Embed Size (px)
Citation preview
Stable isotopes of H, C and N in mice bone collagen as areflection of isotopically controlled food and water intake*
Katarina Topalova, Arndt Schimmelmann a, P. David Pollya,b, Peter E. Sauera andSuresh Viswanathanc**
aDepartment of Earth and Atmospheric Sciences, Indiana University, Bloomington, IN, USA; bEnvironmentalResilience Institute, Indiana University, Bloomington, IN, USA; cSchool of Optometry, Indiana University,Bloomington, IN, USA
ABSTRACT2H/1H ratios in animal biomass reflect isotopic input from food andwater. A 10-week controlled laboratory study raised 48 mice dividedin two generations (8 mothers Mus musculus and their offspring).The mice were divided into four groups based on thecombination of 2H, 13C, 15N-enriched and non-enriched food andwater. Glycine, the most common amino acid in bone collagen,carried the 2H, 13C, 15N-isotopic spike in food. ANOVA dataanalysis indicated that hydrogen in food accounted for ∼81 % ofthe hydrogen isotope inventory in collagen whereas drinkingwater hydrogen contributed ∼17 %. Air humidity contributedan unspecified amount. Additionally, we monitored 13C and15N-enrichment in bone collagen and found strong linearcorrelations with the 2H-enrichment. The experiments with foodand water indicate two biosynthetic pathways, namely (i) de novocreation of non-essential amino acids using hydrogen from water,and (ii) the integration of essential and non-essential amino acidsfrom food. The lower rate of isotope uptake in mothers’ collagenrelative to their offspring indicates incomplete bone collagenturnover after ten weeks. The variance of hydrogen stable isotoperatios within the same cohort may limit its usefulness as a singlesample proxy for archaeological or palaeoenvironmental research.
ARTICLE HISTORYReceived 10 October 2018Accepted 4 January 2019
KEYWORDSCarbon-13; diet; food;hydrogen-2; isotope ecology;mice; nitrogen-15; tracertechnique
1. Introduction
Stable isotope ratios of the most common elements found in living organisms (carbon C,hydrogen H, oxygen O, and nitrogen N) vary in nature due to physically, chemically, andbiologically driven abundances and fractionations. The traditional use of carbon and nitro-gen stable isotope ratios in biology has been subsequently joined by 2H/1H ratios as anadditional independent isotopic dimension [1]. Hydrogen isotopes found in animaltissues provide important insight into metabolism [2–6], ecology [7], and environmental
© 2019 Informa UK Limited, trading as Taylor & Francis Group
CONTACT Arndt Schimmelmann [email protected] Department of Earth and Atmospheric Sciences, IndianaUniversity, Bloomington, IN, USA
Supplemental data for this article can be accessed 10.1080/10256016.2019.1580279.*Originally presented at the Stable Isotope Summer School 2018 ‘Stable isotopes in ancient and contemporary environ-ments’, 15–19 April 2018, University of Konstanz, Germany
**Present address: College of Optometry, State University of New York, 33 W 42nd Street, New York, New York, 10036, USA
ISOTOPES IN ENVIRONMENTAL AND HEALTH STUDIEShttps://doi.org/10.1080/10256016.2019.1580279
conditions [8] of both modern vertebrates and their well-preserved fossil remains. Fruitfulapplications have been found in archaeology [9–11] and forensic sciences [12–14].
The hydrogen isotope ratio of bone collagen and other tissues is ultimately a mixture ofthe isotopic signature of water taken from the local environment by drinking and the sig-nature of ingested food. The raising of biota under isotopically controlled trophic con-ditions and subsequent mass-balances can constrain the isotopic contributions fromvarious sources [e.g. 4–6]. Aqueous inorganic hydrogen can enter newly formed organicmolecules either via metabolic biosynthesis or during isotope exchange of hydrogen inorganic functional groups with body water. Hydrogen from food can be metabolised toH2O through respiration, or can become incorporated into structural tissues, such aswhen amino acids are biopolymerised to form proteins. The diverse hydrogen transferroutes across and within water and biomass yield a wide range of isotope ratios amongdifferent organic compound classes, taxa, environments, seasons, and geographiclocations [15]. Most interestingly the range of hydrogen isotope ratios can be wideeven within a single population. The intrapopulation variability seems to increase withthe trophic level, being the narrowest in herbivores (bison, deer) and the largest amongcarnivores [16]. As the rapidly growing matrix of stable-isotope data on natural popu-lations of plants and animals demonstrates complex relationships, the quantitativeinfluence of individual factors on hydrogen stable isotope ratios in protein remains bestconstrained by carefully controlled laboratory experiments [17,18]. The interpretation ofhydrogen stable isotope data from modern and palaeoenvironments should be basedon insight from ground truthing experiments under lab-controlled conditions. Most com-monly dietary-controlled isotopic studies utilised tissues whose sampling was relativelyharmless to animals, such as hair and feather keratin (birds: [19]; rodents: [20]; humans:[21]). However, in comparison to soft tissues, bone collagen represents a longer-termrecord of environmental conditions and an animal’s ecology during its lifetime due tothe relatively slow turnover rate of most bones in mature animals (versus a more momen-tary, weekly, or monthly record inferred from hair and nail keratin) [22,23]. Collagen can bewell preserved inside the protective bone matrix, and established techniques can diag-nose fossil bone collagen’s integrity for palaeoenvironmental reconstruction [24,25].Due to the detrimental nature for their subjects, the studies involving mammal bone col-lagen have been few (e.g. [6,26–28]).
Our study tested the effects of diet and metabolism on hydrogen isotopes in animaltissues. The focus was on population diversity of hydrogen stable isotope ratio in micebone collagen in controlled laboratory conditions. In addition to the isotopic influenceof food and water, we evaluated whether age and sex differences contribute to the isoto-pic composition of bone collagen. The carbon and nitrogen stable isotope systems wereused in parallel with stable hydrogen ratios to provide multidimensional isotopic controlon experimental variables.
2. Materials and methods
2.1. Preparation of mouse food
As starting material for mouse diets, we used commercially available Purina® 5015 MouseDiet that was optimised for long-term labmouse experiments (caloric contributions in % of
2 K. TOPALOV ET AL.
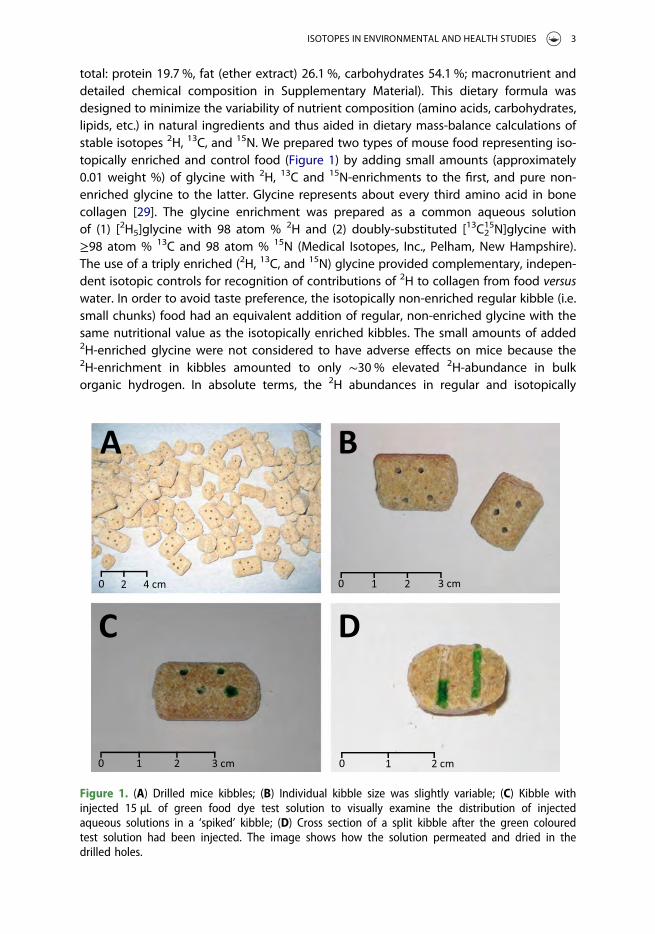
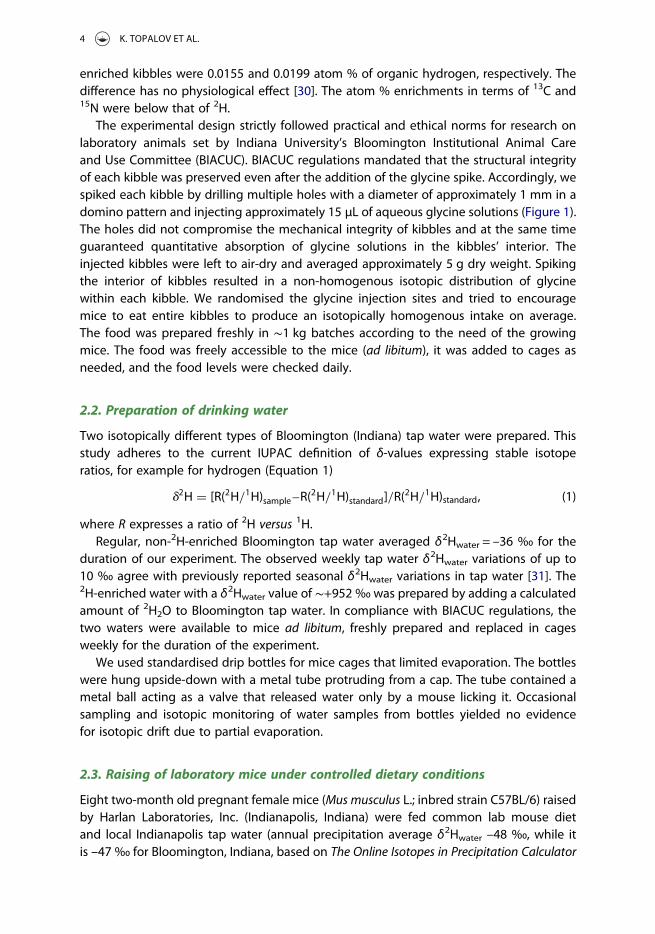
total: protein 19.7 %, fat (ether extract) 26.1 %, carbohydrates 54.1 %; macronutrient anddetailed chemical composition in Supplementary Material). This dietary formula wasdesigned to minimize the variability of nutrient composition (amino acids, carbohydrates,lipids, etc.) in natural ingredients and thus aided in dietary mass-balance calculations ofstable isotopes 2H, 13C, and 15N. We prepared two types of mouse food representing iso-topically enriched and control food (Figure 1) by adding small amounts (approximately0.01 weight %) of glycine with 2H, 13C and 15N-enrichments to the first, and pure non-enriched glycine to the latter. Glycine represents about every third amino acid in bonecollagen [29]. The glycine enrichment was prepared as a common aqueous solutionof (1) [2H5]glycine with 98 atom % 2H and (2) doubly-substituted [13C2
15N]glycine with≥98 atom % 13C and 98 atom % 15N (Medical Isotopes, Inc., Pelham, New Hampshire).The use of a triply enriched (2H, 13C, and 15N) glycine provided complementary, indepen-dent isotopic controls for recognition of contributions of 2H to collagen from food versuswater. In order to avoid taste preference, the isotopically non-enriched regular kibble (i.e.small chunks) food had an equivalent addition of regular, non-enriched glycine with thesame nutritional value as the isotopically enriched kibbles. The small amounts of added2H-enriched glycine were not considered to have adverse effects on mice because the2H-enrichment in kibbles amounted to only ∼30 % elevated 2H-abundance in bulkorganic hydrogen. In absolute terms, the 2H abundances in regular and isotopically
Figure 1. (A) Drilled mice kibbles; (B) Individual kibble size was slightly variable; (C) Kibble withinjected 15 µL of green food dye test solution to visually examine the distribution of injectedaqueous solutions in a ‘spiked’ kibble; (D) Cross section of a split kibble after the green colouredtest solution had been injected. The image shows how the solution permeated and dried in thedrilled holes.
ISOTOPES IN ENVIRONMENTAL AND HEALTH STUDIES 3
enriched kibbles were 0.0155 and 0.0199 atom % of organic hydrogen, respectively. Thedifference has no physiological effect [30]. The atom % enrichments in terms of 13C and15N were below that of 2H.
The experimental design strictly followed practical and ethical norms for research onlaboratory animals set by Indiana University’s Bloomington Institutional Animal Careand Use Committee (BIACUC). BIACUC regulations mandated that the structural integrityof each kibble was preserved even after the addition of the glycine spike. Accordingly, wespiked each kibble by drilling multiple holes with a diameter of approximately 1 mm in adomino pattern and injecting approximately 15 µL of aqueous glycine solutions (Figure 1).The holes did not compromise the mechanical integrity of kibbles and at the same timeguaranteed quantitative absorption of glycine solutions in the kibbles’ interior. Theinjected kibbles were left to air-dry and averaged approximately 5 g dry weight. Spikingthe interior of kibbles resulted in a non-homogenous isotopic distribution of glycinewithin each kibble. We randomised the glycine injection sites and tried to encouragemice to eat entire kibbles to produce an isotopically homogenous intake on average.The food was prepared freshly in ∼1 kg batches according to the need of the growingmice. The food was freely accessible to the mice (ad libitum), it was added to cages asneeded, and the food levels were checked daily.
2.2. Preparation of drinking water
Two isotopically different types of Bloomington (Indiana) tap water were prepared. Thisstudy adheres to the current IUPAC definition of δ-values expressing stable isotoperatios, for example for hydrogen (Equation 1)
d2H = [R(2H/1H)sample–R(2H/1H)standard]/R(
2H/1H)standard, (1)
where R expresses a ratio of 2H versus 1H.Regular, non-2H-enriched Bloomington tap water averaged δ2Hwater = –36 ‰ for the
duration of our experiment. The observed weekly tap water δ2Hwater variations of up to10 ‰ agree with previously reported seasonal δ2Hwater variations in tap water [31]. The2H-enriched water with a δ2Hwater value of ∼+952‰ was prepared by adding a calculatedamount of 2H2O to Bloomington tap water. In compliance with BIACUC regulations, thetwo waters were available to mice ad libitum, freshly prepared and replaced in cagesweekly for the duration of the experiment.
We used standardised drip bottles for mice cages that limited evaporation. The bottleswere hung upside-down with a metal tube protruding from a cap. The tube contained ametal ball acting as a valve that released water only by a mouse licking it. Occasionalsampling and isotopic monitoring of water samples from bottles yielded no evidencefor isotopic drift due to partial evaporation.
2.3. Raising of laboratory mice under controlled dietary conditions
Eight two-month old pregnant female mice (Mus musculus L.; inbred strain C57BL/6) raisedby Harlan Laboratories, Inc. (Indianapolis, Indiana) were fed common lab mouse dietand local Indianapolis tap water (annual precipitation average δ2Hwater –48 ‰, while itis –47‰ for Bloomington, Indiana, based on The Online Isotopes in Precipitation Calculator
4 K. TOPALOV ET AL.
[32]). At the end of their second gestational week they arrived at Indiana University anddelivered their offspring in the next 5–6 days.
The experiment was conducted for four months (i.e. 17 weeks and five days) in the labanimal facilities of the School of Optometry at Indiana University, Bloomington, Indiana,and the animals had unrestricted access to the specially prepared food of known H, C,N-isotopic compositions and water of known H-isotopic composition (Figure 2). Themice were divided into four groups A to D, which received different combinations of iso-topically enriched and non-enriched (i.e. regular) Bloomington tap water and mice kibblefood (Figure 2; Table 1). One water type was 2H-enriched and the other was not, and onefood type was enriched with 2H, 13C, and 15N-enriched glycine and the other was not.Control group A received regular food and water. Group B received isotopically enrichedfood and regular Bloomington tap water. Group C received regular food and 2H-enrichedtap water. Finally, group D received both isotopically enriched food and 2H-enrichedwater. These diets were introduced to pregnant mice from their first day at Indiana Univer-sity, thus their offspring were first exposed to the enrichments in utero at 2 weeks gesta-tional age or 1 week prior to birth. At this point of mouse foetal development the limbbone ossification had started but was not completed until one to three weeks afterbirth [33] thus exposing the bone collagen to enrichment for the entire duration of ourexperiment.
After weaning at about 3 weeks of age, the offspring were separated from mothers. Tenpups for each of the four dietary groups were separated by sex and continued to be raisedon the same diet and water as had been given to their mothers. The mothers were con-tinued on their pre-weaning diets and waters as well, yielding a total of 48 mice (i.e.4 groups with 10 offspring + 2 mothers in each group). Throughout the experiment, allmice were cared for and ultimately euthanised by decapitation under deep anesthesiausing sodium pentobarbital (50 mg/kg) administered intraperitonially in strict accordanceto BIACUC guidelines at Indiana University.
At the end of the 4-month period we collected multiple tissues (bone, muscle, skin, andliver). The only animal tissue used in the present study is bone collagen, while the other
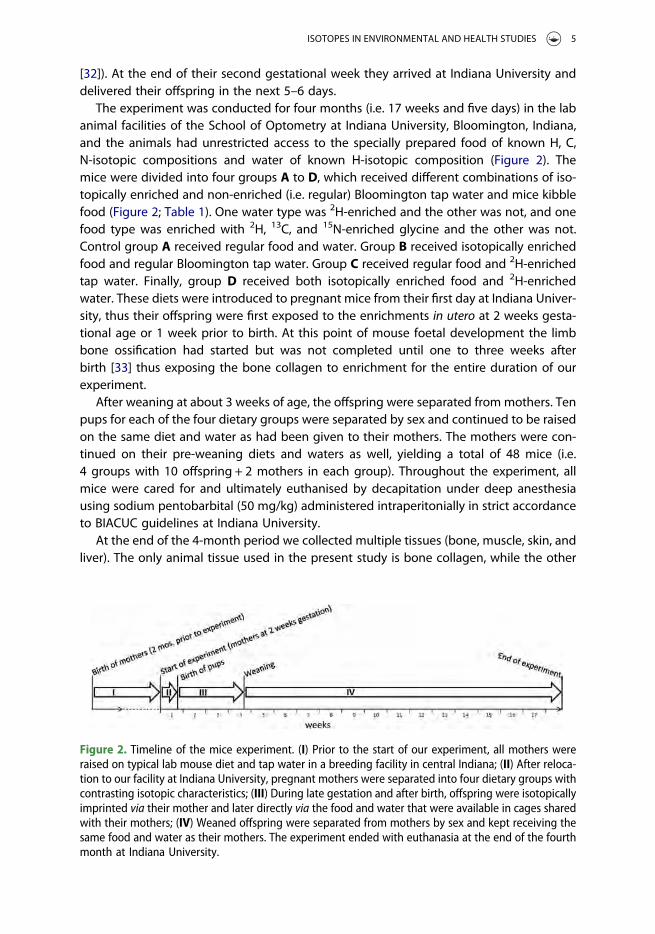
Figure 2. Timeline of the mice experiment. (I) Prior to the start of our experiment, all mothers wereraised on typical lab mouse diet and tap water in a breeding facility in central Indiana; (II) After reloca-tion to our facility at Indiana University, pregnant mothers were separated into four dietary groups withcontrasting isotopic characteristics; (III) During late gestation and after birth, offspring were isotopicallyimprinted via their mother and later directly via the food and water that were available in cages sharedwith their mothers; (IV) Weaned offspring were separated from mothers by sex and kept receiving thesame food and water as their mothers. The experiment ended with euthanasia at the end of the fourthmonth at Indiana University.
ISOTOPES IN ENVIRONMENTAL AND HEALTH STUDIES 5
tissues were frozen for future research. In order to prevent ambiguity from differentgrowth and turnover rates in different bones, we only used front and rear leg bones forthis study (femur, tibia, fibula, humerus, radius, and ulna).
2.4. Preparation of collagen
We used the same classical method for preparing collagen that was described in [16]. Inbrief, bones were mechanically cleaned, ultrasonicated to remove remnants of softtissue, and demineralised in 1N hydrochloric acid (HCl) for one week at room temperaturewith occasional stirring. The demineralised material was rinsed to neutral pH, freeze-dried,lipid-extracted with dichloromethane, dried, and stored in glass vials until isotopicmeasurements were conducted. The C:N ratios of the resulting collagen indicated goodpreservation for stable isotope analysis. We note that after completion of our analyticalwork, Cersoy et al. [34] compared several published bone demineralisation protocolsand found that a method’s length and complexity had little effect on the collagen isotopiccomposition.
2.5. Isotope analyses of mice food and water
Stable isotope analyses were used to determine the average isotopic values of the treatedand untreated food and water. Water samples were analysed by David Finkelstein at theUniversity of Massachusetts Amherst using a Picarro L2120-i Isotopic Water Analyzer.Samples were calibrated with a set of in-house water standards spanning a wide rangeof δ2Hwater values that had been calibrated against VSMOW, SLAP, GISP, and 2H-enrichedwater standards IAEA-302 A and B. For isotopic characterisation of the two kibble foodtypes we created a small ‘master batch’ representing a combination of individualkibbles subsampled from all weekly food batches. The composite master batch was hom-ogenised by grinding in a ball mill and dried in the vacuum chamber of a freeze-dryer.However, even extensive grinding could not sufficiently homogenise food at the 0.3-mglevel for on-line analyses in silver and tin cups. Also, the lipid content of the foodkibbles would have been partially steam-distilled out of any container when exposed toequilibration in hot steam, thus causing partial loss of the 1H-enriched lipid fraction. Ourchoice to equilibrate the food in moist air at room temperature avoided partial mobilis-ation and loss of the lipid fraction, but probably entailed a slightly different average hydro-gen fractionation factor between organic and steam hydrogen when compared withsteam equilibration of collagen. While this may impart a small error in food δ2H versus
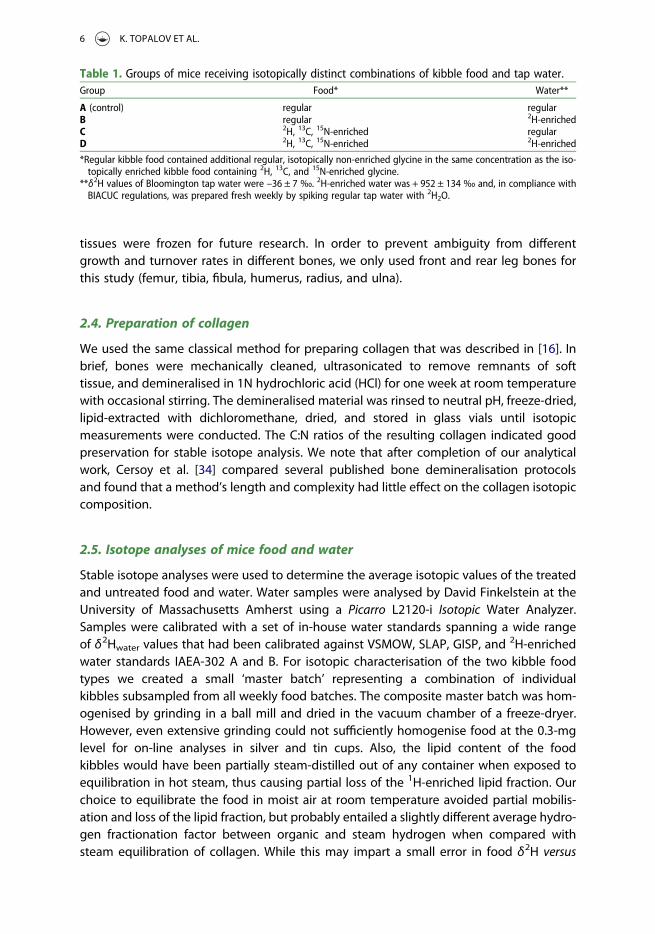
Table 1. Groups of mice receiving isotopically distinct combinations of kibble food and tap water.Group Food* Water**
A (control) regular regularB regular 2H-enrichedC 2H, 13C, 15N-enriched regularD 2H, 13C, 15N-enriched 2H-enriched
*Regular kibble food contained additional regular, isotopically non-enriched glycine in the same concentration as the iso-topically enriched kibble food containing 2H, 13C, and 15N-enriched glycine.
**δ2H values of Bloomington tap water were –36 ± 7 ‰. 2H-enriched water was + 952 ± 134 ‰ and, in compliance withBIACUC regulations, was prepared fresh weekly by spiking regular tap water with 2H2O.
6 K. TOPALOV ET AL.
collagen δ2H of a few per mil (e.g. [35]), the resulting analytical uncertainty was expectedto be small relative to the signal of the 2H-enriched food and water.
Multiple 4-mg aliquots of regular or isotopically enriched mouse food samples wereplaced into open silica (‘quartz glass’) combustion ampoules with additional cupricoxide, copper and silver. Samples were hydrogen-isotopically equilibrated at room temp-erature in closed chambers (‘desiccators’) in the presence of two isotopically distinctwaters (δ2Hwater = –147 and 1348 ‰) at 100 % humidity for one week, followed bydrying of the samples under vacuum, sealing of evacuated quartz ampoules, and combus-tion at 800 °C overnight. Nitrogen and carbon dioxide were separated from water cryo-genically in a vacuum line. Water was reduced to H2 gas by passage over uraniummetal at 800 °C [36]. The volumes of N2, CO2 and H2 were measured manometrically ina vacuum line for the determination of elemental ratios. H2 and N2 gases were collectedby a Toepler pump and temporarily sealed in pre-evacuated glass tubes, whereas CO2
was frozen into evacuated glass tubes and sealed off. Isotope ratios were determinedmass-spectrometrically by manual dual-inlet analysis with a Thermo Finnigan Delta PlusXP stable isotope mass spectrometer. Two-point normalisations relied on internationalstandards VSMOW, SLAP, NBS 19, LSVEC, IAEA-N-1, and IAEA-N-2.
2.6. Isotope analyses of collagen
We measured non-exchangeable hydrogen (Hn) in collagen, most of which is tightlybonded to a carbon chain, does not exchange with the environment, and therefore pre-serves the isotopic information recorded during the life of an individual. Exchangeablehydrogen (Hx), bound to O, N, and S potentially exchanges with environmental waterand humidity in air after collagen biosynthesis and does not preserve a primary isotopicsignature [37], similar to some of the organic oxygen in collagen [38].
The isotope composition of the total pool of hydrogen (δ2Ht) can be represented byEquation (2):
d2Ht = xe∗d2Hx + (1–xe)∗d2Hn (2)
The xe represents the fraction of exchangeable hydrogen in the total pool of hydrogen[39,40].
We accounted for the contribution of Hx to Ht by equilibrating samples with steams ofknown isotope composition. This is done through Equation (3):
1x–w = [(1+ d2Hx)/(1+ d2Hw)]–1, (3)
where εx–w represents the equilibrium isotope enrichment factor unique for each com-pound and dependent on ambient temperature; δ2Hx represents exchangeable hydrogenin the sample, and δ2Hw represents hydrogen in ambient water [37]. To constrain xe andεx–w we equilibrated aliquots of our samples together with a set of laboratory standards ofknown stoichiometry in two water vapours with δ2Hwater =−136 ‰ or 1246 ‰ [39].
Collagen samples were cut into aliquots weighing approximately 0.3 mg, and twosamples per individual were loaded into silver capsules (Costech Analytical TechnologiesInc., Valencia, CA, USA). Sequences of capsules containing samples and stable isotope stan-dards were loaded into 50-position carousels, which were placed into aluminumchambers. Inside each tightly sealed chamber the samples were equilibrated for 6–8 h
ISOTOPES IN ENVIRONMENTAL AND HEALTH STUDIES 7
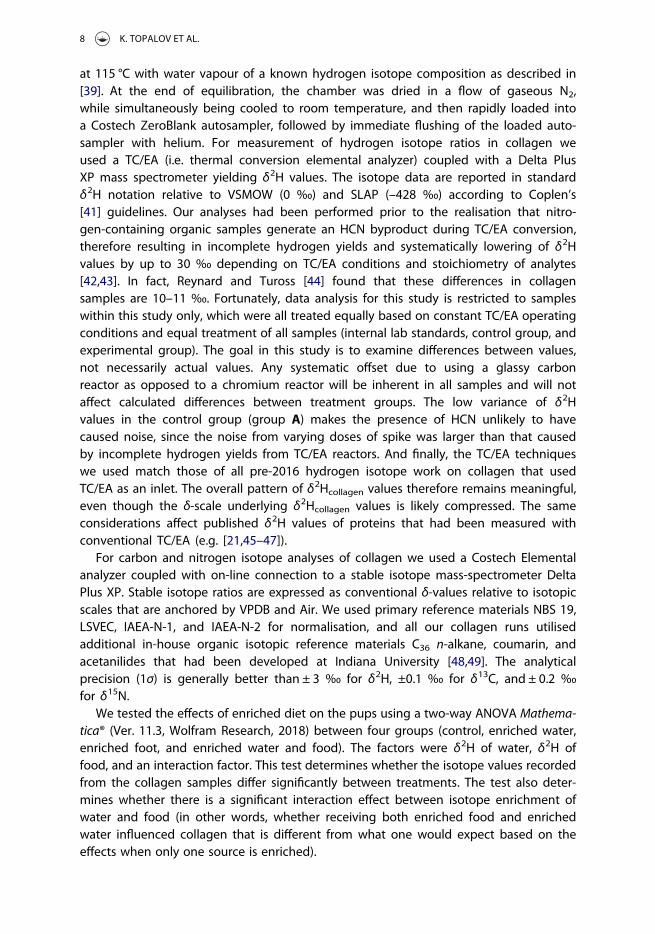
at 115 °C with water vapour of a known hydrogen isotope composition as described in[39]. At the end of equilibration, the chamber was dried in a flow of gaseous N2,while simultaneously being cooled to room temperature, and then rapidly loaded intoa Costech ZeroBlank autosampler, followed by immediate flushing of the loaded auto-sampler with helium. For measurement of hydrogen isotope ratios in collagen weused a TC/EA (i.e. thermal conversion elemental analyzer) coupled with a Delta PlusXP mass spectrometer yielding δ2H values. The isotope data are reported in standardδ2H notation relative to VSMOW (0 ‰) and SLAP (–428 ‰) according to Coplen’s[41] guidelines. Our analyses had been performed prior to the realisation that nitro-gen-containing organic samples generate an HCN byproduct during TC/EA conversion,therefore resulting in incomplete hydrogen yields and systematically lowering of δ2Hvalues by up to 30 ‰ depending on TC/EA conditions and stoichiometry of analytes[42,43]. In fact, Reynard and Tuross [44] found that these differences in collagensamples are 10–11 ‰. Fortunately, data analysis for this study is restricted to sampleswithin this study only, which were all treated equally based on constant TC/EA operatingconditions and equal treatment of all samples (internal lab standards, control group, andexperimental group). The goal in this study is to examine differences between values,not necessarily actual values. Any systematic offset due to using a glassy carbonreactor as opposed to a chromium reactor will be inherent in all samples and will notaffect calculated differences between treatment groups. The low variance of δ2Hvalues in the control group (group A) makes the presence of HCN unlikely to havecaused noise, since the noise from varying doses of spike was larger than that causedby incomplete hydrogen yields from TC/EA reactors. And finally, the TC/EA techniqueswe used match those of all pre-2016 hydrogen isotope work on collagen that usedTC/EA as an inlet. The overall pattern of δ2Hcollagen values therefore remains meaningful,even though the δ-scale underlying δ2Hcollagen values is likely compressed. The sameconsiderations affect published δ2H values of proteins that had been measured withconventional TC/EA (e.g. [21,45–47]).
For carbon and nitrogen isotope analyses of collagen we used a Costech Elementalanalyzer coupled with on-line connection to a stable isotope mass-spectrometer DeltaPlus XP. Stable isotope ratios are expressed as conventional δ-values relative to isotopicscales that are anchored by VPDB and Air. We used primary reference materials NBS 19,LSVEC, IAEA-N-1, and IAEA-N-2 for normalisation, and all our collagen runs utilisedadditional in-house organic isotopic reference materials C36 n-alkane, coumarin, andacetanilides that had been developed at Indiana University [48,49]. The analyticalprecision (1σ) is generally better than ± 3 ‰ for δ2H, ±0.1 ‰ for δ13C, and ± 0.2 ‰for δ15N.
We tested the effects of enriched diet on the pups using a two-way ANOVA Mathema-tica® (Ver. 11.3, Wolfram Research, 2018) between four groups (control, enriched water,enriched foot, and enriched water and food). The factors were δ2H of water, δ2H offood, and an interaction factor. This test determines whether the isotope values recordedfrom the collagen samples differ significantly between treatments. The test also deter-mines whether there is a significant interaction effect between isotope enrichment ofwater and food (in other words, whether receiving both enriched food and enrichedwater influenced collagen that is different from what one would expect based on theeffects when only one source is enriched).
8 K. TOPALOV ET AL.
3. Results
The isotopic characterisation of pairs of bulk kibble food and drinking waters yieldedstrong differences between isotopically enriched and non-enriched diets. The average2H-enrichment (i.e. isotopic difference) among pairs of tap water and mice kibble foodwas + 988 ‰ and + 298 ‰, respectively (Table 2). The net 15N-enrichment in kibbleswas + 21.5 ‰. In comparison, the seemingly low δ13C-difference of 3.0 ‰ betweenenriched and non-enriched bulk food is due to the large amount of organic carbon relativeto the limited amount of added, 13C-enriched glycine.
Mothers had been raised at a breeding facility in Indianapolis, central Indiana, whereasthe offspring were born and raised at Indiana University in south-central Indiana (74 kmflight distance from Indianapolis). The limited isotopic differences between mothers andtheir offspring in control group A (i.e. receiving isotopically non-enriched food andwater; Table 3) indicate that the food and water mothers had received during theirupbringing in central Indiana were isotopically almost identical to non-enriched foodand water used during our experiment at Indiana University (Table 2).
Enrichments in 2H, 13C, and 15N were detected in bone collagen from groups B, C and Dof mice that had consumed isotopically enriched diets and/or waters. In contrast, consist-ently lowest δ-values were found for collagen from control group A that had received iso-topically non-enriched food and water (Figures 3 and 4). 2H, 13C, and 15N-abundances inbone collagen were consistently larger in offspring relative to bone collagen of theirrespective mothers and reflect faster biochemical use and incorporation of dietaryglycine into the collagen of a growing bone (Table 3). The ingestion of 2H-enrichedfood and 2H-enriched drinking water by group D resulted in even higher bone collagenδ2H values than from ingestion of either 2H-enriched water (group B) or 2H-enrichedfood alone (group C) in both mothers and offspring, indicating a cumulative effect fromingestion of 2H derived from food and water.
The δ2H-values of bone collagen from our individual mice ranged by about ∼900 ‰(Figure 3; Supplementary material 1). Because of the large range of δ2H values wereport the data in 2H atom % as well (Tables 2 and 3; Supplementary material 1).
Both mothers and offspring in control group A have collagen that is 2H-depletedby ∼100 ‰ relative to food and water. Collagen from offspring in group A averagesδ2H = –123 ‰ and is slightly less 2H-depleted than collagen from respective mothersaveraging δ2H = –138 ‰. Group B, having received 2H-enriched water and non-enrichedfood, features δ2H values which are higher than that of their food and continue the trendof greater enrichment in offspring compared to their mothers. The mothers receivingenriched food and regular tap water (group C) show values in-between their food and
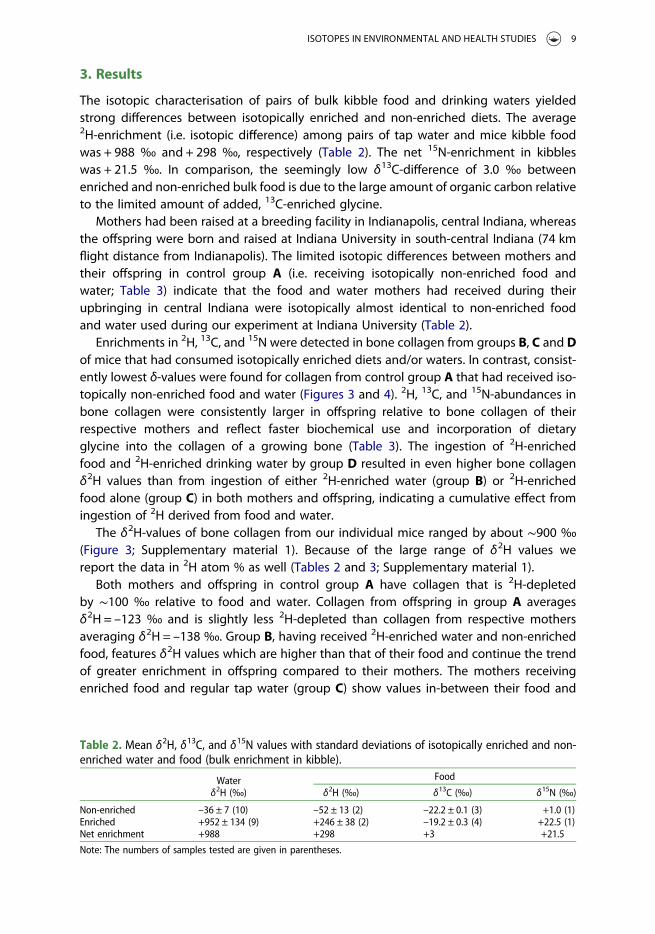
Table 2. Mean δ2H, δ13C, and δ15N values with standard deviations of isotopically enriched and non-enriched water and food (bulk enrichment in kibble).
Water Food
δ2H (‰) δ2H (‰) δ13C (‰) δ15N (‰)
Non-enriched –36 ± 7 (10) –52 ± 13 (2) –22.2 ± 0.1 (3) +1.0 (1)Enriched +952 ± 134 (9) +246 ± 38 (2) –19.2 ± 0.3 (4) +22.5 (1)Net enrichment +988 +298 +3 +21.5
Note: The numbers of samples tested are given in parentheses.
ISOTOPES IN ENVIRONMENTAL AND HEALTH STUDIES 9
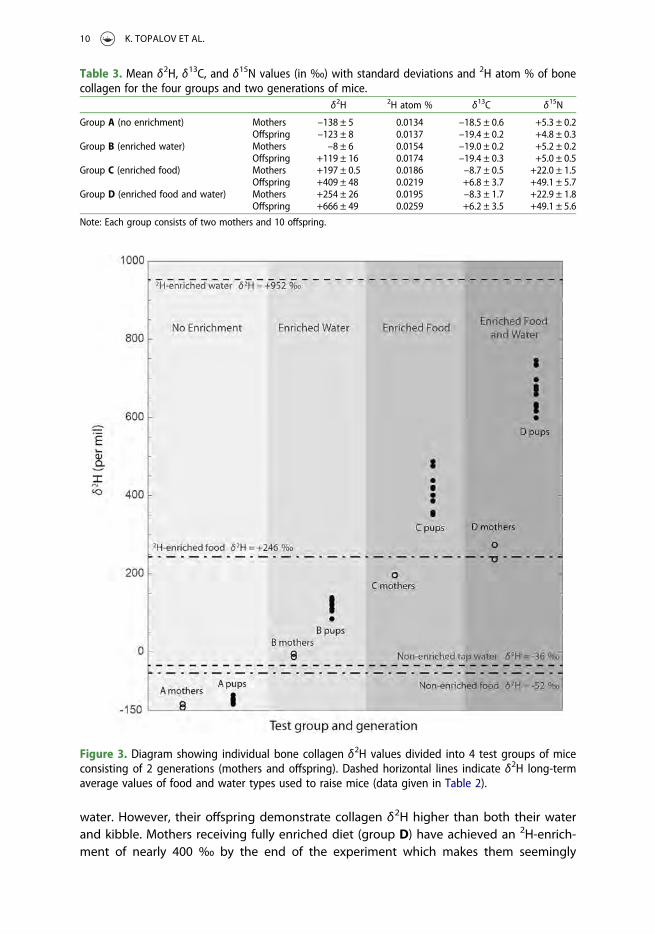
water. However, their offspring demonstrate collagen δ2H higher than both their waterand kibble. Mothers receiving fully enriched diet (group D) have achieved an 2H-enrich-ment of nearly 400 ‰ by the end of the experiment which makes them seemingly
Table 3. Mean δ2H, δ13C, and δ15N values (in ‰) with standard deviations and 2H atom % of bonecollagen for the four groups and two generations of mice.
δ2H 2H atom % δ13C δ15N
Group A (no enrichment) Mothers –138 ± 5 0.0134 –18.5 ± 0.6 +5.3 ± 0.2Offspring –123 ± 8 0.0137 –19.4 ± 0.2 +4.8 ± 0.3
Group B (enriched water) Mothers –8 ± 6 0.0154 –19.0 ± 0.2 +5.2 ± 0.2Offspring +119 ± 16 0.0174 –19.4 ± 0.3 +5.0 ± 0.5
Group C (enriched food) Mothers +197 ± 0.5 0.0186 –8.7 ± 0.5 +22.0 ± 1.5Offspring +409 ± 48 0.0219 +6.8 ± 3.7 +49.1 ± 5.7
Group D (enriched food and water) Mothers +254 ± 26 0.0195 –8.3 ± 1.7 +22.9 ± 1.8Offspring +666 ± 49 0.0259 +6.2 ± 3.5 +49.1 ± 5.6
Note: Each group consists of two mothers and 10 offspring.
Figure 3. Diagram showing individual bone collagen δ2H values divided into 4 test groups of miceconsisting of 2 generations (mothers and offspring). Dashed horizontal lines indicate δ2H long-termaverage values of food and water types used to raise mice (data given in Table 2).
10 K. TOPALOV ET AL.
identical to their enriched baseline, while data from the offspring plot midway betweenthe respective water and food values.
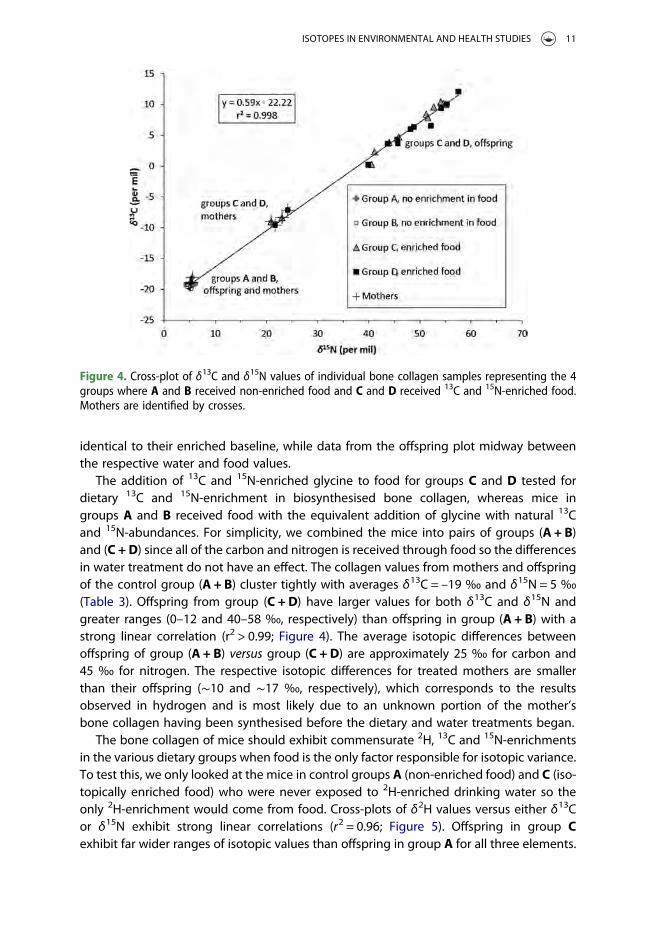
The addition of 13C and 15N-enriched glycine to food for groups C and D tested fordietary 13C and 15N-enrichment in biosynthesised bone collagen, whereas mice ingroups A and B received food with the equivalent addition of glycine with natural 13Cand 15N-abundances. For simplicity, we combined the mice into pairs of groups (A + B)and (C + D) since all of the carbon and nitrogen is received through food so the differencesin water treatment do not have an effect. The collagen values from mothers and offspringof the control group (A + B) cluster tightly with averages δ13C = –19 ‰ and δ15N = 5 ‰(Table 3). Offspring from group (C + D) have larger values for both δ13C and δ15N andgreater ranges (0–12 and 40–58 ‰, respectively) than offspring in group (A + B) with astrong linear correlation (r2 > 0.99; Figure 4). The average isotopic differences betweenoffspring of group (A + B) versus group (C + D) are approximately 25 ‰ for carbon and45 ‰ for nitrogen. The respective isotopic differences for treated mothers are smallerthan their offspring (∼10 and ∼17 ‰, respectively), which corresponds to the resultsobserved in hydrogen and is most likely due to an unknown portion of the mother’sbone collagen having been synthesised before the dietary and water treatments began.
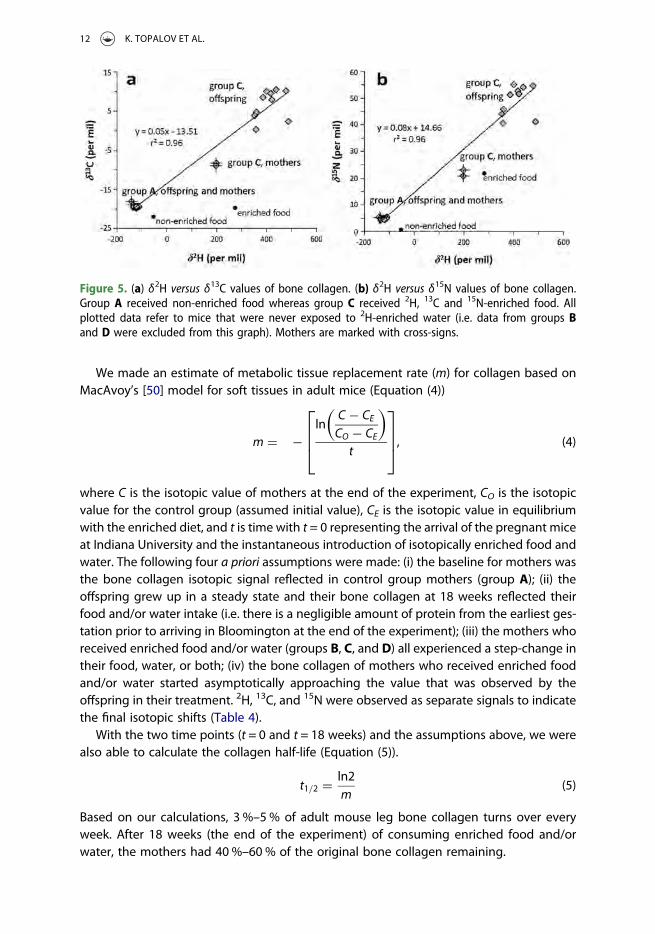
The bone collagen of mice should exhibit commensurate 2H, 13C and 15N-enrichmentsin the various dietary groups when food is the only factor responsible for isotopic variance.To test this, we only looked at the mice in control groups A (non-enriched food) and C (iso-topically enriched food) who were never exposed to 2H-enriched drinking water so theonly 2H-enrichment would come from food. Cross-plots of δ2H values versus either δ13Cor δ15N exhibit strong linear correlations (r2 = 0.96; Figure 5). Offspring in group Cexhibit far wider ranges of isotopic values than offspring in group A for all three elements.
Figure 4. Cross-plot of δ13C and δ15N values of individual bone collagen samples representing the 4groups where A and B received non-enriched food and C and D received 13C and 15N-enriched food.Mothers are identified by crosses.
ISOTOPES IN ENVIRONMENTAL AND HEALTH STUDIES 11
We made an estimate of metabolic tissue replacement rate (m) for collagen based onMacAvoy’s [50] model for soft tissues in adult mice (Equation (4))
m = −ln
C − CECO − CE
( )
t
⎡⎢⎢⎣
⎤⎥⎥⎦, (4)
where C is the isotopic value of mothers at the end of the experiment, CO is the isotopicvalue for the control group (assumed initial value), CE is the isotopic value in equilibriumwith the enriched diet, and t is time with t = 0 representing the arrival of the pregnant miceat Indiana University and the instantaneous introduction of isotopically enriched food andwater. The following four a priori assumptions were made: (i) the baseline for mothers wasthe bone collagen isotopic signal reflected in control group mothers (group A); (ii) theoffspring grew up in a steady state and their bone collagen at 18 weeks reflected theirfood and/or water intake (i.e. there is a negligible amount of protein from the earliest ges-tation prior to arriving in Bloomington at the end of the experiment); (iii) the mothers whoreceived enriched food and/or water (groups B, C, and D) all experienced a step-change intheir food, water, or both; (iv) the bone collagen of mothers who received enriched foodand/or water started asymptotically approaching the value that was observed by theoffspring in their treatment. 2H, 13C, and 15N were observed as separate signals to indicatethe final isotopic shifts (Table 4).
With the two time points (t = 0 and t = 18 weeks) and the assumptions above, we werealso able to calculate the collagen half-life (Equation (5)).
t1/2 = ln2m
(5)
Based on our calculations, 3 %–5 % of adult mouse leg bone collagen turns over everyweek. After 18 weeks (the end of the experiment) of consuming enriched food and/orwater, the mothers had 40 %–60 % of the original bone collagen remaining.
Figure 5. (a) δ2H versus δ13C values of bone collagen. (b) δ2H versus δ15N values of bone collagen.Group A received non-enriched food whereas group C received 2H, 13C and 15N-enriched food. Allplotted data refer to mice that were never exposed to 2H-enriched water (i.e. data from groups Band D were excluded from this graph). Mothers are marked with cross-signs.
12 K. TOPALOV ET AL.
4. Discussion
Our results demonstrate that hydrogen from both water and food contribute to theorganic hydrogen in bone collagen. We observed strong effects on the bone collagenδ2H of groups of mice according to 2H-abundances in their diets and drinking waters(Figure 3), and the strongest 2H-enrichment was observed in mice that received both2H-enriched food and water. The large differences in isotope enrichment signals resultingfrom different treatments, coupled with the relatively small variations within individualgroups, allow us to separate the 2H transfer rates of hydrogen from water and food intocollagen δ2H. For all enriched treatments, the offspring collagen values were higherthan the maternal values, which is consistent with the offspring’s high metabolic ratesand ossification since the early stages of skeletal development in utero, whereas themothers had new isotopic signal incorporated via turnover only. Our complementaryfindings for δ13C and δ15N support the conclusions on hydrogen biochemical incorpor-ation into bone collagen.
4.1. Age effects on δ2H of collagen
Mothers and offspring in control group A had similar δ2H collagen values indicating nodifference in their metabolic processes (though a statistical comparison is impossiblebecause only two mothers were measured). Hydrogen isotope results for group A alsoshow that the food and water the mothers received prior to the start of our experimentfor the first two months of their lives were similar to the treatment’s non-enriched foodand water. While having had constant isotopic intakes during their entire lives, both themothers and offspring of control group A had collagen δ2H values that were 100 ‰lower than the values of their respective food and water. This finding agrees with previousdata on bone collagen from herbivores and omnivores in natural environments [16,51].While all mice in groups B, C, and D produced collagen that reflected the enriched foodand/or water, the amount of 2H-enrichment in mothers was 40 %–50 % lower than thatobserved in their offspring. This points to faster turnover rates for offspring, which canbe due to their faster metabolism, greater integration of essential and nonessentialamino acids created de novo, and juvenile ossification process.
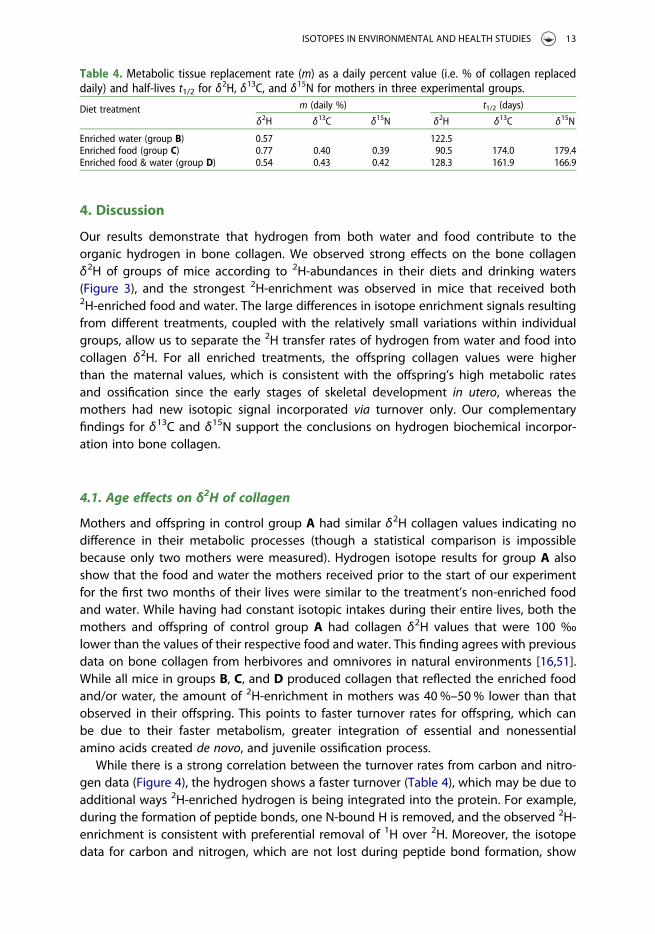
While there is a strong correlation between the turnover rates from carbon and nitro-gen data (Figure 4), the hydrogen shows a faster turnover (Table 4), which may be due toadditional ways 2H-enriched hydrogen is being integrated into the protein. For example,during the formation of peptide bonds, one N-bound H is removed, and the observed 2H-enrichment is consistent with preferential removal of 1H over 2H. Moreover, the isotopedata for carbon and nitrogen, which are not lost during peptide bond formation, show
Table 4. Metabolic tissue replacement rate (m) as a daily percent value (i.e. % of collagen replaceddaily) and half-lives t1/2 for δ
2H, δ13C, and δ15N for mothers in three experimental groups.
Diet treatment m (daily %) t1/2 (days)
δ2H δ13C δ15N δ2H δ13C δ15N
Enriched water (group B) 0.57 122.5Enriched food (group C) 0.77 0.40 0.39 90.5 174.0 179.4Enriched food & water (group D) 0.54 0.43 0.42 128.3 161.9 166.9
ISOTOPES IN ENVIRONMENTAL AND HEALTH STUDIES 13
almost identical turnover rates, as expected assuming that the 15N- and 13C-enrichedglycine is incorporated into the bone collagen along the same pathway. While theobserved shift in 15N results from the dietary protein (the only source of N), the shift in13C may be diluted by the incorporation of C from lipids and carbohydrates in the diet.However, the close match in turnover time estimates using N and C isotope dataimplies that the fraction of C derived from non-protein sources is consistent among allmice groups.
Earlier we had reported a shift towards less negative δ2H values related to weaning incarnivores [16]. A similar trend was not observed in this study of laboratory mice, likely dueto the fact that the offspring generation of mice reached adulthood at the end of ourexperiment. In small mammals such as mice the faster biomass turnover rate and an accel-erated pace of reaching maturity (within a few weeks) can obscure the weaning effect (at 3weeks of age), so any temporary juvenile effects would have been erased by the sub-sequent turnover.
4.2. Influence of water on δ2H of collagen
Mice who drank 2H-enriched water and ate regular food (group B) showed elevated δ2Hcollagen values. This indicates that water has an effect on collagen isotope values throughamino acids, which are synthesised de novo, rather than being ingested as food. Wesurmise that ingested 2H-enriched water isotopically exchanges with intermediateorganic compounds during the biosynthesis of amino acids and generated non-exchange-able polypeptide hydrogen. Approximately every third amino acid building block in thebone collagen biopolymeric chain is the non-essential amino acid glycine [29] that canbe biosynthesised by many organisms [52]. Non-essential amino acids proline and hydro-xyproline each represent every sixth amino acid in collagen, and the remaining 50 % areother amino acids, some of which are essential and must be supplied by food. Eventhough animals can synthesise non-essential amino acids like glycine, they readily incor-porate them from protein-rich food and use them as building blocks in fibrous proteinssuch as collagen [26,53]. The isotope enrichments in food kibbles given to mice wereexclusively in the form of isotopically enriched glycine, while all other dietary aminoacids had natural isotope compositions. The pattern of bone collagen δ2H differencesbetween the offspring in control group (A) and the experimental groups (B, C, and D) issimilar to the δ2H differences observed in their mothers (Figure 3). This indicates approxi-mately equivalent water hydrogen integration in protein biosynthesis for (1) the motherswho only received 2H-enriched water during adulthood after reaching an age of twomonths, and (2) for the offspring generation that received 2H-enriched water throughouttheir growing (juvenile) period, excluding early time in utero. In other words, bone collagenbiosynthesis in both groups partially relies on similarly balanced fluxes of de novo bio-synthesised non-essential amino acids that carry an H-isotope signal from body water.
4.3. The influence of food on δ2H of collagen
The similarity of hydrogen isotope values between food and bone collagen (Figure 3)mainly comes from the artificial 2H-spike in food produced by a small addition ofglycine rather than being randomly distributed among all biochemical components of
14 K. TOPALOV ET AL.
food. Essentially all the carbon incorporated into collagen during overturn derives fromprotein in the diet of mice, as indicated by almost identical turnover rates of carbonand nitrogen (Figure 4), which suggests that much hydrogen in newly incorporatedbone collagen also derives from dietary protein rather than from carbohydrates orlipids. Proteins made up 19 % of the kibble by weight (Purina® 5015 Mouse Diet), andthis portion of the food, plus the glycine that was added to it, should therefore be theprimary component contributing to the isotopic composition of collagen in the mice. Inother words, two factors affect the collagen values measured in this experiment: the pro-portion of protein in the pre-treated kibble and the enrichment value of the glycine thatwas added to it. This complicates the possibility of directly equating the isotope values ofbone collagen and food.
4.4. Extent of food and water effects on δ2H of collagen
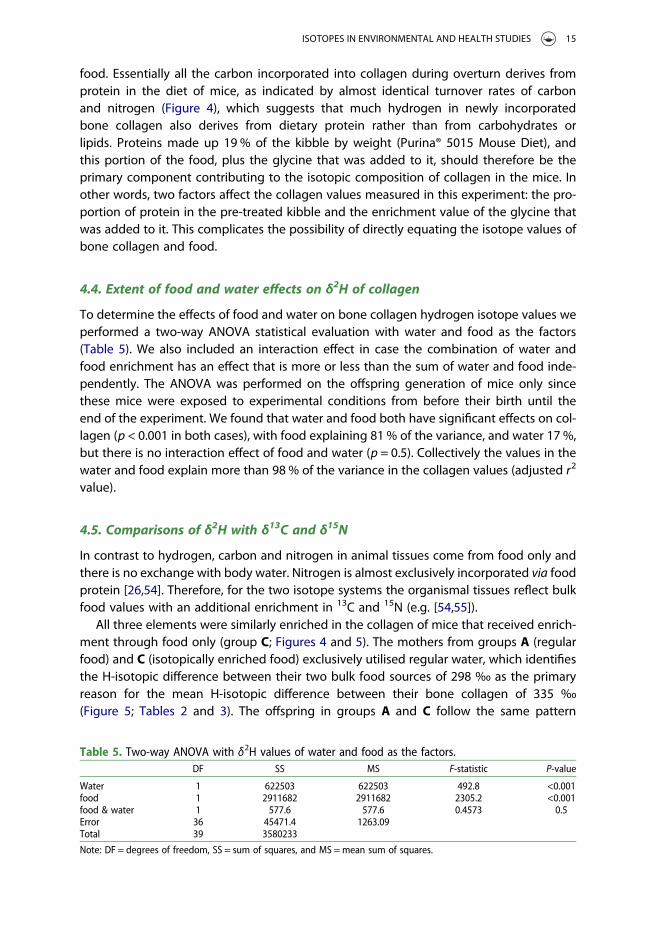
To determine the effects of food and water on bone collagen hydrogen isotope values weperformed a two-way ANOVA statistical evaluation with water and food as the factors(Table 5). We also included an interaction effect in case the combination of water andfood enrichment has an effect that is more or less than the sum of water and food inde-pendently. The ANOVA was performed on the offspring generation of mice only sincethese mice were exposed to experimental conditions from before their birth until theend of the experiment. We found that water and food both have significant effects on col-lagen (p < 0.001 in both cases), with food explaining 81 % of the variance, and water 17 %,but there is no interaction effect of food and water (p = 0.5). Collectively the values in thewater and food explain more than 98 % of the variance in the collagen values (adjusted r2
value).
4.5. Comparisons of δ2H with δ13C and δ15N
In contrast to hydrogen, carbon and nitrogen in animal tissues come from food only andthere is no exchange with body water. Nitrogen is almost exclusively incorporated via foodprotein [26,54]. Therefore, for the two isotope systems the organismal tissues reflect bulkfood values with an additional enrichment in 13C and 15N (e.g. [54,55]).
All three elements were similarly enriched in the collagen of mice that received enrich-ment through food only (group C; Figures 4 and 5). The mothers from groups A (regularfood) and C (isotopically enriched food) exclusively utilised regular water, which identifiesthe H-isotopic difference between their two bulk food sources of 298 ‰ as the primaryreason for the mean H-isotopic difference between their bone collagen of 335 ‰(Figure 5; Tables 2 and 3). The offspring in groups A and C follow the same pattern
Table 5. Two-way ANOVA with δ2H values of water and food as the factors.DF SS MS F-statistic P-value
Water 1 622503 622503 492.8 <0.001food 1 2911682 2911682 2305.2 <0.001food & water 1 577.6 577.6 0.4573 0.5Error 36 45471.4 1263.09Total 39 3580233
Note: DF = degrees of freedom, SS = sum of squares, and MS =mean sum of squares.
ISOTOPES IN ENVIRONMENTAL AND HEALTH STUDIES 15
with a collagen mean H-isotopic difference of 532 ‰, which is larger than for mothersbecause the latter retained some of their bone collagen from their earlier upbringing incentral Indiana. The very strong signal transfer of 2H-enrichment into bone collagen isdue to the 2H-spiking of glycine in isotopically enriched kibbles and the efficient incorpor-ation of dietary glycine into bone collagen.
In contrast to carbon which is abundantly present in many compound classes in food, anitrogen-isotopic comparison between diets and bone collagen is more straightforwardbecause most N in food is present in the form of amino acids that are either directly inte-grated into collagen chains or are used as precursors in collagen biosynthesis [56]. Mothersand offspring that received non-enriched food (the combined group A + B) demonstrate aδ15N increase of approximately 4 ‰ from their diet to bone collagen (Tables 2 and 3),which is in accordance with previously reported δ15N dietary enrichment [54,57]. Themothers which received enriched food (group C +D) exhibit δ15N collagen values thatare similar to δ15N values of enriched food, while the offspring’s collagen from the com-bined group (C +D) express strong 15N-enrichment (δ15N ∼ +50 ‰) that is about 25 ‰more positive than the respective bulk food. This maximum 15N-enrichment indicatesenhanced utilisation of 15N-enriched glycine from food for biosynthesis of growingoffspring’s bone collagen relative to their mothers. This increased integration of nonessen-tial glycine in pre-adult versus adult animals can be explained by ongoing osteogenesis injuveniles and reached turnover equilibrium in adults. 2H-enrichment in group C derivesexclusively from food and therefore follows the trend of 15N-enrichment. Although inten-sive utilisation of glycine is most noticeable in experimental groups that received isotopi-cally enriched food (C +D), the same processes must have occurred in mice that ingestedregular food without the additional benefit of carrying a strong isotopic signal. Our resultsare consistent with those from an earlier carbon isotope study on bone collagen from ratsthat had been raised in the laboratory on purified C3 and/or C4 macronutrients [58].
4.6. Sources of hydrogen isotope heterogeneity
Maternal mice in groups B, C and D were exposed to isotope enrichments during preg-nancy at Indiana University after their bones were fully formed. Any isotope enrichmentof their bone collagen over the control values must therefore have occurred via bone turn-over. On the other hand, their offspring began receiving isotopically enriched nutrientsand water during their bone growth period, first prenatally in utero beginning one weekprior to birth, then for two weeks after birth via lactation, and finally, through waterand/or food intake for the remaining 15 weeks and five days. The full exposure to artificialisotope enrichments for offspring at Indiana University phased in a few days after birth.Around the same time, the slower process of bone collagen turnover in adult micebegan to shift their mothers’ bone collagen in the same isotopic directions as therapidly growing collagen of offspring.
The large isotopic variances among collagen of offspring fed the enriched food (but notthe offspring that received the enriched water only) can be explained by individualfeeding habits that were possibly guided by the taste of glycine concentrated unevenlyin the centres of kibbles. Some of the mice in the offspring generation may have preferredor avoided ingestion of the parts of kibbles containing most of the glycine infusions. Someoffspring may have eaten more food than their siblings (glutton versus runt). The latter
16 K. TOPALOV ET AL.
seems to be less important because 1.5 months into the experiment one of the offspringwas marked as underweight by a lab animal veterinarian and diagnosed with overgrowthof its incisors. From then on, the incisors had been filed down biweekly and the mouseregained its weight. Ultimately the mouse showed no extreme isotopic characteristic (Sup-plementary material 1, sample C7). Underfeeding stress may be insufficient to redirectmetabolic pathways with significant long-term isotopic consequences. In the study of awild mammal fauna around Bloomington, Indiana [16] a group of Eastern short-tailedshrews (6 individuals) showed a wide range of bone collagen δ2H values (–60 to + 100 ‰).Shrews have body mass similar to mice and like them, have a fast metabolism. Both ofthese traits may be responsible for dramatic variations in these two small mammalspecies’ collagen δ2H. In case of wild shrews, it is the heterogeneity of food sourcesavailable to individuals and in case of laboratory mice the heterogeneity comes fromrandomised points of glycine injections into food kibbles and individual preference tomore or less sweet spots. In contrast, larger mammals have slower metabolism, morebody mass, and in case of herbivores more homogenous food sources available (plantsare an isotopically more uniform food source).
Individual isotopic variability in experimental groups of mice may indicate diversity infood and water uptakes, metabolic rates, and maybe even differences in evapotranspira-tion rates between mice of the same group and generation [20,28,50,59]. Similar differ-ences within populations could therefore be expected in ecosystem isotope studies ofwild fauna [60–62]. Stable isotopes in nature do not necessarily reach an isotopic diet–tissue steady state due to the seasonally changing environmental and food isotopicsignals [50]. Moreover, on a day-to-day basis the type of food that animals find availablevaries, especially for carnivores and omnivores who have a broader range of potential foodsources, thus making hydrogen stable isotope values harder to predict. Finally, metabolicpathways within the body change with age, growth rate, and potentially with stress, whichfurther complicates the resulting stable hydrogen isotope characteristics. Animals onsteady homogenous diets and possibly slower metabolism such as herbivores do betterin reflecting similar bone collagen isotope values and can therefore be used as proxiesfor the populations. However, animals with more diverse and irregular diets (omnivoresand carnivores) and faster metabolism (small mammals) show too wide δ2H collagenrange and using one or few samples may not give an average for the entire group.
Conclusions
. Collagen δ2H, δ13C, and δ15N values increased with addition of enriched food and incases of 2H-enriched water.
. Enriched glycine in food was predominately responsible for collagen enrichment for allthree elements.
. 2H-enrichment that came from water indicates (non-essential) amino acids werecreated de novo and integrated into collagen.
. The incorporation of a heavy isotope spike into mothers’ collagen is 40 %–60 % that ofoffspring and most likely due to mothers having slower turnover rates than offspring.The collagen turnover rate in adult mice was 3 %–5 % per week. This was observedin all three elements.
ISOTOPES IN ENVIRONMENTAL AND HEALTH STUDIES 17
. Both mothers and offspring seemed to utilise the same collagen biosynthesis pathways(de novo creation of amino acids from water and integration of food-available essentialand non-essential amino acids) at the same rate. This is indicated by the proportionalincrease of δ-values for all three H, C, N isotope systems.
. We found that food as a source of 2H-enrichment contributed ∼ 80 % and water ∼17 %to collagen (p < 0.001 in both cases), with no interaction effect.
. Variability within the same cohort indicates unique food preferences and uptakes, andpossibly individual differences in metabolic rates and evapotranspiration. This effectshould be expected in equal or even greater measure in nature.
. Individual bone collagen samples of mammals with fast metabolism and heterogenousdiets may not accurately represent their populations and be used as proxies in isotopicecological and archaeological studies of wildlife.
Acknowledgments
We thank the lab staff at the School of Optometry animal facilities at Indiana University for theirpatience and passing down their knowledge on lab animal care. David Finkelstein kindly per-formed water analyses. This manuscript was improved by helpful suggestions from fourreviewers.
Disclosure statement
No potential conflict of interest was reported by the authors.
Funding
The Department of Earth and Atmospheric Sciences’ Stable Isotope Research Facility (SIRF) is sup-ported by Indiana University’s Prepared for Environmental Change Grand Challenge initiative. Thisresearch did not receive funding from agencies in the public, commercial, or not-for-profit sectors.
ORCID
Arndt Schimmelmann http://orcid.org/0000-0003-4648-5253
References
[1] Rundel PW, Ehleringer JR, Nagy KA, editor. Stable isotopes in ecological research. New York:Springer; 2012. (Ecological Studies; 68).
[2] Bowen GJ, Ehleringer JR, Chesson LA, et al. Dietary and physiological controls on the hydrogenand oxygen isotope ratios of hair from mid-20th century indigenous populations. Am J PhysAnthropol. 2009;139:494–504.
[3] Vander Zanden MJ, Clayton MK, Moody EK, et al. Stable isotope turnover and half-life in animaltissues: A literature synthesis. PLoS ONE. 2015;10:e0116182. https://journals.plos.org/plosone/article?id=10.1371/journal.pone.0116182.
[4] Fogel ML, Griffin PL, Newsome SD. Hydrogen isotopes in individual amino acids reflect differ-entiated pools of hydrogen from food and water in Escherichia coli. Proc Natl Acad Sci U S A.2016;113:E4648–E4653.
18 K. TOPALOV ET AL.
[5] Newsome SD, Wolf N, Bradley CJ, et al. Assimilation and discrimination of hydrogen in tilapia:implications for studying animal diet with δ2H. Ecosphere. 2017;8. doi:10.1002/ecs2.1616.
[6] Rodriguez Curras M, Fogel ML, Newsome SD. Assimilation and discrimination of hydrogen iso-topes in a terrestrial mammal. Oecologia. 2018;188:381–393.
[7] Chamberlain CP, Blum JD, Holmes RT, et al. The use of isotope tracers for identifying popu-lations of migratory birds. Oecologia. 1997;109:132–141.
[8] Abeni F, Calamari L, Stefanini L. Metabolic conditions of lactating Friesian cows during the hotseason in the Po valley. 1. Blood indicators of heat stress. Int J Biometeorol. 2007;52:87–96.
[9] Reynard LM, Hedges REM. Stable hydrogen isotopes of bone collagen in palaeodietary andpalaeoenvironmental reconstruction. J Archaeol Sci. 2008;35:1934–1942.
[10] Gröcke DR, Sauer PE, Bridault A, et al. Hydrogen isotopes in Quaternary mammal collagen fromEurope. J Archaeol Sci. 2017;11:12–16.
[11] France CAM, Qi H, Kavich GM. Combined influence of meteoric water and protein intake onhydrogen isotope values in archaeological human bone collagen. J Archaeol Sci. 2018;96:33–44.
[12] Mützel (Rauch) E, Lehn C, Peschel O, et al. Assignment of unknown persons to their geographi-cal origin by determination of stable isotopes in hair samples. Int J Legal Med. 2009;123:35–40.
[13] Chesson LA, Valenzuela LO, Bowen GJ, et al. Consistent predictable patterns in the hydrogenand oxygen stable isotope ratios of animal proteins consumed by modern humans in theUSA. Rapid Commun Mass Spectrom. 2011;25:3713–3722.
[14] Meier-Augenstein W, Hobson KA, Wassenaar LI. Critique: measuring hydrogen stable isotopeabundance of proteins to infer origins of wildlife, food and people. Bioanalysis. 2013;5:751–767.
[15] Sessions AL, Burgoyne TW, Schimmelmann A, et al. Fractionation of hydrogen isotopes in lipidbiosynthesis. Org Geochem. 1999;30:1193–1200.
[16] Topalov K, Schimmelmann A, Polly PD, et al. Environmental, trophic, and ecological factorsinfluencing bone collagen δ2H. Geochim Cosmochim Acta. 2013;111:88–104.
[17] Gannes LZ, O’Brien DM, Martínez del Rio C. Stable isotopes in animal ecology: assumptions,caveats, and a call for more laboratory experiments. Ecology. 1997;78:1271–1276.
[18] Martínez del Rio C, Wolf N, Carleton SA, et al. Isotopic ecology ten years after a call for morelaboratory experiments. Biol Rev. 2009;84:91–111.
[19] Hobson KA, Atwell L, Wassenaar LI. Influence of drinking water and diet on the stable-hydrogenisotope ratios of animal tissues. Proc Natl Acad Sci. 1999;96:8003–8006.
[20] Podlesak DW, Torregrossa AM, Ehleringer JR, et al. Turnover of oxygen and hydrogen isotopesin the body water, CO2, hair, and enamel of a small mammal. Geochim Cosmochim Acta.2008;72:19–35.
[21] Sharp ZD, Atudorei V, Panarello HO, et al. Hydrogen isotope systematics of hair: archeologicaland forensic applications. J Archaeol Sci. 2003;30:1709–1716.
[22] Riofrío-Lazo M, Aurioles-Gamboa D. Timing of isotopic integration in marine mammal skull:comparative study between calcified tissues. Rapid Commun Mass Spectrom. 2013;27:1076–1082.
[23] Bocherens H, Grandal-d’Anglade A, Hobson KA. Pitfalls in comparing modern hair and fossilbone collagen C and N isotopic data to reconstruct ancient diets: a case study with cavebears (Ursus spelaeus). Isot Environ Health Stud. 2014;50:291–299.
[24] Ambrose SH. Preparation and characterization of bone and tooth collagen for isotopic analysis.J Archaeol Sci. 1990;17:431–451.
[25] DeNiro MJ. Postmortem preservation and alteration of in vivo bone collagen isotope ratios inrelation to palaeodietary reconstruction. Nature. 1985;317:806–809.
[26] Hare PE, Fogel ML, Stafford Jr. TW, et al. The isotopic composition of carbon and nitrogen inindividual amino acids isolated from modern and fossil proteins. J Archaeol Sci. 1991;18:277–292.
[27] Warinner C, Tuross N. Brief communication: tissue isotopic enrichment associated with growthdepression in a pig: Implications for archaeology and ecology. Am J Phys Anthropol.2010;141:486–493.
[28] Kirsanow K, Tuross N. Oxygen and hydrogen isotopes in rodent tissues: impact of diet, waterand ontogeny. Palaeogeogr Palaeoclimatol Palaeoecol. 2011;310:9–16.
ISOTOPES IN ENVIRONMENTAL AND HEALTH STUDIES 19
[29] Eastoe JE. The amino acid composition of mammalian collagen and gelatin. Biochem J.1955;61:589–600.
[30] Kushner DJ, Baker A, Dunstall TG. Pharmacological uses and perspectives of heavy water anddeuterated compounds. Can J Physiol Pharm. 1999;77:79–88.
[31] Bowen GJ, Ehleringer JR, Chesson LA, et al. Stable isotope ratios of tap water in the contiguousUnited States. Water Resour Res. 2007;43:W03419. https://agupubs.onlinelibrary.wiley.com/doi/epdf/10.1029/2006WR005186.
[32] Bowen GJ. Online isotopes in precipitation calculator, Ver. 2.2. 2016. http://wateriso.utah.edu/waterisotopes/pages/data_access/oipc.html.
[33] Johnson ML. The time and order of appearance of ossification centers in the albinomouse. Am JAnat. 1933;52:241–271.
[34] Cersoy S, Zazzo A, Lebon M, et al. Collagen extraction and stable isotope analysis of small ver-tebrate bones: a comparative approach. Radiocarbon. 2017;59:679–694.
[35] Qi H, Coplen TB. Investigation of preparation techniques for δ2H analysis of keratin materialsand a proposed analytical protocol. Rapid Comm Mass Spectrom. 2011;25:2209–2222.
[36] Schimmelmann A, Lewan MD, Wintsch RP. D/H isotope ratios of kerogen, bitumen, oil, andwater in hydrous pyrolysis of source rocks containing kerogen types I, II, IIS, and III. GeochimCosmochim Acta. 1999;63:3751–3766.
[37] Schimmelmann A. Determination of the concentration and stable isotopic composition of non-exchangeable hydrogen in organic matter. Anal Chem. 1991;63:2456–2459.
[38] von Holstein ICC, von Tersch M, Coutu AN, et al. Collagen proteins exchange oxygen with demi-neralisation and gelatinisation reagents and also with atmospheric moisture. Rapid CommunMass Spectrom. 2018;32:523–534.
[39] Sauer PE, Schimmelmann A, Sessions AL, et al. Simplified batch equilibration for D/H determi-nation of non-exchangeable hydrogen in solid organic material. Rapid Commun MassSpectrom. 2009;23:949–956.
[40] Sessions AL, Hayes JM. Calculation of hydrogen isotopic fractionations in biogeochemicalsystems. Geochim Cosmochim Acta. 2005;69:593–597.
[41] Coplen TB. Guidelines and recommended terms for expression of stable-isotope-ratio and gas-ratio measurement results. Rapid Commun Mass Spectrom. 2011;25:2538–2560.
[42] Gehre M, Renpenning J, Gilevska T, et al. On-line hydrogen-isotope measurements oforganic samples using elemental chromium: an extension for high temperature elemental-analyzer techniques. Anal Chem. 2015;87:5198–5205; with correction: Anal Chem.2015;87:9108–9108.
[43] Nair S, Geilmann H, Coplen TB, et al. Isotopic disproportionation during hydrogen isotopicanalysis of nitrogen-bearing organic compounds. Rapid Commun Mass Spectrom.2015;29:878–884.
[44] Reynard LM, Tuross N. Hydrogen isotopic analysis with a chromium-packed reactor of organiccompounds of relevance to ecological, archaeological, and forensic applications. RapidCommun Mass Spectrom. 2016;30:1857–1864.
[45] Gröcke DR, Schimmelmann A, Elias S, et al. Stable hydrogen-isotope ratios in beetle chitin: pre-liminary European data and re-interpretation of North American data. Quaternary Sci Rev.2006;25:1850–1864.
[46] Tuross N, Warinner C, Kirsanow K, et al. Organic oxygen and hydrogen isotopes in a porcinecontrolled dietary study. Rapid Commun Mass Spectrom. 2008;22:1741–1745.
[47] Wolf N, Newsome SD, Fogel ML, et al. The relationship between drinking water and the hydro-gen and oxygen stable isotope values of tissues in Japanese quail (Cortunix japonica). Auk.2013;130:323–330.
[48] Schimmelmann A, Albertino A, Sauer PE, et al. Nicotine, acetanilide and urea multi-level 2H-,13C- and 15N-abundance reference materials for continuous-flow isotope ratio mass spec-trometry. Rapid Comm Mass Spectrom. 2009;23:3513–3521.
[49] Meier-Augenstein W, Schimmelmann A. A guide for proper utilisation of stable isotope refer-ence materials. Isotop Environ Health Stud. 2019. doi:10.1080/10256016.2018.1538137.
20 K. TOPALOV ET AL.
[50] MacAvoy SE, Macko SA, Arneson LS. Growth versus metabolic tissue replacement in mousetissues determined by stable carbon and nitrogen isotope analysis. Can J Zool. 2005;83:631–641.
[51] Birchall J, O’Connell TC, Heaton THE, et al. Hydrogen isotope ratios in animal body proteinreflect trophic level. J Anim Ecol. 2005;74:877–881.
[52] Hou Y, Wu G. Nutritionally nonessential amino acids: a misnomer in nutritional sciences. AdvNutrition. 2017;8:137–139.
[53] Harrison SM, Schmidt O, Moloney AP, et al. Tissue turnover in ovine muscles and lipids asrecorded by multiple (H, C, O, S) stable isotope ratios. Food Chem. 2011;124:291–297.
[54] DeNiro MJ, Epstein S. Influence of diet on the distribution of nitrogen isotopes in animals.Geochim Cosmochim Acta. 1981;45:341–351.
[55] DeNiro MJ, Epstein S. Influence of diet on the distribution of carbon isotopes in animals.Geochim Cosmochim Acta. 1978;42:495–506.
[56] Nelson DL, Cox MM. Lehninger principles of biochemistry. 7th ed. New York: W.H. Freeman;2017.
[57] Minagawa M, Wada E. Stepwise enrichment of 15N along food chains: further evidence and therelation between δ15N and animal age. Geochim Cosmochim Acta. 1984;48:1135–1140.
[58] Jim S, Jones V, Ambrose SH, et al. Quantifying dietary macronutrient sources of carbon for bonecollagen biosynthesis using natural abundance stable carbon isotope analysis. British J Nutr.2006;95:1055–1062.
[59] Arneson LS, MacAvoy S, Basset E. Metabolic protein replacement drives tissue turnover in adultmice. Can J Zool. 2006;84:992–1002.
[60] Sare DTJ, Millar JS, Longstaffe FJ. Tracing dietary protein in red-backed voles (Clethrionomysgapperi) using stable isotopes of nitrogen and carbon. Can J Zool. 2005;83:717–725.
[61] MacAvoy SE, Arneson LS, Bassett E. Correlation of metabolism with tissue carbon and nitrogenturnover rate in small mammals. Oecologia. 2006;150:190–201.
[62] Pietsch SJ, Hobson KA, Wassenaar LI, et al. Tracking cats: Problems with placing feline carnivoreson δ18O, δD isoscapes. PLoS ONE. 2011;6. doi:10.1371/journal.pone.0024601.
ISOTOPES IN ENVIRONMENTAL AND HEALTH STUDIES 21