Embed Size (px)
Citation preview
Interim report, January – June 2016, Tobii AB (publ) page 1 of 16
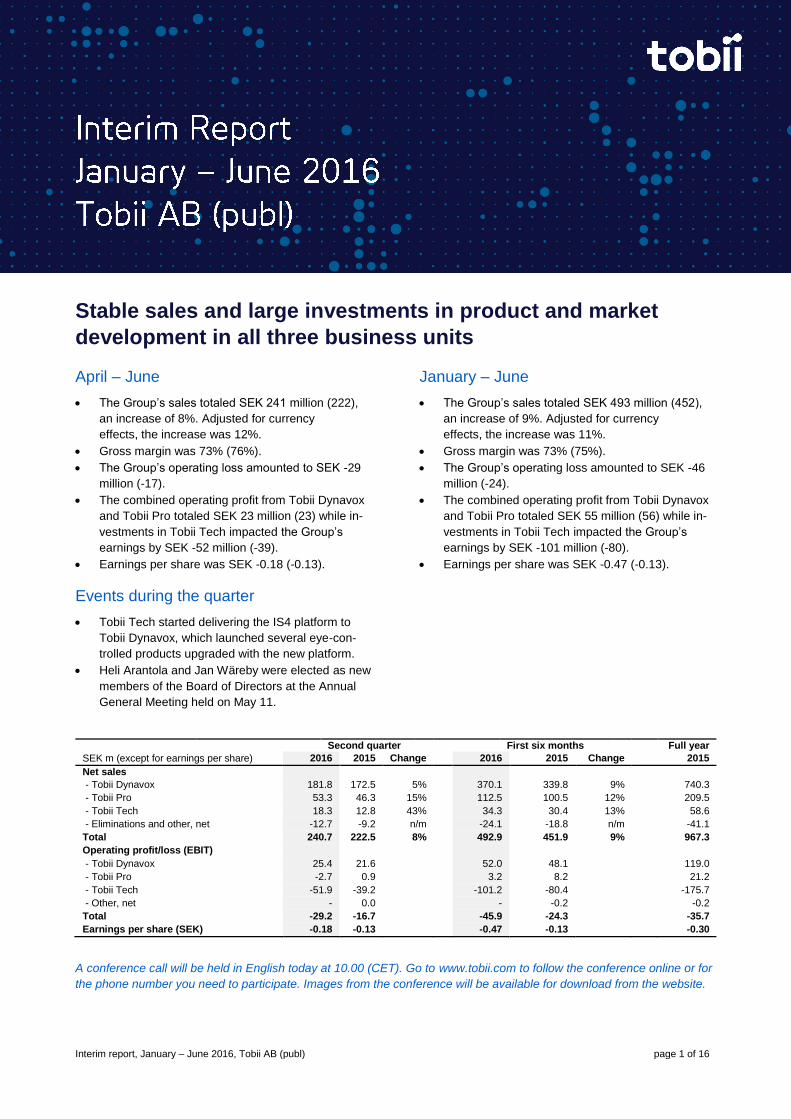
Stable sales and large investments in product and market
development in all three business units
April – June
The Group’s sales totaled SEK 241 million (222),
an increase of 8%. Adjusted for currency
effects, the increase was 12%.
Gross margin was 73% (76%).
The Group’s operating loss amounted to SEK -29
million (-17).
The combined operating profit from Tobii Dynavox
and Tobii Pro totaled SEK 23 million (23) while in-
vestments in Tobii Tech impacted the Group’s
earnings by SEK -52 million (-39).
Earnings per share was SEK -0.18 (-0.13).
Events during the quarter
Tobii Tech started delivering the IS4 platform to
Tobii Dynavox, which launched several eye-con-
trolled products upgraded with the new platform.
Heli Arantola and Jan Wäreby were elected as new
members of the Board of Directors at the Annual
General Meeting held on May 11.
January – June
The Group’s sales totaled SEK 493 million (452),
an increase of 9%. Adjusted for currency
effects, the increase was 11%.
Gross margin was 73% (75%).
The Group’s operating loss amounted to SEK -46
million (-24).
The combined operating profit from Tobii Dynavox
and Tobii Pro totaled SEK 55 million (56) while in-
vestments in Tobii Tech impacted the Group’s
earnings by SEK -101 million (-80).
Earnings per share was SEK -0.47 (-0.13).
Second quarter First six months Full year
SEK m (except for earnings per share) 2016 2015 Change 2016 2015 Change 2015
Net sales - Tobii Dynavox 181.8 172.5 5% 370.1 339.8 9% 740.3
- Tobii Pro 53.3 46.3 15% 112.5 100.5 12% 209.5
- Tobii Tech 18.3 12.8 43% 34.3 30.4 13% 58.6
- Eliminations and other, net -12.7 -9.2 n/m -24.1 -18.8 n/m -41.1
Total 240.7 222.5 8% 492.9 451.9 9% 967.3
Operating profit/loss (EBIT) - Tobii Dynavox 25.4 21.6 52.0 48.1 119.0
- Tobii Pro -2.7 0.9 3.2 8.2 21.2
- Tobii Tech -51.9 -39.2 -101.2 -80.4 -175.7
- Other, net - 0.0 - -0.2 -0.2
Total -29.2 -16.7 -45.9 -24.3 -35.7
Earnings per share (SEK) -0.18 -0.13 -0.47 -0.13 -0.30
A conference call will be held in English today at 10.00 (CET). Go to www.tobii.com to follow the conference online or for
the phone number you need to participate. Images from the conference will be available for download from the website.
Interim report, January – June 2016, Tobii AB (publ) page 2 of 16
Comments from the CEO
The second quarter of the year was characterized by in-
vestments in product and sales development in Tobii
Dynavox and Tobii Pro. At the same time, we continued
to invest heavily in Tobii Tech with the ambition of
bringing eye tracking to new segments such as gaming
and VR. The Group’s year-over-year sales increased by
12% adjusted for currency effects.
Tobii Dynavox – effective communication to more
people
Within Tobii Dynavox, we continued our efforts to give
even more people the opportunity to communicate effec-
tively. We launched the computer peripheral PCEye Mini
and upgraded the I-Series+, the business unit’s eye-con-
trolled communication devices, with the new IS4 plat-
form. Feedback from our users has been very positive.
To strengthen its position in the low-price segment, To-
bii Dynavox is investing long-term to expand its offer-
ings and channels for direct sales to consumers. The in-
vestments cover product development, e-commerce
and marketing initiatives. By doing this we will be able
to offer effective communication solutions to individuals
who cannot or prefer not to use public funding through
insurance systems, to schools and to geographic mar-
kets that lack funding for communication devices. Dur-
ing the quarter, Tobii Dynavox launched e-commerce in
its first market, the UK.
The business unit’s year-over-year sales increased by
9% adjusted for currency effects, due to higher sales in
the US. In Europe however, we saw sales decline some-
what. This was partly due to price reductions on some
products, and partly because we are in the process of
building an organization for direct sales in the UK, which
has resulted in a downturn in sales through resellers.
Tobii Pro – continued strong sales across the board
Tobii Pro had a particularly strong quarter and year-
over-year sales increased by 16% adjusted for currency
effects. Performance was positive in all product catego-
ries and geographic regions. Eye tracking is becoming
a more established method for studying behavior and
we see that its usage is growing through the increasing
number of new and repeat customers, such as Ipsos,
Unilever and Procter & Gamble.
The Glasses 2 eye-tracking glasses have become a
highly successful product and we continue to gain cus-
tomers in new segments. One such segment is the
world of sports, where a study of Formula 1 racing
driver Nico Hulkenberg received widespread interna-
tional attention through SkySports and other media dur-
ing the quarter.
To maintain our strong position in the market for eye-
tracking studies, Tobii Pro is making important invest-
ments in product development. This includes both eye-
tracking hardware and analytics software aimed at mak-
ing it easier for customers to perform both small and
large-scale global surveys.
Tobii Tech – integration projects with several cus-
tomers
We see a clear interest for eye tracking in several differ-
ent product areas. Through increased investments in
Tobii Tech, we now have focused teams dedicated to
platform development, gaming, computer interaction,
VR and mobile devices.
During the quarter, we intensified collaborations with
several computer manufacturers aiming to integrate eye
tracking in specific models of premium notebooks and
monitors. The work involved many teams and covered
various aspects, such as adaptations of the platform and
user interface for eye tracking. We also continued to de-
velop technology for eye tracking for mobile devices.
Interest in eye tracking within the VR segment is stead-
ily growing, with more in-depth dialogues as a result.
Benefits and applications have become more concrete,
but we believe that we are still in an early stage.
During the quarter we continued our efforts together with
game studios to develop immersive gaming experiences
using eye tracking. Feedback from early users has pro-
vided us with an understanding of which concepts are
appreciated and those that can be improved. Several
new games were launched during the period.
Moving forward with a stronger team
We continue to invest in all three business units to main-
tain our market-leading position and to capture the many
business opportunities we see for eye tracking. Over the
past twelve months, the number of full-time employees
has grown by 130 and we are now more than 700 Tobi-
ians worldwide onboard for our exciting journey.
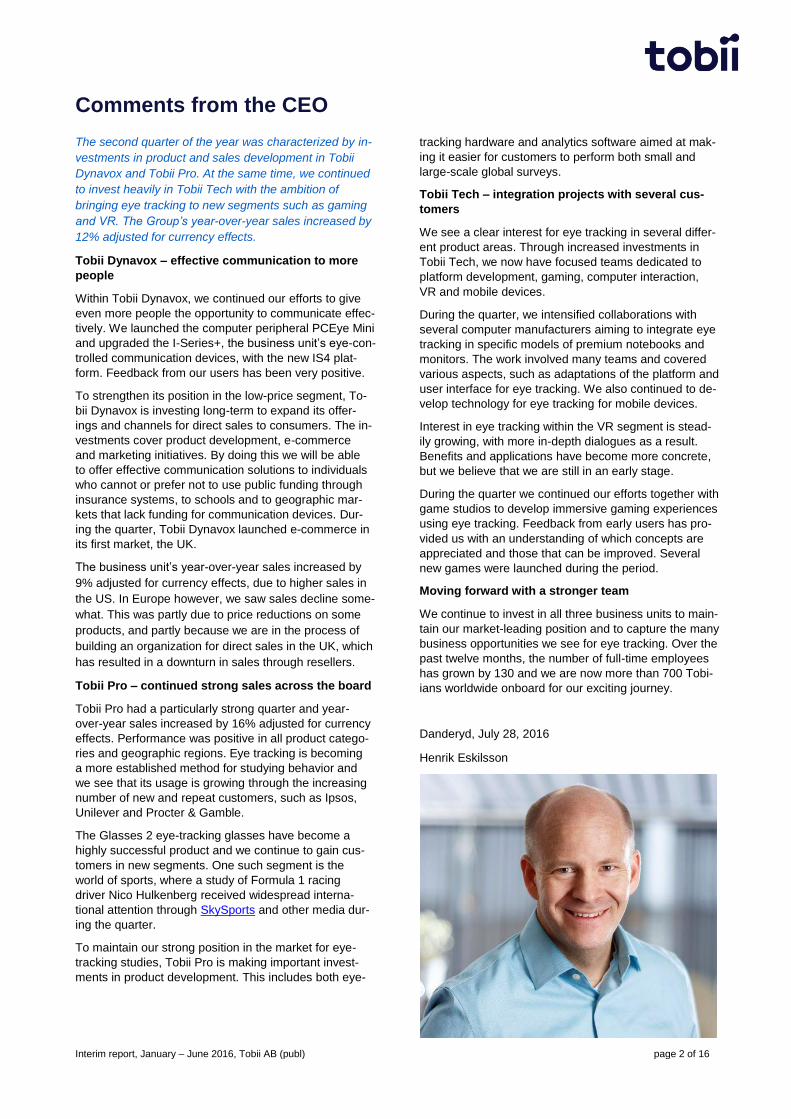
Danderyd, July 28, 2016
Henrik Eskilsson
Interim report, January – June 2016, Tobii AB (publ) page 3 of 16
The Tobii Group in brief
Tobii is the world leader in eye tracking, both in terms of
market shares and technology. Tobii holds more than
50% of the global eye-tracking market and has many
times higher sales than its closest competitor.
An eye-tracking sensor can determine where a person
is looking with high accuracy. This provides access to
information about what the user pays attention to or
processes. The main values of eye tracking is that it
can be used to gain unique insights into human behav-
ior or to create natural and more intuitive user interfaces
for computers and other devices.
The Tobii Group has three business units that have
their own distinct markets, products and organizations.
Two of these, Tobii Dynavox and Tobii Pro, are active in
niche markets for assistive technology for communica-
tion and research and consumer surveys respectively.
Both are market leaders and have established product
portfolios. Tobii Dynavox’ products help tens of thou-
sands of users to speak and communicate, and Tobii
Pro’s eye-tracking solutions add deep insights and
unique objectivity to a multitude of research areas.
Tobii invests in the third business unit, Tobii Tech, to
reach future high-volume markets for eye tracking in pri-
marily consumer products such as computers, gaming
products, VR and mobile devices. The business model
is based on delivering components, algorithms and li-
censes to integration customers.
Tobii invests in a high rate of development to maintain
its market-leading position and advance its market pen-
etration in all three business units.
Tobii has around 700 employees and covers the global
market through its own offices in Sweden, the USA,
China, Japan, Norway, Germany, the UK, South Korea
and Taiwan, and through a global network of resellers.
Tobii is headquartered in Danderyd, Sweden, and is
listed on Nasdaq Stockholm since April 2015.
Read more online
www.tobii.com
www.tobiidynavox.com
www.tobiipro.com
www.tobii.com/tech
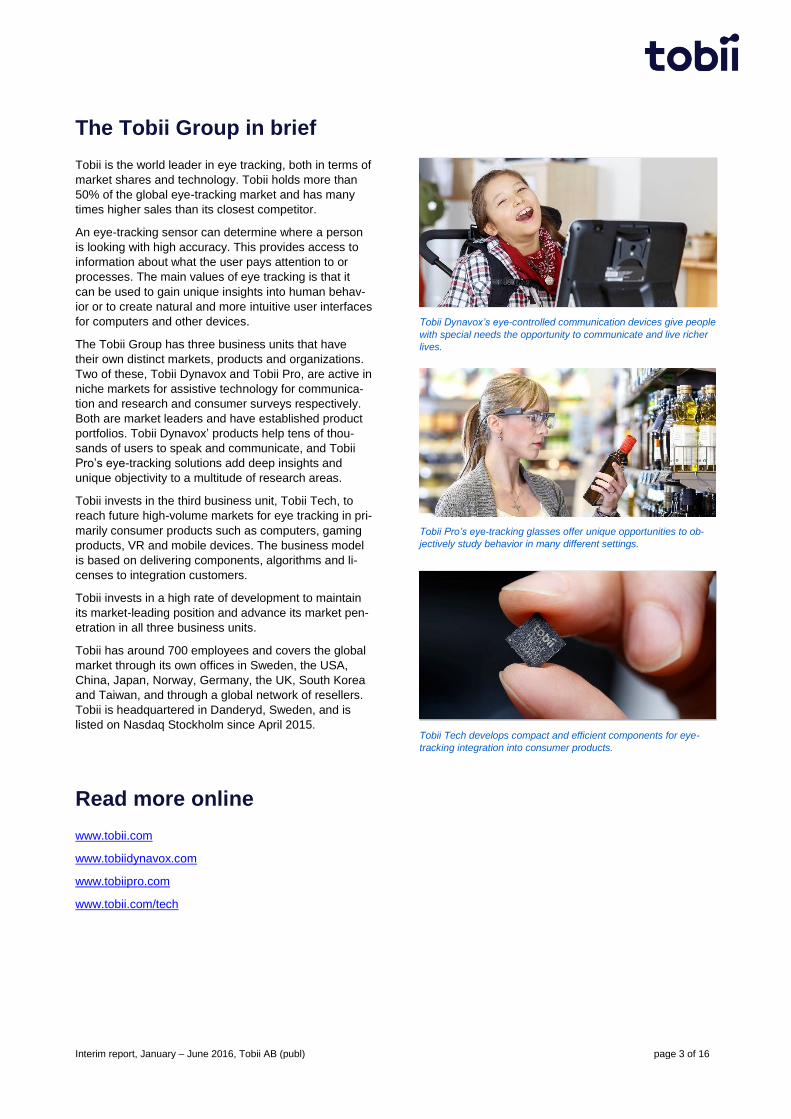
Tobii Dynavox’s eye-controlled communication devices give people
with special needs the opportunity to communicate and live richer
lives.
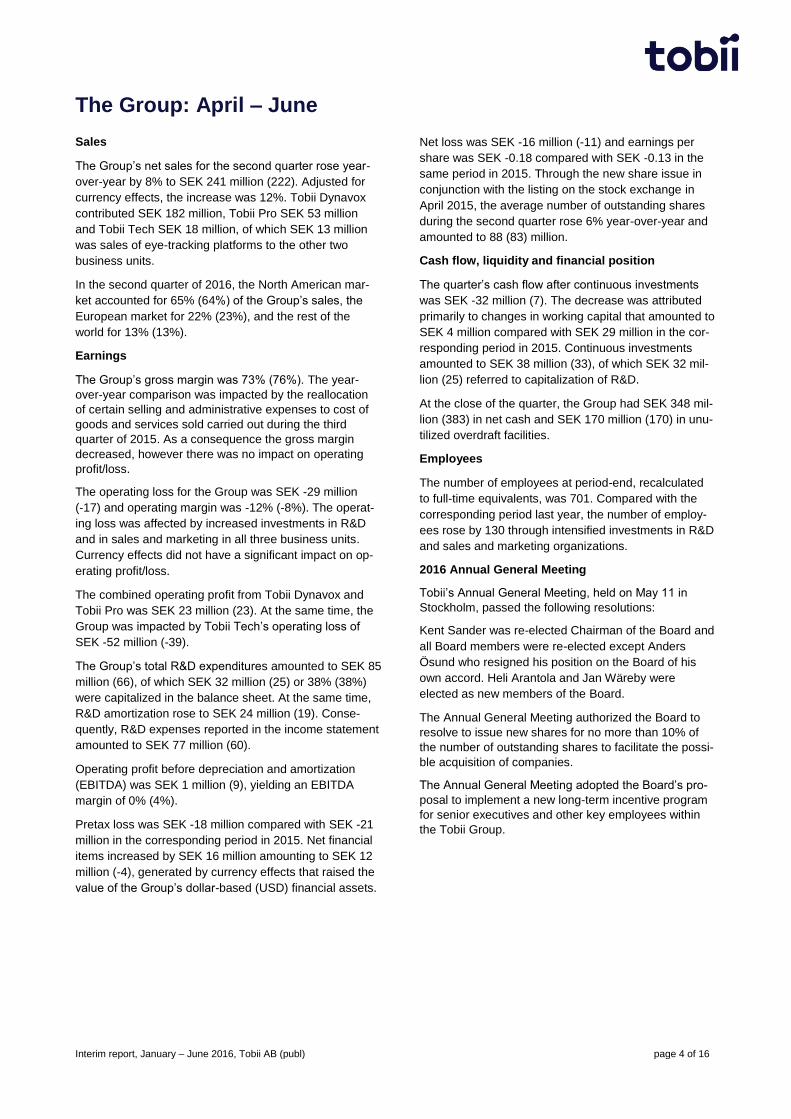
Tobii Pro’s eye-tracking glasses offer unique opportunities to ob-
jectively study behavior in many different settings.
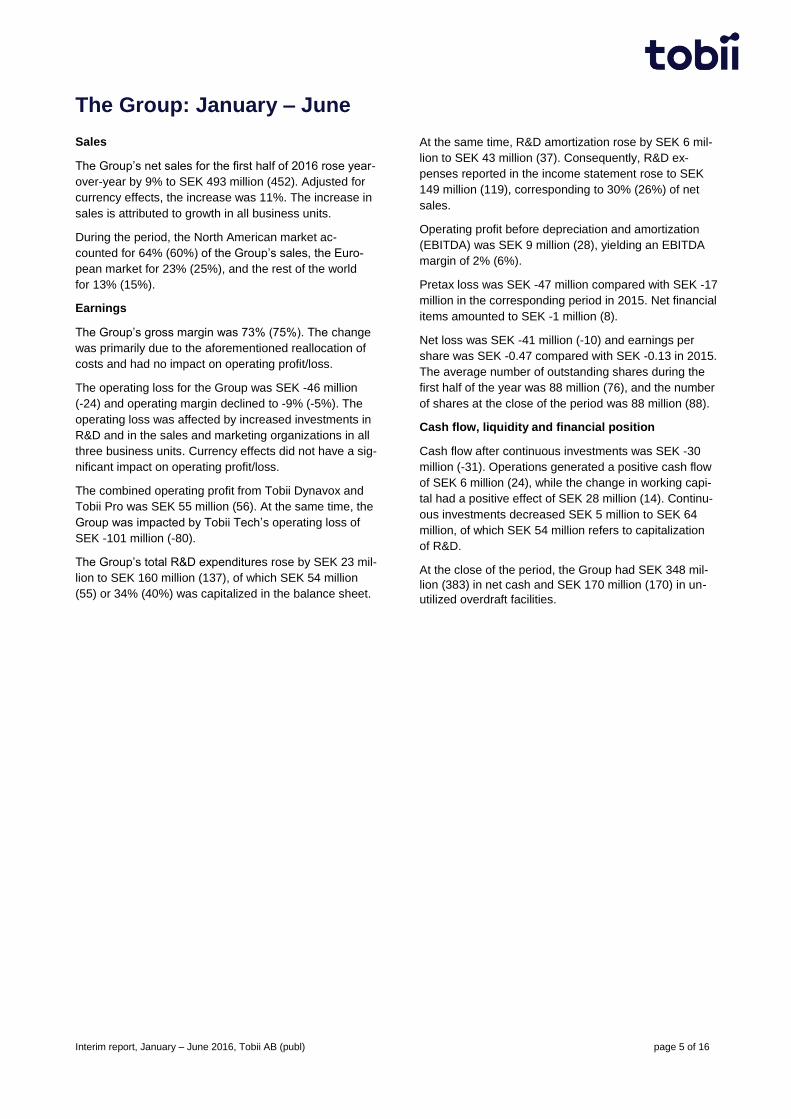
Tobii Tech develops compact and efficient components for eye-
tracking integration into consumer products.
Interim report, January – June 2016, Tobii AB (publ) page 4 of 16
The Group: April – June
Sales
The Group’s net sales for the second quarter rose year-
over-year by 8% to SEK 241 million (222). Adjusted for
currency effects, the increase was 12%. Tobii Dynavox
contributed SEK 182 million, Tobii Pro SEK 53 million
and Tobii Tech SEK 18 million, of which SEK 13 million
was sales of eye-tracking platforms to the other two
business units.
In the second quarter of 2016, the North American mar-
ket accounted for 65% (64%) of the Group’s sales, the
European market for 22% (23%), and the rest of the
world for 13% (13%).
Earnings
The Group’s gross margin was 73% (76%). The year-
over-year comparison was impacted by the reallocation
of certain selling and administrative expenses to cost of
goods and services sold carried out during the third
quarter of 2015. As a consequence the gross margin
decreased, however there was no impact on operating
profit/loss.
The operating loss for the Group was SEK -29 million
(-17) and operating margin was -12% (-8%). The operat-
ing loss was affected by increased investments in R&D
and in sales and marketing in all three business units.
Currency effects did not have a significant impact on op-
erating profit/loss.
The combined operating profit from Tobii Dynavox and
Tobii Pro was SEK 23 million (23). At the same time, the
Group was impacted by Tobii Tech’s operating loss of
SEK -52 million (-39).
The Group’s total R&D expenditures amounted to SEK 85
million (66), of which SEK 32 million (25) or 38% (38%)
were capitalized in the balance sheet. At the same time,
R&D amortization rose to SEK 24 million (19). Conse-
quently, R&D expenses reported in the income statement
amounted to SEK 77 million (60).
Operating profit before depreciation and amortization
(EBITDA) was SEK 1 million (9), yielding an EBITDA
margin of 0% (4%).
Pretax loss was SEK -18 million compared with SEK -21
million in the corresponding period in 2015. Net financial
items increased by SEK 16 million amounting to SEK 12
million (-4), generated by currency effects that raised the
value of the Group’s dollar-based (USD) financial assets.
Net loss was SEK -16 million (-11) and earnings per
share was SEK -0.18 compared with SEK -0.13 in the
same period in 2015. Through the new share issue in
conjunction with the listing on the stock exchange in
April 2015, the average number of outstanding shares
during the second quarter rose 6% year-over-year and
amounted to 88 (83) million.
Cash flow, liquidity and financial position
The quarter’s cash flow after continuous investments
was SEK -32 million (7). The decrease was attributed
primarily to changes in working capital that amounted to
SEK 4 million compared with SEK 29 million in the cor-
responding period in 2015. Continuous investments
amounted to SEK 38 million (33), of which SEK 32 mil-
lion (25) referred to capitalization of R&D.
At the close of the quarter, the Group had SEK 348 mil-
lion (383) in net cash and SEK 170 million (170) in unu-
tilized overdraft facilities.
Employees
The number of employees at period-end, recalculated
to full-time equivalents, was 701. Compared with the
corresponding period last year, the number of employ-
ees rose by 130 through intensified investments in R&D
and sales and marketing organizations.
2016 Annual General Meeting
Tobii’s Annual General Meeting, held on May 11 in
Stockholm, passed the following resolutions:
Kent Sander was re-elected Chairman of the Board and
all Board members were re-elected except Anders
Ösund who resigned his position on the Board of his
own accord. Heli Arantola and Jan Wäreby were
elected as new members of the Board.
The Annual General Meeting authorized the Board to
resolve to issue new shares for no more than 10% of
the number of outstanding shares to facilitate the possi-
ble acquisition of companies.
The Annual General Meeting adopted the Board’s pro-
posal to implement a new long-term incentive program
for senior executives and other key employees within
the Tobii Group.
Interim report, January – June 2016, Tobii AB (publ) page 5 of 16
The Group: January – June
Sales
The Group’s net sales for the first half of 2016 rose year-
over-year by 9% to SEK 493 million (452). Adjusted for
currency effects, the increase was 11%. The increase in
sales is attributed to growth in all business units.
During the period, the North American market ac-
counted for 64% (60%) of the Group’s sales, the Euro-
pean market for 23% (25%), and the rest of the world
for 13% (15%).
Earnings
The Group’s gross margin was 73% (75%). The change
was primarily due to the aforementioned reallocation of
costs and had no impact on operating profit/loss.
The operating loss for the Group was SEK -46 million
(-24) and operating margin declined to -9% (-5%). The
operating loss was affected by increased investments in
R&D and in the sales and marketing organizations in all
three business units. Currency effects did not have a sig-
nificant impact on operating profit/loss.
The combined operating profit from Tobii Dynavox and
Tobii Pro was SEK 55 million (56). At the same time, the
Group was impacted by Tobii Tech’s operating loss of
SEK -101 million (-80).
The Group’s total R&D expenditures rose by SEK 23 mil-
lion to SEK 160 million (137), of which SEK 54 million
(55) or 34% (40%) was capitalized in the balance sheet.
At the same time, R&D amortization rose by SEK 6 mil-
lion to SEK 43 million (37). Consequently, R&D ex-
penses reported in the income statement rose to SEK
149 million (119), corresponding to 30% (26%) of net
sales.
Operating profit before depreciation and amortization
(EBITDA) was SEK 9 million (28), yielding an EBITDA
margin of 2% (6%).
Pretax loss was SEK -47 million compared with SEK -17
million in the corresponding period in 2015. Net financial
items amounted to SEK -1 million (8).
Net loss was SEK -41 million (-10) and earnings per
share was SEK -0.47 compared with SEK -0.13 in 2015.
The average number of outstanding shares during the
first half of the year was 88 million (76), and the number
of shares at the close of the period was 88 million (88).
Cash flow, liquidity and financial position
Cash flow after continuous investments was SEK -30
million (-31). Operations generated a positive cash flow
of SEK 6 million (24), while the change in working capi-
tal had a positive effect of SEK 28 million (14). Continu-
ous investments decreased SEK 5 million to SEK 64
million, of which SEK 54 million refers to capitalization
of R&D.
At the close of the period, the Group had SEK 348 mil-
lion (383) in net cash and SEK 170 million (170) in un-
utilized overdraft facilities.
Interim report, January – June 2016, Tobii AB (publ) page 6 of 16
Tobii Dynavox
Second quarter First six months Full Year
SEK m 2016 2015 2016 2015 2015
Net sales 181.8 172.5 370.1 339.8 740.3
Gross margin 70% 75% 71% 74% 73%
EBITDA 41.5 36.4 84.4 78.5 182.1
EBITDA margin 23% 21% 23% 23% 25%
Operating profit/loss (EBIT) 25.4 21.6 52.0 48.1 119.0
EBIT margin 14% 13% 14% 14% 16%
April – June
Sales
Net sales for the second quarter rose year-over-year by
SEK 9 million, or 5%, to SEK 182 million (173). Adjusted
for currency effects, the increase was 9%. This was
driven by higher sales in the US, primarily due to one-off
effects from the Steve Gleason Act. In Europe, net sales
declined somewhat due to changes in the sales organi-
zation in the UK and price reductions on some products
in the portfolio.
Earnings
Gross margin was 70% (75%). Year-over-year, gross
margin was impacted by the reallocation of certain sell-
ing and administrative expenses to cost of goods and
services sold carried out during the third quarter of 2015.
Price reductions on some products of the portfolio in cer-
tain geographic markets also had an impact on the gross
margin during the quarter.
Operating profit totaled SEK 25 million (22) and the oper-
ating margin was 14% (13%). The operating profit was af-
fected by continued investments in R&D, sales and mar-
keting. These investments included development of new
products and direct channels to consumers to strengthen
the business unit’s position in the low-price segment, and
a general expansion of the sales and marketing organiza-
tions in the UK and the US.
The total R&D expenditures rose by SEK 3 million to
SEK 25 million (22), of which SEK 16 million (11) or 64%
(50%) were capitalized in the balance sheet. At the
same time, R&D amortization rose by SEK 2 million to
SEK 11 million (9). Consequently, R&D expenses re-
ported in the income statement amounted to SEK 20 mil-
lion (20). The business unit continued to invest in prod-
uct development to enhance the product portfolio of eye-
controlled and touch-based communication devices and
communication software.
Operating profit before depreciation and amortization
(EBITDA) was SEK 41 million (36) and the EBITDA mar-
gin was 23% (21%).
January – June
Sales
Net sales for the first half of 2016 rose year-over-year by
9% to SEK 370 million (340), primarily through higher
sales in the US. Adjusted for currency effects, the in-
crease was 11%, about half of which was due to one-off
effects from the Steve Gleason Act.
Earnings
Gross margin decreased by 3 percentage points to 71%
(74%) primarily through the aforementioned reallocation
of expenses and price reductions on some products of
the portfolio.
Total R&D expenditures rose by SEK 8 million to SEK 52
million (44), of which SEK 29 million (20) or 56% (45%)
were capitalized in the balance sheet. At the same time,
R&D amortization rose by SEK 6 million to SEK 23 million
(17). Consequently, R&D expenses reported in the income
statement amounted to SEK 45 million (41).
Operating profit rose to SEK 52 million (48) and the oper-
ating margin was 14% (14%). Operating profit before de-
preciation and amortization (EBITDA) rose to SEK 84 mil-
lion (79) and adjusted EBITDA margin was 23% (23%).
Other events
Launched the computer peripheral PCEye Mini that
integrates the new eye-tracking platform, Tobii IS4.
Launched Snap Scene, an app for children who are
in the early stage of language development.
A dispute with the University of Virginia related to a
licensing agreement that followed the Dynavox ac-
quisition was concluded. All previous and potential
claims were resolved through settlement.
Tobii Dynavox is the world’s leading supplier of assistive
technology for individuals with reduced ability to speak
and communicate due to conditions such as cerebral
palsy, ALS, aphasia, spinal cord injuries or autism. The
products include medical-grade eye-controlled and
touchscreen-based communication devices and a variety
of software.
Tobii Dynavox accounts for three quarters of the Group’s
sales. The business unit’s long-term financial goal is to
deliver revenue growth in excess of 10% per year, with
an EBIT margin of 20%.
Interim report, January – June 2016, Tobii AB (publ) page 7 of 16
Tobii Pro
Second quarter First six months Full Year
SEK m 2016 2015 2016 2015 2015
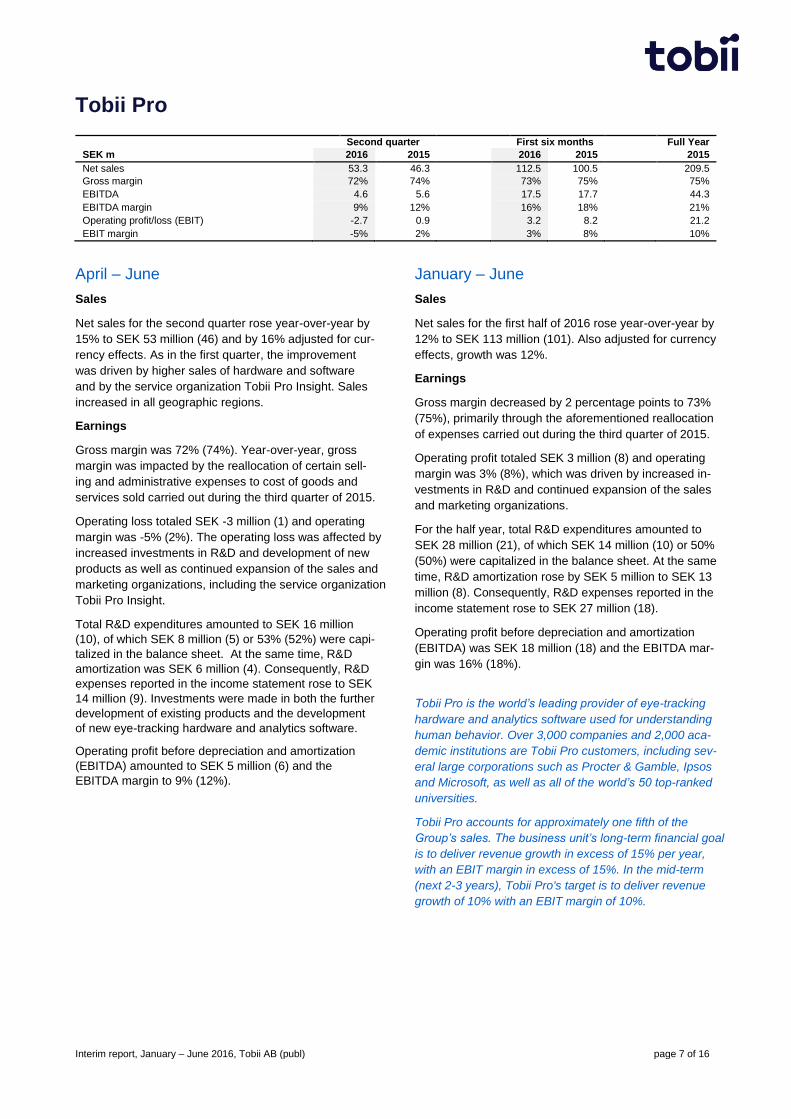
Net sales 53.3 46.3 112.5 100.5 209.5
Gross margin 72% 74% 73% 75% 75%
EBITDA 4.6 5.6 17.5 17.7 44.3
EBITDA margin 9% 12% 16% 18% 21%
Operating profit/loss (EBIT) -2.7 0.9 3.2 8.2 21.2
EBIT margin -5% 2% 3% 8% 10%
April – June
Sales
Net sales for the second quarter rose year-over-year by
15% to SEK 53 million (46) and by 16% adjusted for cur-
rency effects. As in the first quarter, the improvement
was driven by higher sales of hardware and software
and by the service organization Tobii Pro Insight. Sales
increased in all geographic regions.
Earnings
Gross margin was 72% (74%). Year-over-year, gross
margin was impacted by the reallocation of certain sell-
ing and administrative expenses to cost of goods and
services sold carried out during the third quarter of 2015.
Operating loss totaled SEK -3 million (1) and operating
margin was -5% (2%). The operating loss was affected by
increased investments in R&D and development of new
products as well as continued expansion of the sales and
marketing organizations, including the service organization
Tobii Pro Insight.
Total R&D expenditures amounted to SEK 16 million
(10), of which SEK 8 million (5) or 53% (52%) were capi-
talized in the balance sheet. At the same time, R&D
amortization was SEK 6 million (4). Consequently, R&D
expenses reported in the income statement rose to SEK
14 million (9). Investments were made in both the further
development of existing products and the development
of new eye-tracking hardware and analytics software.
Operating profit before depreciation and amortization
(EBITDA) amounted to SEK 5 million (6) and the
EBITDA margin to 9% (12%).
January – June
Sales
Net sales for the first half of 2016 rose year-over-year by
12% to SEK 113 million (101). Also adjusted for currency
effects, growth was 12%.
Earnings
Gross margin decreased by 2 percentage points to 73%
(75%), primarily through the aforementioned reallocation
of expenses carried out during the third quarter of 2015.
Operating profit totaled SEK 3 million (8) and operating
margin was 3% (8%), which was driven by increased in-
vestments in R&D and continued expansion of the sales
and marketing organizations.
For the half year, total R&D expenditures amounted to
SEK 28 million (21), of which SEK 14 million (10) or 50%
(50%) were capitalized in the balance sheet. At the same
time, R&D amortization rose by SEK 5 million to SEK 13
million (8). Consequently, R&D expenses reported in the
income statement rose to SEK 27 million (18).
Operating profit before depreciation and amortization
(EBITDA) was SEK 18 million (18) and the EBITDA mar-
gin was 16% (18%).
Tobii Pro is the world’s leading provider of eye-tracking
hardware and analytics software used for understanding
human behavior. Over 3,000 companies and 2,000 aca-
demic institutions are Tobii Pro customers, including sev-
eral large corporations such as Procter & Gamble, Ipsos
and Microsoft, as well as all of the world’s 50 top-ranked
universities.
Tobii Pro accounts for approximately one fifth of the
Group’s sales. The business unit’s long-term financial goal
is to deliver revenue growth in excess of 15% per year,
with an EBIT margin in excess of 15%. In the mid-term
(next 2-3 years), Tobii Pro's target is to deliver revenue
growth of 10% with an EBIT margin of 10%.
Interim report, January – June 2016, Tobii AB (publ) page 8 of 16
Tobii Tech
Second quarter First six months Full Year
SEK m 2016 2015 2016 2015 2015
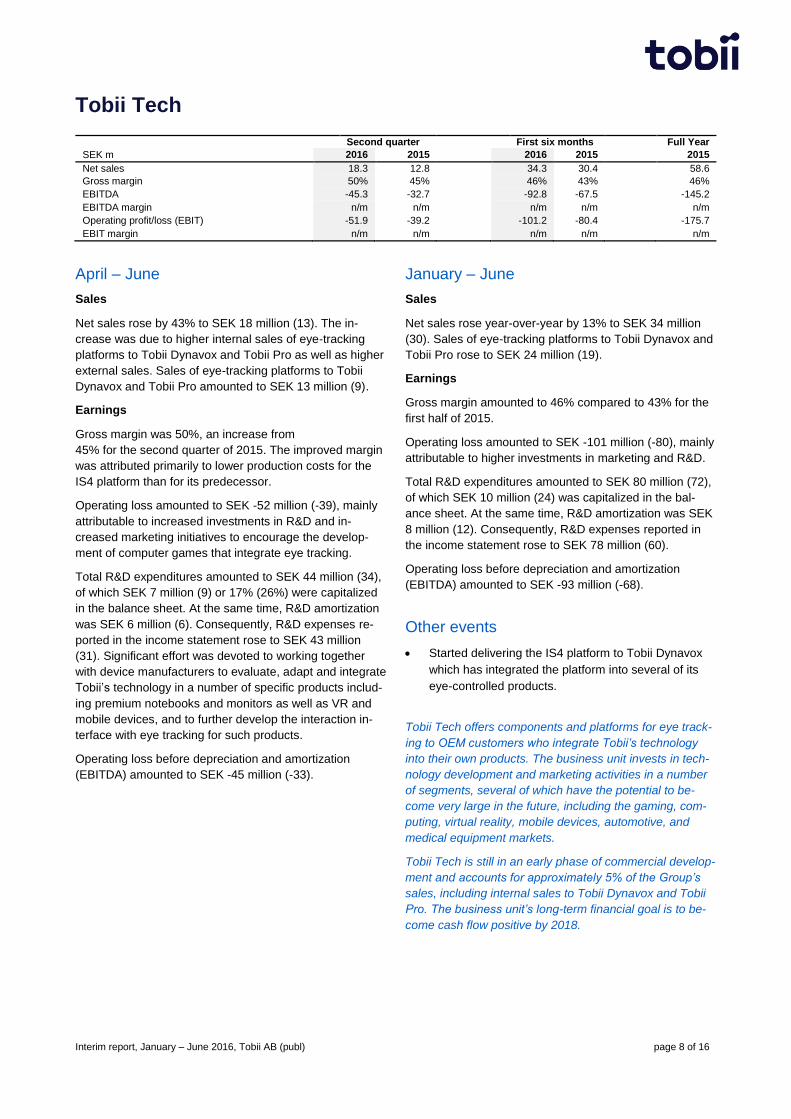
Net sales 18.3 12.8 34.3 30.4 58.6
Gross margin 50% 45% 46% 43% 46%
EBITDA -45.3 -32.7 -92.8 -67.5 -145.2
EBITDA margin n/m n/m n/m n/m n/m
Operating profit/loss (EBIT) -51.9 -39.2 -101.2 -80.4 -175.7
EBIT margin n/m n/m n/m n/m n/m
April – June
Sales
Net sales rose by 43% to SEK 18 million (13). The in-
crease was due to higher internal sales of eye-tracking
platforms to Tobii Dynavox and Tobii Pro as well as higher
external sales. Sales of eye-tracking platforms to Tobii
Dynavox and Tobii Pro amounted to SEK 13 million (9).
Earnings
Gross margin was 50%, an increase from
45% for the second quarter of 2015. The improved margin
was attributed primarily to lower production costs for the
IS4 platform than for its predecessor.
Operating loss amounted to SEK -52 million (-39), mainly
attributable to increased investments in R&D and in-
creased marketing initiatives to encourage the develop-
ment of computer games that integrate eye tracking.
Total R&D expenditures amounted to SEK 44 million (34),
of which SEK 7 million (9) or 17% (26%) were capitalized
in the balance sheet. At the same time, R&D amortization
was SEK 6 million (6). Consequently, R&D expenses re-
ported in the income statement rose to SEK 43 million
(31). Significant effort was devoted to working together
with device manufacturers to evaluate, adapt and integrate
Tobii’s technology in a number of specific products includ-
ing premium notebooks and monitors as well as VR and
mobile devices, and to further develop the interaction in-
terface with eye tracking for such products.
Operating loss before depreciation and amortization
(EBITDA) amounted to SEK -45 million (-33).
January – June
Sales
Net sales rose year-over-year by 13% to SEK 34 million
(30). Sales of eye-tracking platforms to Tobii Dynavox and
Tobii Pro rose to SEK 24 million (19).
Earnings
Gross margin amounted to 46% compared to 43% for the
first half of 2015.
Operating loss amounted to SEK -101 million (-80), mainly
attributable to higher investments in marketing and R&D.
Total R&D expenditures amounted to SEK 80 million (72),
of which SEK 10 million (24) was capitalized in the bal-
ance sheet. At the same time, R&D amortization was SEK
8 million (12). Consequently, R&D expenses reported in
the income statement rose to SEK 78 million (60).
Operating loss before depreciation and amortization
(EBITDA) amounted to SEK -93 million (-68).
Other events
Started delivering the IS4 platform to Tobii Dynavox
which has integrated the platform into several of its
eye-controlled products.
Tobii Tech offers components and platforms for eye track-
ing to OEM customers who integrate Tobii’s technology
into their own products. The business unit invests in tech-
nology development and marketing activities in a number
of segments, several of which have the potential to be-
come very large in the future, including the gaming, com-
puting, virtual reality, mobile devices, automotive, and
medical equipment markets.
Tobii Tech is still in an early phase of commercial develop-
ment and accounts for approximately 5% of the Group’s
sales, including internal sales to Tobii Dynavox and Tobii
Pro. The business unit’s long-term financial goal is to be-
come cash flow positive by 2018.
Interim report, January – June 2016, Tobii AB (publ) page 9 of 16
Consolidated key ratios
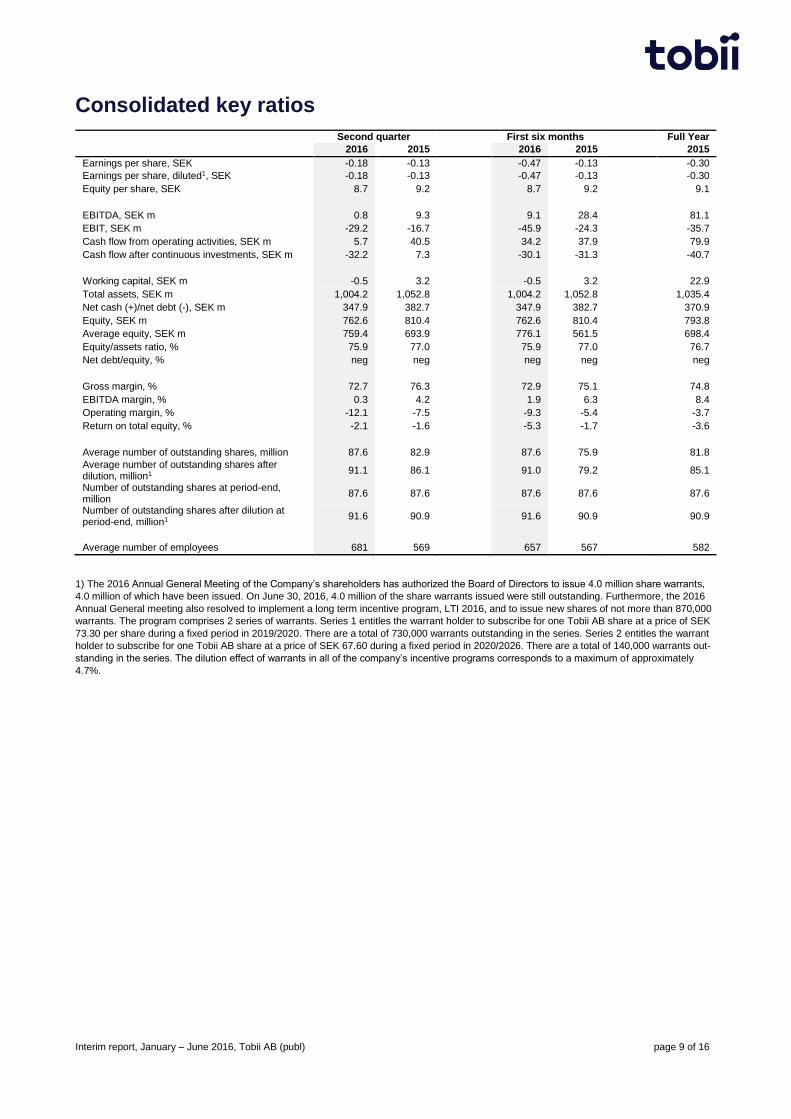
Second quarter First six months Full Year
2016 2015 2016 2015 2015
Earnings per share, SEK -0.18 -0.13 -0.47 -0.13 -0.30
Earnings per share, diluted1, SEK -0.18 -0.13 -0.47 -0.13 -0.30
Equity per share, SEK 8.7 9.2 8.7 9.2 9.1
EBITDA, SEK m 0.8 9.3 9.1 28.4 81.1
EBIT, SEK m -29.2 -16.7 -45.9 -24.3 -35.7
Cash flow from operating activities, SEK m 5.7 40.5 34.2 37.9 79.9
Cash flow after continuous investments, SEK m -32.2 7.3 -30.1 -31.3 -40.7
Working capital, SEK m -0.5 3.2 -0.5 3.2 22.9
Total assets, SEK m 1,004.2 1,052.8 1,004.2 1,052.8 1,035.4
Net cash (+)/net debt (-), SEK m 347.9 382.7 347.9 382.7 370.9
Equity, SEK m 762.6 810.4 762.6 810.4 793.8
Average equity, SEK m 759.4 693.9 776.1 561.5 698.4
Equity/assets ratio, % 75.9 77.0 75.9 77.0 76.7
Net debt/equity, % neg neg neg neg neg
Gross margin, % 72.7 76.3 72.9 75.1 74.8
EBITDA margin, % 0.3 4.2 1.9 6.3 8.4
Operating margin, % -12.1 -7.5 -9.3 -5.4 -3.7
Return on total equity, % -2.1 -1.6 -5.3 -1.7 -3.6
Average number of outstanding shares, million 87.6 82.9 87.6 75.9 81.8
Average number of outstanding shares after dilution, million1 91.1 86.1 91.0 79.2 85.1
Number of outstanding shares at period-end, million
87.6 87.6 87.6 87.6 87.6
Number of outstanding shares after dilution at period-end, million1 91.6 90.9 91.6 90.9 90.9
Average number of employees 681 569 657 567 582
1) The 2016 Annual General Meeting of the Company’s shareholders has authorized the Board of Directors to issue 4.0 million share warrants,
4.0 million of which have been issued. On June 30, 2016, 4.0 million of the share warrants issued were still outstanding. Furthermore, the 2016
Annual General meeting also resolved to implement a long term incentive program, LTI 2016, and to issue new shares of not more than 870,000
warrants. The program comprises 2 series of warrants. Series 1 entitles the warrant holder to subscribe for one Tobii AB share at a price of SEK
73.30 per share during a fixed period in 2019/2020. There are a total of 730,000 warrants outstanding in the series. Series 2 entitles the warrant
holder to subscribe for one Tobii AB share at a price of SEK 67.60 during a fixed period in 2020/2026. There are a total of 140,000 warrants out-
standing in the series. The dilution effect of warrants in all of the company’s incentive programs corresponds to a maximum of approximately
4.7%.
Interim report, January – June 2016, Tobii AB (publ) page 10 of 16
Consolidated Statement of Comprehensive Income
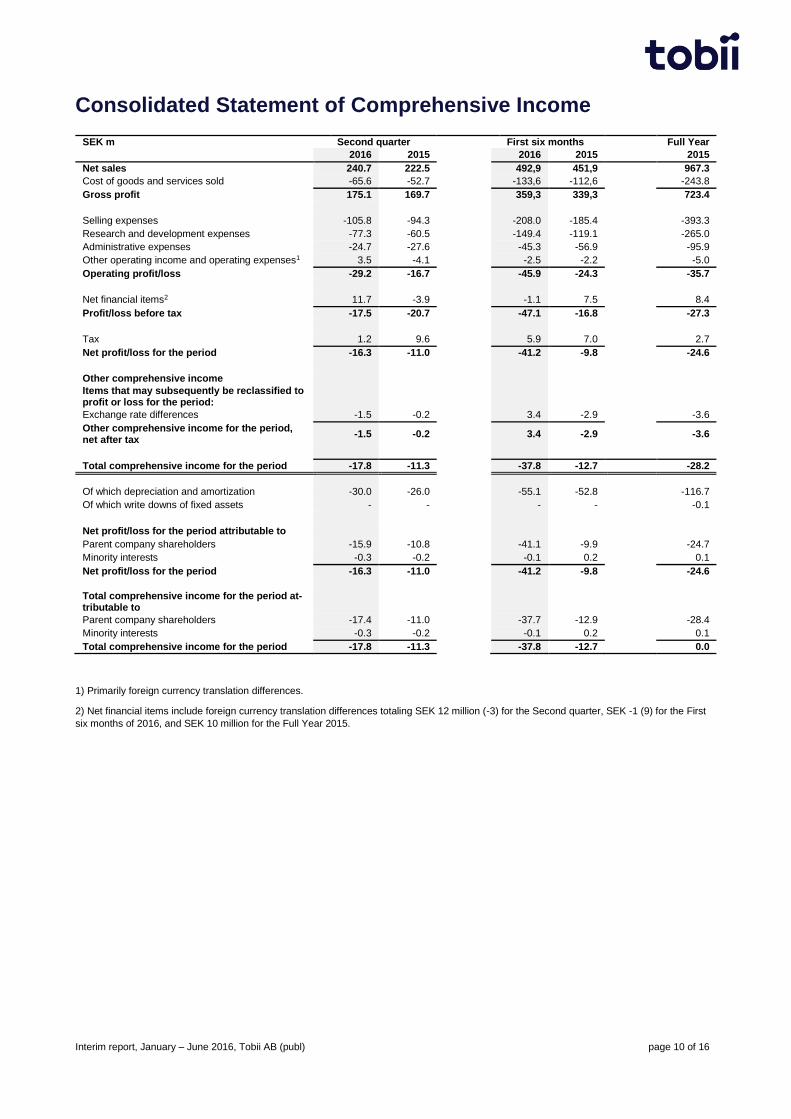
SEK m Second quarter First six months Full Year
2016 2015 2016 2015 2015
Net sales 240.7 222.5 492,9 451,9 967.3
Cost of goods and services sold -65.6 -52.7 -133,6 -112,6 -243.8
Gross profit 175.1 169.7 359,3 339,3 723.4
Selling expenses -105.8 -94.3 -208.0 -185.4 -393.3
Research and development expenses -77.3 -60.5 -149.4 -119.1 -265.0
Administrative expenses -24.7 -27.6 -45.3 -56.9 -95.9
Other operating income and operating expenses1 3.5 -4.1 -2.5 -2.2 -5.0
Operating profit/loss -29.2 -16.7 -45.9 -24.3 -35.7
Net financial items2 11.7 -3.9 -1.1 7.5 8.4
Profit/loss before tax -17.5 -20.7 -47.1 -16.8 -27.3
Tax 1.2 9.6 5.9 7.0 2.7
Net profit/loss for the period -16.3 -11.0 -41.2 -9.8 -24.6
Other comprehensive income Items that may subsequently be reclassified to profit or loss for the period: Exchange rate differences -1.5 -0.2 3.4 -2.9 -3.6
Other comprehensive income for the period, net after tax
-1.5 -0.2
3.4 -2.9 -3.6
Total comprehensive income for the period -17.8 -11.3 -37.8 -12.7 -28.2
Of which depreciation and amortization -30.0 -26.0 -55.1 -52.8 -116.7
Of which write downs of fixed assets - - - - -0.1
Net profit/loss for the period attributable to Parent company shareholders -15.9 -10.8 -41.1 -9.9 -24.7
Minority interests -0.3 -0.2 -0.1 0.2 0.1
Net profit/loss for the period -16.3 -11.0 -41.2 -9.8 -24.6
Total comprehensive income for the period at-tributable to
Parent company shareholders -17.4 -11.0 -37.7 -12.9 -28.4
Minority interests -0.3 -0.2 -0.1 0.2 0.1
Total comprehensive income for the period -17.8 -11.3 -37.8 -12.7 0.0
1) Primarily foreign currency translation differences.
2) Net financial items include foreign currency translation differences totaling SEK 12 million (-3) for the Second quarter, SEK -1 (9) for the First
six months of 2016, and SEK 10 million for the Full Year 2015.
Interim report, January – June 2016, Tobii AB (publ) page 11 of 16
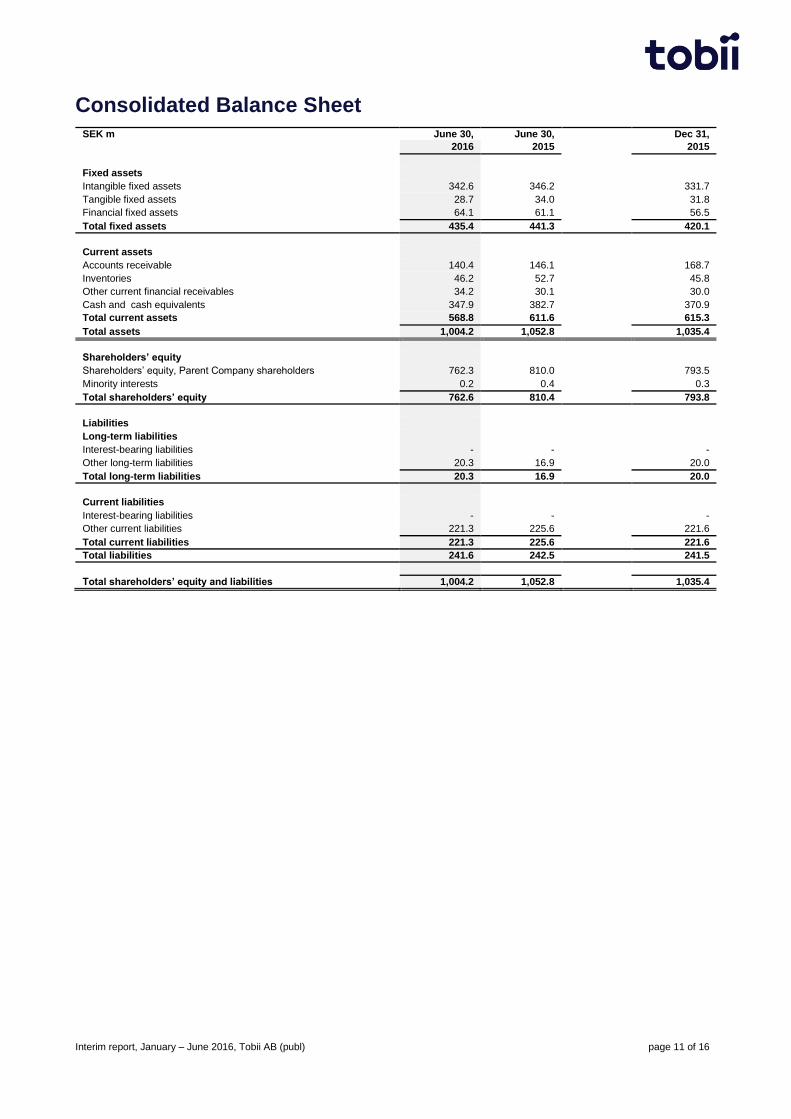
Consolidated Balance Sheet
SEK m June 30, June 30, Dec 31,
2016 2015 2015
Fixed assets Intangible fixed assets 342.6 346.2 331.7
Tangible fixed assets 28.7 34.0 31.8
Financial fixed assets 64.1 61.1 56.5
Total fixed assets 435.4 441.3 420.1
Current assets Accounts receivable 140.4 146.1 168.7
Inventories 46.2 52.7 45.8
Other current financial receivables 34.2 30.1 30.0
Cash and cash equivalents 347.9 382.7 370.9
Total current assets 568.8 611.6 615.3
Total assets 1,004.2 1,052.8 1,035.4
Shareholders’ equity Shareholders’ equity, Parent Company shareholders 762.3 810.0 793.5
Minority interests 0.2 0.4 0.3
Total shareholders’ equity 762.6 810.4 793.8
Liabilities Long-term liabilities Interest-bearing liabilities - - -
Other long-term liabilities 20.3 16.9 20.0
Total long-term liabilities 20.3 16.9 20.0
Current liabilities Interest-bearing liabilities - - -
Other current liabilities 221.3 225.6 221.6
Total current liabilities 221.3 225.6 221.6
Total liabilities 241.6 242.5 241.5
Total shareholders’ equity and liabilities 1,004.2 1,052.8 1,035.4
Interim report, January – June 2016, Tobii AB (publ) page 12 of 16
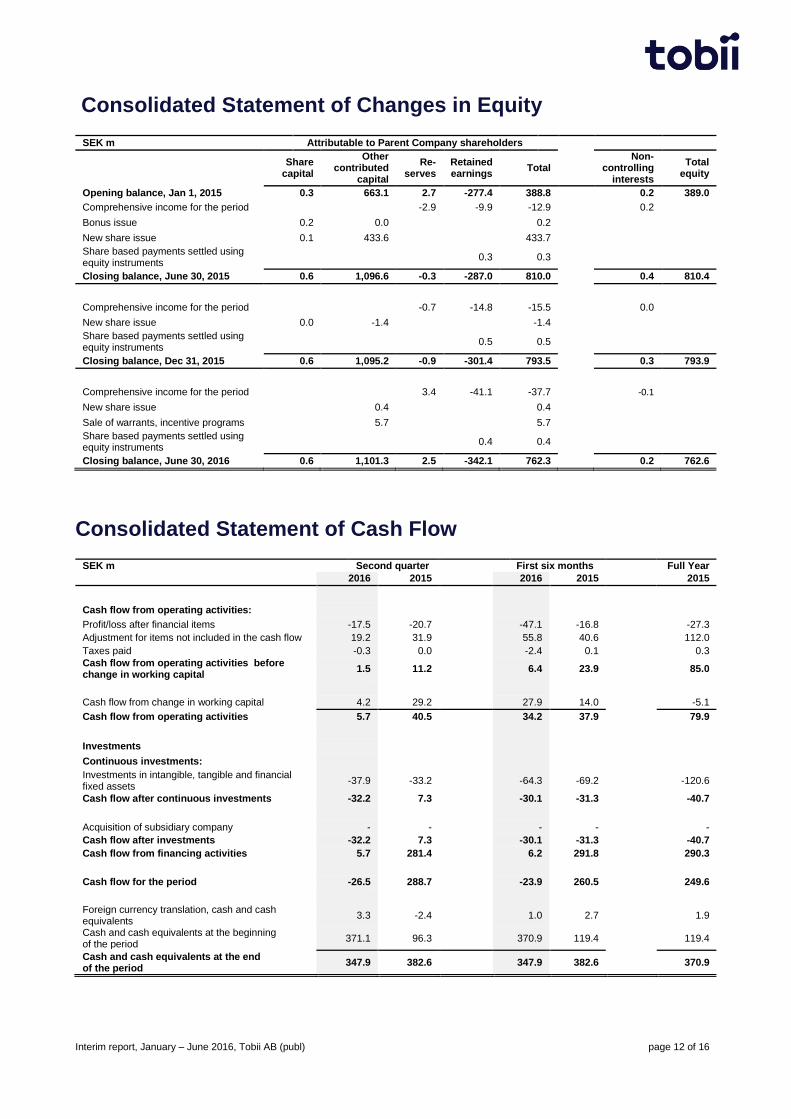
Consolidated Statement of Changes in Equity
SEK m Attributable to Parent Company shareholders
Share
capital
Other contributed
capital
Re-serves
Retained earnings
Total Non-
controlling interests
Total equity
Opening balance, Jan 1, 2015 0.3 663.1 2.7 -277.4 388.8 0.2 389.0
Comprehensive income for the period -2.9 -9.9 -12.9 0.2
Bonus issue 0.2 0.0 0.2 New share issue 0.1 433.6 433.7 Share based payments settled using equity instruments 0.3 0.3 Closing balance, June 30, 2015 0.6 1,096.6 -0.3 -287.0 810.0 0.4 810.4
Comprehensive income for the period -0.7 -14.8 -15.5 0.0
New share issue 0.0 -1.4 -1.4 Share based payments settled using equity instruments
0.5 0.5
Closing balance, Dec 31, 2015 0.6 1,095.2 -0.9 -301.4 793.5 0.3 793.9
Comprehensive income for the period 3.4 -41.1 -37.7 -0.1
New share issue 0.4 0.4 Sale of warrants, incentive programs 5.7 5.7 Share based payments settled using equity instruments
0.4 0.4
Closing balance, June 30, 2016 0.6 1,101.3 2.5 -342.1 762.3 0.2 762.6
Consolidated Statement of Cash Flow
SEK m Second quarter First six months Full Year
2016 2015 2016 2015 2015
Cash flow from operating activities: Profit/loss after financial items -17.5 -20.7 -47.1 -16.8 -27.3
Adjustment for items not included in the cash flow 19.2 31.9 55.8 40.6 112.0
Taxes paid -0.3 0.0 -2.4 0.1 0.3
Cash flow from operating activities before change in working capital
1.5 11.2 6.4 23.9 85.0
Cash flow from change in working capital 4.2 29.2 27.9 14.0 -5.1
Cash flow from operating activities 5.7 40.5 34.2 37.9 79.9
Investments Continuous investments: Investments in intangible, tangible and financial fixed assets
-37.9 -33.2 -64.3 -69.2 -120.6
Cash flow after continuous investments -32.2 7.3 -30.1 -31.3 -40.7
Acquisition of subsidiary company - - - - -
Cash flow after investments -32.2 7.3 -30.1 -31.3 -40.7
Cash flow from financing activities 5.7 281.4 6.2 291.8 290.3
Cash flow for the period -26.5 288.7 -23.9 260.5 249.6
Foreign currency translation, cash and cash equivalents
3.3 -2.4 1.0 2.7
1.9
Cash and cash equivalents at the beginning of the period
371.1 96.3 370.9 119.4
119.4
Cash and cash equivalents at the end of the period
347.9 382.6 347.9 382.6 370.9
Interim report, January – June 2016, Tobii AB (publ) page 13 of 16
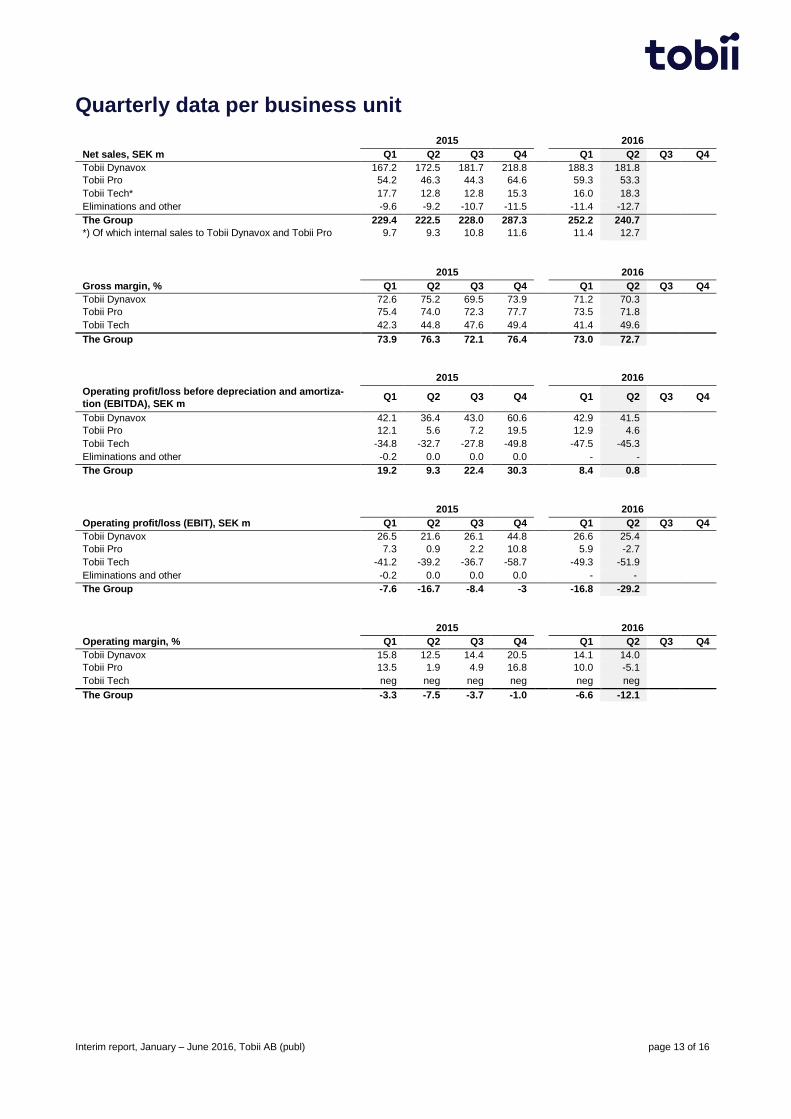
Quarterly data per business unit
2015 2016
Net sales, SEK m Q1 Q2 Q3 Q4 Q1 Q2
2Q2
Q3
3Q
3
Q4
4Q4 Tobii Dynavox 167.2 172.5 181.7 218.8 188.3 181.8 Tobii Pro 54.2 46.3 44.3 64.6 59.3 53.3
Tobii Tech* 17.7 12.8 12.8 15.3 16.0 18.3
Eliminations and other -9.6 -9.2 -10.7 -11.5 -11.4 -12.7
The Group 229.4 222.5 228.0 287.3 252.2 240.7 *) Of which internal sales to Tobii Dynavox and Tobii Pro 9.7 9.3 10.8 11.6 11.4 12.7
2015 2016
Gross margin, % Q1 Q2 Q3 Q4 Q1 Q2 Q3 Q4
Tobii Dynavox 72.6 75.2 69.5 73.9 71.2 70.3 Tobii Pro 75.4 74.0 72.3 77.7 73.5 71.8
Tobii Tech 42.3 44.8 47.6 49.4 41.4 49.6
The Group 73.9 76.3 72.1 76.4 73.0 72.7
2015 2016
Operating profit/loss before depreciation and amortiza-
tion (EBITDA), SEK m
SEK m
Q1 Q2 Q3 Q4
Q1 Q2 Q3 Q4
Tobii Dynavox 42.1 36.4 43.0 60.6 42.9 41.5 Tobii Pro 12.1 5.6 7.2 19.5 12.9 4.6
Tobii Tech -34.8 -32.7 -27.8 -49.8 -47.5 -45.3
Eliminations and other -0.2 0.0 0.0 0.0 - -
The Group 19.2 9.3 22.4 30.3 8.4 0.8
2015 2016
Operating profit/loss (EBIT), SEK m Q1 Q2 Q3 Q4 Q1 Q2 Q3 Q4
Tobii Dynavox 26.5 21.6 26.1 44.8 26.6 25.4 Tobii Pro 7.3 0.9 2.2 10.8 5.9 -2.7
Tobii Tech -41.2 -39.2 -36.7 -58.7 -49.3 -51.9
Eliminations and other -0.2 0.0 0.0 0.0 - -
The Group -7.6 -16.7 -8.4 -3 -16.8 -29.2
2015 2016
Operating margin, % Q1 Q2 Q3 Q4 Q1 Q2 Q3 Q4
Tobii Dynavox 15.8 12.5 14.4 20.5 14.1 14.0 Tobii Pro 13.5 1.9 4.9 16.8 10.0 -5.1
Tobii Tech neg neg neg neg neg neg
The Group -3.3 -7.5 -3.7 -1.0 -6.6 -12.1
Interim report, January – June 2016, Tobii AB (publ) page 14 of 16
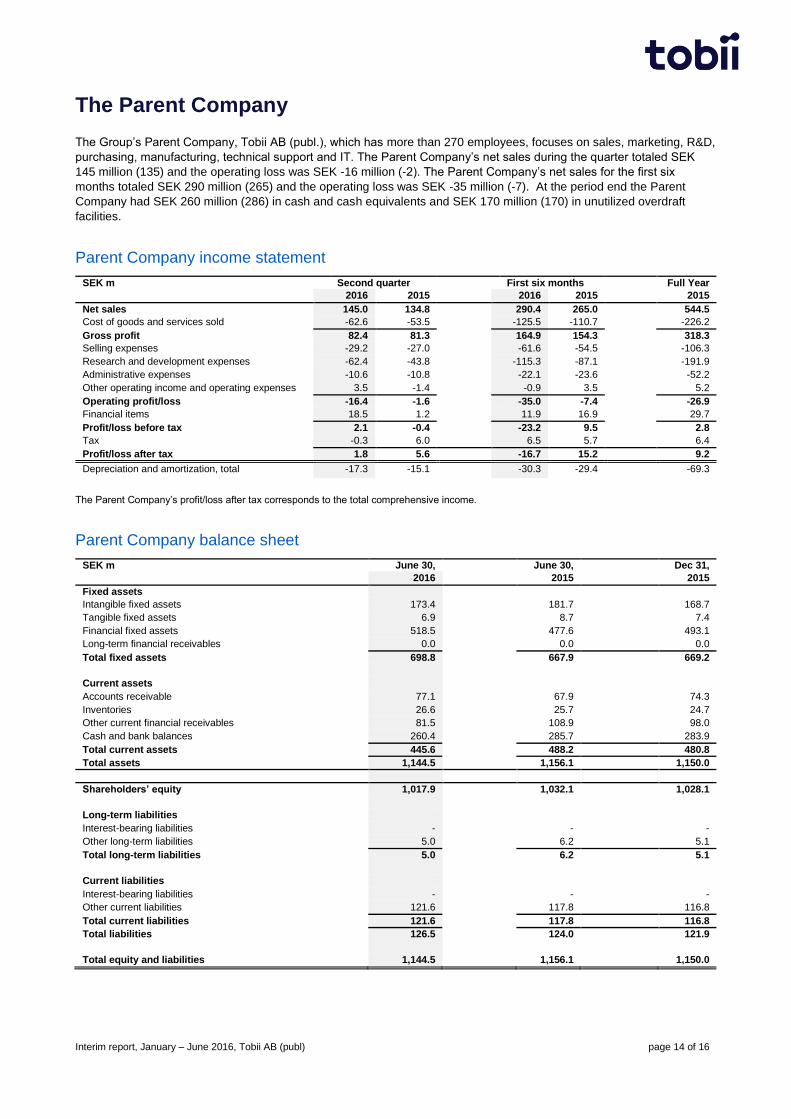
The Parent Company
The Group’s Parent Company, Tobii AB (publ.), which has more than 270 employees, focuses on sales, marketing, R&D,
purchasing, manufacturing, technical support and IT. The Parent Company’s net sales during the quarter totaled SEK
145 million (135) and the operating loss was SEK -16 million (-2). The Parent Company’s net sales for the first six
months totaled SEK 290 million (265) and the operating loss was SEK -35 million (-7). At the period end the Parent
Company had SEK 260 million (286) in cash and cash equivalents and SEK 170 million (170) in unutilized overdraft
facilities.
Parent Company income statement
SEK m Second quarter First six months Full Year
2016 2015 2016 2015 2015
Net sales 145.0 134.8 290.4 265.0 544.5
Cost of goods and services sold -62.6 -53.5 -125.5 -110.7 -226.2
Gross profit 82.4 81.3 164.9 154.3 318.3
Selling expenses -29.2 -27.0 -61.6 -54.5 -106.3
Research and development expenses -62.4 -43.8 -115.3 -87.1 -191.9
Administrative expenses -10.6 -10.8 -22.1 -23.6 -52.2
Other operating income and operating expenses 3.5 -1.4 -0.9 3.5 5.2
Operating profit/loss -16.4 -1.6 -35.0 -7.4 -26.9
Financial items 18.5 1.2 11.9 16.9 29.7
Profit/loss before tax 2.1 -0.4 -23.2 9.5 2.8
Tax -0.3 6.0 6.5 5.7 6.4
Profit/loss after tax 1.8 5.6 -16.7 15.2 9.2
Depreciation and amortization, total -17.3 -15.1 -30.3 -29.4 -69.3
The Parent Company’s profit/loss after tax corresponds to the total comprehensive income.
Parent Company balance sheet
SEK m June 30, June 30, Dec 31,
2016 2015 2015
Fixed assets Intangible fixed assets 173.4 181.7 168.7
Tangible fixed assets 6.9 8.7 7.4
Financial fixed assets 518.5 477.6 493.1
Long-term financial receivables 0.0 0.0 0.0
Total fixed assets 698.8 667.9 669.2
Current assets Accounts receivable 77.1 67.9 74.3
Inventories 26.6 25.7 24.7
Other current financial receivables 81.5 108.9 98.0
Cash and bank balances 260.4 285.7 283.9
Total current assets 445.6 488.2 480.8
Total assets 1,144.5 1,156.1 1,150.0
Shareholders’ equity 1,017.9 1,032.1 1,028.1
Long-term liabilities Interest-bearing liabilities - - -
Other long-term liabilities 5.0 6.2 5.1
Total long-term liabilities 5.0 6.2 5.1
Current liabilities Interest-bearing liabilities - - -
Other current liabilities 121.6 117.8 116.8
Total current liabilities 121.6 117.8 116.8
Total liabilities 126.5 124.0 121.9
Total equity and liabilities 1,144.5 1,156.1 1,150.0
Interim report, January – June 2016, Tobii AB (publ) page 15 of 16
Definitions of alternative
performance measures
(APM) not defined by IFRS Alternative Performance Measures, (APMs), are financial
measures of financial performance, financial position, or cash
flows, other than those defined in the applicable financial reporting
framework (IFRS). These are considered to be important supple-
mental measures of the company’s performance. These measures
may not be comparable to measures used by other companies,
due to the fact that not all companies calculate financial measures
in the same way.
Gross margin
Gross profit relative to the operations’ net sales.
Operating profit/loss (EBIT)
Operating profit/loss before financial income and expenses, and
taxes. Also known as EBIT – Earnings before interest and taxes.
Operating margin
Operating profit relative to the operations’ net sales.
EBITDA (Earnings before interest, taxes, depreciation and
amortization)
Operating profit/loss before depreciation, amortization and write-
downs.
EBITDA margin
Operating profit/loss before depreciation, amortization and write-
downs relative to the operations’ net sales.
Cash flow after continuous investments
Cash flow from operating activities minus investments in intangible,
tangible and financial fixed assets.
Working capital
Inventories, accounts receivable, and other current receivables mi-
nus accounts payable and other non-interest-bearing current liabili-
ties.
Net cash/net debt
Cash and cash equivalents minus interest-bearing liabilities.
Equity/assets ratio
Shareholders’ equity as a percentage of the Balance Sheet total.
Debt/equity ratio
Interest-bearing liabilities divided by shareholders’ equity.
Return on equity
Profit after tax, relative to the average shareholders’ equity during
the period.
Equity per share
Shareholders’ equity at the period end attributable to the Parent
Company’s shareholders, divided by the number of shares at the
period end.
Average number of employees
Average number of full time employees during the period, including
part-time employees recalculated as full-time positions.
n/m = not meaningful
Other information
Accounting principles
The consolidated interim report has been prepared in accordance
with the International Financial Reporting Standards (IFRS)
adopted by the EU. The Interim Report complies with the provi-
sions of IAS 34, and the report for the Parent Company has been
prepared pursuant to the provisions of the Swedish Annual Ac-
counts Act and RFR 2. The accounting principles of the Parent
Company and the Group, and the calculation principles used in the
report, are unchanged from those used in the most recently pub-
lished Annual Report. No new or amended IFRS regulations have
had any material impact on the Group.
ESMA’s (European Securities and Markets Authority) guidelines on
“Alternative Performance Measures” have been applied from July
3, 2016, requiring disclosure regarding financial measures that are
not defined in accordance with IFRS.
Risks and uncertainty factors
Tobii’s business risks include the economic climate, the competi-
tive situation, currency risks, credit risks in relation to customers, fi-
nancing risks, the risk of impairment write-downs of capitalized
R&D and other intangible assets, and regulatory risks (Tobii
Dynavox in the U.S. is under the supervisory control of the U.S.
Food and Drug Administration (FDA)). The Group’s risks and risk
management are described in greater detail in the Directors’ Re-
port section of Tobii’s 2015 Annual Report and Tobii is of the opin-
ion that this risk description remains correct.
Transactions with related parties
No transactions have occurred between Tobii and related parties
that have materially affected the company’s position and earnings.
Interim report, January – June 2016, Tobii AB (publ) page 16 of 16
This interim report has not been audited.
The Board of Directors and the CEO certify that this financial statement provides a fair view of the operations,
position and earnings of the Parent Company and the Group, and that it describes the significant risks and uncertainty
factors faced by the Company and the companies that make up the Group.
Danderyd, July 28, 2016
Tobii AB (publ)
Kent Sander
Chairman
Heli Arantola
Nils Bernhard
John Elvesjö
Martin Gren
Åsa Hedin
Jan Wäreby Henrik Eskilsson
President & CEO
This is a translation of the original Swedish interim report. In the event of a discrepancy between this translation and the
Swedish original, the Swedish interim report takes precedence.
This information is information that Tobii AB (publ) is obliged to make public, pursuant to the EU Market Abuse Regula-
tion and the Securities Markets Act. The information was submitted for publication, through the agency of the contact
person set out below, on July 28, 2016 at 08.00 (CET).
Contact details
Sara Hyléen, Corporate Communications Director, phone:
+46 709 161 641
Henrik Eskilsson, President & CEO, phone: +46 8 663 69 90
Esben Olesen, CFO, phone: +46 8 663 69 90
Tobii AB (publ) Corporate ID number: 556613-9654
Postal address: Box 743 18217 Danderyd, Sweden
Phone: +46 8 663 69 90
www.tobii.com
Financial calendar
Interim report Q3, 2016 October 27, 2016
Year-end report, 2016 February 15, 2017