Embed Size (px)
Citation preview
RESEARCH ARTICLE
Stably integrated and expressed retroviral sequencescan influence nuclear location and chromatincondensation of the integration locus
Jens Nagel & Birgit Groß & Manja Meggendorfer &
Carolin Preiss & Manuel Grez & Ruth Brack-Werner &
Steffen Dietzel
Received: 14 November 2011 /Revised: 27 February 2012 /Accepted: 27 February 2012 /Published online: 14 March 2012# The Author(s) 2012. This article is published with open access at Springerlink.com
Abstract The large-scale chromatin organization of retro-virus and retroviral gene vector integration loci has attractedlittle attention so far. We compared the nuclear organizationof transcribed integration loci with the corresponding loci onthe homologous chromosomes. Loci containing gamma-retroviral gene transfer vectors in mouse hematopoietic pre-cursor cells showed small but significant repositioning ofthe integration loci towards the nuclear interior. HIV inte-gration loci in human cells showed a significant reposition-ing towards the nuclear interior in two out of five cases.Notably, repositioned HIV integration loci also showedchromatin decondensation. Transcriptional activation of
HIV by sodium butyrate treatment did not lead to a furtherenhancement of the differences between integration andhomologous loci. The positioning relative to splicing speck-les was indistinguishable for integration and homologouscontrol loci. Our data show that stable retroviral integrationcan lead to alterations of the nuclear chromatin organization,and has the potential to modulate chromatin structure of thehost cell. We thus present an example where a few kb ofexogenous DNA are sufficient to significantly alter thelarge-scale chromatin organization of an endogenous locus.
Introduction
The mammalian interphase nucleus is a highly organizedand compartmentalized organelle in which each chromo-some occupies its own territory, providing the functionalform of chromatin (Cremer et al. 2006; Lanctôt et al.2007; Meaburn and Misteli 2007; Cremer and Cremer2010). Chromosome territories themselves also have a sub-structure with distinct subdomains for chromosomal subre-gions (Dietzel et al. 1998). The radial nuclear positioning ofchromosome territories is non-random. In many cell types,gene-rich territories and chromosome regions preferentiallyoccupy more internal regions while gene-poor territories andheterochromatin are preferentially at the nuclear periphery(Croft et al. 1999; Boyle et al. 2001; Cremer et al. 2001).Other studies showed that GC-rich chromosome regions aremore likely to occur in central positions than GC-poorregions (Hepperger et al. 2008; Küpper et al. 2007).
Thanks to their capacity to deliver genetic material intotarget cells, viral gene vectors play an important role in thefield of gene therapy. Retroviral vectors integrate stably intothe host genome and therefore have the potential to exert
Communicated by Greg Matera
J. Nagel : B. Groß : S. DietzelDepartment Biologie II,Ludwig-Maximilians-Universität München,Großhaderner Str. 2,82152 Planegg-Martinsried, Germany
M. Meggendorfer : R. Brack-WernerInstitute of Virology,Helmholtz-Zentrum München,German Research Center for Environmental Health,Ingolstädter Landstrasse 1,85764 Neuherberg, Germany
C. Preiss :M. GrezGeorg-Speyer-Haus,Paul-Ehrlich-Straße 42-44,60596 Frankfurt am Main, Germany
S. Dietzel (*)Walter-Brendel-Zentrum für Experimentelle Medizin,Ludwig-Maximilians-Universität München,Marchioninistr. 27,81377 Munich, Germanye-mail: [email protected]
Chromosoma (2012) 121:353–367DOI 10.1007/s00412-012-0366-9

enduring therapeutical effects (Kay et al. 2001; Mancheno-Corvo and Martin-Duque 2006; Edelstein et al. 2007). UntilJuly 2011 1714 gene therapy clinical trials were approvedworldwide (http://www.wiley.com/legacy/wileychi/genmed/clinical/) with retroviral vectors coming in a close second(23% including lentiviral vectors) after adenoviral vectors(24%). Retroviral gene transfer vectors lack most retroviralprotein coding sequences while retaining the viral packag-ing signal and the 5′ and 3′ terminal repeat sequences(LTRs), which are required for DNA integration (Thiel andRössler 2007; Nolan 2009). Integration potentially may leadto oncogenesis by disruption of tumor suppressor genes oractivation of nearby proto-oncogenes and is thus a reasonfor concern (Hacein-Bey-Abina et al. 2008; Howe et al.2008; Ott et al. 2006; Stein et al. 2010).
Retroviruses, in particular HIV, are also important humandisease agents. For both, retroviruses and retroviral vectors,it is not clear how the genomic site for integration is deter-mined, although some preferences were described(Bushman et al. 2005; Cattoglio et al. 2010; Cassani et al.2009; Felice et al. 2009). HIV favors integration in tran-scribed chromosomal regions, thus improving chances forefficient expression of the viral genes (Wang et al. 2007).The only study on large-scale chromatin organization ofretroviral integration loci we are aware of described anintegrated, inactive HIV-1-derived gene vector associatedwith heterochromatin in about 10% of cells of a humanlymphoid cell line and a loss of this association for theactivated vector (Dieudonne et al. 2009). To our knowledge,an investigation of the impact of retroviral integration onnuclear positioning of the host loci by a comparison to thesame loci without integration was not previously performed.
We studied the transcribed retroviral integration loci inthree human cell types infected with HIV, astrocytes, HeLacells and T-lymphocytes, as well as in a mouse hematopoi-etic precursor cell line transduced with a retroviral vector.Integration sites were mapped and their three-dimensionalposition was compared to the respective site on the homol-ogous chromosome after fluorescence in situ hybridization(FISH) and confocal microscopy. Among other changes, wefound that HIV integrations in HeLa cells were locatedsignificantly more interior in the nucleus than their homol-ogous loci. For some transgenes, a repositioning towardsmore internal nuclear regions was described upon transcrip-tional activation (Dietzel et al. 2004; Tumbar and Belmont2001), and similar findings were made for several gene lociand chromosomal subregions (Williams et al. 2006; Chuanget al. 2006; Zink et al. 2004).We therefore tested whether anartificial increase of HIV transcription by sodium butyrateinduction (Quivy et al. 2002) would lead to even strongerdifferences between integration and homologous loci. SinceHIV RNA is multiply spliced (Tazi et al. 2010), we alsoconsidered the possibility that the transcribed integration
site attracts large numbers of splicing factors, resulting in acolocalization with signals obtained with anti-SC-35 splic-ing factors, so called speckles. We therefore investigated thepositioning of HIV integration loci and homologous locirelative to SC35 splicing speckle surfaces.
Materials and methods
Cells
Generation of the mouse hematopoietic precursor cell linecloneB and definition of retroviral integration sites is de-scribed in (Modlich et al. 2006). Cells were cultivated inIMDM medium supplemented with mIL-3 (final concentra-tion 10 ng/ml), mSCF (50 ng/ml), fetal bovine serum (10%),100 U/ml Penicillin and 100 μg/ml Streptomycin.
TH4-7-5 cells were established by HIV-1 infection of thehuman glioma cell line 85HG-66 derived from astrocytomabrain tumors (Brack-Werner et al. 1992). LC5-HIV cellswere established by HIV-1 infection of the cell line L-132(Mellert et al. 1990), which originally was thought to bederived from embryonic lung tissue but subsequently wasidentified as a HeLa derived cell line, according to LGCS t anda r d s ( h t t p : / /www. l g c s t a nda r d s - a t c c . o rg /LGCAdvancedCatalogueSearch/ProductDescription/tabid/1068/Default .aspx?ATCCNum0CCL-5&Template0cellBiology). KE37/1-IIIB cells were established by HIV-1infection of the T-lymphoma derived cell line KE37/1(Popovic et al. 1984). In the latter two cases, the culturescontain a pool of cells originating from several founderswith various HIV integrations. By FISH (see below), wecould visualize between zero and four integration sites pernucleus. All three cell types were cultured in RPMI Medium(supplemented with 10% FCS, 100 U/ml penicillin and100 μg/ml streptomycin). For simplicity, subsequently cellsare identified by their cell type only: astrocytes (for TH4-7-5), HeLa cells (LC5-HIV) and T-lymphocytes (KE37/1-IIIB), respectively.
Sodium butyrate (NaB) treatment was performed for 24 hat 0.5 mM. For controls and treated cells, the amount of HIVRNA was determined and compared to the amount of RNApolymerase II RNA as a control. To this end, quantitativepolymerase chain reaction (qPCR) was performed on aLightCycler 480 (Roche) with the Light Cycler 480 SYBRGreen I Master PCR kit.
Integration site mapping
Retroviral integration sites in cloneB were analyzed as de-scribed (Modlich et al. 2006). To obtain HIV integrationsites ligation-mediated polymerase chain reaction (LM-PCR) was accomplished using the Genome Walker
354 Chromosoma (2012) 121:353–367

Universal Kit (BD Biosciences Clontech, Palo Alto, CA,USA). HIV-1 LTR sequence specific outer primer (5′-AAAGGTCAGTGGATATCTGATCCCTGGCCC-3′) andinner primer (5′-CAGGGAAGTAGCCTTGTGTGTGGTAGATCC-3′) for nested PCR were applied using thePCR Kit advantage 2 (BD Biosciences Clontech). PCRproducts were purified (Quiaquick Gel extraction Kit;Quiagen, Hilden, Germany) and sequenced (Sequiserve,Vaterstetten, Germany; GATC Biotech AG, Konstanz,Germany). Integration sites were mapped by blasting thesequencing results on the NCBI homepage (http://blast.ncbi.nlm.nih.gov/Blast.cgi; version Build 36.2). In case of posi-tive blast hits the “cytoview” display of the EnsemblGenome Browser (http://www.ensembl.org/index.html; ver-sion Ensembl 43) was used to select suitable bacterial arti-ficial chromosome (BAC) clones that cover the genomicregion around the integration locus.
Preparation of cells for 3D-FISH
Astrocytes and HeLa cells were seeded on coverslips at 70–80% confluence. Since T-lymphocytes and cloneB cellsgrow in suspension, growing cells were attached to poly-L-lysine coated coverslips. All cells were fixed and preparedfor 3D-FISH as described (Solovei et al. 2002; Hepperger etal. 2007). Briefly, T-lymphocytes and cloneB cells wereincubated in 0.3× PBS for 45 s and subsequently fixed in4% paraformaldehyde in 0.3× PBS for 10 min. Astrocytesand HeLa cells were fixed in 4% paraformaldehyde in 1×PBS for 10 min. All cells were permeabilized 15 min in0.5% Triton-X100, incubated over night in 20% glycerol,subjected to five freeze–thaw cycles with liquid nitrogen,incubated in 0.1 M HCl for 6 min and stored in 50%formamide/2× SSC at 4°C until use (at least 48 h). Inprevious work, we could show that this procedure providesgood structural preservation of the large-scale chromatinstructure (Kim et al. 2007; Hepperger et al. 2007).
Probes and fluorescence in situ hybridization
FISH probes for integration loci were generated from BACclones ordered from BAC-PAC Resource Centre (Oakland,CA, USA; http://bacpac.chori.org). BAC DNA wasextracted with the High Pure Plasmid Isolation Kit (Roche,cat. No. 11754777001). As HIV FISH probe, the pNL4-3plasmid (Adachi et al. 1986) was used, isolated from E.coli(Plasmid isolation kit, Macherey-Nagel, Düren, Germany).Prior to labeling all FISH probes were amplified with theGenomiPhi™ V2 DNA Amplification Kit (GE Healthcare,Munich, Germany). BAC DNA was labeled with dinitro-phenol (DNP)-deoxyuridine triphosphate (dUTP),digoxigenin-dUTP, biotin-dUTP or Texas Red-dUTP bynick translation as described elsewhere (Cremer et al.
2008). BACs were tested for correct chromosomal locationby FISH on metaphase spreads together with the respectivechromosomal libraries. HIV probe DNA was labeled withdigoxigenin-dUTP or Cy3-dUTP by nick translation.
Hybridization was performed as described in (Heppergeret al. 2007). Haptens were detected with antibodies in block-ing solution at 37°C, 45–60 min for each layer: rabbit-anti-DNP (1:200; Sigma-Aldrich, Deisenhofen, Germany), goat-anti-rabbit-Alexa488 (1:200, Molecular Probes (Invitrogen),Karlsruhe, Germany), goat-anti-rabbit-Cy3 (1:200;Dianova, Hamburg, Germany), AvidinAlexa488 (1:200;Molecular Probes), mouse-anti-dig-Cy5 (1:100, Dianova),goat-anti-mouse-Cy5 (1:100, Dianova). SC35 splicingspeckles were detected with a mouse antibody (1:100,Sigma-Aldrich). 4′,6′-Diamidino-2-phenylindole (DAPI;Sigma-Aldrich) was used as DNA counterstain,VectaShield (Vector, Burlingame, CA, USA) was used formounting.
Confocal microscopy, image processing
Three-dimensional confocal image stacks were recorded ona Leica TCS SP5 microscope with a 63× oil immersionobjective. Voxel size was 80 nm in xy and 240 nm in z.The software ImageJ (http://rsb.info.nih.gov/ij/) was usedfor shift correction of chromatic aberration and for settingsignal thresholds for subsequent computerized image anal-ysis. The intensity of HIVand gene vector signals was weakcompared to BAC signals. Hence, for simultaneous presen-tation of color channels in Fig. 1, the HIV or gene vectorchannel was strongly enhanced with the Brightness/Contrastfunction in ImageJ.
The surface area of BAC signals was measured in ImageJafter noise reduction (Gaussian filter, Sigma (Radius)01)with the object counter 3D plug-in (Bolte and Cordelieres2006). Subjective influence was minimized by normalizingthe BAC signals with the stack normalizer plug-in and byapplying a constant threshold of 50 (HeLa cells) or 100 (T-lymphocytes).
For SC35 experiments, light optical sections were decon-volved by the Huygens software package (Scientific VolumeImaging B.V., Hilversum, Netherlands) using measuredpoint spread functions.
3D distance measurements from BAC signal voxels tothe nearest surface of the nucleus or SC35 splicing speckleswere performed with the ADS program (absolute distance tosurface) as described by Küpper et al. (2007). Briefly,thresholds were interactively set to allow the program tocalculate for each voxel of a signal the shortest 3D distanceto the nuclear surface. To minimize bias, all thresholds for adata set were determined by one person in one go.Reevaluation of such data sets by other persons generallyresulted in a very similar outcome. Integration loci and
Chromosoma (2012) 121:353–367 355

control loci were always evaluated in the same cells.Intensity-weighted frequencies were collected in classeswith 250 nm width as percentage of the total given signalin a nucleus and the averages over the population of nucleiwere calculated. Due to the limited microscopic resolutionthe transition from DNA signal to background is not sharpbut blurred and the position of the nuclear surface variessomewhat with the applied threshold. Thus, depending onthe threshold, peripheral FISH signals may come to liepartially outside the nucleus. For example, in Fig. 2a, theexternal portion of the control locus is composed entirely ofsuch peripheral signals which are partially inside and par-tially outside. Since the same defined surface was used forall signals in the nucleus, the comparison of integration lociwith control loci is not affected by the blurred surface.Graphs were generated in Microsoft Excel. Publication fig-ures were assembled in Adobe Photoshop.
Statistical evaluation
We generally used the paired t-test, a pair consisting of thevalues for the integration site and the homologous site
(averaged when two were present: HeLa18q22.3,Astro18q22.1) from the same nucleus. For radial nuclearpositioning, the median values were used. Some distribu-tions were not normally distributed, we thus had to apply theWilcoxon signed rank (WSR) test for paired samples instead(radial distributions of MMUXA1.1, HeLa18q22.3,HeLaXq22.1, Astro18q22.1, surface pixels HeLa18q22.3).Distributions in untreated and sodium butyrate treated cellswere compared with the Mann–Whitney rank sum test. Allcalculations were performed with SigmaStat 3.5 (SPSS,Chicago, IL, USA).
Databases and genomic properties
The gene density in a 0.5-, 2- and 10-Mbp window aroundthe integration site was read off the NCBI Map viewer(http://www.ncbi.nlm.nih.gov/mapview/, version Build37.1). The sequence was downloaded from there and sub-mitted to RepeatMasker (version open-3.2.9, http://www.repeatmasker.org/) to obtain the percentage consisting ofGCs and of repetitive elements
Results
Experimental strategy
To study the 3D localization of retroviral integration loci, wefirst mapped integration sites by LM-PCR and used thissequence information to identify the integration loci(Tables 1 and 2). To visualize integration loci and theirhomologous regions microscopically, we used BACs cover-ing the mapped chromosomal loci as FISH probes. BACswere first tested for correct genomic localization by FISH onmetaphase chromosome spreads of the respective cell line.The karyotype was analyzed on the same preparations forchromosomal translocations or other rearrangements. If anintegration harboring chromosome differed from its homo-log, the respective integration locus was excluded fromfurther analysis. For 3D FISH experiments on structurallypreserved nuclei, we used HIV proviral DNA (HIV infectedcells) or retroviral vector DNA (mouse cells) in addition toBACs as a FISH probe (Fig. 1). Thus, integration loci werecolabeled by a BAC signal and a vector signal while the
Fig. 1 3D FISH on structurally preserved cell nuclei. a Mouse hema-topoietic precursor cell cloneB. Three RNA transcribing integrationsites (red) were detected, one of them (arrow) colocalizing with theBAC signal (MMU12D2, green). The other two RNA labeled integra-tion sites were not evaluated in this nucleus. b Human T-lymphocyte.One FISH signal from the 2q11.2 BAC (green) colocalized with a HIVRNA signal (red, arrow). The 2q14.2 BAC (cyan) is shown in the insetonly, together with the other FISH signals. One of them colocalizedwith the second HIV signal (arrowhead). From FISH on metaphasespreads both integration sites are known to be on the same chromo-some 2. c HeLa cell, BAC and HIV signals as before, X-chromosomepaint probe in light blue. d Human astrocyte, BAC and HIV signals asbefore. SC35 splicing speckles in light blue. a–c Projections of confo-cal image stacks, d projection of three adjacent sections. Dark blue —Dapi-stained DNA; scale bar 5: μm for all four images
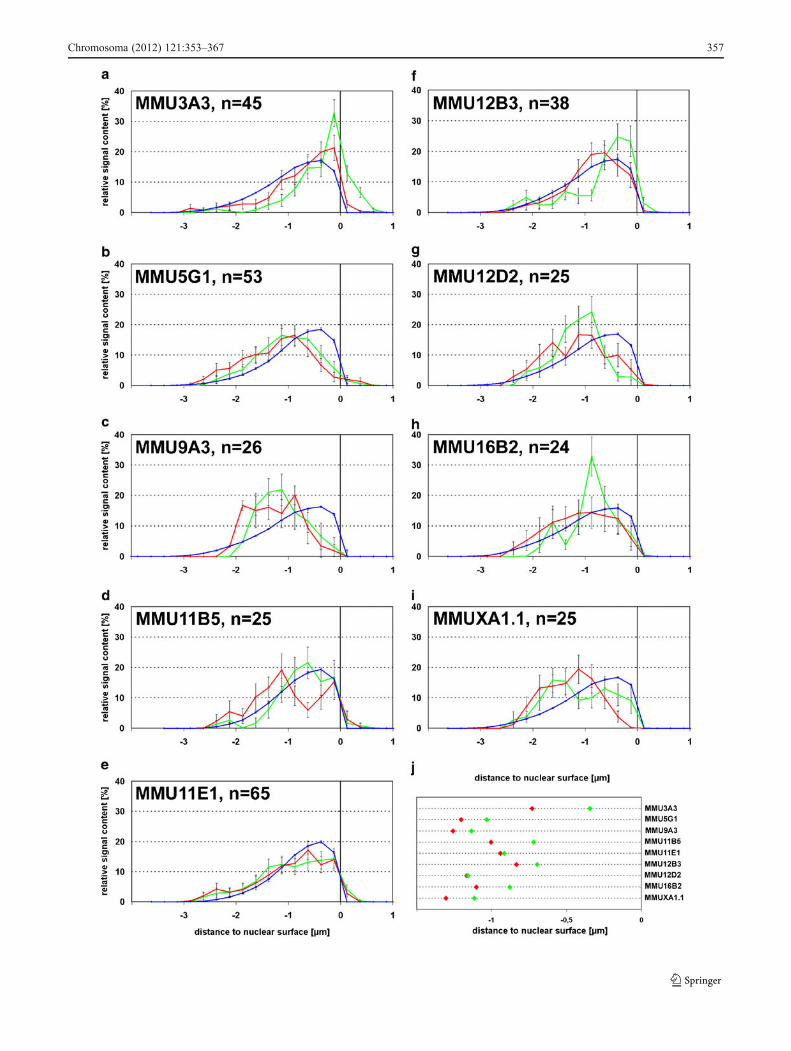
Fig. 2 Nuclear distribution of BAC signals in mouse hematopoieticprecursor cells. a–i Green BAC signals not colocalizing with genevector signals; red BAC signals colocalizing with gene vector signal;blue Dapi stained DNA. Distances to the nuclear surface are given inμm, negative values reflect signals inside nucleus and positive valuesthose outside the nucleus. jMean values of medians of respective BACdistribution curves for each integration locus; green BAC signals notcolocalizing with gene vector signals; red BAC signals colocalizingwith gene vector signal
b
356 Chromosoma (2012) 121:353–367
Chromosoma (2012) 121:353–367 357

homologous regions were labeled by BAC signals alone.Despite the low intensity of the HIV FISH signal (seemethods), it was still much stronger in 3D FISH prep-arations than expected for a ~10-kb sequence (Fig. 1).Control experiments with RNase revealed that this wasdue to hybridization of the labeled probe to HIV RNA.Thus, only transcribed HIV integration sites were eval-uated in our study. After confocal microscopy, quantita-tive analysis of the 3D radial nuclear position ofintegration and control loci was performed with theBAC signals only. To avoid a potential bias due todifferences in FISH signal appearance of BAC andHIV or vector signals, HIV and vector signals were usedfor identification of the integration locus but not for 3Devaluation.
Integration loci in a mouse hematopoetic precursor cell linewere repositioned to more internal nuclear regions
The mouse hematopoietic precursor cell line “cloneB” wascreated by transduction with the LTR-driven retroviral genevector pSF91-GFP (Modlich et al. 2006). In addition to fiveintegration sites mapped in the original study, we identifiedfour additional ones (Table 1). FISH on metaphase chromo-somes with BACs and corresponding chromosomal paintprobes did not reveal any aberrations from a normal karyo-type. In any one nucleus, up to four integration sites gaverise to a detectable gene vector FISH signal, arguing thatonly a subset of sites was transcribed in individual nuclei.Analysis of the 3D radial distribution of the nine integrationloci in structurally preserved nuclei (Fig. 1a) revealed thatMMU3A3 showed a highly significant shift of the integra-tion locus towards more internal nuclear regions when com-pared with the corresponding locus on the homologouschromosome (p<0.001; Fig. 2a,j). Notably, MMU3A3 isin the immediate vicinity of the protooncogene Evi1 (eco-tropic virus integration site 1), a region with frequentlyobserved viral and gene vector integrations (Modlich et al.2006; Ott et al. 2006; Wieser 2007; Metais and Dunbar2008).
MMU5G1 showed a less pronounced but still significantdifference (p00.033; Fig. 2b,j). For some of the other sevenintegrations loci the difference to the corresponding locus onthe homologous chromosome was very small and none ofthem was significant (p>0.05, n between 24 and 65;Fig. 2c–i). However, pooled values from these seven loci(n0228) revealed a highly significant difference (p00.002;WSR test). In agreement with this result, the average medianposition for all nine integration loci was more internal thanthe respective homologous locus (Fig. 2j). Taken together,retroviral integration loci in this mouse hematopoietic pre-cursor cell line show a more internal position than theirrespective homologous loci.T
able
1Overview
ofgene
vector
integrationloci
inthemou
sestem
celllin
e“cloneB”
Integrationlocus
MMU
3A3+
MMU
5G1+
MMU
9A3
MMU
11B5
MMU
11E1+
MMU
12B3+
MMU
12D2
MMU
16B2
MMU
XA1.1+
Nearestgene
Evi1
Mad1like1
Dnm
2Lig3
Gm885
Akap6
Batf
AI480653
Wdr45
Distanceto
nearestgene
121kb
00
2.6kb
00.4kb
13.6
kb0
0.4kb
GeneID
14013
1712
013
430
1688
238
0732
238161
53314
2688
8054
636
BACname
RP23
-439
N22
RP23
-217N11
RP23
-317
E10
RP23
-316C11
RP23
-247
J12
RP24
-267
H3
RP23
-369
N11
RP24
-206H1
RP23
-54C
14
Genedensity
0.5Mb
418
4024
204
326
52
2Mb
921
39.5
2422
6.5
21.5
1233
10Mb
7.2
23.4
17.3
18.7
17.4
8.5
17.1
10.3
18.8
chromosom
e9.9
11.6
13.2
17.2
17.2
11.3
11.3
9.9
11.1
GCcontent
0.5Mb
39.9%
51.3%
49.1%
46.9%
45.3%
41.1%
45.1%
46.7%
38.4%
2Mb
40.6%
50.5%
47.9%
45.3%
45.1%
41.1%
45.9%
45.4%
43.1%
10Mb
41.5%
47.9%
41.3%
44.8%
44.5%
40.2%
43.9%
43.2%
41.9%
chromosom
e40
.5%
42.5%
43.0%
44.0%
44.0%
41.5%
41.5%
41.0%
39.0%
Integrationlocusdescriptiondefinesthechromosom
alband
;Locim
arkedby
+have
been
describedbefore(M
odlichetal.200
6);g
eneID
from
NCBImou
segeno
medatabase;B
ACnameidentifies
theBACused
asaprob
ein
FISHexperiments.G
enedensity
isgivenas
genespermegabase,calculated
for0.5,
2and10
Mbp
windo
wsarou
ndtheintegrationsite,and
forthewho
lechromosom
e.The
GCcontentin
percentisgivenforthesamewindo
ws
358 Chromosoma (2012) 121:353–367
Tab
le2
HIV
integrationloci
inthreeinvestigated
celllin
es,HeL
acells,Tlymph
ocytes
(TLy)
andastrocytes
(Astro)
Integrationlocus
HeL
a6p
12.3
HeL
a11q2
2.3
HeL
a15
q21.3
HeL
a16
p13.3
HeL
a18
q22.3
HeL
aXq2
2.1
TLy2q
11.2
TLy2q
14.2
Astro
18q2
2.1
Nearestgene
SUPT3H
PDGFD
ZNF28
0DAXIN
1NETO1
CSTF2
KIA
A13
10PTPN4
CDH19
Distanceto
nearest
gene
025
0kb
00
700kb
00
00
GeneID
8464
8031
054
816
8312
8183
214
7855
683
5775
2851
3
BACname
RP11-818
O21
RP11-63H
12RP11-566
D24
RP11-517
F15
RP11-693
I21
RP11-255
J06
RP11-67L
23RP11-132
N24
RP11-831
H17
Chrom
osom
eintegrity
−−
−−
++
++
+
sequ
ence
GCAAGTTTTCA
GTTA
CTGTGC
TTGATA
GGC
AAATCATTA
AGTTGTTA
ATGGAATT
TTA
AG
CAGAAAAAT
GCAAATA
GGGTCATTTT
AGTC
GGGCTTTCC
CTA
GGTTC
TGTTCATC
AGGTG
CATA
GAGCA
AGGGGCCA
ACAGACCC
CCTTA
ACAGCACAA
CTGGATA
CC
ACTGAATTA
ATC
GGTGGGTC
TGGACCA
CTCCTGGA
TTCTGGG
TGCCTTCCT
CAGACTTT
GTTA
CAGC
ATA
GG
ATA
ACAATA
TTGTA
TAAT
ATA
TGAAGA
AAT
Genedensity
0.5Mb
62
1054
034
2412
2
2Mb
8.5
7.5
8.5
41.5
421
.520
112
10Mb
14.7
7.8
8.5
29.3
3.8
11.6
11.8
4.7
4.5
chromosom
e11.5
15.3
12.0
14.8
6.7
10.5
9.1
9.1
6.7
GCcontent
0.5Mb
35.9%
35.8%
37.5%
55.3%
35.9%
41.7%
47.7%
39.5%
34.4%
2Mb
41.7%
44.8%
39.3%
58.6%
38.4%
40.2%
44.9%
45.6%
34.8%
10Mb
41.7%
37.2%
39.6%
53.6%
39.2%
38.5%
43.3%
40.0%
37.0%
chromosom
e40
%42
%42
%44
%40
%39
%40
%40
%40
%
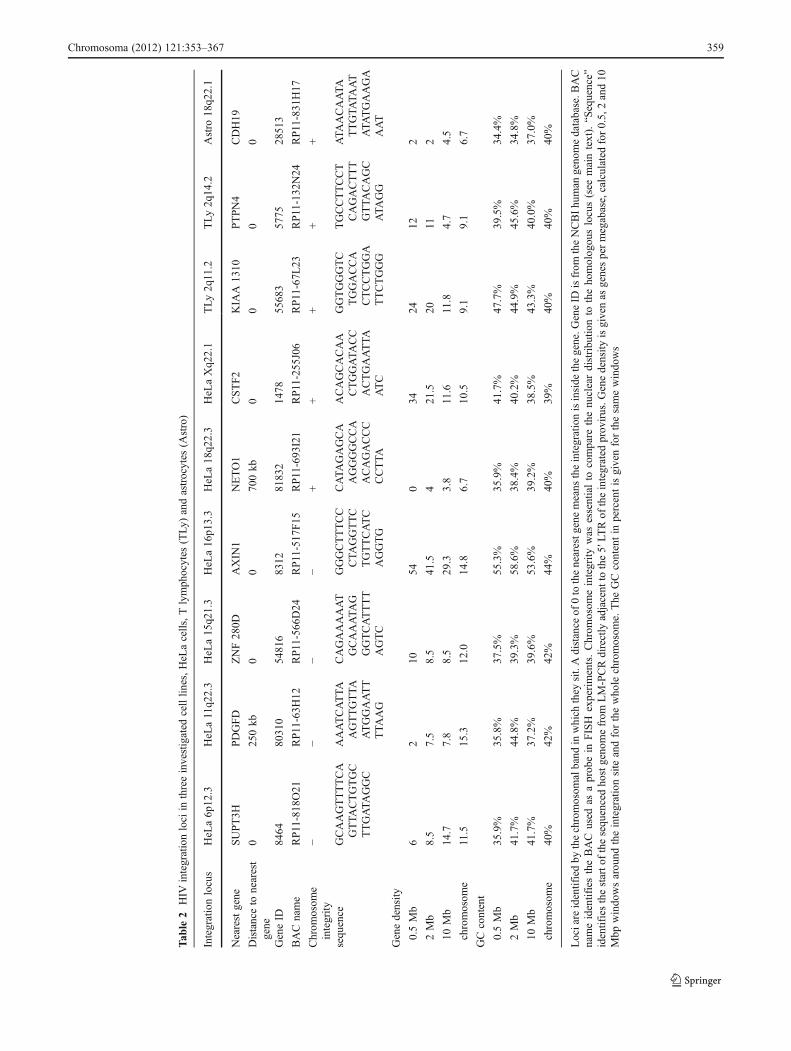
Lociare
identifiedby
thechromosom
alband
inwhich
they
sit.Adistance
of0to
thenearestg
enemeans
theintegrationisinside
thegene.G
eneID
isfrom
theNCBIhu
man
geno
medatabase.B
AC
nameidentifiestheBAC
used
asaprob
ein
FISH
experiments.Chrom
osom
eintegrity
was
essentialto
compare
thenu
cleardistribu
tionto
theho
molog
ouslocus(see
maintext).“Sequence”
identifiesthestarto
fthesequ
encedho
stgeno
mefrom
LM-PCRdirectly
adjacent
tothe5′LT
Rof
theintegrated
prov
irus.G
enedensity
isgivenas
genespermegabase,calculated
for0.5,
2and10
Mbp
windo
wsarou
ndtheintegrationsite
andforthewho
lechromosom
e.The
GCcontentin
percentisgivenforthesamewindo
ws
Chromosoma (2012) 121:353–367 359
360 Chromosoma (2012) 121:353–367

HIV integration sites
Retroviral integration in human cells was investigated in aHeLa-, a T-lymphocyte- and an astrocyte cell line previouslygenerated by infection with HIV (see methods) but withhitherto unknown genomic positions of integration sites.LM-PCR identified a total of nine integration sites, of whichseven were within genes (Table 2). No evident preferenceswere found concerning GC content or gene density aroundthe integration sites (Table 2).
FISH on metaphase chromosome spreads of the three celllines revealed that five of the nine mapped integration siteswere evaluable while four were on chromosomes involvedin structural aberrations precluding a meaningful analysis.For example the genome of the HeLa cell line had threedifferently rearranged chromosomes 11, rendering a com-parison of the integration site 11q22.3 with its homologoussite futile. Metaphase spreads of HeLa cells also revealedthat the two evaluable integration sites on chromosomes 18and X did not occur together, suggesting that the cell pop-ulation consisted of several subclones with independentintegration events. The number of HIV-FISH signals instructurally preserved nuclei in HeLa cells was two (3%),one (74%) or 0 (23%); in T-lymphocytes four (7%), three(19%), two (34%), one (33%) or zero (7%); and in astro-cytes one (95%) or zero (5%; n between 70 and 80), whileundetected integration sites did not produce sufficient levelsof RNA for the generation of a signal. For T-lymphocytes,this observation suggests that there are at least two more, yetunmapped, integration sites.
Two of five HIV integration loci were repositionedand decondensed
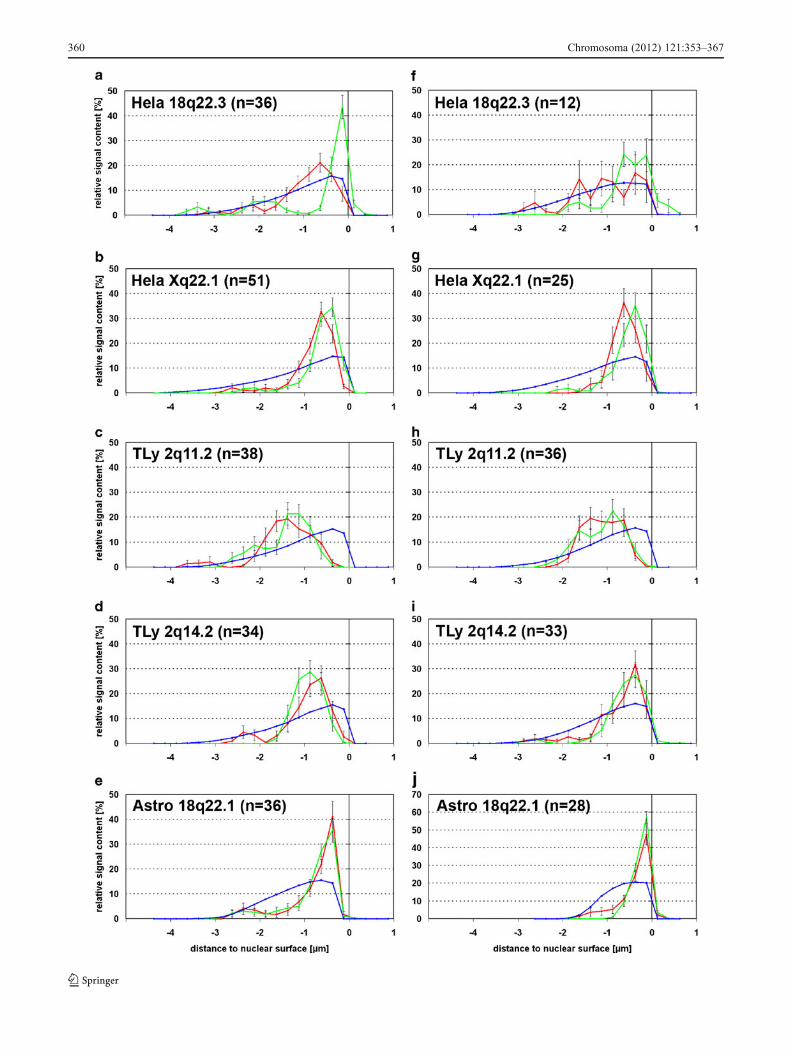
3D image analysis of radial nuclear positions revealed thatthe integration loci HeLa 18q22.3 and HeLa Xq22.1 (seeTable 2) were highly significantly more internal than theirhomologous regions (p<0.001 and p00.002, respectively;Figs. 3a,b and 4a). The integration loci TLy 2q11.2, TLy2q14.2 and Astro 18q22.1 (Fig. 3c,d,e) did not show signif-icant differences.
For the two significantly repositioned HIV integrationloci, we also investigated the positioning relative to thesurface of the harboring chromosome territories. Compared
to their homologous loci, they did not show a significantdifference in this analysis (p>0.05). The nuclear radialposition of the harboring chromosome territories was alsounaffected.
Upon visual inspection of BAC signals, we noticed that insome cases signals of integration loci appeared larger and thusmore decondensed than the BAC signals from the homolo-gous chromosomes. 3D measurements of the signal surfacesconfirmed this impression (Fig. 5). For HeLa 18q22.3, theBAC signal of the integration locus showed on average a 1.49times larger surface (p<0.001). For HeLa Xq22.1, the surfacedifference was smaller (1.14×), corresponding to a less pro-nounced repositioning (Figs. 3a,b and 4a), but still highlysignificant (p<0.001). Both BACs did not generate a detect-able signal when used as a probe for RNA FISH, arguing thatthe increased surface of DNA FISH signals is indeed due tochromatin decondensation and not to transcribed RNA fromhost sequences. For the other three integration loci, BACsignal surfaces did not show noticeable differences betweenintegration and homologous loci (p>0.05).
Treatment with sodium butyrate increased HIV transcriptionbut did not affect nuclear position of integration loci
Sodium butyrate is a deacetylase inhibitor which was shownto increase HIV-1 transcription (Quivy et al. 2002). Thisallowed us to investigate whether increased HIV transcriptionwould enhance or cause positional differences between inte-grations and homologous loci. Sodium butyrate treatmentindeed led to elevated HIV RNA levels, between twofold inT-lymphocytes and tenfold in HeLa cells. However, the ele-vated transcription of the integrated virus did not lead to asignificant increase in positional differences between integra-tion loci and homologous controls (Figs. 3f–j and 4b).
HIV integration loci did not show altered position relativeto SC35 splicing speckles
Production of the full array of HIV-1 proteins involves theproduction of multiple HIV-1 mRNA species by alternativesplicing of a primary transcript (Tazi et al. 2010). SR pro-teins such as SC35 are serine/arginine-rich and known to beessential for alternative splicing (Lin and Fu 2007; Graveley2000). For HIV RNA and SC35, both, colocalization(Favaro et al. 1998) and random distribution (Berthold andMaldarelli 1996; Boe et al. 1998; Zhang et al. 1996; Bell etal. 2001), was described for transfected cells. To our knowl-edge, only one study investigated this relation in infectedcells, finding a random relative distribution (Bell et al.2001). We tested for repositioning effects due to HIV inte-gration relative to SC35 speckles, manifested by positioningdifferences between the integration locus and the homolo-gous chromosomal region (Fig. 1d).
�Fig. 3 Nuclear distribution of BAC signals in HIV infected humancell types. a–e Untreated cells, f–j sodium butyrate-treated cells. HeLaHeLa cells, TLy T-lymphocytes, Astro astrocytes; blue DNA distribu-tion, green distribution of BAC signals not colocalizing with HIVsignal, red distribution of BAC signals colocalizing with HIV signal.Distances to the nuclear surface are given in microns (μm); negativevalues reflect signals inside nucleus and positive values those outsidethe nucleus
Chromosoma (2012) 121:353–367 361

Generally, BAC signals of both, the integration loci andthe homologous regions did not contact SC35 speckles,again with the exception of HeLa 18q22.3 where 15–20%of BAC signals colocalized with or were found adjacent toSC35 (Fig. 6a–e). Significant differences between the posi-tion of the integration locus and the homologous locusrelative to SC35 speckles were not found (p>0.05). Bycontrast, about 30% of the larger HIV RNA signals inHeLa cells and T-lymphocytes contacted or colocalized withSC35 speckles (Fig. 6f).
Discussion
The current study provides new insights on the influence ofstable retroviral integration on nuclear chromatin organiza-tion. In a hematopoietic mouse cell line, we found mostly
modest but significant radial nuclear repositioning of tran-scribed retroviral vector integration sites to more internalregions. In two out of five transcribed HIV integration sitesin human cell lines we also found significant repositioningand in addition indication of chromatin unfolding. An inte-grated retroviral DNA sequence of only a few kb in lengththus altered large-scale chromatin structure of the host locus.
The extent of chromatin decondensation found in the twocases of HIV integration in HeLa cells was surprising. BACsused as FISH probes contained 150–200 kb genomic DNA.With about 10 kb, the size of the provirus is only 5–7%. Asreflected by three of the HIV integration loci, such a smallincrease in base pairs by itself does not lead to a microscop-ically detectable size increase of the FISH signal from thesurrounding host chromatin. Since the BAC only detects hostsequences but not the provirus itself, larger FISH signals atHIV integration loci clearly indicate a decondensation effect
Fig. 4 Mean values of medians of integration and control loci in HIVinfected human cell types. In individual nuclei, the median position ofa given BAC signal was determined. The mean values of thosemedians for HIV-colocalizing or not colocalizing signals over all nucleiare shown here. a Untreated cells. b Sodium butyrate-treated cells.
Green mean value of medians of BAC distribution curves not colocal-izing with HIV signal in respective cell type; red mean value ofmedians of BAC distribution curves colocalizing with HIV signal inrespective cell type. For TLy2q11.2, the two values in a are so similarthat the data points lay on top of each other
Fig. 5 Surface area of BACsignals for HIV integration andhomologous control loci. Bluedots surface area in pixels of allBAC signals; bars mean valuesof BAC surface areacolocalizing (red) or notcolocalizing (green) with HIVsignal, respectively
362 Chromosoma (2012) 121:353–367

on the neighboring chromatin. The larger FISH signals are notdue to detection of RNA from host genes by the BACs. First,BACs did not produce a signal in RNA FISH and second, theBAC used for HeLa18q22.3 does not cover a gene since thedistance from the integration site to the next gene is 700 kb.
Several studies comparing transcriptionally inactive andactive chromatin found a more interior nuclear position foractive chromatin (Zhao et al. 2009; Takizawa et al. 2008b;Kumaran et al. 2008; Lanctôt et al. 2007). A more internalradial position was also described for the active allele of agene with monoallelic expression when compared to theinactive allele on the homologous chromosome in the same
nucleus (Takizawa et al. 2008a). For an array of transgenes,we observed a more internal position as well as a deconden-sation after transcriptional activation (Dietzel et al. 2004).Taken together, such earlier data suggest that the changes inlarge-scale chromatin organization in the current study arealso correlated to chromatin activation. In the current study,the largest change in radial position as well as decondensa-tion was observed for the two investigated integration loci inHeLa cells, suggesting that also in this system decondensa-tion and repositioning are connected. Chromatin deconden-sation and nuclear repositioning of transgene arrays was alsofound after chromatin activation but in the absence of
Fig. 6 Distribution of BAC signals relative to SC35 splicing speckles.DNA FISH on HeLa cells (a, b), T-lymphocytes (c, d) and astrocytes(e). Distance to the closest surface of SC35 speckles in microns;negative values reflect signals inside speckles and positive values thoseoutside speckles. Green distribution of BAC signals not colocalizing
with HIV signals; red distribution of BAC signals colocalizing withHIV signals. f RNA FISH; orange distribution of HIV RNA signalsrelative to the surface of SC35 speckles in HeLa cells; brown same forT-lymphocytes
Chromosoma (2012) 121:353–367 363
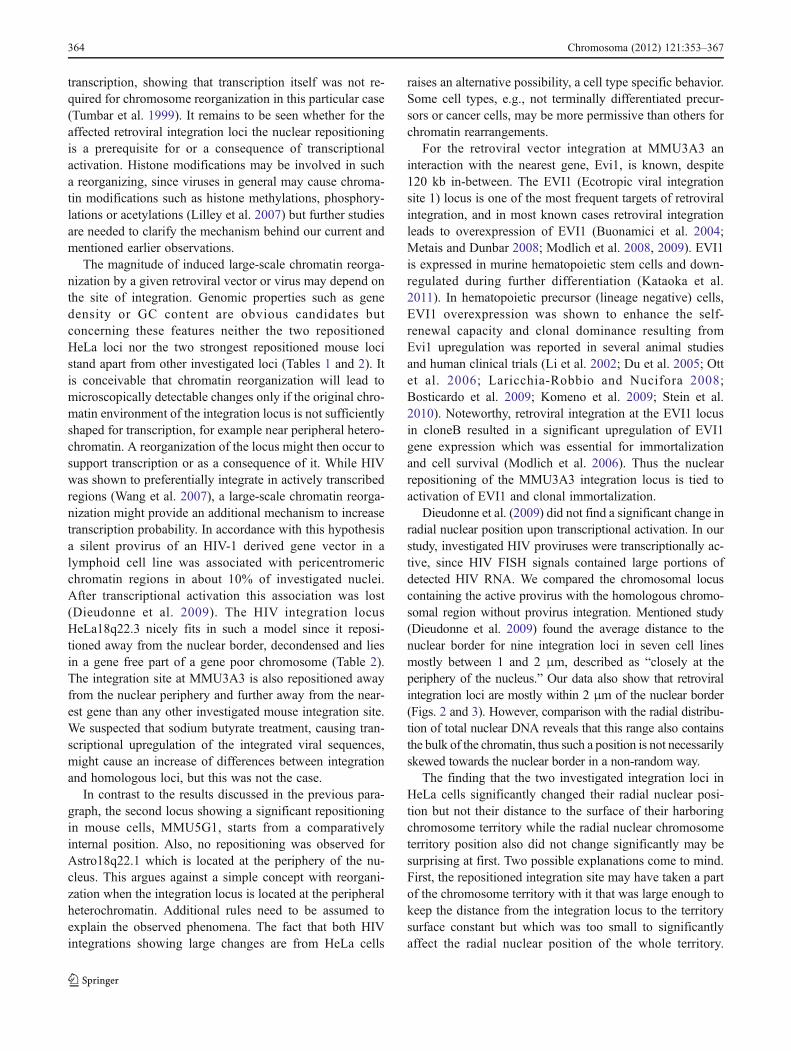
transcription, showing that transcription itself was not re-quired for chromosome reorganization in this particular case(Tumbar et al. 1999). It remains to be seen whether for theaffected retroviral integration loci the nuclear repositioningis a prerequisite for or a consequence of transcriptionalactivation. Histone modifications may be involved in sucha reorganizing, since viruses in general may cause chroma-tin modifications such as histone methylations, phosphory-lations or acetylations (Lilley et al. 2007) but further studiesare needed to clarify the mechanism behind our current andmentioned earlier observations.
The magnitude of induced large-scale chromatin reorga-nization by a given retroviral vector or virus may depend onthe site of integration. Genomic properties such as genedensity or GC content are obvious candidates butconcerning these features neither the two repositionedHeLa loci nor the two strongest repositioned mouse locistand apart from other investigated loci (Tables 1 and 2). Itis conceivable that chromatin reorganization will lead tomicroscopically detectable changes only if the original chro-matin environment of the integration locus is not sufficientlyshaped for transcription, for example near peripheral hetero-chromatin. A reorganization of the locus might then occur tosupport transcription or as a consequence of it. While HIVwas shown to preferentially integrate in actively transcribedregions (Wang et al. 2007), a large-scale chromatin reorga-nization might provide an additional mechanism to increasetranscription probability. In accordance with this hypothesisa silent provirus of an HIV-1 derived gene vector in alymphoid cell line was associated with pericentromericchromatin regions in about 10% of investigated nuclei.After transcriptional activation this association was lost(Dieudonne et al. 2009). The HIV integration locusHeLa18q22.3 nicely fits in such a model since it reposi-tioned away from the nuclear border, decondensed and liesin a gene free part of a gene poor chromosome (Table 2).The integration site at MMU3A3 is also repositioned awayfrom the nuclear periphery and further away from the near-est gene than any other investigated mouse integration site.We suspected that sodium butyrate treatment, causing tran-scriptional upregulation of the integrated viral sequences,might cause an increase of differences between integrationand homologous loci, but this was not the case.
In contrast to the results discussed in the previous para-graph, the second locus showing a significant repositioningin mouse cells, MMU5G1, starts from a comparativelyinternal position. Also, no repositioning was observed forAstro18q22.1 which is located at the periphery of the nu-cleus. This argues against a simple concept with reorgani-zation when the integration locus is located at the peripheralheterochromatin. Additional rules need to be assumed toexplain the observed phenomena. The fact that both HIVintegrations showing large changes are from HeLa cells
raises an alternative possibility, a cell type specific behavior.Some cell types, e.g., not terminally differentiated precur-sors or cancer cells, may be more permissive than others forchromatin rearrangements.
For the retroviral vector integration at MMU3A3 aninteraction with the nearest gene, Evi1, is known, despite120 kb in-between. The EVI1 (Ecotropic viral integrationsite 1) locus is one of the most frequent targets of retroviralintegration, and in most known cases retroviral integrationleads to overexpression of EVI1 (Buonamici et al. 2004;Metais and Dunbar 2008; Modlich et al. 2008, 2009). EVI1is expressed in murine hematopoietic stem cells and down-regulated during further differentiation (Kataoka et al.2011). In hematopoietic precursor (lineage negative) cells,EVI1 overexpression was shown to enhance the self-renewal capacity and clonal dominance resulting fromEvi1 upregulation was reported in several animal studiesand human clinical trials (Li et al. 2002; Du et al. 2005; Ottet al. 2006; Laricchia-Robbio and Nucifora 2008;Bosticardo et al. 2009; Komeno et al. 2009; Stein et al.2010). Noteworthy, retroviral integration at the EVI1 locusin cloneB resulted in a significant upregulation of EVI1gene expression which was essential for immortalizationand cell survival (Modlich et al. 2006). Thus the nuclearrepositioning of the MMU3A3 integration locus is tied toactivation of EVI1 and clonal immortalization.
Dieudonne et al. (2009) did not find a significant change inradial nuclear position upon transcriptional activation. In ourstudy, investigated HIV proviruses were transcriptionally ac-tive, since HIV FISH signals contained large portions ofdetected HIV RNA. We compared the chromosomal locuscontaining the active provirus with the homologous chromo-somal region without provirus integration. Mentioned study(Dieudonne et al. 2009) found the average distance to thenuclear border for nine integration loci in seven cell linesmostly between 1 and 2 μm, described as “closely at theperiphery of the nucleus.” Our data also show that retroviralintegration loci are mostly within 2 μm of the nuclear border(Figs. 2 and 3). However, comparison with the radial distribu-tion of total nuclear DNA reveals that this range also containsthe bulk of the chromatin, thus such a position is not necessarilyskewed towards the nuclear border in a non-random way.
The finding that the two investigated integration loci inHeLa cells significantly changed their radial nuclear posi-tion but not their distance to the surface of their harboringchromosome territory while the radial nuclear chromosometerritory position also did not change significantly may besurprising at first. Two possible explanations come to mind.First, the repositioned integration site may have taken a partof the chromosome territory with it that was large enough tokeep the distance from the integration locus to the territorysurface constant but which was too small to significantlyaffect the radial nuclear position of the whole territory.
364 Chromosoma (2012) 121:353–367
Second, the territory may have been remodeled in a way thatthe integrations locus kept the average distance to the terri-tory surface but now was located in a part of the territorywhich was closer to the nuclear center.
While one might expect that integration and strong tran-scription of HIV within a gene poor region such as 18q22.3might induce or attract a microscopically detectable accu-mulation of splicing factors to the site, we did not observe achange in the association frequency with splicing factoraccumulations. Neither did any of the other HIV integrationloci show a significant change in the average distance tosplicing speckles. Consistent with this, HIV FISH signalswere frequently found away from splicing speckles (Fig. 6f).
In conclusion, results from two independent experimentalsystems, HIV in human cells and gene vector integration in amouse hematopoietic precursor cell line, show that transcribedretroviral integrations can lead to microscopically detectablechanges in large-scale chromatin structure. This includes arepositioning to a more internal nuclear position and a decon-densation of neighboring chromosomal sequences.
Acknowledgements We thank Christopher Baum, Hannover, forproviding the “cloneB,” Anja Ehrhardt, Munich, for help with settingup the LM PCR, Jürgen Peters, Munich, for statistical advice andThomas Cremer for his continuing support. This work was supportedby the Deutsche Forschungsgemeinschaft (SPP 1230).
Conflict of interest The authors declare that they have no conflict ofinterest.
Open Access This article is distributed under the terms of theCreative Commons Attribution License which permits any use, distri-bution, and reproduction in any medium, provided the original author(s)and the source are credited.
References
Adachi A, Gendelman HE, Koenig S, Folks T, Willey R, Rabson A,Martin MA (1986) Production of acquired immunodeficiencysyndrome-associated retrovirus in human and nonhuman cellstransfected with an infectious molecular clone. J Virol 59(2):284–291
Bell P, Montaner LJ, Maul GG (2001) Accumulation and intranucleardistribution of unintegrated human immunodeficiency virus type1 DNA. J Virol 75(16):7683–7691. doi:10.1128/JVI.75.16.7683-7691.2001
Berthold E, Maldarelli F (1996) cis-Acting elements in human immu-nodeficiency virus type 1 RNAs direct viral transcripts to distinctintranuclear locations. J Virol 70(7):4667–4682
Boe SO, Bjorndal B, Rosok B, Szilvay AM, Kalland KH (1998)Subcellular localization of human immunodeficiency virus type1 RNAs, Rev, and the splicing factor SC-35. Virology 244(2):473–482. doi:10.1006/viro.1998.9110
Bolte S, Cordelieres FP (2006) A guided tour into subcellular colocal-ization analysis in light microscopy. J Microsc 224(Pt 3):213–232. doi:10.1111/j.1365-2818.2006.01706.x
Bosticardo M, Ghosh A, Du Y, Jenkins NA, Copeland NG, Candotti F(2009) Self-inactivating retroviral vector-mediated gene transferinduces oncogene activation and immortalization of primary mu-rine bone marrow cells. Mol Ther 17(11):1910–1918.doi:10.1038/mt.2009.172
Boyle S, Gilchrist S, Bridger JM, Mahy NL, Ellis JA, Bickmore WA(2001) The spatial organization of human chromosomes withinthe nuclei of normal and emerin-mutant cells. Hum Mol Genet 10(3):211–219
Brack-Werner R, Kleinschmidt A, Ludvigsen A, Mellert W, NeumannM, Herrmann R, Khim MC, Burny A, Muller-Lantzsch N,Stavrou D et al (1992) Infection of human brain cells by HIV-1:restricted virus production in chronically infected human glial celllines. AIDS 6(3):273–285
Buonamici S, Li D, Chi Y, Zhao R, Wang X, Brace L, Ni H,Saunthararajah Y, Nucifora G (2004) EVI1 induces myelodys-plastic syndrome in mice. J Clin Invest 114(5):713–719.doi:10.1172/JCI21716
Bushman F, Lewinski M, Ciuffi A, Barr S, Leipzig J, Hannenhalli S,Hoffmann C (2005) Genome-wide analysis of retroviral DNAintegration. Nat Rev Microbiol 3(11):848–858
Cassani B, Montini E, Maruggi G, Ambrosi A, Mirolo M, Selleri S,Biral E, Frugnoli I, Hernandez-Trujillo V, Di Serio C, RoncaroloMG, Naldini L, Mavilio F, Aiuti A (2009) Integration of retroviralvectors induces minor changes in the transcriptional activity of Tcells from ADA-SCID patients treated with gene therapy. Blood114(17):3546–3556. doi:10.1182/blood-2009-02-202085
Cattoglio C, Pellin D, Rizzi E, Maruggi G, Corti G, Miselli F, SartoriD, Guffanti A, Di Serio C, Ambrosi A, De Bellis G, Mavilio F(2010) High-definition mapping of retroviral integration sitesidentifies active regulatory elements in human multipotent hema-topoietic progenitors. Blood 116(25):5507–5517. doi:10.1182/blood-2010-05-283523
Chuang CH, Carpenter AE, Fuchsova B, Johnson T, de Lanerolle P,Belmont AS (2006) Long-range directional movement of an in-terphase chromosome site. Curr Biol 16(8):825–831
Cremer T, Cremer M (2010) Chromosome territories. Cold SpringHarb Perspect Biol 2(3):a003889. doi:10.1101/cshperspect.a003889
Cremer M, von Hase J, Volm T, Brero A, Kreth G, Walter J, Fischer C,Solovei I, Cremer C, Cremer T (2001) Non-random radial higher-order chromatin arrangements in nuclei of diploid human cells.Chromosome Res 9(7):541–567
Cremer T, Cremer M, Dietzel S, Muller S, Solovei I, Fakan S (2006)Chromosome territories—a functional nuclear landscape. CurrOpin Cell Biol 18(3):307–316
Cremer M, Grasser F, Lanctot C, Muller S, Neusser M, Zinner R,Solovei I, Cremer T (2008) Multicolor 3D fluorescence in situhybridization for imaging interphase chromosomes. Methods MolBiol 463:205–239. doi:10.1007/978-1-59745-406-3_15
Croft JA, Bridger JM, Boyle S, Perry P, Teague P, Bickmore WA(1999) Differences in the localization and morphology of chro-mosomes in the human nucleus. J Cell Biol 145(6):1119–1131
Dietzel S, Jauch A, Kienle D, Qu G, Holtgreve-Grez H, Eils R, MunkelC, Bittner M, Meltzer PS, Trent JM, Cremer T (1998) Separateand variably shaped chromosome arm domains are disclosed bychromosome arm painting in human cell nuclei. Chromosome Res6(1):25–33
Dietzel S, Zolghadr K, Hepperger C, Belmont AS (2004) Differentiallarge-scale chromatin compaction and intranuclear positioning oftranscribed versus non-transcribed transgene arrays containing beta-globin regulatory sequences. J Cell Sci 117(Pt 19):4603–4614
Dieudonne M, Maiuri P, Biancotto C, Knezevich A, Kula A, Lusic M,Marcello A (2009) Transcriptional competence of the integratedHIV-1 provirus at the nuclear periphery. EMBO J 28(15):2231–2243. doi:10.1038/emboj.2009.141
Chromosoma (2012) 121:353–367 365

Du Y, Jenkins NA, Copeland NG (2005) Insertional mutagenesisidentifies genes that promote the immortalization of primary bonemarrow progenitor cells. Blood 106(12):3932–3939. doi:10.1182/blood-2005-03-1113
Edelstein ML, Abedi MR, Wixon J (2007) Gene therapy clinical trialsworldwide to 2007—an update. J Gene Med 9(10):833–842
Favaro JP, Borg KT, Arrigo SJ, Schmidt MG (1998) Effect of Rev onthe intranuclear localization of HIV-1 unspliced RNA. Virology249(2):286–296. doi:10.1006/viro.1998.9312
Felice B, Cattoglio C, Cittaro D, Testa A, Miccio A, Ferrari G, Luzi L,Recchia A, Mavilio F (2009) Transcription factor binding sites aregenetic determinants of retroviral integration in the human ge-nome. PLoS One 4(2):e4571. doi:10.1371/journal.pone.0004571
Graveley BR (2000) Sorting out the complexity of SR protein func-tions. RNA 6(9):1197–1211
Hacein-Bey-Abina S, Garrigue A, Wang GP, Soulier J, Lim A,Morillon E, Clappier E, Caccavelli L, Delabesse E, Beldjord K,Asnafi V, MacIntyre E, Dal Cortivo L, Radford I, Brousse N,Sigaux F, Moshous D, Hauer J, Borkhardt A, Belohradsky BH,Wintergerst U, Velez MC, Leiva L, Sorensen R, Wulffraat N,Blanche S, Bushman FD, Fischer A, Cavazzana-Calvo M(2008) Insertional oncogenesis in 4 patients after retrovirus-mediated gene therapy of SCID-X1. J Clin Invest 118(9):3132–3142. doi:10.1172/JCI35700
Hepperger C, Otten S, von Hase J, Dietzel S (2007) Preservation oflarge-scale chromatin structure in FISH experiments.Chromosoma 116(2):117–133
Hepperger C, Mannes A, Merz J, Peters J, Dietzel S (2008) Three-dimensional positioning of genes in mouse cell nuclei.Chromosoma 117(6):535–551. doi:10.1007/s00412-008-0168-2
Howe SJ, Mansour MR, Schwarzwaelder K, Bartholomae C, HubankM, Kempski H, Brugman MH, Pike-Overzet K, Chatters SJ, deRidder D, Gilmour KC, Adams S, Thornhill SI, Parsley KL, StaalFJ, Gale RE, Linch DC, Bayford J, Brown L, Quaye M, KinnonC, Ancliff P, Webb DK, Schmidt M, von Kalle C, Gaspar HB,Thrasher AJ (2008) Insertional mutagenesis combined with ac-quired somatic mutations causes leukemogenesis following genetherapy of SCID-X1 patients. J Clin Invest 118(9):3143–3150.doi:10.1172/JCI35798
Kataoka K, Sato T, Yoshimi A, Goyama S, Tsuruta T, KobayashiH, Shimabe M, Arai S, Nakagawa M, Imai Y, Kumano K,Kumagai K, Kubota N, Kadowaki T, Kurokawa M (2011)Evi1 is essential for hematopoietic stem cell self-renewal, andits expression marks hematopoietic cells with long-term mul-tilineage repopulating activity. J Exp Med 208(12):2403–2416. doi:10.1084/jem.20110447
Kay MA, Glorioso JC, Naldini L (2001) Viral vectors for gene therapy:the art of turning infectious agents into vehicles of therapeutics.Nat Med 7(1):33–40
Kim IH, Nagel J, Otten S, Knerr B, Eils R, Rohr K, Dietzel S (2007)Quantitative comparison of DNA detection by GFP-lac repressortagging, fluorescence in situ hybridization and immunostaining.BMC Biotechnol 7(1):92
Komeno Y, Kitaura J, Kitamura T (2009) Molecular bases of myelo-dysplastic syndromes: lessons from animal models. J Cell Physiol219(3):529–534. doi:10.1002/jcp. 21739
Kumaran RI, Thakar R, Spector DL (2008) Chromatin dynamics andgene positioning. Cell 132(6):929–934. doi:10.1016/j.cell.2008.03.004
Küpper K, Kölbl A, Biener D, Dittrich S, von Hase J, Thormeyer T,Fiegler H, Carter NP, Speicher MR, Cremer T, Cremer M (2007)Radial chromatin positioning is shaped by local gene density, notby gene expression. Chromosoma 116(3):285–306
Lanctôt C, Cheutin T, Cremer M, Cavalli G, Cremer T (2007) Dynamicgenome architecture in the nuclear space: regulation of geneexpression in three dimensions. Nat Rev Genet 8(2):104–115
Laricchia-Robbio L, Nucifora G (2008) Significant increase of self-renewal in hematopoietic cells after forced expression of EVI1.Blood Cells Mol Dis 40(2):141–147. doi :10.1016/j .bcmd.2007.07.012
Li Z, Dullmann J, Schiedlmeier B, Schmidt M, von Kalle C, Meyer J,Forster M, Stocking C, Wahlers A, Frank O, Ostertag W, KuhlckeK, Eckert HG, Fehse B, Baum C (2002) Murine leukemia inducedby retroviral gene marking. Science 296(5567):497. doi:10.1126/science.1068893
Lilley CE, Schwartz RA, Weitzman MD (2007) Using or abusing:viruses and the cellular DNA damage response. TrendsMicrobiol 15(3):119–126. doi:10.1016/j.tim.2007.01.003
Lin S, Fu XD (2007) SR proteins and related factors in alternativesplicing. Adv Exp Med Biol 623:107–122
Mancheno-Corvo P, Martin-Duque P (2006) Viral gene therapy. ClinTransl Oncol 8(12):858–867
Meaburn KJ, Misteli T (2007) Cell biology: chromosome territories.Nature 445(7126):379–781
Mellert W, Kleinschmidt A, Schmidt J, Festl H, Emler S, Roth WK,Erfle V (1990) Infection of human fibroblasts and osteoblast-likecells with HIV-1. AIDS 4(6):527–535
Metais JY, Dunbar CE (2008) The MDS1-EVI1 gene complex as aretrovirus integration site: impact on behavior of hematopoieticcells and implications for gene therapy. Mol Ther 16(3):439–449
Modlich U, Bohne J, Schmidt M, von Kalle C, Knoss S, Schambach A,Baum C (2006) Cell-culture assays reveal the importance ofretroviral vector design for insertional genotoxicity. Blood 108(8):2545–2553. doi:10.1182/blood-2005-08-024976
Modlich U, Schambach A, Brugman MH, Wicke DC, Knoess S, Li Z,Maetzig T, Rudolph C, Schlegelberger B, Baum C (2008)Leukemia induction after a single retroviral vector insertion inEvi1 or Prdm16. Leuk Off J Leuk Soc Am Leuk Res Fund UK 22(8):1519–1528. doi:10.1038/leu.2008.118
Modlich U, Navarro S, Zychlinski D, Maetzig T, Knoess S, BrugmanMH, Schambach A, Charrier S, Galy A, Thrasher AJ, Bueren J,Baum C (2009) Insertional transformation of hematopoietic cellsby self-inactivating lentiviral and gammaretroviral vectors. MolTher 17(11):1919–1928. doi:10.1038/mt.2009.179
Nolan G (2009) Retroviral Life cycle. Stanford University. http://stanford.edu/group/nolan/tutorials/ret_1_advant.html
Ott MG, Schmidt M, Schwarzwaelder K, Stein S, Siler U, Koehl U,Glimm H, Kuhlcke K, Schilz A, Kunkel H, Naundorf S,Brinkmann A, Deichmann A, Fischer M, Ball C, Pilz I, DunbarC, Du Y, Jenkins NA, Copeland NG, Luthi U, Hassan M,Thrasher AJ, Hoelzer D, von Kalle C, Seger R, Grez M (2006)Correction of X-linked chronic granulomatous disease by genetherapy, augmented by insertional activation of MDS1-EVI1,PRDM16 or SETBP1. Nat Med 12(4):401–409
Popovic M, Read-Connole E, Gallo RC (1984) T4 positive humanneoplastic cell lines susceptible to and permissive for HTLV-III.Lancet 2(8417–8418):1472–1473
Quivy V, Adam E, Collette Y, Demonte D, Chariot A, Vanhulle C,Berkhout B, Castellano R, de Launoit Y, Burny A, Piette J,Bours V, Van Lint C (2002) Synergistic activation of humanimmunodeficiency virus type 1 promoter activity by NF-kappaB and inhibitors of deacetylases: potential perspectivesfor the development of therapeutic strategies. J Virol 76(21):11091–11103
Solovei I, Cavallo A, Schermelleh L, Jaunin F, Scasselati C, CmarkoD, Cremer C, Fakan S, Cremer T (2002) Spatial preservation ofnuclear chromatin architecture during three-dimensional fluores-cence in situ hybridization (3D-FISH). Exp Cell Res 276(1):10–23. doi:10.1006/excr.2002.5513 S0014482702955138 [pii]
Stein S, Ott MG, Schultze-Strasser S, Jauch A, Burwinkel B, Kinner A,Schmidt M, Kramer A, Schwable J, Glimm H, Koehl U, Preiss C,Ball C, Martin H, Gohring G, Schwarzwaelder K, Hofmann WK,
366 Chromosoma (2012) 121:353–367

Karakaya K, Tchatchou S, Yang R, Reinecke P, Kuhlcke K,Schlegelberger B, Thrasher AJ, Hoelzer D, Seger R, von KalleC, Grez M (2010) Genomic instability and myelodysplasia withmonosomy 7 consequent to EVI1 activation after gene therapy forchronic granulomatous disease. Nat Med 16(2):198–204.doi:10.1038/nm.2088
Takizawa T, Gudla PR, Guo L, Lockett S, Misteli T (2008a) Allele-specific nuclear positioning of the monoallelically expressed as-trocyte marker GFAP. Genes Dev 22(4):489–498
Takizawa T, Meaburn KJ, Misteli T (2008b) The meaning of genepositioning. Cell 135(1):9–13
Tazi J, Bakkour N, Marchand V, Ayadi L, Aboufirassi A, Branlant C(2010) Alternative splicing: regulation of HIV-1 multiplication asa target for therapeutic action. FEBS J 277(4):867–876.doi:10.1111/j.1742-4658.2009.07522.x
Thiel G, Rössler O. (2007) Viren als Werkzeuge der Gentherapie. Biol.Unserer Zeit, vol 4
Tumbar T, Belmont AS (2001) Interphase movements of a DNAchromosome region modulated by VP16 transcriptional activator.Nat Cell Biol 3:134–139
Tumbar T, Sudlow G, Belmont AS (1999) Large scale chromatinunfolding and remodeling induced by VP16 acidic activationdomain. J Cell Biol 145(7):1341–1354
Wang GP, Ciuffi A, Leipzig J, Berry CC, Bushman FD (2007)HIV integration site selection: analysis by massively parallelpyrosequencing reveals association with epigenetic modifi-cations. Genome Res 17(8):1186–1194. doi:10.1101/gr.6286907
Wieser R (2007) The oncogene and developmental regulator EVI1:expression, biochemical properties, and biological functions.Gene 396(2):346–357
Williams RR, Azuara V, Perry P, Sauer S, Dvorkina M, JorgensenH, Roix J, McQueen P, Misteli T, Merkenschlager M, FisherAG (2006) Neural induction promotes large-scale chromatinreorganisation of the Mash1 locus. J Cell Sci 119(Pt 1):132–140
Zhang G, Zapp ML, Yan G, Green MR (1996) Localization of HIV-1RNA in mammalian nuclei. J Cell Biol 135(1):9–18
Zhao R, Bodnar MS, Spector DL (2009) Nuclear neighborhoods andgene expression. Curr Opin Genet Dev 19(2):172–179.doi:10.1016/j.gde.2009.02.007
Zink D, Amaral MD, Englmann A, Lang S, Clarke LA, Rudolph C, AltF, Luther K, Braz C, Sadoni N, Rosenecker J, Schindelhauer D(2004) Transcription-dependent spatial arrangements of CFTRand adjacent genes in human cell nuclei. J Cell Biol 166(6):815–825
Chromosoma (2012) 121:353–367 367