Embed Size (px)
Citation preview
MONGOLIA STAFF REPORT FOR THE 2015 ARTICLE IV CONSULTATION—DEBT SUSTAINABILITY ANALYSIS
Approved By Markus Rodlauer and Masato Miyazaki (IMF) and Satu Kähkönen and Mathew Verghis (IDA)
The Debt Sustainability Analysis (DSA) has been prepared jointly by IMF and World Bank staff, in consultation with the authorities, using the debt sustainability framework for low-income countries approved by the Boards of both institutions.
Based on the LIC-DSA analytical framework and a broader coverage of public debt than previously used, this debt sustainability analysis (DSA) concludes that Mongolia is at high risk of public debt distress under the baseline scenario. 1 This is not because debt is on an ever-increasing path over the medium-term, but rather because key debt indicators are currently elevated and, while expected to decline over time, would still remain above the relevant thresholds for a number of years. This assessment shows a significant deterioration of debt dynamics since the 2013 Article IV, which suggested a moderate risk under a “strong policy scenario.” In 2014, the fiscal deficit ceiling set forth under the Fiscal Stability Law (FSL) was breached, DBM borrowed large amounts at commercial terms, and the BOM continued to draw down its swap line established with the People’s Bank of China (PBC). Public debt could rise further in the near term as the newly passed Debt Management Law allows more room for the government to contract debt and guarantees.2
1 The low-income country debt sustainability framework (LIC DSF) recognizes that better policies and institutions allow countries to manage higher levels of debt, and thus the threshold levels are policy-dependent. Mongolia’s policies and institutions, as measured by the World Bank’s Country Policy and Institutional Assessment (CPIA), place it as a “medium performer”, with an average rating of 3.43 during 2011-13. The relevant indicative thresholds for this category are: 40 percent for the NPV of debt-to-GDP ratio, 150 percent for the NPV of debt-to-exports ratio, 250 percent for the NPV of debt-to-revenue ratio, 20 percent for the debt service-to-exports ratio, and 20 percent for the debt service-to-revenue ratio. These thresholds are applicable to public and publicly guaranteed external debt. 2 This DSA is based on end-2014 debt data. The fiscal year for Mongolia is January–December. The 2013 DSA (see IMF Country Report No. 14/64) was based on end-2013 debt data.
March 19, 2015
MONGOLIA
2 INTERNATIONAL MONETARY FUND
A. Background
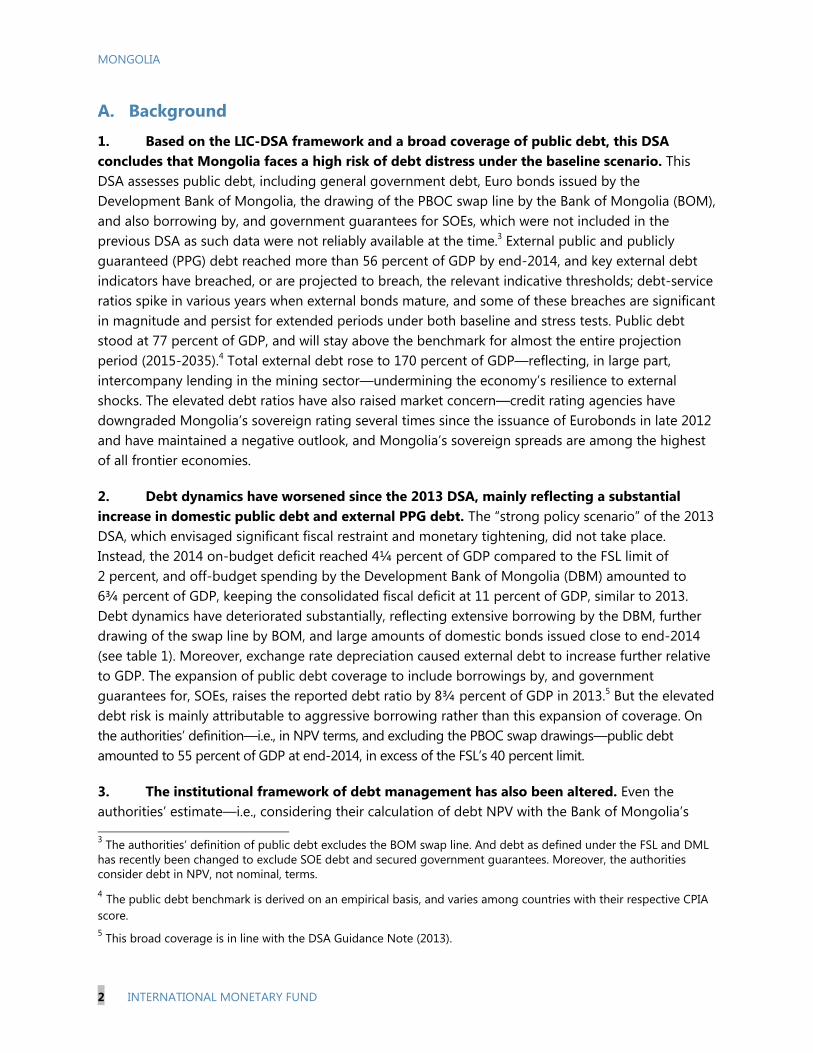
1. Based on the LIC-DSA framework and a broad coverage of public debt, this DSA concludes that Mongolia faces a high risk of debt distress under the baseline scenario. This DSA assesses public debt, including general government debt, Euro bonds issued by the Development Bank of Mongolia, the drawing of the PBOC swap line by the Bank of Mongolia (BOM), and also borrowing by, and government guarantees for SOEs, which were not included in the previous DSA as such data were not reliably available at the time.3 External public and publicly guaranteed (PPG) debt reached more than 56 percent of GDP by end-2014, and key external debt indicators have breached, or are projected to breach, the relevant indicative thresholds; debt-service ratios spike in various years when external bonds mature, and some of these breaches are significant in magnitude and persist for extended periods under both baseline and stress tests. Public debt stood at 77 percent of GDP, and will stay above the benchmark for almost the entire projection period (2015-2035).4 Total external debt rose to 170 percent of GDP—reflecting, in large part, intercompany lending in the mining sector—undermining the economy’s resilience to external shocks. The elevated debt ratios have also raised market concern—credit rating agencies have downgraded Mongolia’s sovereign rating several times since the issuance of Eurobonds in late 2012 and have maintained a negative outlook, and Mongolia’s sovereign spreads are among the highest of all frontier economies.
2. Debt dynamics have worsened since the 2013 DSA, mainly reflecting a substantial increase in domestic public debt and external PPG debt. The “strong policy scenario” of the 2013 DSA, which envisaged significant fiscal restraint and monetary tightening, did not take place. Instead, the 2014 on-budget deficit reached 4¼ percent of GDP compared to the FSL limit of 2 percent, and off-budget spending by the Development Bank of Mongolia (DBM) amounted to 6¾ percent of GDP, keeping the consolidated fiscal deficit at 11 percent of GDP, similar to 2013. Debt dynamics have deteriorated substantially, reflecting extensive borrowing by the DBM, further drawing of the swap line by BOM, and large amounts of domestic bonds issued close to end-2014 (see table 1). Moreover, exchange rate depreciation caused external debt to increase further relative to GDP. The expansion of public debt coverage to include borrowings by, and government guarantees for, SOEs, raises the reported debt ratio by 8¾ percent of GDP in 2013.5 But the elevated debt risk is mainly attributable to aggressive borrowing rather than this expansion of coverage. On the authorities’ definition—i.e., in NPV terms, and excluding the PBOC swap drawings—public debt amounted to 55 percent of GDP at end-2014, in excess of the FSL’s 40 percent limit.
3. The institutional framework of debt management has also been altered. Even the authorities’ estimate—i.e., considering their calculation of debt NPV with the Bank of Mongolia’s 3 The authorities’ definition of public debt excludes the BOM swap line. And debt as defined under the FSL and DML has recently been changed to exclude SOE debt and secured government guarantees. Moreover, the authorities consider debt in NPV, not nominal, terms. 4 The public debt benchmark is derived on an empirical basis, and varies among countries with their respective CPIA score. 5 This broad coverage is in line with the DSA Guidance Note (2013).
MONGOLIA
INTERNATIONAL MONETARY FUND 3
swap line excluded—shows public debt amounted to 54.7 percent of GDP at end-2014 and thus far exceeded the 40 percent threshold enshrined in the FSL. Recent amendments to the FSL and a new Debt Management Law narrowed the definition of debt to government debt only by excluding SOE borrowing and government guarantees secured by government securities. This legal framework also laid out a path for bringing the deficit and government debt back to the original limits within a few years. The new laws will thus provide additional room for the government to contract debt and provide guarantees in the near term. Staff does not support the narrowing of public debt coverage, nor the temporary increase of debt ceiling. Staff also explained the need to include all DBM spending and BOM swap line drawing in public debt for the following reasons:
DBM spending. All DBM activities should be included in the statistics (revenue, expenditure, deficit, and financing) of general government for Mongolia. This practice reflects the institutional unit approach as stated by international statistical manuals (GFSM 2014, SNA 2008 and BPM6). Although in limited circumstances international statistical manuals allow for commercial or market activities of general government units to be split out, but the current activities undertaken by DBM clearly do not satisfy the requirements.
BOM swap. Since this DSA covers the entire public sector, BOM’s liability relating to the swap should be included.
Composition of Public Debt (percent of GDP)
2013 2014
Government External Debt 32 31
Government Domestic Debt 12 14
Government Guarantees (incl. DBM Debt) 6 12
Non-Guaranteed SOE Debt 9 7
BOM Foreign Liability 9 13
Total Public Debt (% of GDP) 67 77 4. Mongolia’s long-term prospects remain bright, but liquidity risks are high in the near term. The country’s resource wealth is estimated at $1 trillion to $3 trillion, and this is assumed to continue being realized gradually. Mongolia is thus projected to be solvent given the strong projected revenues from mining over the long term. It does, however, face serious liquidity pressures and risks in the short run, before mining exports ramp up. Until then, financing outsized prospective fiscal and BOP deficits will be difficult, and thus policies should be focused to avoid building up excessive debt and manage BOP pressure.
5. The authorities have embarked on policy tightening, but more needs to be done. Part of DBM’s spending has been brought on budget, and the consolidated fiscal deficit is expected to decline this year. The authorities target ambitious deficit reduction (to 5 percent of GDP this year, and 2 percent by 2018, excluding “commercial” DBM spending) but this is not likely to materialize on current policies. (Responding to these concerns, the authorities envisage a government resolution to cut spending administratively, to be backed up by a second supplementary budget later in the year). The BOM has hiked the policy rate twice, slowed the pace of PSP and mortgage
MONGOLIA
4 INTERNATIONAL MONETARY FUND
lending, and proposed transferring the existing stock of PSP loans to the government’s balance sheet; nonetheless, credit growth is higher than desirable. The authorities have redoubled efforts to reach agreement with investors on large projects and introduced other structural measures to boost exports and reduce imports. Steps have been taken to strengthen the banks and to improve bank supervision and crisis preparedness. Nevertheless, these policy adjustments may not be sufficient to ensure macro-stability. Under the baseline, the consolidated fiscal deficit (including all DBM spending) would decline but remain above the FSL limit (2 percent of GDP). A large BOP financing gap, estimated at about $2 billion over the next three years (discussed below), will be financed at least partly by public borrowing or debt contracted with government guarantees.6
6. Baseline assumptions differ significantly from those in the “strong policy scenario” used in the previous DSA:
The previous DSA projected the fiscal deficit to fall below 2 percent of GDP in 2016, while here it drops to 4 percent from 2019.
The previous DSA projected a complete phaseout of unconventional monetary easing programs, which helped to bring credit growth down to around 13½ percent, while here some of these programs continue, albeit on a smaller scale, and credit growth is around 16 percent.
Reflecting updated information on OT-1 output, mining growth is revised down from an average of 5½ percent to 3½ percent, while nonmineral growth is revised down from 6½ percent to 5½ percent, on account of weakened near-term investor confidence. Given weaker activity, this DSA also revises CPI inflation down from a medium-term average of 7½ percent to 7 percent. The real exchange rate is assumed to remain constant.
Finally, while there was no BOP financing gap in the previous DSA, the current BOP envisages a financing gap (relative to zero reserves) of $2 billion mainly because of weaker capital and financial inflows.7 It is assumed that 62 percent of the financing gap will be filled by government borrowing or debt with government guarantees—this ratio is consistent with the share of public external debt in total external debt (excluding intercompany lending). This borrowing also reflects additional borrowing space created by the revised legal framework (the revised FSL and the new DML).
B. Debt Sustainability under Baseline Scenario
7. Debt is not on an ever-increasing path under the baseline scenario. Both external and public debt scaled by GDP would fall after an initial period.8 This reflects promising prospects of the mining sector in outer years and fiscal adjustment measures enshrined in the legal system. Nevertheless, the debt path is sensitive to external shocks. Meanwhile, disputes surrounding OT-2, 6 The financing gap is defined as the shortfall of BOP financing after FX reserves fall to zero. Considering the need to build up FX reserves, the financing needs could be even larger. 7 An important difference is that the current DSA baseline assumes no rollover of the maturing sovereign and quasi-sovereign bonds in 2017, while the previous DSA assumes a full rollover of these debts. 8 Residuals reflect large capital outflows under “currency and deposits” and change of FX reserves.

MONGOLIA
INTERNATIONAL MONETARY FUND 5
which is assumed to be addressed by end-2015 under the baseline, add to economic uncertainty. Should it be further delayed, growth prospects would be dampened, fiscal risk would rise, and BOP financing gap could be wider, but the debt path would still trend down slowly. To put the debt trajectory on a more sustainable footing, more needs to be done. Below is a summary of the debt indicators under the baseline scenario:
External DSA
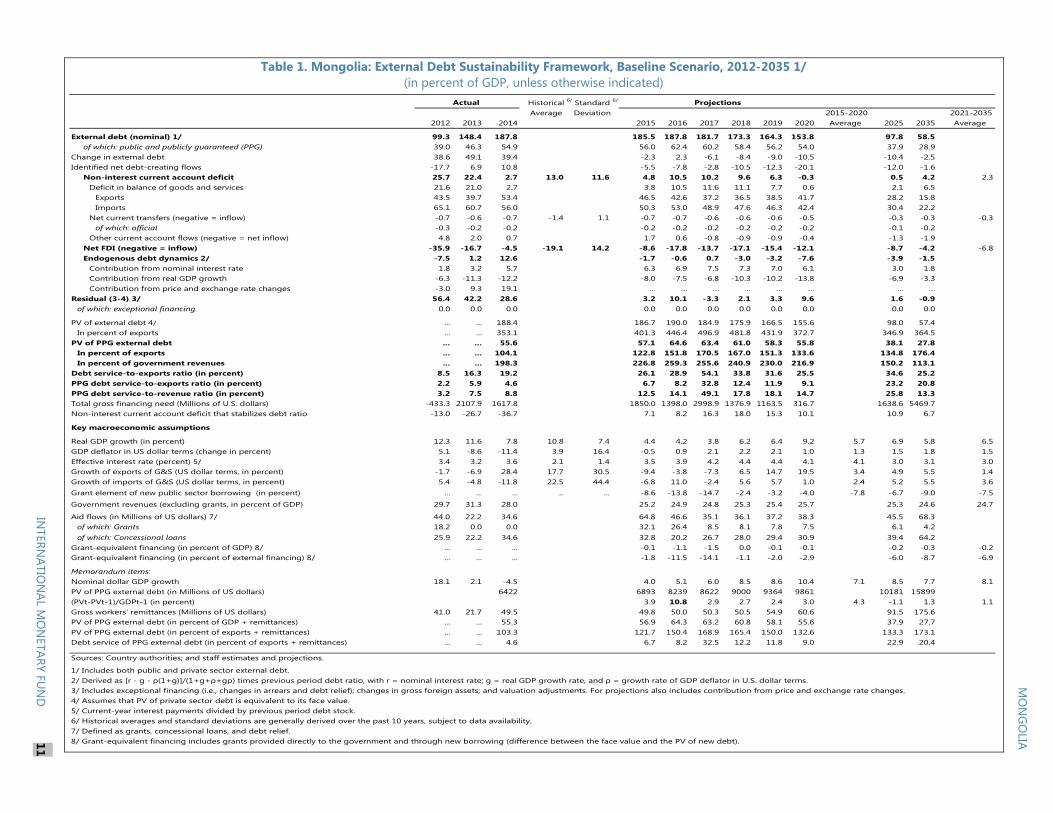
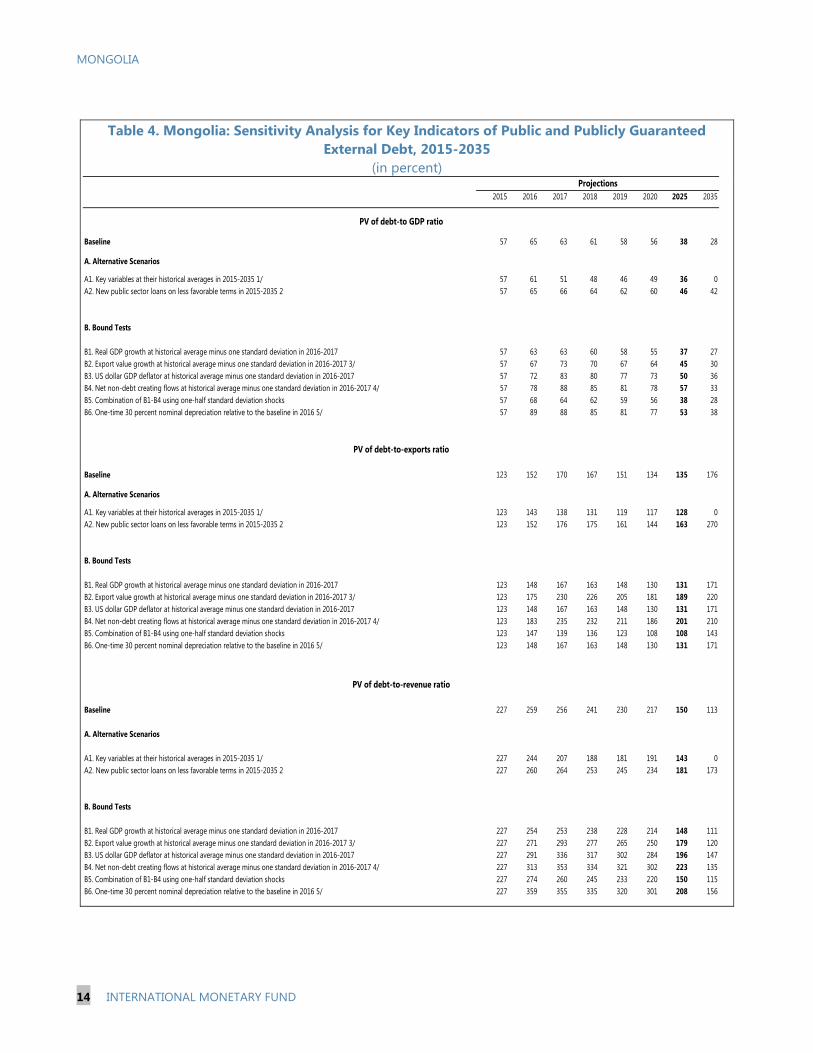
8. Mongolia’s external PPG debt indicators have all breached, or are projected to breach, the thresholds, and will remain above these thresholds, in some cases for a prolonged time. The detailed results are as follows:
The present value of external PPG debt reached 57 percent of GDP by end-2014, far above the indicative threshold of 40 percent.9 It is expected to peak at 64½ percent of GDP in 2016, and gradually moderate to below the threshold in 2025 onwards.
The present value of external PPG debt would peak at 170½ percent of exports in 2017, and stay above the threshold of 150 percent in about half of the projection period.
The present value of external PPG debt in relation to revenue would slightly breach the threshold only in 2016–17. It would peak at 259¼ percent in 2017, and decline steadily, falling to 113 percent in 2035.
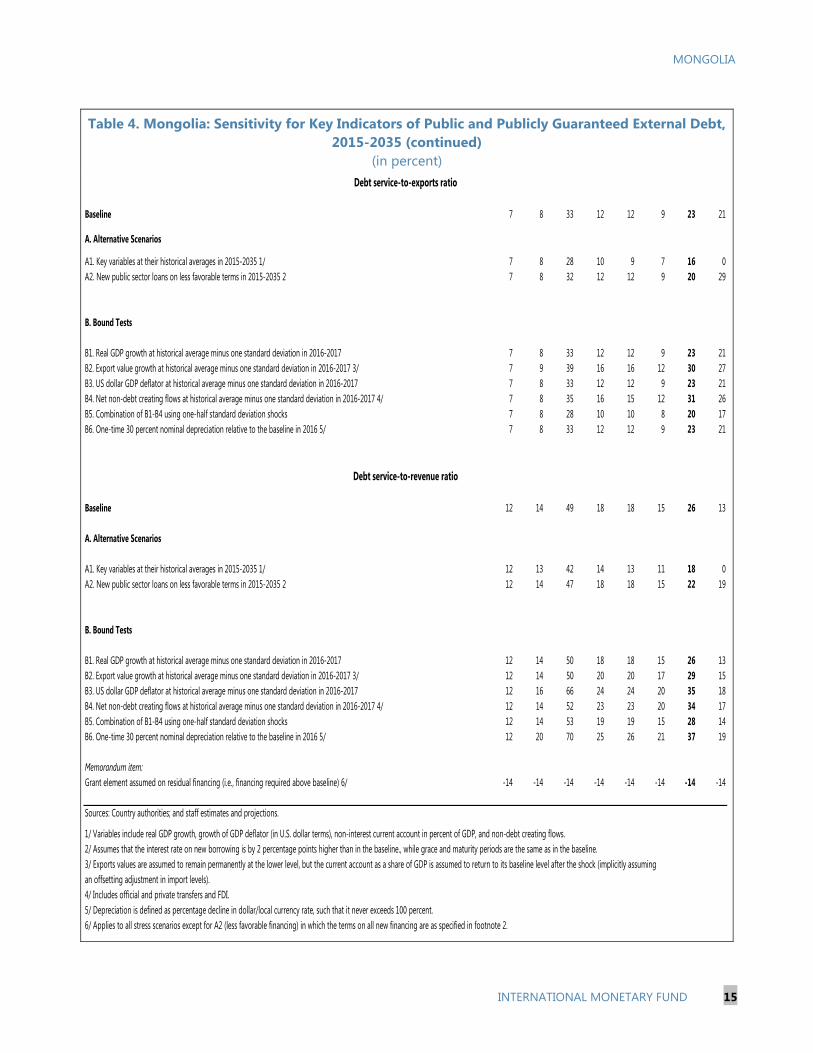
Debt service indicators, i.e. debt service-to-exports and debt service-to-revenue, would briefly breach the thresholds several times (each time for just one year), including in 2017 and 2022, when the Chinggis bonds mature.
9. Meanwhile, these debt indicators are susceptible to various standard shocks such as a sharp exchange rate depreciation and decline of BOP inflows. Given a one-time 30 percent exchange rate depreciation, the present value of external PPG debt would peak at 89½ percent of GDP in 2017 and stay above the indicative threshold for almost the entire projection period; the present value of external debt-to-revenue would peak at 359 percent and stay above the threshold for seven years; and debt service-to-revenue would peak at 70percent in 2017 and stay above its threshold until 2027. In the case of a one-standard deviation shock to non-debt creating BOP flows, the present value of debt-to-exports would peak at 235¼ percent in 2017 and stay above the threshold through the whole projection period; and debt service-to-exports would breach its threshold in 14 out of the 21-year projection period.
10. The standard “historical scenario”—where key variables follow historical paths and debt ratios thus decline rapidly—does not seem to represent a possible outcome. For example, FDI inflows peaked at more than $4 billion per year in 2011-12, and have since dropped sharply to just $542 million in 2014. Even if OT-2 is launched soon, FDI would likely peak at only $2½ billion in the next few years. By the same token, real GDP growth would also be more moderate in the future barring the investment boom observed in 2011–12.
9 The discount rate is 5 percent, according to the DSA guidelines.
MONGOLIA
6 INTERNATIONAL MONETARY FUND
Public DSA
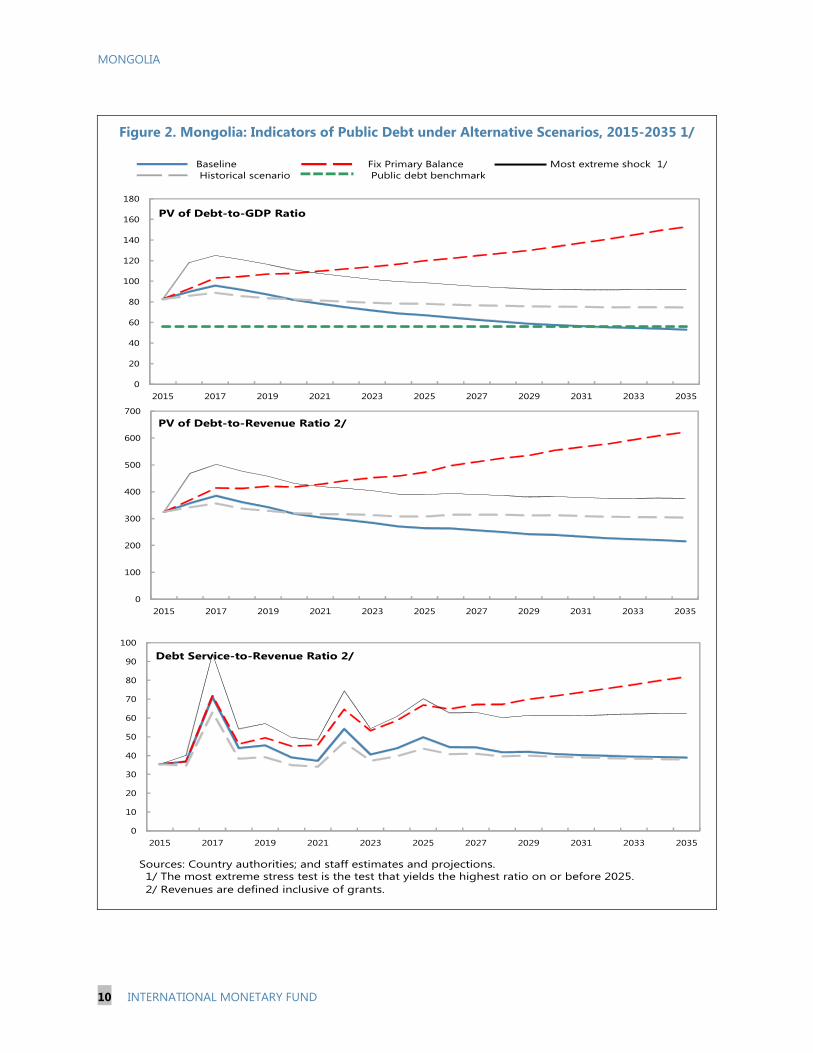
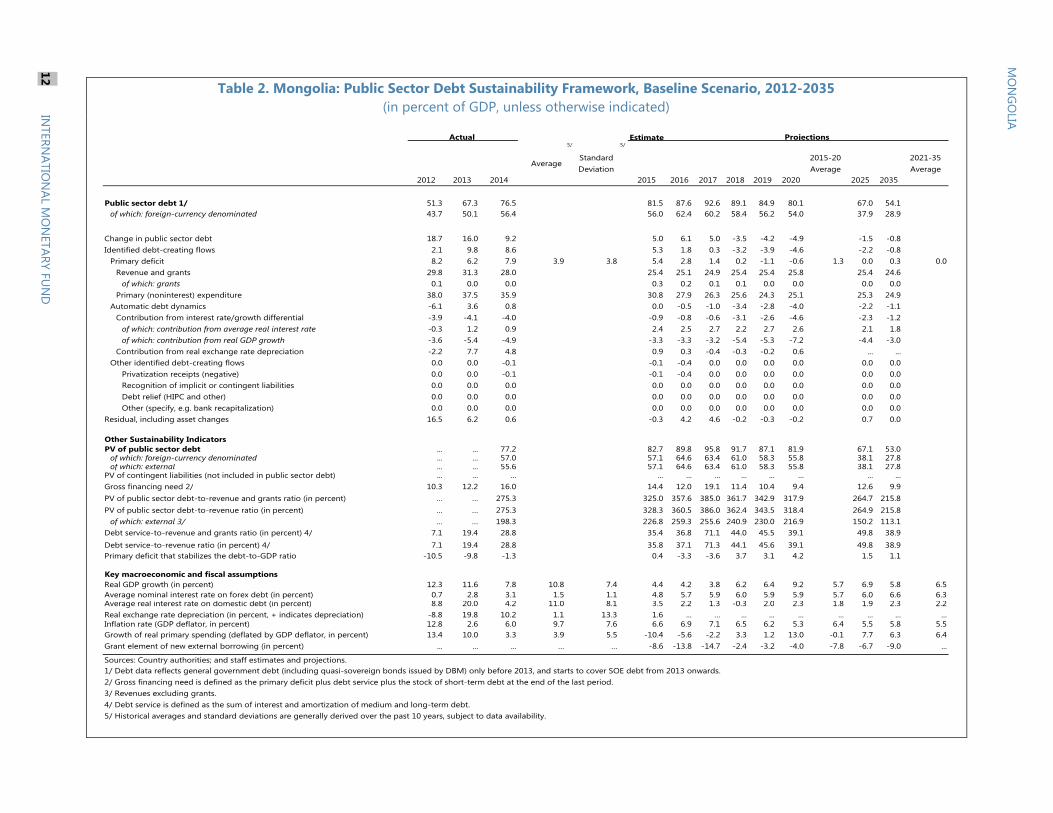
11. Public ratios would remain elevated across the projection period. The present value of public debt-to-GDP ratio peaks at 95¾ percent of GDP in 2017 and then falls gradually, to 53 percent by end-2035. This ratio has been far above the benchmark (56 percent), and is expected to decline below the benchmark only in 2032 onward. The present value of public debt-to-revenue ratio would peak at just below 400 percent in 2017, and thereafter falls gradually to just above 200 percent in 2035. The debt service-to-revenue ratio would spike several times, peaking in 2017 at 71 percent and hovering around 40 percent in most of the projection period. Debt could rise further if some banks need to be recapitalized, and if this requires fiscal resources.
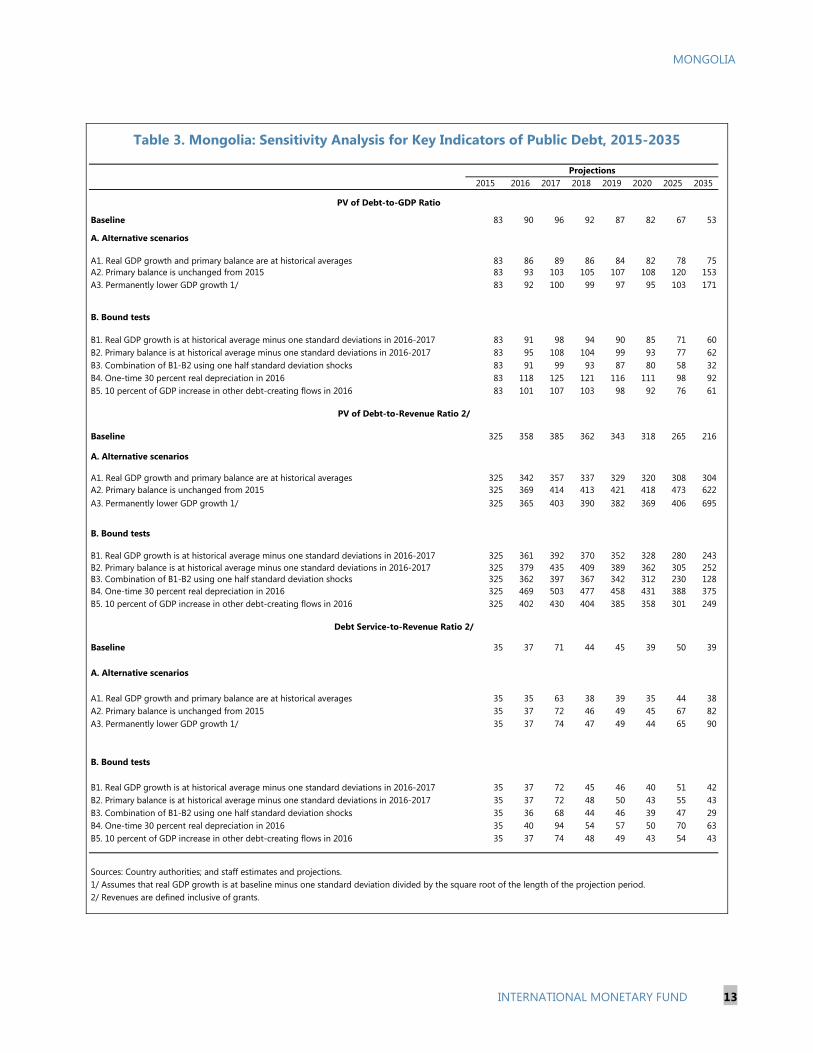
12. The alternative scenarios and bound tests indicate that the projected paths of debt indicators are sensitive to alternative assumptions. In particular, the scenario in which the primary balance is fixed at the level prevailing in 2014 illustrates a steadily rising trend of debt ratios, underscoring the urgent need for fiscal consolidation.
13. The uncertainty surrounding OT-2 represents an important downside risk, but debt ratios would still decline steadily even if the project were delayed by three years. In this context, the present value of external PPG debt would peak at 70¾ percent of GDP in 2017, and decline thereafter steadily, to 27 percent of GDP at the end of the projection period; meanwhile, the present value of public debt would reach 103 percent of GDP, and then decline consistently, to 53 percent of GDP by 2035. The present value of external PPG debt would stay above its threshold for 10 years, and the most severe shock would cause this ratio to peak at 98¼ percent of GDP in 2017, though it would fall over time, to below the threshold close to the end of the projection period. Spikes of external debt service ratios would be more severe than under the baseline assumption of no delay in OT-2.
C. Debt Sustainability under Policy Adjustment Scenario
14. Macro policies need to be tightened to keep current account deficits at more manageable levels and to improve the fiscal position. One possible adjustment scenario is summarized below:
Fiscal. The fiscal path needs to be secured with Parliamentary approval for measures to control spending, both on-budget and off, as part of a coherent, medium-term macro framework. In the adjustment scenario, all DBM spending is brought on-budget and the fiscal deficit would be reduced to 2 percent of GDP in 2017 onward.
Monetary. The BOM should cease all unconventional easing programs targeting particular industries or involving direct lending to the private sector, returning to traditional central-banking functions; these programs should, if desired, by conducted by the government, competing with other spending priorities for funds within the budget. The monetary stance should be tightened further, to control credit growth and support the BOP. Credit growth slows to about 12 percent (y/y) in the adjustment scenario.
MONGOLIA
INTERNATIONAL MONETARY FUND 7
Exchange rate policy. Foreign-exchange intervention should be limited to dealing with episodes of excessive volatility, and the exchange rate should be allowed to move flexibly.
Growth and inflation. Given the policy tightening, non-mining growth would initially slow to 1 percent in 2015 and then gradually pick up to 6½ percent over the medium term. Real exchange rate is assumed to depreciate by 4 percent per year in 2015-17 barring BOM intervention. The exchange rate depreciation will have pass-through effects on inflation, which would stay high at 9½ percent in 2015 and gradually moderate to 6½ percent.
Balance of payments. Macro policy tightening, lower growth and real exchange rate depreciation will all help compress imports. Current account deficit will decline by about $800 million in the next three years, compared to the baseline. As a consequence, the balance of payments will have no financing gap and FX reserves will stand at 1¾ months of imports by end-2017.
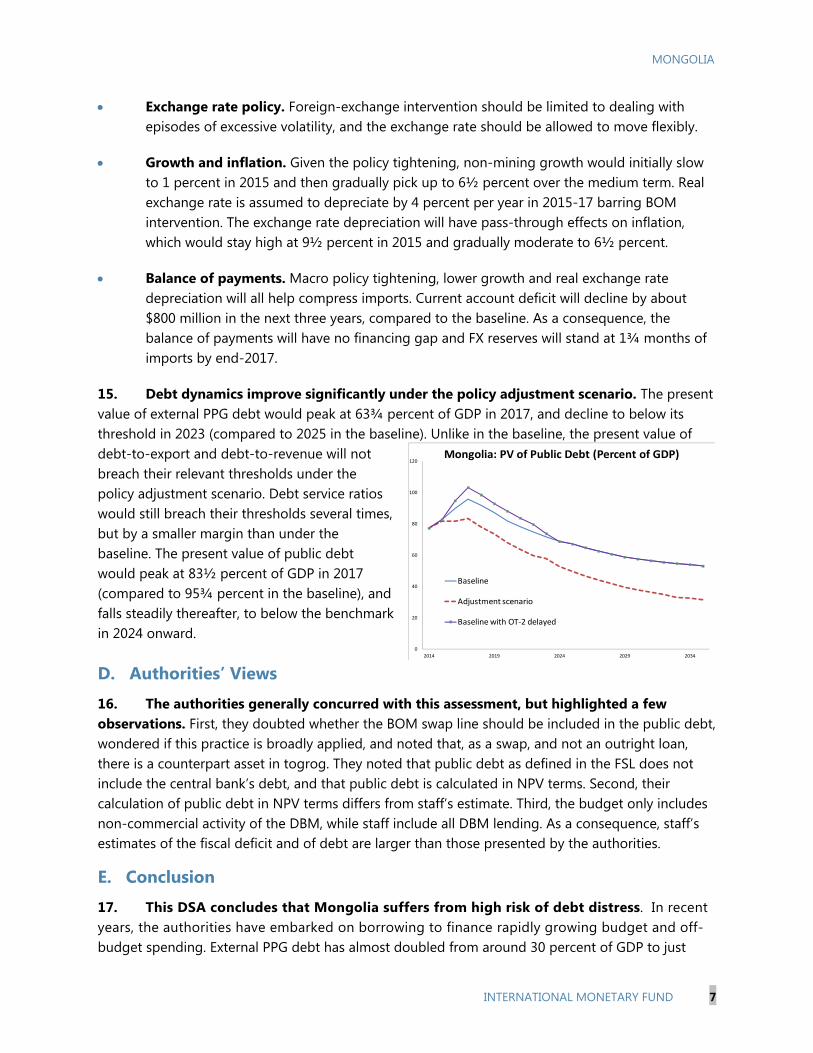
15. Debt dynamics improve significantly under the policy adjustment scenario. The present value of external PPG debt would peak at 63¾ percent of GDP in 2017, and decline to below its threshold in 2023 (compared to 2025 in the baseline). Unlike in the baseline, the present value of debt-to-export and debt-to-revenue will not breach their relevant thresholds under the policy adjustment scenario. Debt service ratios would still breach their thresholds several times, but by a smaller margin than under the baseline. The present value of public debt would peak at 83½ percent of GDP in 2017 (compared to 95¾ percent in the baseline), and falls steadily thereafter, to below the benchmark in 2024 onward.
D. Authorities’ Views
16. The authorities generally concurred with this assessment, but highlighted a few observations. First, they doubted whether the BOM swap line should be included in the public debt, wondered if this practice is broadly applied, and noted that, as a swap, and not an outright loan, there is a counterpart asset in togrog. They noted that public debt as defined in the FSL does not include the central bank’s debt, and that public debt is calculated in NPV terms. Second, their calculation of public debt in NPV terms differs from staff’s estimate. Third, the budget only includes non-commercial activity of the DBM, while staff include all DBM lending. As a consequence, staff’s estimates of the fiscal deficit and of debt are larger than those presented by the authorities.
E. Conclusion
17. This DSA concludes that Mongolia suffers from high risk of debt distress. In recent years, the authorities have embarked on borrowing to finance rapidly growing budget and off-budget spending. External PPG debt has almost doubled from around 30 percent of GDP to just
0
20
40
60
80
100
120
2014 2019 2024 2029 2034
Mongolia: PV of Public Debt (Percent of GDP)
Baseline
Adjustment scenario
Baseline with OT-2 delayed
MONGOLIA
8 INTERNATIONAL MONETARY FUND
below 60 percent in the past four years. Public debt stood at below 80 percent of GDP by end-2014, and could further increase given the lax fiscal policy and loosening of borrowing limits offered by the DML. Although debt indicators, mainly external and public debt scaled by GDP, would decline steadily under the baseline, they would remain elevated for prolonged periods.
18. The debt dynamics exhibit a high vulnerability to shocks and bound tests. External PPG debt ratios would rise dramatically in the case of a sharp exchange rate depreciaiton or negative shocks to BOP inflows. Public debt would be on an ever-increasing trajectory should the primary deficit remain at the level prevailing in 2014. Moreover, total external debt, both public and private, has reached about 140 percent of GDP, and this has made the macro-financial stability highly susceptible to exchange rate movements and flucutation of BOP flows.
19. These risks call for immediate policy actions. Although some fiscal adjustment measures have been announced, they are not sufficient to safeguard macro-financial stability and to ensure debt sustainability in case of adverse shocks. Staff suggests more pronounced policy tighening instead. Under a policy adjustment scenario, debt indicators improve significantly—external debt indicators either do not breach their thresholds, or breach them with a smaller margin; public debt as a share of GDP would fall below the benchmark more quickly than under the baseline.
Macroeconomic Assumptions
The baseline scenario assumes the authorities’ current policies, including those proposed under the CMAP framework (but not the latest fiscal cuts that are under consideration). The details are summarized below:
Real sector. It is assumed that OT-2 will start construction from late 2015 and begin operation in 2020.
Fiscal. The authorities target the fiscal deficit at 5 percent of GDP for 2015, and aim to bring the deficit down to 2 percent of GDP by 2018. However, given certain unrealistic assumptions and the need to reflect all DBM spending in the budget, staff project the fiscal deficit to remain close to 10 percent of GDP in 2015, and gradually to decline to 4 percent of GDP from 2019 onward.
Monetary. While the BOM has raised the policy rate twice in recent months and scaled down some monetary easing programs, other unconventional programs have continued and expanded. Given these developments, staff project credit growth at about 16 percent over the medium term.
Balance of payments. The current account deficit is projected to average 13½ percent of GDP over the medium term, before OT-2 starts to export mining commodities in 2020. FDI would average about 2½ billion per year on account of OT-2 related investment. In 2017, maturing debt of more than $1½ billion would exert heavy pressure on the BOP. A large financing gap is expected to emerge, and it is assumed that about two-thirds of this gap will be filled by public borrowing.
Exchange rate. Staff project a constant real exchange rate, along with declining reserves. The adjustment scenario instead assumes that: (i) the fiscal deficit, with all DBM spending brought on budget, is brought down to 2 percent of GDP from 2017 onward; (ii) unconventional easing programs at the BOM are transferred to the budget or discontinued altogether, and credit growth drops to 12 percent; (iii) the exchange rate is allowed to move flexibly; and (iv) market rollovers are easier. With these assumptions, BOP financing gaps are closed.
MONGOLIA
INTERNATIONAL MONETARY FUND 9
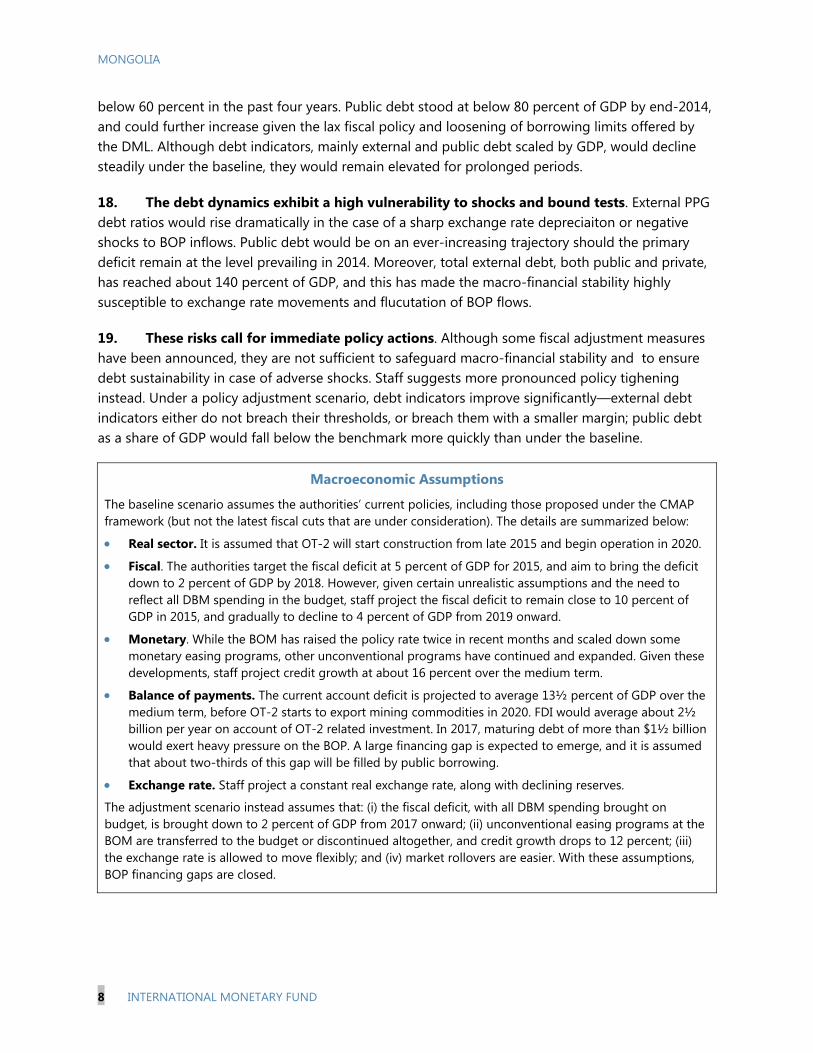
Figure 1. Mongolia: Indicators of Public and Publicly Guaranteed External Debt under Alternative Scenarios, 2015-2035 1/
Sources: Country authorities; and staff estimates and projections.
1/ The most extreme stress test is the test that yields the highest ratio on or before 2025. In figure b. it corresponds to a One-time depreciation shock; in c. to a Non-debt flows shock; in d. to a One-time depreciation shock; in e. to a Exports shock and in figure f. to a One-time depreciation shock
Baseline Historical scenario Most extreme shock 1/ Threshold
0
10
20
30
40
50
60
70
80
2015 2020 2025 2030 2035
f.Debt service-to-revenue ratio
-16
-14
-12
-10
-8
-6
-4
-2
0
-4
-2
0
2
4
6
8
10
12
2015 2020 2025 2030 2035
Rate of Debt AccumulationGrant-equivalent financing (% of GDP)Grant element of new borrowing (% right scale)
a. Debt Accumulation
0
50
100
150
200
250
2015 2020 2025 2030 2035
c.PV of debt-to-exports ratio
0
10
20
30
40
50
60
70
80
90
100
2015 2020 2025 2030 2035
b.PV of debt-to GDP ratio
0
50
100
150
200
250
300
350
400
2015 2020 2025 2030 2035
d.PV of debt-to-revenue ratio
0
5
10
15
20
25
30
35
40
45
2015 2020 2025 2030 2035
e.Debt service-to-exports ratio
MONGOLIA
10 INTERNATIONAL MONETARY FUND
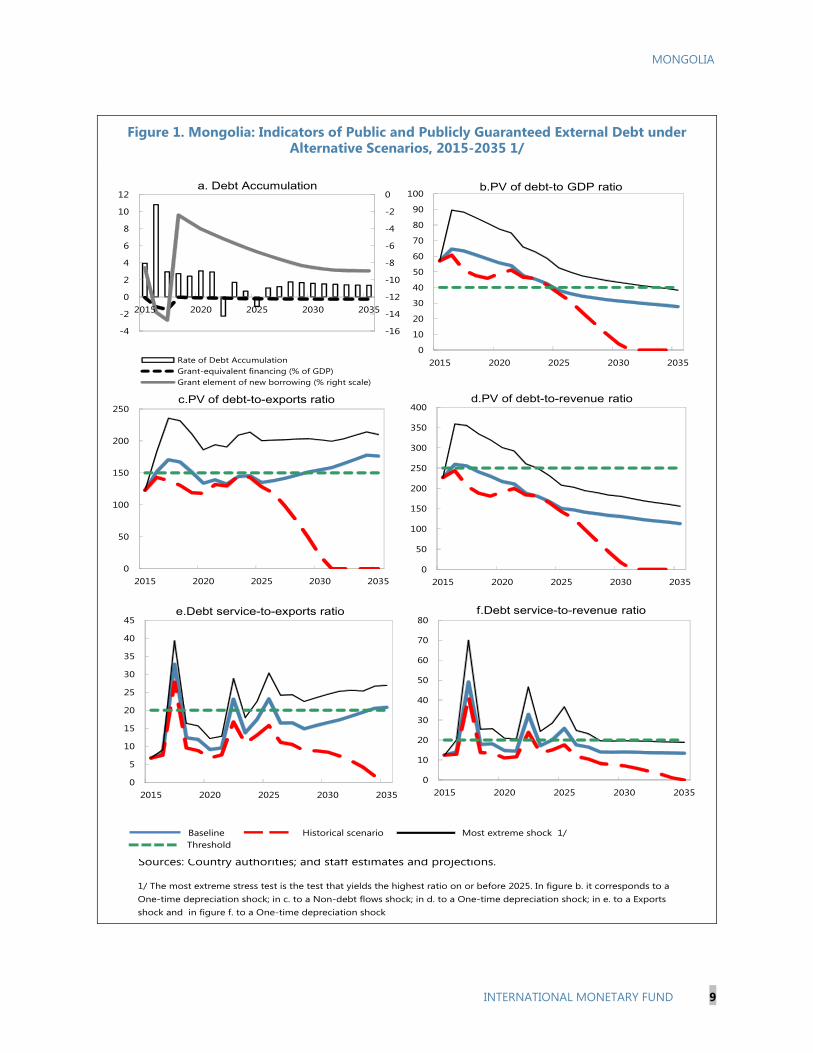
Figure 2. Mongolia: Indicators of Public Debt under Alternative Scenarios, 2015-2035 1/
Sources: Country authorities; and staff estimates and projections.1/ The most extreme stress test is the test that yields the highest ratio on or before 2025. 2/ Revenues are defined inclusive of grants.
BaselinePublic debt benchmark
Most extreme shock 1/Historical scenario
Fix Primary Balance
0
100
200
300
400
500
600
700
2015 2017 2019 2021 2023 2025 2027 2029 2031 2033 2035
PV of Debt-to-Revenue Ratio 2/
0
20
40
60
80
100
120
140
160
180
2015 2017 2019 2021 2023 2025 2027 2029 2031 2033 2035
PV of Debt-to-GDP Ratio
0
10
20
30
40
50
60
70
80
90
100
2015 2017 2019 2021 2023 2025 2027 2029 2031 2033 2035
Debt Service-to-Revenue Ratio 2/
Historical 6/ Standard 6/
Average Deviation 2015-2020 2021-20352012 2013 2014 2015 2016 2017 2018 2019 2020 Average 2025 2035 Average
External debt (nominal) 1/ 99.3 148.4 187.8 185.5 187.8 181.7 173.3 164.3 153.8 97.8 58.5of which: public and publicly guaranteed (PPG) 39.0 46.3 54.9 56.0 62.4 60.2 58.4 56.2 54.0 37.9 28.9
Change in external debt 38.6 49.1 39.4 -2.3 2.3 -6.1 -8.4 -9.0 -10.5 -10.4 -2.5Identified net debt-creating flows -17.7 6.9 10.8 -5.5 -7.8 -2.8 -10.5 -12.3 -20.1 -12.0 -1.6
Non-interest current account deficit 25.7 22.4 2.7 13.0 11.6 4.8 10.5 10.2 9.6 6.3 -0.3 0.5 4.2 2.3Deficit in balance of goods and services 21.6 21.0 2.7 3.8 10.5 11.6 11.1 7.7 0.6 2.1 6.5
Exports 43.5 39.7 53.4 46.5 42.6 37.2 36.5 38.5 41.7 28.2 15.8Imports 65.1 60.7 56.0 50.3 53.0 48.9 47.6 46.3 42.4 30.4 22.2
Net current transfers (negative = inflow) -0.7 -0.6 -0.7 -1.4 1.1 -0.7 -0.7 -0.6 -0.6 -0.6 -0.5 -0.3 -0.3 -0.3of which: official -0.3 -0.2 -0.2 -0.2 -0.2 -0.2 -0.2 -0.2 -0.2 -0.1 -0.2
Other current account flows (negative = net inflow) 4.8 2.0 0.7 1.7 0.6 -0.8 -0.9 -0.9 -0.4 -1.3 -1.9Net FDI (negative = inflow) -35.9 -16.7 -4.5 -19.1 14.2 -8.6 -17.8 -13.7 -17.1 -15.4 -12.1 -8.7 -4.2 -6.8Endogenous debt dynamics 2/ -7.5 1.2 12.6 -1.7 -0.6 0.7 -3.0 -3.2 -7.6 -3.9 -1.5
Contribution from nominal interest rate 1.8 3.2 5.7 6.3 6.9 7.5 7.3 7.0 6.1 3.0 1.8Contribution from real GDP growth -6.3 -11.3 -12.2 -8.0 -7.5 -6.8 -10.3 -10.2 -13.8 -6.9 -3.3Contribution from price and exchange rate changes -3.0 9.3 19.1 … … … … … … … …
Residual (3-4) 3/ 56.4 42.2 28.6 3.2 10.1 -3.3 2.1 3.3 9.6 1.6 -0.9of which: exceptional financing 0.0 0.0 0.0 0.0 0.0 0.0 0.0 0.0 0.0 0.0 0.0
PV of external debt 4/ ... ... 188.4 186.7 190.0 184.9 175.9 166.5 155.6 98.0 57.4In percent of exports ... ... 353.1 401.3 446.4 496.9 481.8 431.9 372.7 346.9 364.5
PV of PPG external debt ... ... 55.6 57.1 64.6 63.4 61.0 58.3 55.8 38.1 27.8In percent of exports ... ... 104.1 122.8 151.8 170.5 167.0 151.3 133.6 134.8 176.4In percent of government revenues ... ... 198.3 226.8 259.3 255.6 240.9 230.0 216.9 150.2 113.1
Debt service-to-exports ratio (in percent) 8.5 16.3 19.2 26.1 28.9 54.1 33.8 31.6 25.5 34.6 25.2PPG debt service-to-exports ratio (in percent) 2.2 5.9 4.6 6.7 8.2 32.8 12.4 11.9 9.1 23.2 20.8PPG debt service-to-revenue ratio (in percent) 3.2 7.5 8.8 12.5 14.1 49.1 17.8 18.1 14.7 25.8 13.3Total gross financing need (Millions of U.S. dollars) -433.3 2107.9 1617.8 1850.0 1398.0 2998.9 1376.9 1163.5 316.7 1638.6 5469.7Non-interest current account deficit that stabilizes debt ratio -13.0 -26.7 -36.7 7.1 8.2 16.3 18.0 15.3 10.1 10.9 6.7
Key macroeconomic assumptions
Real GDP growth (in percent) 12.3 11.6 7.8 10.8 7.4 4.4 4.2 3.8 6.2 6.4 9.2 5.7 6.9 5.8 6.5GDP deflator in US dollar terms (change in percent) 5.1 -8.6 -11.4 3.9 16.4 -0.5 0.9 2.1 2.2 2.1 1.0 1.3 1.5 1.8 1.5Effective interest rate (percent) 5/ 3.4 3.2 3.6 2.1 1.4 3.5 3.9 4.2 4.4 4.4 4.1 4.1 3.0 3.1 3.0Growth of exports of G&S (US dollar terms, in percent) -1.7 -6.9 28.4 17.7 30.5 -9.4 -3.8 -7.3 6.5 14.7 19.5 3.4 4.9 5.5 1.4Growth of imports of G&S (US dollar terms, in percent) 5.4 -4.8 -11.8 22.5 44.4 -6.8 11.0 -2.4 5.6 5.7 1.0 2.4 5.2 5.5 3.6Grant element of new public sector borrowing (in percent) ... ... ... ... ... -8.6 -13.8 -14.7 -2.4 -3.2 -4.0 -7.8 -6.7 -9.0 -7.5
Government revenues (excluding grants, in percent of GDP) 29.7 31.3 28.0 25.2 24.9 24.8 25.3 25.4 25.7 25.3 24.6 24.7
Aid flows (in Millions of US dollars) 7/ 44.0 22.2 34.6 64.8 46.6 35.1 36.1 37.2 38.3 45.5 68.3of which: Grants 18.2 0.0 0.0 32.1 26.4 8.5 8.1 7.8 7.5 6.1 4.2of which: Concessional loans 25.9 22.2 34.6 32.8 20.2 26.7 28.0 29.4 30.9 39.4 64.2
Grant-equivalent financing (in percent of GDP) 8/ ... ... ... -0.1 -1.1 -1.5 0.0 -0.1 -0.1 -0.2 -0.3 -0.2Grant-equivalent financing (in percent of external financing) 8/ ... ... ... -1.8 -11.5 -14.1 -1.1 -2.0 -2.9 -6.0 -8.7 -6.9
Memorandum items:Nominal dollar GDP growth 18.1 2.1 -4.5 4.0 5.1 6.0 8.5 8.6 10.4 7.1 8.5 7.7 8.1PV of PPG external debt (in Millions of US dollars) 6422 6893 8239 8622 9000 9364 9861 10181 15899(PVt-PVt-1)/GDPt-1 (in percent) 3.9 10.8 2.9 2.7 2.4 3.0 4.3 -1.1 1.3 1.1Gross workers' remittances (Millions of US dollars) 41.0 21.7 49.5 49.8 50.0 50.3 50.5 54.9 60.6 91.5 175.6PV of PPG external debt (in percent of GDP + remittances) ... ... 55.3 56.9 64.3 63.2 60.8 58.1 55.6 37.9 27.7PV of PPG external debt (in percent of exports + remittances) ... ... 103.3 121.7 150.4 168.9 165.4 150.0 132.6 133.3 173.1Debt service of PPG external debt (in percent of exports + remittances) ... ... 4.6 6.7 8.2 32.5 12.2 11.8 9.0 22.9 20.4
Sources: Country authorities; and staff estimates and projections.
1/ Includes both public and private sector external debt.2/ Derived as [r - g - ρ(1+g)]/(1+g+ρ+gρ) times previous period debt ratio, with r = nominal interest rate; g = real GDP growth rate, and ρ = growth rate of GDP deflator in U.S. dollar terms. 3/ Includes exceptional financing (i.e., changes in arrears and debt relief); changes in gross foreign assets; and valuation adjustments. For projections also includes contribution from price and exchange rate changes.4/ Assumes that PV of private sector debt is equivalent to its face value.5/ Current-year interest payments divided by previous period debt stock. 6/ Historical averages and standard deviations are generally derived over the past 10 years, subject to data availability. 7/ Defined as grants, concessional loans, and debt relief.8/ Grant-equivalent financing includes grants provided directly to the government and through new borrowing (difference between the face value and the PV of new debt).
Actual Projections
Table 1. Mongolia: External Debt Sustainability Framework, Baseline Scenario, 2012-2035 1/(in percent of GDP, unless otherwise indicated)
MO
NG
OLIA
IN
TERNATIO
NAL M
ON
ETARY FUN
D 11
Estimate
2012 2013 2014
Average
5/
Standard Deviation
5/
2015 2016 2017 2018 2019 2020
2015-20 Average
2025 2035
2021-35 Average
Public sector debt 1/ 51.3 67.3 76.5 81.5 87.6 92.6 89.1 84.9 80.1 67.0 54.1of which: foreign-currency denominated 43.7 50.1 56.4 56.0 62.4 60.2 58.4 56.2 54.0 37.9 28.9
Change in public sector debt 18.7 16.0 9.2 5.0 6.1 5.0 -3.5 -4.2 -4.9 -1.5 -0.8Identified debt-creating flows 2.1 9.8 8.6 5.3 1.8 0.3 -3.2 -3.9 -4.6 -2.2 -0.8
Primary deficit 8.2 6.2 7.9 3.9 3.8 5.4 2.8 1.4 0.2 -1.1 -0.6 1.3 0.0 0.3 0.0Revenue and grants 29.8 31.3 28.0 25.4 25.1 24.9 25.4 25.4 25.8 25.4 24.6
of which: grants 0.1 0.0 0.0 0.3 0.2 0.1 0.1 0.0 0.0 0.0 0.0Primary (noninterest) expenditure 38.0 37.5 35.9 30.8 27.9 26.3 25.6 24.3 25.1 25.3 24.9
Automatic debt dynamics -6.1 3.6 0.8 0.0 -0.5 -1.0 -3.4 -2.8 -4.0 -2.2 -1.1Contribution from interest rate/growth differential -3.9 -4.1 -4.0 -0.9 -0.8 -0.6 -3.1 -2.6 -4.6 -2.3 -1.2
of which: contribution from average real interest rate -0.3 1.2 0.9 2.4 2.5 2.7 2.2 2.7 2.6 2.1 1.8of which: contribution from real GDP growth -3.6 -5.4 -4.9 -3.3 -3.3 -3.2 -5.4 -5.3 -7.2 -4.4 -3.0
Contribution from real exchange rate depreciation -2.2 7.7 4.8 0.9 0.3 -0.4 -0.3 -0.2 0.6 ... ...Other identified debt-creating flows 0.0 0.0 -0.1 -0.1 -0.4 0.0 0.0 0.0 0.0 0.0 0.0
Privatization receipts (negative) 0.0 0.0 -0.1 -0.1 -0.4 0.0 0.0 0.0 0.0 0.0 0.0Recognition of implicit or contingent liabilities 0.0 0.0 0.0 0.0 0.0 0.0 0.0 0.0 0.0 0.0 0.0Debt relief (HIPC and other) 0.0 0.0 0.0 0.0 0.0 0.0 0.0 0.0 0.0 0.0 0.0Other (specify, e.g. bank recapitalization) 0.0 0.0 0.0 0.0 0.0 0.0 0.0 0.0 0.0 0.0 0.0
Residual, including asset changes 16.5 6.2 0.6 -0.3 4.2 4.6 -0.2 -0.3 -0.2 0.7 0.0
Other Sustainability IndicatorsPV of public sector debt ... ... 77.2 82.7 89.8 95.8 91.7 87.1 81.9 67.1 53.0
of which: foreign-currency denominated ... ... 57.0 57.1 64.6 63.4 61.0 58.3 55.8 38.1 27.8of which: external ... ... 55.6 57.1 64.6 63.4 61.0 58.3 55.8 38.1 27.8
PV of contingent liabilities (not included in public sector debt) ... ... ... ... ... ... ... ... ... ... ...Gross financing need 2/ 10.3 12.2 16.0 14.4 12.0 19.1 11.4 10.4 9.4 12.6 9.9PV of public sector debt-to-revenue and grants ratio (in percent) … … 275.3 325.0 357.6 385.0 361.7 342.9 317.9 264.7 215.8PV of public sector debt-to-revenue ratio (in percent) … … 275.3 328.3 360.5 386.0 362.4 343.5 318.4 264.9 215.8
of which: external 3/ … … 198.3 226.8 259.3 255.6 240.9 230.0 216.9 150.2 113.1Debt service-to-revenue and grants ratio (in percent) 4/ 7.1 19.4 28.8 35.4 36.8 71.1 44.0 45.5 39.1 49.8 38.9Debt service-to-revenue ratio (in percent) 4/ 7.1 19.4 28.8 35.8 37.1 71.3 44.1 45.6 39.1 49.8 38.9Primary deficit that stabilizes the debt-to-GDP ratio -10.5 -9.8 -1.3 0.4 -3.3 -3.6 3.7 3.1 4.2 1.5 1.1
Key macroeconomic and fiscal assumptionsReal GDP growth (in percent) 12.3 11.6 7.8 10.8 7.4 4.4 4.2 3.8 6.2 6.4 9.2 5.7 6.9 5.8 6.5Average nominal interest rate on forex debt (in percent) 0.7 2.8 3.1 1.5 1.1 4.8 5.7 5.9 6.0 5.9 5.9 5.7 6.0 6.6 6.3Average real interest rate on domestic debt (in percent) 8.8 20.0 4.2 11.0 8.1 3.5 2.2 1.3 -0.3 2.0 2.3 1.8 1.9 2.3 2.2Real exchange rate depreciation (in percent, + indicates depreciation) -8.8 19.8 10.2 1.1 13.3 1.6 ... ... ... ... ... ... ... ... ...Inflation rate (GDP deflator, in percent) 12.8 2.6 6.0 9.7 7.6 6.6 6.9 7.1 6.5 6.2 5.3 6.4 5.5 5.8 5.5Growth of real primary spending (deflated by GDP deflator, in percent) 13.4 10.0 3.3 3.9 5.5 -10.4 -5.6 -2.2 3.3 1.2 13.0 -0.1 7.7 6.3 6.4Grant element of new external borrowing (in percent) ... ... ... … … -8.6 -13.8 -14.7 -2.4 -3.2 -4.0 -7.8 -6.7 -9.0 ...
Sources: Country authorities; and staff estimates and projections.1/ Debt data reflects general government debt (including quasi-sovereign bonds issued by DBM) only before 2013, and starts to cover SOE debt from 2013 onwards.2/ Gross financing need is defined as the primary deficit plus debt service plus the stock of short-term debt at the end of the last period. 3/ Revenues excluding grants.4/ Debt service is defined as the sum of interest and amortization of medium and long-term debt.5/ Historical averages and standard deviations are generally derived over the past 10 years, subject to data availability.
Actual Projections
Table 2. Mongolia: Public Sector Debt Sustainability Framework, Baseline Scenario, 2012-2035
(in percent of GDP, unless otherwise indicated)
12 IN
TERNATIO
NAL M
ON
ETARY FUN
D
MO
NG
OLIA
MONGOLIA
INTERNATIONAL MONETARY FUND 13
Table 3. Mongolia: Sensitivity Analysis for Key Indicators of Public Debt, 2015-2035
2015 2016 2017 2018 2019 2020 2025 2035
Baseline 83 90 96 92 87 82 67 53
A. Alternative scenarios
A1. Real GDP growth and primary balance are at historical averages 83 86 89 86 84 82 78 75A2. Primary balance is unchanged from 2015 83 93 103 105 107 108 120 153A3. Permanently lower GDP growth 1/ 83 92 100 99 97 95 103 171
B. Bound tests
B1. Real GDP growth is at historical average minus one standard deviations in 2016-2017 83 91 98 94 90 85 71 60B2. Primary balance is at historical average minus one standard deviations in 2016-2017 83 95 108 104 99 93 77 62B3. Combination of B1-B2 using one half standard deviation shocks 83 91 99 93 87 80 58 32B4. One-time 30 percent real depreciation in 2016 83 118 125 121 116 111 98 92B5. 10 percent of GDP increase in other debt-creating flows in 2016 83 101 107 103 98 92 76 61
Baseline 325 358 385 362 343 318 265 216
A. Alternative scenarios
A1. Real GDP growth and primary balance are at historical averages 325 342 357 337 329 320 308 304A2. Primary balance is unchanged from 2015 325 369 414 413 421 418 473 622A3. Permanently lower GDP growth 1/ 325 365 403 390 382 369 406 695
B. Bound tests
B1. Real GDP growth is at historical average minus one standard deviations in 2016-2017 325 361 392 370 352 328 280 243B2. Primary balance is at historical average minus one standard deviations in 2016-2017 325 379 435 409 389 362 305 252B3. Combination of B1-B2 using one half standard deviation shocks 325 362 397 367 342 312 230 128B4. One-time 30 percent real depreciation in 2016 325 469 503 477 458 431 388 375B5. 10 percent of GDP increase in other debt-creating flows in 2016 325 402 430 404 385 358 301 249
Baseline 35 37 71 44 45 39 50 39
A. Alternative scenarios
A1. Real GDP growth and primary balance are at historical averages 35 35 63 38 39 35 44 38A2. Primary balance is unchanged from 2015 35 37 72 46 49 45 67 82A3. Permanently lower GDP growth 1/ 35 37 74 47 49 44 65 90
B. Bound tests
B1. Real GDP growth is at historical average minus one standard deviations in 2016-2017 35 37 72 45 46 40 51 42B2. Primary balance is at historical average minus one standard deviations in 2016-2017 35 37 72 48 50 43 55 43B3. Combination of B1-B2 using one half standard deviation shocks 35 36 68 44 46 39 47 29B4. One-time 30 percent real depreciation in 2016 35 40 94 54 57 50 70 63B5. 10 percent of GDP increase in other debt-creating flows in 2016 35 37 74 48 49 43 54 43
Sources: Country authorities; and staff estimates and projections.1/ Assumes that real GDP growth is at baseline minus one standard deviation divided by the square root of the length of the projection period.2/ Revenues are defined inclusive of grants.
PV of Debt-to-GDP Ratio
Projections
PV of Debt-to-Revenue Ratio 2/
Debt Service-to-Revenue Ratio 2/
MONGOLIA
14 INTERNATIONAL MONETARY FUND
Table 4. Mongolia: Sensitivity Analysis for Key Indicators of Public and Publicly Guaranteed External Debt, 2015-2035
(in percent)
2015 2016 2017 2018 2019 2020 2025 2035
Baseline 57 65 63 61 58 56 38 28
A. Alternative Scenarios
A1. Key variables at their historical averages in 2015-2035 1/ 57 61 51 48 46 49 36 0A2. New public sector loans on less favorable terms in 2015-2035 2 57 65 66 64 62 60 46 42
B. Bound Tests
B1. Real GDP growth at historical average minus one standard deviation in 2016-2017 57 63 63 60 58 55 37 27B2. Export value growth at historical average minus one standard deviation in 2016-2017 3/ 57 67 73 70 67 64 45 30B3. US dollar GDP deflator at historical average minus one standard deviation in 2016-2017 57 72 83 80 77 73 50 36B4. Net non-debt creating flows at historical average minus one standard deviation in 2016-2017 4/ 57 78 88 85 81 78 57 33B5. Combination of B1-B4 using one-half standard deviation shocks 57 68 64 62 59 56 38 28B6. One-time 30 percent nominal depreciation relative to the baseline in 2016 5/ 57 89 88 85 81 77 53 38
Baseline 123 152 170 167 151 134 135 176
A. Alternative Scenarios
A1. Key variables at their historical averages in 2015-2035 1/ 123 143 138 131 119 117 128 0A2. New public sector loans on less favorable terms in 2015-2035 2 123 152 176 175 161 144 163 270
B. Bound Tests
B1. Real GDP growth at historical average minus one standard deviation in 2016-2017 123 148 167 163 148 130 131 171B2. Export value growth at historical average minus one standard deviation in 2016-2017 3/ 123 175 230 226 205 181 189 220B3. US dollar GDP deflator at historical average minus one standard deviation in 2016-2017 123 148 167 163 148 130 131 171B4. Net non-debt creating flows at historical average minus one standard deviation in 2016-2017 4/ 123 183 235 232 211 186 201 210B5. Combination of B1-B4 using one-half standard deviation shocks 123 147 139 136 123 108 108 143B6. One-time 30 percent nominal depreciation relative to the baseline in 2016 5/ 123 148 167 163 148 130 131 171
Baseline 227 259 256 241 230 217 150 113
A. Alternative Scenarios
A1. Key variables at their historical averages in 2015-2035 1/ 227 244 207 188 181 191 143 0A2. New public sector loans on less favorable terms in 2015-2035 2 227 260 264 253 245 234 181 173
B. Bound Tests
B1. Real GDP growth at historical average minus one standard deviation in 2016-2017 227 254 253 238 228 214 148 111B2. Export value growth at historical average minus one standard deviation in 2016-2017 3/ 227 271 293 277 265 250 179 120B3. US dollar GDP deflator at historical average minus one standard deviation in 2016-2017 227 291 336 317 302 284 196 147B4. Net non-debt creating flows at historical average minus one standard deviation in 2016-2017 4/ 227 313 353 334 321 302 223 135B5. Combination of B1-B4 using one-half standard deviation shocks 227 274 260 245 233 220 150 115B6. One-time 30 percent nominal depreciation relative to the baseline in 2016 5/ 227 359 355 335 320 301 208 156
PV of debt-to-exports ratio
PV of debt-to-revenue ratio
PV of debt-to GDP ratio
Projections
MONGOLIA
INTERNATIONAL MONETARY FUND 15
Table 4. Mongolia: Sensitivity for Key Indicators of Public and Publicly Guaranteed External Debt, 2015-2035 (continued)
(in percent)
Baseline 7 8 33 12 12 9 23 21
A. Alternative Scenarios
A1. Key variables at their historical averages in 2015-2035 1/ 7 8 28 10 9 7 16 0A2. New public sector loans on less favorable terms in 2015-2035 2 7 8 32 12 12 9 20 29
B. Bound Tests
B1. Real GDP growth at historical average minus one standard deviation in 2016-2017 7 8 33 12 12 9 23 21B2. Export value growth at historical average minus one standard deviation in 2016-2017 3/ 7 9 39 16 16 12 30 27B3. US dollar GDP deflator at historical average minus one standard deviation in 2016-2017 7 8 33 12 12 9 23 21B4. Net non-debt creating flows at historical average minus one standard deviation in 2016-2017 4/ 7 8 35 16 15 12 31 26B5. Combination of B1-B4 using one-half standard deviation shocks 7 8 28 10 10 8 20 17B6. One-time 30 percent nominal depreciation relative to the baseline in 2016 5/ 7 8 33 12 12 9 23 21
Baseline 12 14 49 18 18 15 26 13
A. Alternative Scenarios
A1. Key variables at their historical averages in 2015-2035 1/ 12 13 42 14 13 11 18 0A2. New public sector loans on less favorable terms in 2015-2035 2 12 14 47 18 18 15 22 19
B. Bound Tests
B1. Real GDP growth at historical average minus one standard deviation in 2016-2017 12 14 50 18 18 15 26 13B2. Export value growth at historical average minus one standard deviation in 2016-2017 3/ 12 14 50 20 20 17 29 15B3. US dollar GDP deflator at historical average minus one standard deviation in 2016-2017 12 16 66 24 24 20 35 18B4. Net non-debt creating flows at historical average minus one standard deviation in 2016-2017 4/ 12 14 52 23 23 20 34 17B5. Combination of B1-B4 using one-half standard deviation shocks 12 14 53 19 19 15 28 14B6. One-time 30 percent nominal depreciation relative to the baseline in 2016 5/ 12 20 70 25 26 21 37 19
Memorandum item:Grant element assumed on residual financing (i.e., financing required above baseline) 6/ -14 -14 -14 -14 -14 -14 -14 -14
Sources: Country authorities; and staff estimates and projections.
1/ Variables include real GDP growth, growth of GDP deflator (in U.S. dollar terms), non-interest current account in percent of GDP, and non-debt creating flows. 2/ Assumes that the interest rate on new borrowing is by 2 percentage points higher than in the baseline., while grace and maturity periods are the same as in the baseline.3/ Exports values are assumed to remain permanently at the lower level, but the current account as a share of GDP is assumed to return to its baseline level after the shock (implicitly assumingan offsetting adjustment in import levels). 4/ Includes official and private transfers and FDI.5/ Depreciation is defined as percentage decline in dollar/local currency rate, such that it never exceeds 100 percent.6/ Applies to all stress scenarios except for A2 (less favorable financing) in which the terms on all new financing are as specified in footnote 2.
Debt service-to-revenue ratio
Debt service-to-exports ratio
Statement by the Staff Representative on Mongolia April 3, 2015
This statement summarizes additional information on economic developments and policies that have become available since the staff report was issued. This information does not alter the thrust of the staff appraisal.
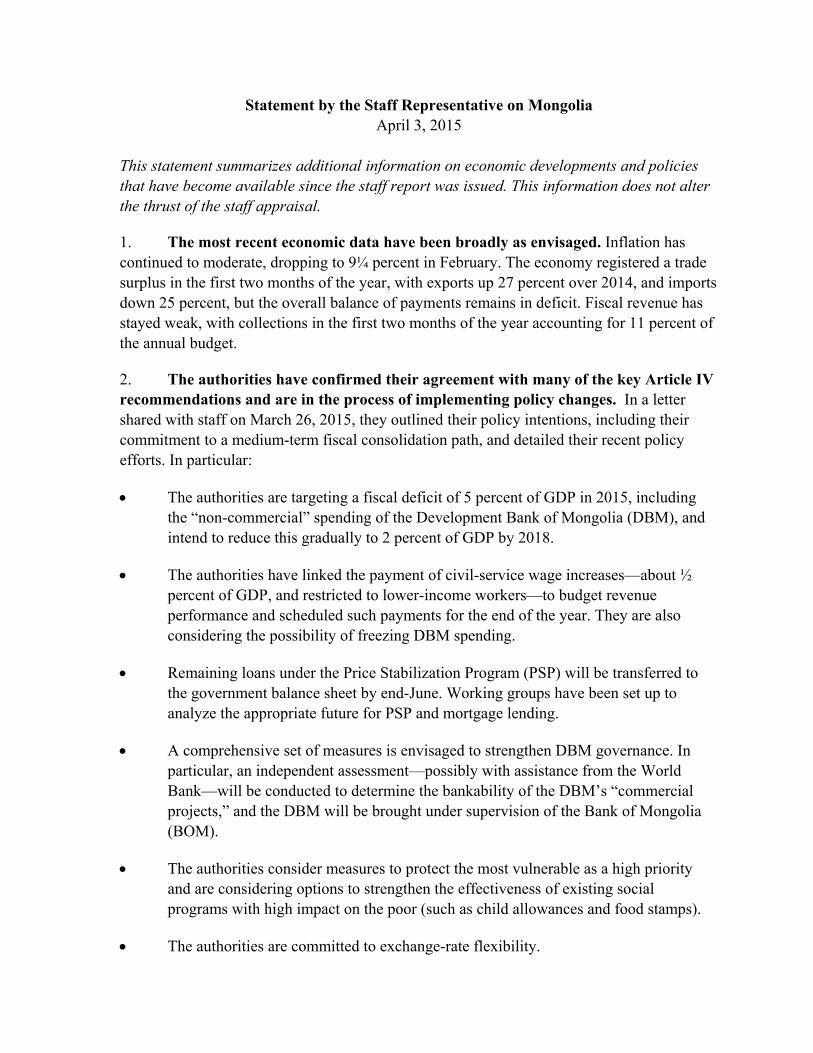
1. The most recent economic data have been broadly as envisaged. Inflation has continued to moderate, dropping to 9¼ percent in February. The economy registered a trade surplus in the first two months of the year, with exports up 27 percent over 2014, and imports down 25 percent, but the overall balance of payments remains in deficit. Fiscal revenue has stayed weak, with collections in the first two months of the year accounting for 11 percent of the annual budget.
2. The authorities have confirmed their agreement with many of the key Article IV recommendations and are in the process of implementing policy changes. In a letter shared with staff on March 26, 2015, they outlined their policy intentions, including their commitment to a medium-term fiscal consolidation path, and detailed their recent policy efforts. In particular:
The authorities are targeting a fiscal deficit of 5 percent of GDP in 2015, including the “non-commercial” spending of the Development Bank of Mongolia (DBM), and intend to reduce this gradually to 2 percent of GDP by 2018.
The authorities have linked the payment of civil-service wage increases—about ½ percent of GDP, and restricted to lower-income workers—to budget revenue performance and scheduled such payments for the end of the year. They are also considering the possibility of freezing DBM spending.
Remaining loans under the Price Stabilization Program (PSP) will be transferred to the government balance sheet by end-June. Working groups have been set up to analyze the appropriate future for PSP and mortgage lending.
A comprehensive set of measures is envisaged to strengthen DBM governance. In particular, an independent assessment—possibly with assistance from the World Bank—will be conducted to determine the bankability of the DBM’s “commercial projects,” and the DBM will be brought under supervision of the Bank of Mongolia (BOM).
The authorities consider measures to protect the most vulnerable as a high priority and are considering options to strengthen the effectiveness of existing social programs with high impact on the poor (such as child allowances and food stamps).
The authorities are committed to exchange-rate flexibility.
2
In order to strengthen the banking system, the BOM intends, over 2015–17, to: increase loan loss provisions; tighten requirements for recognition of nonperforming loans; increase the minimum paid-in capital of banks; raise the Tier-1 capital adequacy ratio (CAR) to 10½ percent for systemically important banks; incorporate PSP loans into banks’ CAR calculations; increase sectoral risk weights; and impose additional capital requirements on banks with higher risk profiles.
The authorities are working on a range of steps, including tax measures, to improve the investment climate.
3. The authorities’ efforts to strengthen policies are welcome, although additional steps will be needed, and full and early implementation will be critical.
Press Release No. 15/169
FOR IMMEDIATE RELEASE
IMF Executive Board Concludes 2015 Article IV Consultation with Mongolia
On April 3, 2015, the Executive Board of the International Monetary Fund (IMF) concluded the 2015 Article IV Consultation1 with Mongolia.
Medium- to long-term prospects are promising given Mongolia’s large natural resources. In the near term, however, the country continues to face balance-of-payments (BOP) pressures on account of low foreign direct investment (FDI) and weak commodity prices, as well as expansionary macro policies. Imports have now started to taper off, and, with the first phase of the Oyu Tolgoi copper and gold mine now in operation, exports have picked up. The trade balance has thus improved, but with FDI and other financial-account flows still depressed, the overall BOP remains weak. In addition, public debt has risen sharply, and the banking sector should be watched closely in the wake of the rapid credit expansion over the past two years. Barring a change in policies and/or major new developments in the real economy, these trends are likely to continue. Risks are to the downside, and relate to possible difficulties in securing agreement on major investment projects, as well as to the possibilities of a further slowdown in China or a surge in global financial market volatility. Recognizing these challenges, the new government has already taken some policy action. It has implemented a “Comprehensive Macro Adjustment Plan” which targets a substantial reduction in the fiscal deficit, phases out some of the Bank of Mongolia’s unconventional easing programs, and introduces a number of structural measures to boost exports and substitute for imports. However, additional measures—now under discussion—are needed to underpin the fiscal deficit targets, strengthen monetary and banking-sector policies, and ensure the most vulnerable are protected from the impact of the necessary macro adjustment. Executive Board Assessment
Executive Directors noted that Mongolia’s economic prospects remain promising over the medium to long term given its natural resource wealth, although the country faces substantial macroeconomic challenges in the near term. Directors welcomed the policy adjustment envisaged by the authorities and called for further adjustment to strengthen the balance of payments and public finances, safeguard financial stability, and strengthen social safety nets. 1 Under Article IV of the IMF's Articles of Agreement, the IMF holds bilateral discussions with members, usually every year. A staff team visits the country, collects economic and financial information, and discusses with officials the country's economic developments and policies. On return to headquarters, the staff prepares a report, which forms the basis for discussion by the Executive Board. At the conclusion of the discussion, the Managing Director, as Chairman of the Board, summarizes the views of Executive Directors, and this summary is transmitted to the country's authorities. An explanation of any qualifiers used in summings up can be found here: http://www.imf.org/external/np/sec/misc/qualifiers.htm.
International Monetary Fund Washington, D.C. 20431 USA
Directors agreed that an ambitious consolidation approach would be needed to strengthen the fiscal position. They welcomed the steps already taken and the authorities’ readiness to undertake additional fiscal reforms. Directors saw scope for further cuts in public spending, including that of the Development Bank of Mongolia (DBM), complemented with measures to raise revenue, protect the poor, and improve the effectiveness of subsidies and other social programs. They looked forward to the passage of a supplementary budget that includes these measures. Directors also supported the authorities’ intention to phase out unconventional easing programs by the central bank and encouraged them to bring all DBM spending onto the budget. Directors agreed on the need for some monetary tightening, while ensuring that banks remain adequately liquid, to help control credit growth and strengthen the balance of payments. They also encouraged the central bank to limit deficit financing. These steps should be complemented with continued efforts to enhance governance at the central bank and the DBM. Noting the role of exchange rate flexibility as a shock absorber for the economy, Directors agreed that foreign exchange intervention should be limited to smoothing excessive volatility. Directors recommended a comprehensive approach to addressing risks in the banking system. They considered it a priority to bolster banks’ provisions and capital buffers, eliminate forbearance, strengthen risk recognition, and enhance supervisory and crisis preparedness frameworks. Directors commended the authorities for the progress in strengthening the regime against money laundering and terrorism financing. Directors supported ongoing efforts to foster high, inclusive growth, by improving the investment climate, enhancing competitiveness, and promoting economic diversification. More broadly, they emphasized that prudent management of natural resources is critically important for lasting growth and inter-generational equity. It is expected that the next Article IV consultation with Mongolia will be held on the standard 12-month cycle.
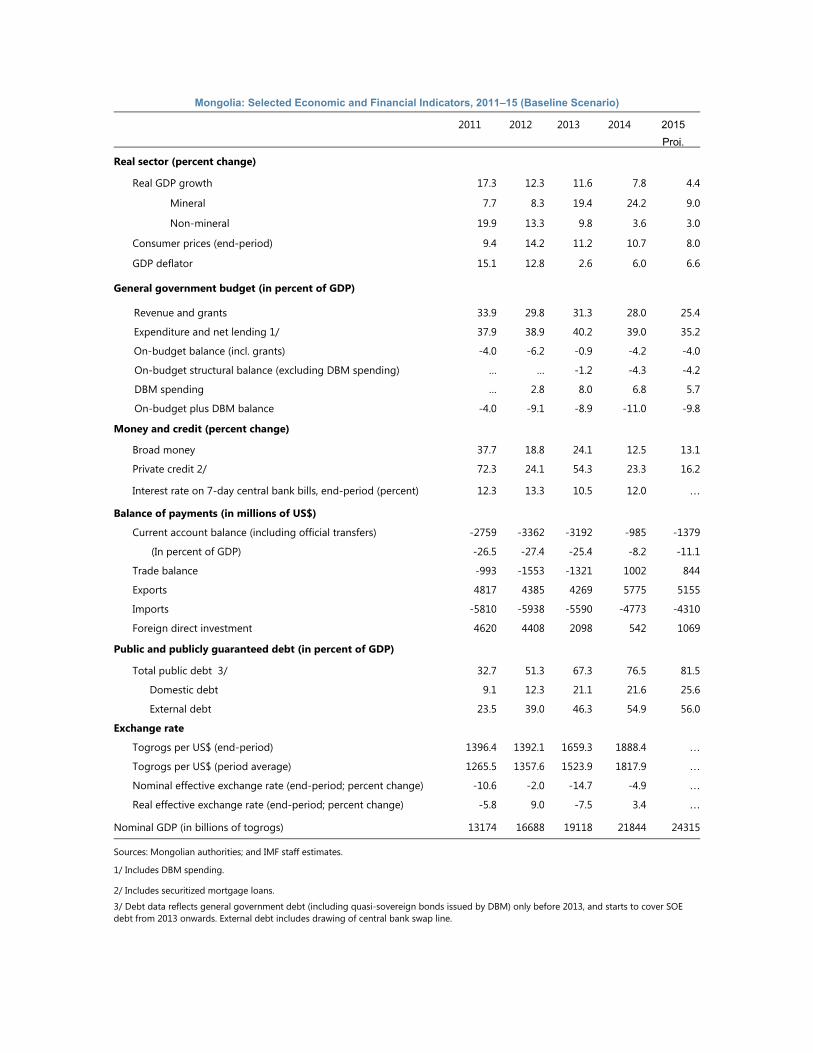
Mongolia: Selected Economic and Financial Indicators, 2011–15 (Baseline Scenario)
2011 2012 2013 2014 2015
Proj.
Real sector (percent change)
Real GDP growth 17.3 12.3 11.6 7.8 4.4
Mineral 7.7 8.3 19.4 24.2 9.0
Non-mineral 19.9 13.3 9.8 3.6 3.0
Consumer prices (end-period) 9.4 14.2 11.2 10.7 8.0
GDP deflator 15.1 12.8 2.6 6.0 6.6
General government budget (in percent of GDP)
Revenue and grants 33.9 29.8 31.3 28.0 25.4
Expenditure and net lending 1/ 37.9 38.9 40.2 39.0 35.2
On-budget balance (incl. grants) -4.0 -6.2 -0.9 -4.2 -4.0
On-budget structural balance (excluding DBM spending) … … -1.2 -4.3 -4.2
DBM spending … 2.8 8.0 6.8 5.7
On-budget plus DBM balance -4.0 -9.1 -8.9 -11.0 -9.8
Money and credit (percent change)
Broad money 37.7 18.8 24.1 12.5 13.1
Private credit 2/ 72.3 24.1 54.3 23.3 16.2
Interest rate on 7-day central bank bills, end-period (percent) 12.3 13.3 10.5 12.0 …
Balance of payments (in millions of US$)
Current account balance (including official transfers) -2759 -3362 -3192 -985 -1379
(In percent of GDP) -26.5 -27.4 -25.4 -8.2 -11.1
Trade balance -993 -1553 -1321 1002 844
Exports 4817 4385 4269 5775 5155
Imports -5810 -5938 -5590 -4773 -4310
Foreign direct investment 4620 4408 2098 542 1069
Public and publicly guaranteed debt (in percent of GDP)
Total public debt 3/ 32.7 51.3 67.3 76.5 81.5
Domestic debt 9.1 12.3 21.1 21.6 25.6
External debt 23.5 39.0 46.3 54.9 56.0
Exchange rate
Togrogs per US$ (end-period) 1396.4 1392.1 1659.3 1888.4 …
Togrogs per US$ (period average) 1265.5 1357.6 1523.9 1817.9 …
Nominal effective exchange rate (end-period; percent change) -10.6 -2.0 -14.7 -4.9 …
Real effective exchange rate (end-period; percent change) -5.8 9.0 -7.5 3.4 …
Nominal GDP (in billions of togrogs) 13174 16688 19118 21844 24315
Sources: Mongolian authorities; and IMF staff estimates.
1/ Includes DBM spending.
2/ Includes securitized mortgage loans.
3/ Debt data reflects general government debt (including quasi-sovereign bonds issued by DBM) only before 2013, and starts to cover SOE debt from 2013 onwards. External debt includes drawing of central bank swap line.
Statement by Barry Sterland, Executive Director for Mongolia and Dorjkhand Togmid Advisor to Executive Director
April 3, 2015
On behalf of the Mongolian authorities, we would like to thank the mission team for their candid policy consultation and the effective engagement. The current Government was formed in November 2014 and has set about dealing with the macroeconomic challenges it inherited. Mongolian Authorities are in broad agreement with staff’s analysis and policy recommendations, especially on the strengthening fiscal position, maintaining prudent monetary policy, bolstering financial stability and improving the investment climate. The Authorities have commenced concrete actions to adjust macroeconomic and financial policies in response to all the broad areas of weakness identified by the staff. They express their willingness to address the macroeconomic and development challenges facing Mongolia through continued cooperation with the Fund. Economic Outlook Mongolia has made strong development progress in recent years, retains enormous long-run economic potential, but faces challenges in ensuring sustained and stable growth in the short to medium-term. Economic growth of Mongolia remained at 7.8 percent and per capita income reached $4,000 in 2014, but growth is expected to slow in the next few years. The economy remains vulnerable to boom-bust cycles and has faced sharp declines in FDI over the past few years. Mongolia faced a severe balance of payment shock in late 2012 throughout 2013 and 2014 though measures were taken to achieve a soft landing. Commodities super cycle turned down, capital flows toward emerging markets and developing economies reversed, and net foreign direct investment to GDP ratio substantially declined from 45 percent to only 5 percent over the last three years. The balance of payment shock was particularly intense in 2013 though authorities consider the impacts on trade, the current account, and economic activity were significantly lessened in 2014 as a result of policy adjustments. Real GDP growth gradually slowed down from 12.3 percent in 2012 to 11.6 percent in 2013 and 7.8 percent in 2014. Inflation has decreased gradually in past years and appears broadly under control, and actions have been taken to slow credit and money growth. Annual CPI inflation decreased from 14.0 percent in 2012 to 9.3 percent as of February 2015. Supply-driven inflationary pressure has been substantially decreased. The Bank of Mongolia (BOM) has gradually tightened its monetary policy stance by increasing the policy interest rate twice, 1.5 percentage points in July 2014 and 1.0 percentage point to 13 percent in January 2015. Real interest rates are now strongly positive and money and credit growth have slowed significantly. These decisions have reduced aggregate demand and the current account deficit, curbed inflationary pressure, and promoted macroeconomic and financial stability.
2
Uncertainty in the balance of payment outlook still remains a concern, and the authorities are pursuing a range of options to reduce risks on this front. The baseline forecast indicates that overall balance of payment could face a 1.4 billion dollars financing deterioration in 2015 due to mainly unfavorable external environment for the mineral exports and a sharp fall of the FDI inflows in the past two years. We note that recent import data has been weaker than the assumptions of this baseline which, if this weakness persists, may assist in ameliorating financing needs. However, authorities accept that a range of actions must be explored to deal with this challenge. They are working closely with a range of international financial organizations and bilateral partners on the possible options for external financing to fill this gap, including the extension of the local currency swap facility between the BOM and PBOC that has been playing a crucial role in mitigating the impacts of the shocks. The authorities have indicated that the PBOC has reaffirmed that it is fully committed to continuing the facility and willing to extend the swap line. Ongoing close consultation with the IMF and responsiveness to its recommendations will assist in this process of engagement with other financing partners. Furthermore, efforts are ongoing to advance negotiations on major projects with a significant potential impact on development and FDI flows. Finally, authorities stand ready to take additional corrective action, if required, to deal with unfolding risks, by adjusting import-intensive spending or fiscal policy. Fiscal Policy The authorities are committed to significant reductions in structural deficit targets, including limiting off-budget and reducing quasi-fiscal operations and integrating them into the Budget. In order to strengthen Mongolia’s fiscal position, the authorities have secured Parliamentary approval of the Amendment to the Fiscal Stability Law (FSL), Debt Management Law (DML), and the Comprehensive Macroeconomic Adjustment Program (CMAP). As a result, the authorities will achieve a 2015 fiscal deficit of 5 percent of GDP, including non-commercial Development Bank of Mongolia (DBM) investment, decreasing the deficit by 1 percentage point for each year to reach the deficit target of 2 percent of GDP by 2018 and implement a cost-saving regime in the budget through prioritizing spending. Concrete measures have been introduced to cut budget expenditures and increase the revenue in line with these fiscal objectives. Budget resources earmarked for civil servants’ wage increase have been decreased by 60 percent and targeted at maintaining real wages of low wage earners, equivalent to a reduction in spending by 0.6 percent of GDP. Authorities are considering ways of targeting non-social welfare related subsidies. On the revenue side, the authorities increased the customs duties and excise tax rates on imported oil, in response to the recent declines of oil prices. The Government of Mongolia has started implementing recommendations of international financial organizations to limit off-budget and quasi-fiscal operations and
3
integrate them to the budget. The parliament has agreed to the integration of off-budget ‘quasi fiscal’ spending into the central budget. This includes several programs currently operated by the Bank of Mongolia. A comprehensive set of actions are being undertaken to improve the legal environment and governance structure of the DBM to match international principles and standards and to ensure the successful operation of the bank in international financial markets. As a first step, the authorities are planning to transfer non-commercial lending activities in the pipeline of the DBM to the budget after conducting an independent assessment on the portfolio. While commercial DBM spending is not being fully integrated with central budget at this stage controls are being greatly enhanced to ensure these investments are driven by market considerations. The Minister of Finance will now approve financing of projects and activities included in the 2015 budget, to ensure consistency with the budget deficit and macroeconomic conditions (including BOP requirements). Furthermore, the DBM shall now obtain the Finance Minister’s opinion when taking on a direct or contingent liability or any other explicit or implicit financial obligations regarding the consistency of any such liabilities with the FSL. Controls are being put in place to prevent political intervention in decision making processes, and more generally, improve governance and oversight. Another key element regarding control is that the Finance Minister and the Governor of the Bank of Mongolia will jointly approve supervision rules on DBM operations, effectively putting the DBM under the BOM supervision. Amendments along these lines will be introduced to Parliament in the Spring Session. The authorities are also investigating the potential to transfer key social programs currently in the Future Heritage Fund to the central budget. The authorities will keep fiscal settings under review to ensure public debt is managed appropriately. The Medium-term Debt Management Strategy and the Comprehensive External Debt Servicing Plan have been revised in accordance with the newly adopted Debt Management Law and the CMAP was approved by the Financial Stability Committee on March 13 of this year. Under this approach, the authorities will initiate active debt and liability management operations to ensure further debt is serviced or rolled over in a way that is consistent with macroeconomic stability. The authorities are taking step to underpin Mongolia’s long time fiscal future through the establishment of a sovereign wealth fund. The draft Law on Future Heritage Fund is expected to be reviewed and passed during the 2015 Spring Session of the Parliament. The fund would be designed consistent with international best practices. The aim is to ‘ring fence’ a certain portion of mining revenues to support future development needs, while also supporting the realization of counter-cyclical policies. Monetary and Exchange Rate Policy Supply-driven inflationary pressure has been substantially decreased and inflation appears broadly under control. There has been a positive change in the composition of inflation since
4
2013, with ‘supply shock inflation’ being significantly reduced. The BOM considers that this positive development is due to the PSP and a range of measures reducing headline inflation. The inflation outlook consistent with the Bank of Mongolia’s medium-term target of 7 percent, and real interest rates are now strongly positive. Monetary policy will continue to be managed in a prudent way to control inflationary pressures.
The BOM considers unconventional monetary policy measures have assisted in achieving a soft landing and is now phasing out programs as planned in the context of the broader macroeconomic adjustment program. The BOM considers its unconventional monetary policy measures, including the price stabilization program (PSP), as instrumental in achieving a soft-landing for the economy, mitigating impacts in the balance of payment shock on the economy and risks of a potential economic crisis, reducing supply-driven pressures on inflation, and ensuring financial sector stability. With the implementation of the CMAP, measures are being taken to normalize unconventional aspects of the monetary policy and the BOM has been intentionally phasing out the program as planned. Remaining PSP loans shall be transferred to the Government by the end of the 1st half of 2015, and this process has already commenced. The Government and the BOM are jointly examining the Sustainable Mortgage Financing Program including how it aligns with long term efforts to boost domestic savings and possible response options. The Bank of Mongolia remains committed to a flexible exchange rate regime. If necessary, the Bank of Mongolia intends to intervene only for the purpose of smoothing out excessive exchange rate volatility. The Bank of Mongolia will look for opportunities to enhance monetary policy decision making frameworks at an appropriate time. Structural Reforms The authorities are committed to improving the investment climate to assist growth and contribute to the resolution of BOP challenges. The authorities have submitted Parliament draft amendments to simplify tax laws and enhance their contribution to private sector growth, including by reducing inconsistencies and ambiguities. The authorities proposed amendments to the VAT to reduce the informal sector, support small businesses, and simplify the administrative procedures. They have also prepared an amendment to the corporate income tax law to support non-mining business activities. Financial Sector The Bank of Mongolia is taking action to strengthen the banking sector, enhance banking system safety, proactively address potential systemic risks, and ensure financial stability. The Bank of Mongolia received IMF technical assistance (TA) on enhancing systemic
5
oversight and crisis preparedness capabilities in February 2015. The Bank of Mongolia has already started implementing the recommended actions provided by the TA by reflecting them in its Medium term strategy on banking supervision, including phasing in measures to ensure better risky loan recognition, improve provisioning and capital buffers, and improve risk weights among other actions. These actions will be implemented progressively. Conclusion The Mongolian authorities are committed to taking decisive action to ensure macroeconomic stability, thus laying a sound basis for longer term development. They are implementing measures across a wide range of areas, including those identified by Fund staff, and understand the need to further transition policy if circumstances require. Authorities greatly value ongoing engagement with the Fund and will keep staff recommendations under close review.