Embed Size (px)
Citation preview

1
Staffing Statistics
including Equality Act 2010
publication of equality information
December 2015
Produced by Human Resources
2
Introduction This is the eighth annual staffing statistics report produced by HR. The purpose of the report is to provide managers and other users with up to date information about UWE’s workforce profile and to highlight emerging trends. Managers will be able to use this information to identify where we need to make improvements. UWE has a longstanding commitment to the promotion of equality and undertakes a wide range of activities to promote better outcomes and meet the needs of different groups of staff. In April 2012 we published our single equality scheme 2012-15 which includes a commitment to increase our workforce diversity by increasing the numbers of black and minority ethnic and disabled staff, and women at a senior level. This report provides the information needed to monitor progress; it also provides a rich source of data for managers carrying out equality analysis. The Single Equality Scheme can be accessed by going to this page on the UWE website: www.uwe.ac.uk/equalityanddiversity. The data is taken from a snapshot of the staff population on 31 December 2015. The report is based on data held in the University’s HR payroll system (SAP). The SAP database is populated with information supplied by new staff on their application forms; we then update the database with information supplied by current employees in response to periodic data surveys. Our latest equality and diversity data survey was carried out in March 2014. This report should be read in conjunction with results from the 2014 staff survey available in the HR intranet. I hope you find the report interesting and informative. If you have any ideas for how it might be improved, or have any queries relating to the data and its analysis, then please contact Lesley Donnithorne in the HR Systems, Information and Grading Team ([email protected]) or Valerie Russell Emmott in the Equality and Diversity Unit ([email protected]). Debbie England HR Director April 2016
3
Index The report is separated into sections covering different topic areas. The main part of the document provides graphs and commentaries; an appendix contains the detailed data tables. Section 1 – Staff Employment Page Staff/students full time equivalent (FTE) ratios………………………………………… 6 Total UWE expenditure and staff costs…………………………………………………… 6 Staff by faculties or services……………………………………………………………….. 7 Staff by employee group……………………………………………………………………. 7 GENDER: Employee group by gender …………………………………………………. 8 Gender pay gap………………………………………………………………. 8 Female staff in senior academic/management grades…………………… 9 Female staff in senior professional services grades……………………… 9 Family friendly leave………………………………………………………….. 10 Child care vouchers…………………………………………………………… 10 ETHNICITY : Black and minority ethnic staff, overall and in senior grades……………. 11 Black and minority ethnic staff by ethnic origin……………………………. 12 Staff by nationality…………………………………………………………….. 12 DISABILITY: Disabled staff, overall and in senior grades………………………………. 13 AGE: Staff by age band by gender……………………………………………………….. 14 LGB: Staff by sexual orientation………………………………………………………….. 14 RELIGION: Staff by religion and belief…………………………………………………… 14 TRANS/TRANSGENDER: Staff by trans/transgender …………………………………. 15 CONTRACT TERM (permanent, fixed term, temporary) Staff by contract term by equality group……………………………………. 15 CONTRACT MODE (full time, part time) Staff by contract mode by equality group…………………………………... 16

4
Section 2 – Staff Recruitment Success rates by equality group………………………………………………………….. 17 Temporary Staff Unit recruitment success rates by equality group…………………… 18 Internal candidate success rates by equality group…………………………………….. 19 Section 3 – Leavers Turnover rates………………………………………………………………………………. 20 Reasons for leaving………………………………………………………………………… 20 Section 4 – Staff Development and Career Progression Internal training attendances by equality group…………………………………………. 21 Career progressions by equality group…………………………………………………… 21 Section 5 – Formal Procedures Staff grievances……………………………………………………………………………… 22 Staff disciplinary cases……………………………………………………………………… 22 Section 6 – Sickness Absence UWE sickness rates overall and by equality group……………………………………… 23 Reasons for sickness absence……………………………………………………………. 24 Section 7 – Employee Assistance Programme (EAP) Use of EAP Services……………………………………………………………………….. 24 Section 8 – Benchmark Performance Indicators Comparisons with other Universities and UWE targets…………………………………. 25
5
Appendix – Data Tables Section 1 – Staff Employment Page TABLE 1 - Staff headcounts and FTEs by faculty/service………………………………… 26 TABLE 2 - Employee group and grade by equality group………………………………… 27 TABLE 3 - Age by gender…………………………………………………………………….. 30 TABLE 4 - Sexual orientation………………………………………………………………… 30 TABLE 5 - Religion and belief ……………………………………………………………….. 30 TABLE 6 - Trans/transgender………………………………………………………………… 30 TABLE 7 - Ethnic origin ……………………………………………………………………….. 31 TABLE 8 - Nationality………………………………………………………………………….. 31 TABLE 9 - Family friendly leave………………………………………………………………. 32 TABLE 10 - Child care vouchers……………………………………………………………….. 32 TABLE 11 - Contract type by equality group………………………………………………….. 33 TABLE 12 - Mode of employment by equality group…………………………………………. 33 Section 2 – Staff Recruitment TABLE 13 - Recruitment by equality group……………………………………………………. 34 TABLE 14 - Recruitment to temporary staff unit by equality group…………………………. 35 TABLE 15 - Internal candidate recruitment by equality group……………………………….. 36 Section 3 – Leavers TABLE 16 - Leavers by equality group…………………………………………………………. 37 TABLE 17 - Reasons for leaving………………………………………………………………… 38 Section 4 – Staff Development and Career Progression TABLE 18 - Internal training attendance by equality group………………………………….. 39 TABLE 19 - Career progression by equality group…………………………………………… 39 TABLE 20 - Career progression by type …………………………………………………….. 40 TABLE 21 - Gender pay gap……………………………………………………………………. 40 Section 5 – Formal Procedures TABLE 22 - Staff grievances by equality group……………………………………………….. 41 TABLE 23 - Staff disciplinary cases by type by equality group……………………………… 41 Section 6 – Sickness Absence TABLE 24 - Sickness rates by faculty/service…………………………………………………. 42 TABLE 25 - Sickness rates by equality group…………………………………………………. 43 TABLE 26 - Reasons for sickness absence…………………………………………………… 44 Section 7 – Employee Assistance Programme (EAP) TABLE 27 - Use of EAP services………………………………………………………………... 45
6
Section 1 – Staff Employment
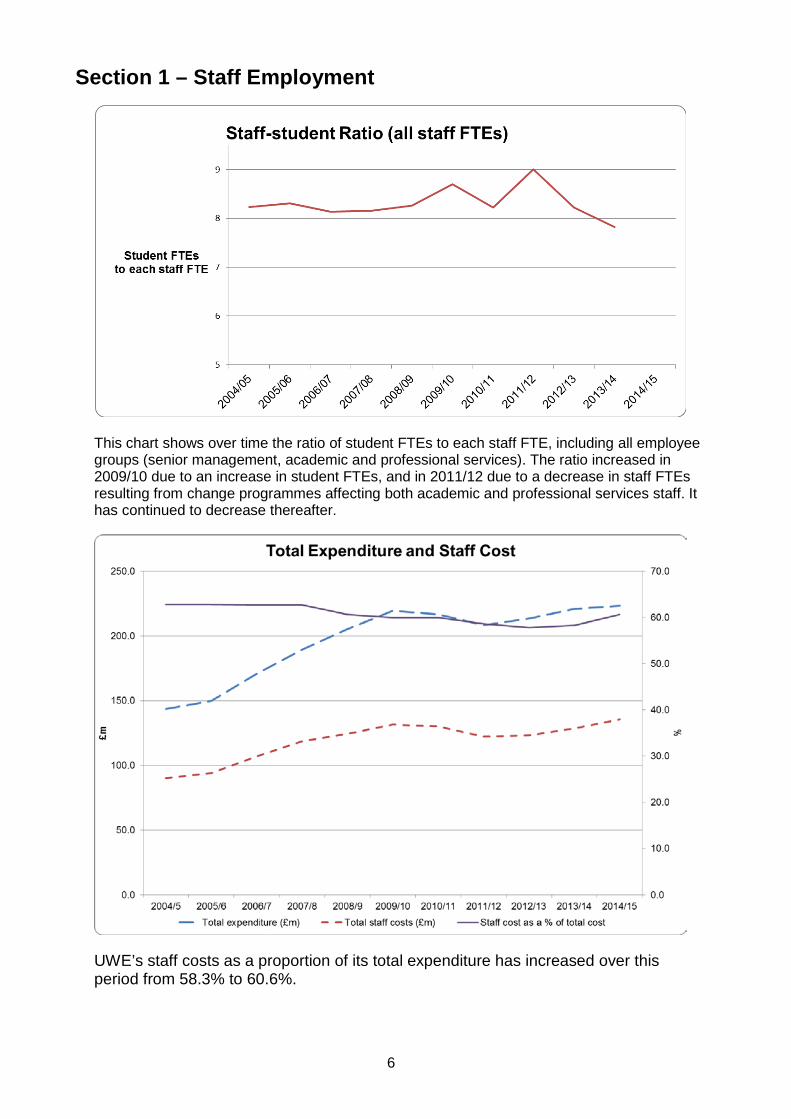
This chart shows over time the ratio of student FTEs to each staff FTE, including all employee groups (senior management, academic and professional services). The ratio increased in 2009/10 due to an increase in student FTEs, and in 2011/12 due to a decrease in staff FTEs resulting from change programmes affecting both academic and professional services staff. It has continued to decrease thereafter.
UWE’s staff costs as a proportion of its total expenditure has increased over this period from 58.3% to 60.6%.
7
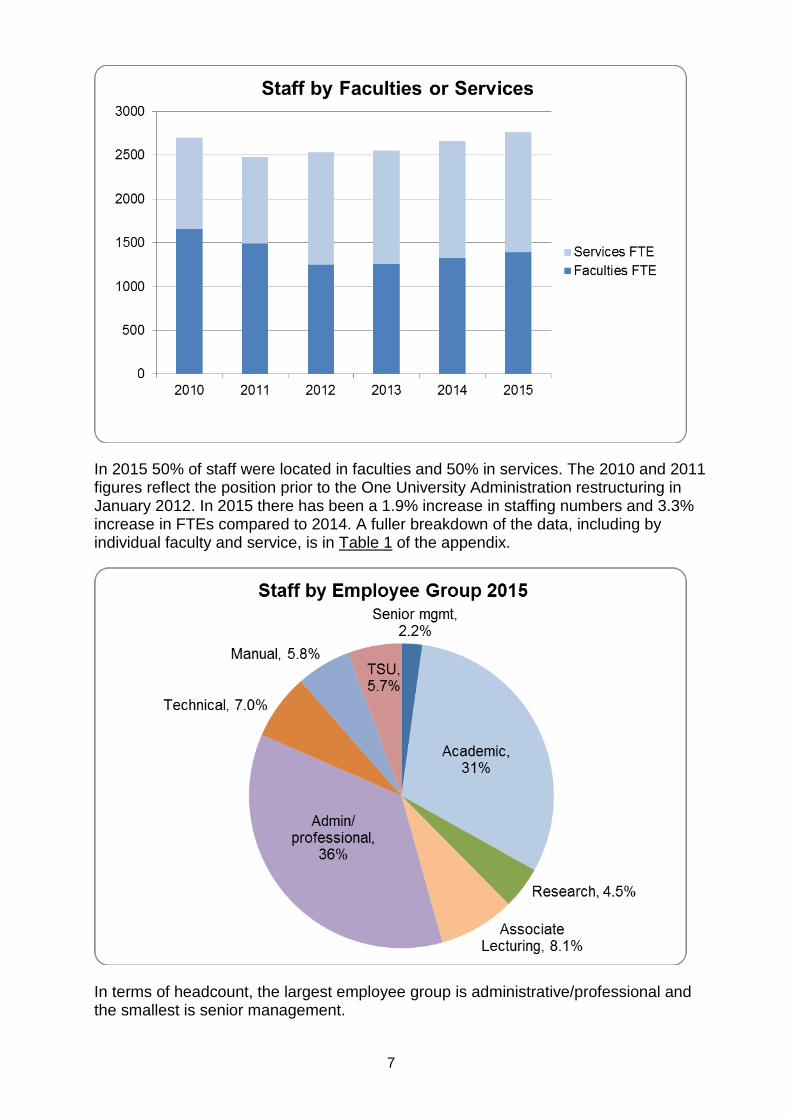
In 2015 50% of staff were located in faculties and 50% in services. The 2010 and 2011 figures reflect the position prior to the One University Administration restructuring in January 2012. In 2015 there has been a 1.9% increase in staffing numbers and 3.3% increase in FTEs compared to 2014. A fuller breakdown of the data, including by individual faculty and service, is in Table 1 of the appendix.
In terms of headcount, the largest employee group is administrative/professional and the smallest is senior management.

8
Staff by Gender
Academic and administrative/professional are the largest staff groups. The UWE workforce is 58% female and 42% male but there are differences in gender balance between the employee groups. A full breakdown, including historical data and by grade level, is available in Table 2 of the appendix.
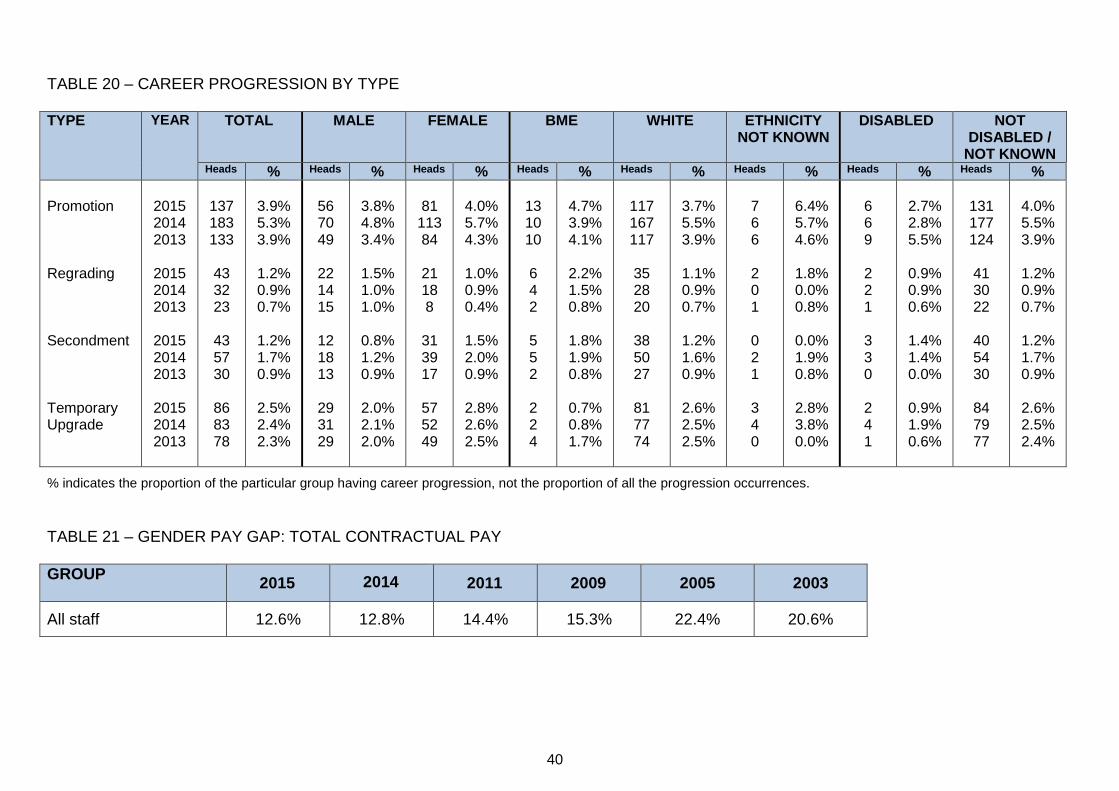
The gender pay gap is the percentage by which average female pay is lower than average male pay. A full equal pay audit is currently taking place. This data is also shown in Table 21 of the appendix.

9
The representation of women in senior management grades has increased over time, and decreased for senior academic I grade and senior research H grade in 2015. A full breakdown is available in Table 2 of the appendix.
The representation of women in senior professional services grades increased significantly with the implementation of the University wide job evaluation exercise in 2008. In 2015 the representation of women in senior manual, senior technical and senior administrative/professional grades has increased. A full breakdown is available in Table 2 of the appendix.

10
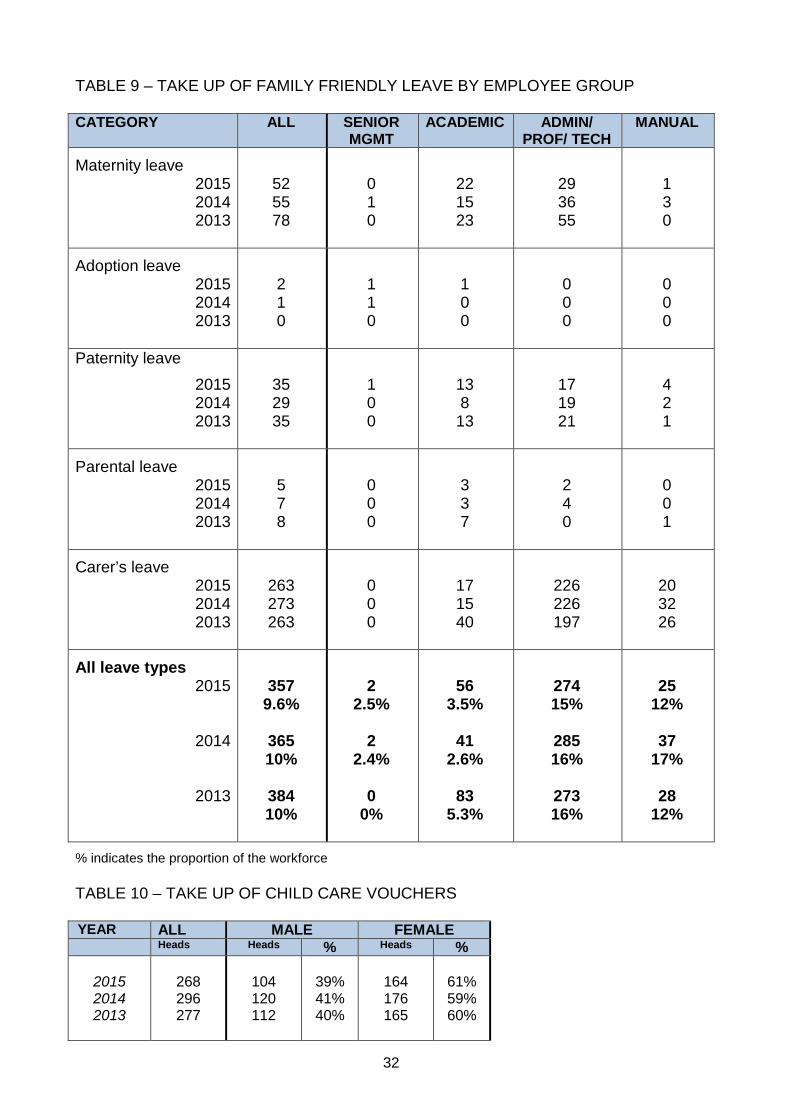
Academic staff (including associate lecturing and research) and administrative/ professional/technical staff make up 43% of the workforce respectively; 5.8% of the workforce is manual staff and 2.1% senior management. The chart illustrates that in 2015 family friendly leave was taken up in greatest proportion by administrative/ professional/technical staff; the staff group with the highest proportion of women (48%). A full breakdown, including historical data, is available in Table 9 of the appendix.
Child care vouchers are taken up by female and male staff approximately in proportion to the workforce gender split. This chart shows that as a proportion of the workforce, child care vouchers are taken up in much lower numbers by manual staff, an employee group with a high proportion of women but the lowest pay rates. A full breakdown, including historical data is available in Table 10 of the appendix.
11
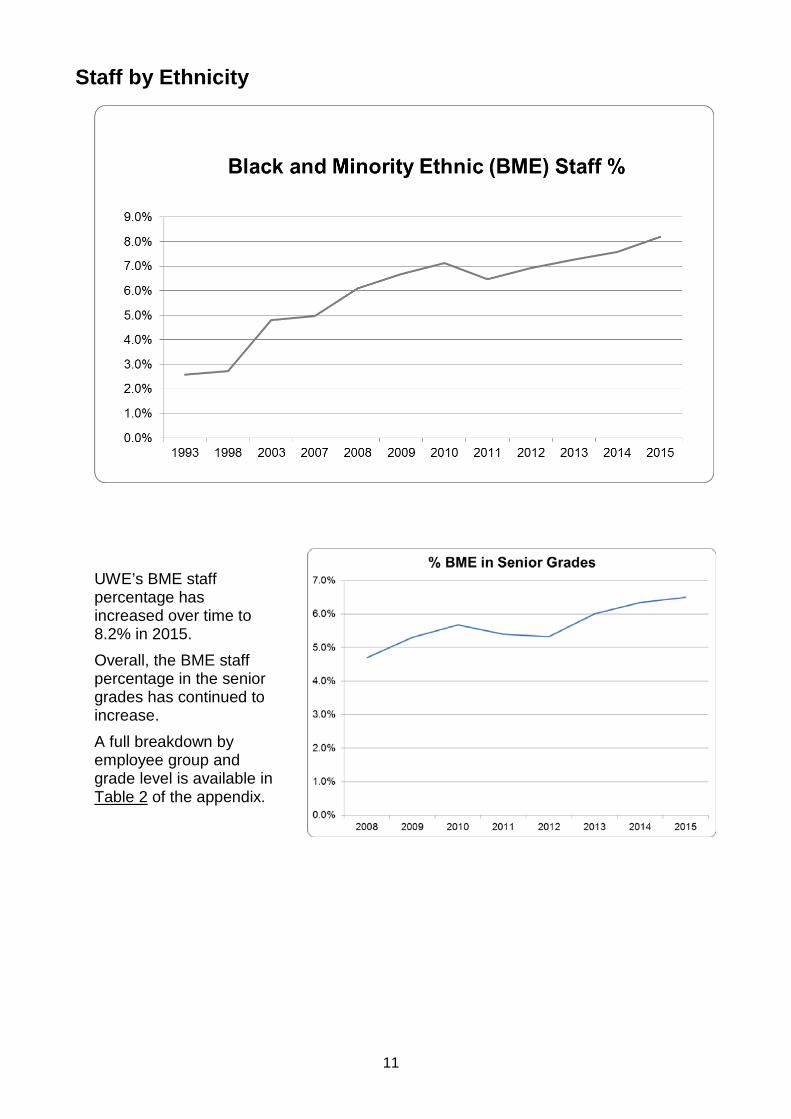
Staff by Ethnicity
UWE’s BME staff percentage has increased over time to 8.2% in 2015. Overall, the BME staff percentage in the senior grades has continued to increase. A full breakdown by employee group and grade level is available in Table 2 of the appendix.
12
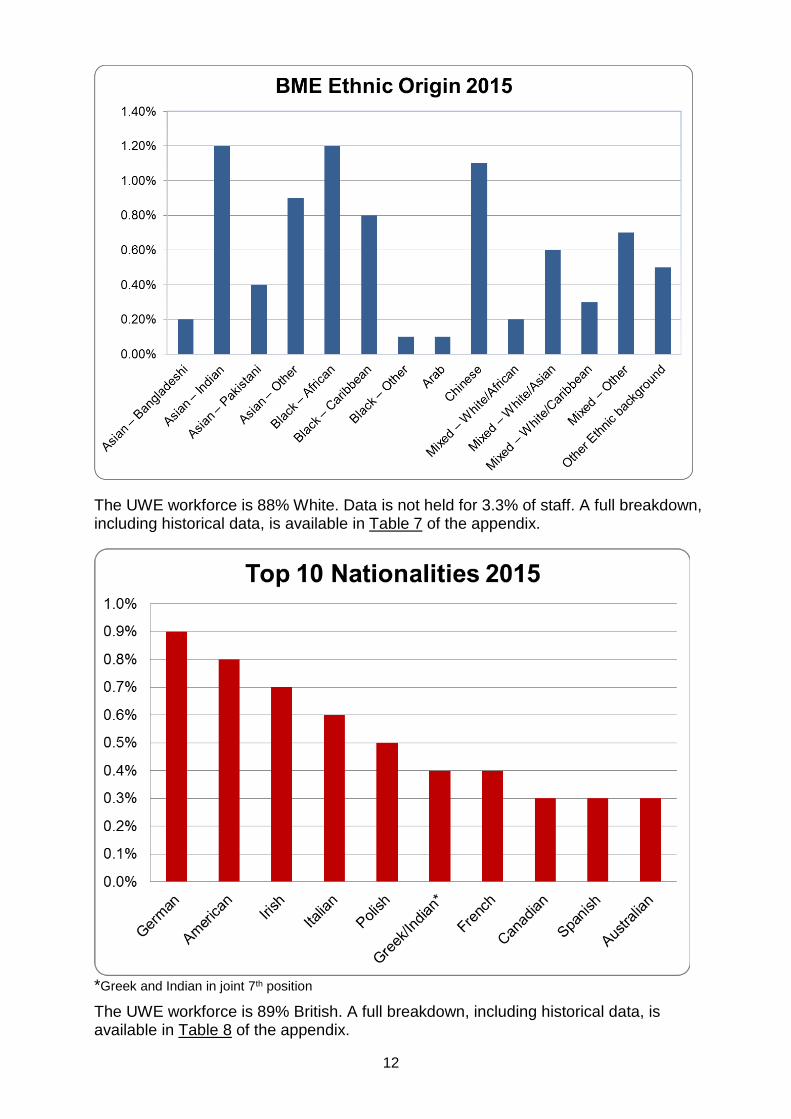
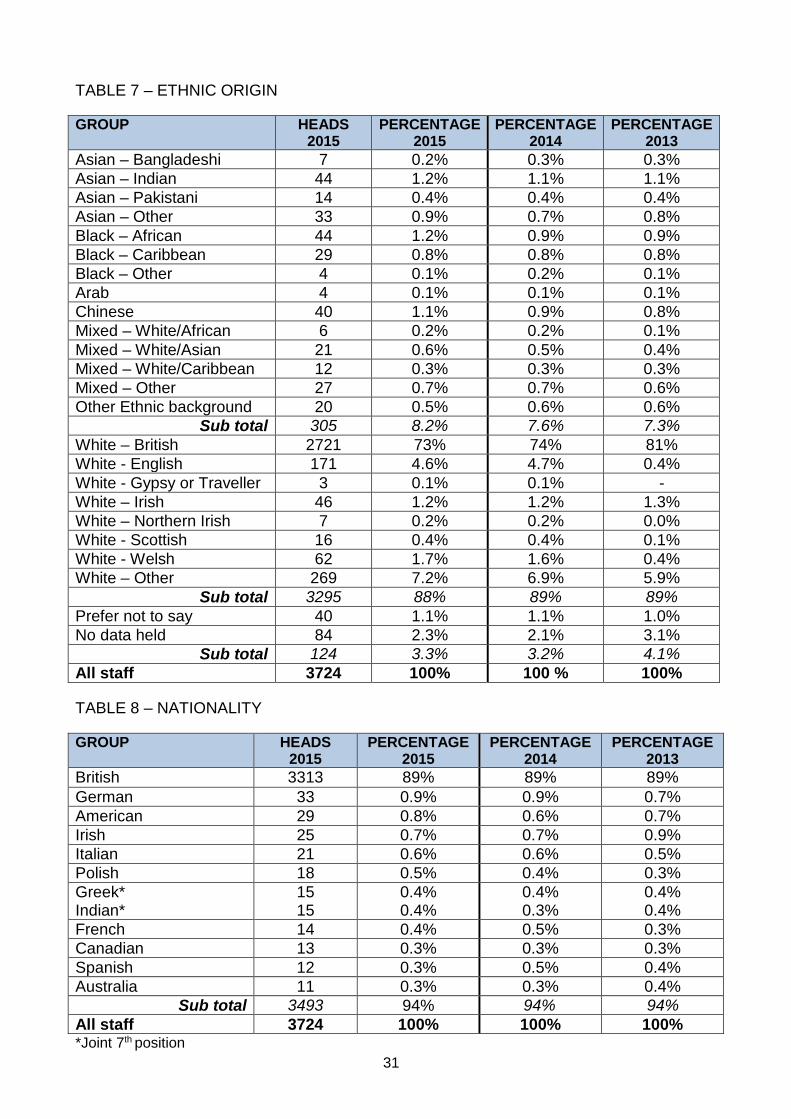
The UWE workforce is 88% White. Data is not held for 3.3% of staff. A full breakdown, including historical data, is available in Table 7 of the appendix.
*Greek and Indian in joint 7th position The UWE workforce is 89% British. A full breakdown, including historical data, is available in Table 8 of the appendix.
13
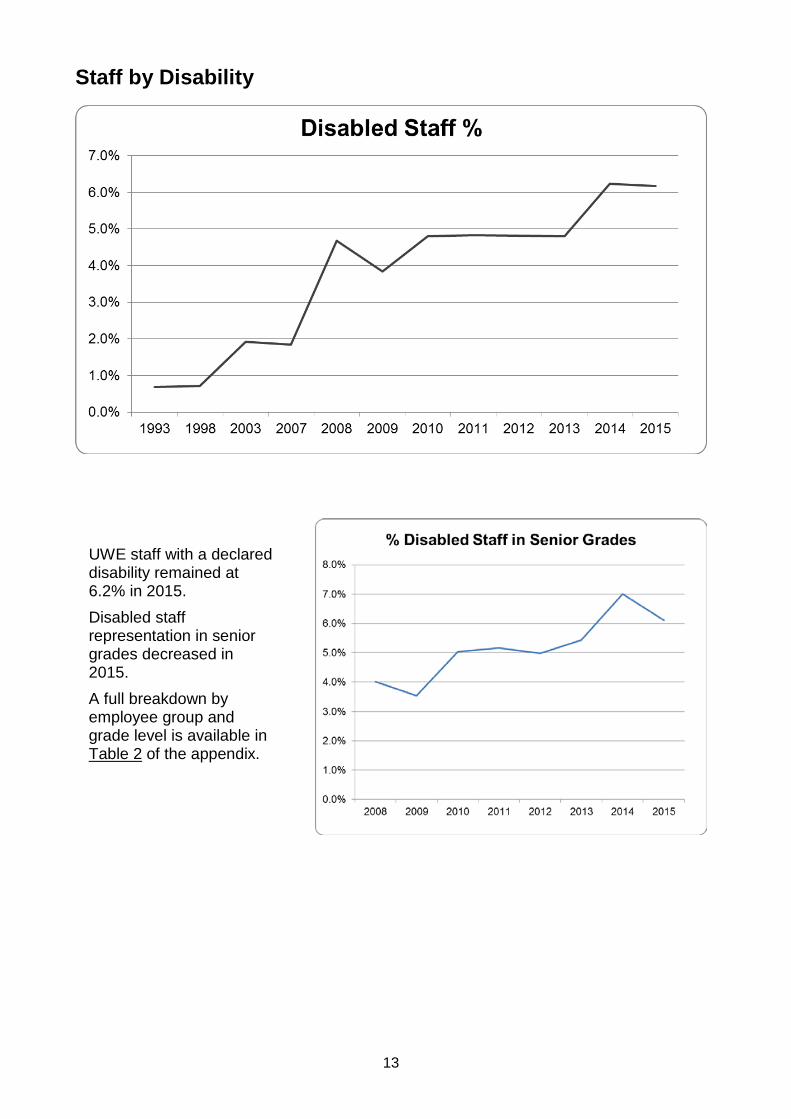
Staff by Disability
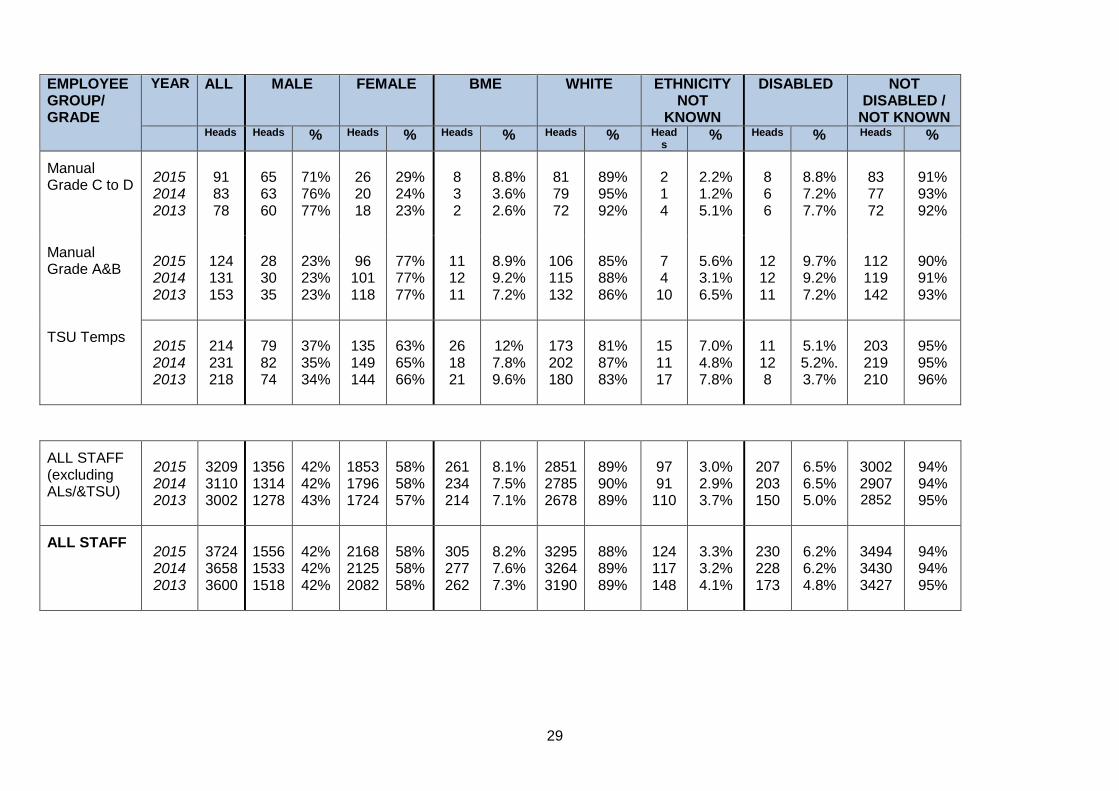
UWE staff with a declared disability remained at 6.2% in 2015. Disabled staff representation in senior grades decreased in 2015. A full breakdown by employee group and grade level is available in Table 2 of the appendix.
14
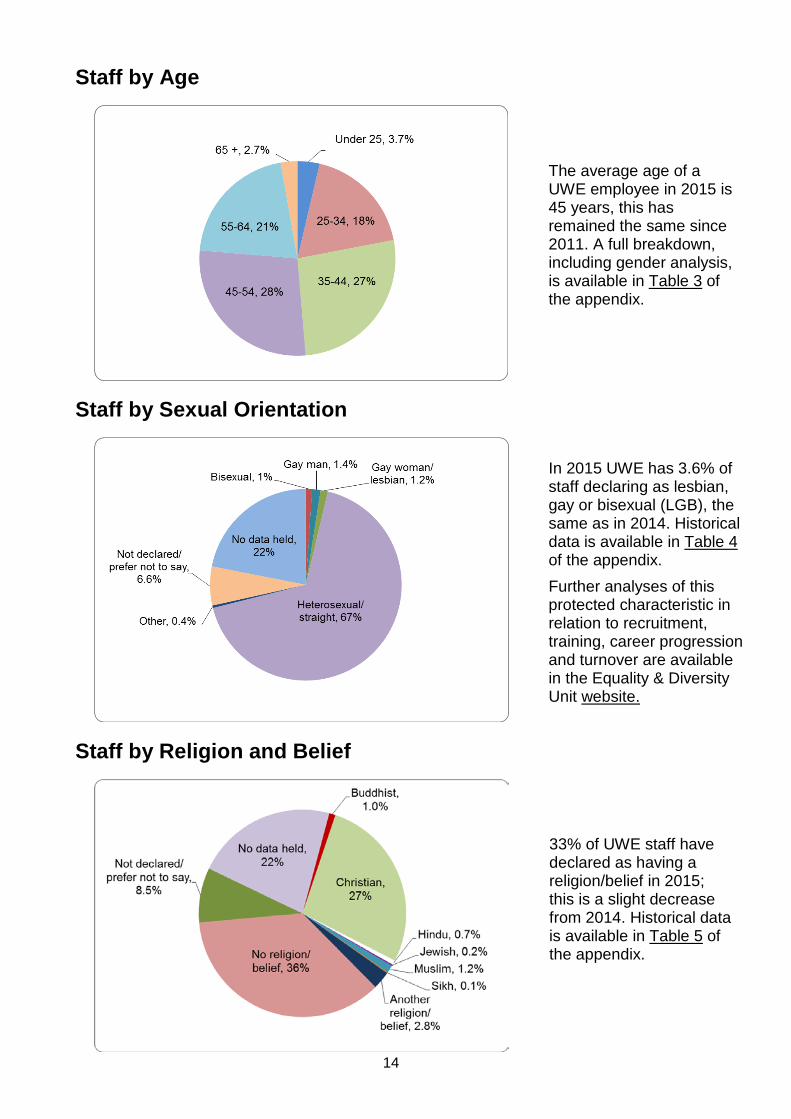
Staff by Age
Staff by Sexual Orientation
Staff by Religion and Belief
In 2015 UWE has 3.6% of staff declaring as lesbian, gay or bisexual (LGB), the same as in 2014. Historical data is available in Table 4 of the appendix. Further analyses of this protected characteristic in relation to recruitment, training, career progression and turnover are available in the Equality & Diversity Unit website.
33% of UWE staff have declared as having a religion/belief in 2015; this is a slight decrease from 2014. Historical data is available in Table 5 of the appendix.
The average age of a UWE employee in 2015 is 45 years, this has remained the same since 2011. A full breakdown, including gender analysis, is available in Table 3 of the appendix.
15
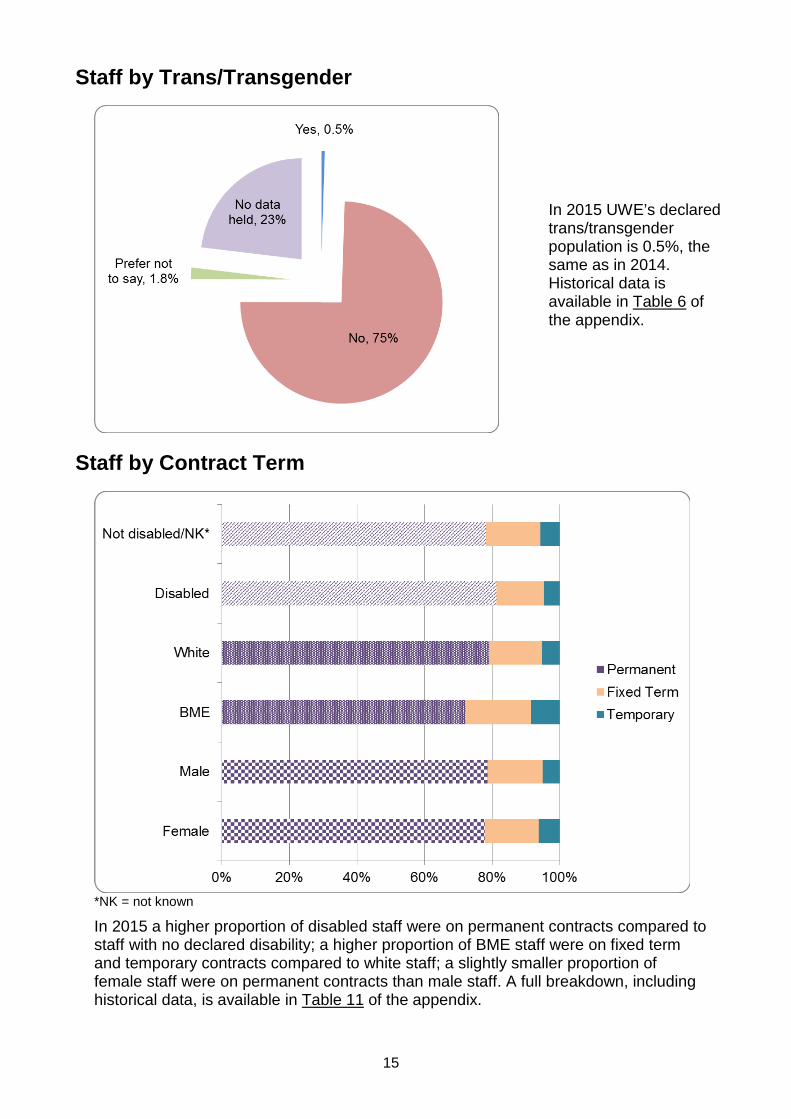
Staff by Trans/Transgender
Staff by Contract Term
*NK = not known
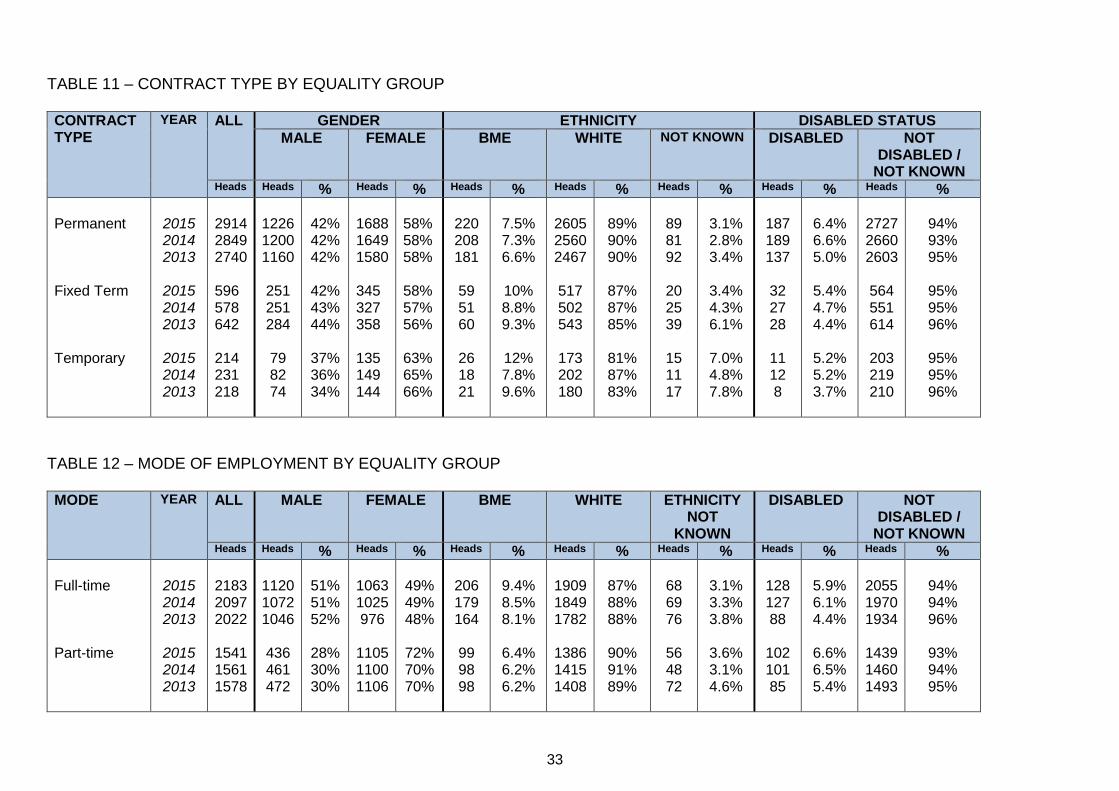
In 2015 a higher proportion of disabled staff were on permanent contracts compared to staff with no declared disability; a higher proportion of BME staff were on fixed term and temporary contracts compared to white staff; a slightly smaller proportion of female staff were on permanent contracts than male staff. A full breakdown, including historical data, is available in Table 11 of the appendix.
In 2015 UWE’s declared trans/transgender population is 0.5%, the same as in 2014. Historical data is available in Table 6 of the appendix.
16
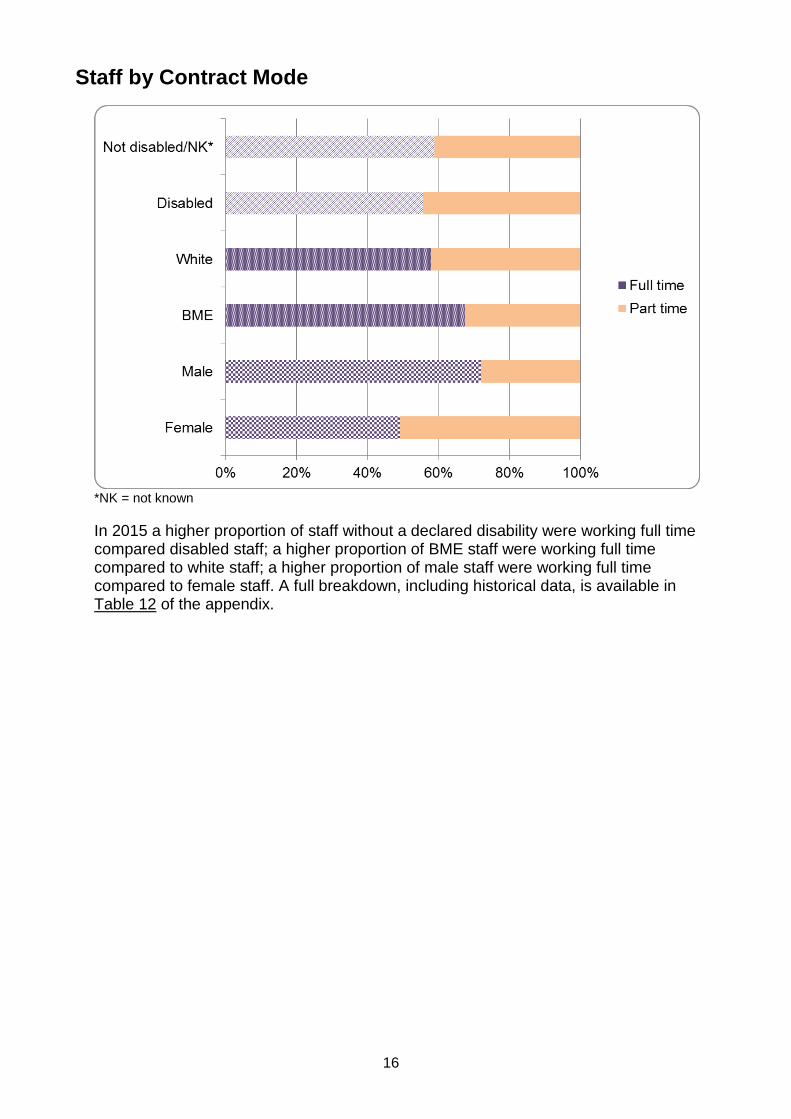
Staff by Contract Mode
*NK = not known
In 2015 a higher proportion of staff without a declared disability were working full time compared disabled staff; a higher proportion of BME staff were working full time compared to white staff; a higher proportion of male staff were working full time compared to female staff. A full breakdown, including historical data, is available in Table 12 of the appendix.
17
Section 2 – Staff Recruitment
*NK = not known
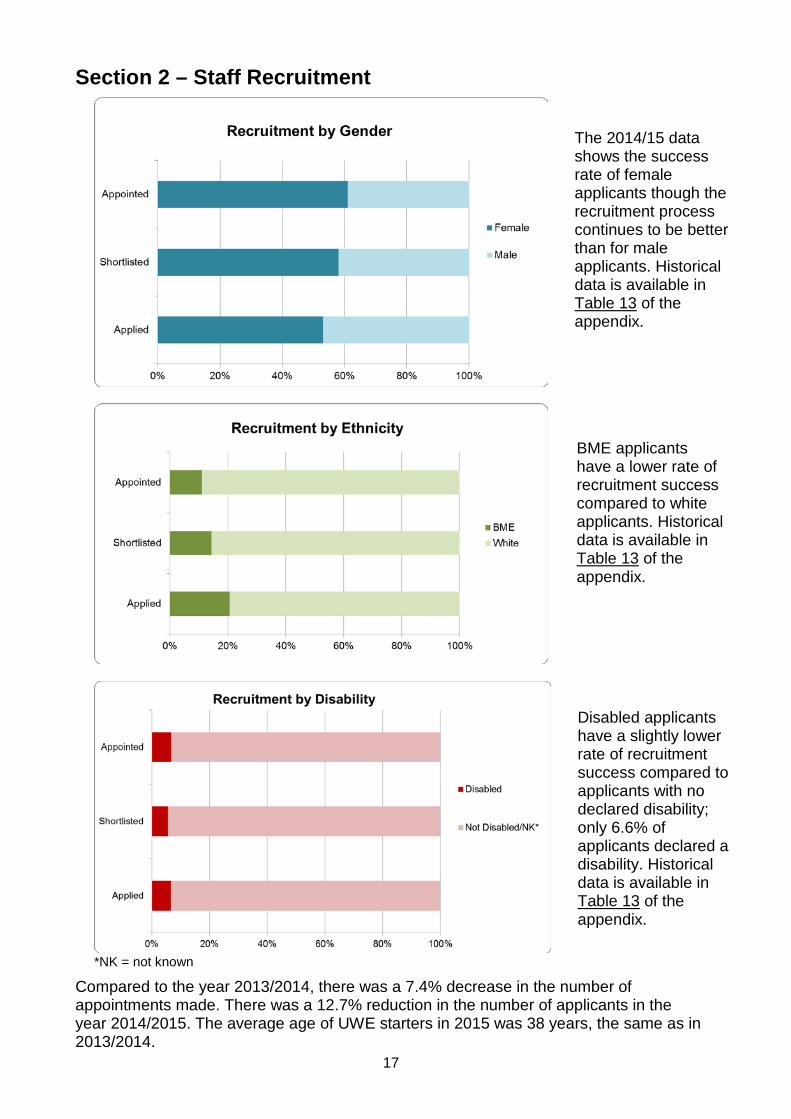
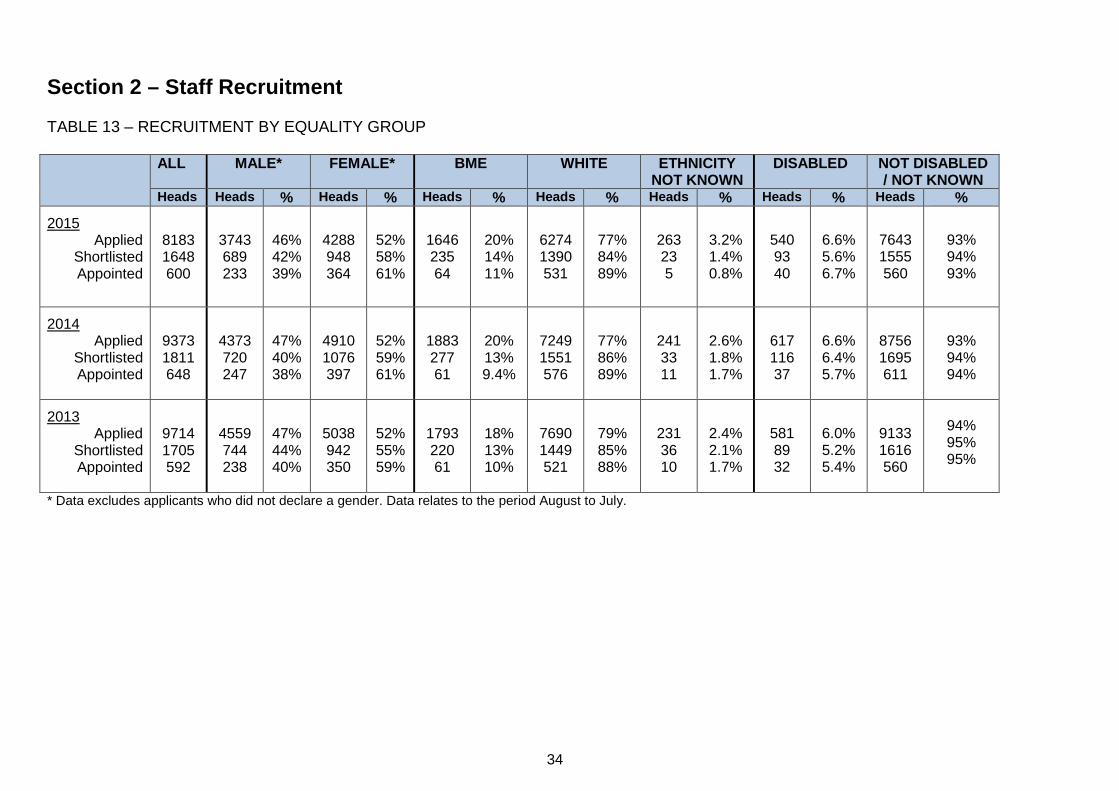
Compared to the year 2013/2014, there was a 7.4% decrease in the number of appointments made. There was a 12.7% reduction in the number of applicants in the year 2014/2015. The average age of UWE starters in 2015 was 38 years, the same as in 2013/2014.
Disabled applicants have a slightly lower rate of recruitment success compared to applicants with no declared disability; only 6.6% of applicants declared a disability. Historical data is available in Table 13 of the appendix.
The 2014/15 data shows the success rate of female applicants though the recruitment process continues to be better than for male applicants. Historical data is available in Table 13 of the appendix.
BME applicants have a lower rate of recruitment success compared to white applicants. Historical data is available in Table 13 of the appendix.
18
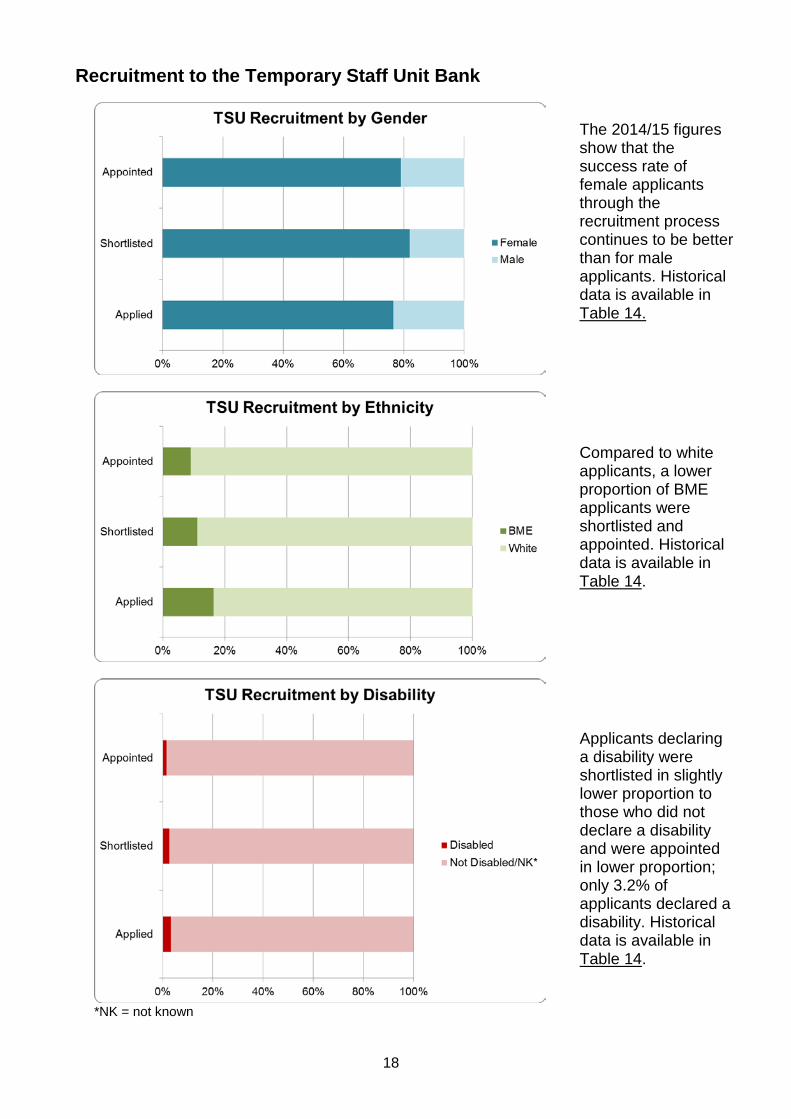
Recruitment to the Temporary Staff Unit Bank
*NK = not known
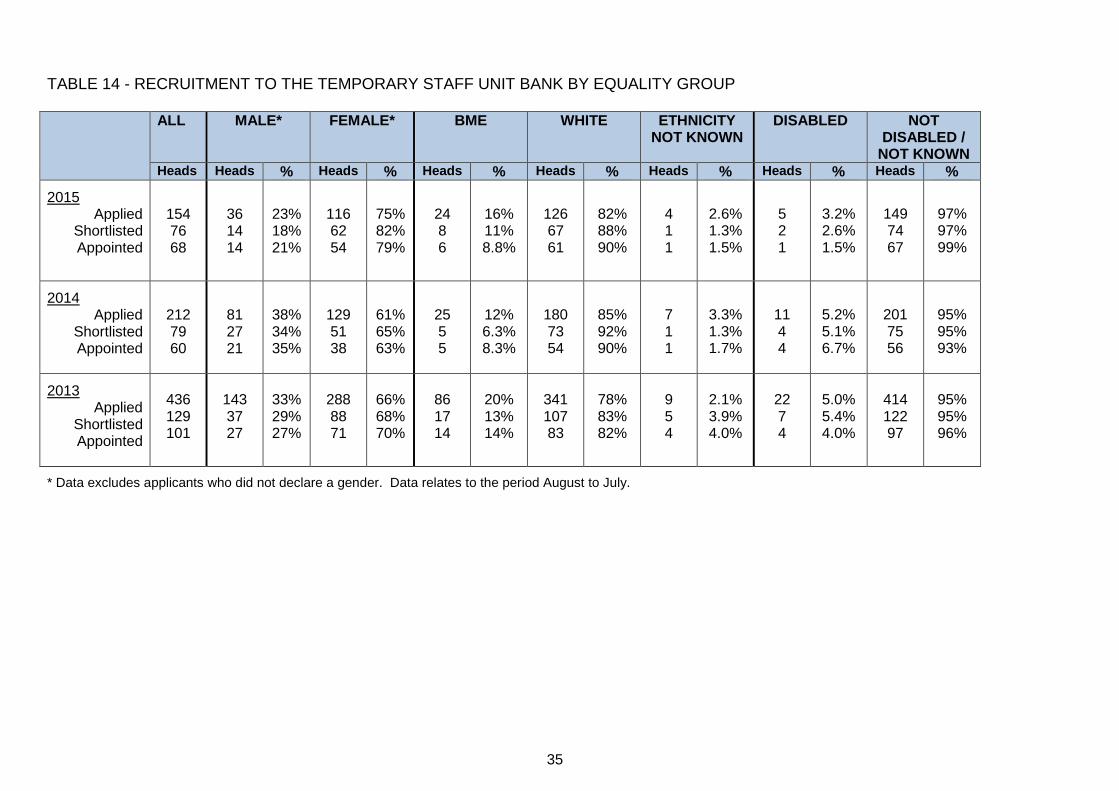
The 2014/15 figures show that the success rate of female applicants through the recruitment process continues to be better than for male applicants. Historical data is available in Table 14.
Compared to white applicants, a lower proportion of BME applicants were shortlisted and appointed. Historical data is available in Table 14.
Applicants declaring a disability were shortlisted in slightly lower proportion to those who did not declare a disability and were appointed in lower proportion; only 3.2% of applicants declared a disability. Historical data is available in Table 14.

19
Recruitment of Internal Candidates
*NK = not known
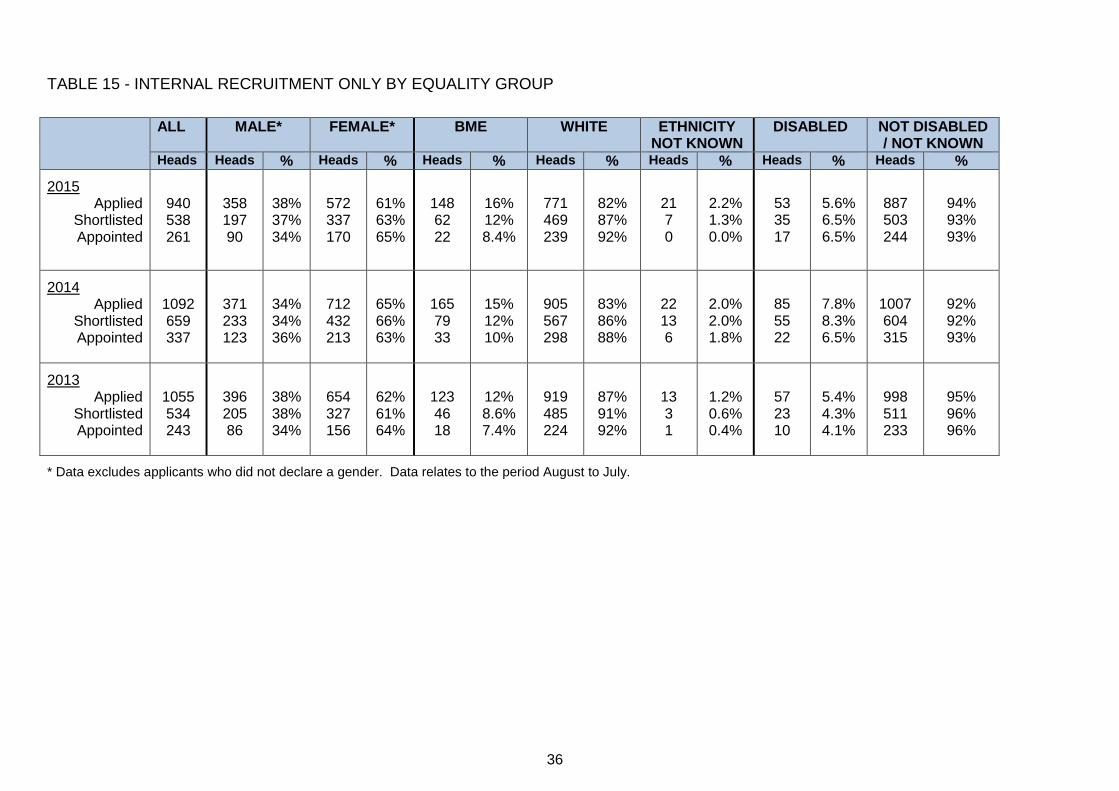
The proportion of internal applicants declaring as disabled is 5.6% and is lower than the UWE disabled workforce of 6.2%. The figures show a slightly higher rate of success from application to short listing. The proportion is equal from shortlisted to appointed. Historical data is available in Table 15.
BME internal applicants have a lower rate of recruitment success compared to white internal applicants. The proportion of BME internal applicants and appointments remains higher than the UWE BME workforce of 8.2%. Historical data is available in Table 15.
In 2014/15 a slightly higher proportion of female internal applicants were shortlisted and appointed compared to male internal applicants. Historical data is available in Table 15.
20
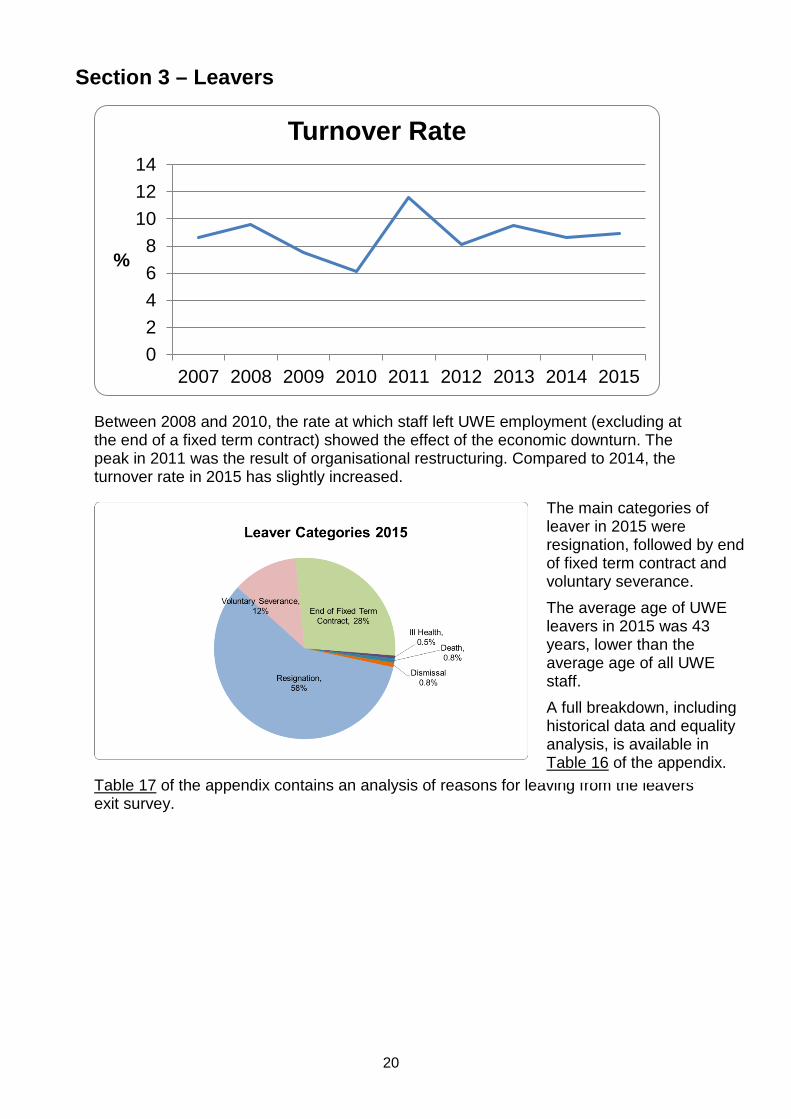
Section 3 – Leavers
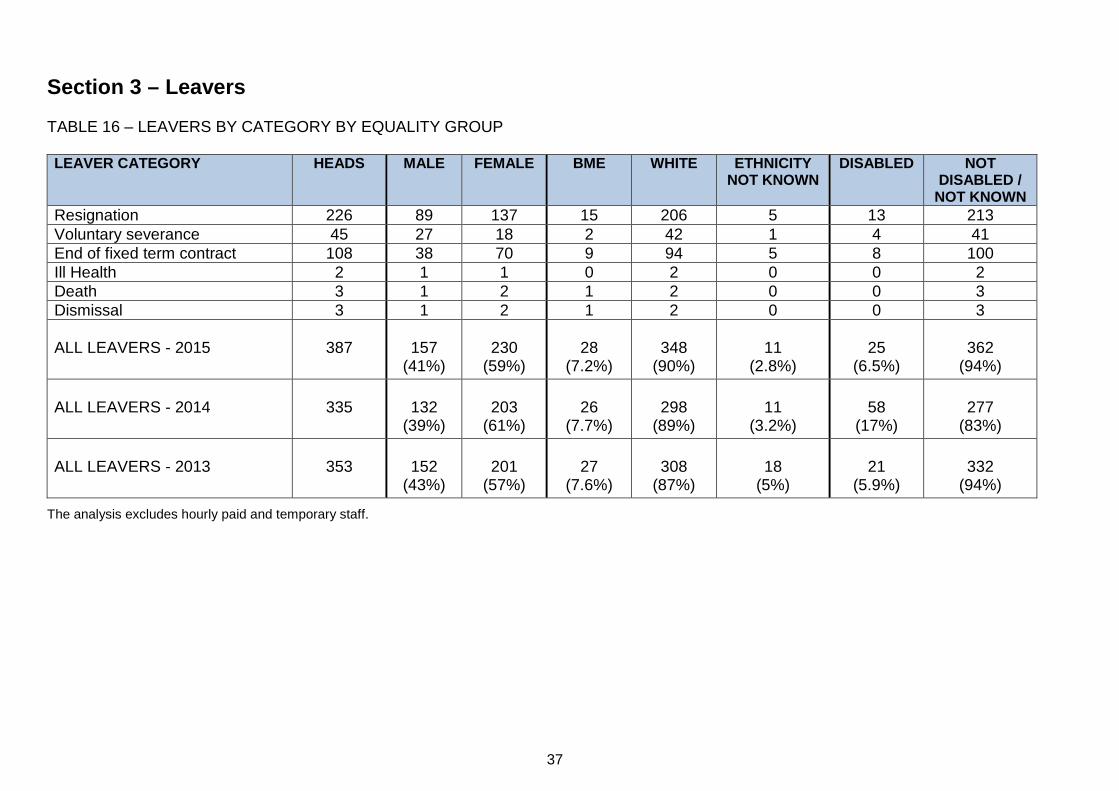
Between 2008 and 2010, the rate at which staff left UWE employment (excluding at the end of a fixed term contract) showed the effect of the economic downturn. The peak in 2011 was the result of organisational restructuring. Compared to 2014, the turnover rate in 2015 has slightly increased.
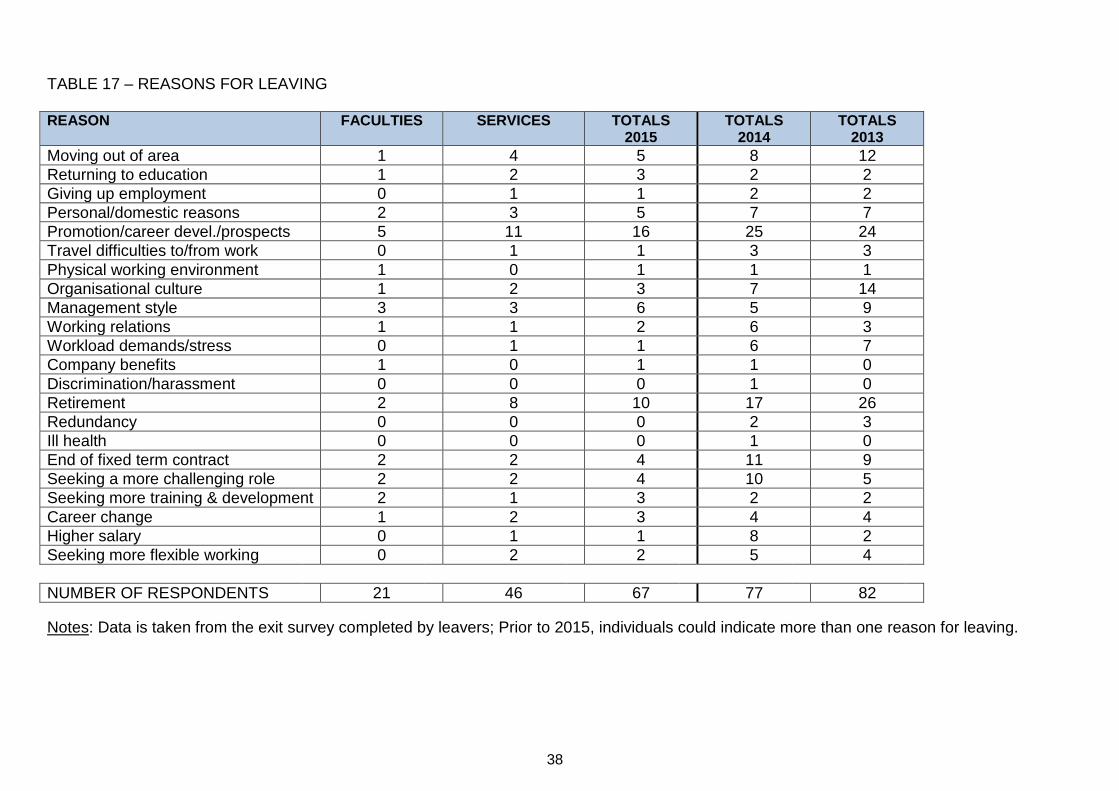
Table 17 of the appendix contains an analysis of reasons for leaving from the leavers’ exit survey.
02468
101214
2007 2008 2009 2010 2011 2012 2013 2014 2015
%
Turnover Rate
The main categories of leaver in 2015 were resignation, followed by end of fixed term contract and voluntary severance. The average age of UWE leavers in 2015 was 43 years, lower than the average age of all UWE staff. A full breakdown, including historical data and equality analysis, is available in Table 16 of the appendix.

21
Section 4 – Staff Development and Career Progression
*NK = not known
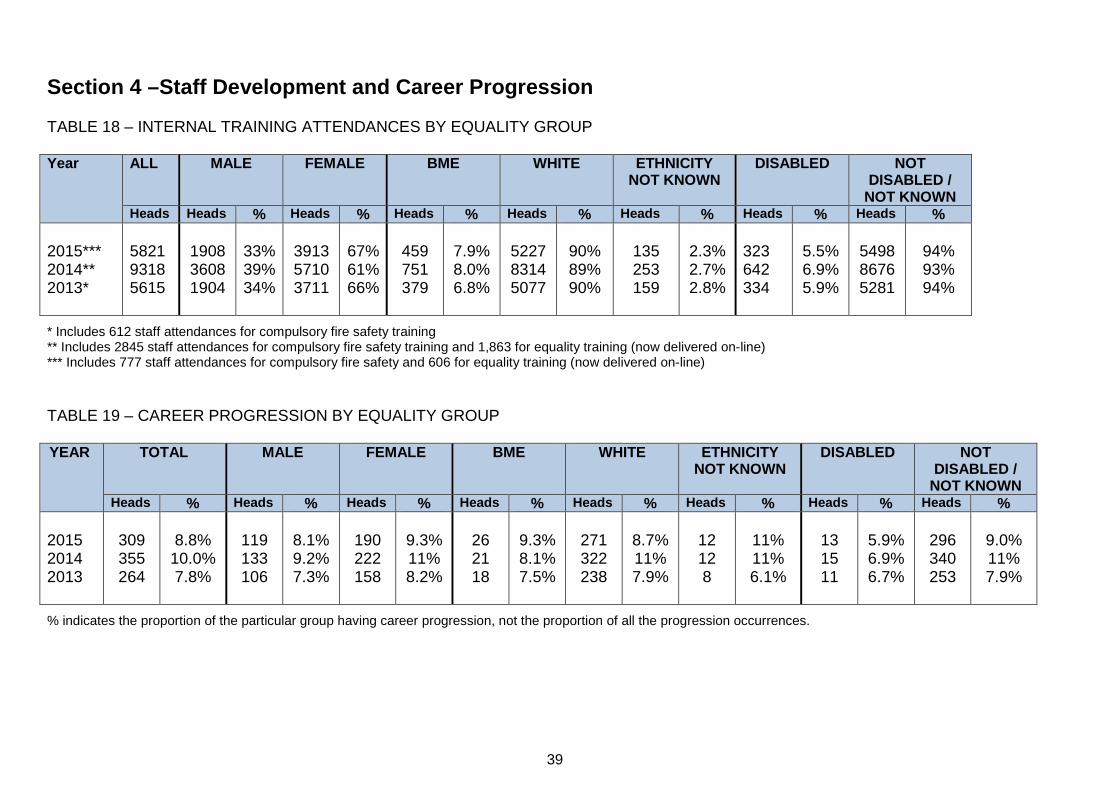
In 2015 UWE managed training course opportunities were taken up in higher proportion by female staff, and in lower proportion by BME staff and disabled staff compared to their representation in the workforce. A full breakdown, including historical data, is available in Table 18 of the appendix.
*NK = not known
In 2015 career progression opportunities (promotion, regrading, secondment, temporary upgrade) were taken up in higher proportion by female staff and BME staff, and in lower proportion by disabled staff, compared to their representation in the workforce. A full breakdown, including historical data, is available in Table 19 and Table 20 of the appendix.
22
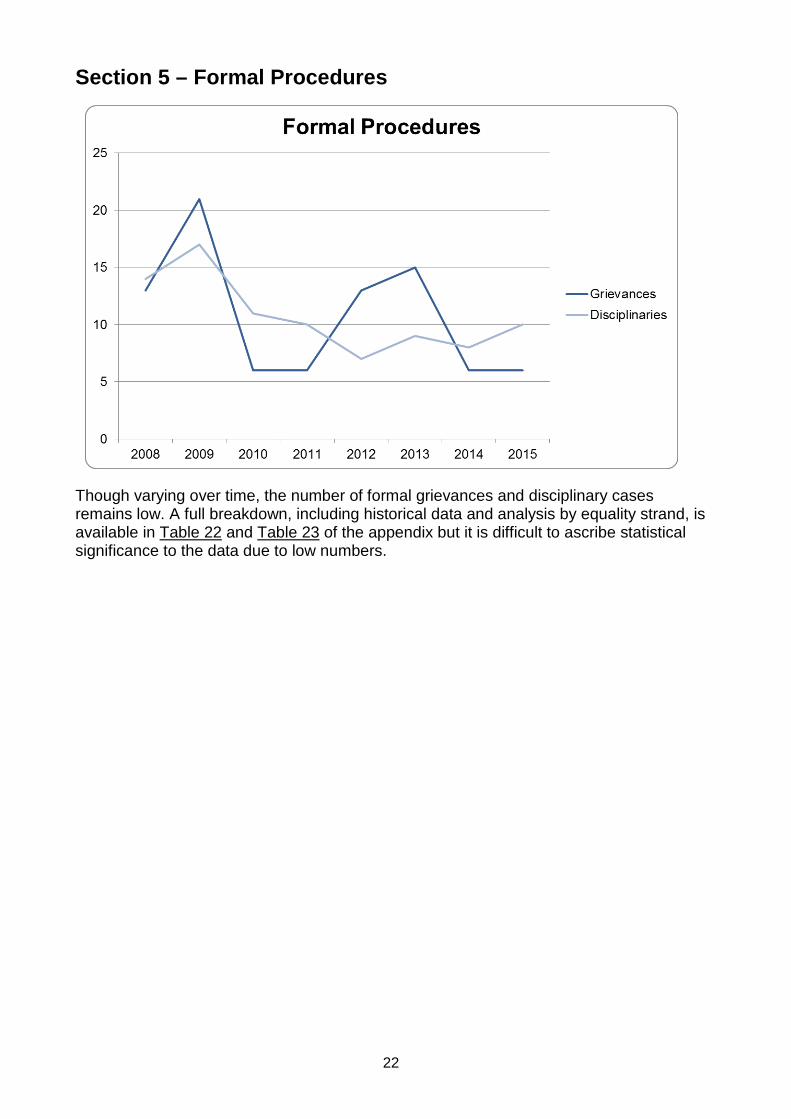
Section 5 – Formal Procedures
Though varying over time, the number of formal grievances and disciplinary cases remains low. A full breakdown, including historical data and analysis by equality strand, is available in Table 22 and Table 23 of the appendix but it is difficult to ascribe statistical significance to the data due to low numbers.

23
Section 6 – Sickness Absence
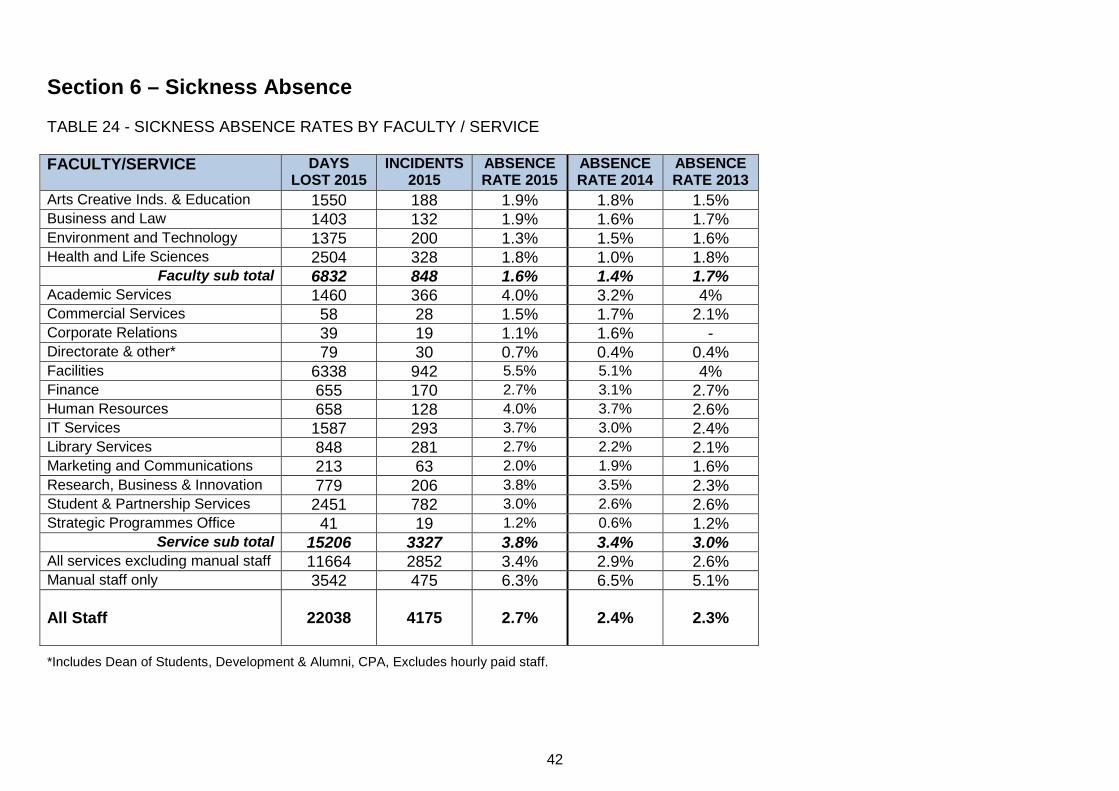
In 2015 the sickness absence rate was 2.7%. There were 22,038 days lost and 4,175 incidents, so on average sickness incidents were 5.3 days in duration. Reported sickness absence rates are lower in faculties (mainly academic staff), than in services (mainly professional services staff), though manual staff continue to have the highest rate of sickness. A breakdown by each faculty and service, including historical data is available in Table 24 of the appendix.
*NK = not known.
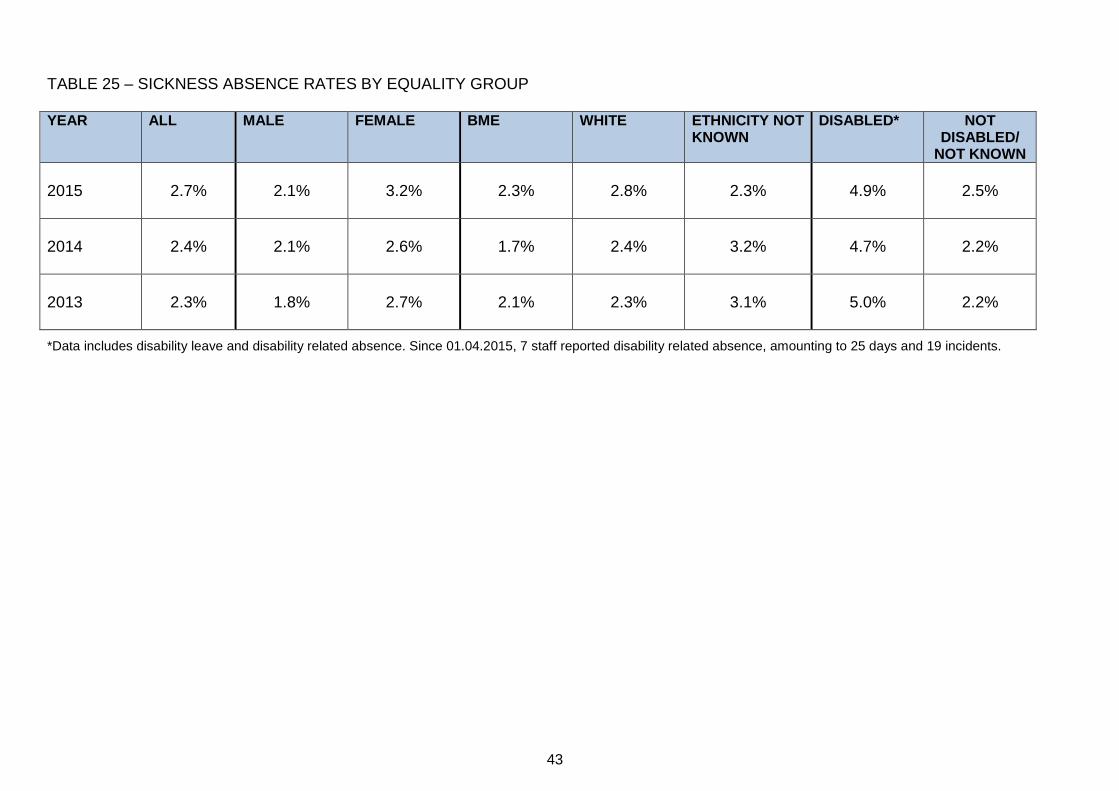
In 2015 the absence percentage rate was higher for female, lower for BME staff and higher for disabled staff (NB: data includes disability-related absence). Historical data is available in Table 25 of the appendix.
24
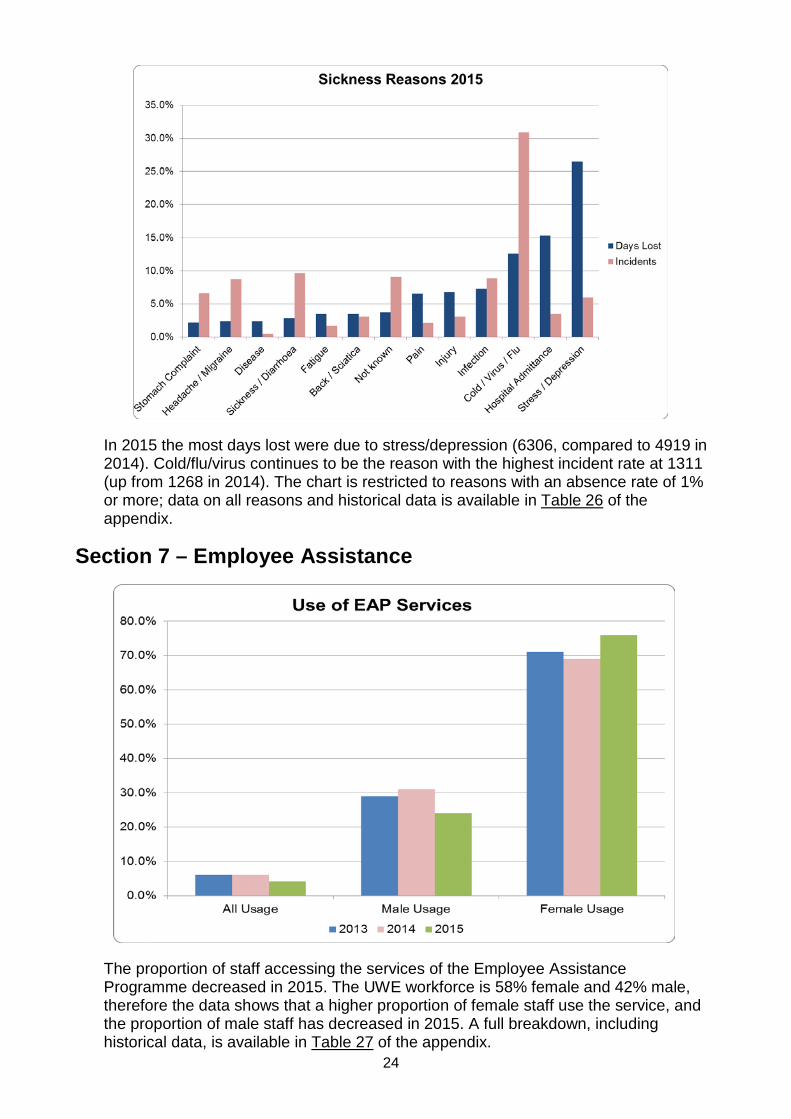
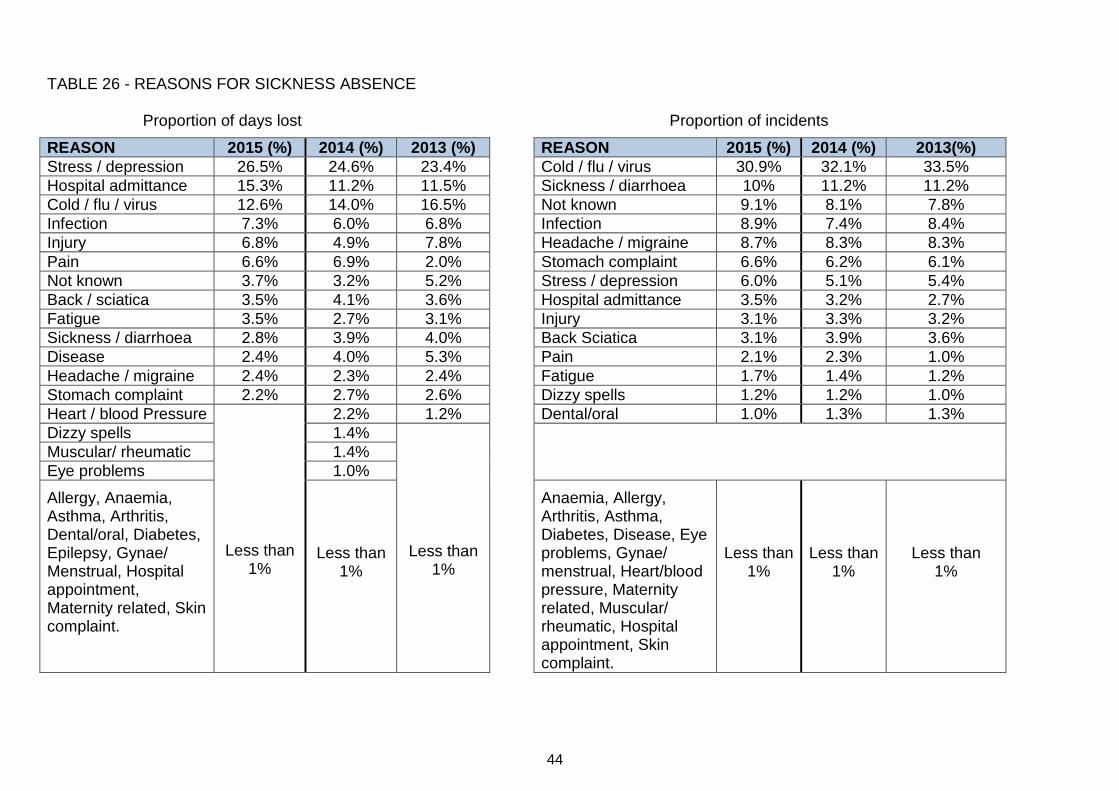
In 2015 the most days lost were due to stress/depression (6306, compared to 4919 in 2014). Cold/flu/virus continues to be the reason with the highest incident rate at 1311 (up from 1268 in 2014). The chart is restricted to reasons with an absence rate of 1% or more; data on all reasons and historical data is available in Table 26 of the appendix.
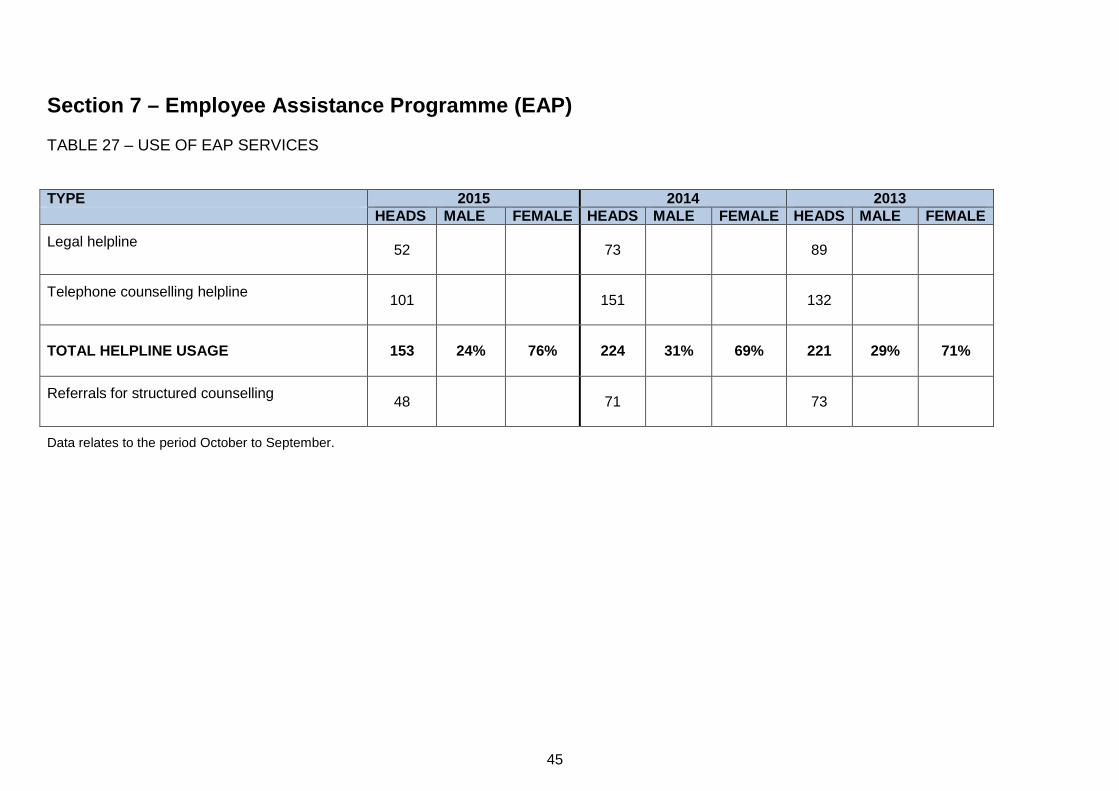
Section 7 – Employee Assistance
The proportion of staff accessing the services of the Employee Assistance Programme decreased in 2015. The UWE workforce is 58% female and 42% male, therefore the data shows that a higher proportion of female staff use the service, and the proportion of male staff has decreased in 2015. A full breakdown, including historical data, is available in Table 27 of the appendix.
25
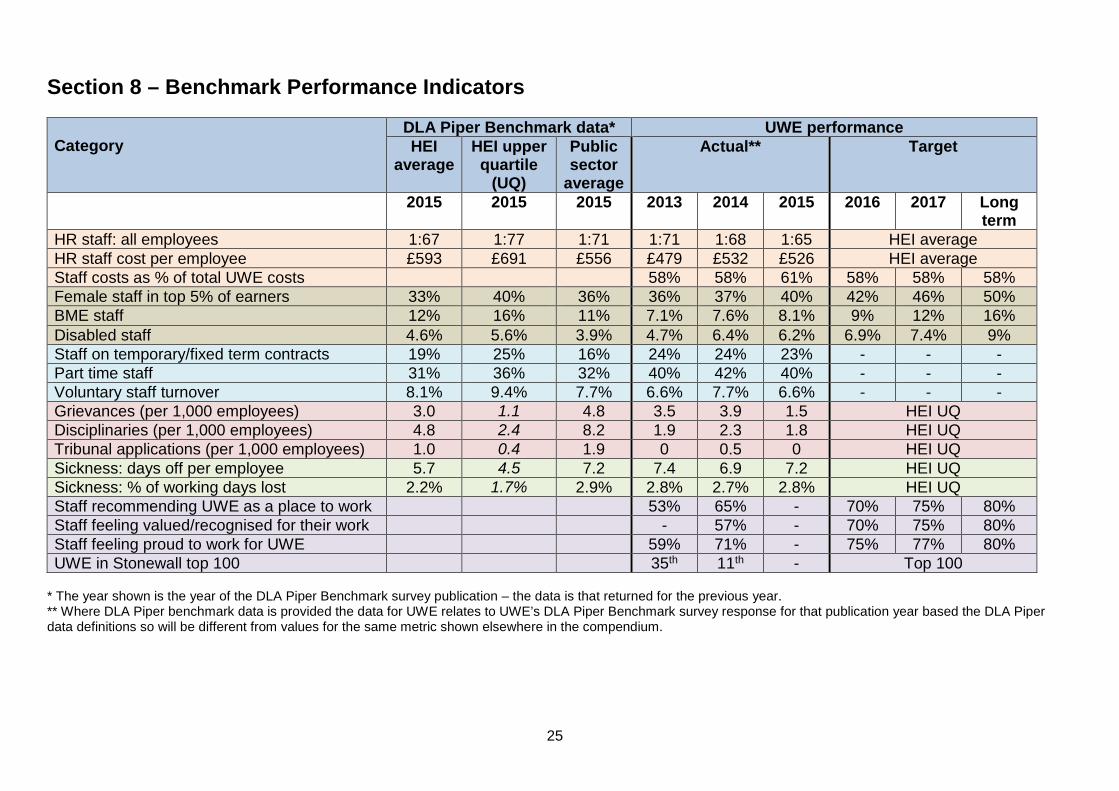
Section 8 – Benchmark Performance Indicators Category
DLA Piper Benchmark data* UWE performance HEI
average HEI upper quartile
(UQ)
Public sector
average
Actual** Target
2015 2015 2015 2013 2014 2015 2016 2017 Long term
HR staff: all employees 1:67 1:77 1:71 1:71 1:68 1:65 HEI average HR staff cost per employee £593 £691 £556 £479 £532 £526 HEI average Staff costs as % of total UWE costs 58% 58% 61% 58% 58% 58% Female staff in top 5% of earners 33% 40% 36% 36% 37% 40% 42% 46% 50% BME staff 12% 16% 11% 7.1% 7.6% 8.1% 9% 12% 16% Disabled staff 4.6% 5.6% 3.9% 4.7% 6.4% 6.2% 6.9% 7.4% 9% Staff on temporary/fixed term contracts 19% 25% 16% 24% 24% 23% - - - Part time staff 31% 36% 32% 40% 42% 40% - - - Voluntary staff turnover 8.1% 9.4% 7.7% 6.6% 7.7% 6.6% - - - Grievances (per 1,000 employees) 3.0 1.1 4.8 3.5 3.9 1.5 HEI UQ Disciplinaries (per 1,000 employees) 4.8 2.4 8.2 1.9 2.3 1.8 HEI UQ Tribunal applications (per 1,000 employees) 1.0 0.4 1.9 0 0.5 0 HEI UQ Sickness: days off per employee 5.7 4.5 7.2 7.4 6.9 7.2 HEI UQ Sickness: % of working days lost 2.2% 1.7% 2.9% 2.8% 2.7% 2.8% HEI UQ Staff recommending UWE as a place to work 53% 65% - 70% 75% 80% Staff feeling valued/recognised for their work - 57% - 70% 75% 80% Staff feeling proud to work for UWE 59% 71% - 75% 77% 80% UWE in Stonewall top 100 35th 11th - Top 100
* The year shown is the year of the DLA Piper Benchmark survey publication – the data is that returned for the previous year. ** Where DLA Piper benchmark data is provided the data for UWE relates to UWE’s DLA Piper Benchmark survey response for that publication year based the DLA Piper data definitions so will be different from values for the same metric shown elsewhere in the compendium.
26
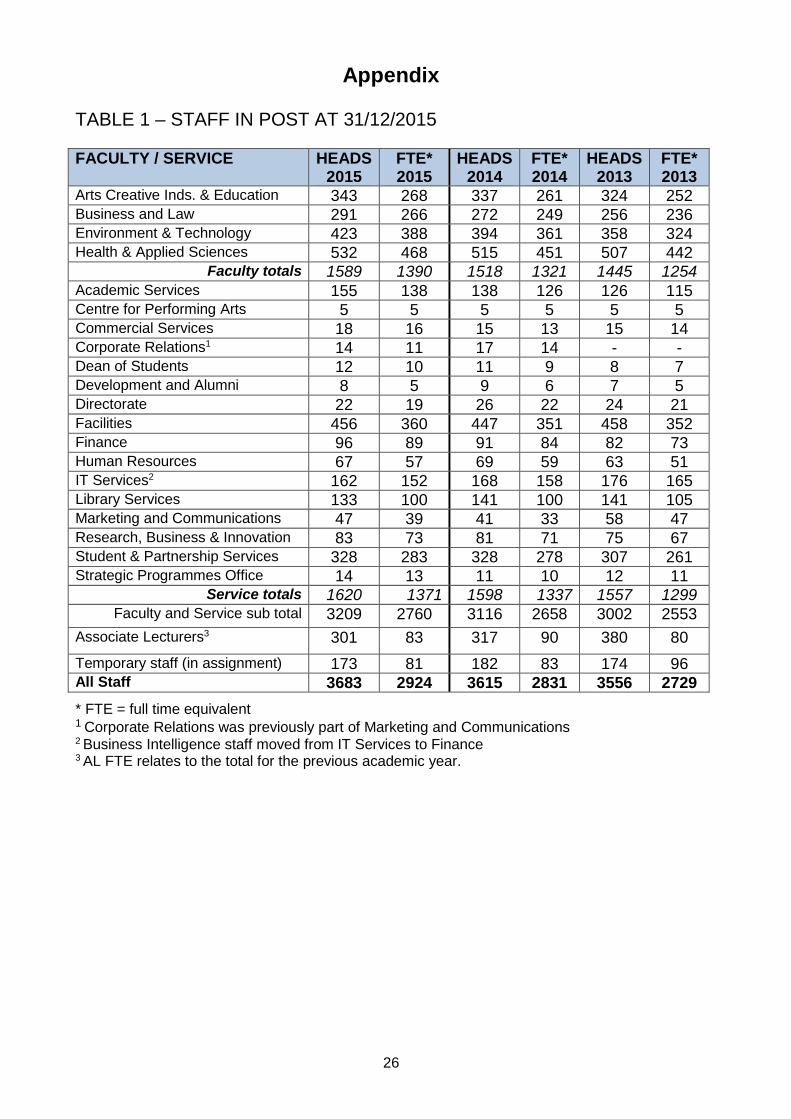
Appendix TABLE 1 – STAFF IN POST AT 31/12/2015 FACULTY / SERVICE HEADS
2015 FTE* 2015
HEADS 2014
FTE* 2014
HEADS 2013
FTE* 2013
Arts Creative Inds. & Education 343 268 337 261 324 252 Business and Law 291 266 272 249 256 236 Environment & Technology 423 388 394 361 358 324 Health & Applied Sciences 532 468 515 451 507 442
Faculty totals 1589 1390 1518 1321 1445 1254 Academic Services 155 138 138 126 126 115 Centre for Performing Arts 5 5 5 5 5 5 Commercial Services 18 16 15 13 15 14 Corporate Relations1 14 11 17 14 - - Dean of Students 12 10 11 9 8 7 Development and Alumni 8 5 9 6 7 5 Directorate 22 19 26 22 24 21 Facilities 456 360 447 351 458 352 Finance 96 89 91 84 82 73 Human Resources 67 57 69 59 63 51 IT Services2 162 152 168 158 176 165 Library Services 133 100 141 100 141 105 Marketing and Communications 47 39 41 33 58 47 Research, Business & Innovation 83 73 81 71 75 67 Student & Partnership Services 328 283 328 278 307 261 Strategic Programmes Office 14 13 11 10 12 11
Service totals 1620 1371 1598 1337 1557 1299 Faculty and Service sub total 3209 2760 3116 2658 3002 2553
Associate Lecturers3 301 83 317 90 380 80 Temporary staff (in assignment) 173 81 182 83 174 96 All Staff 3683 2924 3615 2831 3556 2729 * FTE = full time equivalent 1 Corporate Relations was previously part of Marketing and Communications 2 Business Intelligence staff moved from IT Services to Finance 3 AL FTE relates to the total for the previous academic year.
27
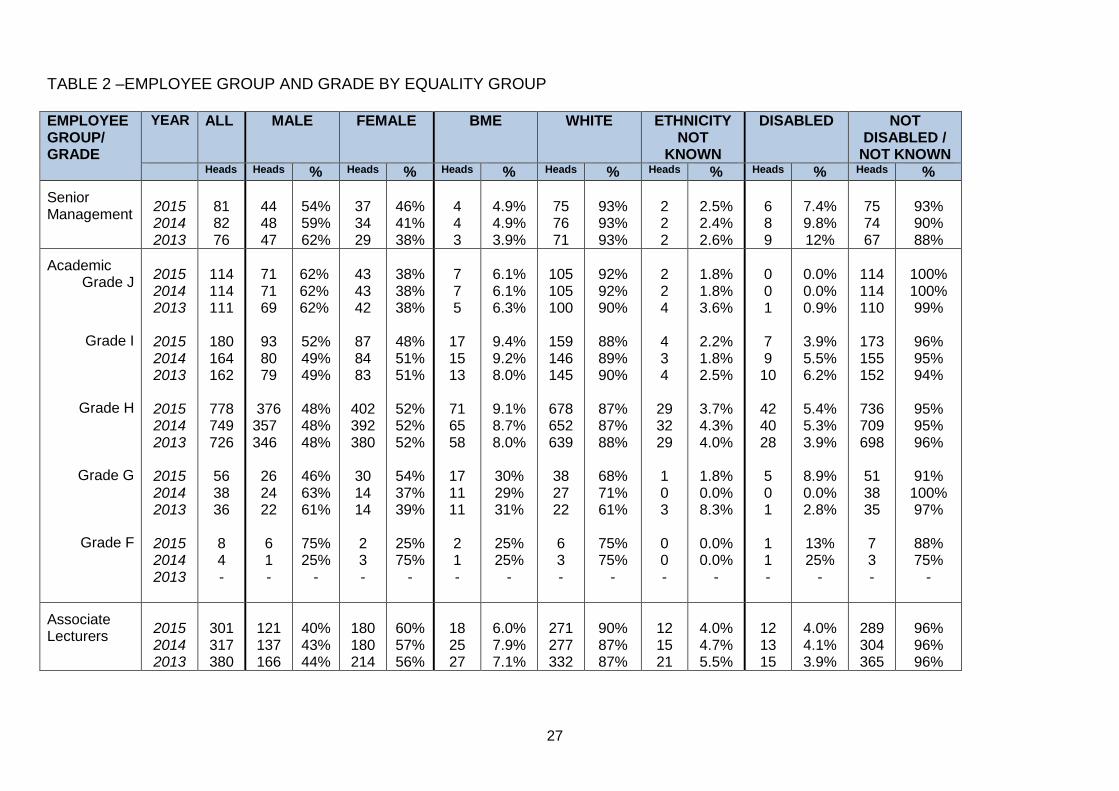
TABLE 2 –EMPLOYEE GROUP AND GRADE BY EQUALITY GROUP
EMPLOYEE GROUP/ GRADE
YEAR ALL MALE FEMALE BME WHITE ETHNICITY NOT
KNOWN
DISABLED NOT DISABLED /
NOT KNOWN Heads Heads % Heads % Heads % Heads % Heads % Heads % Heads %
Senior Management
2015 2014 2013
81 82 76
44 48 47
54% 59% 62%
37 34 29
46% 41% 38%
4 4 3
4.9% 4.9% 3.9%
75 76 71
93% 93% 93%
2 2 2
2.5% 2.4% 2.6%
6 8 9
7.4% 9.8% 12%
75 74 67
93% 90% 88%
Academic Grade J
Grade I
Grade H
Grade G
Grade F
2015 2014 2013
2015 2014 2013
2015 2014 2013
2015 2014 2013
2015 2014 2013
114 114 111
180 164 162
778 749 726
56 38 36 8 4 -
71 71 69
93 80 79
376 357 346
26 24 22 6 1 -
62% 62% 62%
52% 49% 49%
48% 48% 48%
46% 63% 61%
75% 25%
-
43 43 42
87 84 83
402 392 380
30 14 14 2 3 -
38% 38% 38%
48% 51% 51%
52% 52% 52%
54% 37% 39%
25% 75%
-
7 7 5
17 15 13
71 65 58
17 11 11 2 1 -
6.1% 6.1% 6.3%
9.4% 9.2% 8.0%
9.1% 8.7% 8.0%
30% 29% 31%
25% 25%
-
105 105 100
159 146 145
678 652 639
38 27 22
6 3 -
92% 92% 90%
88% 89% 90%
87% 87% 88%
68% 71% 61%
75% 75%
-
2 2 4
4 3 4
29 32 29
1 0 3
0 0 -
1.8% 1.8% 3.6%
2.2% 1.8% 2.5%
3.7% 4.3% 4.0%
1.8% 0.0% 8.3%
0.0% 0.0%
-
0 0 1
7 9 10
42 40 28
5 0 1
1 1 -
0.0% 0.0% 0.9%
3.9% 5.5% 6.2%
5.4% 5.3% 3.9%
8.9% 0.0% 2.8%
13% 25%
-
114 114 110
173 155 152
736 709 698
51 38 35
7 3 -
100% 100% 99%
96% 95% 94%
95% 95% 96%
91%
100% 97%
88% 75%
-
Associate Lecturers
2015 2014 2013
301 317 380
121 137 166
40% 43% 44%
180 180 214
60% 57% 56%
18 25 27
6.0% 7.9% 7.1%
271 277 332
90% 87% 87%
12 15 21
4.0% 4.7% 5.5%
12 13 15
4.0% 4.1% 3.9%
289 304 365
96% 96% 96%
28
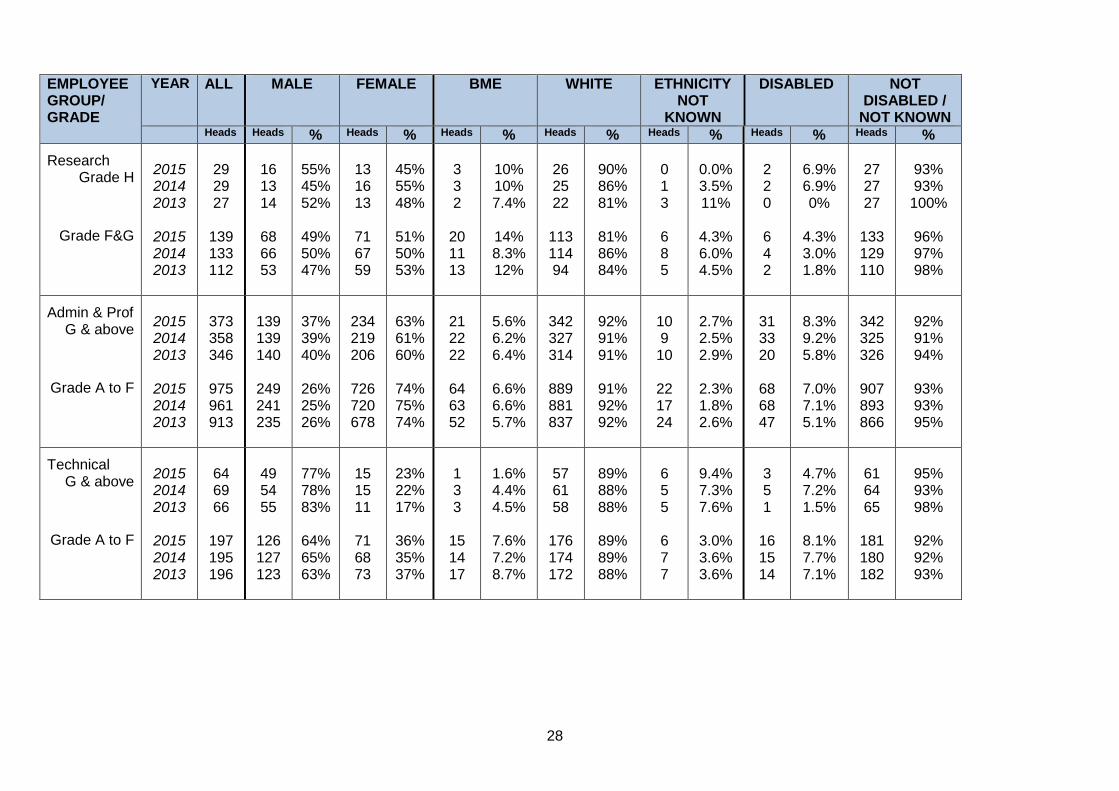
EMPLOYEE GROUP/ GRADE
YEAR ALL
MALE FEMALE BME WHITE ETHNICITY NOT
KNOWN
DISABLED NOT DISABLED /
NOT KNOWN Heads Heads % Heads % Heads % Heads % Heads % Heads % Heads %
Research Grade H
Grade F&G
2015 2014 2013
2015 2014 2013
29 29 27
139 133 112
16 13 14
68 66 53
55% 45% 52%
49% 50% 47%
13 16 13
71 67 59
45% 55% 48%
51% 50% 53%
3 3 2
20 11 13
10% 10% 7.4%
14% 8.3% 12%
26 25 22
113 114 94
90% 86% 81%
81% 86% 84%
0 1 3 6 8 5
0.0% 3.5% 11%
4.3% 6.0% 4.5%
2 2 0 6 4 2
6.9% 6.9% 0%
4.3% 3.0% 1.8%
27 27 27
133 129 110
93% 93% 100%
96% 97% 98%
Admin & Prof G & above
Grade A to F
2015 2014 2013
2015 2014 2013
373 358 346
975 961 913
139 139 140
249 241 235
37% 39% 40%
26% 25% 26%
234 219 206
726 720 678
63% 61% 60%
74% 75% 74%
21 22 22
64 63 52
5.6% 6.2% 6.4%
6.6% 6.6% 5.7%
342 327 314
889 881 837
92% 91% 91%
91% 92% 92%
10 9
10
22 17 24
2.7% 2.5% 2.9%
2.3% 1.8% 2.6%
31 33 20
68 68 47
8.3% 9.2% 5.8%
7.0% 7.1% 5.1%
342 325 326
907 893 866
92% 91% 94%
93% 93% 95%
Technical G & above
Grade A to F
2015 2014 2013
2015 2014 2013
64 69 66
197 195 196
49 54 55
126 127 123
77% 78% 83%
64% 65% 63%
15 15 11
71 68 73
23% 22% 17%
36% 35% 37%
1 3 3
15 14 17
1.6% 4.4% 4.5%
7.6% 7.2% 8.7%
57 61 58
176 174 172
89% 88% 88%
89% 89% 88%
6 5 5 6 7 7
9.4% 7.3% 7.6%
3.0% 3.6% 3.6%
3 5 1
16 15 14
4.7% 7.2% 1.5%
8.1% 7.7% 7.1%
61 64 65
181 180 182
95% 93% 98%
92% 92% 93%
29
EMPLOYEE GROUP/ GRADE
YEAR ALL MALE FEMALE BME WHITE ETHNICITY NOT
KNOWN
DISABLED NOT DISABLED /
NOT KNOWN Heads Heads % Heads % Heads % Heads % Head
s % Heads % Heads %
Manual Grade C to D
2015 2014 2013
91 83 78
65 63 60
71% 76% 77%
26 20 18
29% 24% 23%
8 3 2
8.8% 3.6% 2.6%
81 79 72
89% 95% 92%
2 1 4
2.2% 1.2% 5.1%
8 6 6
8.8% 7.2% 7.7%
83 77 72
91% 93% 92%
Manual Grade A&B
2015 2014 2013
124 131 153
28 30 35
23% 23% 23%
96 101 118
77% 77% 77%
11 12 11
8.9% 9.2% 7.2%
106 115 132
85% 88% 86%
7 4 10
5.6% 3.1% 6.5%
12 12 11
9.7% 9.2% 7.2%
112 119 142
90% 91% 93%
TSU Temps 2015 2014 2013
214 231 218
79 82 74
37% 35% 34%
135 149 144
63% 65% 66%
26 18 21
12% 7.8% 9.6%
173 202 180
81% 87% 83%
15 11 17
7.0% 4.8% 7.8%
11 12 8
5.1% 5.2%. 3.7%
203 219 210
95% 95% 96%
ALL STAFF (excluding ALs/&TSU)
2015 2014 2013
3209 3110 3002
1356 1314 1278
42% 42% 43%
1853 1796 1724
58% 58% 57%
261 234 214
8.1% 7.5% 7.1%
2851 2785 2678
89% 90% 89%
97 91
110
3.0% 2.9% 3.7%
207 203 150
6.5% 6.5% 5.0%
3002 2907 2852
94% 94% 95%
ALL STAFF
2015 2014 2013
3724 3658 3600
1556 1533 1518
42% 42% 42%
2168 2125 2082
58% 58% 58%
305 277 262
8.2% 7.6% 7.3%
3295 3264 3190
88% 89% 89%
124 117 148
3.3% 3.2% 4.1%
230 228 173
6.2% 6.2% 4.8%
3494 3430 3427
94% 94% 95%

30
TABLE 3 – AGE AGE BAND HEADS
2015 FEMALE
2015 MALE 2015
PERCENTAGE 2015
PERCENTAGE 2014
PERCENTAGE 2013
Under 25 136 70 66 3.7% 3.7% 3.6% 25-34 682 405 277 18% 19% 18% 35-44 994 575 419 27% 27% 26% 45-54 1030 619 411 28% 27% 27% 55-64 780 455 325 21% 21% 22% 65 + 102 44 58 2.7% 2.7% 2.4% TABLE 4 – SEXUAL ORIENTATION GROUP HEADS
2015 PERCENTAGE
2015 PERCENTAGE
2014 PERCENTAGE
2013 Bisexual 39 1.0% 1.0% 0.8% Gay man 53 1.4% 1.3% 1.0% Gay woman/lesbian 46 1.2% 1.3% 1.1% Heterosexual/straight 2510 67% 67% 60% Other 15 0.4% 0.5% 0.3% Not declared/prefer not to say 245 6.6% 6.4% 6.1% No data held 816 22% 22% 30% TABLE 5 – RELIGION AND BELIEF GROUP HEADS
2015 PERCENTAGE
2015 PERCENTAGE
2014 PERCENTAGE
2013 Buddhist 37 1.0% 0.9% 0.9% Christian 1019 27% 28% 26% Hindu 26 0.7% 0.6% 0.7% Jewish 9 0.2% 0.3% 0.3% Muslim 44 1.2% 1.1% 1.0% Sikh 5 0.1% 0.1% 0.1% Another religion/belief 104 2.8% 2.8% 1.7% No religion/belief 1341 36% 35% 30% Not declared/prefer not to say 318 8.5% 8.4% 7.9% No data held 821 22% 23% 31% TABLE 6 – TRANS/TRANSGENDER CATEGORY HEADS
2015 PERCENTAGE
2015 PERCENTAGE
2014 PERCENTAGE
2013 Yes 19 0.5% 0.5% 0.5% No 2777 75% 74% 65% Prefer not to say 68 1.8% 1.9% 1.7% No data held 860 23% 24% 33%
31
TABLE 7 – ETHNIC ORIGIN
GROUP HEADS 2015
PERCENTAGE 2015
PERCENTAGE 2014
PERCENTAGE 2013
Asian – Bangladeshi 7 0.2% 0.3% 0.3% Asian – Indian 44 1.2% 1.1% 1.1% Asian – Pakistani 14 0.4% 0.4% 0.4% Asian – Other 33 0.9% 0.7% 0.8% Black – African 44 1.2% 0.9% 0.9% Black – Caribbean 29 0.8% 0.8% 0.8% Black – Other 4 0.1% 0.2% 0.1% Arab 4 0.1% 0.1% 0.1% Chinese 40 1.1% 0.9% 0.8% Mixed – White/African 6 0.2% 0.2% 0.1% Mixed – White/Asian 21 0.6% 0.5% 0.4% Mixed – White/Caribbean 12 0.3% 0.3% 0.3% Mixed – Other 27 0.7% 0.7% 0.6% Other Ethnic background 20 0.5% 0.6% 0.6%
Sub total 305 8.2% 7.6% 7.3% White – British 2721 73% 74% 81% White - English 171 4.6% 4.7% 0.4% White - Gypsy or Traveller 3 0.1% 0.1% - White – Irish 46 1.2% 1.2% 1.3% White – Northern Irish 7 0.2% 0.2% 0.0% White - Scottish 16 0.4% 0.4% 0.1% White - Welsh 62 1.7% 1.6% 0.4% White – Other 269 7.2% 6.9% 5.9%
Sub total 3295 88% 89% 89% Prefer not to say 40 1.1% 1.1% 1.0% No data held 84 2.3% 2.1% 3.1%
Sub total 124 3.3% 3.2% 4.1% All staff 3724 100% 100 % 100%
TABLE 8 – NATIONALITY
GROUP HEADS 2015
PERCENTAGE 2015
PERCENTAGE 2014
PERCENTAGE 2013
British 3313 89% 89% 89% German 33 0.9% 0.9% 0.7% American 29 0.8% 0.6% 0.7% Irish 25 0.7% 0.7% 0.9% Italian 21 0.6% 0.6% 0.5% Polish 18 0.5% 0.4% 0.3% Greek* Indian*
15 15
0.4% 0.4%
0.4% 0.3%
0.4% 0.4%
French 14 0.4% 0.5% 0.3% Canadian 13 0.3% 0.3% 0.3% Spanish 12 0.3% 0.5% 0.4% Australia 11 0.3% 0.3% 0.4%
Sub total 3493 94% 94% 94% All staff 3724 100% 100% 100% *Joint 7th position
32
TABLE 9 – TAKE UP OF FAMILY FRIENDLY LEAVE BY EMPLOYEE GROUP CATEGORY ALL SENIOR
MGMT ACADEMIC ADMIN/
PROF/ TECH MANUAL
Maternity leave 2015 2014 2013
52 55 78
0 1 0
22 15 23
29 36 55
1 3 0
Adoption leave 2015 2014 2013
2 1 0
1 1 0
1 0 0
0 0 0
0 0 0
Paternity leave 2015 2014 2013
35 29 35
1 0 0
13 8
13
17 19 21
4 2 1
Parental leave 2015 2014 2013
5 7 8
0 0 0
3 3 7
2 4 0
0 0 1
Carer’s leave 2015 2014 2013
263 273 263
0 0 0
17 15 40
226 226 197
20 32 26
All leave types 2015
2014
2013
357
9.6%
365 10%
384 10%
2
2.5%
2 2.4%
0
0%
56
3.5%
41 2.6%
83
5.3%
274 15%
285 16%
273 16%
25
12%
37 17%
28
12%
% indicates the proportion of the workforce TABLE 10 – TAKE UP OF CHILD CARE VOUCHERS YEAR ALL MALE FEMALE Heads Heads % Heads %
2015 2014 2013
268 296 277
104 120 112
39% 41% 40%
164 176 165
61% 59% 60%
33
TABLE 11 – CONTRACT TYPE BY EQUALITY GROUP CONTRACT TYPE
YEAR ALL GENDER ETHNICITY DISABLED STATUS MALE FEMALE BME WHITE NOT KNOWN DISABLED NOT
DISABLED / NOT KNOWN
Heads Heads % Heads % Heads % Heads % Heads % Heads % Heads % Permanent Fixed Term Temporary
2015 2014 2013
2015 2014 2013
2015 2014 2013
2914 2849 2740 596 578 642 214 231 218
1226 1200 1160
251 251 284
79 82 74
42% 42% 42%
42% 43% 44%
37% 36% 34%
1688 1649 1580 345 327 358 135 149 144
58% 58% 58% 58% 57% 56% 63% 65% 66%
220 208 181
59 51 60
26 18 21
7.5% 7.3% 6.6%
10% 8.8% 9.3%
12% 7.8% 9.6%
2605 2560 2467
517 502 543
173 202 180
89% 90% 90%
87% 87% 85%
81% 87% 83%
89 81 92
20 25 39
15 11 17
3.1% 2.8% 3.4%
3.4% 4.3% 6.1%
7.0% 4.8% 7.8%
187 189 137
32 27 28
11 12 8
6.4% 6.6% 5.0%
5.4% 4.7% 4.4%
5.2% 5.2% 3.7%
2727 2660 2603
564 551 614
203 219 210
94% 93% 95%
95% 95% 96%
95% 95% 96%
TABLE 12 – MODE OF EMPLOYMENT BY EQUALITY GROUP MODE YEAR ALL MALE FEMALE BME WHITE ETHNICITY
NOT KNOWN
DISABLED NOT DISABLED /
NOT KNOWN Heads Heads % Heads % Heads % Heads % Heads % Heads % Heads %
Full-time Part-time
2015 2014 2013
2015 2014 2013
2183 2097 2022
1541 1561 1578
1120 1072 1046
436 461 472
51% 51% 52%
28% 30% 30%
1063 1025 976
1105 1100 1106
49% 49% 48%
72% 70% 70%
206 179 164
99 98 98
9.4% 8.5% 8.1%
6.4% 6.2% 6.2%
1909 1849 1782
1386 1415 1408
87% 88% 88%
90% 91% 89%
68 69 76
56 48 72
3.1% 3.3% 3.8%
3.6% 3.1% 4.6%
128 127 88
102 101 85
5.9% 6.1% 4.4%
6.6% 6.5% 5.4%
2055 1970 1934
1439 1460 1493
94% 94% 96%
93% 94% 95%
34
Section 2 – Staff Recruitment TABLE 13 – RECRUITMENT BY EQUALITY GROUP ALL MALE* FEMALE* BME WHITE ETHNICITY
NOT KNOWN DISABLED NOT DISABLED
/ NOT KNOWN Heads Heads % Heads % Heads % Heads % Heads % Heads % Heads %
2015 Applied
Shortlisted Appointed
8183 1648 600
3743 689 233
46% 42% 39%
4288 948 364
52% 58% 61%
1646 235 64
20% 14% 11%
6274 1390 531
77% 84% 89%
263 23 5
3.2% 1.4% 0.8%
540 93 40
6.6% 5.6% 6.7%
7643 1555 560
93% 94% 93%
2014 Applied
Shortlisted Appointed
9373 1811 648
4373 720 247
47% 40% 38%
4910 1076 397
52% 59% 61%
1883 277 61
20% 13% 9.4%
7249 1551 576
77% 86% 89%
241 33 11
2.6% 1.8% 1.7%
617 116 37
6.6% 6.4% 5.7%
8756 1695 611
93% 94% 94%
2013 Applied
Shortlisted Appointed
9714 1705 592
4559 744 238
47% 44% 40%
5038 942 350
52% 55% 59%
1793 220 61
18% 13% 10%
7690 1449 521
79% 85% 88%
231 36 10
2.4% 2.1% 1.7%
581 89 32
6.0% 5.2% 5.4%
9133 1616 560
94% 95% 95%
* Data excludes applicants who did not declare a gender. Data relates to the period August to July.
35
TABLE 14 - RECRUITMENT TO THE TEMPORARY STAFF UNIT BANK BY EQUALITY GROUP ALL MALE* FEMALE* BME WHITE ETHNICITY
NOT KNOWN DISABLED NOT
DISABLED / NOT KNOWN
Heads Heads % Heads % Heads % Heads % Heads % Heads % Heads %
2015 Applied
Shortlisted Appointed
154 76 68
36 14 14
23% 18% 21%
116 62 54
75% 82% 79%
24 8 6
16% 11% 8.8%
126 67 61
82% 88% 90%
4 1 1
2.6% 1.3% 1.5%
5 2 1
3.2% 2.6% 1.5%
149 74 67
97% 97% 99%
2014 Applied
Shortlisted Appointed
212 79 60
81 27 21
38% 34% 35%
129 51 38
61% 65% 63%
25 5 5
12% 6.3% 8.3%
180 73 54
85% 92% 90%
7 1 1
3.3% 1.3% 1.7%
11 4 4
5.2% 5.1% 6.7%
201 75 56
95% 95% 93%
2013 Applied
Shortlisted Appointed
436 129 101
143 37 27
33%29% 27%
288 88 71
66% 68% 70%
86 17 14
20% 13% 14%
341 107 83
78% 83% 82%
9 5 4
2.1% 3.9% 4.0%
22 7 4
5.0% 5.4% 4.0%
414 122 97
95% 95% 96%
* Data excludes applicants who did not declare a gender. Data relates to the period August to July.
36
TABLE 15 - INTERNAL RECRUITMENT ONLY BY EQUALITY GROUP ALL MALE* FEMALE* BME WHITE ETHNICITY
NOT KNOWN DISABLED NOT DISABLED
/ NOT KNOWN Heads Heads % Heads % Heads % Heads % Heads % Heads % Heads %
2015 Applied
Shortlisted Appointed
940 538 261
358 197 90
38% 37% 34%
572 337 170
61% 63% 65%
148 62 22
16% 12% 8.4%
771 469 239
82% 87% 92%
21 7 0
2.2% 1.3% 0.0%
53 35 17
5.6% 6.5% 6.5%
887 503 244
94% 93% 93%
2014 Applied
Shortlisted Appointed
1092 659 337
371 233 123
34% 34% 36%
712 432 213
65% 66% 63%
165 79 33
15% 12% 10%
905 567 298
83% 86% 88%
22 13 6
2.0% 2.0% 1.8%
85 55 22
7.8% 8.3% 6.5%
1007 604 315
92% 92% 93%
2013 Applied
Shortlisted Appointed
1055 534 243
396 205 86
38% 38% 34%
654 327 156
62% 61% 64%
123 46 18
12% 8.6% 7.4%
919 485 224
87% 91% 92%
13 3 1
1.2% 0.6% 0.4%
57 23 10
5.4% 4.3% 4.1%
998 511 233
95% 96% 96%
* Data excludes applicants who did not declare a gender. Data relates to the period August to July.
37
Section 3 – Leavers TABLE 16 – LEAVERS BY CATEGORY BY EQUALITY GROUP LEAVER CATEGORY HEADS
MALE FEMALE BME WHITE ETHNICITY
NOT KNOWN DISABLED NOT
DISABLED / NOT KNOWN
Resignation 226 89 137 15 206 5 13 213 Voluntary severance 45 27 18 2 42 1 4 41 End of fixed term contract 108 38 70 9 94 5 8 100 Ill Health 2 1 1 0 2 0 0 2 Death 3 1 2 1 2 0 0 3 Dismissal 3 1 2 1 2 0 0 3 ALL LEAVERS - 2015
387
157
(41%)
230
(59%)
28
(7.2%)
348
(90%)
11
(2.8%)
25
(6.5%)
362
(94%) ALL LEAVERS - 2014
335
132
(39%)
203
(61%)
26
(7.7%)
298
(89%)
11
(3.2%)
58
(17%)
277
(83%) ALL LEAVERS - 2013
353
152
(43%)
201
(57%)
27
(7.6%)
308
(87%)
18
(5%)
21
(5.9%)
332
(94%)
The analysis excludes hourly paid and temporary staff.
38
TABLE 17 – REASONS FOR LEAVING REASON FACULTIES SERVICES TOTALS
2015 TOTALS
2014 TOTALS
2013 Moving out of area 1 4 5 8 12 Returning to education 1 2 3 2 2 Giving up employment 0 1 1 2 2 Personal/domestic reasons 2 3 5 7 7 Promotion/career devel./prospects 5 11 16 25 24 Travel difficulties to/from work 0 1 1 3 3 Physical working environment 1 0 1 1 1 Organisational culture 1 2 3 7 14 Management style 3 3 6 5 9 Working relations 1 1 2 6 3 Workload demands/stress 0 1 1 6 7 Company benefits 1 0 1 1 0 Discrimination/harassment 0 0 0 1 0 Retirement 2 8 10 17 26 Redundancy 0 0 0 2 3 Ill health 0 0 0 1 0 End of fixed term contract 2 2 4 11 9 Seeking a more challenging role 2 2 4 10 5 Seeking more training & development 2 1 3 2 2 Career change 1 2 3 4 4 Higher salary 0 1 1 8 2 Seeking more flexible working 0 2 2 5 4 NUMBER OF RESPONDENTS 21 46 67 77 82 Notes: Data is taken from the exit survey completed by leavers; Prior to 2015, individuals could indicate more than one reason for leaving.
39
Section 4 –Staff Development and Career Progression TABLE 18 – INTERNAL TRAINING ATTENDANCES BY EQUALITY GROUP Year ALL MALE FEMALE BME WHITE ETHNICITY
NOT KNOWN DISABLED NOT
DISABLED / NOT KNOWN
Heads Heads % Heads % Heads % Heads % Heads % Heads % Heads % 2015*** 2014** 2013*
5821 9318 5615
1908 3608 1904
33% 39% 34%
3913 5710 3711
67% 61% 66%
459 751 379
7.9% 8.0% 6.8%
5227 8314 5077
90% 89% 90%
135 253 159
2.3% 2.7% 2.8%
323 642 334
5.5% 6.9% 5.9%
5498 8676 5281
94% 93% 94%
* Includes 612 staff attendances for compulsory fire safety training ** Includes 2845 staff attendances for compulsory fire safety training and 1,863 for equality training (now delivered on-line) *** Includes 777 staff attendances for compulsory fire safety and 606 for equality training (now delivered on-line) TABLE 19 – CAREER PROGRESSION BY EQUALITY GROUP YEAR TOTAL MALE FEMALE BME WHITE ETHNICITY
NOT KNOWN DISABLED NOT
DISABLED / NOT KNOWN
Heads % Heads % Heads % Heads % Heads % Heads % Heads % Heads % 2015 2014 2013
309 355 264
8.8%
10.0% 7.8%
119 133 106
8.1% 9.2% 7.3%
190 222 158
9.3% 11% 8.2%
26 21 18
9.3% 8.1% 7.5%
271 322 238
8.7% 11% 7.9%
12 12 8
11% 11% 6.1%
13 15 11
5.9% 6.9% 6.7%
296 340 253
9.0% 11% 7.9%
% indicates the proportion of the particular group having career progression, not the proportion of all the progression occurrences.
40
TABLE 20 – CAREER PROGRESSION BY TYPE TYPE YEAR TOTAL MALE FEMALE BME WHITE ETHNICITY
NOT KNOWN DISABLED NOT
DISABLED / NOT KNOWN
Heads % Heads % Heads % Heads % Heads % Heads % Heads % Heads % Promotion Regrading Secondment Temporary Upgrade
2015 2014 2013
2015 2014 2013
2015 2014 2013
2015 2014 2013
137 183 133
43 32 23
43 57 30
86 83 78
3.9% 5.3% 3.9%
1.2% 0.9% 0.7%
1.2% 1.7% 0.9%
2.5% 2.4% 2.3%
56 70 49
22 14 15
12 18 13
29 31 29
3.8% 4.8% 3.4%
1.5% 1.0% 1.0%
0.8% 1.2% 0.9%
2.0% 2.1% 2.0%
81
113 84
21 18 8
31 39 17
57 52 49
4.0% 5.7% 4.3%
1.0% 0.9% 0.4%
1.5% 2.0% 0.9%
2.8% 2.6% 2.5%
13 10 10 6 4 2 5 5 2 2 2 4
4.7% 3.9% 4.1%
2.2% 1.5% 0.8%
1.8% 1.9% 0.8%
0.7% 0.8% 1.7%
117 167 117
35 28 20
38 50 27
81 77 74
3.7% 5.5% 3.9%
1.1% 0.9% 0.7%
1.2% 1.6% 0.9%
2.6% 2.5% 2.5%
7 6 6
2 0 1
0 2 1
3 4 0
6.4% 5.7% 4.6%
1.8% 0.0% 0.8%
0.0% 1.9% 0.8%
2.8% 3.8% 0.0%
6 6 9 2 2 1 3 3 0 2 4 1
2.7% 2.8% 5.5%
0.9% 0.9% 0.6%
1.4% 1.4% 0.0%
0.9% 1.9% 0.6%
131 177 124
41 30 22
40 54 30
84 79 77
4.0% 5.5% 3.9%
1.2% 0.9% 0.7%
1.2% 1.7% 0.9%
2.6% 2.5% 2.4%
% indicates the proportion of the particular group having career progression, not the proportion of all the progression occurrences. TABLE 21 – GENDER PAY GAP: TOTAL CONTRACTUAL PAY GROUP 2015 2014 2011 2009 2005 2003
All staff 12.6% 12.8% 14.4% 15.3% 22.4% 20.6%

41
Section 5 – Formal Procedures TABLE 22 – STAFF GRIEVANCES BY EQUALITY GROUP YEAR ALL MALE FEMALE BME WHITE ETHNICITY
NOT KNOWN DISABLED NOT DISABLED/
NOT KNOWN Heads Heads % Heads % Heads % Heads % Heads % Heads % Heads %
2015 6 3 50% 3 50% - - 6 100% - - - - 6 100% 2014 6 3 50% 3 50% 2 33% 3 50% 1 17% 3 50% 3 50% 2013 15 6 40% 9 60% 1 6.7% 14 93% - - - - 15 100% TABLE 23 – STAFF DISCIPLINARIES BY TYPE BY EQUALITY GROUP YEAR/TYPE ALL MALE FEMALE BME WHITE ETHNICITY
NOT KNOWN DISABLED NOT DISABLED/
NOT KNOWN Heads Heads % Heads % Heads % Heads % Heads % Heads % Heads %
2015 Conduct Capability Performance
10 - -
9 - -
90%
- -
1 - -
10%
- -
2 - -
20%
- -
8 - -
80%
- -
- - -
- - -
- - -
- - -
10 - -
100%
- -
Total 2015 10 9 90% 1 10% 2 20% 8 80% - - - - 10 100% Total 2014 8 6 75% 2 25% 1 12% 7 88% - - - - 8 100% Total 2013 9 7 78% 2 22% - - 8 89% 1 11% 1 11% 8 89%
42
Section 6 – Sickness Absence TABLE 24 - SICKNESS ABSENCE RATES BY FACULTY / SERVICE FACULTY/SERVICE DAYS
LOST 2015 INCIDENTS
2015 ABSENCE RATE 2015
ABSENCE RATE 2014
ABSENCE RATE 2013
Arts Creative Inds. & Education 1550 188 1.9% 1.8% 1.5% Business and Law 1403 132 1.9% 1.6% 1.7% Environment and Technology 1375 200 1.3% 1.5% 1.6% Health and Life Sciences 2504 328 1.8% 1.0% 1.8%
Faculty sub total 6832 848 1.6% 1.4% 1.7% Academic Services 1460 366 4.0% 3.2% 4% Commercial Services 58 28 1.5% 1.7% 2.1% Corporate Relations 39 19 1.1% 1.6% - Directorate & other* 79 30 0.7% 0.4% 0.4% Facilities 6338 942 5.5% 5.1% 4% Finance 655 170 2.7% 3.1% 2.7% Human Resources 658 128 4.0% 3.7% 2.6% IT Services 1587 293 3.7% 3.0% 2.4% Library Services 848 281 2.7% 2.2% 2.1% Marketing and Communications 213 63 2.0% 1.9% 1.6% Research, Business & Innovation 779 206 3.8% 3.5% 2.3% Student & Partnership Services 2451 782 3.0% 2.6% 2.6% Strategic Programmes Office 41 19 1.2% 0.6% 1.2%
Service sub total 15206 3327 3.8% 3.4% 3.0% All services excluding manual staff 11664 2852 3.4% 2.9% 2.6% Manual staff only 3542 475 6.3% 6.5% 5.1% All Staff
22038
4175
2.7%
2.4%
2.3%
*Includes Dean of Students, Development & Alumni, CPA, Excludes hourly paid staff.
43
TABLE 25 – SICKNESS ABSENCE RATES BY EQUALITY GROUP YEAR ALL MALE FEMALE BME WHITE ETHNICITY NOT
KNOWN DISABLED* NOT
DISABLED/ NOT KNOWN
2015
2.7%
2.1%
3.2%
2.3%
2.8%
2.3%
4.9%
2.5%
2014
2.4%
2.1%
2.6%
1.7%
2.4%
3.2%
4.7%
2.2%
2013
2.3%
1.8%
2.7%
2.1%
2.3%
3.1%
5.0%
2.2%
*Data includes disability leave and disability related absence. Since 01.04.2015, 7 staff reported disability related absence, amounting to 25 days and 19 incidents.
44
TABLE 26 - REASONS FOR SICKNESS ABSENCE Proportion of days lost Proportion of incidents
REASON 2015 (%) 2014 (%) 2013 (%) REASON 2015 (%) 2014 (%) 2013(%) Stress / depression 26.5% 24.6% 23.4% Cold / flu / virus 30.9% 32.1% 33.5% Hospital admittance 15.3% 11.2% 11.5% Sickness / diarrhoea 10% 11.2% 11.2% Cold / flu / virus 12.6% 14.0% 16.5% Not known 9.1% 8.1% 7.8% Infection 7.3% 6.0% 6.8% Infection 8.9% 7.4% 8.4% Injury 6.8% 4.9% 7.8% Headache / migraine 8.7% 8.3% 8.3% Pain 6.6% 6.9% 2.0% Stomach complaint 6.6% 6.2% 6.1% Not known 3.7% 3.2% 5.2% Stress / depression 6.0% 5.1% 5.4% Back / sciatica 3.5% 4.1% 3.6% Hospital admittance 3.5% 3.2% 2.7% Fatigue 3.5% 2.7% 3.1% Injury 3.1% 3.3% 3.2% Sickness / diarrhoea 2.8% 3.9% 4.0% Back Sciatica 3.1% 3.9% 3.6% Disease 2.4% 4.0% 5.3% Pain 2.1% 2.3% 1.0% Headache / migraine 2.4% 2.3% 2.4% Fatigue 1.7% 1.4% 1.2% Stomach complaint 2.2% 2.7% 2.6% Dizzy spells 1.2% 1.2% 1.0% Heart / blood Pressure
Less than 1%
2.2% 1.2% Dental/oral 1.0% 1.3% 1.3% Dizzy spells 1.4%
Less than 1%
Muscular/ rheumatic 1.4% Eye problems 1.0%
Allergy, Anaemia, Asthma, Arthritis, Dental/oral, Diabetes, Epilepsy, Gynae/ Menstrual, Hospital appointment, Maternity related, Skin complaint.
Less than 1%
Anaemia, Allergy, Arthritis, Asthma, Diabetes, Disease, Eye problems, Gynae/ menstrual, Heart/blood pressure, Maternity related, Muscular/ rheumatic, Hospital appointment, Skin complaint.
Less than 1%
Less than 1%
Less than 1%
45
Section 7 – Employee Assistance Programme (EAP) TABLE 27 – USE OF EAP SERVICES TYPE 2015 2014 2013 HEADS MALE FEMALE HEADS MALE FEMALE HEADS MALE FEMALE
Legal helpline
52
73
89
Telephone counselling helpline
101
151
132
TOTAL HELPLINE USAGE 153
24%
76% 224 31% 69% 221 29% 71%
Referrals for structured counselling
48
71
73
Data relates to the period October to September.