Embed Size (px)
Citation preview

Lincoln Water Cycle Study
Stage 1 – Outline Strategy
The City of Lincoln Council
July 2008
Lincoln Water Cycle Study
Stage 1 – Outline Strategy
The City of Lincoln Council
July 2008


Prepared by: Faraj Arfa-Zangeneh Associate Director
Clive Mason Technical Director
Checked by: Clive Mason
Technical Director
Approved by: Phillip Mcloughlin
Associate Director
Lincoln Water Cycle Study
Rev No Comments Date
Re001A Internal check March 2008
Re001B Draft Report for comments by EA, Councils and AW March 2008
Re001C Draft Report including comments from EA and Councils April 2008
Re001D 2nd
Draft Report, comments added and reformatted April 2008
Re001E 3rd
Draft Report, additional comments added, population growth revised
May 2008
Re001F 4th
Draft Report May 2008
Re001G Draft Report June 2008
Re001H Final Draft Report June 2008
Re001I Final Report July 2008
1 The Forum, Minerva Business Park, Lynch Wood, Peterborough, PE2 6FT Telephone: 01733 391456 Fax: 01733 391139 Website: http://www.fabermaunsell.com Job No 55744 Reference Re001I Date Created: July 2008 This document has been prepared by Faber Maunsell Limited (“Faber Maunsell”) for the sole use of our client (the “Client”) and in accordance with generally accepted consultancy principles, the budget for fees and the terms of reference agreed between Faber Maunsell and the Client. Any information provided by third parties and referred to herein has not been checked or verified by Faber Maunsell, unless otherwise expressly stated in the document. No third party may rely upon this document without the prior and express written agreement of Faber Maunsell. f:\projects\55744i lincoln wcs\report\report\faber maunsell report re001i final.doc


Executive Summary .................................................................................................................... 1
1 Introduction ..................................................................................................................... 5 Background ....................................................................................................................... 5 East Midlands Regional Spatial Strategy.......................................................................... 5 Lincoln Policy Area Sub-Regional Strategy ...................................................................... 5 The Lincoln Policy Area .................................................................................................... 5 Growth in the Lincoln Policy Area ..................................................................................... 6 Objective ........................................................................................................................... 6 Partnership Approach ....................................................................................................... 7 Outputs/Benefits................................................................................................................ 7 The Water Cycle ............................................................................................................... 9 Purpose of the Water Cycle Study.................................................................................. 10
2 A Strategic Approach ................................................................................................... 11 Water Cycle Processes................................................................................................... 11 Development and Provision of Water Cycle Infrastructure ............................................. 11 Challenges - Phasing ...................................................................................................... 11 Development ................................................................................................................... 11 Anglian Water.................................................................................................................. 11 Environment Agency ....................................................................................................... 12 Internal Drainage Boards ................................................................................................ 12 Initial Study...................................................................................................................... 12
3 Data Collection .............................................................................................................. 15 Overview ......................................................................................................................... 15 Housing Growth .............................................................................................................. 15 Water Resources and Supply ......................................................................................... 16 Water Quality................................................................................................................... 17 Sewerage ........................................................................................................................ 17 Sewage Treatment .......................................................................................................... 17 Source of Flood Risk....................................................................................................... 17 Climate Change .............................................................................................................. 18
4 Development Targets.................................................................................................... 19 Overview ......................................................................................................................... 19 Developments in Lincoln Policy Area since 2001 ........................................................... 19 Distribution of New Properties......................................................................................... 20 General Development Patterns and Options .................................................................. 21
5 Catchment Baseline Conditions.................................................................................. 23 Overview ......................................................................................................................... 23 Water Resources and Supply ......................................................................................... 23 Foul Water Sewers.......................................................................................................... 26 Surface Water Sewers .................................................................................................... 26 Sewer Flooding ............................................................................................................... 27 Sewage Treatment Works............................................................................................... 27 Flood Risk ....................................................................................................................... 28 Major Catchments ........................................................................................................... 28 Secondary Sources of Flooding...................................................................................... 30 Residual Risks................................................................................................................. 31 Historic Flooding ............................................................................................................. 31 Overview of Current Demands on Water Cycle Infrastructure........................................ 35 Potential Impact of Implementing Extant Planning Commitments .................................. 35
Table of Contents

6 Outline Strategy ............................................................................................................ 38 Overview ......................................................................................................................... 38 Urban Extension Areas and Brownfield Sites ................................................................. 38 Phasing of Developments ............................................................................................... 41 Options ............................................................................................................................ 42 Strategic Options............................................................................................................. 43
7 Related Issues ............................................................................................................... 46 Overview ......................................................................................................................... 46 Developer Guidelines...................................................................................................... 46 Developer Contributions.................................................................................................. 46 Climate Change .............................................................................................................. 47 SUDS………………………………………….. .................................................................. 47 Water Efficiency Measures ............................................................................................. 48 Stage 2 – Study Content ................................................................................................. 48
8 Conclusions and Recommendations.......................................................................... 50 Overview ......................................................................................................................... 50 Current Situation ............................................................................................................. 50 Impact of Extant Planning Permissions .......................................................................... 50 Developer Involvement ................................................................................................... 51 Summary......................................................................................................................... 51
Appendix A - Development Targets......................................................................................... 54 Table A.1 – Total Housing Commitments for City of Lincoln to 31st March 2007 .......... 54 Table A.2 - Housing Indicators between 1st April 2006 to 31st March 2007.................. 55 Table A.3 – Total Remaining Housing Supply (Extant Permissions) within Lincoln
Policy Area of NKDC........................................................................................... 56 Table A.4 – Housing Completions within Lincoln Policy Area of WLDC......................... 57 Table A.5 - Housing Indicators as of 1st April 2007........................................................ 57 Table A.6 – Total Remaining Housing Supply (Extant Permissions) within Lincoln
Policy Area of WLDC as of 31st December 2006............................................... 58
Appendix B – Water Resources and Water Supply ............................................................... 62 B1 Water Resource Management Units (WRMUs).................................................. 62 B2 WRMUs – Resource Availability Classification................................................... 63 B3 Water Quality ...................................................................................................... 64
Appendix C – Sewerage and Sewage Treatment ................................................................... 68 C1 Catchment Sewerage Models – Current Status ................................................. 68 C2 Location of DG5 Flooding Incidents.................................................................... 70 C3 STWs–Headroom(flow headroom estimated by reference to Flow recorder
readings) ............................................................................................................. 71 C4 Current Status of Main STWs............................................................................. 72
Appendix D – Fluvial Flood Risk.............................................................................................. 74 D1 Hydrometric Sub-Catchments............................................................................. 74 D2 Internal Drainage Board Boundaries .................................................................. 74 D3 Flooding Events .................................................................................................. 74 D4 PPS25 – Aims and Implementation.................................................................... 75
Appendix E – Developers Checklist ........................................................................................ 80 E1 Contact Points..................................................................................................... 80 E2 Items of The Water Cycle To Be Considered ..................................................... 80 E3 ….. Reference Documents ........................................................................................ 82
Appendix F – Water Efficiency Measures ............................................................................... 86 F1 Introduction ......................................................................................................... 86 F2 Water Efficiency Measures ................................................................................. 86 F3 Rainwater Harvesting ......................................................................................... 86 F4 Greywater Recycling........................................................................................... 86
References Abbreviations

Figures (in text) Figure 1.1 – Lincoln Policy Area Boundary Figure 1.2 – Schematic of the Water Cycle Components Figure 3.1 – Lincoln Water Resource Zone Figure 3.2 – Water Resource Planning Zones Figure 5.1 – Forecast of Future Water Supplies and Demands Figure 5.2 – Major Sewage Treatment Works within Lincoln Policy Area Figure 5.3 – Watercourses within Lincoln Policy Area Figure 5.4 – Historical Pluvial Flooding Areas with June 2007 Affected Areas Figure 5.5 – Flood Zone 3 Figure 6.1 – Strategic Options – Sewage Treatment
Tables (in text) Table 1.1 – Settlements within Lincoln Policy Area Table 1.2 – Indicative Project Milestones Table 2.1 – Typical Timescales for New Infrastructure Development Table 2.2 – Constraints Matrix Table 3.1 – Water Resource Planning Zones Table 3.2 – Resource Availability Classifications Table 4.1 – Lincoln Policy Area Development Targets and Completed Dwellings Table 5.1 – Public Water Supply Planning Zones – Available Resources Table 5.2 – Sewage Treatment Works – Headrooms Table 5.3 – Summary of Significant Flooding Events within Lincoln Policy Area Table 6.1 – Major Sites – Constraints Table 6.2 – Possible Phasing for New Development Table 7.1 – SUDS in the Major Growth Areas

- This page intentionally left blank -

Executive Summary


Faber Maunsell Lincoln Water Cycle Study 1
The draft East Midlands Regional Plan (RSS8) designates Lincoln as a “Growth” area and the LPA Sub-Regional Strategy (SRS) identifies that the local authorities in the area should make provision for 28,350 new dwellings over the plan period 2001-2026, based on the following annual housing targets:-
City of Lincoln 524 North Kesteven District Council 440 West Lindsey District Council 170 Total for LPA 1,134 per annum
It was considered that this rate of growth may be constrained by lack of adequate water cycle infrastructure, at a time when new standards of water quality were being required under the Urban Waste Water and Water Framework Directives. Hence, the study was required as the first stage in the development of a strategic approach to the provision of water cycle infrastructure which would help to deliver Lincoln’s growth in a sustainable manner.
The objectives were to:-
� Define the current situation and note key issues relating to elements of the water cycle
infrastructure.
� Consider how implementation of extant planning permissions would impact on the
infrastructure.
� Identify requirements and phasing for new water cycle infrastructure to meet the target
growth numbers over the plan period.
Elements of the water cycle under consideration include water resources, water supply, foul
sewerage, sewage treatment, surface water drainage and fluvial systems.
Initial findings identified several fundamental and significant gaps in the data and policy that will
require resolution/determination during the detailed phase of this study. These issues included:-
� The extent of development in two of the major urban growth areas, i.e. the Western Growth
Corridor (WGC) and the South East Quadrant (SEQ), where numbers of dwellings could
range from 0 to 5,000 and 4,000 to 8,000 respectively.
� The lack of hydraulic models for various sewerage and drainage systems and arterial
watercourses (stage 3 available May 2008 for the Lincoln catchment).
� Lack of a confirmed Water Resource Management Plan (to be published by Anglian Water
later in 2008).
� Lack of an agreed Catchment Flood Management Plan (draft available by the end of May
2008).
Without this it will be extremely difficult to formulate an effective strategy.
Hence, this initial study was aimed at providing a high level of understanding of the relevant
issues and at scoping out the way forward for a more detailed Stage 2 study.
A partnership has been established of all key stakeholders involved in the planning, provision
and operation of drainage assets and water infrastructure in the LPA.
The approach to the study was to collect baseline data from various stakeholders, to analyse
the data and relate it to the potential major urban growth areas. A constraints matrix was drawn
up to indicate the relative degrees of difficulty and costs involved in providing the necessary
infrastructure, and consideration was given to the potential for developer contributions.
References were also made in the study to outputs from the Lincoln Integrated Urban Drainage
Pilot study.
Executive Summary

Faber Maunsell Lincoln Water Cycle Study 2
Key findings of the study, in relation to the existing situation, were:-
� Water resources and supply mains currently adequate, but Anglian Water are planning
phased additions to secure supplies for the future. (Phase 1 – probably 2015 – possibly
River Trent water treated at Newton).
� Some sewerage networks have capacity problems (e.g. Stamp End, Bracebridge Heath and
northern fringes of Lincoln) and Anglian Water are reviewing future programmes of hydraulic
modelling.
� Out of the 24 STWs in the LPA, five have flow headroom for more than 1,000 dwellings and
four have headroom for between 200 and 800 dwellings. However, of these nine, four have
process headroom issues. Canwick STW has the most flow headroom (11,233), but it also
has process headroom issues. No strategic planning has been done to cater for future
growth, and water quality modelling may be required.
� Lincoln is well protected against fluvial flooding, but pluvial flooding has increased over
recent years. Residual risks exist, from possible breaching of raised flood defence
embankments, and Internal Drainage Boards are key in controlling ground water levels and
surface water flows in low lying areas.
� Guideline for developers have been produced by the LIUD Group and to ensure an
integrated approach, drainage proposals from significant development sites are considered
by the Lincoln Drainage Group.
If extant planning permissions are implemented, they should not create significant problems for
Water Resources or at STWs. Neither will they necessitate major, new investment in flood
defences. However, developments could exacerbate problems in sewerage networks and lead
to an increase in pluvial flooding. Arterial systems could also be affected and improvements
may be required with contributions from developers. Flood defence mitigation measures may
be required and sites in Zone 3(a) will have to pass the Exception Test, as per PPS25.
Strategically, extant permissions do represent significant proportions of available flow
headroom at some STWs, e.g. 42% at Canwick, 34% at North Hykeham and 29% at
Skellingthorpe. If these permissions are taken up over the next few years, then taking into
account lead times, plans for future works extensions should be developed in the near future.
The overall conclusions were that to meet the target growth by 2026, the following issues will
have to be addressed during stage 2 of the study:-
� A better indication of the number and location of dwellings in major urban growth areas and
in rural settlements will have to be determined.
� Water resources will have to be supplemented, as currently being planned by Anglian Water.
� New water supply trunk mains will be required, possibly to all three major urban growth
areas.
� New foul sewerage outfalls will be required from the NEQ and the SEQ, and possibly from
the WGC (depending on the number of dwellings finally agreed).
� Improvements to existing sewerage networks should be considered, where appropriate, in
conjunction with the provision of new outfall sewers (e.g. to relieve flooding in the Stamp End
area, Bracebridge Heath, etc). Hydraulic models may be required.
� Some phased extensions to STWs will be required, depending on the numbers of dwellings
in the various locations. Options exist for the major urban growth areas, including extensions
at Canwick, North Hykeham, South Hykeham and Skellingthorpe STWs.
� Some extensions may be required at STWs serving “villages” and some land purchases may
be necessary (again, depending on final numbers of dwellings agreed).
� Consideration will have to be given to the contents of the CFMP, in particular to the flood risk
management policies e.g. to the strategic options for attenuation of surface water (at the
NEQ and the SEQ).
� Appropriate SUDS techniques should be used, depending on the geology and soil conditions
of individual sites.
Faber Maunsell Lincoln Water Cycle Study 3
� Long-term planning of flood defences should take into account the latest advice on impacts
of Climate Change (as currently defined in PPS25).
� Significant contributions from developers need to be defined.
The study has found no over-riding technical constraints which could prevent the proposed level
of growth in the LPA, but several issues require relatively urgent attention, if timescales are to
be met.
In summary, the recommendations from this study are that the issues identified in the above
conclusions should be pursued further in a Stage 2 study, and that Anglian Water Services
should consider commencement of preliminary strategic planning for STW extensions to serve
the major urban growth areas.

Faber Maunsell Lincoln Water Cycle Study 4
- This page intentionally left blank -
Faber Maunsell Lincoln Water Cycle Study 5
Background
1.1 The need for a water cycle strategy has come about through the identification of water
infrastructure as a significant potential constraint to the rate and nature of growth in Lincoln. It
will therefore require supply and demand management to manage sub-regional water levels
and the Lincoln Water Cycle Study (LWCS) will move this process forward.
1.2 The Urban Waste Water Treatment (UWWT) and Water Framework (WF) Directives demand
new standards of water quality. Water companies and regulators are major stakeholders for
delivering these new standards. The baseline situation is expected to be exacerbated by the
forecast pressures of climate change (including increased flood risk) and the extent of existing
committed development. In this context, it is essential that key stakeholders address the three
main water issues of supply, quality and flooding in an integrated and strategic way.
East Midlands Regional Spatial Strategy
1.3 The East Midlands region covers Derbyshire, Leicestershire, Lincolnshire, Northamptonshire,
Nottinghamshire and Rutland. The Draft East Midlands Regional Spatial Strategy (RSS)
provides a broad development strategy for the East Midlands up to 2026. The RSS identifies
the scale and distribution of provision for new housing and priorities for the environment,
transport, infrastructure, economic development, agriculture, energy, minerals and waste
treatment and disposal.
1.4 The Draft RSS has been developed in the context of the Integrated Regional Strategy which
aims to ensure the plan should be drawn up within an overarching sustainable development
framework.
1.5 The Draft RSS underwent an independent ‘Examination in Public’ between June-July 2007
where a government appointed panel considered the draft plan. Following the examination, the
Panel produced a report in November 2007 containing a number of recommendations. These
recommendations will be considered by the Secretary of State who is expected to release
proposed changes in Summer 2008 followed by the final report in Winter 2008.
Lincoln Policy Area Sub-Regional Strategy
1.6 The Lincoln Policy Area Sub-Regional Strategy (SRS) aims to set out a strategic context for the
strengthening of Lincoln’s role as a Principal Urban Area. Originally defined and approved in
the Lincolnshire Structure Plan 2006, the SRS provides additional direction and guidance to
Local Development Frameworks on strategic issues relating to the City of Lincoln and the
surrounding area.
The Lincoln Policy Area
1.7 Lincoln Policy Area boundary is shown in Figure 1.1and falls within three administrative local
authority boundaries. The LWCS study area is defined as the extent of the Lincoln Policy Area
1.8 Table 1.1 shows the settlements within each local authority.
1 Introduction

Faber Maunsell Lincoln Water Cycle Study 6
Table 1.1 – Settlements within Lincoln Policy Area
Local Authority Area Settlements in Lincoln Policy Area
City of Lincoln Council Entire City of Lincoln
North Kesteven District
Council
Aubourn & Haddington, Bassingham, Boothby Graffoe,
Bracebridge Heath, Branston & Mere, Canwick, Coleby,
Doddington & Whisby, Dunston, Eagle & Swinethorpe,
Harmston, Heighington, Nocton, North Hykeham, North
Scarle, Potterhanworth, Metheringham, Skellingthorpe, South
Hykeham, Thorpe on the Hill, Thurlby, Waddington,
Washingborough, Witham St.Hughs
West Lindsey District
Council
Bardney, Dunholme, Fiskerton, Nettleham, Saxilby,
Scampton, Sudbrooke, Welton
Growth in the Lincoln Policy Area
1.9 New Growth Point status for the Lincoln Policy area was awarded in October 2006. Over the
next 10 years and beyond, Lincoln will expand its role as the principal urban area in the county
of Lincolnshire by delivering a fundamental change in the level of housing and economic growth
in the city and wider area, principally through the development of a series of key sites in and
around the city. This will lead to an increase in the number, quality and variety of houses that
cater for all requirements; higher population numbers; a larger business base; and a higher
quality and quantity of jobs for local people. This will also be supported by the provision of the
necessary strategic green infrastructure.
Objective
1.10 On behalf of Lincoln Area Strategic Planning Joint Advisory Committee1 (LASPJAC), the
Environment Agency and its partners have identified the need to evaluate the impact of future
development in the Lincoln Policy Area on the existing capacity and standards of:
� Water resources, including supply and demand,
� Foul, surface water, and combined sewage drainage systems,
� Sewage treatment infrastructure,
� Fluvial systems,
1.11 The study was commissioned to generate information and mathematical models that would
inform future land use decisions. The study will identify the environmental capacity (and
shortfalls) for each of these systems for a range of scenarios, being;
� Those based upon the demands placed by current development in the area,
� Those which are generated by current development and existing housing commitments
(those with extant permissions),
� Those generated assuming the development proposed within the Growth Point Bids takes
place including the strategic urban extensions as proposed in the Draft Lincoln Policy Area
Sub-Regional Strategy within RSS8 (the scope of the study will initially consider 1700
dwellings at Western Growth Corridor (WGC) as per Lincolnshire Structure Plan with
flexibility for review following determination by Secretary of State.
1.12 Stage 1 Outline Strategy - To produce a strategy for water infrastructure provision to help
deliver Lincoln’s growth in a sustainable way. The outline strategy will provide a common
framework for Lincoln Policy Area’s developers, water companies and water regulators to work
to by ensuring that water infrastructure is co-ordinated during development planning and
maximises opportunities for private investment.
1 A joint member/officer advisory committee made up of representatives from Lincolnshire County Council, City of
Lincoln, West Lindsey District and North Kesteven District Councils, Environment Agency, Lincolnshire Association Local Councils, GOEM, Natural England).

Faber Maunsell Lincoln Water Cycle Study 7
1.13 Stage 2 Detailed Strategy - A Stage 2 Water Cycle Strategy will inform Local Development
Framework (LDF) and will be needed to detail necessary water infrastructure and provide a co-
ordinated investment plan.
1.14 The overall study involves the following activities:
� Data collection and collation, working closely with the stakeholders identified in 1.15, to
establish the baseline situation with regard to water services
� Consultation with the above consultees to establish future constraints and opportunities
� Provision of a Strategic Overview of water services requirements to highlight areas of
development constraints or development opportunities
� Make use of LIUD study to assess the key issues facing Lincoln associated with surface
water drainage.
� Production of a report to describe each work area and the particular issues relevant to the
Lincoln Policy Area.
Partnership Approach
1.15 The study will be undertaken with the assistance of the key local stakeholders, involved in the
planning, provision, and operation of drainage assets and water infrastructure in the Lincoln
Policy Area. The members act as a point of reference for data collection and provide an
understanding of water cycle issues in the Lincoln Policy Area.
1.16 The local stakeholders group consists of representatives from the following organisations:
� City of Lincoln Council (CLC), [Accountable Body]
� Environment Agency (EA), [Project Manager]
� North Kesteven District Council (NKDC)
� West Lindsey District Council (WLDC)
� Anglian Water Services Ltd. (AWS)
� Lincolnshire County Council (LCC)
� Upper Witham Internal Drainage Board (UWIDB)
� Witham First Internal Drainage Board (WFIDB)
� Witham Third Internal Drainage Board (WTIDB)
1.17 The City of Lincoln Council appointed Faber Maunsell Ltd, in October 2007 to undertake a
Stage 1, Outline Water Cycle Study covering the Lincoln Policy Area. Faber Maunsell Ltd
carried out most of the supporting work such as gathering data, organising meetings, technical
testing of options and reporting results. There will be some outputs from the ongoing Lincoln
Integrated Urban Drainage Pilot Study (LIUD) feeding into the LWCS
Outputs/Benefits
1.18 It is anticipated the "tools" developed in this process will be used in respect of all future land
use decisions in the Lincoln Policy Area, and an important output will be the development of a
mechanism that may be used by the Local Planning Authorities to levy developer contributions
where appropriate.
� The outline strategy will enable the planning and phasing of Lincoln’s major urban
extensions.
� The detailed strategy will then enable planning permissions to incorporate infrastructure
requirements to deliver the growth in a timely and sustainable manner.
� In combination, the studies will lever private sector investment and dovetail this with public
and utility infrastructure.
� Indirect benefits to the environment will be to water quality, water resources and flood risk –
including surface water management.
Indicative project milestones are shown below in Table 1.2.

Faber Maunsell Lincoln Water Cycle Study 8
Table 1.2 - Indicative Project Milestones
Date Milestone
Stage 1 - Outline Lincoln Water Cycle Strategy
Project start
January 2008 Baseline data collected, agree and set out main issues and options
June 2008 Outline WCS report issued
Stage 2- Detailed Lincoln Water Cycle Strategy
July 2008 Agreement of consultancy proposals and project start
September 2008 Test main issues and options
December 2008 First draft of report produced
February 2009 Second draft of report produced
April 2009 Final report submitted and project completed
Faber Maunsell Lincoln Water Cycle Study 9
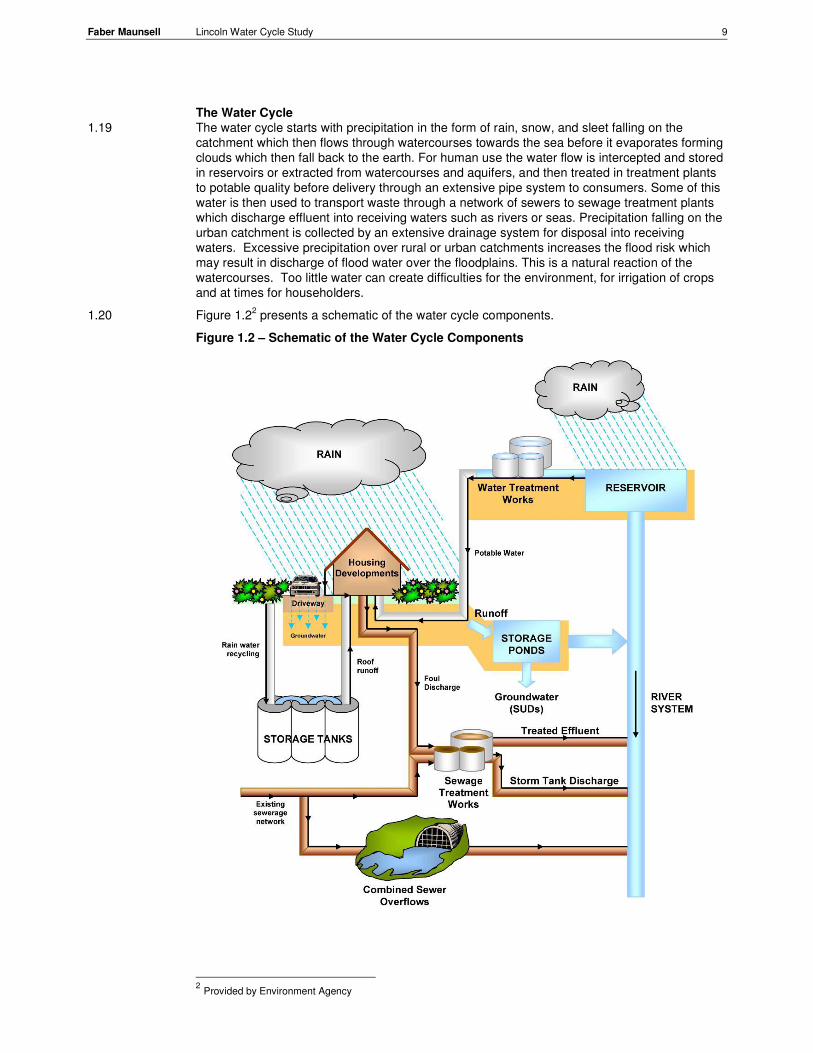
The Water Cycle
1.19 The water cycle starts with precipitation in the form of rain, snow, and sleet falling on the
catchment which then flows through watercourses towards the sea before it evaporates forming
clouds which then fall back to the earth. For human use the water flow is intercepted and stored
in reservoirs or extracted from watercourses and aquifers, and then treated in treatment plants
to potable quality before delivery through an extensive pipe system to consumers. Some of this
water is then used to transport waste through a network of sewers to sewage treatment plants
which discharge effluent into receiving waters such as rivers or seas. Precipitation falling on the
urban catchment is collected by an extensive drainage system for disposal into receiving
waters. Excessive precipitation over rural or urban catchments increases the flood risk which
may result in discharge of flood water over the floodplains. This is a natural reaction of the
watercourses. Too little water can create difficulties for the environment, for irrigation of crops
and at times for householders.
1.20 Figure 1.22 presents a schematic of the water cycle components.
Figure 1.2 – Schematic of the Water Cycle Components
2 Provided by Environment Agency

Faber Maunsell Lincoln Water Cycle Study 10
1.21 Development activities on any catchment should be placed in the context of the catchment and
its existing water cycle components such as water resource, sewage infrastructure and
drainage, as well as available land for development. The potential impacts of new
developments and their requirements should be taken into consideration through a strategic
approach and investment programme. This requires close co-operation between the authorities
involved.
Purpose of the Water Cycle Study
1.22 A water cycle strategy enables the implications of growth and development to be mapped out
against water services infrastructure. By undertaking a water cycle strategy, organisations
responsible for managing development are able to set out what water supply and treatment
infrastructure is needed to be in place, by when and what it may cost. The study will enable the
necessary planning and implementation of water related infrastructure to be carried out in time
to meet the needs of new housing and employment.
1.23 Local Authorities are required to build up an ‘Evidence Base’ to support their Local
Development Frameworks and the water cycle study will be a key piece of evidence in
considering the impacts of growth in relation to water management. The study could identify
constraints to water cycle infrastructure provision.
1.24 The study will be undertaken in two stages.
Stage 1 – Outline Study
1.25 This involves scoping as well as the outline strategy to overview the key issues relating to the
water cycle namely water resources, water supply, sewerage, sewage treatment and flooding to
ensure that new proposed developments do not overwhelm the existing water infrastructure,
and to identify any potential constraints restricting the growth within the Lincoln Policy Area.
The functions provided by the built system of water supply, wastewater and drainage
infrastructure are commonly referred to as water services. The objectives of the LWCS were
proposed to provide fundamental information on:
� The potential requirement for water services to 2026
� The environmental capacity of the region to meet those requirements
� The water services that would come under the most stress
� The reliability, over the long-term, of water services
� Development away from sensitive areas such as floodplains and statutory designated
environmental sites.
Stage 2 – Detailed Study
1.26 Building on the findings of stage 1 the stage 2 detailed strategy will involve further technical
study in conjunction with the Local Development Framework (LDF) process and site allocation
and catchment management planning in the form of integrated management of land uses in
catchment areas ensuring that the required water services can be put in place prior to or at the
same time as the completion of the new developments. This should be combined with more
integrated management of water services with efficient water use and surface water discharge.
1.27 Stage 1 of the LWCS is a desktop study exercise drawing on a body of existing technical work
produced by the local authorities and their statutory partners identifying the constraints and
opportunities for growth at a strategic level.

Faber Maunsell Lincoln Water Cycle Study 11
Water Cycle Processes
2.1 Section 1.20 illustrates the processes involved in the water cycle. Development in any area can
impact on some or all of the processes, depending on its extent and location and on the
capacity of the current water infrastructure. To maximise benefits and minimise adverse
impacts on the environment, an integrated approach is required for the future provision of water
infrastructure which takes into account the demands created by the predicted rates of
development.
Development and Provision of Water Cycle Infrastructure
2.2 An overall, integrated or “strategic” approach will only be achieved if all relevant key
stakeholders, are involved, and if investment programmes are phased appropriately.
2.3 Some development could possibly be directed to areas where surplus capacity exists in current
water cycle infrastructure. Some could be delayed pending the provision of new or improved
infrastructure.
2.4 Hence, policies in the emerging LDFs of the three local authorities, Anglian Water’s investment
programmes and the Environment Agency’s/Internal Drainage Board’s investment programmes
are key factors. Phasing of investment should be such that water services are available in
advance of new developments without detriment to existing customers or the environment.
Challenges - Phasing
2.5 Achieving effective co-ordination is challenging because of the following factors:-
� Differing policies of the various organisations.
� Phasing of investment may not be synchronised between the various authorities.
� External factors may alter plans and programmes.
� Financial constraints may limit development/investment opportunities.
The following four sections identify some of the challenges of timing and phasing which have to
be addressed to develop an integrated strategy.
Development
2.6 The extent of development in the LPA will only be definitive following directions given by the
Secretary of State. When definitive figures are available, some revisions may be required to
emerging LDFs and new or altered development sites may be designated. Potential conflicts
between the LPA growth target and those of individual Local Planning Authorities may have to
be resolved, e.g. the extent of development in villages. This process, involving public
consultation, could be relatively lengthy (i.e. say 2 to 3 years).
2.7 Local Authority Development Plans can, sometimes, be altered quite significantly by proposals
which are promoted (and sometimes “justified”) by developers on sites not previously included
in the Development Plans. Usually “windfall sites” are relatively small, but sometimes they can
be large and consideration of them can involve appeal procedures, public enquiries, etc.
Hence, “lead in” times for these types of development can extend to 18 months to 3 years.
“Windfall” sites may help to achieve the overall growth targets.
Anglian Water
2.8 Because of the lead times for progression of new infrastructure AWS require detailed
information on likely housing developments up to 2026 well in advance if they are to plan and
provide the required water infrastructure.
2 A Strategic Approach
Faber Maunsell Lincoln Water Cycle Study 12
2.9 As part of the water industry management process AWS are required to develop an Asset
Management Plan (AMP), which is reviewed by OFWAT and used to determine the customer
bill limits and thus the level of capital investment over successive five-year periods. This is a
robust and well-rehearsed funding mechanism that has been completed for the period 2005-
2010. The next review will take place in 2009, and Anglian Water are currently working on a
business plan (PR09).
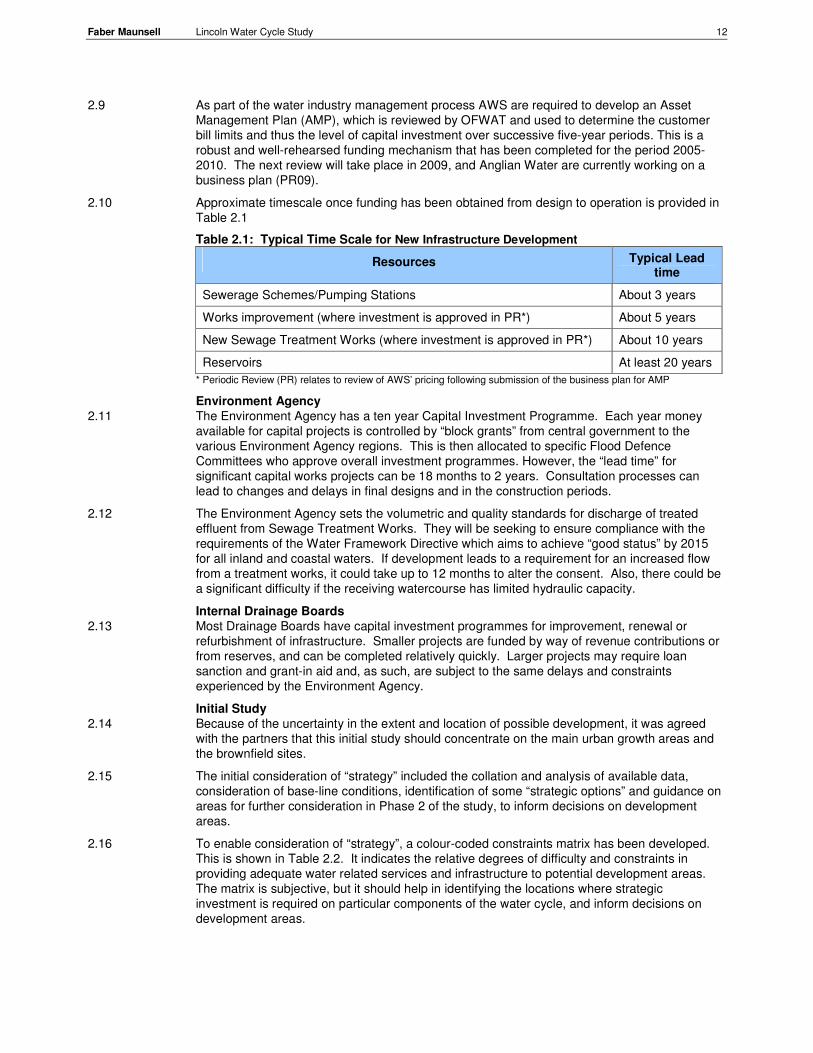
2.10 Approximate timescale once funding has been obtained from design to operation is provided in
Table 2.1
Table 2.1: Typical Time Scale for New Infrastructure Development
Resources Typical Lead time
Sewerage Schemes/Pumping Stations About 3 years
Works improvement (where investment is approved in PR*) About 5 years
New Sewage Treatment Works (where investment is approved in PR*) About 10 years
Reservoirs At least 20 years
* Periodic Review (PR) relates to review of AWS’ pricing following submission of the business plan for AMP
Environment Agency
2.11 The Environment Agency has a ten year Capital Investment Programme. Each year money
available for capital projects is controlled by “block grants” from central government to the
various Environment Agency regions. This is then allocated to specific Flood Defence
Committees who approve overall investment programmes. However, the “lead time” for
significant capital works projects can be 18 months to 2 years. Consultation processes can
lead to changes and delays in final designs and in the construction periods.
2.12 The Environment Agency sets the volumetric and quality standards for discharge of treated
effluent from Sewage Treatment Works. They will be seeking to ensure compliance with the
requirements of the Water Framework Directive which aims to achieve “good status” by 2015
for all inland and coastal waters. If development leads to a requirement for an increased flow
from a treatment works, it could take up to 12 months to alter the consent. Also, there could be
a significant difficulty if the receiving watercourse has limited hydraulic capacity.
Internal Drainage Boards
2.13 Most Drainage Boards have capital investment programmes for improvement, renewal or
refurbishment of infrastructure. Smaller projects are funded by way of revenue contributions or
from reserves, and can be completed relatively quickly. Larger projects may require loan
sanction and grant-in aid and, as such, are subject to the same delays and constraints
experienced by the Environment Agency.
Initial Study
2.14 Because of the uncertainty in the extent and location of possible development, it was agreed
with the partners that this initial study should concentrate on the main urban growth areas and
the brownfield sites.
2.15 The initial consideration of “strategy” included the collation and analysis of available data,
consideration of base-line conditions, identification of some “strategic options” and guidance on
areas for further consideration in Phase 2 of the study, to inform decisions on development
areas.
2.16 To enable consideration of “strategy”, a colour-coded constraints matrix has been developed.
This is shown in Table 2.2. It indicates the relative degrees of difficulty and constraints in
providing adequate water related services and infrastructure to potential development areas.
The matrix is subjective, but it should help in identifying the locations where strategic
investment is required on particular components of the water cycle, and inform decisions on
development areas.

Faber Maunsell Lincoln Water Cycle Study 13
Table 2.2 - Constraints Matrix
Water Resources Sewage , Wastewater Fluvial Flood Risk
Water
Resource
Availability
Water Supply
Network
Sewer Network Treatment Works Surface Water Drainage
and Pluvial Flood Risk
Z1 Z2 Z3
Water resource available to meet planned growth.
Existing network available with spare capacity
Existing sewer network can accommodate the proposed development
Existing STW flow headroom can accommodate the proposed development and there are no compliance issues
Low risk of flooding on site or downstream.
Flood Zone 1: Low Probability (<0.1%)
Water resource available but may need new source to meet growth.
Existing network available with no spare capacity
Existing sewer network may need to be upgraded
Existing STW flow headroom can accommodate the proposed development but there are compliance issues
Medium risk of flooding on site or downstream.
Flood Zone 2: Medium Probability (1% - 0.1%)
Existing resource not adequate to meet growth.
No existing network available to serve growth area.
Existing sewer network can not accommodate the proposed development
Existing STW flow headroom can not accommodate the proposed development
High risk of flooding on site or downstream.
Flood Zone 3: High Probability (>1%)

Faber Maunsell Lincoln Water Cycle Study 14
- This page intentionally left blank - .
Faber Maunsell Lincoln Water Cycle Study 15
Overview
3.1 A desk based assessment has been undertaken to gather information on the Lincoln Policy
Area. This preliminary assessment has involved a review of available data to gain a broad
overview of water related existing issues, backed up by discussions with key stakeholders.
Further investigation is envisaged in the stage 2 of the water cycle study, in order to confirm the
recommendations in respect of water services and development potential within the study area.
This chapter describes the sources of data used in the study.
Consultation
3.2 Consultation was carried out with each of the local authority partners in addition to the
Environment Agency and AWS. GIS layers have been obtained from various organisations in
order to map information in the Lincoln Policy Area. The outputs from the collection of baseline
data has been forwarded to each of the above authorities to ensure that all key information
have been identified during the assessment.
The assessment of the baseline data is given in Chapter 5.
Relevant Published Material
3.3 This involved a review of existing published material. A list of all references reviewed can be
found at the end of this document.
Internet Search
3.4 The internet pages of the relevant organisations were searched for information relating to the
water cycle within Lincoln Policy Area.
Housing Growth
3.5 Regional housing provision is set out in the Draft Regional Plan Policy 14 (RPP14)
3.6 The Lincoln Policy Area Sub-Regional Strategy (SRS) Policy 2 recommends that the
appropriate sites for new development should be allocated having regard to the following order
of preference3:
� Central Lincoln;
� Elsewhere in the built up area of Lincoln and North Hykeham where they are accessible to
local facilities, and are well served or are capable of being well served by public transport,
and/or they are within convenient walking or cycling distance of central Lincoln;
� On the edge of the built up area having regard to the environmental factors set out in Lincoln
Policy Area SRS Policy 3 and elsewhere in the Regional Plan, and where they are
accessible to local facilities or are well served or are capable of being well served by public
transport, cycling and pedestrian links to existing local facilities;
� In appropriate settlements elsewhere in the policy area which have a range of existing
services and facilities including regular access by public transport and having regard to
regeneration needs and the environmental factors set out in Lincoln Policy Area SRS Policy
3 and elsewhere in the Regional Plan.
3.7 According to Draft East Midlands Regional Plan (RSS8), in line with Regional Plan Policy 2, the
suitability of previously developed land should be assessed as first priority within the sequential
preference above before consideration is given to greenfield sites. Land will be subject to
phasing where appropriate and consistent with this strategy so as to ensure that its release is in
accordance with the above order of preference and priority.
3 Draft East Midlands Regional Plan (RSS8)
3 Data Collection

Faber Maunsell Lincoln Water Cycle Study 16
Water Resources and Supply
3.8 Information on strategic water resources and the existing water supply infrastructure within the
Lincoln Policy Area was provided by Anglian Water Services. Related data is included in
Appendix B.
3.9 The study area falls wholly within Anglian Water’s Lincoln Water Resource Zone. The Lincoln
Water Resource Zone is divided into ten Water Resource Planning Zones, as shown in Table
3.1.
Table 3.1 – Water Resource Planning Zones
Zone Principal Urban Areas Impact on Lincoln WCS
Everton Wholly outside LWCS
East Retford Retford Wholly outside LWCS
Gainsborough Gainsborough Wholly outside LWCS
Waddingham Southern fringe of Zone within LWCS
Welton Wholly within LWCS
Branston Wholly within LWCS
LINCOLN Lincoln Largely within LWCS except southern end and western edge of zone
Grantham Grantham Wholly outside LWCS
Sleaford Sleaford Wholly outside LWCS
Billingborough Wholly outside LWCS
3.10 The western side of the Lincoln WR Zone falls within the Environment Agency’s Midlands
Region and two of the Lincoln WR Planning Zones (Everton and East Retford) lie west of the
River Trent. Only four of the ten WP Planning Zones fall wholly or partly within the LWCS area.
The relationship between the Lincoln Water Resource Zone, the Water Resource Planning
Zones and the study area are shown in Figures 3.1 and 3.2.
3.11 Information about water abstraction was obtained from the Environment Agency’s Witham
Catchment Abstraction Management Strategy (CAMS) report. CAMS are strategies for the
management of water resources at a local level. They make information on water resources
and abstraction licensing practice publicly available and allow the balance between the needs
of abstractors, other water users and the aquatic environment to be considered in consultation
with the local community and interested parties. Table 3.2 shows Resource Availability Status
categories as defined within the CAMS.
Table 3.2 – Resource Availability Classifications Indicative Resource Availability Status
Licence Availability
Water available Water is likely to be available at all flows including low flows. Restrictions may apply.
No water available No water is available for further licensing at low flows. Water may be available at higher flows with appropriate restrictions.
Over-licensed
Current actual abstraction is such that no water is available at low flows. If existing licences were used to their full allocation they could cause unacceptable environmental damage at low flows. Water may be available at high flows, with appropriate restrictions.
Over-abstracted Existing abstraction is causing unacceptable damage to the environment at low flows. Water may still be available at high flows, with appropriate restrictions.
Faber Maunsell Lincoln Water Cycle Study 17
3.12 In areas where groundwater resources are significant, Groundwater Management Units
(GWMUs) are defined within the CAMS report.
3.13 The domestic per-capita consumption figures for the area supplied by AWS as reported by
OFWAT in their report entitled “Security of Supply” for 2006/07 are as follows:
� Un-metered household 155.8 litres/head/day
� Metered household 136.9 litres/head/day
� Average household 146.0 litres/head/day
3.14 OFWAT guidance for the estimation of per capita wastewater figures is 95% of un-metered
supply (148 litres/head/day) and 90% of metered supply (123 litres/head/day).
Water Quality
3.15 Information about water quality was obtained from the CAMS report and the Environment
Agency.
Sewerage
3.16 Water Industry Act 1991, Section 94 places a duty upon a sewerage undertaker to provide,
improve and extend a system of public sewers to ensure that its area is effectually drained and
the contents of those sewers effectually dealt with. In doing so, it must also make provision for
trade effluent.
Foul Water Sewers
3.17 Information about the existing foul water sewer was provided by AWS and additional
information was obtained from the LIUD. AWS do not hold records for private foul water
systems.
Combined Sewers
3.18 Again, information about the existing combined sewers was provided by AWS and additional
information was obtained from the LIUD.
Surface Water Sewers
3.19 Information about the existing surface water sewerage systems was provided by AWS and
additional information was obtained from the LIUD. Some surface water drainage systems are
maintained by the County Council Highways Department but full records are not available.
There is no requirement in the Highways Act to maintain drainage records.
3.20 AWS is not responsible for soakaways, land drainage, highway drainage or private surface
water systems. It is currently reconsidering its position regarding the possible adoption of
certain types of SUDS installations.
Sewage Treatment
3.21 Information about the existing STWs was provided by AWS. There may be some privately
operated works which serve certain residential estates and have not been adopted by AWS.
Data related to sewerage and sewerage treatment is included in Appendix C.
Source of Flood Risk
3.22 The Lincoln Policy Area falls within the catchment of the River Witham with its three major
tributaries; the Rivers Till, Brant and Fossdyke Canal. The River Witham flows through the City
of Lincoln. The River Till drains into the Fossdyke Canal at Odder Farm west of Lincoln. The
Fossdyke Canal joins the River Witham in Lincoln at Brayford Pool. The River Brant discharges
into the River Witham south of the City, west of Waddington. The River Witham drains into the
Wash at Boston.
3.23 The information regarding the catchment of the main rivers was obtained from the Environment
Agency. This data includes:
� Flood Zones 2 and 3
� Flood Watch Areas
� Locations and types of defences
3.24 CFMPs should provide a high-level planning tool to identify and agree policies for sustainable
flood risk management. They are used to inform and support planning policies such as local
development plans, land use plans and the implementation of the WFD. The River Witham draft
CFMP is currently (May 2008) being prepared by the Environment Agency.

Faber Maunsell Lincoln Water Cycle Study 18
3.25 The Witham River Basin Management Plan (WRBMP) is currently being prepared by the
Environment Agency in partnership with various organisations in the Witham catchment. A river
basin management plan is a tool used for implementing the requirements of the WFD and each
plan will be reviewed on a six-yearly cycle. Main objectives include:
� Reducing pollution
� Promoting sustainable use of water
� Reducing the effects of floods and droughts.
3.26 Other flood risk information was obtained from IDBs and local authorities, particularly where
they have, or had in the past, responsibility for maintenance of local watercourses. The majority
of Critical Ordinary Watercourses (COWs), which were historically under control of local
authorities and IDBs have now been en-mained (classified as main rivers) and so fall under the
jurisdiction of the Environment Agency.
3.27 Flood risk information obtained from local authorities included:
� Details of flooding hotspots identified in the LIUD Pilot Study
� Local plans
� Feasibility studies for flood alleviation works
� Flood emergency plans and flood risk policy statements.
Data related to fluvial flood risk is included in Appendix D.
Climate Change
3.28 Every water cycle is part of a much larger regional and global water cycle that is affected by
global processes such as climate change. These global processes provide additional risk
factors for the management of water services with increased climatic disturbances and extreme
weather events such as severe droughts and heavy rainfalls.
3.29 There is growing evidence of global climate change as a result of human activities. The UK
Climate Impacts Programme (UKCIP) is funded by the Department of the Environment to
investigate the potential impacts of climate change in the United Kingdom. The UKCIP has
produced assessments of the potential impacts based on rates of increase in global
greenhouse gas emissions consistent with the projections of the Intergovernmental Panel on
Climate Change (IPCC). In 1998 the UKCIP published their Technical Report No. 1 entitled
“Climate Change Scenarios for the United Kingdom”. Revised scenarios referred to as the
UKCIP02 scenarios were published in April 2002. The UKCIP02 scenarios are based on new
global emission scenarios published in 2000 by the Intergovernmental Panel Report on
Emission Scenarios, and utilise global climate modelling carried out by the Hadley Centre of the
Meteorological Office using their most recently developed models.
3.30 Planning Policy Statement 25 (PPS25), Annex B, sets out the impacts of climate change that
must be taken into consideration for new development that may be affected by flooding. The
climate change predictions in PPS25 should therefore be used in relation to planning rather
than any other predictions/scenarios.
3.31 The extent of the possible impacts of climate change in the future is by no means certain.
These could be a significant impact on various elements of the water cycle and further
reference to this is made in Section 7 of this report.

Faber Maunsell Lincoln Water Cycle Study 19
Overview
National Context
4.1 Following the receipt of various survey reports on future housing needs, the Government has
stated that a considerable increase in the rate of house building is required. They expect this
requirement to be reflected in Regional Spatial Strategies (RSSs) and they are looking for the
creation of sustainable neighbourhoods which use water, energy and other resources in an
effective and efficient manner. The Government’s specific objectives for housing are set out in
PPG3 and include the aims of providing sufficient housing, creating mixed communities and
meeting local housing needs. Emphasis is placed on a “plan, monitor and manage approach”
to housing provision. This chapter describes in more detail the expected development growth
within the Lincoln Policy Area.
East Midlands Regional Spatial Strategy
4.2 Eleven separate Housing Market Areas (HMAs) were identified in RSS documents and a total
average annual building rate for the whole Region was set at 20,418. The Central Lincolnshire
HMA (covering the whole of City of Lincoln, North Kesteven and West Lindsey of Lincoln Policy
Area) was set an annual average of 1,830 (for the period between 2001 and 2026). Within the
Central Lincolnshire HMA, a Sub-Regional Strategy (SRS) was developed to provide guidance
on issues relating to the City of Lincoln and its surrounding hinterland. The aim was to assist in
strengthening Lincoln’s role as a Principal Urban Area.
Lincoln Policy Area
4.3 The area covered by the SRS is known as the Lincoln Policy Area. It contains the whole of the
City of Lincoln and various parishes/wards in the Districts of North Kesteven District Council
and West Lindsey District Council. The Lincoln Policy Area SRS Policy 4 sets out housing
provision requirements. The boundary of the Lincoln Policy Area is shown in Figure 1.1
4.4 The Lincoln Policy Area SRS Policy 4 provides an annual housing target within the Lincoln
Policy Area for each Local Authority for period of 2001 to 2026 as described below:
- City of Lincoln Council 524 Per Annum
- North Kesteven District Council 440 Per Annum
- West Lindsey District Council 170 Per Annum
- Total Lincoln Policy Area 1,134 Per Annum
4.5 Taking into account current completions, an approximate total of 22,484 new dwellings are
expected to be built in the Lincoln Policy Area between 2008-26. However this figure is subject
to change with indications that figures are likely to rise and this will need to be considered in
more detail during Stage 2 of the study. Data related to development targets is included in
Appendix A.
Developments in Lincoln Policy Area since 2001
4.6 Table 4.1 shows the completed dwellings between the period of 2001-07 which are calculated
from the information in Appendix ‘A’ but later revised and supplied by the authorities in the
Lincoln Policy Area.
4 Development Targets

Faber Maunsell Lincoln Water Cycle Study 20
Table 4.1– Lincoln Policy Area Development Targets and Completed Dwellings between 2001-2007 within Lincoln Policy Area
Local Planning Authority
Lincoln Policy Area Target 2001-2026
No of Dwelling Completed to 2007
% Target
Lincoln 13,100 2,080 15.9
North Kesteven 11,000 2,020 18.4
West Lindsey 4,250 1,454
34.2
Total 28,350 5,554 19.6
4.7 To meet the target, an average number of 1,200 dwellings per annum will have to be built
between 2008-2026.
4.8 Detailed information which was provided by relevant Councils are included in Appendix A
Distribution of New Properties
4.9 Lincoln Policy Area SRS Policy 2 sets out an order of preference for site selection in the Lincoln
Policy Area:-
� Central Lincoln
� Elsewhere in the built up area of Lincoln and North Hykeham
� On the edge of the built up area
� In appropriate settlements elsewhere in the policy area
4.10 “Brownfield” land should be developed in preference to “greenfield” land and account should be
taken of availability of services and relevant environmental factors. The total amount of
development required has necessitated the promotion of strategic urban extension
development areas (first defined in the adopted Lincolnshire Structure Plan 2006). Three such
areas are now identified as follows:-
� Western Growth Corridor (WGC)
� North East Quadrant (NEQ)
� South East Quadrant (SEQ)
4.11 In the Lincoln Policy Area SRS, allowances for housing in these development areas are quoted
as:-
� About 4,500 in WGC
� About 1,500 in NEQ
� About 3,000 in SEQ
� Total 9,000
4.12 The above figures are not yet definitive. There is opposition to major development in the WGC
(mainly on flooding and drainage grounds), and the amount of potential development in the
SEQ depends on the selected route for the Eastern Bypass. Hence, the numbers in the WGC
could be substantially lower and the number in the SEQ substantially higher. It is understood
that the Secretary of State’s will publish proposed changes to the plan with final draft to be
produced by end of 2008.
4.13 It has been agreed by all partners that the scope of the study will initially consider 1700
dwellings at WGC as per Lincolnshire Structure Plan with flexibility for review.
Faber Maunsell Lincoln Water Cycle Study 21
General Development Patterns and Options
4.14 The Lincoln Policy Area SRS identified the need for strategic urban extension development
areas to accommodate 9,000 dwellings.
4.15 The Regional Plan Policy 17 sets out a regional target of 60% for new developments on
previously developed land wherever practicable and appropriate. In the Lincoln Policy Area, if
this target percentage was achieved, a total of 17,010 (60% of 28,350) buildings (residential)
would be constructed on “brownfield” land.
4.16 Without a definitive “core strategy” and specific targets for annual growth rates, it is difficult to
predict the impact of development on the various elements of the water cycle. Employment
provision, in addition to new housing, will have significant impacts. Whereas historically, heavy
engineering and manufacturing companies operated in central Lincoln, these have been
replaced, to some extent, by service and light industries on “industrial estates”. This trend may
continue and companies may seek to relocate out of the central Lincoln area.
4.17 Re-development of “brownfield” sites in central Lincoln will require careful consideration of flood
risk and of capacities of drainage systems. Options and constraints arising from the provision
of water cycle components are identified in Section 6 of this study where an outline strategic
overview is considered.

Faber Maunsell Lincoln Water Cycle Study 22
- This page intentionally left blank -

Faber Maunsell Lincoln Water Cycle Study 23
Overview
5.1 This section contains comments on each of the water cycle components, based on the data
collected as described in Section 3 and contained in the Appendices. It also provides a
summarised assessment of current baseline conditions and explains how these may be
affected by the take up of extant planning permissions.
River Witham Catchment Abstraction Management Strategy
5.2 The River Witham Catchment Abstraction Management Strategy (CAMS) Report was issued by
the Environment Agency in March 2004 and updated in April 2007. The strategy is intended to
ensure that the water resources of the River Witham are managed sustainably for the future,
with due regard for environmental and abstractor needs. Although the Witham catchment
extends well beyond the Lincoln study area, with the exception of two small tributaries of the
River Ancholme on the northern edge of the LWCS area at Spridlington and Toft Newton, the
whole of the study area is within the area covered by the Witham CAMS.
5.3 According to the CAMS Report, groundwater resources, predominantly from the Lincolnshire
Limestone aquifer in the Lincoln area, are used mainly for public water supply but are also an
important source of water for agricultural and industrial supply. Springs from the aquifer provide
the main dry weather flow contribution to the headwaters of various minor watercourses that
eventually drain into the River Witham.
5.4 The Witham CAMS area is subdivided into ten Water Resource Management Units (WRMUs).
Each unit is categorised in accordance with its resource availability status. Of the ten WRMUs,
numbers 6, 7, 9 and 10 are all outside and downstream of the LWCS area. WRMUs 2, 4, 5 and
8 are wholly or partly within the LWCS area. WRMUs 1 and 3 are outside the LWCS area but
because they are upstream of the LWCS area they are of relevance to water resources within
the LWCS area. The current resource situation in each relevant WRMUs is summarised in
Appendix B.
5.5 Within the CAMS area the Environment Agency has established a number of assessment
points at which river flow objectives are defined. These objectives are developed by first
assigning an environmental weighting band, which represents the sensitivity of that reach of the
river to abstraction, and are then used to determine the resource availability status. The
Environment Agency’s resource availability classification is given for each WRMU in Appendix
B.
5.6 Overall of the six WRMUs impacting on the LPA, 4 are classified as “no water available” and 2
as “over licensed”. These classifications indicate that no water is available for licensing at low
flows, but some may be at high flows with appropriate restrictions.
Water Resources and Supply
5.7 Anglian Water Services are responsible for the operation and maintenance of the potable water
supply system throughout the study area. They have a statutory duty to produce a Water
Resources Plan (WRP) every five years. This plan, which is reviewed and agreed with the
Environment Agency, is now subject to public consultation and is approved by the Secretary of
State. In view of the significant lead times needed to plan, develop and deploy new water
resources, the WRP looks 25 years ahead to ensure that AWS can meet its customers' needs.
5.8 Following a typhoid epidemic caused by polluted water, a new water supply to Lincoln was
established in 1911 by bringing water from wells sunk into the Bunter Sanstone aquifer at
Elkesley. This water was pumped into a new water tower at Westgate from where it overflowed
to feed a new service reservoir at Bracebridge Heath. Westgate Tower supplied the City’s
water distribution network north of the River Witham system and Bracebridge Heath reservoir
supplied the southern half of the City.
5 Catchment Baseline Conditions
Faber Maunsell Lincoln Water Cycle Study 24
5.9 The Elkesley Scheme still forms the principal component of Lincoln’s water supply although it
was progressively expanded during the 20th century. The trunk main from Elkesley has been
duplicated and can now feed Bracebridge Heath service reservoir direct. The city’s water
supply has also been supplemented by a number of local groundwater sourceworks which
abstract water from the Lincolnshire Limestone aquifer north and south of the city which forms
the most significant groundwater resource in the Lincoln study area.
5.10 There are six principal source works which provide the public water supplies to the Lincoln
Policy Area. These are Elkesley (Newton), Branston Booths, Dunston, Waddingham, Welton
and Elsham (Potable). The groundwater sourceworks at Elkesley (associated with the water
treatment works at Newton-on-Trent) and Waddingham and the surface water sourceworks at
Cadney (associated with Elsham treatment works) are all situated outside the study area.
5.11 Tables in Appendix B give figures for average daily sourceworks outputs (ADSO) and maximum
sourceworks outputs (MaxSO) to each of the water resource planning zones in the LPA (i.e. to
Lincoln, Branston, Welton and Waddingham). Further tables in the Appendix show
sourceworks deployable outputs (ADSO as % of MaxSO) and available resources in the
Planning Zones.
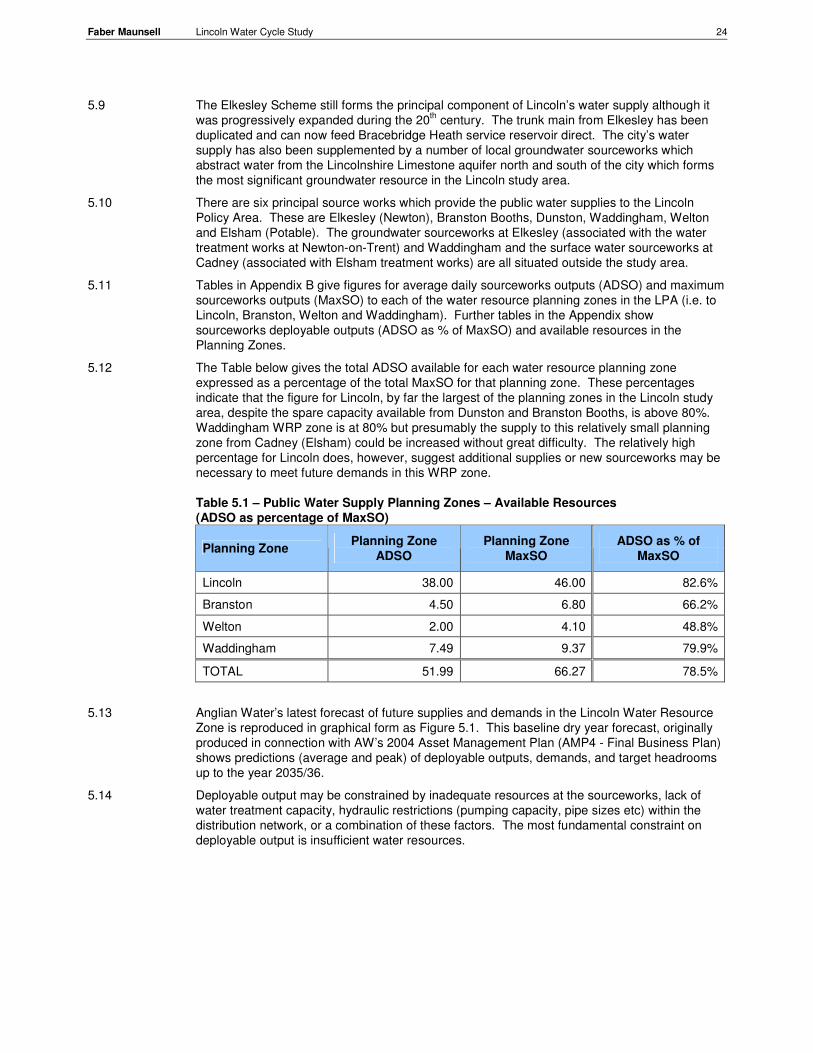
5.12 The Table below gives the total ADSO available for each water resource planning zone
expressed as a percentage of the total MaxSO for that planning zone. These percentages
indicate that the figure for Lincoln, by far the largest of the planning zones in the Lincoln study
area, despite the spare capacity available from Dunston and Branston Booths, is above 80%.
Waddingham WRP zone is at 80% but presumably the supply to this relatively small planning
zone from Cadney (Elsham) could be increased without great difficulty. The relatively high
percentage for Lincoln does, however, suggest additional supplies or new sourceworks may be
necessary to meet future demands in this WRP zone.
Table 5.1 – Public Water Supply Planning Zones – Available Resources
(ADSO as percentage of MaxSO)
Planning Zone Planning Zone
ADSO
Planning Zone
MaxSO
ADSO as % of
MaxSO
Lincoln 38.00 46.00 82.6%
Branston 4.50 6.80 66.2%
Welton 2.00 4.10 48.8%
Waddingham 7.49 9.37 79.9%
TOTAL 51.99 66.27 78.5%
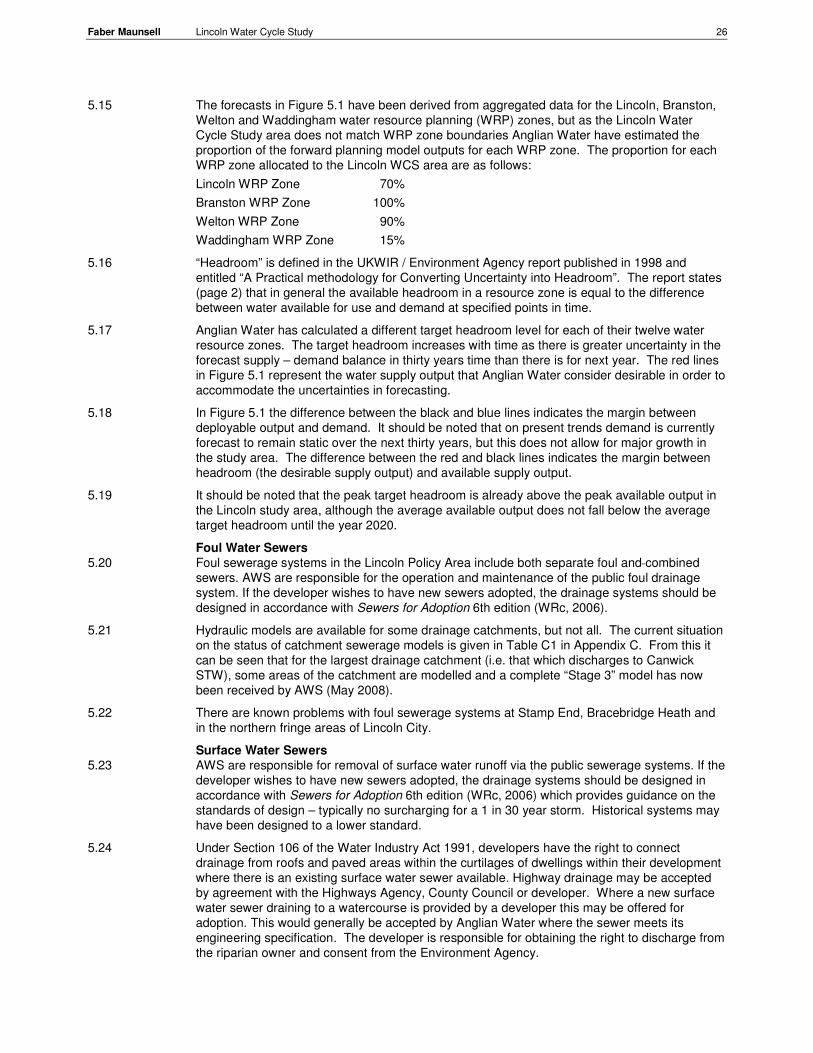
5.13 Anglian Water’s latest forecast of future supplies and demands in the Lincoln Water Resource
Zone is reproduced in graphical form as Figure 5.1. This baseline dry year forecast, originally
produced in connection with AW’s 2004 Asset Management Plan (AMP4 - Final Business Plan)
shows predictions (average and peak) of deployable outputs, demands, and target headrooms
up to the year 2035/36.
5.14 Deployable output may be constrained by inadequate resources at the sourceworks, lack of
water treatment capacity, hydraulic restrictions (pumping capacity, pipe sizes etc) within the
distribution network, or a combination of these factors. The most fundamental constraint on
deployable output is insufficient water resources.

Faber Maunsell Lincoln Water Cycle Study 25
Figure 5.1 – Forecast of Future Water Supplies and Demands
30.000
35.000
40.000
45.000
50.000
55.000
60.000
65.000
70.0002006/0
7
2007/0
8
2008/0
9
2009/1
0
2010/1
1
2011/1
2
2012/1
3
2013/1
4
2014/1
5
2015/1
6
2016/1
7
2017/1
8
2018/1
9
2019/2
0
2020/2
1
2021/2
2
2022/2
3
2023/2
4
2024/2
5
2025/2
6
2026/2
7
2027/2
8
2028/2
9
2029/3
0
2030/3
1
2031/3
2
2032/3
3
2033/3
4
2034/3
5
2035/3
6
Years
Meg
a-l
itre
s p
er
Day (
Ml/d
)
Average Deployable Output Peak Deployable Output Total Average Demand
Total Peak Demand Average Target Headroom Peak Target Headroom
Anglian Water Services 2008 (c)
Title: Lincoln Water Cycle Study: Baseline 'Dry
Year' Forecast (AMP4 FBP FORWARD model run
2004)
Version: Final 1.1
Drawn by:
A. Chivers
Reviewed by:
K. MacDougall
Figure:
One
Creation date:
29th February 2008
FORWARD model baseline 'dry year' supply/demand forecast outputs. AMP4 Final
Business Plan model run. Data audited and approved in 2004 by Ofwat and
Environment Agency.
Faber Maunsell Lincoln Water Cycle Study 26
5.15 The forecasts in Figure 5.1 have been derived from aggregated data for the Lincoln, Branston,
Welton and Waddingham water resource planning (WRP) zones, but as the Lincoln Water
Cycle Study area does not match WRP zone boundaries Anglian Water have estimated the
proportion of the forward planning model outputs for each WRP zone. The proportion for each
WRP zone allocated to the Lincoln WCS area are as follows:
Lincoln WRP Zone 70%
Branston WRP Zone 100%
Welton WRP Zone 90%
Waddingham WRP Zone 15%
5.16 “Headroom” is defined in the UKWIR / Environment Agency report published in 1998 and
entitled “A Practical methodology for Converting Uncertainty into Headroom”. The report states
(page 2) that in general the available headroom in a resource zone is equal to the difference
between water available for use and demand at specified points in time.
5.17 Anglian Water has calculated a different target headroom level for each of their twelve water
resource zones. The target headroom increases with time as there is greater uncertainty in the
forecast supply – demand balance in thirty years time than there is for next year. The red lines
in Figure 5.1 represent the water supply output that Anglian Water consider desirable in order to
accommodate the uncertainties in forecasting.
5.18 In Figure 5.1 the difference between the black and blue lines indicates the margin between
deployable output and demand. It should be noted that on present trends demand is currently
forecast to remain static over the next thirty years, but this does not allow for major growth in
the study area. The difference between the red and black lines indicates the margin between
headroom (the desirable supply output) and available supply output.
5.19 It should be noted that the peak target headroom is already above the peak available output in
the Lincoln study area, although the average available output does not fall below the average
target headroom until the year 2020.
Foul Water Sewers
5.20 Foul sewerage systems in the Lincoln Policy Area include both separate foul and combined
sewers. AWS are responsible for the operation and maintenance of the public foul drainage
system. If the developer wishes to have new sewers adopted, the drainage systems should be
designed in accordance with Sewers for Adoption 6th edition (WRc, 2006).
5.21 Hydraulic models are available for some drainage catchments, but not all. The current situation
on the status of catchment sewerage models is given in Table C1 in Appendix C. From this it
can be seen that for the largest drainage catchment (i.e. that which discharges to Canwick
STW), some areas of the catchment are modelled and a complete “Stage 3” model has now
been received by AWS (May 2008).
5.22 There are known problems with foul sewerage systems at Stamp End, Bracebridge Heath and
in the northern fringe areas of Lincoln City.
Surface Water Sewers
5.23 AWS are responsible for removal of surface water runoff via the public sewerage systems. If the
developer wishes to have new sewers adopted, the drainage systems should be designed in
accordance with Sewers for Adoption 6th edition (WRc, 2006) which provides guidance on the
standards of design – typically no surcharging for a 1 in 30 year storm. Historical systems may
have been designed to a lower standard.
5.24 Under Section 106 of the Water Industry Act 1991, developers have the right to connect
drainage from roofs and paved areas within the curtilages of dwellings within their development
where there is an existing surface water sewer available. Highway drainage may be accepted
by agreement with the Highways Agency, County Council or developer. Where a new surface
water sewer draining to a watercourse is provided by a developer this may be offered for
adoption. This would generally be accepted by Anglian Water where the sewer meets its
engineering specification. The developer is responsible for obtaining the right to discharge from
the riparian owner and consent from the Environment Agency.

Faber Maunsell Lincoln Water Cycle Study 27
5.25 Anglian Water currently has no legal obligations in terms of adoption or maintenance of SUDS
although it supports the principle of disposal of surface water as close to source as possible. It
is currently reviewing its policy on SUDS and surface water management4.
Sewer Flooding
5.26 The sewer flooding register known as the DG5 register (Director General) is held by AWS on
the location of properties with reported sewer flooding problems (foul water, surface water or
combined sewer systems). The presence of a DG5 entry suggests there may be an issue with
sewer capacity. However, flooding may be due to another cause, eg blockage or operational
issue. When the cause of flooding has been resolved, entries do not require reporting to Ofwat
and they are removed from the register. However, details are still retained by Anglian Water in
a separate database.
5.27 Pluvial flooding can occur as a result of saturated land, artesian groundwater and/or overland
flows from surface water drainage systems. This type of flooding has been experienced across
Lincoln on a number of occasions in the recent past. These incidents included June and July
1993, August 1999, July 2001, July 2002 and July 2006. The latest incident in June 2007 was
the worst in Lincoln both in extent and severity.
5.28 Many of the flooding incidents in the LPA have been on sewer systems that discharge directly
into the River Witham. In hydraulic terminology, this condition is associated with secondary
flooding. Secondary flooding is flooding of areas that are not affected directly by overtopping of
the banks of the watercourses, but by an hydraulic interaction between pluvial and fluvial
drainage systems. Appendix C shows current locations of DG5s in Lincoln Area. Recorded
pluvial events are shown in Figure 5.4.
Sewage Treatment Works
5.29 AWS is the statutory undertaker for wastewater for the Policy Area. The locations of the major
STWs within Lincoln Policy Area were provided by AWS and are shown in Figure 5.2.
5.30 The current status in terms of available volumetic “headroom” (i.e. capacity for flow from new
dwellings) and land availability for extensions within the existing site is given in Appendix C.
Tables also contain information on flooding incidents in the associated catchments and on the
current status of modelling work. The volumetric headroom is based on an occupancy of 2.1
people per dwelling and infiltration rates of 45 litres per head per day. Commercial rates are
taken as 18 litres per head per day. Trade effluent is accounted for separately.
5.31 The data in Appendix C shows that of the existing 24 STWs, 10 are small size works of less
than 1,000 population equivalent, 12 are medium size, i.e. between 1,000 and 10,000
population equivalent and only 2 are above 10,000 population equivalent (Canwick and North
Hykeham). 8 works have land available for extensions within the existing sites and 12 appear
to have significant headroom (i.e. above 100 dwellings).
5.32 An extract from Appendix C is produced below showing only those STWs with significant
headroom. Land availability for extensions is also shown:-
Table 5.2 – Sewage Treatment Works – Headrooms
Sewage Treatment Works Headroom
(dwellings)
Land Availability
In Ex. Works Purchase Required
Canwick2 11,233 �
Reepham 1,500 �
Dunholme2 231 �
Nettleham2 474 �
Saxilby 781 �
Bardney 1,524 �
4 Paragraph provided by Anglian Water

Faber Maunsell Lincoln Water Cycle Study 28
Table 5.2 – Sewage Treatment Works – Headrooms (continued)
Sewage Treatment Works Headroom
(dwellings)
Land Availability
In Ex. Works Purchase Required
Scampton (RAF) 617 �
North Hykeham2 4,181 �
Metheringham2 102 �
Skellingthorpe 986 �
South Hykeham1 1,536 � (see App C)
Bassingham 324 �
1. Anglian Water have noted that the flow headroom at South Hykeham is likely to be taken up by “extant” planning
permissions.
2. Anglian Water are currently negotiating flow consents with the Environment Agency.
5.33 The total headroom in the LPA amounts to 23,489 dwellings. (Note: This compares with the
remaining 22,484 dwellings to be built between 2008 and 2026, to meet the overall growth
target. Hence, theoretically, if development was located “appropriately”, it could all take place
without extensions to any STWs. However, this is a gross over simplification. Some STWs
have more stringent consent standards than others and some may require significant capital
investment if consent standards are tightened). Geographical locations could create constraints
for some potential growth areas.
5.34 A description of the current status of the above twelve works is included in Appendix C. It is
apparent that because of location and capacities, the STWs which are likely to serve the major
urban growth areas are Canwick, North Hykeham, Skellingthorpe and South Hykeham and
these possibilities are considered in Section 6 – Options and Outline Strategy.
Flood Risk
5.35 Managing flood risk in the Lincoln Policy Area is a significant activity, and the LIUD pilot study
has investigated this topic for the ‘Greater Lincoln Area’. Reference will be made to the LIUD
when formulating options for management of flood risk. The primary sources of fluvial flooding
are the Main Rivers and their tributaries. However, secondary sources are also important, i.e.
the arterial drainage systems. Recently pluvial flooding has become more frequent and
disruptive.
Major Catchments
5.36 Figure 5.3 shows the watercourses within Lincoln Policy Area. The principal river catchment is
the River Witham with its major tributaries upstream of Lincoln the River Brant and the River Till

Faber Maunsell Lincoln Water Cycle Study 29
Figure 5.3 - Watercourses within Lincoln Policy Area (Taken from LIUD)

Faber Maunsell Lincoln Water Cycle Study 30
River Witham Catchment
5.37 The River Witham is one of the largest rivers in the east of England. The River Witham rises
south of Grantham and flows in a north easterly direction towards Lincoln. It is joined by the
River Brant before entering the City of Lincoln and joined by the River Till (Fossdyke Canal) at
Brayford Pool within the City. Downstream of Lincoln the River Witham flows in a easterly
direction and bends through the Lincoln Gap and flows southeast before discharging into the
Haven at Boston. The total catchment area of the River Witham immediately downstream of
Lincoln is about 821km2.
River Brant Catchment
5.38 The River Brant is a major tributary of the River Witham with a total catchment area of 146km2.
It rises south west of Caythorpe and flows generally in a northerly direction joining the River
Witham south west of Waddington. The catchment is principally rural in character draining
areas of agricultural lands to the south of Lincoln. The only significant urban area in the
catchment is Navenby.
River Till Catchment
5.39 The River Till including the Fossdyke catchment is the largest of the River Witham’s tributaries
upstream of Lincoln with a total catchment area of 215km2. The River Till rises south east of
Gainsborough and flows in a southerly direction. It is joined by the Fossdyke east of Saxilby
and continues in a south easterly direction towards Lincoln. It joins the River Witham at
Brayford Pool within the City. The catchment is principally rural in character draining areas of
agricultural lands to the north west of Lincoln. The significant urban areas in the catchment are
Sturton by Stow and Saxilby.
5.40 Six hydrometric sub-catchments impact on the Lincoln Policy Area and the hydrological
response differs between the sub-catchments as each varies in terms of hydrology, topography,
geology, soils, land use and man-made influences. Appendix D illustrates the sub-catchment
characteristics.
5.41 The average annual rainfall over the sub-catchments is between 550-650mm. Higher rainfall
occurs to the south (over the Grantham area) where topography is steeper and the soils are
less permeable. Hence, a significant portion of flood water originates in this upland location.
The flood water flows northwards in the River Witham through the Lincoln Policy Area, with
some additional flows entering the system from urban areas.
5.42 Rainfall to the west of the Lincolnshire Limestone Ridge mainly runs overland to the various
watercourses making up the network upstream of Lincoln. There is some flow through the
soils, but any significant flow is limited to the sand areas.
5.43 River flows through Lincoln are controlled by ‘washlands’ flood defence system on the River Till
to the west of Lincoln and on the River Brant/Witham to the south of Lincoln. These washlands
became operational in 1991 and at that time were designed to accommodate a 1% (1 in 100
year) annual probability event. Downstream of Lincoln, Branston Island is used to store flood
water which relieves pressure on the existing flood embankments. It was not designed to
provide storage for a specific event or annual probability of flooding, but it is considered that it
can provide storage for approximately between 20%-10% (1 in 5 and 1 in 10 years) annual
probability event.
5.44 There are significant lengths of raised defences on the main rivers and tributaries throughout
the Lincoln Policy Area. Historically, these have had an important role in defending the area
from flooding. However, embankments can breach and there is uncertainty as to where and
when a breach could occur. Hence, maintenance of the embankments has been and will
continue to be an important part of Flood Risk Management. In the long-term controlled
spillways may be used to reduce and manage embankment failures and more flood storage
areas may be created where it is consistent with ‘Making Space for Water’.
Secondary Sources of Flooding
Arterial Drains
5.45 An important feature within the Lincoln Policy Area is the reliance on pumping stations for
effective surface water drainage from low lying areas. Agricultural land in the Witham
catchment is highly graded and very productive. Much of it is Fenland and high groundwater
levels have to be controlled to facilitate its use for agriculture. Three IDBs in the Lincoln Policy

Faber Maunsell Lincoln Water Cycle Study 31
Area operate and maintain the arterial drainage systems and it is often their network of drains
which receive surface water discharges from new developments. The Boards are – Witham 1st
and 3rd
IDBs and Upper Witham IDB. The IDB boundaries and the pumped catchments within
Lincoln Policy Area are shown in Appendix D. The Newark IDB also pumps water from outside
the area into the Fossdyke Canal.
5.46 In low lying areas flooding often occurs as a result of “waterlogging”. Winter is the main flood
season when ground conditions are wetter and evaporation rates lower. Rapid thawing of snow
and frost has also been identified as a factor leading to flooding. Summer flooding can happen
when high intensity rainfall occurs on a very dry catchment – particularly if the soil has become
“panned”. Hence the Environment Agency and IDBs have to cope with a range of climatic
conditions from drought to severe floods, whilst satisfying their environmental responsibilities.
The LIUD has identified instances where the capability of arterial drains to receive surface
water from developments is critical. This may well apply to some of the future planned
developments.
Groundwater Flooding
5.47 High groundwater levels can cause flooding if the water table rises above the ground level. The
risk of this happening in the Lincoln Policy Area is limited. At Heighington the Lincolnshire
Limestone is unconfined and is at or near the surface. Any significant rainfall combined with a
high water table will increase groundwater levels and could result in flooding. However,
historical records only indicate a small number of flood events resulting from groundwater in the
entire Witham catchment.
Surface Water and Sewer Flooding
5.48 In the Lincoln Policy Area risk of surface water flooding is generally restricted to urban areas.
The flood risk is usually from quick high intensity summer storms that overwhelm the drainage
systems. Historical records show a recent increase in surface water flooding with
approximately six flood events in seven years. It has been reported in LIUD Pilot study that
there is some degree of interaction between the River Witham and the surface water sewers
that may require further dialogue between Anglian Water and the Environment Agency to
determine if this can be overcome.
Residual Risks
5.49 If any of the raised embankments in the Lincoln Policy Area failed, i.e. collapsed, flood water
would flow through the resultant breach. The depth and velocity of this water could create
dangerous conditions for people, traffic and, sometimes, even the emergency services.
Properties in the vicinity of the breach could be damaged. These hazardous conditions and the
vulnerability of the receptors are factors which have to be taken into account, in accordance
with the contents of PPS25, when flood risk assessments are being undertaken. This is a
significant issue in the Lincoln Policy Area when considering relative flood risk in a series of
locations.
Historic Flooding
5.50 The River Witham catchment has historically been subject to periods of fluvial flooding. Table
5.3 shows notable flooding in the catchment over the past 100 years. The extent of flooding, for
each event, is shown in Appendix D. This includes the use of the ‘washlands’ flood defence
upstream of Lincoln during the November 2000 event.

Faber Maunsell Lincoln Water Cycle Study 32
Table 5.3- Summary of Significant Flood Events within Lincoln Policy Area
Date Watercourse Known Towns and Villages Affected
Failure of Flood
Defences
March 1947 River Witham Lincoln -
July 1958
River Witham, Fossdyke Canal, River Brant, River Till
Lincoln, Fiskerton, Bracebridge through Beckingham Bridge, Ingleby, Broxholme
Yes
December 1960 River Witham, River Brant
Hykeham Yes
February 1977 Heighington Beck, River Witham, River Brant
Lincoln -
April 1981
Barlings Eau, River Witham
Lincoln, Cherry Willingham, Fiskerton, Stainfield, Langworth, Bullington, Fulsby
Yes
October 1993
Barlings Eau, Boultham Catchwater Drain, River Witham
Swinethorpe, Cherry Willingham, Fiskerton, Sudbrooke, Scothern, Snarford, Stainford, Langworth, Friesthorpe
Yes
November 2000
Flood storage areas on the River Witham and River Till
Langworth and various rural locations
No
Note: Serious flooding also occurred in the catchment in June 2007 but this was identified as mainly “pluvial flooding” and is illustrated in Figure 5.4.
Flood Risk Areas
5.51 Data is now being collected of all flooding incidents in the LIUD area in a consistent manner.
Together with reference to historic flooding, analysis of this data will enable Flood Risk Areas to
be defined where the relative risk of flooding is “high”. This will enable comparisons to be made
between proposed growth areas and facilitate the selection of options for improvement works.
This work is being co-ordinated by Lincolnshire County Council Emergency Planning, under the
auspices of the LIUD study.
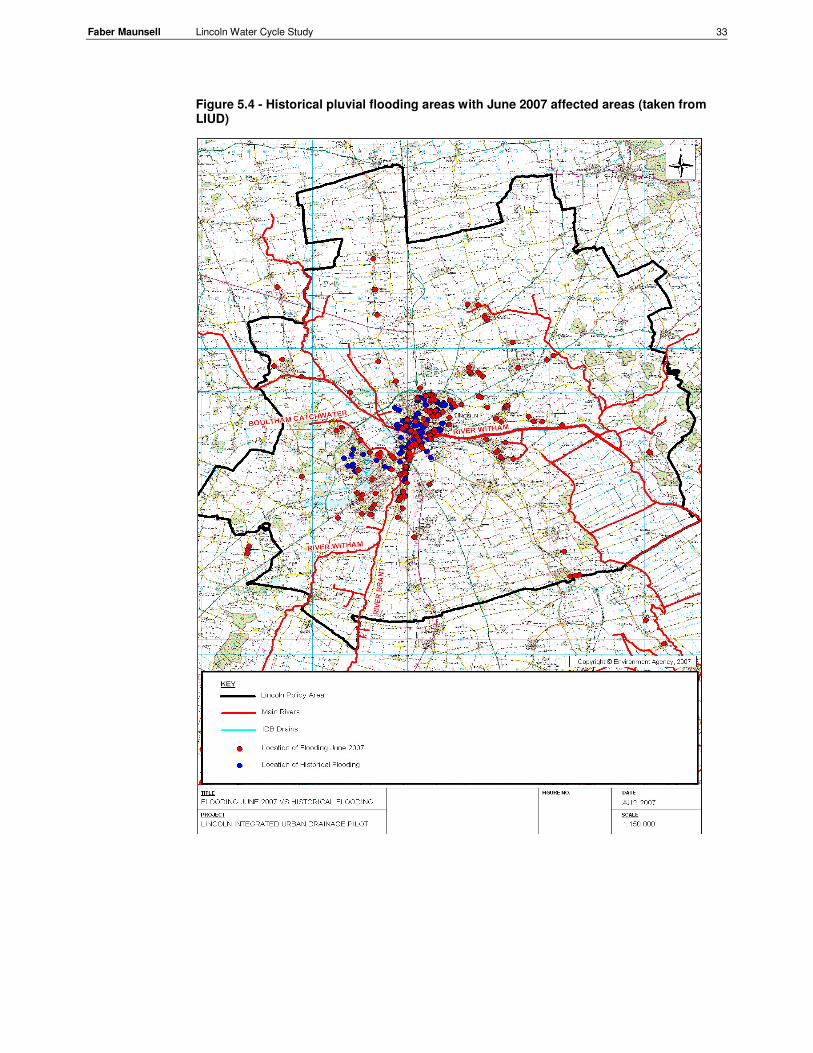
Faber Maunsell Lincoln Water Cycle Study 33
Figure 5.4 - Historical pluvial flooding areas with June 2007 affected areas (taken from LIUD)

Faber Maunsell Lincoln Water Cycle Study 34
Flood Risk Zones
5.52 Areas at risk of flooding are classified in Planning Policy Statement 25; Development and Flood
Risk (PPS25). PPS25 aims to steer development into Flood Zone 1 through the application of
the Sequential Test. Information on the aims of PPS25 and its future implementation are given
in Appendix D. Tables from PPS25 are also reproduced in Appendix D, showing the flood zone
classifications and their compatibility with various classifications of development vulnerability.
Figure 5.5 shows Flood Zone 3 land in the LPA (i.e. land with a 1% annual probability of
flooding, assuming no flood defences exist.
5.53 As a result of the publication of PPS25, JBA Consulting was commissioned by Lincoln City
Council to provide a report on the implications of PPS25 in respect of the SFRA completed in
November 2004. . Key changes were presented and implication for Flood Risk Maps, Flood
Zone Maps and breach risk assessments were discussed. Reference was made to the
reclassification of the Flood Zones, to the introduction of Flood Risk Vulnerability classifications
and the new use of the Exception Test. The latter is to be used, after application of the
sequential test, if a site in Flood Zone 3a still appears to be the only reasonable available
suitable location. These considerations are very relevant in the Lincoln Policy Area. Table B.2
in Appendix ‘B’ is reproduced from the PPS25.
Flood Defences
5.54 The majority of the Lincoln Policy Area urbanised area (i.e. the City of Lincoln) is well protected
against the risk of flooding by a combination of raised embankments and the presence of
washlands. The JBA Consulting 2007 report in line with Annex E of PPS25 suggested that flood
hazards for developments behind existing defences be considered at the site specific Flood
Risk Assessment stage (i.e. consideration should be given to depths and velocities of water and
to the danger which they create for people at various distances behind defences).
Pumping Station on arterial systems
5.55 The low lying land in the Lincoln Policy Area depends on pumping stations to evacuate potential
flood water and to maintain ground water at appropriate levels for agriculture. There are
between 50 to 60 pumps in the Lincoln Policy Area and some pumping stations have only
single pump installation. Others have two or three and some have standby diesel pumps. IDB
pumping stations are not usually designed to cater for future development and developers may
be faced with attenuating flows to acceptable limits and/or contributing towards upgrading of
pumping stations.
Overflows from combined sewers
5.56 Additional surface water discharged to combined sewers has the potential to increase
frequency and volume of discharge from overflows to watercourses. This can have an adverse
effect on water quality. Recent developments have tended to have separate systems of surface
water and foul sewerage but in some instances combined sewers may be the only available
point of connection for surface water from a new development. In the future developers should
seek to use appropriate drainage techniques such as SUDS to avoid additional surcharging of
combined sewers.
Flood Watch Areas – Flood Warning
5.57 A key factor in overall Flood Risk Management is Flood Forecasting and Flood Warning. This
is particularly relevant in the Lincoln Policy Area where existing developments are located in
High Risk Flood Zones.
5.58 The Environment Agency are developing a National Flood Forecasting Modelling System
Strategy (NFFMSS). This will involve the input of data from models into NFFMSS which will
then generate forecasts of levels and flows in river networks, with significant lead times. This
should help to ensure that the time for issuing warnings is optimised. Floodline Warnings Direct
was introduced in February 2006 to replace the Automated Voice Messaging (AVM) system.
Where the service is available, the FWD will allow the public and other organisations to register
for FWD to their telephones or mobile phones.
Need for Integrated Urban Drainage Management
5.59 The LIUD study has demonstrated the need for various organisations involved in flood
protection and drainage matters to work closely together when considering drainage systems
from proposed developments. A “Lincoln Drainage Group” has been established to consider
relevant significant planning applications and to give guidance to developers on appropriate
Faber Maunsell Lincoln Water Cycle Study 35
systems, outfalls, etc. This could prove to be an effective means of achieving better co-
ordination between the various parties involved in the water cycle and development planning
processes. Surface Water Management Plans (SWMP) may be addressed by this forum when
their format has been finally agreed at National Level.
It has been agreed nationally, and is reflected in PPS25, that SUDS are preferred wherever
possible. This applies, in principle, to all new developments.
Overview of Current Demands on Water Cycle Infrastructure
5.60 Current Situation
Water Resources and Supply - Residents and industries in the LPA currently receive an
adequate supply of water, at acceptable pressures. The Lincoln Water Resource Planning
Zone which provides water for the southern part of the City of Lincoln and for areas to the south
of the City has limited headroom at times of peak demand. Hence, no major network
improvements are currently needed, other than those required to reduce leakage or to replace
ageing assets. Investigations are ongoing into options for supplementing the resource
availability in the Lincoln Zone.
Sewerage - The LIUD pilot study has revealed that there are areas within the LPA where no
hydraulic models exist for some of the sewerage networks (foul, combined, and/or surface
water). It also demonstrated that there is a need for an “integrated” approach to drainage, as
water levels in rivers and other watercourses (e.g. arterial drains), sometimes impact
significantly on flows in piped systems. Anglian Water’s DG5 Flood Register identifies 43
incidents of flooding, of which only 14 were “internal” in the last 10 years. However, in June
2007, numerous incidents of pluvial flooding occurred particularly in the northern and central
areas of Lincoln City. Some of these incidents may have resulted from a basic lack of capacity
in surface water or combined systems and Anglian Water are assessing the need for further
network modelling.
Sewage Treatment - There are 24 Sewage Treatment Works in the LPA, of which 10 treat
population equivalents of over 2,000, 8 works have water quality compliance issues and 2 have
odour issues. Some have available hydraulic capacity, but may be constrained by water quality
consent parameters. Anglian Water are addressing the current compliance and odour issues.
Fluvial Systems - Historically Lincoln has experienced serious fluvial flooding. However, since
1991 river flows through Lincoln have been controlled by “washlands” which were designed to
provide a 1 in 100 year standard of protection. Maintenance of raised embankments on the
main rivers and tributaries by the Environment Agency is an important part of current Flood Risk
Management. A further important feature is the reliance on pumping stations for effective
surface water drainage from low lying areas. High ground water levels have to be controlled for
agricultural reasons and three Internal Drainage Boards operate and maintain the arterial
drainage systems.
Potential Impact of Implementing Extant Planning Commitments
5.61 Assuming Extant Planning Permissions Are Implemented
There are approximately 8,385 extant planning permissions in the LPA, made up in Lincoln
Council Area 4,189, North Kesteven 2,552 and West Lindsey 1,644. Completion of these
properties should not create significant problems for water resources or at STWs (taking into
account that some of the sites are “brownfield” sites and do not necessarily represent an
increase in demand). However, extant permissions could take up significant proportions of
available headroom at some STWs, e.g. 42% at Canwick, 34% at North Hykeham and 29% at
Skellingthorpe. At Nettleham STW nearly 90% of the available headroom will be taken up by
extant permissions. The extant permissions are spread around the LPA and details of them are
provided in Appendix A.
This preliminary broad consideration of the implementation of extant planning permissions
should be extended further at the detailed study stage. In particular the effects on villages and
specific areas such as North Hykeham (where a considerable number of extant permissions
exist) should be assessed to gauge if the water infrastructure is adequate to service the
developments.
Faber Maunsell Lincoln Water Cycle Study 36
If the whole of the “growth” was initially in areas which drain to Canwick STWs, and the annual
target growth rate was achieved, then the existing “headroom” would be taken up in 3.79 years.
This is very unlikely to happen, but it does illustrate that, taking into account lead times, it would
be sensible to start planning extensions at Canwick STW now. Similarly, extensions at
Nettleham STW may be needed if all extant permissions are implemented and at this works
land purchase would be necessary.
Individual sites could exacerbate problems in sewerage networks and surface water flows could
increase incidents of pluvial flooding. In the future, these issues will be considered by the
Lincoln Drainage Group which was established as a result of the LIUD pilot study. The LDG will
ensure that an integrated approach is taken which considers the inter-relationship of the
drainage network and the receiving watercourse. A current example of the involvement of the
LDG is in connection with the redevelopment of the old Power Station at Spa Road.
The implementation of the extant planning permissions will not necessitate major, new
investment in flood defences, but mitigation measures will be required, particularly if some
areas on sites are in Zone 3 (this obviously will be at the Developer’s expense). Improvements
may also be required to arterial drainage systems (with commuted sums from Developers).
Impacts of Future Development
5.62 The impacts of future development on current water infrastructure are considered in Section 6
of this study, where constraints, options and the beginning of an outline strategy are discussed.
Related Issues
5.63 A series of issues related to this topic are identified in Section 7, including Climate Change,
Developer Contributions and Developer Guidelines.

Faber Maunsell Lincoln Water Cycle Study 37
Overview
6.1 The outline strategy is developed by considering the three major urban extension areas and the
brownfield sites. Constraints are identified using the Constraints Matrix and phasing is
considered alongside some Options for future infrastructure provision. Currently there is limited
indication on the spatial direction of growth, or on the scale of settlements in rural areas, as
none of the three local authorities involved in the LPA have reached the stage of issuing a
“Core Strategy” for their LDFs.
Urban Extension Areas and Brownfield Sites
North East Quadrant 6.2 Water Resource - The NE Quadrant (Northern Lincoln) is currently supplied from Newton WTW
with support from Elsham WTW . It is planned to increase the quantity of Elsham water
imported into Northern Lincoln to support growth.
The new water resource at Newton – planned for Lincoln (2015 onwards) – will enable the support from Elsham to be reduced in phases. Elsham water will progressively be required to support growth in North Lincolnshire.
6.3 Water Supply - As there are no significant water supply trunk mains close to the site it is
anticipated that new trunk mains will be required to service the development area. Distribution
networks will also be required within the boundaries of the site.
6.4 Sewerage - There may be capacity problems with foul and combined sewers in the north-
eastern parts of Lincoln where pluvial flooding has occurred. Hence, investigations will be
required before connection points to existing systems can be agreed. It appears likely that a
new sewer will be required direct to Canwick Terminal Pumping Station (this will involve railway
and river crossings) as there are known problems with the sewerage systems in the Stamp End
area.
6.5 Sewage Treatment - Foul sewage from the NEQ could be treated at Canwick or Reepham
STWs. Canwick has considerable headroom, but will have to accept some flows from
brownfield sites and other major urban extension areas. It will probably require extensions in
the next 5-7 years. Reepham STW has sufficient flow headroom to accept 1,500 dwellings (the
process capacity is limited and extensions would be required to accommodate growth). The
existing outfall sewer from Hawthorne Road to the STW is only 150mm diameter and this
cannot accept sewage from the NEQ. Hence, a new trunk sewer would be required.
6.6 Fluvial - The NEQ is located in Flood Zone 1, fluvial flooding from Main Rivers will not be a
problem. However, surface water flooding has occurred in the locality and improvements will
be required to Greetwell Beck (a riparian maintained watercourse) and to the receiving IDB
maintained arterial drainage system. At design stage drainage impact assessment will be
required to assess the impact of the surface runoff from the new development. A surface water
attenuation basin may be required to limit the rate and volume of runoff into the receiving
watercourses.
Western Growth Corridor 6.7 Water Resource - In the medium term (by 2015 – 1st phase) Anglian Water are planning to
supplement flows to this area by importing water into northern Lincoln from Elsham WTW. In
the short term, this will release resources to allow the first phase of WGC to proceed - a
maximum of 1700 properties.
6 Outline Strategy
Faber Maunsell Lincoln Water Cycle Study 38
In the medium term (2015 onwards) A new treatment works is planned to meet the forcasted increase in demands resulting from growth. As the new works is commissioned the transfer from Elsham will be reduced accordingly.
6.8 Water Supply - An existing 900mm pumped trunk main from the existing Newton WTW will
supply water to the proposed Development Area.
6.9 Sewerage - Foul sewage from up to 1,500 dwellings could be accepted into the local sewerage
network which flows to the St Botolphs Pumping Station. However, the drainage network
eventually connects into sewers which pass through the Stamp End area of the City and there
are known problems in this part of the system. Hydraulic modelling carried out for Anglian
Water suggests that network improvements will be required if more than 1,500 dwellings are
connected to the local sewers.
6.10 Sewage Treatment - Canwick STW has sufficient headroom to treat foul sewage from the
WGC, even if numbers of dwellings exceed 1,500. However, it may be more practical and
economical to treat the foul sewage at other STWs, e.g. North Hykeham, South Hykeham
and/or Skellingthorpe (each of which have some headroom available). Expensive
improvements to the sewer network through the centre of Lincoln City may be avoided.
6.11 Fluvial - Most of the WGC is located in Flood Zone 3. Hence the inherent flood risk is high and
mitigation measures will be required to offset the residual risks associated with the existing
flood defences. PPS25 requires a sequential approach to be taken which aims to avoid
development in higher flood risk zones if possible and adoption of an Exception Test for more
vulnerable development if other factors make it necessary for some development to take place
in Zone 3a.
Lincoln – South East Quadrant 6.12 Water Resources and Water Supply: The SEQ will be supplied with water from Bracebridge
Heath Reservoir which originates at Newton WTW. To support growth from 2015 onwards - a
new WTW is planned to be developed at Newton together with supporting trunk mains into
Lincoln City. The SEQ developments will be supported by additional distribution mains and a
new Pumping Station. These are planned to be provided as required with appropriate
contributions from Developers.
6.13 Sewerage: New sewerage mains will be required to serve the SEQ, as there are problems with
the existing system in Sleaford Road, Bracebridge Heath and lower down the system. In effect,
there are no trunk sewers which could accept flows from the SEQ and a new connection to
Canwick STW will be required (whatever the final number of dwellings).
6.14 Sewage Treatment: Canwick STW could possibly treat all the foul sewage from the SEQ, but
some of its available headroom will be taken up by other developments and a phased
programme of extensions may be required.
6.15 Fluvial: Most of the land in the SEQ is in Flood Zone 1 and fluvial flooding from Main Rivers will
not be a problem. A surface water drainage impact assessment will be required and balancing
of surface water runoff. Use of SUDS techniques will probably be possible on this major
greenfield area, and there may be a choice for the discharge points for surface water.
Brownfield Sites
6.16 Most brownfield sites will have water resources available and there will be sufficient STW
capacity to take the resulting domestic sewage. However, investigations will be required into
the receiving foul and surface water sewerage systems and into the standards of protection
against flooding (these issues will be dependant on the particular brownfield site under
consideration). Where sites are redeveloped Anglian Water will require investigations into the
possibilities of separating foul and surface water sewerage.
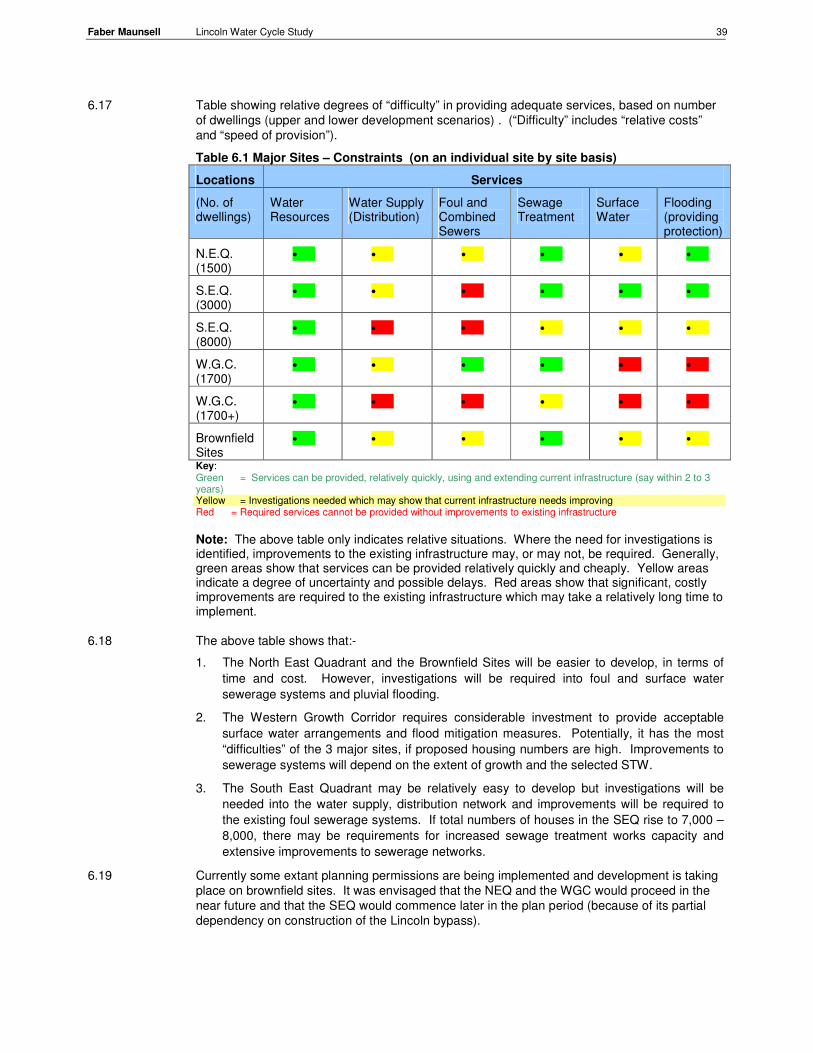
Faber Maunsell Lincoln Water Cycle Study 39
6.17 Table showing relative degrees of “difficulty” in providing adequate services, based on number
of dwellings (upper and lower development scenarios) . (“Difficulty” includes “relative costs”
and “speed of provision”).
Table 6.1 Major Sites – Constraints (on an individual site by site basis)
Locations Services
(No. of dwellings)
Water Resources
Water Supply (Distribution)
Foul and Combined Sewers
Sewage Treatment
Surface Water
Flooding (providing protection)
N.E.Q. (1500)
• • • • • •
S.E.Q. (3000)
• • • • • •
S.E.Q. (8000)
• • • • • •
W.G.C. (1700)
• • • • • •
W.G.C. (1700+)
• • • • • •
Brownfield Sites
• • • • • •
Key: Green = Services can be provided, relatively quickly, using and extending current infrastructure (say within 2 to 3 years) Yellow = Investigations needed which may show that current infrastructure needs improving Red = Required services cannot be provided without improvements to existing infrastructure Note: The above table only indicates relative situations. Where the need for investigations is identified, improvements to the existing infrastructure may, or may not, be required. Generally, green areas show that services can be provided relatively quickly and cheaply. Yellow areas indicate a degree of uncertainty and possible delays. Red areas show that significant, costly improvements are required to the existing infrastructure which may take a relatively long time to implement.
6.18 The above table shows that:-
1. The North East Quadrant and the Brownfield Sites will be easier to develop, in terms of
time and cost. However, investigations will be required into foul and surface water
sewerage systems and pluvial flooding.
2. The Western Growth Corridor requires considerable investment to provide acceptable
surface water arrangements and flood mitigation measures. Potentially, it has the most
“difficulties” of the 3 major sites, if proposed housing numbers are high. Improvements to
sewerage systems will depend on the extent of growth and the selected STW.
3. The South East Quadrant may be relatively easy to develop but investigations will be
needed into the water supply, distribution network and improvements will be required to
the existing foul sewerage systems. If total numbers of houses in the SEQ rise to 7,000 –
8,000, there may be requirements for increased sewage treatment works capacity and
extensive improvements to sewerage networks.
6.19 Currently some extant planning permissions are being implemented and development is taking
place on brownfield sites. It was envisaged that the NEQ and the WGC would proceed in the
near future and that the SEQ would commence later in the plan period (because of its partial
dependency on construction of the Lincoln bypass).
Faber Maunsell Lincoln Water Cycle Study 40
Phasing of Developments
6.20 The phasing and location of development will be dependant on the content of the RSS8, once
the final document is made available. Accordingly the following discussions of possible phasing
should be considered as provisional and without expectation that it will be representative of the
eventual outcome.
6.21 Inter alia, the Lincoln Policy Area SRS Policy 1 (Spatial Priorities for the Lincoln Policy Area)
requires development of “phased strategic urban extensions co-ordinated with the necessary
infrastructure provision” and “economic regeneration and employment growth including
necessary infrastructure requirements in an appropriately co-ordinated and phased manner”.
The phased release of land for development should reflect the order of preference and priority
stated in the core strategy, in so far as it is consistent with the findings of the WCS and other
supporting documents.
6.22 Phasing is referred to in Lincoln Policy Area SRS Policies 5 (Employment Land Provision) and
6 (Strategic Urban Extension Development Areas: Employment Land Provision). Policy 5
suggests the following phasing5:-
� 2001 onwards - Lincoln City - up to 100 hectares
- North Kesteven part of Lincoln Policy Area – up to 60 hectares
- West Lindsey part of Lincoln Policy Area – up to 10 hectares
� 2016 onwards - Lincoln City – up to 5 hectares
- North Kesteven part of Lincoln Policy Area – up to 55 hectares
6.23 Policy 6 suggests the following phasing:-
From 2001 onwards the main strategic locations for new employment development could be:-
� The North East Quadrant
� Decoy Farm, part of the Western Growth Corridor (B1 uses only)
From 2016 onwards – the main strategic location for new employment development will be:-
� South East Quadrant (B1 uses only)
6.24 However, based on this study overall considering for new housing development phasing is
likely to be as described in Table 6.9.
Table 6.2: Possible Phasing for New Developments
Plan Years Period Localities
Phase 1 2001-2015 Brownfield areas, NEQ, WGC
Phase 2 2016-2020 Brownfield and SEQ, (WGC)
Phase 3 2020-2026 Brownfield areas and other settlements (SEQ)
The letters in brackets in the above table indicate that time periods for construction of the WGC
and the SEQ will depend on the scale of the developments.
6.25 The second stage of this study will enable more precise definition of impacts, potential costs
and phasing. It will also take into account Environmental impacts. When the second stage is
carried out, Anglian Water’s Water Resources Plan should be available, together with more
data from the Catchment Flood Management Plan and more definite Development Plans.
5 Draft East Midlands Regional Plan (RSS8)

Faber Maunsell Lincoln Water Cycle Study 41
Options
6.26 At this stage, it appears that strategic investment options are available for water resources and
for provision of sewage treatment works capacity.
6.27 Water Resource - Anglian Water will determine the most appropriate source of additional water,
via their Water Resource Management Plan. Three possible scenarios have been identified
during this study:-
� Use of Rutland Water – by increasing the treatment capacity at Saltersford WTW and
extending supply pipelines from Salterford into the southern part of the LPA.
� Use of water from the River Trent, with treatment at a new or extended WTW at Newton.
� Use of increased amounts of potable water from the Trent-Witham-Ancholme scheme
(supplied from Elsham currently into the Waddington WRP zone).
Anglian Water advise that a phased scheme will probably be implemented to provide extra
water via a new or extended WTW at Newton and that the target date for all the first phase is
2015. Further phases will be related to the actual and predicted growth rates – beyond the
2026 plan period.
6.28 Sewage Treatment -The main STWs with available headroom which could serve the major
urban extension areas and the Lincoln City based brownfield sites are:-
� Canwick (11,233 headroom)
� Reepham (1,500 headroom) (process upgrade may be required]
� North Hykeham (4,181 headroom)
� South Hykeham (1,536 headroom)
� Skellingthorpe (986 headroom)
6.29 Considering each area, individually, the Options are:-
NEQ – flows could go to Reepham – but new outfall sewer (and extensions to sewage
treatment works) would be required
or to Canwick – but new connection required to Canwick STW
WGC – could go to Canwick – but improvements to sewer network would be required if more
than 1,500.
or to North Hykeham and/or Skellingthorpe, but new sewer networks would be required
SEQ – could go to Canwick – but new sewer to Canwick STWs required
or to North and/or South Hykeham – or to a new STW if scale of development is large (this
could take up to 10 years)
6.30 Whilst Canwick STW has a relatively large volumetric or “dwellings” headroom, taking into
account extant permissions, and possible extra flows from brownfield sites, it could not take
flows from all three of the major urban areas, without extensions to the works. It is also unlikely
that flows from the WGC and the SEQ could be taken to North and South Hykeham STWs and
Skellingthorpe STWs – without extensions to one or other of the works. Hence, when numbers
of dwellings in the growth areas are more definitive, a study is required to determine the most
economically and environmentally acceptable option, taking into account STWs extensions and
alterations/additions to sewerage networks.
6.31 There are 7 other STWs with headroom of over 100 dwellings and these are:-
� Bardney (1,524)
� Bassingham (324)
� Metheringham (102)
� Nettleham (474)
� Saxilby (781)
� Scampton RAF (617)
� Dunholme (231)
It may be that some of these provide opportunities for growth in the associated localities,
subject to extant permissions and water quality issues.
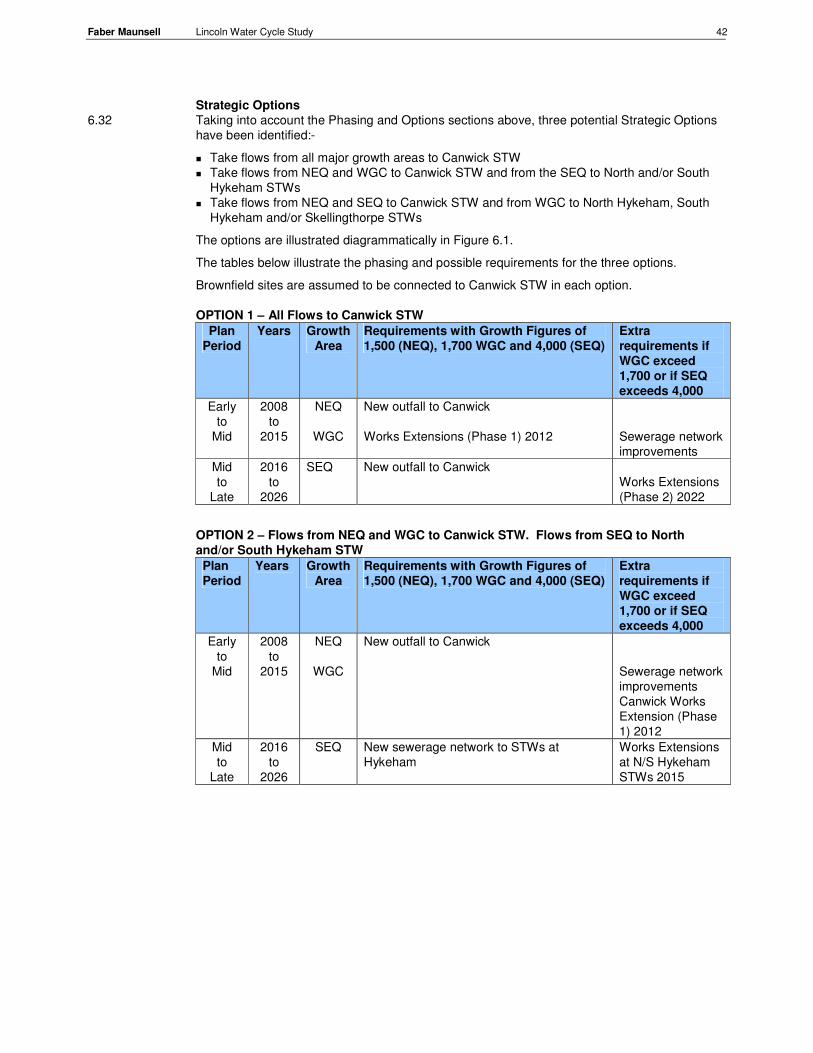
Faber Maunsell Lincoln Water Cycle Study 42
Strategic Options
6.32 Taking into account the Phasing and Options sections above, three potential Strategic Options
have been identified:-
� Take flows from all major growth areas to Canwick STW
� Take flows from NEQ and WGC to Canwick STW and from the SEQ to North and/or South
Hykeham STWs
� Take flows from NEQ and SEQ to Canwick STW and from WGC to North Hykeham, South
Hykeham and/or Skellingthorpe STWs
The options are illustrated diagrammatically in Figure 6.1.
The tables below illustrate the phasing and possible requirements for the three options.
Brownfield sites are assumed to be connected to Canwick STW in each option.
OPTION 1 – All Flows to Canwick STW
Plan
Period
Years Growth
Area
Requirements with Growth Figures of
1,500 (NEQ), 1,700 WGC and 4,000 (SEQ)
Extra
requirements if
WGC exceed
1,700 or if SEQ
exceeds 4,000
Early
to
Mid
2008
to
2015
NEQ
WGC
New outfall to Canwick
Works Extensions (Phase 1) 2012
Sewerage network
improvements
Mid
to
Late
2016
to
2026
SEQ New outfall to Canwick
Works Extensions
(Phase 2) 2022
OPTION 2 – Flows from NEQ and WGC to Canwick STW. Flows from SEQ to North
and/or South Hykeham STW
Plan
Period
Years Growth
Area
Requirements with Growth Figures of
1,500 (NEQ), 1,700 WGC and 4,000 (SEQ)
Extra
requirements if
WGC exceed
1,700 or if SEQ
exceeds 4,000
Early
to
Mid
2008
to
2015
NEQ
WGC
New outfall to Canwick
Sewerage network
improvements
Canwick Works
Extension (Phase
1) 2012
Mid
to
Late
2016
to
2026
SEQ New sewerage network to STWs at
Hykeham
Works Extensions
at N/S Hykeham
STWs 2015
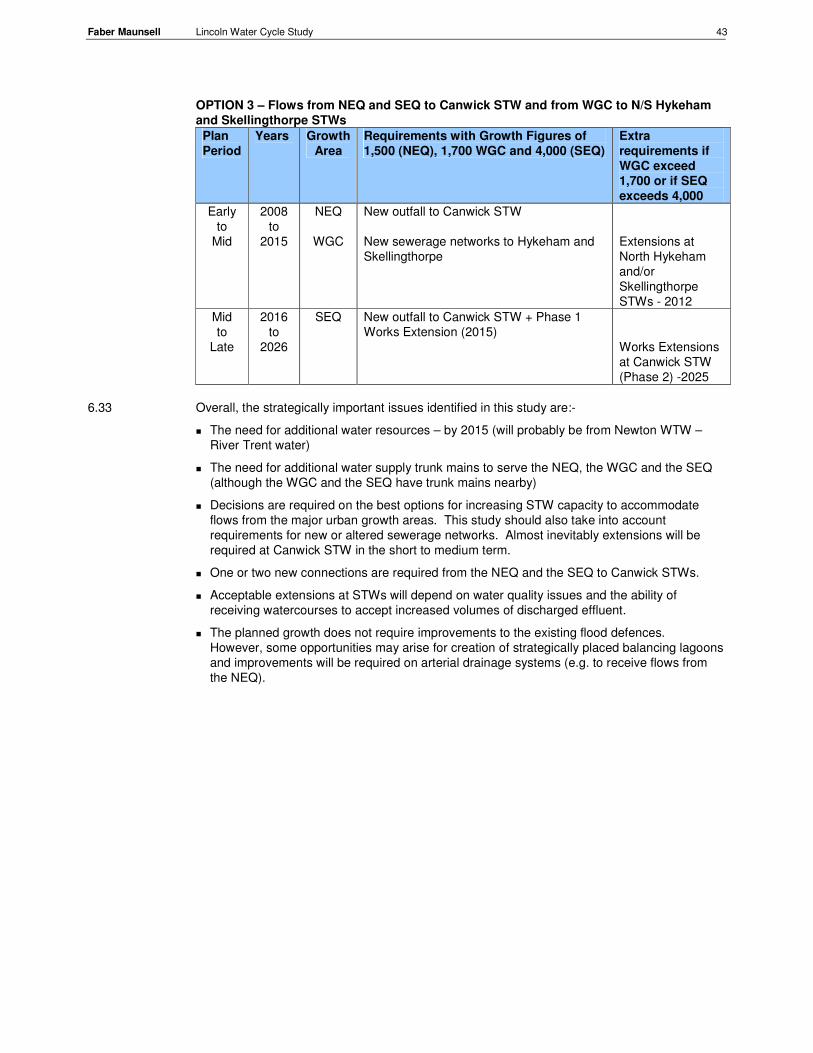
Faber Maunsell Lincoln Water Cycle Study 43
OPTION 3 – Flows from NEQ and SEQ to Canwick STW and from WGC to N/S Hykeham
and Skellingthorpe STWs
Plan
Period
Years Growth
Area
Requirements with Growth Figures of
1,500 (NEQ), 1,700 WGC and 4,000 (SEQ)
Extra
requirements if
WGC exceed
1,700 or if SEQ
exceeds 4,000
Early
to
Mid
2008
to
2015
NEQ
WGC
New outfall to Canwick STW
New sewerage networks to Hykeham and
Skellingthorpe
Extensions at
North Hykeham
and/or
Skellingthorpe
STWs - 2012
Mid
to
Late
2016
to
2026
SEQ New outfall to Canwick STW + Phase 1
Works Extension (2015)
Works Extensions
at Canwick STW
(Phase 2) -2025
6.33 Overall, the strategically important issues identified in this study are:-
� The need for additional water resources – by 2015 (will probably be from Newton WTW –
River Trent water)
� The need for additional water supply trunk mains to serve the NEQ, the WGC and the SEQ
(although the WGC and the SEQ have trunk mains nearby)
� Decisions are required on the best options for increasing STW capacity to accommodate
flows from the major urban growth areas. This study should also take into account
requirements for new or altered sewerage networks. Almost inevitably extensions will be
required at Canwick STW in the short to medium term.
� One or two new connections are required from the NEQ and the SEQ to Canwick STWs.
� Acceptable extensions at STWs will depend on water quality issues and the ability of
receiving watercourses to accept increased volumes of discharged effluent.
� The planned growth does not require improvements to the existing flood defences.
However, some opportunities may arise for creation of strategically placed balancing lagoons
and improvements will be required on arterial drainage systems (e.g. to receive flows from
the NEQ).

Faber Maunsell Lincoln Water Cycle Study 44
- This page intentionally left blank -
Faber Maunsell Lincoln Water Cycle Study 45
Overview
7.1 The consideration of outline strategy has been restricted by lack of definitive development
proposals and strategic plans of the infrastructure providers. Developers will need to ensure
that their proposals meet the requirements of the various authorities and they may have to
provide significant financial contributions towards the provision of off-site infrastructure in
addition to on-site costs. This section refers to these issues and to a Developers Checklist
which summarises best practice related to provision of water cycle related infrastructure. It also
includes comments on three important and related issues, i.e. Climate Change, the use of
SUDS and Water Efficiency Measures. Finally, this section identifies work to be carried out in
Phase 2 of the study (i.e. at the detailed strategy stage).
Developer Guidelines
7.2 Other water cycle studies have developed a “Developer Checklist” which brings together
Environment Agency guidance and principles established at outline study stage. A checklist of
this type is included in Appendix E. It has taken into account a similar guidance document
produced by the LIUD Group and currently referred to by Lincoln Drainage Group.
Developer Contributions
7.3 There is established statutory legislation for developers to follow when they wish to requisition
sewers and water mains in accordance with the Water Industry Act 1991. In respect of non
water industry infrastructure, for example flood defences, Section 106 agreements may be
used relating to the Town and Country Planning Act 1990. This allows a Local Planning
Authority to enter into a planning obligation with a land developer.
In addition to the above arrangements there is now the facility for a community infrastructure
levy (CIL) developers.
� CIL will form part of a wider package of funding for infrastructure to support housing and
economic growth and it will be a standard charge decided by the designated charging
authorities and levied by them on new developments.
� Where a CIL is implemented planning obligations under Section 106 will compliment CIL.
However, the Government proposes, subject to consultation, that they should focus on three
areas as follows:-
- Planning obligations may be the only suitable tool to cover certain none financial
technical or operational matters.
- Developers should continue to negotiate directly with the Local Planning Authority to deal
with the site specific impacts that their development will have on the immediate area and
without the mitigation of which the development ought not to be given planning
permission.
- To ensure that there is sufficient affordable housing.
7.4 Typical unit costs for improving water cycle infrastructure are:-
� Water supply trunk mains £1.5m to £2m/Km
� Trunk sewers £2m to £2.5m/Km
� Pumping Stations £250-400k for the half to one cumec stations
� Extending STWs – tanks £1m/1000m3
Data taken from Faber Maunsell database.
7.5 Actual costs involved will depend on the ultimate scale of the developments and on the
selected options for improvements at STWs and in sewerage networks. Inevitably,
contributions amounting to several million pounds will be involved.
7 Related Issues
Faber Maunsell Lincoln Water Cycle Study 46
Climate Change
7.6 Global climate change may have a significant effect on the frequency and intensity of flood
events in Britain and could have wide ranging impacts on flood risk, water supply and demand,
and flows to STWs in the Lincoln Policy Area over the next century. More precise and detailed
information will gradually emerge as time progresses.
7.7 PPS25 Annex B includes guidance on the predicted impacts of climate change on flood risk for
new development. Any decisions and consideration on climate change relating to planning
decisions must be made in accordance with this guidance.
7.8 These changes could have a significant impact in the Lincoln Policy Area, and the relevant
authorities should discuss and agree approaches on climate change with the Environment
Agency and AWS.
7.9 Local authorities across the country have been signing up to a voluntary Climate Change
Pledge to help safeguard the environment for future generations. The three local authorities
involved in the LPA have signed up to this document. However, the effects of climate change
still remain uncertain and the Government office is working on the development of a regional
climate change action plan which should be available for consultation later this year (2008).
SUDS…………………………………………..
7.10 Government guidance has been promoting the use of SUDS to protect receiving water quality
and amenity and to provide protection against flooding downstream of developments. In the
LPA, appropriate SUDS will be required whenever practicable.
7.11 The type of SUDS techniques which are suitable, in particular areas, depends very much on
the nature of the soil and sub-soil geology. In some case, infiltration techniques are
appropriate, whilst in others (usually at higher ground levels), attenuation SUDS may be more
appropriate.
7.12 Maintenance of SUDS is a difficult issue as very rarely do Local Authorities, Internal Drainage
Boards, or the Environment Agency agree to take over long-term maintenance of installations.
Developers sometimes set up companies to manage the maintenance and sometimes
residents are required to contribute towards annual maintenance costs. However, these
arrangements may not be sustainable in the longer term. In the LPA, Lincs CC Highways
Department will not accept highways for adoption if the highway drains outfall to soakaways.
7.13 Table 7.1 identifies the geology and permeability in the three major urban growth areas and
indicates the types of SUDS which may be suitable. (Developers should check infiltration rates
before drainage designs are finalised).

Faber Maunsell Lincoln Water Cycle Study 47
Table 7.1 SUDS in the Major Growth Areas
Site Geology Soil Type Soil Characteristics SUDS
Techniques
NEQ Jurassic
Limestone
343a (Elmton 1)
Lithomorphic –
calcareous over
limestone
Shallow, well drained fine
loamy soil.
Permeable
(Infiltration ) ?
Attenuation
being
considered
Mainly Drift over
jurassic and
cretaceous clay
or mudstone
711f (Wickham 2)
Clay soils-with
distinctive topsoil.
Stagnogley soil –
seasonably
waterlogged
Slowly permeable,
seasonally waterlogged
fine loamy over clayey,
fine silty over clayey or
clagey soil
Attenuation
Glacio fluvial
Drift (along SW
edge of area)
821b (Blackwood)
Sandy clay soil
Deep, permeable sandy
and coarse loamy soil
Infiltration
and
attenuation
WGC
River Alluvium
(along Fossdyke
Canal)
813c (Fladbury 2)
Pelo alluvial clay soil
Variably affected by
ground water. Often
sandy sub soil
Infiltration
and
attenuation –
depending on
water levels
SEQ Jurassic
Limestone
343a (Elmton 1) Shallow, well drained fine
loamy soil.
Permeable
Infiltration
It is also the intention that for proposed significant development as above, and development in ‘critical drainage areas’ will be considered by the Lincoln Drainage Group to formulate a strategy with the developer for appropriate surface water drainage.
Water Efficiency Measures
7.14 Developers should be encouraged to utilise water efficiency measures to help reduce potable
water consumption and maximise limited water resources. Examples of such measures
include;
� Water efficient appliances
� Rainwater harvesting
� Greywater recycling
Further details are provided in Appendix F.
Stage 2 – Study Content
7.15 The Stage 2 study will include re-examination of the emerging LDFs of the three local
authorities. By then, ideally more definitive plans should be available and the extent and
location of the major urban growth areas should be identified. More information should also be
available on extents of growth in the villages.
7.16 The following items should also be taken into account:-
� Outputs from Anglian Water’s Water Resource Management Plan (WRMP)
� Outputs from the Catchment Flood Management Plan (CFMP)
� Costs of providing new water supply trunk mains to the three major urban growth areas
� Costs of providing new outfalls and reinforcements to foul sewerage networks
� Best value options for extending STWs to take flows from major urban growth areas (at
Canwick, North Hykeham, South Hykeham, Skellingthorpe)
� Need for extending “village” STWs, taking into account agreed growth figures
7.17 When the need for extensions at STWs is considered, account should be taken of the desired
water quality standards, and whether the capacity of the receiving watercourse is adequate to
accept the increased volumes of treated effluent.

Faber Maunsell Lincoln Water Cycle Study 48
7.18 The Stage 2 study should include more reference to water requirements for the environment
and other users (e.g. industry, agriculture, etc) and the impacts which Climate Change may
have.
7.19 The City of Lincoln Council have recently commissioned a Strategic Housing Land Availability
Assessment (SHLAA). This will help to identify areas for future development and data from the
study needs to feed into the Stage 2 Water Cycle Study. This study is due to be completed by
August 2008.

Faber Maunsell Lincoln Water Cycle Study 49
Overview
8.1 This study has included the collection and collation of data relating to the water cycle and to
future development in the LPA. Significant uncertainty exists regarding the numbers of
dwellings in two of the major urban growth areas (the WGC and the SEQ) and this has
constrained consideration of some water cycle infrastructure issues (e.g. provision of STW
capacity). However, the base data has been examined to identify potential constraints on
development and to identify where developer contributions may be required. The main items
studied are:-
� The current situation relating to water cycle infrastructure
� The impact that implementation of extant planning permissions could have
� Future requirements for infrastructure improvements if target growth is achieved
This is a preliminary study and it defines areas where further work is required to produce a
phased water cycle strategy which will facilitate sustainable development.
Current Situation
8.2 The current situation is discussed in Section 5. The main conclusions are:-
� Water resources and supply mains are currently adequate, but Anglian Water are planning
phased additions, to secure supplies for the future (Phase 1 – probably 2015).
� Water supply mains are being replaced to reduce leakage and improve efficiency.
� No hydraulic models exist for some of the sewerage networks and Anglian Water are
considering future programmes where data may be required to ensure an integrated
approach to urban drainage (as identified by LIUD Pilot Study) and/or where flooding has
occurred.
� Pluvial flooding has increased in recent years.
� Of the 24 STWs in the LPA, 8 have water quality issues. (These are being addressed by
Anglian Water). Some have available hydraulic capacity, but may be constrained by water
quality consent parameters (Canwick and Reepham STWs may require extensions, subject
to the outcome of ongoing negotiations).
� Historically, Lincoln has experienced serious fluvial flooding but is currently protected by
“washlands” designed to give a 1 in 100 year standard of protection.
� Maintenance of raised flood embankments is an important part of Flood Risk Management
(this is carried out by the Environment Agency).
� Low lying areas rely on pumping stations for effective surface water drainage and control of
groundwater levels. Hence, the role of the Internal Drainage Boards is very important in the
LPA.
� Guidelines for developers have been produced by the LIUD Group and drainage proposals
from significant development sites are considered by the Lincoln Drainage Group.
Impact of Extant Planning Permissions
8.3 There are approximately 8,385 extant planning permissions in the LPA:-
Lincoln 4,189, North Kesteven 2,552 and West Lindsey 1,644.
Completion of these properties should not create significant problems for water resources or at
STWs. Neither will they necessitate major, new investment flood defences. However,
depending on locations, drainage from developments could exacerbate problems in sewerage
networks and lead to an increase in pluvial flooding. Arterial drainage systems could also be
8 Conclusions and Recommendations
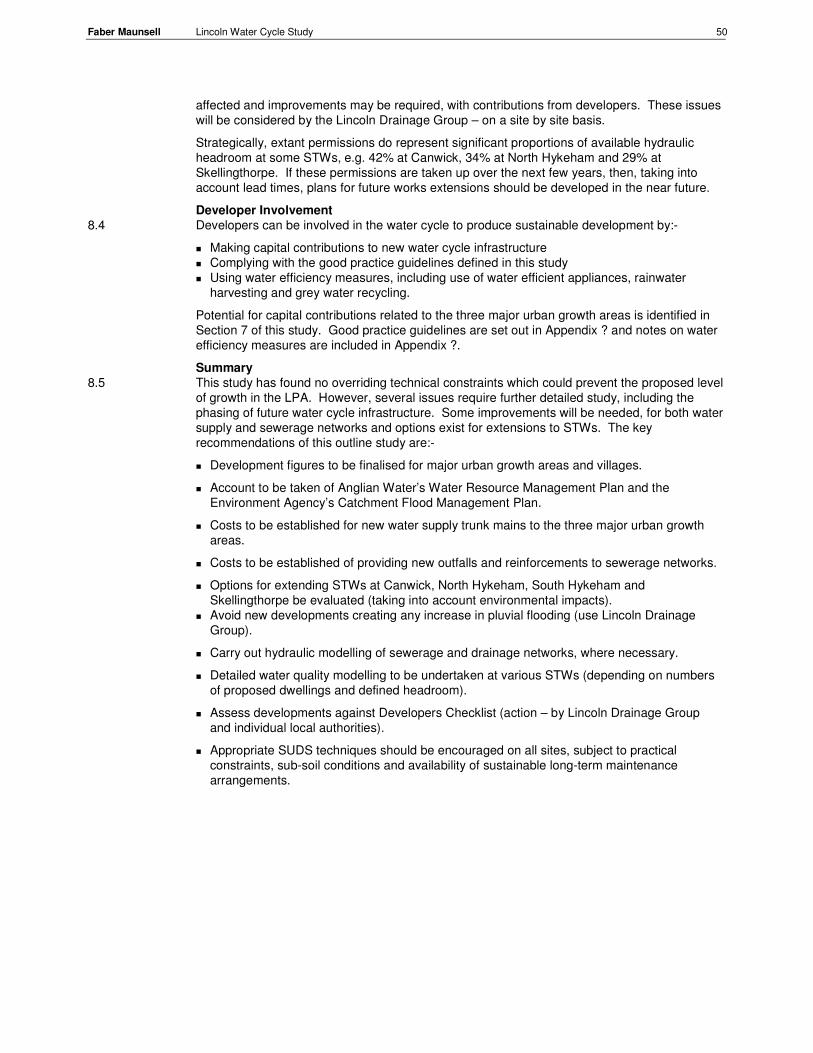
Faber Maunsell Lincoln Water Cycle Study 50
affected and improvements may be required, with contributions from developers. These issues
will be considered by the Lincoln Drainage Group – on a site by site basis.
Strategically, extant permissions do represent significant proportions of available hydraulic
headroom at some STWs, e.g. 42% at Canwick, 34% at North Hykeham and 29% at
Skellingthorpe. If these permissions are taken up over the next few years, then, taking into
account lead times, plans for future works extensions should be developed in the near future.
Developer Involvement
8.4 Developers can be involved in the water cycle to produce sustainable development by:-
� Making capital contributions to new water cycle infrastructure
� Complying with the good practice guidelines defined in this study
� Using water efficiency measures, including use of water efficient appliances, rainwater
harvesting and grey water recycling.
Potential for capital contributions related to the three major urban growth areas is identified in
Section 7 of this study. Good practice guidelines are set out in Appendix ? and notes on water
efficiency measures are included in Appendix ?.
Summary
8.5 This study has found no overriding technical constraints which could prevent the proposed level
of growth in the LPA. However, several issues require further detailed study, including the
phasing of future water cycle infrastructure. Some improvements will be needed, for both water
supply and sewerage networks and options exist for extensions to STWs. The key
recommendations of this outline study are:-
� Development figures to be finalised for major urban growth areas and villages.
� Account to be taken of Anglian Water’s Water Resource Management Plan and the
Environment Agency’s Catchment Flood Management Plan.
� Costs to be established for new water supply trunk mains to the three major urban growth
areas.
� Costs to be established of providing new outfalls and reinforcements to sewerage networks.
� Options for extending STWs at Canwick, North Hykeham, South Hykeham and
Skellingthorpe be evaluated (taking into account environmental impacts).
� Avoid new developments creating any increase in pluvial flooding (use Lincoln Drainage
Group).
� Carry out hydraulic modelling of sewerage and drainage networks, where necessary.
� Detailed water quality modelling to be undertaken at various STWs (depending on numbers
of proposed dwellings and defined headroom).
� Assess developments against Developers Checklist (action – by Lincoln Drainage Group
and individual local authorities).
� Appropriate SUDS techniques should be encouraged on all sites, subject to practical
constraints, sub-soil conditions and availability of sustainable long-term maintenance
arrangements.

Appendix A - Development Targets


Faber Maunsell Lincoln Water Cycle Study 53
City of Lincoln Council Housing Land Commitments
Table A.1 shows the total housing land commitments for City of Lincoln as at 31st March 2007
provided by the City of Lincoln Council.
Table A.1 – Total Housing Commitments for City of Lincoln to 31st March 2007
Lincoln Wards Total Extant Commitment
Total with permission
(not started)
Total Under Construction
Total Allocated (no permission)
Carholme 209 150 59 0
Glebe 255 140 115 0
Castle 128 97 31 0
Minster 347 295 52 0
Abbey 381 334 47 0
Park 152 71 81 0
Boultham 2,365 147 218 2,000
Bracebridge 104 80 4 20
Moorland 65 58 7 0
Birchwood 179 140 39 0
Hartsholme 4 2 2 0
Grand Total 4,189 1,514 655 2,020
Appendix A - Development Targets

Faber Maunsell Lincoln Water Cycle Study 54
The North Kesteven District Council Housing Indicators From 1st
April 2006 to
31st
March 2007
The Third North Kesteven Annual Monitoring Report by North Kesteven District Council
covering the period between 1st April 2006 to 31
st March 2007 describes the following housing
indicators shown in Table A.2.
Table A.2 - Housing Indicators between 1st April 2006 to 31st March 2007
Housing April 06 – March 07
Net additional dwellings over the previous five-year period or since the start of the relevant development plan document period, whichever is the longer
3843
Net additional dwellings for the current year 584
Total houses built in plan period (from 2001 onwards) 3843
Projected net additional dwellings up to the end of the relevant development plan document period (2021) from;
I. Outstanding Planning Permissions 5830
II. Adopted allocations 0
III. Windfall estimates 573
Total 6403
The annual net additional dwelling requirement; 400
Annual average number of net additional dwellings needed to meet overall housing requirements, having regard to previous year’s performance
297
It is reported that in the year to 31st March 2007, the annual build rates increased to 584 from
2006 level of 538. Construction levels further exceed the requirements set by the Lincolnshire
Structure Plan (400 units per year) for the period 2001 to 2021. The Revised Draft Local Plan
process sought to restrict development to accord with Structure Plan and Regional Planning
Guidance / Regional Spatial Strategy. In order to meet the reduced Structure Plan targets for
the District, build rates would need to come down to 297 houses per year.
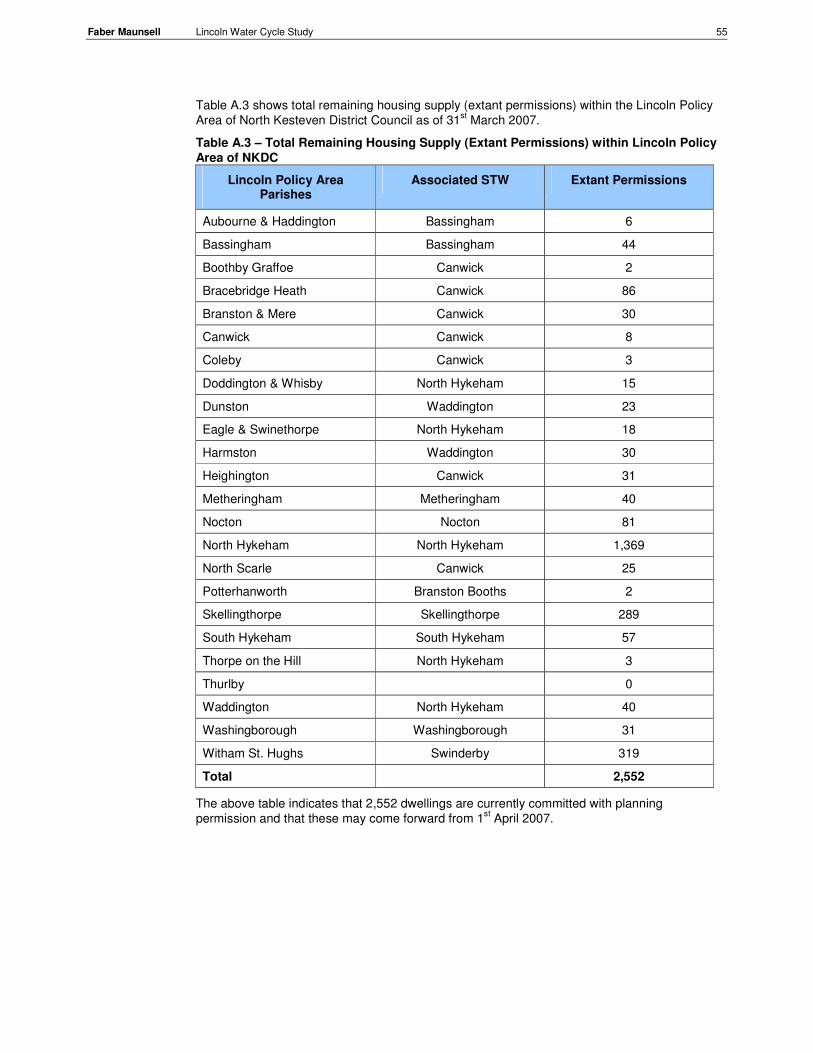
Faber Maunsell Lincoln Water Cycle Study 55
Table A.3 shows total remaining housing supply (extant permissions) within the Lincoln Policy
Area of North Kesteven District Council as of 31st March 2007.
Table A.3 – Total Remaining Housing Supply (Extant Permissions) within Lincoln Policy
Area of NKDC
Lincoln Policy Area Parishes
Associated STW Extant Permissions
Aubourne & Haddington Bassingham 6
Bassingham Bassingham 44
Boothby Graffoe Canwick 2
Bracebridge Heath Canwick 86
Branston & Mere Canwick 30
Canwick Canwick 8
Coleby Canwick 3
Doddington & Whisby North Hykeham 15
Dunston Waddington 23
Eagle & Swinethorpe North Hykeham 18
Harmston Waddington 30
Heighington Canwick 31
Metheringham Metheringham 40
Nocton Nocton 81
North Hykeham North Hykeham 1,369
North Scarle Canwick 25
Potterhanworth Branston Booths 2
Skellingthorpe Skellingthorpe 289
South Hykeham South Hykeham 57
Thorpe on the Hill North Hykeham 3
Thurlby 0
Waddington North Hykeham 40
Washingborough Washingborough 31
Witham St. Hughs Swinderby 319
Total 2,552
The above table indicates that 2,552 dwellings are currently committed with planning
permission and that these may come forward from 1st April 2007.

Faber Maunsell Lincoln Water Cycle Study 56
West Lindsey District Council
The amount of housing to be developed in West Lindsey between 2001 and 2026 will be
broadly set by the emerging East Midlands Regional Plan (RSS8). The emerging Regional Plan
presently sets an annual average housing provision rate for West Lindsey of 552 dwellings, of
which 170 (5225 in total) should be in that part of the District identified as the Lincoln Policy
Area. This level of development represents a substantial growth on the previous West Lindsey
Local Plan figure of 350 dwellings per annum. Although in recent years housing completions in
West Lindsey have actually been as shown in Table A.4.
Table A.4 – Housing Completions within Lincoln Policy Area of WLDC
Year of Completion No. of Dwellings
Completed No. of Dwellings in Lincoln
Policy Area
2003/4 878 451
2004/5 809 344
2005/6 897 305
2006/7 873 354
Total 2003/07 3,457 1,454
West Lindsey Annual Monitoring Report covering the period between 1st April 2006 to 31
st
March 2007 describes the following housing requirement for the Lincoln Policy Area within West
Lindsey District Council as shown in Table A.5.
Table A.5 - Housing Indicators as of 1st April 2007
Housing Requirement No. of Dwellings
Structure Plan Requirement 2001-2016 2,175 (145 per annum)
Completions 2001-2006/7 (6 years) 1,910
Residual Requirements 2007-2016 (9 years) 265
Table A.6 shows total remaining housing supply (extent permissions) within Lincoln Policy Area
of West Lindsey District Council as of 31st December 2007.

Faber Maunsell Lincoln Water Cycle Study 57
Table A.6 – Total Remaining Housing Supply (Extant Permissions) within Lincoln Policy
Area of WLDC as of 31st December 2006
Lincoln Policy Area Parishes
STW Under Construction
Outline Planning
Permission
Full Planning
Permission
Residual Local Plan Allocations
Aisthorpe - - - - -
Apley 2 5 12
Bardney Bardney 1 4 12 200
Barlings - - - -
Brattleby - - - -
Broadholme - - - -
Broxholme - - - -
Bullington - - - -
Burton Canwick 1 - - -
Burton Waters Canwick 36 - 32
Cammeringham
Cherry Willingham Canwick/ Reepham
124 8 133 10
Cold Hanworth - - - - -
Dunholme Dunholme 48 2 29 35
Faldingworth Faldingworth 5 4 1 38
Fillingham Faldingworth 1 4 1 -
Fiskerton Fiskerton 10 5 4 -
Friesthorpe - - - -
Fulnetby - - - -
Glentworth - 1 -
Goltho - - - -
Grange-de-Lings - - - -
Hackthorn - - - -
Hawthorn Avenue Reepham 8 14 38
Holton-cum-Beckering
- -
1 -
Ingham Ingham 1 6 6 -
Ingleby - - - -
Kingthorpe - - - -
Langworth Reepham 2 1 23
Lincoln Fringe (N Greetwell)
Canwick
23
-
142
-
Lincoln Fringe (Nettleham)
Nettleham
350
65
Lincoln Fringe (Riseholme)
- - - -
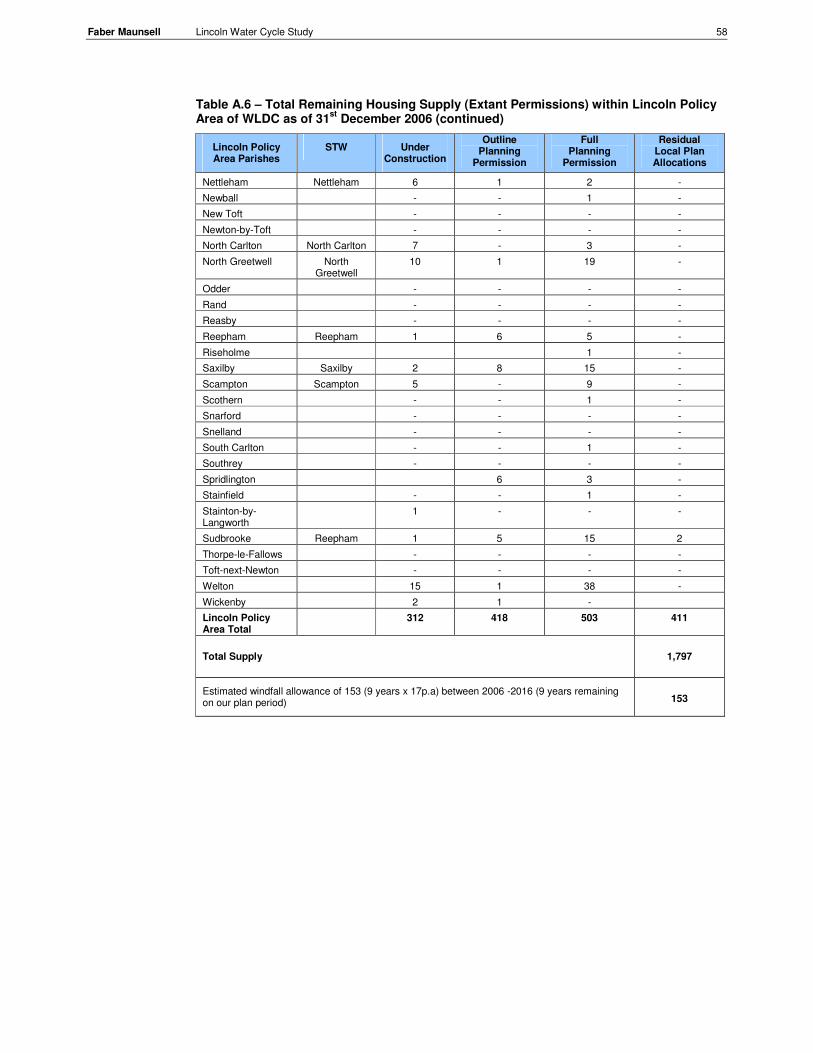
Faber Maunsell Lincoln Water Cycle Study 58
Table A.6 – Total Remaining Housing Supply (Extant Permissions) within Lincoln Policy Area of WLDC as of 31
st December 2006 (continued)
Lincoln Policy Area Parishes
STW Under Construction
Outline Planning
Permission
Full Planning
Permission
Residual Local Plan Allocations
Nettleham Nettleham 6 1 2 -
Newball - - 1 -
New Toft - - - -
Newton-by-Toft - - - -
North Carlton North Carlton 7 - 3 -
North Greetwell North Greetwell
10 1 19 -
Odder - - - -
Rand - - - -
Reasby - - - -
Reepham Reepham 1 6 5 -
Riseholme 1 -
Saxilby Saxilby 2 8 15 -
Scampton Scampton 5 - 9 -
Scothern - - 1 -
Snarford - - - -
Snelland - - - -
South Carlton - - 1 -
Southrey - - - -
Spridlington 6 3 -
Stainfield - - 1 -
Stainton-by-Langworth
1 - - -
Sudbrooke Reepham 1 5 15 2
Thorpe-le-Fallows - - - -
Toft-next-Newton - - - -
Welton 15 1 38 -
Wickenby 2 1 -
Lincoln Policy Area Total
312 418 503 411
Total Supply 1,797
Estimated windfall allowance of 153 (9 years x 17p.a) between 2006 -2016 (9 years remaining on our plan period) 153

Appendix B – Water Resources and Water
Supply


Faber Maunsell Lincoln Water Cycle Study 61
B1 Water Resource Management Units (WRMUs)
The current resource situation in each WMRU is summarised below:-
WRMU 1 - Upper Witham down to Marston
This unit covers the headwaters of the River Witham from its source at South Witham down to
Marston (upstream of the STW discharge) and includes two significant tributaries, Cringle Brook
and Honington Brook. It also includes the unconfined Lincolnshire Limestone Groundwater
Management Unit (GWMU). The unit includes two Environment Agency assessment points,
AP1 (Saltersford) and AP2 (Marston), both on the River Witham.
The river flows through a largely agricultural area, with pockets of rapidly developing
infrastructure, housing and light industry around Grantham. There are 22 licences to abstract
from this unit. 97% of the abstraction is for public water supply, 3% for spray irrigation and less
than 1% for industry, commerce and general agriculture. Although the unit’s resource
availability status is classified by the Environment Agency as ‘over licensed’ flows in the river
can be supported at Colsterworth by discharges from a bulk raw water transfer pipeline from
Rutland Water constructed during the 1976 drought emergency.
WRMU 2 – River Witham from Claypole to North Hykeham and Lower River Brant
This unit encompasses the River Witham from Marston (AP2) down to North Hykeham (AP5).
AP3 (Claypole) falls within this section of the Witham. This unit also includes the lower end of
the River Brant as far upstream as Brant Broughton (AP4). Land drainage and flood defence
works have generally removed the direct connection between these watercourses and the land
in this unit, and raised flood defence embankments along the Witham and Brant protect the
floodplain from inundation.
There are 25 abstraction licences in this unit, mostly for spray irrigation, with smaller amounts
used for industry and commerce. The resource availability status in this unit is classified as ‘no
water available’.
WRMU 3 – Upper River Brant
This small unit covers the headwaters and upper catchment of the River Brant as far
downstream as Brant Broughton (AP4). This is predominantly an agricultural area with 9 spray
irrigation abstraction licences, 4 for summer abstraction and 5 for winter abstraction. The unit’s
resource availability status is classified as ‘over licensed’.
WRMU 4 - Main River Witham, Fossdyke Canal and River Till.
This unit includes the River Witham from North Hykeham (AP5) downstream to the tidal limit at
Grand Sluice, Boston (AP14). Upstream of Lincoln this unit also includes the Fossdyke Canal
and the River Till. Downstream of Lincoln the unit includes Branston Beck and the extensive
fenlands on the west (right) bank of the river as far downstream as Chapel Hill, including the
downstream ends of Billinghay Skirth and the River Slea, and the minor east (left) bank
tributaries between Bardney and Dogdyke.
The unit includes AP6 (Fossdyke in Lincoln), AP9 (Bardney) and the unconfined groundwater
assessment point, AP18, at Branston. The unit extends up Billinghay Skirth as far as AP12
(Scopwick) and up the River Slea as far as AP13 (Leasingham Mill). This unit consists primarily
of surface waters and forms the main receiving unit for the Witham catchment.
Within this unit the Fossdyke Canal and River Witham form an important link for an inter-basin
raw water transfer (the Trent Witham Ancholme Scheme) to support public water supply
abstraction from the River Ancholme.
There are 167 abstraction licences in this unit (94 summer, 54 winter and 19 annual licences).
Apart from the City of Lincoln, the unit is largely agricultural because of the high grade farmland
Appendix B – Water Resources and
Water Supply

Faber Maunsell Lincoln Water Cycle Study 62
in the area and licensed abstraction is split between three main uses; spray irrigation, industrial
/ commercial and general agriculture. The resource availability status in this unit is categorised
as ‘no water available’.
WRMU 5 – Barlings Eau
This unit comprises the eastern half of the Barlings Eau catchment and all of its east (left) bank
tributaries above its confluence with the River Witham near Short Ferry. The unit also includes
the downstream ends of the Barlings Eau’s west bank tributaries. AP8 (Langworth Bridge) falls
within this unit.
There are 42 abstraction licences in this predominantly rural unit, by far the largest of which is
the bulk water transfer abstraction at Short Ferry. Although the abstraction point is actually on
the Barlings Eau, 500m upstream of the confluence with the Old River Witham, the water
abstracted comes almost entirely from the River Witham and the flow in the Eau is reversed at
its downstream end when pumping is taking place. The resource availability status in this unit
is categorised as ‘no water available’.
WRMU 8 – Unconfined Lincolnshire Limestone
This unit consists of two sections, separated by the River Witham (WRMU8). Both sections are
similar areas of the unconfined Lincolnshire Limestone aquifer. The northern section covers the
western half of the Barlings Eau catchment and its west bank spring-fed tributaries. This
section of the unit includes the confined groundwater assessment points 15 (Welton) and 16
(Fiskerton) as well as AP7 (Nettleham) on Nettleham Beck.
The southern section of this unit extends from Potterhanworth down to Bloxholm and includes
the spring-fed headwaters of Dunston, Metheringham and Scopwick Becks and Springwell
Brook. The confined groundwater assessment point 17 (Blankney) lies on the eastern edge of
the unit, as does AP12 (Scopwick).
There are 35 abstraction licences in this unit (both northern and southern sections) and nearly
80% of the water abstracted is at public water supply sourceworks on the confined Lincolnshire
Limestone aquifer. The remainder is split between spray irrigation, industrial / commercial use
and general agriculture. The resource availability status in this unit is ‘no water available’.
B2 WRMUs – Resource Availability Classification
Tables B.1 and B.2 below show the deployable outputs in megalitres per day (ml/d) from each
of the sourceworks to each of the water resource planning (WRP) zones in the Lincoln study
area. Table B.1 gives the figures in terms of average daily sourceworks output (ADSO) which
reflects current average outputs and supplies. Table B.2 gives the figures in terms of the
maximum sourceworks output (MaxSO) that can be delivered to that planning zone. These
figures are determined by overall sourceworks and distribution network capacities. Outputs
from the sourceworks listed in Tables B.1 and B.2 to planning zones outside the Lincoln study
area are not included in those tables.
Table B.1 – Public Water Supply Sourceworks - Average Deployable Outputs
ADSO Average Daily Sourceworks Output
(ADSO) to WRP Zone Sourceworks
Total Lincoln Branston Welton Waddingham
Elkesley (Newton) 38.00 32.71 0.19 5.10 0
Branston Booths 4.50 0.02 4.48 0 0
Dunston 2.00 2.00 0 0 0
Waddingham 3.90 0 0 0.23 3.67
Welton 5.70 0 0 5.70 0
Elsham (Potable) 7.49 0 0 3.50 3.99
Note: All sourceworks are groundwater abstraction except for Elsham which is surface water.

Faber Maunsell Lincoln Water Cycle Study 63
Table B.2 – Public Water Supply Sourceworks - Maximum Deployable Outputs
MaxSO Maximum Sourceworks Output
(MaxSO) to WRP Zone Sourceworks
Total Lincoln Branston Welton Waddingham
Elkesley (Newton) 46.00 39.60 0.23 6.17 0
Branston Booths 6.80 0.03 6.77 0 0
Dunston 4.10 4.10 0 0 0
Waddingham 5.00 0 0 0.30 4.70
Welton 7.50 0 0 7.50 0
Elsham (Potable) 9.37 0 0 4.38 4.99
Note: All sourceworks are groundwater abstraction except for Elsham which is surface water.
The totals in Tables B.1 and B.2 have been used to derive Tables B.3 and B.4 (in main text)
Table B.3 gives the total ADSO for each sourceworks expressed as a percentage of the total
MaxSO for that sourceworks. These percentages indicate that these sourceworks are all
operating at about 80% of their maximum capacity with the exception of Branston Booths at
66% and Dunston at under 50%, providing a degree of spare capacity for the Lincoln WRP
zone.
Table B.3 – Public Water Supply Sourceworks - Deployable Outputs
(ADSO as a percentage of MaxSO)
Sourceworks Sourceworks
ADSO
Sourceworks
MaxSO
ADSO as
% of
MaxSO
Elkesley (Newton) 38.00 46.00 82.6%
Branston Booths 4.50 6.80 66.2%
Dunston 2.00 4.10 48.8%
Waddingham 3.90 5.00 78.0%
Welton 5.70 7.50 76.0%
Elsham (Potable) 7.49 9.37 79.9%
TOTAL 61.59 78.77 78.2%
B3 Water Quality
The discharge of salts, nutrients and pathogens to rivers and groundwater may impact water
quality and the beneficial use of these waters. Rivers and water bodies may be contaminated
from surface runoff (e.g. agricultural land) of direct discharge from STWs, storm overflows or
industrial premises. In addition to the impact associated with the discharge of pollutants to the
environment, excess nutrients may result in algal blooms in receiving waters. Algal blooms can
affect drinking water systems, aquatic life and may limit the use of the water for other beneficial
uses.
Water abstraction and discharges can have an adverse impact on ecosystems associated with
rivers and terrestrial systems where the water flow and receiving water quality are modified.
Therefore, careful consideration should be given to the abstraction of water and discharge of
wastewater from areas that contain or are located near sensitive ecological resources.
Wastewater discharges may selectively induce the growth of one species over another or alter
the structure and characteristics of given ecosystem. In some cases, the flow in a river or
stream may be composed of a large fraction, or entirely of, treated effluent. The implementation
of a water reclamation and reuse programme may have a large impact on downstream water
use under these conditions. In some cases, final effluent may be used beneficially for stream-
flow augmentation, where minimum flows are required to protect the habitat of aquatic

Faber Maunsell Lincoln Water Cycle Study 64
organisms or support downstream activities. Limits on water quality may be implemented to
protect sensitive and important species.
The Environment Agency’s water quality classification system establishes a target water quality
for different stretches of river using a five grade hierarchical system. Each grade has differing
acceptable concentrations of chemicals, including ammonia, biochemical oxygen demand and
dissolved oxygen. These then determine a target grade for each designated river stretch
determining the water quality based on Surface Waters River Ecosystem Classification (RE)
Regulations 1994 and defined as follows1:
The River Quality Objective (RQO) is the water quality target as defined by these regulations.
Compliance with the RQO is assessed on a 3 year rolling basis from the General Quality
Assessment (GQA) routine monitoring undertaken by the Environment Agency. Although the
methods of calculation and standards are not identical, GQA (A) is approximately equivalent to
RE1 etc, as shown in Table B.4. Therefore a river which has a river quality objective of RE1 is
likely to meet its objective if it is reporting a GQA (A) for the preceding three years.
Both the GQA and RQO classifications consider quality against a statistical 90 percentile target.
This means that statistically the river quality has to be better than the target value for 90% of
the time.
Table B.4: GQA and RQO Correlation
GQA RQO (RE) Ecological status
A RE1 Very good quality (suitable for all fish species)
B RE2 Good quality (suitable for all fish species)
C RE3 Fairly good quality (suitable for high-class coarse fisheries)
D RE4 Fair quality (suitable for course fisheries)
E RE5 Poor quality (likely to limit fish populations)
River Witham
There are over 100 discharges greater that 20 m3/day from a variety of sources including STWs
and industry in to the Witham catchment.
In terms of watercourse discharges, the Lincoln Policy Area is dominated by the major STW
serving Lincoln at Canwick with a current DWF of about 25000 m3/d. Other substantial
discharges (>2000 m3/day) are made from sewage works at North Hykeham, Anwick, Sleaford
and Horncastle. Major trade discharges with a maximum permitted flow of >2000 m3/day are
made from quarries at Norton Bottoms Pit and Norton Disney, landfills at Leadenham and
Colsterworth, and from a factory at Easton.
Water quality is assessed by the Environment Agency in terms of both chemical and biological
quality parameters in accordance with the General Quality Assessment scheme (GQA). GQA
scores can range between ‘A’ (highest quality) to F (lowest quality). Records from sampling
undertaken during 2000 show that the chemical GQA results for the Witham catchment range
between ‘A’ e.g. Upper River Witham to ‘D’ e.g. Fossdyke Canal.
There have in the past been persistent problems with low level but significant contamination of
water in the River Witham / Sincil Dyke system in the Lincoln area with heating oil and a toxic
timber treatment chemical. Pollutants in either the Sincil Dyke of the River Witham have
implications for the use of Trent-Witham-Ancholme Scheme water as a potable resource and
the Environment Agency and Anglian Water should be satisfied that these problems have been
resolved and that these contaminants are no longer present in water abstracted at Short Ferry.
1 The Environment Agency website

Appendix C- Sewerage and Sewage
Treatment

Faber Maunsell Lincoln Water Cycle Study 67
C1 Catchment Sewerage Models – Current Status
The following spreadsheet – Table C.1 – gives data relating to sewage treatment works, their
catchments and the current status of catchment sewerage models.
Appendix C – Sewerage and Sewage
Treatment

Faber Maunsell Lincoln Water Cycle Study 68
- This page intentionally left blank -

Faber Maunsell Lincoln Water Cycle Study 69
C2 Location of DG5 Flooding Incidents
Table C.2 below shows current locations of DG5s in Lincoln Area:-
Table C.2 - Current DG5s in Lincoln Area by Postcode
Postcode Internal
Flooding (last 10 yrs)
External Flooding
(last 10 yrs)
Internal First Flooding Date
External First Flooding Date
LN4 2LZ Y
LN4 2PH Y
LN1 1LX Y 31 May 2007
LN5 8RL Y 6 Jul 2006
LN5 8RL Y 6 Jul 2006
LN5 8RL Y 6 Jul 2006
LN5 8RL Y 6 Jul 2006
LN2 4AX Y
LN2 4DX Y 7 Jul 2006
LN5 9BB Y 6 Jul 2006
LN5 9BB Y 6 Jul 2006
LN5 8PW Y Y 6 Jul 2006 6 Jul 2006
LN6 7HF Y 29 Jun 2006
LN5 8TN Y 6 Jul 2006
LN2 5LT Y
LN5 9UD Y Y 31 Jul 2002 6 Jul 2006
LN5 9UD Y Y 31 Jul 2002 6 Jul 2006
LN5 9UD Y Y 31 Jul 2002 6 Jul 2006
LN5 9UD Y 6 Jul 2006
LN5 9UD Y 6 Jul 2006
LN6 3NL Y
LN5 9TY Y 6 Jul 2006
LN5 9TY Y 6 Jul 2006
LN2 2HZ Y
LN5 8NW Y 6 Jul 2006
LN2 1RS Y Y
LN2 1RS Y
LN2 5ET Y Y 30 Oct 2005 30 Oct 2005
LN1 3SN Y 6 Aug 1985
LN1 3SN 6 Aug 1985
LN1 3SN 6 Sep 2005
LN1 3SN 6 Sep 2005
LN1 3SN 26 Sep 1991
LN1 3SN 26 Sep 1991
LN1 3SN 26 Oct 1991
LN1 3SN 26 Sep 1991
LN4 4 BU Y
LN5 7QD Y
LN2 5DQ Y 22 Jul 2004
LN2 4PX Y 29 Jul 2002
LN2 4PX Y 29 Jul 2002
LN2 4LW Y 12 Jun 2006
LN4 1DZ Y 31 May 2007
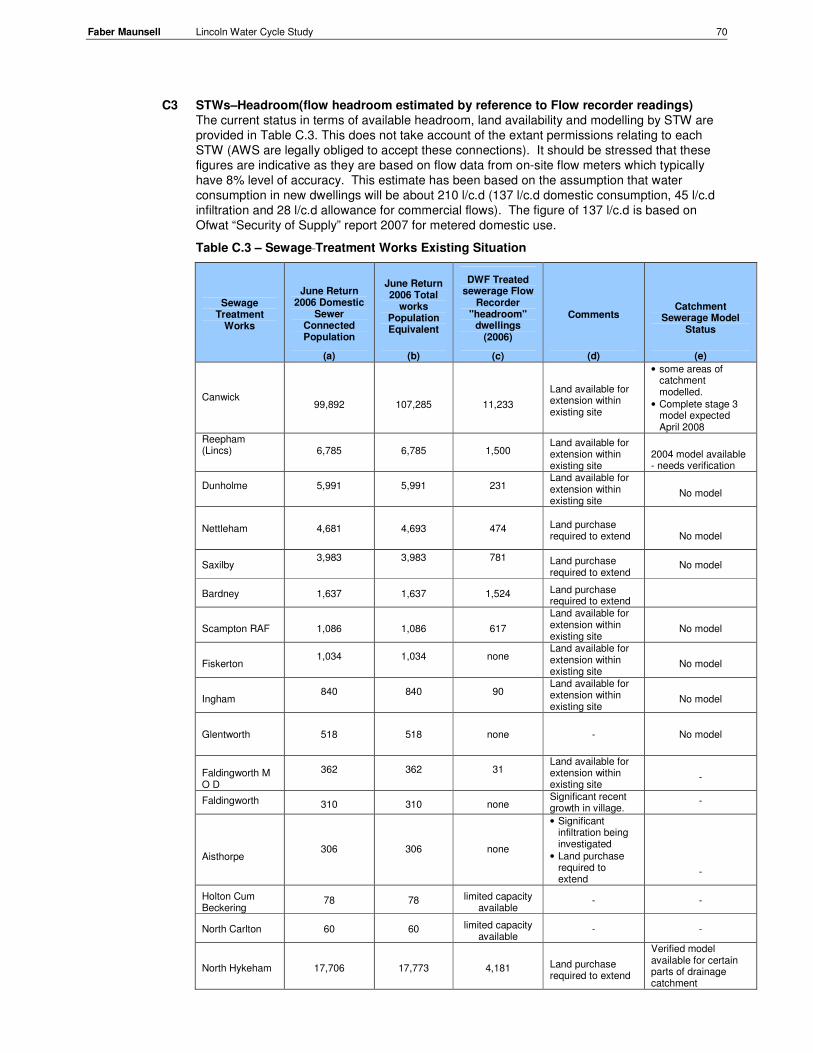
Faber Maunsell Lincoln Water Cycle Study 70
C3 STWs–Headroom(flow headroom estimated by reference to Flow recorder readings)
The current status in terms of available headroom, land availability and modelling by STW are
provided in Table C.3. This does not take account of the extant permissions relating to each
STW (AWS are legally obliged to accept these connections). It should be stressed that these
figures are indicative as they are based on flow data from on-site flow meters which typically
have 8% level of accuracy. This estimate has been based on the assumption that water
consumption in new dwellings will be about 210 l/c.d (137 l/c.d domestic consumption, 45 l/c.d
infiltration and 28 l/c.d allowance for commercial flows). The figure of 137 l/c.d is based on
Ofwat “Security of Supply” report 2007 for metered domestic use.
Table C.3 – Sewage Treatment Works Existing Situation
Sewage Treatment
Works
June Return 2006 Domestic
Sewer Connected Population
(a)
June Return 2006 Total
works Population Equivalent
(b)
DWF Treated sewerage Flow
Recorder "headroom"
dwellings (2006)
(c)
Comments
(d)
Catchment Sewerage Model
Status
(e)
Canwick 99,892 107,285 11,233
Land available for extension within existing site
• some areas of catchment modelled.
• Complete stage 3 model expected April 2008
Reepham (Lincs) 6,785 6,785 1,500
Land available for extension within existing site
2004 model available - needs verification
Dunholme 5,991 5,991 231 Land available for extension within existing site
No model
Nettleham 4,681 4,693 474
Land purchase required to extend No model
Saxilby 3,983 3,983 781 Land purchase
required to extend No model
Bardney 1,637 1,637 1,524 Land purchase required to extend
Scampton RAF 1,086 1,086 617
Land available for extension within existing site
No model
Fiskerton 1,034 1,034 none
Land available for extension within existing site
No model
Ingham 840 840 90
Land available for extension within existing site
No model
Glentworth 518 518 none - No model
Faldingworth M O D
362 362 31 Land available for extension within existing site
-
Faldingworth 310 310 none Significant recent growth in village.
-
Aisthorpe 306 306 none
• Significant infiltration being investigated
• Land purchase required to extend
-
Holton Cum Beckering
78 78 limited capacity available
- -
North Carlton 60 60 limited capacity available
- -
North Hykeham 17,706 17,773 4,181 Land purchase required to extend
Verified model available for certain parts of drainage catchment

Faber Maunsell Lincoln Water Cycle Study 71
Sewage Treatment
Works
June Return 2006 Domestic
Sewer Connected Population
(a)
June Return 2006 Total
works Population Equivalent
(b)
DWF Treated sewerage Flow
Recorder "headroom"
dwellings (2006)
(c)
Comments
(d)
Catchment Sewerage Model
Status
(e)
Metheringham 4,165 4,229 102 Land purchase required to extend
Complete model
Skellingthorpe 4,163 4,163 986 Land purchase required to extend
2002 model
Washingborough 3,453 3,419 none
Limited land available for extension within existing site
No model
South Hykeham 2,611 2,585 1,536
• Flow headroom likely to be taken up by existing approvals.
• Land available for extension within existing site
No model
Bassingham 1,898 1,914 324
• Land purchase required to extend
No model
Nocton (RAF) 544 538 none Descriptive consent -
Branston Booths 239 237 limited capacity available
Descriptive consent -
Swinderby 550 550 5
Probable growth scheme associated with ongoing development at Witham St Hughs
No model
Note: No allowance is made for “extant” planning permissions in this Table.
Difference between Domestic Sewer Connected Population and Total works Population Equivalent is trade Increased amounts of flow to the STWs could lead to volumetric problems in the watercourses which receive
treated effluent. This factor will require further consideration in the Stage 2 study.
C4 Current Status of Main STWs
Canwick
This is the main STWs in the Lincoln Policy Area, serves the drainage areas of Lincoln city and
settlements within North Kesteven Lincoln Policy Area of Bracebrige Heath, Branston and Mere
and most of Washingborough. The total population equivalent (pe) served is currently 107,285.
Canwick STW approximate dwelling capacity before the consented dry weather flow (cDWF)
exceeds 11,233. AWS will be required to apply to the EA for a revised flow consent which is
likely to result in a tightening of effluent pollutant concentrations. The current consent is not
particularly stringent at 30:15:15 (TTS : BOD: ammN all as mg/l). As such, any revised consent
to meet growth requirements should not be technically challenging to meet. There is significant
land available for any future extension works. Canwick is a regional sludge treatment centre
and the site is thus safeguarded as a waste site within the local plan.
There is an existing Drainage Area Plan (DAP) model for the sewer network which covers some
areas of the catchment. A complete Stage 3 InfoWorks model is due for completion in May
2008.
Reepham
This works is the largest in the West Lindsay Lincoln Policy Area with a current pe of 6,785. It
has an approximate dwelling flow capacity of about 1,500 although there are process capacity
issues which will need to be addressed by AWS if this site is to serve significant growth. There
is land available within the existing site boundary for extensions to treatment capacity.
The catchment has a 2004 DAP but this requires verification to give reliable outputs.

Faber Maunsell Lincoln Water Cycle Study 72
Dunholme
This works currently serves a pe of 5,991. It has limited flow headroom capacity of about 200
dwellings. The discharge has a consent of 20:10:4. A tightening of this consent which would be
likely in the event of an application to the EA for a higher flow consent would require significant
capital investment. There is land available within the existing site boundary for increasing
treatment capacity. There is no DAP for Dunholme.
Nettleham
The current pe served is 4,693. The flow headroom based on cDWF equates to about 450
dwellings. Consent issues are similar to Dunholme with the current requirement being 20:12:5.
There is insufficient land available within the existing site boundary to provide significant
increase in treatment capacity. There is no DAP for the catchment.
Saxilby
The works has a pe of 3,983 and a headroom based on cDWF of about 750 dwellings. The
current consent is 30:15:5. Any reduction in consent parameters would require significant
capital investment. Furthermore, land purchase would be required since there is limited
availability within the existing boundary.
North Hykeham
This is the second largest works in the Lincoln Policy Area serving a pe of 17,773 including the
major settlement of North Hykeham. It has an approximate dwelling capacity based on cDWF of
4,000. The consent is relatively relaxed at 40:20:15. However, there is little land available
within the current boundary to extend the treatment process. There is a verified DAP for key
areas of the catchment.
Metheringham
The current pe served is 4,229 and the cDWF headroom about 100. The consent is currently
20:15:10; a tightening of the BOD consent would involve significant capital investment. Any
significant extension of treatment capacity would require land purchase since there is limited
space within the existing boundary. There is a complete, verified model for the drainage area.
Skellingthopre
The works current pe is 4,163 with flow headroom to accommodate about an additional 1,000
dwelling connections. Current consent is 20:10:5 and would therefore involve significant capital
investment if tightened. Furthermore, land purchase would be required to extend treatment.
There is a DAP available dating from 2002.
South Hykeham
The works currently serves 2,485 pe and has a flow headroom equating to about 1,500
dwellings.The works offers opportunity for development in the catchment having a fairly relaxed
consent of 40:20:10 and land availability within the existing boundary.
Swinderby (ex RAF) STW There is significant development at Witham St Hughs which is within the catchment of Swinderby (ex RAF) STW. Prior to new housing being connected, the population equivalent of the STW was about 550. The phase 1 development is expected to increase the population equivalent of the works to over 2000 pe. As such it will be required to meet Urban Wastewater Treatment Directive BOD and COD removal.The STW will require a capital scheme and a revised flow consent which may result in a tightening in the current consent of 40:20:15. The STW discharge is to a ditch for which the Upper Witham IDB is responsible. Increasing effluent flow may require relocating and discharging directly to the River Witham.
Other Sites
Of the other treatment works, there is currently little or no headroom within the DWF consent at
Fiskerton, both works in Faldingworth, Aisthorpe, Washingborough, Nocton and Swinderby
Of these, Washingborough has a relatively relaxed consent at 45:35:15 and there is limited land
available for extending the works. Subject to EA granting a revised consent, this site offers
potential for accepting a reasonable increase in flow.

Faber Maunsell Lincoln Water Cycle Study 73
Fiskerton similarly does not have a tight consent at 50:25:10 and has land availability within the
existing boundary.
Other sites such as Bardney, Aisthope, will require a significant time period to extend as land
purchase will be required.

Faber Maunsell Lincoln Water Cycle Study 74
- This page intentionally left blank -

Appendix D – Fluvial Flood Risk

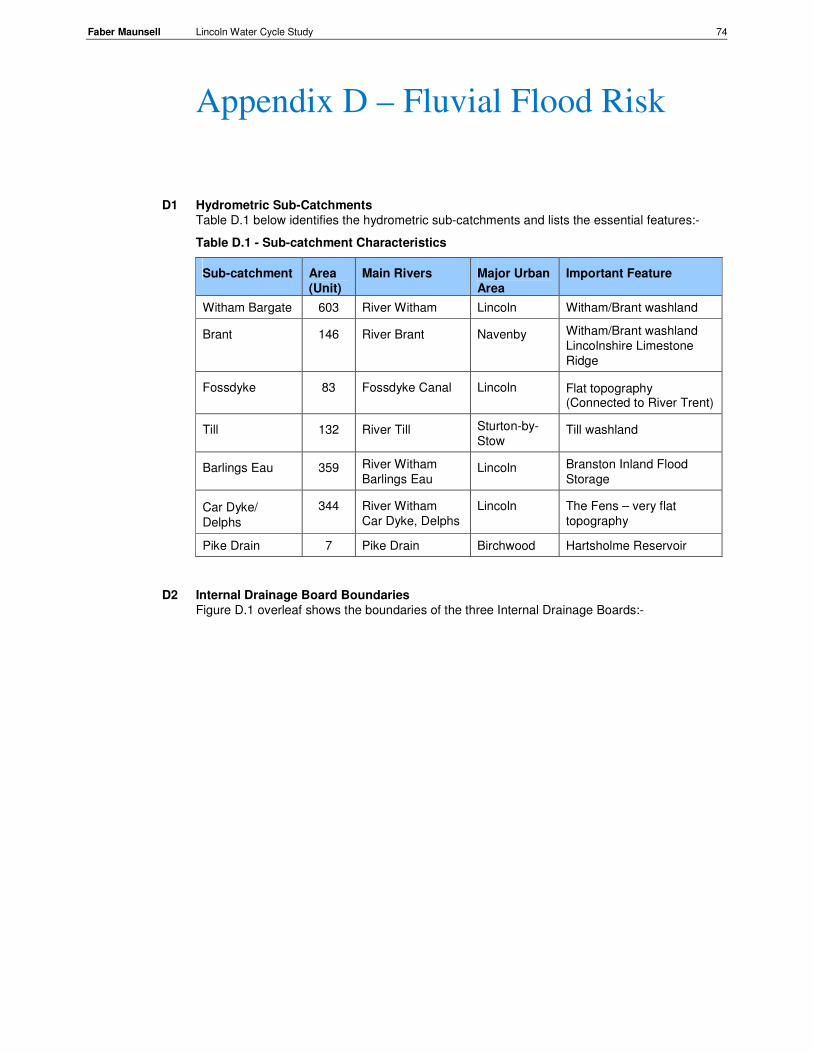
Faber Maunsell Lincoln Water Cycle Study 74
D1 Hydrometric Sub-Catchments
Table D.1 below identifies the hydrometric sub-catchments and lists the essential features:-
Table D.1 - Sub-catchment Characteristics
Sub-catchment Area
(Unit)
Main Rivers Major Urban
Area
Important Feature
Witham Bargate 603 River Witham Lincoln Witham/Brant washland
Brant 146 River Brant Navenby Witham/Brant washland
Lincolnshire Limestone
Ridge
Fossdyke 83 Fossdyke Canal Lincoln Flat topography (Connected to River Trent)
Till 132 River Till Sturton-by-
Stow Till washland
Barlings Eau 359 River Witham
Barlings Eau Lincoln Branston Inland Flood
Storage
Car Dyke/
Delphs
344 River Witham
Car Dyke, Delphs
Lincoln The Fens – very flat
topography
Pike Drain 7 Pike Drain Birchwood Hartsholme Reservoir
D2 Internal Drainage Board Boundaries
Figure D.1 overleaf shows the boundaries of the three Internal Drainage Boards:-
Appendix D – Fluvial Flood Risk

Faber Maunsell Lincoln Water Cycle Study 75
Figure D.1- Boundaries of Internal Drainage Boards

Faber Maunsell Lincoln Water Cycle Study 74
D3 Flooding Events Figure D.2 below shows the historical fluvial and pluvial flooding areas as described in the LIUD study:-
Figure D.2 - Extent of Recorded Fluvial and Pluvial Flood Events
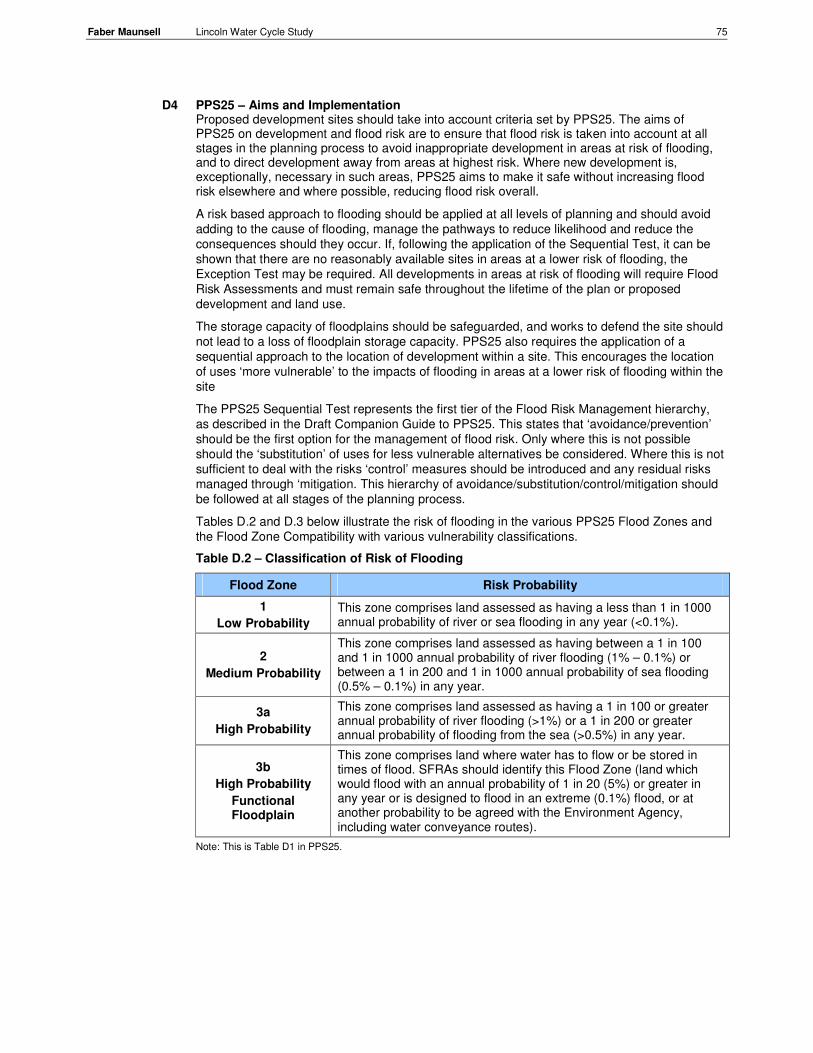
Faber Maunsell Lincoln Water Cycle Study 75
D4 PPS25 – Aims and Implementation Proposed development sites should take into account criteria set by PPS25. The aims of PPS25 on development and flood risk are to ensure that flood risk is taken into account at all stages in the planning process to avoid inappropriate development in areas at risk of flooding, and to direct development away from areas at highest risk. Where new development is, exceptionally, necessary in such areas, PPS25 aims to make it safe without increasing flood risk elsewhere and where possible, reducing flood risk overall.
A risk based approach to flooding should be applied at all levels of planning and should avoid
adding to the cause of flooding, manage the pathways to reduce likelihood and reduce the
consequences should they occur. If, following the application of the Sequential Test, it can be
shown that there are no reasonably available sites in areas at a lower risk of flooding, the
Exception Test may be required. All developments in areas at risk of flooding will require Flood
Risk Assessments and must remain safe throughout the lifetime of the plan or proposed
development and land use.
The storage capacity of floodplains should be safeguarded, and works to defend the site should
not lead to a loss of floodplain storage capacity. PPS25 also requires the application of a
sequential approach to the location of development within a site. This encourages the location
of uses ‘more vulnerable’ to the impacts of flooding in areas at a lower risk of flooding within the
site
The PPS25 Sequential Test represents the first tier of the Flood Risk Management hierarchy,
as described in the Draft Companion Guide to PPS25. This states that ‘avoidance/prevention’
should be the first option for the management of flood risk. Only where this is not possible
should the ‘substitution’ of uses for less vulnerable alternatives be considered. Where this is not
sufficient to deal with the risks ‘control’ measures should be introduced and any residual risks
managed through ‘mitigation. This hierarchy of avoidance/substitution/control/mitigation should
be followed at all stages of the planning process.
Tables D.2 and D.3 below illustrate the risk of flooding in the various PPS25 Flood Zones and
the Flood Zone Compatibility with various vulnerability classifications.
Table D.2 – Classification of Risk of Flooding
Flood Zone Risk Probability
1
Low Probability
This zone comprises land assessed as having a less than 1 in 1000 annual probability of river or sea flooding in any year (<0.1%).
2
Medium Probability
This zone comprises land assessed as having between a 1 in 100 and 1 in 1000 annual probability of river flooding (1% – 0.1%) or between a 1 in 200 and 1 in 1000 annual probability of sea flooding (0.5% – 0.1%) in any year.
3a
High Probability
This zone comprises land assessed as having a 1 in 100 or greater annual probability of river flooding (>1%) or a 1 in 200 or greater annual probability of flooding from the sea (>0.5%) in any year.
3b
High Probability
Functional Floodplain
This zone comprises land where water has to flow or be stored in times of flood. SFRAs should identify this Flood Zone (land which would flood with an annual probability of 1 in 20 (5%) or greater in any year or is designed to flood in an extreme (0.1%) flood, or at another probability to be agreed with the Environment Agency, including water conveyance routes).
Note: This is Table D1 in PPS25.

Faber Maunsell Lincoln Water Cycle Study 76
Table D.3 Flood Risk Vulnerability and Flood Zone Compatibility
Vulnerability
classification
(Table D2,
PPS25)
Zone Essential
Infrastructure
Water
Compatible
Highly
Vulnerable
More
Vulnerable
Less
Vulnerable
Zone 1 √ √ √ √ √
Zone 2 √ √ Exception
Test
√ √
Zone 3 Exception Test √ X Exception
Test
√
Flo
od
Zon
e
(Tab
le D
1,
PP
S2
5)
Zone 3b Exception Test √ X X X
Key √ Development is appropriate
X Development should not be permitted

Faber Maunsell Lincoln Water Cycle Study 77
- This page intentionally left blank -

Appendix E – Developers Checklist

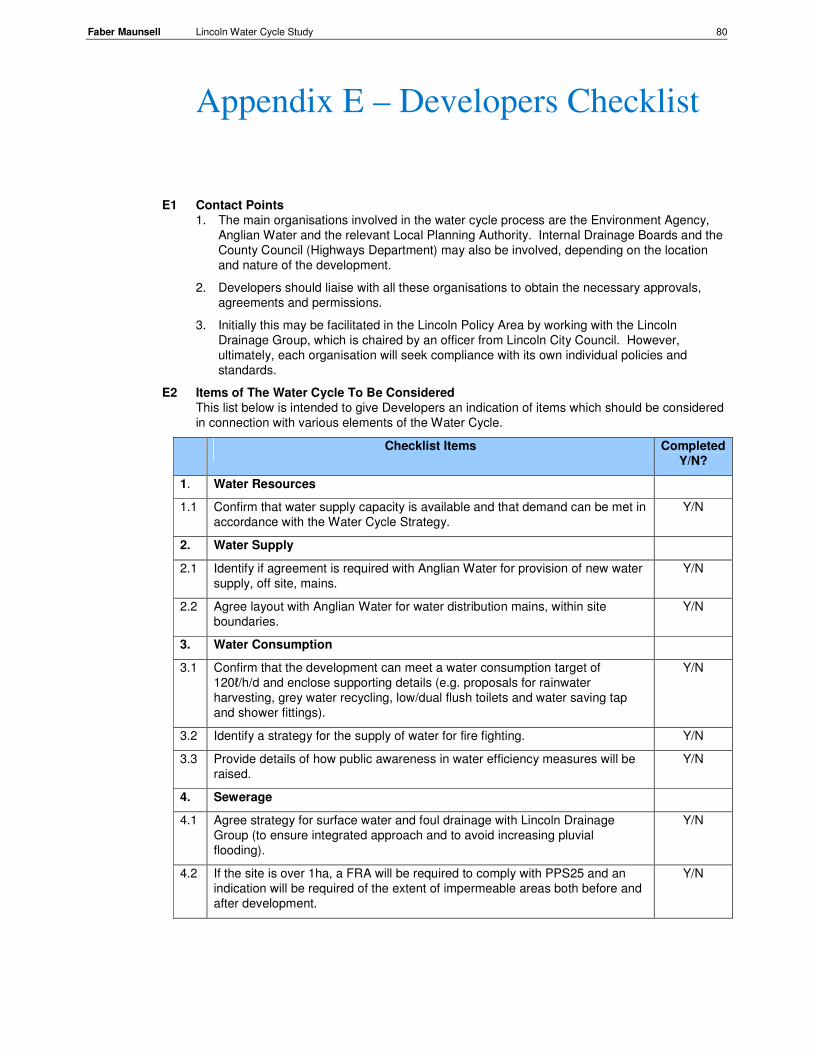
Faber Maunsell Lincoln Water Cycle Study 80
E1 Contact Points
1. The main organisations involved in the water cycle process are the Environment Agency,
Anglian Water and the relevant Local Planning Authority. Internal Drainage Boards and the
County Council (Highways Department) may also be involved, depending on the location
and nature of the development.
2. Developers should liaise with all these organisations to obtain the necessary approvals,
agreements and permissions.
3. Initially this may be facilitated in the Lincoln Policy Area by working with the Lincoln
Drainage Group, which is chaired by an officer from Lincoln City Council. However,
ultimately, each organisation will seek compliance with its own individual policies and
standards.
E2 Items of The Water Cycle To Be Considered
This list below is intended to give Developers an indication of items which should be considered
in connection with various elements of the Water Cycle.
Checklist Items Completed
Y/N?
1. Water Resources
1.1 Confirm that water supply capacity is available and that demand can be met in
accordance with the Water Cycle Strategy.
Y/N
2. Water Supply
2.1 Identify if agreement is required with Anglian Water for provision of new water
supply, off site, mains.
Y/N
2.2 Agree layout with Anglian Water for water distribution mains, within site
boundaries.
Y/N
3. Water Consumption
3.1 Confirm that the development can meet a water consumption target of
120ℓ/h/d and enclose supporting details (e.g. proposals for rainwater
harvesting, grey water recycling, low/dual flush toilets and water saving tap
and shower fittings).
Y/N
3.2 Identify a strategy for the supply of water for fire fighting. Y/N
3.3 Provide details of how public awareness in water efficiency measures will be
raised.
Y/N
4. Sewerage
4.1 Agree strategy for surface water and foul drainage with Lincoln Drainage
Group (to ensure integrated approach and to avoid increasing pluvial
flooding).
Y/N
4.2 If the site is over 1ha, a FRA will be required to comply with PPS25 and an
indication will be required of the extent of impermeable areas both before and
after development.
Y/N
Appendix E – Developers Checklist

Faber Maunsell Lincoln Water Cycle Study 81
Checklist Items Completed
Y/N?
4.3 Demonstrate that surface water runoff rates will not be increased and that
balancing arrangements will be designed in accordance with the Environment
Agency Technical Report “Preliminary Rainfall Runoff Management for
Developments, Revision “D” (taking into account varying rainfall events up to
and including a 1 in 100 year plus climate change event).
Y/N
4.4 Apply for Byelaw consents from the Environment Agency and/or the Internal
Drainage Board if new outfalls are proposed into watercourses, or if new
buildings/structures are proposed within a specified distance from the banks.
(For the EA and Witham 1st and 3
rd IDBs this distance is 9 metres. For the
Upper Witham IDB it is 6 metres). Designs will have to be in accordance with
relevant standards/specifications.
Y/N
5. Sustainable Drainage Systems (SUDS)
5.1 Provide details of any SUDS proposed and supporting evidence, e.g. ground
investigation results as per BRE 365 – Soakaway Design. For design
guidance of SUDS see CIRIA publication C697.
Y/N
5.2 Confirm methods of interception and infiltration (where applicable) and
quantify the amount of surface water to be controlled by SUDS.
Y/N
5.3 Confirm the arrangements for the future ownership and maintenance of all
SUDS installations.
Y/N
6. Sewage Treatment
6.1 Confirm whether or not sewage treatment capacity is available in accordance
with the Water Cycle Strategy and whether a financial contribution is required
to works extensions.
Y/N
6.2 Identify if new outfall sewer to STW is required in the Water Cycle Strategy,
and possible costs.
Y/N
7. Flood Risk Management
7.1 Has a Flood Risk Assessment (FRA) been prepared, as required by Planning
Policy Statement Note 25: (- Annex ‘E’)?
Y/N
7.2 Is development proposed within flood zones 2 or 3 (see Environment Agency
Flood Map)?
Y/N
7.3 If the answer to 7.2 is ‘Yes’, have the Sequential Test and the Exception Test
been applied (see Annex ‘D’ of PPS25), and account taken of Vulnerability
classification?.
Y/N
7.4 Will arterial drains be affected by surface water runoff from the development,
and will financial contributions be required from the Internal Drainage Board or
the Environment Agency?
Y/N
7.5 Has the Lincoln Drainage Group agreed the principles for flood risk
management on the site?
Y/N
7.6 Demonstrate that all sources of flooding have been taken into account, and
that allowances have been made for the possible impacts of climate change.
Y/N
7.7 Where residual risks are involved, demonstrate that appropriate mitigation
measures will be provided, e.g. raising of floor levels, flood resilience and
resistance measures, dry access/egress, compensatory flood storage areas,
etc (see Annex ‘G’ of PPS25).
Y/N
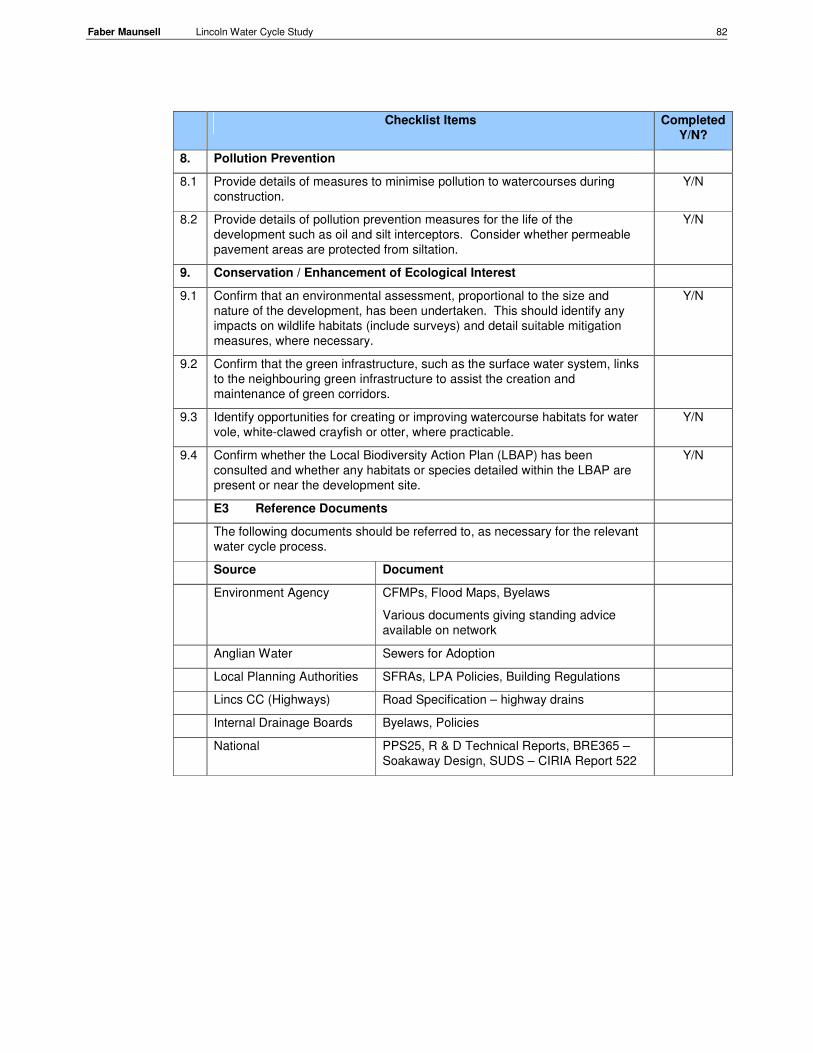
Faber Maunsell Lincoln Water Cycle Study 82
Checklist Items Completed
Y/N?
8. Pollution Prevention
8.1 Provide details of measures to minimise pollution to watercourses during
construction.
Y/N
8.2 Provide details of pollution prevention measures for the life of the
development such as oil and silt interceptors. Consider whether permeable
pavement areas are protected from siltation.
Y/N
9. Conservation / Enhancement of Ecological Interest
9.1 Confirm that an environmental assessment, proportional to the size and
nature of the development, has been undertaken. This should identify any
impacts on wildlife habitats (include surveys) and detail suitable mitigation
measures, where necessary.
Y/N
9.2 Confirm that the green infrastructure, such as the surface water system, links
to the neighbouring green infrastructure to assist the creation and
maintenance of green corridors.
9.3 Identify opportunities for creating or improving watercourse habitats for water
vole, white-clawed crayfish or otter, where practicable.
Y/N
9.4 Confirm whether the Local Biodiversity Action Plan (LBAP) has been
consulted and whether any habitats or species detailed within the LBAP are
present or near the development site.
Y/N
E3 ….. Reference Documents
The following documents should be referred to, as necessary for the relevant
water cycle process.
Source Document
Environment Agency CFMPs, Flood Maps, Byelaws
Various documents giving standing advice
available on network
Anglian Water Sewers for Adoption
Local Planning Authorities SFRAs, LPA Policies, Building Regulations
Lincs CC (Highways) Road Specification – highway drains
Internal Drainage Boards Byelaws, Policies
National PPS25, R & D Technical Reports, BRE365 –
Soakaway Design, SUDS – CIRIA Report 522

Faber Maunsell Lincoln Water Cycle Study 83
- This page intentionally left blank -

Appendix F – Water Efficiency Measures

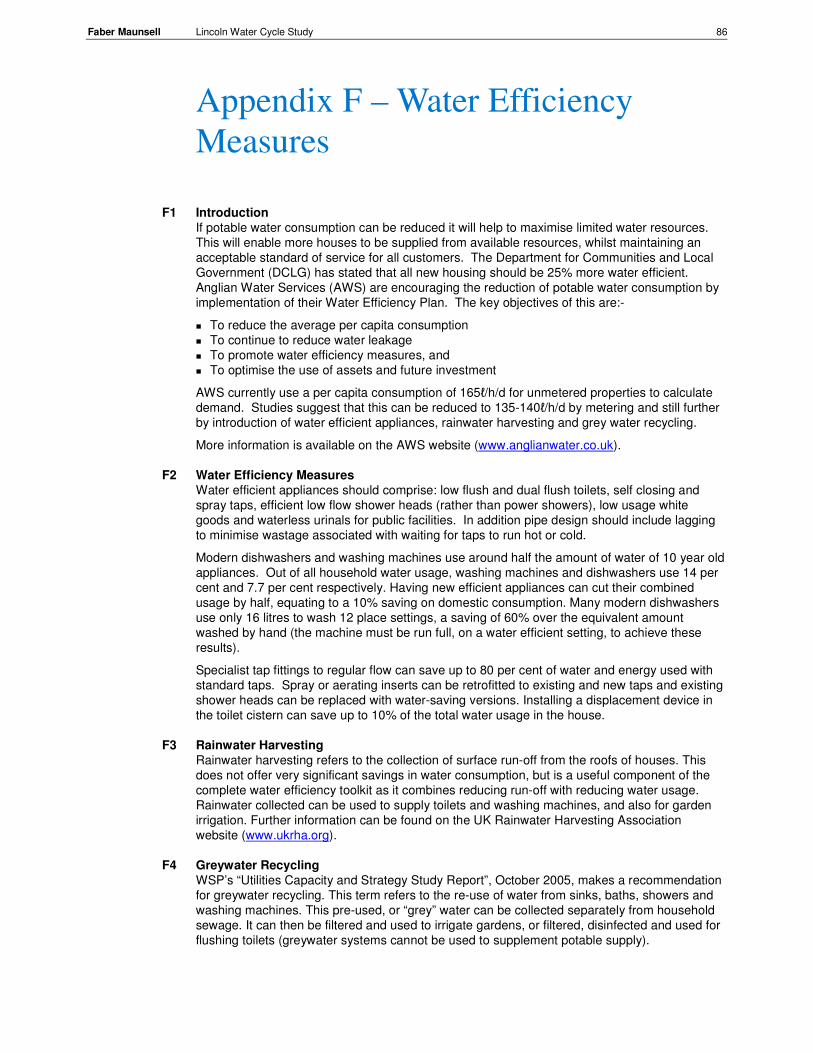
Faber Maunsell Lincoln Water Cycle Study 86
F1 Introduction
If potable water consumption can be reduced it will help to maximise limited water resources.
This will enable more houses to be supplied from available resources, whilst maintaining an
acceptable standard of service for all customers. The Department for Communities and Local
Government (DCLG) has stated that all new housing should be 25% more water efficient.
Anglian Water Services (AWS) are encouraging the reduction of potable water consumption by
implementation of their Water Efficiency Plan. The key objectives of this are:-
� To reduce the average per capita consumption
� To continue to reduce water leakage
� To promote water efficiency measures, and
� To optimise the use of assets and future investment
AWS currently use a per capita consumption of 165ℓ/h/d for unmetered properties to calculate
demand. Studies suggest that this can be reduced to 135-140ℓ/h/d by metering and still further
by introduction of water efficient appliances, rainwater harvesting and grey water recycling.
More information is available on the AWS website (www.anglianwater.co.uk).
F2 Water Efficiency Measures
Water efficient appliances should comprise: low flush and dual flush toilets, self closing and
spray taps, efficient low flow shower heads (rather than power showers), low usage white
goods and waterless urinals for public facilities. In addition pipe design should include lagging
to minimise wastage associated with waiting for taps to run hot or cold.
Modern dishwashers and washing machines use around half the amount of water of 10 year old
appliances. Out of all household water usage, washing machines and dishwashers use 14 per
cent and 7.7 per cent respectively. Having new efficient appliances can cut their combined
usage by half, equating to a 10% saving on domestic consumption. Many modern dishwashers
use only 16 litres to wash 12 place settings, a saving of 60% over the equivalent amount
washed by hand (the machine must be run full, on a water efficient setting, to achieve these
results).
Specialist tap fittings to regular flow can save up to 80 per cent of water and energy used with
standard taps. Spray or aerating inserts can be retrofitted to existing and new taps and existing
shower heads can be replaced with water-saving versions. Installing a displacement device in
the toilet cistern can save up to 10% of the total water usage in the house.
F3 Rainwater Harvesting
Rainwater harvesting refers to the collection of surface run-off from the roofs of houses. This
does not offer very significant savings in water consumption, but is a useful component of the
complete water efficiency toolkit as it combines reducing run-off with reducing water usage.
Rainwater collected can be used to supply toilets and washing machines, and also for garden
irrigation. Further information can be found on the UK Rainwater Harvesting Association
website (www.ukrha.org).
F4 Greywater Recycling
WSP’s “Utilities Capacity and Strategy Study Report”, October 2005, makes a recommendation
for greywater recycling. This term refers to the re-use of water from sinks, baths, showers and
washing machines. This pre-used, or “grey” water can be collected separately from household
sewage. It can then be filtered and used to irrigate gardens, or filtered, disinfected and used for
flushing toilets (greywater systems cannot be used to supplement potable supply).
Appendix F – Water Efficiency
Measures

Faber Maunsell Lincoln Water Cycle Study 87
Although greywater systems are often opposed on the grounds of hygiene, it is important to
remember that only a minimal percentage (3%) of domestic water consumption is actually used
for drinking and cooking purposes. The remainder therefore undergoes expensive, energy-
intensive treatment processes to meet the EU Drinking Water Directive unnecessarily.
In a typical household, toilet flushing accounts for around 35% of all use. This is comparable to
the amount used for bathing, showering and hand basins. There is a strong case for using this
“greywater” (i.e. water used for washing) for toilet flushing, which does not require water of
potable quality.
Reusing greywater significantly reduces domestic water usage. In a system where greywater is
used, up to 18,000 litres of treated water per person can be saved each year.
The full benefit of greywater recycling can only be realised through a new build system. With
larger developments there may be opportunities to integrate large scale greywater recycling
systems from the outset, which will reduce water consumption and also reduce the impact of
wastewater discharges on the environment.
Note: F2, F3 and F4 above have been taken from previous work carried out by Halcrow for the
Environment Agency and North Northamptonshire Joint Planning Unit.

References

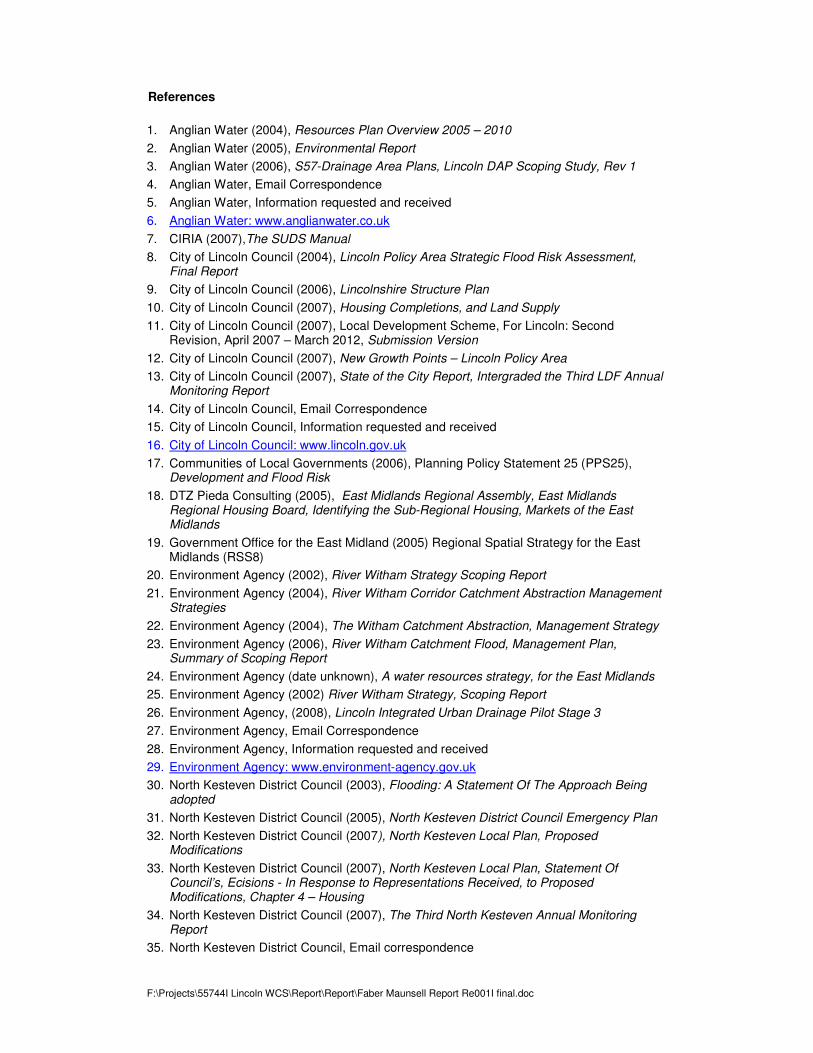
F:\Projects\55744I Lincoln WCS\Report\Report\Faber Maunsell Report Re001I final.doc
References
1. Anglian Water (2004), Resources Plan Overview 2005 – 2010
2. Anglian Water (2005), Environmental Report
3. Anglian Water (2006), S57-Drainage Area Plans, Lincoln DAP Scoping Study, Rev 1
4. Anglian Water, Email Correspondence
5. Anglian Water, Information requested and received
6. Anglian Water: www.anglianwater.co.uk
7. CIRIA (2007),The SUDS Manual
8. City of Lincoln Council (2004), Lincoln Policy Area Strategic Flood Risk Assessment, Final Report
9. City of Lincoln Council (2006), Lincolnshire Structure Plan
10. City of Lincoln Council (2007), Housing Completions, and Land Supply
11. City of Lincoln Council (2007), Local Development Scheme, For Lincoln: Second Revision, April 2007 – March 2012, Submission Version
12. City of Lincoln Council (2007), New Growth Points – Lincoln Policy Area
13. City of Lincoln Council (2007), State of the City Report, Intergraded the Third LDF Annual Monitoring Report
14. City of Lincoln Council, Email Correspondence
15. City of Lincoln Council, Information requested and received
16. City of Lincoln Council: www.lincoln.gov.uk
17. Communities of Local Governments (2006), Planning Policy Statement 25 (PPS25), Development and Flood Risk
18. DTZ Pieda Consulting (2005), East Midlands Regional Assembly, East Midlands Regional Housing Board, Identifying the Sub-Regional Housing, Markets of the East Midlands
19. Government Office for the East Midland (2005) Regional Spatial Strategy for the East Midlands (RSS8)
20. Environment Agency (2002), River Witham Strategy Scoping Report
21. Environment Agency (2004), River Witham Corridor Catchment Abstraction Management Strategies
22. Environment Agency (2004), The Witham Catchment Abstraction, Management Strategy
23. Environment Agency (2006), River Witham Catchment Flood, Management Plan, Summary of Scoping Report
24. Environment Agency (date unknown), A water resources strategy, for the East Midlands
25. Environment Agency (2002) River Witham Strategy, Scoping Report
26. Environment Agency, (2008), Lincoln Integrated Urban Drainage Pilot Stage 3
27. Environment Agency, Email Correspondence
28. Environment Agency, Information requested and received
29. Environment Agency: www.environment-agency.gov.uk
30. North Kesteven District Council (2003), Flooding: A Statement Of The Approach Being adopted
31. North Kesteven District Council (2005), North Kesteven District Council Emergency Plan
32. North Kesteven District Council (2007), North Kesteven Local Plan, Proposed Modifications
33. North Kesteven District Council (2007), North Kesteven Local Plan, Statement Of Council’s, Ecisions - In Response to Representations Received, to Proposed Modifications, Chapter 4 – Housing
34. North Kesteven District Council (2007), The Third North Kesteven Annual Monitoring Report
35. North Kesteven District Council, Email correspondence

F:\Projects\55744I Lincoln WCS\Report\Report\Faber Maunsell Report Re001I final.doc
36. North Kesteven District Council, Information requested and received
37. North Kesteven District Council: http://www.n-kesteven.gov.uk/
38. Regional Plan Policy 14 (RPP14) (date)
39. The Draft East Midlands Regional Spatial Strategy (RSS) (date)
40. The Lincoln Policy Area Sub-Regional Strategy (SRS) (date)
41. The UKCIP02 (2002), Climate Change Scenarios for the United Kingdom, Scientific Report
42. Water Framework Directive (2003)
43. West Lindsey District Council (2007), West Lindsey Annual Monitoring Report
44. West Lindsey District Council (2007), West Lindsey Strategic Flood Risk Assessment.
45. West Lindsey District Council, Email correspondence
46. West Lindsey District Council, Information requested and received
47. West Lindsey District Council: http://www.west-lindsey.gov.uk/
48. WRc (2006), Sewers for Adoption, 6th edition

Abbreviations

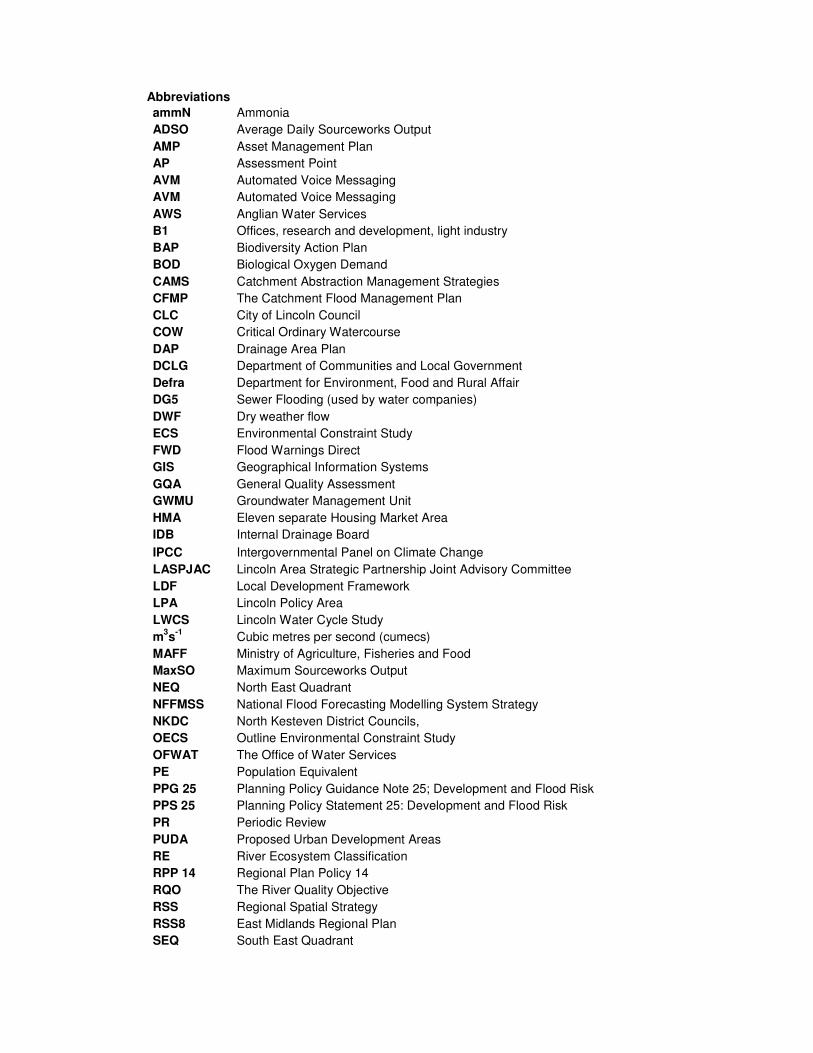
Abbreviations
ammN Ammonia
ADSO Average Daily Sourceworks Output
AMP Asset Management Plan
AP Assessment Point
AVM Automated Voice Messaging
AVM Automated Voice Messaging
AWS Anglian Water Services
B1 Offices, research and development, light industry
BAP Biodiversity Action Plan
BOD Biological Oxygen Demand
CAMS Catchment Abstraction Management Strategies
CFMP The Catchment Flood Management Plan
CLC City of Lincoln Council
COW Critical Ordinary Watercourse
DAP Drainage Area Plan
DCLG Department of Communities and Local Government
Defra Department for Environment, Food and Rural Affair
DG5 Sewer Flooding (used by water companies)
DWF Dry weather flow
ECS Environmental Constraint Study
FWD Flood Warnings Direct
GIS Geographical Information Systems
GQA General Quality Assessment
GWMU Groundwater Management Unit
HMA Eleven separate Housing Market Area
IDB Internal Drainage Board
IPCC Intergovernmental Panel on Climate Change
LASPJAC Lincoln Area Strategic Partnership Joint Advisory Committee
LDF Local Development Framework
LPA Lincoln Policy Area
LWCS Lincoln Water Cycle Study
m3s
-1 Cubic metres per second (cumecs)
MAFF Ministry of Agriculture, Fisheries and Food
MaxSO Maximum Sourceworks Output
NEQ North East Quadrant
NFFMSS National Flood Forecasting Modelling System Strategy
NKDC North Kesteven District Councils,
OECS Outline Environmental Constraint Study
OFWAT The Office of Water Services
PE Population Equivalent
PPG 25 Planning Policy Guidance Note 25; Development and Flood Risk
PPS 25 Planning Policy Statement 25: Development and Flood Risk
PR Periodic Review
PUDA Proposed Urban Development Areas
RE River Ecosystem Classification
RPP 14 Regional Plan Policy 14
RQO The River Quality Objective
RSS Regional Spatial Strategy
RSS8 East Midlands Regional Plan
SEQ South East Quadrant

SFRA Strategic Flood Risk Assessment
SSSI Sites of Special Scientific Interest
STW Sewage Treatment Works
SUDS Sustainable Urban Drainage Systems
TP Total Phosphorus.
TSFR Treated Sewage Flow Recorded
TSS Total Suspended Solids
TWAS The Trent Witham Ancholme Scheme
UKCIP UK Climate Impacts Programme
WCS Water Cycle Study
WFD Water Framework Directive
WGC Western Growth Corridor
WLDC West Lindsey District Council
WRBM Witham River Basin Management Plan
WRMU Water Resource Management Unit
UWIDB Upper Witham Internal Drainage Board
WFIDB Witham First Internal Drainage Board
WTIDB Witham Third Internal Drainage Board

Job No: 60055744I Reference: Final Report Date created: July 2008
Telephone: 01733 391456 Fax: 01733 391139 Website: http://www.fabermaunsell.com
1 The ForumMinerva Business Park
Lynch WoodPeterborough
PE2 6FT