Embed Size (px)
Citation preview
Stage 2 DBP RuleWater Supplier Training
Workbook
2013Created by the Pennsylvania DEP’s Bureau of
Safe Drinking Water
Sponsored by:

v1.1
Table of Contents
Lesson 1: Introduction……………………………………………………………………………………… 1-1
Lesson 2: IDSE Review……………………………………………………………………………………. 2-1
Lesson 3: Monitoring and Reporting……………………………………………………………….. 3-1
Lesson 4: Compliance and Enforcement……………….………………………………………… 4-1
Lesson 5: Operational Evaluation Levels…………………………………………………………. 5-1
Lesson 6: Monitoring Plans………………………………………………………………………………. 6-1
Appendix A: IDSE Report Form Addendum…………………………………………………….. A-1
Appendix B: Compliance Monitoring Summary Table…………………………………….. B-1
Appendix C: Example Full Operational Evaluation and Report………………………. C-1
Appendix D: Example Limited Scope Operational Evaluation………………………… D-1
Appendix E: Monitoring Plan Template and Instructions………………………………… E-1
Stage 2 DBP Website The forms and guidance for the Stage 2 DBP Rule can be found at the following:
Go to www.depweb.state.pa.us
On the left side, click on “DEP Programs A-Z”
Find “Drinking Water” under the letter “D”
On the right side of the Drinking Water page, click on “Regulations”
Then click on Stage 2 DBP

2013 DBP Stage 2 Water Supplier Training Lesson 1: Introduction
1-1
Lesson 1 Introduction
Objectives
We are going to start with an introductory chapter to give you:
An explanation how disinfection byproducts (DBPs) are formed
The health effects of DBPs
How we came to Stage 2: brief history of regulating DBPs in Pennsylvania.
An overview of the Stage 2 changes
Operator license “contact hours” for the course
To receive credit for this course, you must:
Attend and participate in the entire course
Complete the in-class scenario exercises.
Why are we here?
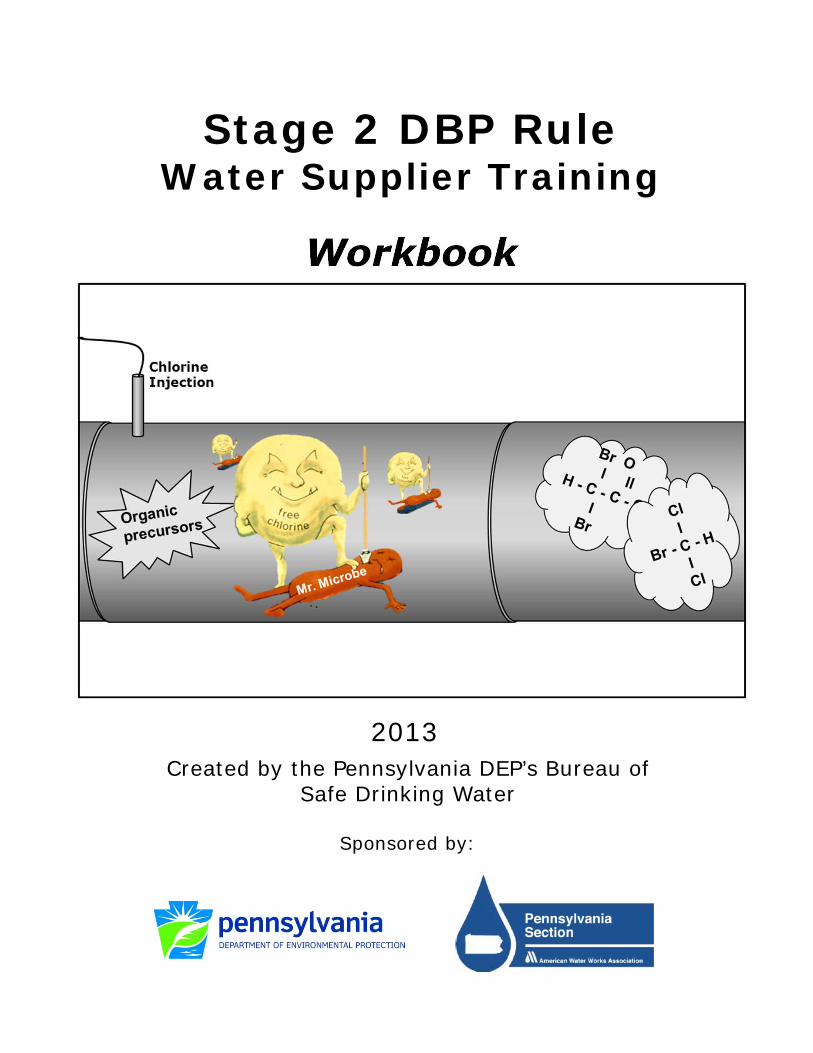
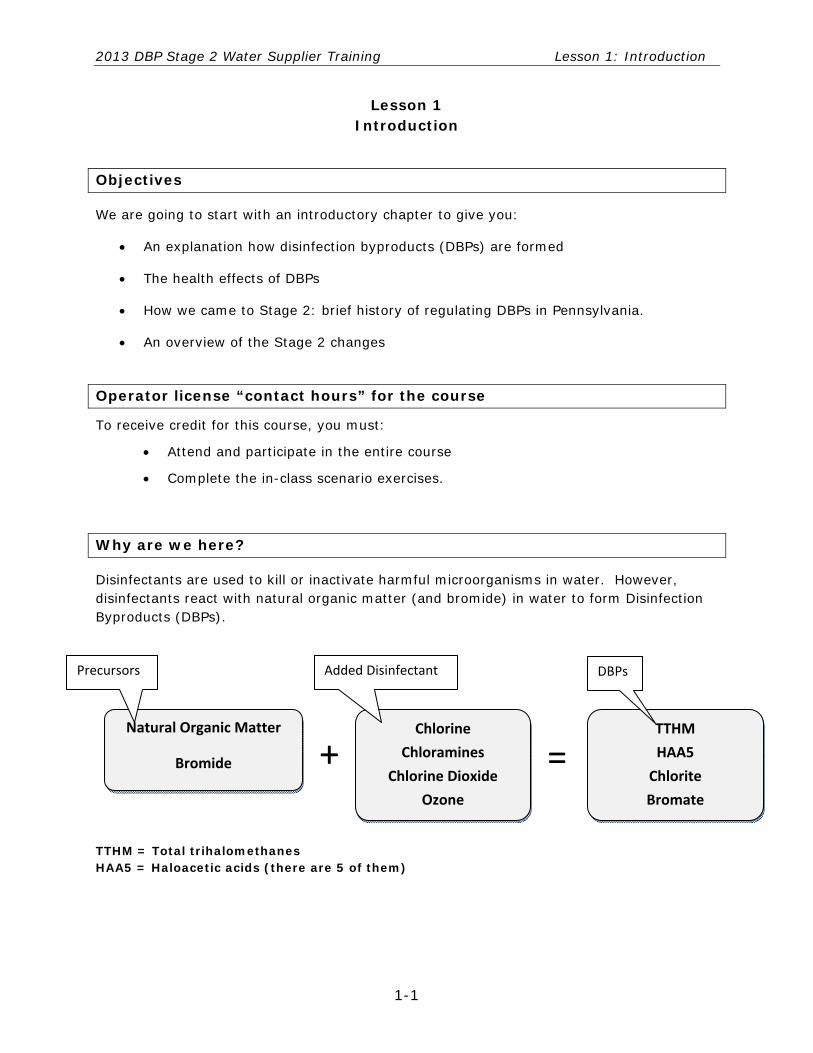
Disinfectants are used to kill or inactivate harmful microorganisms in water. However, disinfectants react with natural organic matter (and bromide) in water to form Disinfection Byproducts (DBPs).
TTHM = Total trihalomethanes HAA5 = Haloacetic acids (there are 5 of them)
Natural Organic Matter
Bromide
Precursors
+Chlorine
Chloramines
Chlorine Dioxide
Ozone
Added Disinfectant
TTHM
HAA5
Chlorite
Bromate
DBPs
=
2013 DBP Stage 2 Water Supplier Training Lesson 1: Introduction
1-2
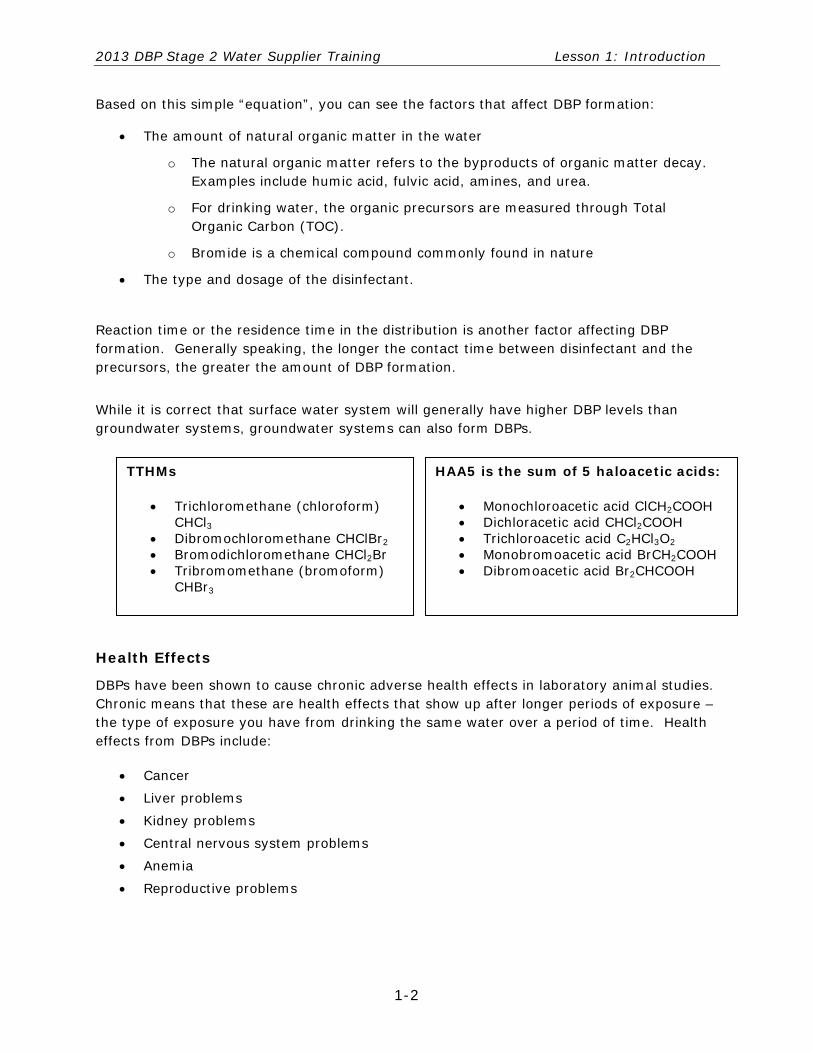
Based on this simple “equation”, you can see the factors that affect DBP formation:
The amount of natural organic matter in the water
o The natural organic matter refers to the byproducts of organic matter decay. Examples include humic acid, fulvic acid, amines, and urea.
o For drinking water, the organic precursors are measured through Total Organic Carbon (TOC).
o Bromide is a chemical compound commonly found in nature
The type and dosage of the disinfectant.
Reaction time or the residence time in the distribution is another factor affecting DBP formation. Generally speaking, the longer the contact time between disinfectant and the precursors, the greater the amount of DBP formation.
While it is correct that surface water system will generally have higher DBP levels than groundwater systems, groundwater systems can also form DBPs.
Health Effects
DBPs have been shown to cause chronic adverse health effects in laboratory animal studies. Chronic means that these are health effects that show up after longer periods of exposure – the type of exposure you have from drinking the same water over a period of time. Health effects from DBPs include:
Cancer
Liver problems
Kidney problems
Central nervous system problems
Anemia
Reproductive problems
HAA5 is the sum of 5 haloacetic acids:
Monochloroacetic acid ClCH2COOH Dichloracetic acid CHCl2COOH Trichloroacetic acid C2HCl3O2 Monobromoacetic acid BrCH2COOH Dibromoacetic acid Br2CHCOOH
TTHMs
Trichloromethane (chloroform) CHCl3
Dibromochloromethane CHClBr2 Bromodichloromethane CHCl2Br Tribromomethane (bromoform)
CHBr3
2013 DBP Stage 2 Water Supplier Training Lesson 1: Introduction
1-3
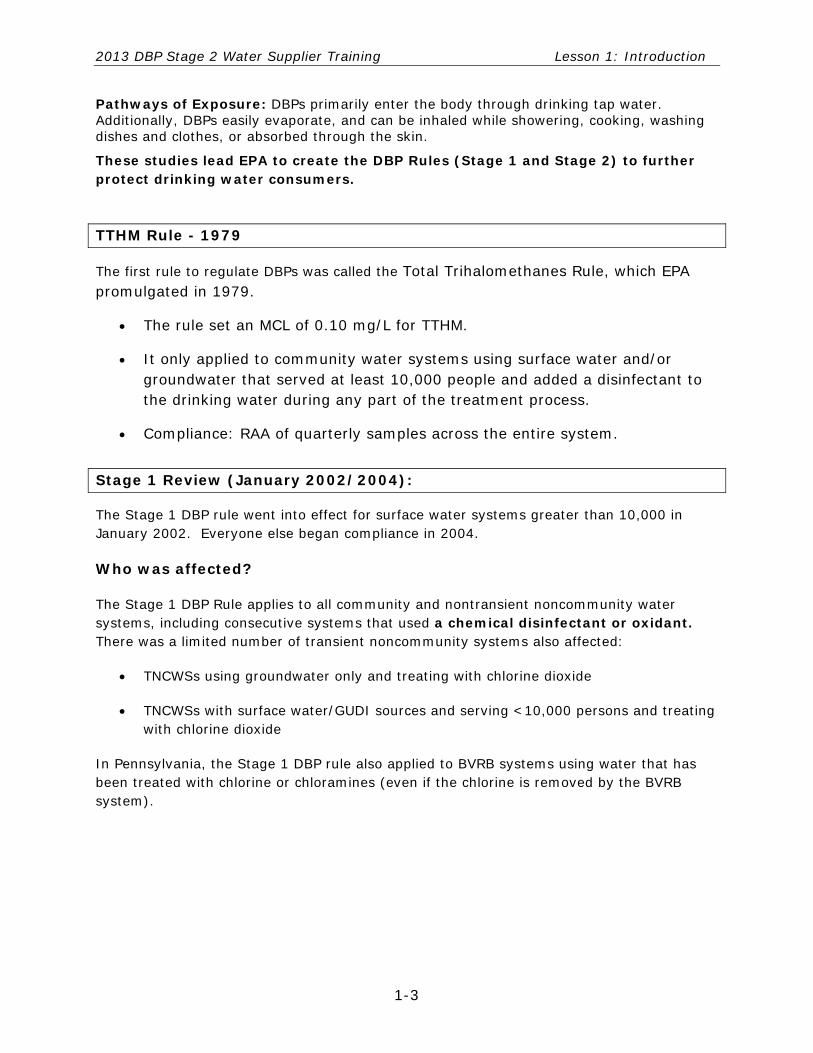
Pathways of Exposure: DBPs primarily enter the body through drinking tap water. Additionally, DBPs easily evaporate, and can be inhaled while showering, cooking, washing dishes and clothes, or absorbed through the skin.
These studies lead EPA to create the DBP Rules (Stage 1 and Stage 2) to further protect drinking water consumers.
TTHM Rule - 1979
The first rule to regulate DBPs was called the Total Trihalomethanes Rule, which EPA promulgated in 1979.
The rule set an MCL of 0.10 mg/L for TTHM.
It only applied to community water systems using surface water and/or groundwater that served at least 10,000 people and added a disinfectant to the drinking water during any part of the treatment process.
Compliance: RAA of quarterly samples across the entire system.
Stage 1 Review (January 2002/2004):
The Stage 1 DBP rule went into effect for surface water systems greater than 10,000 in January 2002. Everyone else began compliance in 2004.
Who was affected?
The Stage 1 DBP Rule applies to all community and nontransient noncommunity water systems, including consecutive systems that used a chemical disinfectant or oxidant. There was a limited number of transient noncommunity systems also affected:
TNCWSs using groundwater only and treating with chlorine dioxide
TNCWSs with surface water/GUDI sources and serving <10,000 persons and treating with chlorine dioxide
In Pennsylvania, the Stage 1 DBP rule also applied to BVRB systems using water that has been treated with chlorine or chloramines (even if the chlorine is removed by the BVRB system).
2013 DBP Stage 2 Water Supplier Training Lesson 1: Introduction
1-4
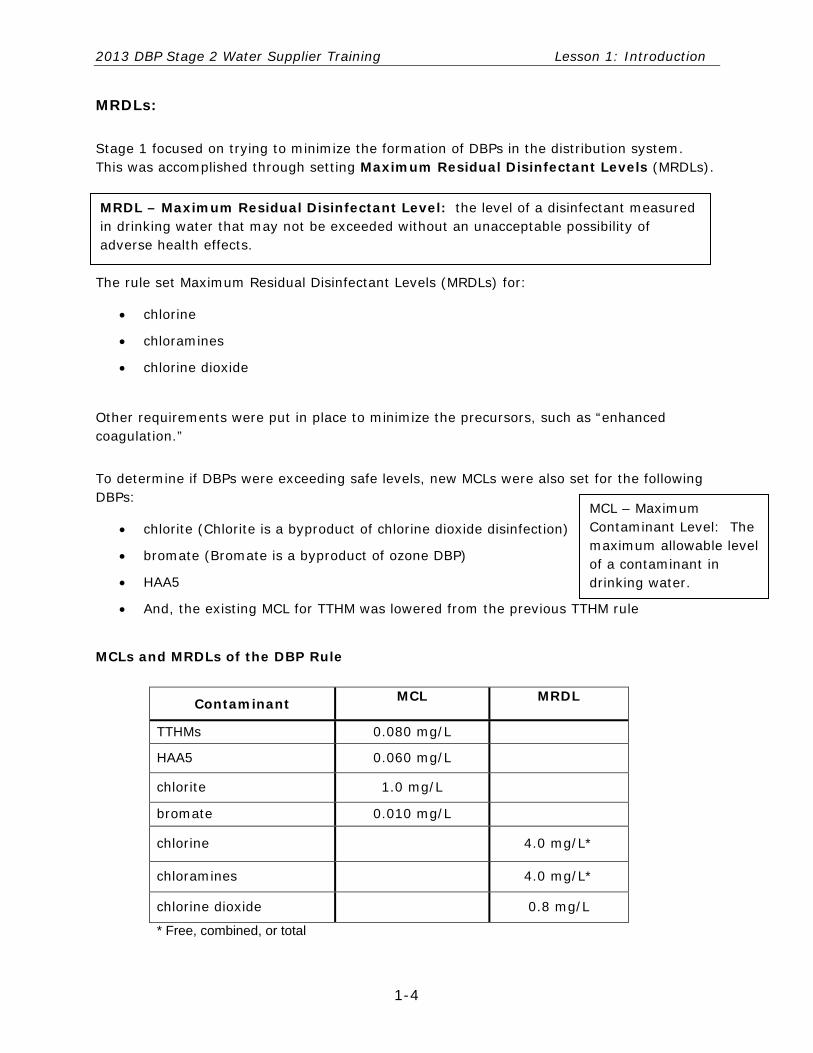
MRDL – Maximum Residual Disinfectant Level: the level of a disinfectant measured in drinking water that may not be exceeded without an unacceptable possibility of adverse health effects.
MRDLs:
Stage 1 focused on trying to minimize the formation of DBPs in the distribution system. This was accomplished through setting Maximum Residual Disinfectant Levels (MRDLs).
The rule set Maximum Residual Disinfectant Levels (MRDLs) for:
chlorine
chloramines
chlorine dioxide
Other requirements were put in place to minimize the precursors, such as “enhanced coagulation.”
To determine if DBPs were exceeding safe levels, new MCLs were also set for the following DBPs:
chlorite (Chlorite is a byproduct of chlorine dioxide disinfection)
bromate (Bromate is a byproduct of ozone DBP)
HAA5
And, the existing MCL for TTHM was lowered from the previous TTHM rule
MCLs and MRDLs of the DBP Rule
Contaminant MCL MRDL
TTHMs 0.080 mg/L
HAA5 0.060 mg/L
chlorite 1.0 mg/L
bromate 0.010 mg/L
chlorine 4.0 mg/L*
chloramines 4.0 mg/L*
chlorine dioxide 0.8 mg/L
* Free, combined, or total
MCL – Maximum Contaminant Level: The maximum allowable level of a contaminant in drinking water.
2013 DBP Stage 2 Water Supplier Training Lesson 1: Introduction
1-5
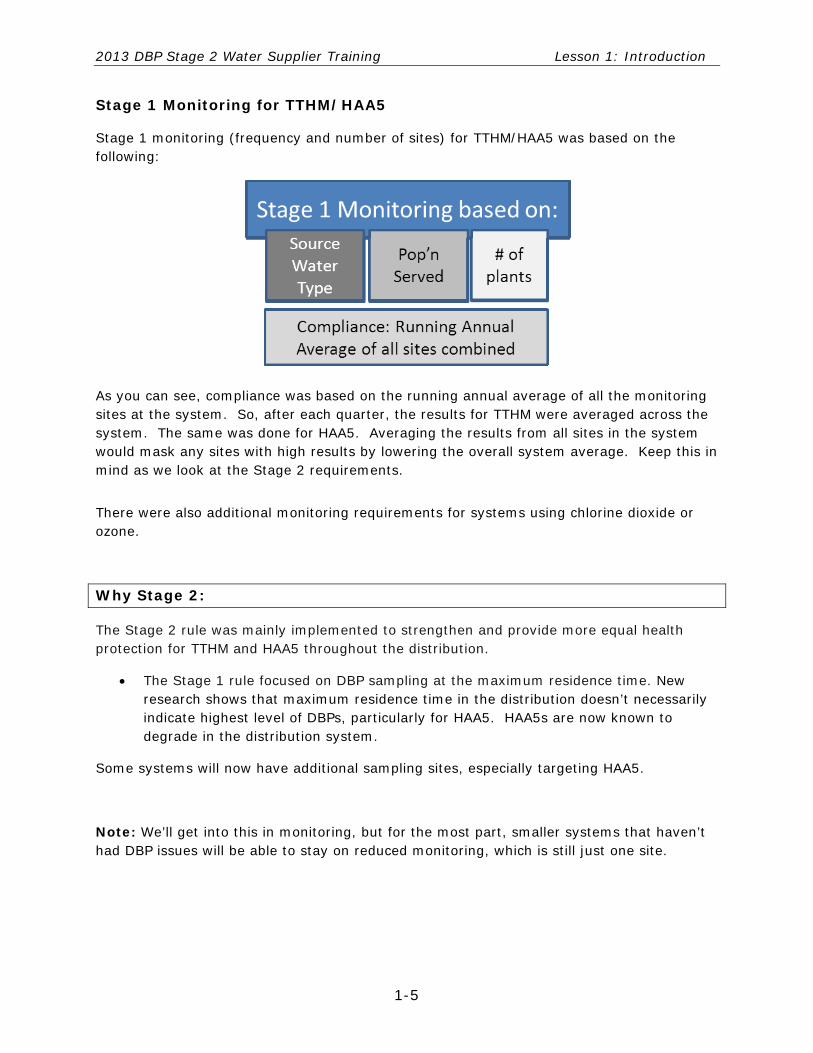
Stage 1 Monitoring for TTHM/HAA5
Stage 1 monitoring (frequency and number of sites) for TTHM/HAA5 was based on the following:
As you can see, compliance was based on the running annual average of all the monitoring sites at the system. So, after each quarter, the results for TTHM were averaged across the system. The same was done for HAA5. Averaging the results from all sites in the system would mask any sites with high results by lowering the overall system average. Keep this in mind as we look at the Stage 2 requirements.
There were also additional monitoring requirements for systems using chlorine dioxide or ozone.
Why Stage 2:
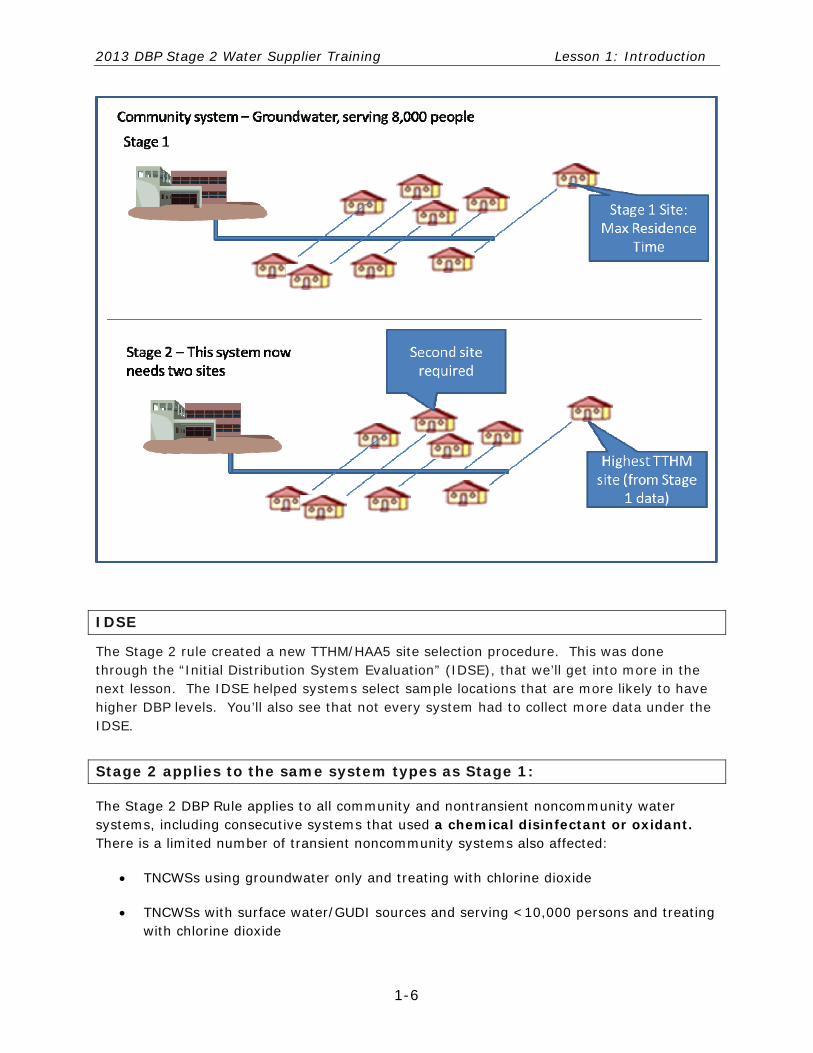
The Stage 2 rule was mainly implemented to strengthen and provide more equal health protection for TTHM and HAA5 throughout the distribution.
The Stage 1 rule focused on DBP sampling at the maximum residence time. New research shows that maximum residence time in the distribution doesn’t necessarily indicate highest level of DBPs, particularly for HAA5. HAA5s are now known to degrade in the distribution system.
Some systems will now have additional sampling sites, especially targeting HAA5.
Note: We’ll get into this in monitoring, but for the most part, smaller systems that haven’t had DBP issues will be able to stay on reduced monitoring, which is still just one site.
2013 DBP Stage 2 Water Supplier Training Lesson 1: Introduction
1-6
IDSE
The Stage 2 rule created a new TTHM/HAA5 site selection procedure. This was done through the “Initial Distribution System Evaluation” (IDSE), that we’ll get into more in the next lesson. The IDSE helped systems select sample locations that are more likely to have higher DBP levels. You’ll also see that not every system had to collect more data under the IDSE.
Stage 2 applies to the same system types as Stage 1:
The Stage 2 DBP Rule applies to all community and nontransient noncommunity water systems, including consecutive systems that used a chemical disinfectant or oxidant. There is a limited number of transient noncommunity systems also affected:
TNCWSs using groundwater only and treating with chlorine dioxide
TNCWSs with surface water/GUDI sources and serving <10,000 persons and treating with chlorine dioxide
2013 DBP Stage 2 Water Supplier Training Lesson 1: Introduction
1-7
In PA, Stage 2 DBP also applies to all BVRBs that use a chemical oxidant or disinfectant (including ozone).
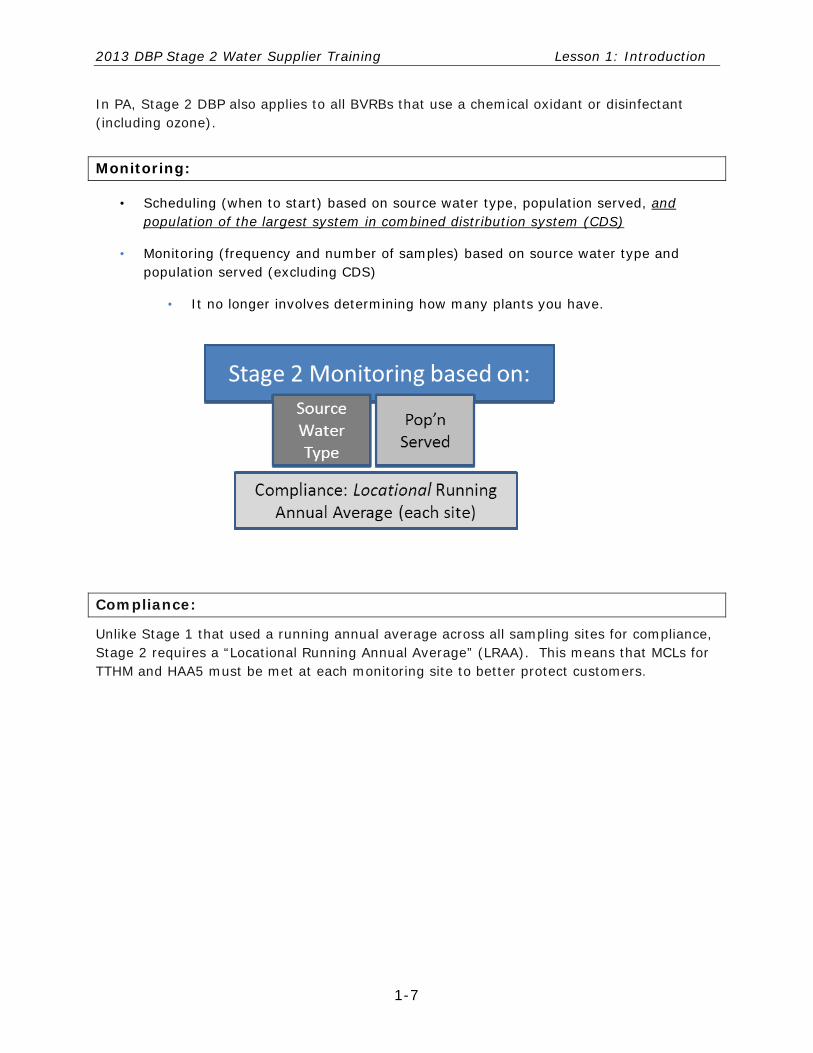
Monitoring:
• Scheduling (when to start) based on source water type, population served, and population of the largest system in combined distribution system (CDS)
• Monitoring (frequency and number of samples) based on source water type and population served (excluding CDS)
• It no longer involves determining how many plants you have.
Compliance:
Unlike Stage 1 that used a running annual average across all sampling sites for compliance, Stage 2 requires a “Locational Running Annual Average” (LRAA). This means that MCLs for TTHM and HAA5 must be met at each monitoring site to better protect customers.

2013 DBP Stage 2 Water Supplier Training Lesson 1: Introduction
1-8
2013 DBP Stage 2 Water Supplier Training Lesson 1: Introduction
1-9
OEL
The rule also adds something called “operational evaluation level” (OEL). This is a calculation that systems on quarterly monitoring will have to complete. This helps systems take actions if they are approaching a possible MCL violation. Lesson 5 in this course is dedicated to OEL.
Monitoring Plans for Stage 2
In the next lesson we are going to cover the IDSE and associated reports that had to be submitted that showed the system’s new sampling locations and schedule.
However, not every system had to collect additional data for the IDSE. Many systems in Pennsylvania received the Very Small System (VSS) Waiver or the 40/30 certification. These systems did not need to collect extra data, but they must submit monitoring plans for Stage 2 before compliance monitoring begins. The monitoring plans show their sampling locations and the schedule.
Other Stage 2 changes:
Minor changes to TOC monitoring (for surface water systems)
Minor changes to bromate monitoring
Agenda for the Course:
Lesson 1: Introduction
Lesson 2: IDSE
Lesson 3: Monitoring and Reporting
Lesson 4: Compliance and Enforcement
Lesson 5: OEL
Lesson 6: Monitoring Plans

2013 Stage 2 DBPR Water Supplier Training Lesson 2: IDSE Review
2 ‐ 1
Lesson 2 IDSE Review
Objectives
Provide some background on the purpose of, and who had to comply with, the IDSE.
Review the different options systems used to comply with IDSE requirements.
General Information
As part of the Stage 2 rule (what EPA calls early implementation), water systems had to conduct an Initial Distribution System Evaluation (IDSE). The IDSE is separate from the Stage 2 compliance requirements and was intended to:
o Identify areas of the distribution system that are or were likely to cause high levels of disinfection byproducts (DBPs)
o Determine the monitoring locations for Stage 2 compliance monitoring
ALL Community water systems and any NTNC water system serving > 10,000 people were required to conduct an IDSE. NTNC systems serving < 10,000 are exempted from IDSE requirements, but will still need to comply with Stage 2 DBPR compliance monitoring.
There are 4 options water systems could use to fulfill their IDSE:
Very Small System (VSS) Waiver
40/30 Certification
System Specific Study (SSS)
Standard Monitoring
The VSS Waiver and 40/30 Certification were considered a simplified IDSE because the PWS would not have to complete an evaluation. These options were available to systems that had small distribution systems or historically low DBP levels. Systems that follow these options will use Stage 1 DBP data to choose Stage 2 DBP sites.
VSS Waiver
Eligibility Requirements – All systems meeting the criteria were granted this waiver:
Serve fewer than 500 people
Have taken TTHM and HAA5 samples under Stage 1 DBPR
Eligibility not affected by Stage 1 sample results
2013 Stage 2 DBPR Water Supplier Training Lesson 2: IDSE Review
2 ‐ 2
Details
Waivers were effective immediately
No application necessary
VSS Waiver only for IDSE activities (systems still had to sample for Stage 1)
o Waived from additional monitoring beyond what was required for Stage 1 compliance
o IDSE Report was not required
Systems granted the VSS Waiver were/are required to continue Stage 1 compliance monitoring with Stage 1 DBPR until their applicable Stage 2 DBPR compliance monitoring begin date.
Systems granted a VSS Waiver will be required to complete and submit a Stage 2 compliance monitoring plan.
Systems not granted VSS Waiver were required to comply with IDSE through Standard Monitoring or System Specific Study (very few in PA).
40/30 Certification
Eligibility Requirements – based on Stage 1 DBPR samples taken during 8 consecutive calendar quarters no earlier than January 2004 for Schedule 1 and 2 systems and no earlier than January 2005 for Schedule 3 and 4 systems.
All required TTHM and HAA5 samples under Stage 1 were collected
No individual TTHM sample > 0.040 mg/L and no individual HAA5 sample > 0.030 mg/L
The system did not have any TTHM or HAA5 monitoring/reporting violations
Details
Systems had to submit certification form & supporting documentation
Certifications were approved by EPA or PADEP
Certifications not reviewed by EPA or PADEP within specified deadlines were considered “approved by default,” regardless of sample results or certification form completeness
40/30 Certification only for IDSE activities
o Waived from additional monitoring beyond what was required for Stage 1 compliance
o IDSE Report was not required
2013 Stage 2 DBPR Water Supplier Training Lesson 2: IDSE Review
2 ‐ 3
Systems granted the 40/30 Certification were/are required to continue Stage 1 compliance monitoring with Stage 1 DBPR until their applicable Stage 2 DBPR compliance monitoring begin date.
Systems granted the 40/30 Certification will be required to complete and submit a Stage 2 compliance monitoring plan.
The remaining 2 options for the IDSE, Standard Monitoring and the System Specific Study, did require a more in-depth evaluation that included additional monitoring beyond what was required for Stage 1 compliance.
System Specific Study (SSS)
Systems with detailed knowledge of the distribution system could choose to conduct a SSS by either:
Utilizing existing widespread historical data (must meet specific criteria).
Developing a hydraulic model that was a detailed, comprehensive, and well-calibrated model of the distribution system (very complicated).
Both required some sampling (in addition to Stage 1 compliance monitoring) to confirm the conclusions of the SSS. There were 24 systems that attempted the SSS (Schedule 1, 2 or 3 systems).
Systems choosing this option were required to develop and submit an IDSE Report.
Standard Monitoring
Details
Required by those systems not receiving VSS, 40/30 or choosing SSS and was intended to identify more appropriate sample sites for Stage 2 DBPR compliance monitoring.
Consisted of 1 year of monitoring (dual sampling) in addition to Stage 1 compliance monitoring (sites had to be separate from Stage 1 sites).
Plan Requirements
Determine their “peak historical month” (i.e. the month with highest TTHM, highest HAA5 or warmest water temperature) in order to determine in which months sampling for SM was required. All systems had to sample during this month.
Select monitoring sites based on: high TTHM or HAA5 levels, average residence time, and locations near entry points.
2013 Stage 2 DBPR Water Supplier Training Lesson 2: IDSE Review
2 ‐ 4
Submit a monitoring plan to EPA or the state (to explain what the system was planning to do).
Plan Approval
Plans were approved by EPA or PADEP
o Schedule 1 - 3 systems reviewed/approved by EPA
o Schedule 4 systems reviewed/approved by PADEP
Plans not reviewed by EPA or PADEP within specified deadlines were considered “approved by default.”
Monitoring Requirements
Sample in accordance with the approved plan during a specific 12-month period.
The monitoring frequency was every other month, quarterly or annually. The frequency and number of monitoring locations depended on the system size (population) and source water type.
Monitoring Results and Final Report
Results used to determine the Stage 2 DBPR compliance monitoring locations. Selecting compliance sites is based on a specific protocol using high TTHM, high HAA5 and existing Stage 1 sites.
IDSE Report developed based on the information collected during the 1 year of standard monitoring. (This report explained what the system actually did and where the compliance sites will be.) The report included:
o Analytical results
o LRAAs
o Recommended Stage 2 DBPR compliance monitoring locations
o Sampling schedule
DEP was/is responsible for reviewing the IDSE Reports for all systems (Schedules 1-4).
IDSE Reports not reviewed within specified deadlines were considered “approved by default.”
Key Points
CWS and NTNC water systems serving > 10,000 that were in PADWIS as an active, regulated PWS at the time the (federal) Stage 2 DBPR was finalized had to conduct an Initial Distribution System Evaluation (IDSE).
The IDSE is separate from the Stage 2 compliance requirements and was meant to identify areas of the distribution system that are or were likely to cause high levels of
2013 Stage 2 DBPR Water Supplier Training Lesson 2: IDSE Review
2 ‐ 5
disinfection byproducts (DBPs) to determine the Stage 2 compliance monitoring locations.
There are 4 options water systems could use to fulfill their IDSE: VSS Waiver, 40/30 Certification, SSS, or Standard Monitoring.
The 40/30 and VSS Waiver systems need to submit monitoring plans, which we will discuss today.
The SSS and SM required systems to conduct monitoring that was in addition to the monitoring that was required for Stage 1 compliance.
If a system submits an IDSE report that contains all the content elements required for BOTH the Report AND the compliance monitoring plan, they will not have to submit a separate compliance monitoring plan.

2013 Stage 2 DBPR Water Supplier Training Lesson 3: M/R Requirements
3 ‐ 1
Lesson 3 Monitoring and Reporting Requirements
Objectives
Explain the TTHM / HAA5 monitoring & reporting requirements for the various PWS categories
Discuss the criteria to qualify for (and remain on) reduced monitoring
Explain increased monitoring
Work through a few scenarios
Introduction – Focus of M&R for this Course
There are three types of monitoring that we will focus on today:
Routine Reduced Increased
We’ll be focusing primarily on the monitoring requirements for two types of DBPs today: TTHMs & HAA5s. There are a couple of changes to some other parameters that we’ll review in a later chapter.
Regardless of what was done (or not done) for the IDSE, all community water systems, nontransient noncommunity and Bottled, Vended, Retail or Bulk (BVRB) systems using a chemical disinfectant or oxidant will be required to monitor TTHMs & HAA5s under the Stage 2 DBPR.
System Type
The monitoring requirements (where & when sampling is required) are based only on two things:
o Systems source water type
o Population served
We’ll focus our attention on some of the nuances of system type first.
Groundwater source
Surface water source
Combination of groundwater and surface water
Any system using any amount of water from a Surface Water or GUDI source follows the surface water requirements for Stage 2. There is no longer
any exception for portions of a system that use only groundwater and are
2013 Stage 2 DBPR Water Supplier Training Lesson 3: M/R Requirements
3 ‐ 2
hydraulically/physically separate because treatment plants no longer factor into determining monitoring requirements (as they did in Stage 1).
Another consideration when determining “System Type”: Combined Distribution System (CDS)
A Combined Distribution System (CDS) consists of all systems that provide water (wholesaler) and the systems that receive finished water (purchaser). What it really means is that anyone buying any amount of finished water from anyone else is part of a large group of systems.
If there is a surface water source within the combined system, the purchasing system must follow the surface water “system type” monitoring requirements. Otherwise, the purchasing system follows the groundwater system type requirements.
Routine Monitoring
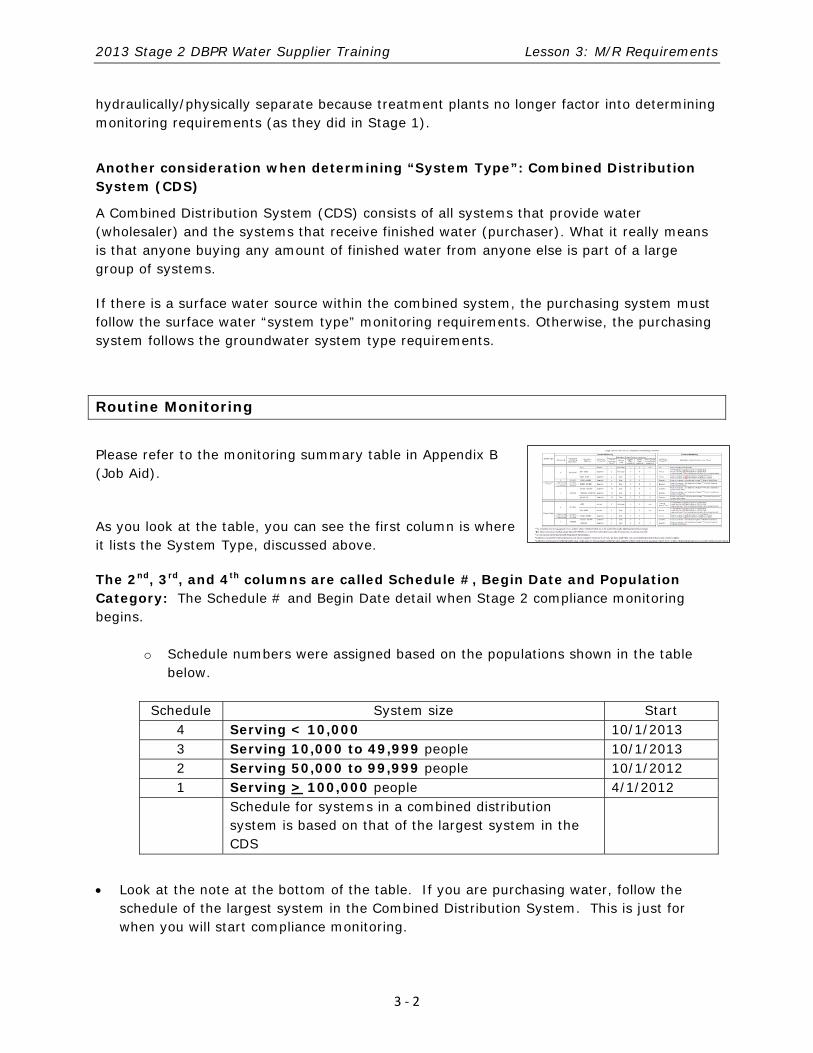
Please refer to the monitoring summary table in Appendix B (Job Aid).
As you look at the table, you can see the first column is where it lists the System Type, discussed above.
The 2nd, 3rd, and 4th columns are called Schedule #, Begin Date and Population Category: The Schedule # and Begin Date detail when Stage 2 compliance monitoring begins.
o Schedule numbers were assigned based on the populations shown in the table below.
Schedule System size Start
4 Serving < 10,000 10/1/2013 3 Serving 10,000 to 49,999 people 10/1/2013 2 Serving 50,000 to 99,999 people 10/1/2012 1 Serving > 100,000 people 4/1/2012 Schedule for systems in a combined distribution
system is based on that of the largest system in the CDS
Look at the note at the bottom of the table. If you are purchasing water, follow the schedule of the largest system in the Combined Distribution System. This is just for when you will start compliance monitoring.
2013 Stage 2 DBPR Water Supplier Training Lesson 3: M/R Requirements
3 ‐ 3
In the job aid, note under footnote #2 that Schedule 4 SW/GUDI systems conducting Crypto monitoring under LT2 have a delayed Stage 2 begin date (Oct 2014, not 2013). This is to allow these systems time to make any treatment changes necessary for both rules at the same time to address potential simultaneous compliance problems.
Population versus Schedule #:
You’ll notice that the Schedule # is split for one of the population categories under both SW/GUDI and GW systems.
Here is what you need to remember:
o Follow the Schedule # for your compliance start date ONLY
o Follow your population size for all other monitoring requirements in the table.
o The schedule was just how EPA chose to start systems in Stage 2.
Operator Tip: Combined Distribution Systems (consecutive systems)
How to determine monitoring requirements for a purchasing system: To start monitoring, follow the schedule of the largest system in the combined
distribution system If there is a surface water source within the combined system, the purchasing
system must follow the surface water “system type” monitoring requirements, however…
o The purchasing system follows the monitoring requirements for its own population size.
Monitoring Frequency
The routine monitoring is required either quarterly or annually. Systems must sample during the month of highest DBP concentration based on past results. You’ll learn more about this in the monitoring plan chapter. The Total per Monitoring Period details how many different sampling locations are required for routine monitoring. You can see that 2 samples are required for the smaller size systems, but there are exceptions.
2013 Stage 2 DBPR Water Supplier Training Lesson 3: M/R Requirements
3 ‐ 4
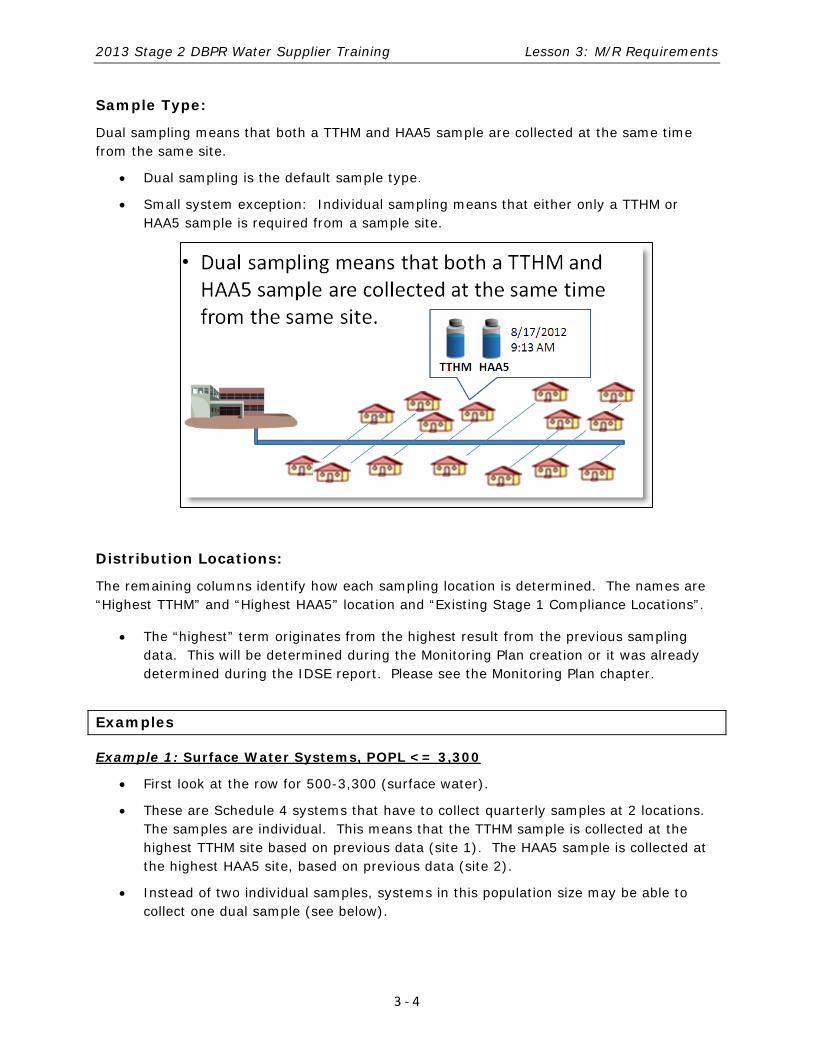
Sample Type:
Dual sampling means that both a TTHM and HAA5 sample are collected at the same time from the same site.
Dual sampling is the default sample type.
Small system exception: Individual sampling means that either only a TTHM or HAA5 sample is required from a sample site.
Distribution Locations:
The remaining columns identify how each sampling location is determined. The names are “Highest TTHM” and “Highest HAA5” location and “Existing Stage 1 Compliance Locations”.
The “highest” term originates from the highest result from the previous sampling data. This will be determined during the Monitoring Plan creation or it was already determined during the IDSE report. Please see the Monitoring Plan chapter.
Examples
Example 1: Surface Water Systems, POPL <= 3,300
First look at the row for 500-3,300 (surface water).
These are Schedule 4 systems that have to collect quarterly samples at 2 locations. The samples are individual. This means that the TTHM sample is collected at the highest TTHM site based on previous data (site 1). The HAA5 sample is collected at the highest HAA5 site, based on previous data (site 2).
Instead of two individual samples, systems in this population size may be able to collect one dual sample (see below).
2013 Stage 2 DBPR Water Supplier Training Lesson 3: M/R Requirements
3 ‐ 5
Systems serving < 500 monitor annually
Example 2: Groundwater, POPL 500 – 9,999 (Second Row in Schedule 4)
The monitoring requirements for a groundwater system are similar to those for surface water/GUDI systems.
This is a Schedule 4 system that has to conduct annual sampling at 2 different locations. Dual samples must be collected from each location.
Example 3: Groundwater, POPL < 500
As you can see in the job aid table, this size system has to collect samples from 2 locations annually.
The system may be able to collect one dual sample.
Routine Monitoring – The Individual Sample Exceptions
For groundwater systems up to 500 and Surface Systems up to and including 3,300 served:
o IF the highest TTHM and highest HAA5 sites are the same location AND the highest TTHM and highest HAA5 concentrations occur in the same month, only 1 dual sample is required. This would be determined by looking at the system’s Stage 1 compliance data and any other relevant results they may have.
If the highest sites are the same location, but occur during different months, individual samples are still required (1 in each applicable month).
For Example: A small system may have Stage 1 results from two different locations. However, the results show that both TTHM and HAA5 are the highest at the same location during August. Normally, under Stage 2, this system would be required to take a sample for TTHM at the historical high TTHM location and a sample for HAA5 at the historical high HAA5 location. But, these two are the same location! So, only one “dual” sample for TTHM and HAA5 is required at this one location.
For many small systems, they may only have Stage 1 data from one compliance location (maximum residence). For these systems, a dual sample from the maximum resident location will meet the Stage 2 monitoring requirements.
2013 Stage 2 DBPR Water Supplier Training Lesson 3: M/R Requirements
3 ‐ 6
Monitoring for New Systems
For the purpose of the Stage 2 DBPR, a ‘new’ system is one that, on or after January 1, 2006, was either:
…reactivated or added to PADWIS as a CWS or NTNC system with disinfection treatment other than UV Light, or
…changed to a CWS or NTNC with disinfection treatment other than UV Light.
There are 2 categories of ‘new’ systems based on when they are identified as a ‘new’ system.
‘New’ systems identified prior to April 1, 2012 were/will be:
o Required to develop a Stage 1 DBPR compliance monitoring plan and begin Stage 1 compliance monitoring;
o Assigned the appropriate Stage 2 Schedule #;
o Required to develop and submit a Stage 2 compliance monitoring plan and begin Stage 2 compliance monitoring when appropriate.
EXAMPLE: An unpermitted MHP is discovered in May 2009 and added to PADWIS as a new CWS. The system was not included in any of the IDSE requirements (VSS, 40/30, etc.), but they had to develop a Stage 1 monitoring plan and begin Stage 1 monitoring in the Jul-Sept 2009 quarter. They are identified as a Schedule 4 system so they will have to also develop a Stage 2 monitoring plan and begin Stage 2 monitoring in Oct 2013. (If this had been a consecutive CWS, they would have been assigned the same Schedule # and begin date as all other systems in the CDS.)
‘New’ systems identified on or after April 1, 2012 are/will be required:
o To develop and submit a Stage 2 compliance monitoring plan;
o Begin Stage 2 compliance monitoring as appropriate.
The Stage 2 compliance schedule date is the first day of the quarter following the date the PWS qualifies as a ‘new’ system under the Stage 2 DBPR.
All systems must begin with routine monitoring.
EXAMPLE: A small NTNC system without any treatment has to install 4-log disinfection in Feb 2013. The system is now a ‘new’ system under the Stage 2 rule. So, they will have to develop and submit a Stage 2 monitoring plan and begin Stage 2 monitoring. Their Stage 2 begin date is April 1, 2013 (even if they are on an annual frequency for routine monitoring).
2013 Stage 2 DBPR Water Supplier Training Lesson 3: M/R Requirements
3 ‐ 7
Exercise:
Please answer the questions below using the Summary Table Job Aid.
Routine Monitoring Exercise 1
Scenario System:
Community Water System: Groundwater source Population: 429
What is the Stage 2 compliance monitoring begin date? ______________
What is the routine monitoring frequency? ______________
How many TTHM/HAA5 distribution locations are required? __________
For each location, are dual or individual samples collected? ___________
If the highest TTHM and highest HAA5 are the same location (and month), can one dual sample be collected instead? _________
Routine Monitoring Exercise 2 Scenario System:
Community Water System: Surface Water Source and Groundwater Sources Population served: 8,932
What is the Stage 2 compliance monitoring begin date? __________
What is the routine monitoring frequency? ____________
How many TTHM/HAA5 distribution locations are required? ______
For each location, are dual or individual samples collected? _______
2013 Stage 2 DBPR Water Supplier Training Lesson 3: M/R Requirements
3 ‐ 8
Reduced Monitoring
The most obvious criteria to qualify for reduced monitoring is to have low TTHM and HAA5 levels, but it is not that simple. The requirements are based on whether the routine frequency is quarterly or annual and SW/GUDI systems have an additional requirement. All of the following criteria are listed on back of the job aid monitoring summary! Criteria to Qualify for Reduced Monitoring
For systems on a quarterly routine frequency: after 4 consecutive quarters, the TTHM/HAA5 levels for each location running annual average (LRAA) must be < ½ each MCL (< 0.040 mg/L and < 0.030 mg/L respectively).
For systems on an annual frequency: after 4 consecutive quarters, each SAMPLE RESULT must be < ½ each MCL (< 0.040 mg/L and < 0.030 mg/L respectively).
NOTE: EACH monitoring location must qualify or the reduced frequency is not granted (i.e. the monitoring frequency is system level, so all locations qualify or none do).
Systems with SW/GUDI sources must also demonstrate that the source water TOC RAA for each plant treating SW/GUDI sources is < 4.0 mg/L.
o Source water TOC is required monthly for at least 12 consecutive months (& must continue as long as the system is on the routine TTHM/HAA5 frequency).
o Systems with conventional filtration may use same monitoring results as those used for compliance with the enhanced coagulation treatment technique.
Criteria to Remain on Reduced Monitoring
For systems on a quarterly frequency, each LRAA must continue to be < ½ each MCL (< 0.040 mg/L and < 0.030 mg/L respectively).
For systems on an annual or triennial frequency, each SAMPLE RESULT must be < ¾ each MCL (< 0.060 mg/L and < 0.045 mg/L respectively).
Systems with SW/GUDI sources must continue to demonstrate that the source water TOC RAA for each plant treating SW/GUDI sources is < 4.0 mg/L.
2013 Stage 2 DBPR Water Supplier Training Lesson 3: M/R Requirements
3 ‐ 9
Staying on Reduced from Stage 1 to Stage 2
A PWS on reduced TTHM/HAA5 monitoring under the Stage 1 DBP rule may remain on a reduced monitoring frequency under the Stage 2 DBP rule after their Stage 2 compliance monitoring begin date if all of the following criteria are met:
o Qualifies for a 40/30 Certification or has a VSS waiver
o Meets the Stage 2 reduced monitoring criteria – This is the criteria to GET to reduced monitoring (not the Stage 2 criteria to stay on reduced monitoring).
o Does not change or add monitoring locations from those used for Stage 1
o Reduced monitoring under Stage 2 may not be exactly the same as it was under Stage 1. The frequency or # of samples may be different, but the frequency status is still reduced. (Example: GW, popl 500-9,999: Stage 1 reduced frequency was triennial, Stage 2 reduced frequency is annual).
Reduced Monitoring Sampling – Job Aid Right Side
For larger systems, the number of sampling locations is reduced, but you may stay on the same frequency.
NOTE: Reduced monitoring is not an option for the Surface Water/GUDI systems serving < 500.
Example: Groundwater, POPL 500 – 9,999
For routine monitoring, these systems are required to collect dual samples at 2 locations annually. However, for reduced monitoring, the locations and the frequency are the same (2 sites, annually), but the sampling type goes from dual to individual.
The same exception also applies here: only 1 dual sample is required annually if the highest TTHM and highest HAA5 values occur at the same location and during the same month.
Example: Groundwater, POPL < 500
The only difference between routine and reduced monitoring for these systems is the frequency. Annual is reduced to triennial. Individual samples are required from 2 locations once every 3 years.
As shown in the job aid, sampling for triennial occurs every 3rd year.
o To make it easier for DEP and water suppliers to track when monitoring is due, and to not overload the labs with many systems monitoring in the same year, triennial TTHM/HAA5 will line up with your VOC monitoring.
2013 Stage 2 DBPR Water Supplier Training Lesson 3: M/R Requirements
3 ‐ 10
Systems serving 101-500 will monitor in the peak month of “VOC Year 2”, which is 2015 (then 2018, 2021, etc).
Systems serving < 100 will monitor in the peak month of “VOC Year 3”, which is 2016 (then 2019, 2022, etc).
The DEP monitoring calendar will show your schedule. Remember, this is only for groundwater systems serving <500 on reduced monitoring.
NOTES: 1. DEP (PADWIS) will identify the specific locations required for reduced monitoring.
Systems will have to refer to the DEP website/monitoring calendars to ensure sampling is conducted at the correct sites.
2. The highest TTHM & HAAA5 sites are determined each time a system on routine monitoring qualifies for reduced monitoring, so the monitoring locations may be different than they were the last time the system was on reduced monitoring.
Revocation of reduced monitoring
A system that no longer meets the criteria to remain on reduced monitoring must resume routine monitoring the next calendar quarter, unless increased monitoring is required.
o Systems must then stay on routine monitoring for at least a year to re-qualify for reduced monitoring.
DEP has the authority, on a case-by-case basis, to require a system to resume routine monitoring even if they have not exceeded any of the trigger levels.
Group Question
Let’s say we have a system currently sampling on a quarterly basis under routine monitoring. The system source is surface water and it serves 6,000 people. How does the system get to reduced monitoring?
Answer: __________________________________________________________________ What is reduced monitoring this system? Answer: __________________________________________________________________
2013 Stage 2 DBPR Water Supplier Training Lesson 3: M/R Requirements
3 ‐ 11
Increased Monitoring
Increased monitoring only applies to systems that are on annual or triennial monitoring and is triggered whenever any result exceeds either the TTHM or HAA5 MCL. Increased monitoring begins the quarter immediately following the quarter in which the exceedance occurs.
Increased monitoring consists of collecting quarterly, dual samples at ALL compliance locations for at least 4 consecutive quarters until the TTHM LRAA is < 0.060 mg/L and the HAA5 LRAA is < 0.045 mg/L at each compliance location.
This is done until the TTHM LRAA is < 0.060 mg/L and the HAA5 LRAA is < 0.045 mg/L at each compliance location (this is ¾ of the MCL)
Once the LRAAs show levels less than or equal to ¾ of the MCL, the system may resume routine monitoring.
Reporting Requirements
These are the key things you need to know about reporting TTHM/HAA5 results under the Stage 2 DBPR.
NOTE: These requirements only apply to systems conducting Stage 2 DBPR compliance monitoring. Systems monitoring under the Stage 1 DBPR must continue to report results that include the appropriate number of maximum residence samples (type ‘M’).
Samples must be analyzed by a lab accredited for TTHM/HAA5 analyses. Results are to be reported by the lab that does the analyses (unless there is a written agreement that another party is responsible for reporting to DEP).
All TTHM/HAA5 results are reported as D samples. We will accept either D or M samples for now (at least until the compliance program is completed).
All results must be identified by a valid 3-digit location ID that starts with ‘7’ (700, 701, 799, etc.).
Results should be reported by the 10th of the month following: either the month in which the result is determined (i.e. the analysis date) or end of the quarter in which the sample is collected, whichever is sooner.
2013 Stage 2 DBPR Water Supplier Training Lesson 3: M/R Requirements
3 ‐ 12
TTHM/HAA5 Scenarios
Exercise: If you represent a surface water system, please complete Scenarios 1 and 3. Groundwater system representatives, please complete Scenarios 2 and 3.
If you represent a surface water system, please complete Scenarios 1 and 3.
Groundwater system representatives, please complete Scenarios 2 and 3.
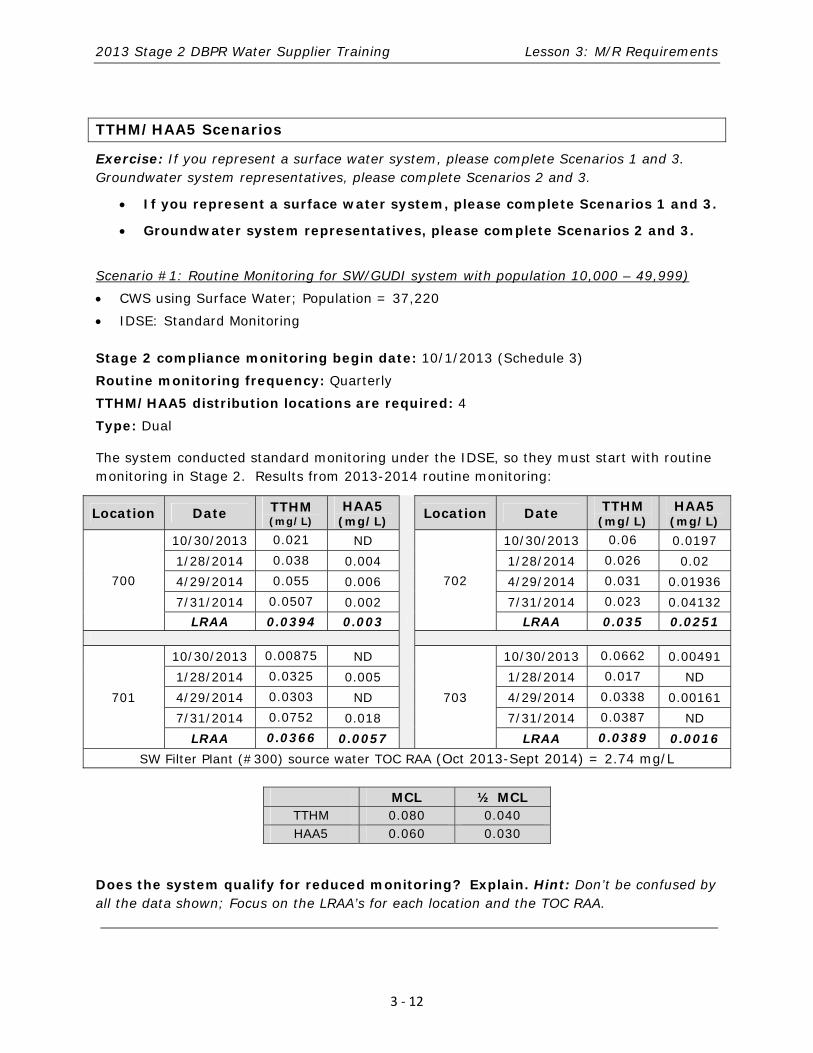
Scenario #1: Routine Monitoring for SW/GUDI system with population 10,000 – 49,999)
CWS using Surface Water; Population = 37,220
IDSE: Standard Monitoring Stage 2 compliance monitoring begin date: 10/1/2013 (Schedule 3)
Routine monitoring frequency: Quarterly
TTHM/HAA5 distribution locations are required: 4
Type: Dual
The system conducted standard monitoring under the IDSE, so they must start with routine monitoring in Stage 2. Results from 2013-2014 routine monitoring:
Location Date TTHM (mg/L)
HAA5 (mg/L)
Location Date TTHM (mg/L)
HAA5 (mg/L)
700
10/30/2013 0.021 ND
702
10/30/2013 0.06 0.0197
1/28/2014 0.038 0.004 1/28/2014 0.026 0.02
4/29/2014 0.055 0.006 4/29/2014 0.031 0.01936
7/31/2014 0.0507 0.002 7/31/2014 0.023 0.04132
LRAA 0.0394 0.003 LRAA 0.035 0.0251
701
10/30/2013 0.00875 ND
703
10/30/2013 0.0662 0.00491
1/28/2014 0.0325 0.005 1/28/2014 0.017 ND
4/29/2014 0.0303 ND 4/29/2014 0.0338 0.00161
7/31/2014 0.0752 0.018 7/31/2014 0.0387 ND
LRAA 0.0366 0.0057 LRAA 0.0389 0.0016
SW Filter Plant (#300) source water TOC RAA (Oct 2013-Sept 2014) = 2.74 mg/L
MCL ½ MCL TTHM 0.080 0.040 HAA5 0.060 0.030
Does the system qualify for reduced monitoring? Explain. Hint: Don’t be confused by all the data shown; Focus on the LRAA’s for each location and the TOC RAA.
2013 Stage 2 DBPR Water Supplier Training Lesson 3: M/R Requirements
3 ‐ 13
Assuming the system achieved reduced monitoring, what are their monitoring
requirements?
Which locations must be sampled for reduced monitoring?
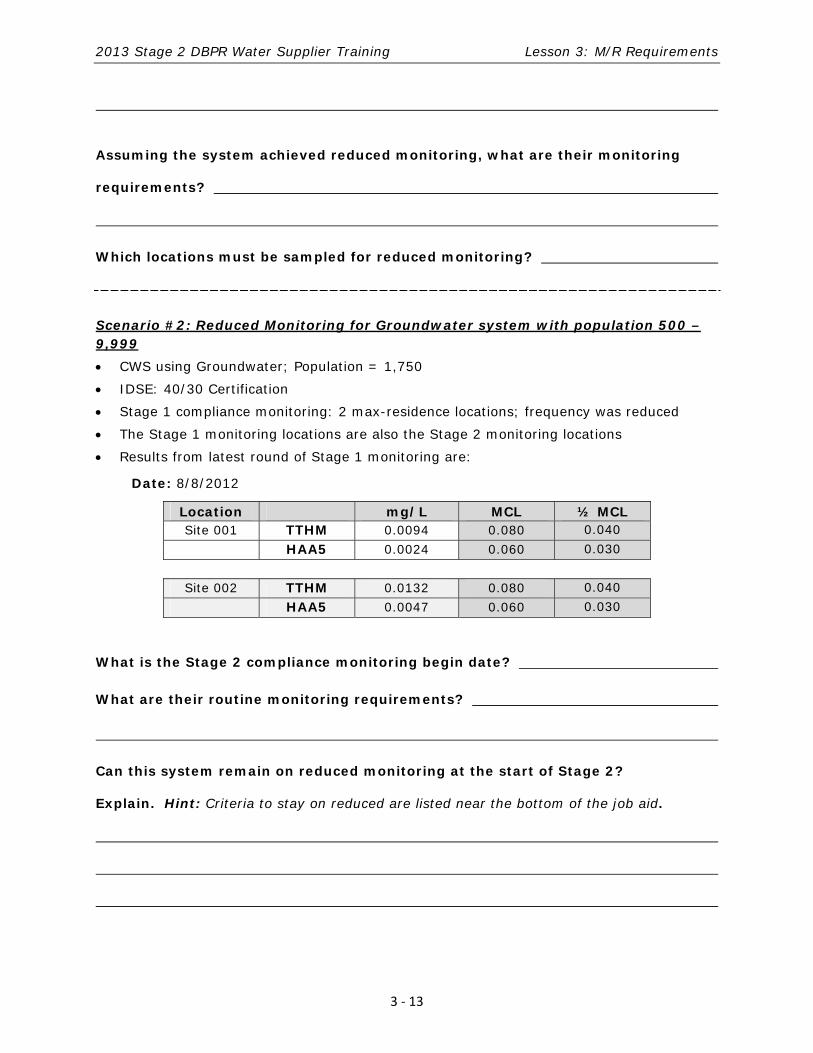
Scenario #2: Reduced Monitoring for Groundwater system with population 500 – 9,999
CWS using Groundwater; Population = 1,750
IDSE: 40/30 Certification
Stage 1 compliance monitoring: 2 max-residence locations; frequency was reduced
The Stage 1 monitoring locations are also the Stage 2 monitoring locations
Results from latest round of Stage 1 monitoring are:
Date: 8/8/2012
Location mg/L MCL ½ MCL Site 001 TTHM 0.0094 0.080 0.040
HAA5 0.0024 0.060 0.030
Site 002 TTHM 0.0132 0.080 0.040
HAA5 0.0047 0.060 0.030
What is the Stage 2 compliance monitoring begin date? What are their routine monitoring requirements?
Can this system remain on reduced monitoring at the start of Stage 2?
Explain. Hint: Criteria to stay on reduced are listed near the bottom of the job aid.
2013 Stage 2 DBPR Water Supplier Training Lesson 3: M/R Requirements
3 ‐ 14
What are their reduced monitoring requirements?
How & when should the results be reported?
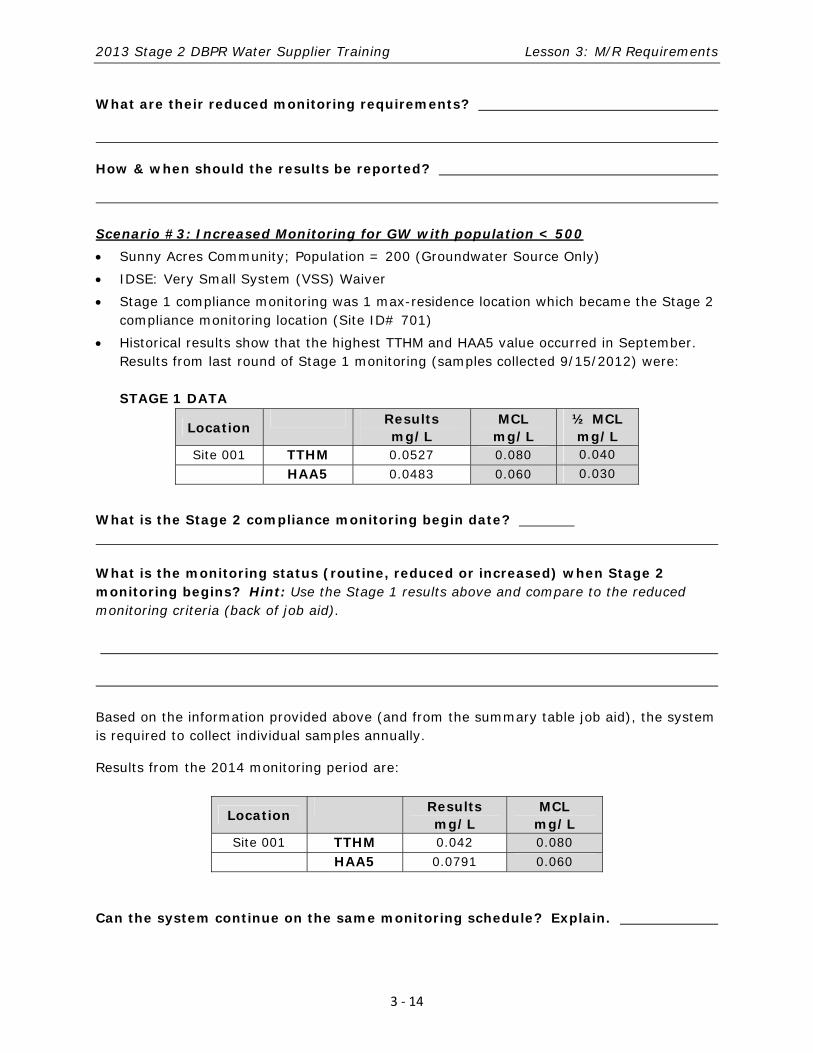
Scenario #3: Increased Monitoring for GW with population < 500
Sunny Acres Community; Population = 200 (Groundwater Source Only)
IDSE: Very Small System (VSS) Waiver
Stage 1 compliance monitoring was 1 max-residence location which became the Stage 2 compliance monitoring location (Site ID# 701)
Historical results show that the highest TTHM and HAA5 value occurred in September. Results from last round of Stage 1 monitoring (samples collected 9/15/2012) were: STAGE 1 DATA
Location Results
mg/L MCL
mg/L ½ MCL mg/L
Site 001 TTHM 0.0527 0.080 0.040
HAA5 0.0483 0.060 0.030
What is the Stage 2 compliance monitoring begin date? What is the monitoring status (routine, reduced or increased) when Stage 2 monitoring begins? Hint: Use the Stage 1 results above and compare to the reduced monitoring criteria (back of job aid).
Based on the information provided above (and from the summary table job aid), the system is required to collect individual samples annually.
Results from the 2014 monitoring period are:
Location Results
mg/L MCL
mg/L Site 001 TTHM 0.042 0.080
HAA5 0.0791 0.060
Can the system continue on the same monitoring schedule? Explain.
2013 Stage 2 DBPR Water Supplier Training Lesson 3: M/R Requirements
3 ‐ 15
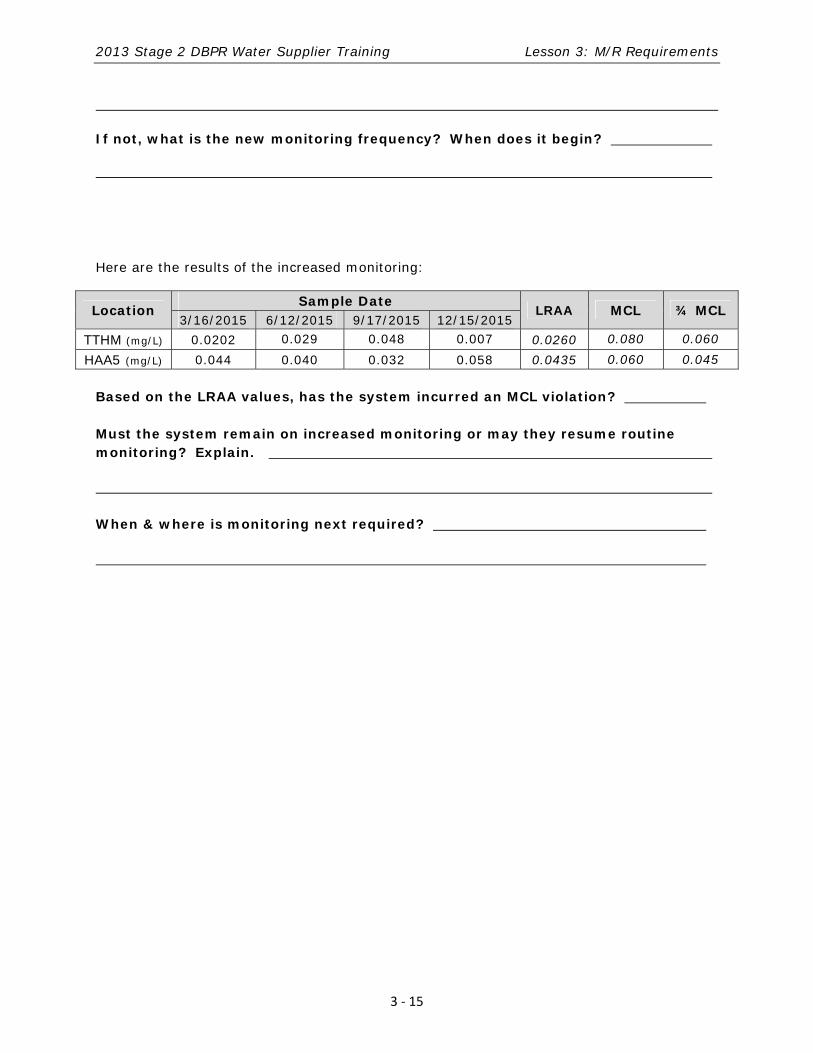
If not, what is the new monitoring frequency? When does it begin?
Here are the results of the increased monitoring:
Location Sample Date
LRAA MCL ¾ MCL 3/16/2015 6/12/2015 9/17/2015 12/15/2015
TTHM (mg/L) 0.0202 0.029 0.048 0.007 0.0260 0.080 0.060
HAA5 (mg/L) 0.044 0.040 0.032 0.058 0.0435 0.060 0.045 Based on the LRAA values, has the system incurred an MCL violation? Must the system remain on increased monitoring or may they resume routine monitoring? Explain.
When & where is monitoring next required?
2013 Stage 2 DBPR Water Supplier Training Lesson 3: M/R Requirements
3 ‐ 16
Key Points
The schedule # only determines when a system begins compliance monitoring, not the frequency or number of sampling locations.
The monitoring requirements (where & when sampling is required) are based only on each system’s source water type and population.
Blended systems that purchase any amount of water from a SW or GUDI source follow the requirements for a SW/GUDI system.
Routine monitoring is required either quarterly or annually, and all systems must sample during the month of highest DBP concentrations.
Dual samples means that both a TTHM and HAA5 sample are collected from each monitoring location. Individual samples mean that either a TTHM or HAA5 sample is collected at the monitoring location.
Reduced monitoring is system level, so all locations must meet the criteria or the system remains on routine monitoring. Systems must conduct routine monitoring for at least 1 year (4 consecutive quarters) before they can qualify for reduced monitoring.
A system on reduced TTHM/HAA5 monitoring under the Stage 1 DBPR may remain on a reduced monitoring frequency under the Stage 2 DBPR if certain criteria are met.
The criteria to qualify for reduced monitoring are different from the criteria to remain on reduced monitoring.
Increased monitoring only applies to systems that are on annual or triennial monitoring and is triggered whenever any result exceeds either the TTHM or HAA5 MCL.
2013 Stage 2 DBPR Water Supplier Training Lesson 3: M/R Requirements
3 ‐ 17
Additional Information:
TOC Monitoring
There are two components to TOC monitoring in the DBP Rule.
1. Systems with conventional filtration must monitor TOC under the enhanced coagulation treatment technique requirements.
2. All surface water/GUDI systems can optionally monitor for TOC to qualify for reduced TTHM/HAA5 monitoring
Enhanced Coagulation Treatment Technique:
Total Organic Carbon (TOC) is required for systems with SW or GUDI sources that use conventional filtration treatment as part of the Enhanced Coagulation Treatment Technique.
TOC Sampling:
A paired TOC sample, consisting of 1 untreated “raw” source water sample (sample type “R”) and 1 post-sedimentation sample (sample type “P”), collected at the same time on the same day, is required for each treatment plant using conventional filtration.
If multiple sources are treated at a single plant, the source water sample should be from a blended raw water tap (prior to any treatment) or a composite sample comprised of water in proportion to the percent of the influent each comprises.
The post-sedimentation sample location may be the top of the filters or the combined filter effluent. If a combined filter effluent sampling point is unavailable, samples may be collected from the clearwell or entry point upon approval by DEP.
Both the source water and post-sedimentation samples must be associated with the treatment plant, so the location identifier for both samples must be the treatment plant ID number (3-digit number beginning with “3”).
Reduced TOC Monitoring under Enhanced Coagulation TT
Monitoring may be reduced at a treatment plant to 1 paired sample collected each quarter (every 90 days) if the TOC post-sedimentation running annual average value is less than 2.0 mg/L for 2 consecutive years or less than 1.0 mg/L for 1 year. If the running annual average for post sedimentation TOC is 2.0 mg/L or more for any treatment plant, the system must resume routine monthly monitoring. All TOC samples must be analyzed by an accredited laboratory.
Alkalinity
Alkalinity monitoring is also required for systems with SW or GUDI sources that use conventional filtration treatment as part of the Enhanced Coagulation Treatment Technique in order to determine the percent of required TOC removal. Source water alkalinity samples
2013 Stage 2 DBPR Water Supplier Training Lesson 3: M/R Requirements
3 ‐ 18
(sample type “R”) are collected from each treatment plant with conventional filtration at the same time (either monthly or quarterly) and location as the source water TOC sample. Alkalinity measurements may be conducted by a certified operator using an approved method.
Optional TOC Monitoring to reduce TTHM/HAA5 Monitoring:
Systems serving > 500 customers with SW or GUDI source wishing to qualify for (and remain on) a reduced TTHM/HAA5 monitoring frequency are required to monitor TOC in the source water (sample type “R”).
The TOC concentration, based on a running annual average calculated quarterly (using results from the 4 most recent quarters), must be 4.0 mg/L or less at each treatment plant treating SW or GUDI sources (in addition to meeting the TTHM/HAA5 criteria for a reduced frequency).
Therefore, systems with SW or GUDI sources using direct, slow sand, diatomaceous earth, other, or no filtration may also choose to collect source water TOC samples.
If multiple sources are treated at a single plant, the source water sample should be from a blended raw water tap (prior to any treatment).
Monthly source water TOC monitoring (every 30 days) is required to qualify for the reduced TTHM/HAA5 frequency and quarterly source water TOC monitoring (every 90 days) is required once the reduced TTHM/HAA5 frequency has been granted.
NOTE: The required monitoring done by systems using conventional filtration also satisfies the monitoring needed for reduced TTHM/HAA5 monitoring.
Specific Ultraviolet Absorbance (SUVA) is optional for systems with SW or GUDI sources using conventional filtration treatment. These systems may use SUVA data to meet the TOC removal requirements of the Enhanced Coagulation Treatment Technique as an Alternative Compliance Criteria (ACC) if the source or treated water running annual average SUVA value is 2.0 L/mg-m or less. SUVA may also be used as a monthly ACC if the source (or treated) water SUVA value is 2.0 L/mg-m or less in that month. Samples to determine SUVA values consist of separate measurements of UV absorption at 254 nm (UV254) and dissolved organic carbon (DOC).
The SUVA monitoring frequency is the same as the paired TOC sampling (monthly every 30 days or quarterly every 90 days). Samples for source water SUVA are sample type “R” and samples for treated water SUVA are sample type “P”. These samples must be of water prior to the addition of any oxidant or disinfectant, so ‘treated’ water SUVA samples are collected as the result of a jar test. The UV254 and DOC samples must be collected at the same times from the same locations. All samples for the SUVA calculation must be analyzed by an accredited laboratory.
2013 Stage 2 DBPR Water Supplier Training Lesson 3: M/R Requirements
3 ‐ 19
NOTE: SUVA monitoring does not replace the TOC monitoring requirements of the Enhanced Coagulation Treatment Technique. SUVA monitoring is an option that is in addition to the TOC monitoring required for systems using conventional filtration.

2013 Stage 2 DBPR Water Supplier Training Lesson 4: Compliance
4‐1
Lesson 4 Compliance
What do we mean when we say compliance? We are looking at how well you are meeting the requirements of the regulation. Here is what you will learn in this lesson:
Objectives
Explain how compliance with the Maximum Contaminant Level (MCL) is determined
Discuss the different monitoring and reporting violations
Discuss the public notification and the Consumer Confidence Reports (CCR) requirements
MCL Compliance MCL compliance is system level. This means that all DBP monitoring locations must be in compliance with the MCLs or the system incurs a violation.
MCL compliance is based on running annual averages (actually the locational running average, which we’ll discuss in a minute).
A running annual average (RAA) is the average of the last 4 calendar quarters.
Many of you will be on annual or triennial sampling so you will not have quarterly data. If you remember from the last chapter, if you have an exceedance, you have to go to increased monitoring, which is quarterly.
Since compliance is based on the running annual average, an MCL exceedance in one quarter or an MCL exceedance in an annual sample is not a violation.
How is the running annual average calculated? At the end of 4 quarters, the RAA will be calculated like this:
Q1 + Q2 + Q3 + Q4 4
The following quarter, the RAA is:
Q2 + Q3 + Q4 + Q5 4
2013 Stage 2 DBPR Water Supplier Training Lesson 4: Compliance
4‐2
The DBP rule adds one more component to the running annual average. The RAA must be calculated at each DBP monitoring location. This is called the Locational Running Annual Average (LRAA).
Note for Systems on Annual or Triennial:
When calculating MCL compliance, the quarter with the exceedance becomes Q1 in the LRAA calculation.
If a system on annual or triennial monitoring has any result that is more than 4 times the MCL value, a violation occurs immediately.
Extra Samples:
MCL compliance for additional samples:
o For systems on a quarterly frequency, a quarterly average is determined for each location with multiple results; this quarterly average is then used in the LRAA calculation.
o For systems on an annual or triennial frequency, each individual result must meet the MCL (any exceedance causes the system to go to quarterly monitoring).
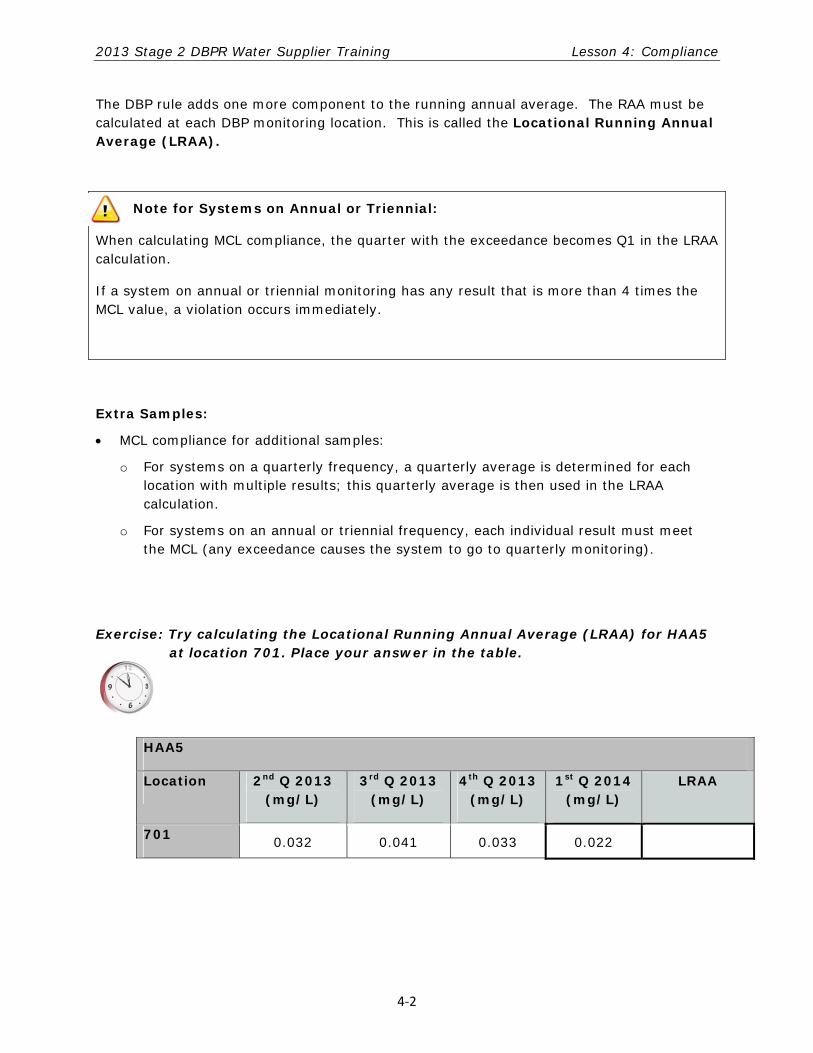
Exercise: Try calculating the Locational Running Annual Average (LRAA) for HAA5 at location 701. Place your answer in the table.
HAA5
Location 2nd Q 2013 (mg/L)
3rd Q 2013 (mg/L)
4th Q 2013 (mg/L)
1st Q 2014 (mg/L)
LRAA
701 0.032 0.041 0.033 0.022
2013 Stage 2 DBPR Water Supplier Training Lesson 4: Compliance
4‐3
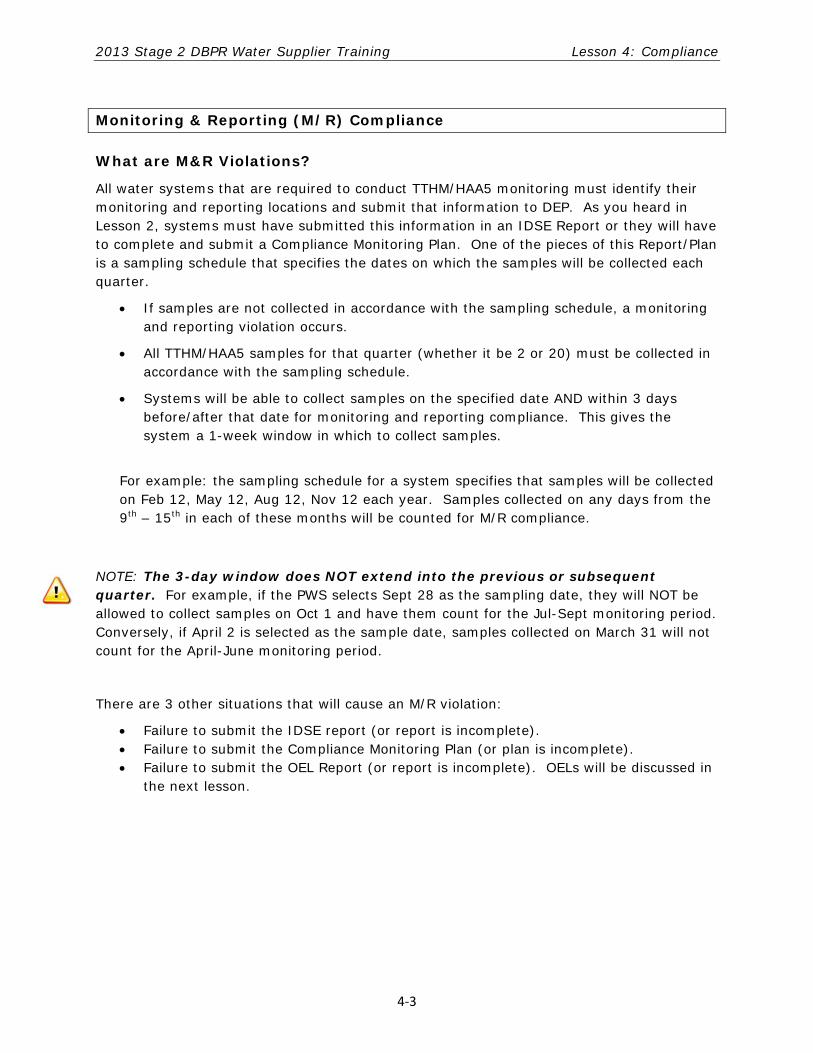
Monitoring & Reporting (M/R) Compliance What are M&R Violations?
All water systems that are required to conduct TTHM/HAA5 monitoring must identify their monitoring and reporting locations and submit that information to DEP. As you heard in Lesson 2, systems must have submitted this information in an IDSE Report or they will have to complete and submit a Compliance Monitoring Plan. One of the pieces of this Report/Plan is a sampling schedule that specifies the dates on which the samples will be collected each quarter.
If samples are not collected in accordance with the sampling schedule, a monitoring and reporting violation occurs.
All TTHM/HAA5 samples for that quarter (whether it be 2 or 20) must be collected in accordance with the sampling schedule.
Systems will be able to collect samples on the specified date AND within 3 days before/after that date for monitoring and reporting compliance. This gives the system a 1-week window in which to collect samples.
For example: the sampling schedule for a system specifies that samples will be collected on Feb 12, May 12, Aug 12, Nov 12 each year. Samples collected on any days from the 9th – 15th in each of these months will be counted for M/R compliance.
NOTE: The 3-day window does NOT extend into the previous or subsequent quarter. For example, if the PWS selects Sept 28 as the sampling date, they will NOT be allowed to collect samples on Oct 1 and have them count for the Jul-Sept monitoring period. Conversely, if April 2 is selected as the sample date, samples collected on March 31 will not count for the April-June monitoring period.
There are 3 other situations that will cause an M/R violation:
Failure to submit the IDSE report (or report is incomplete). Failure to submit the Compliance Monitoring Plan (or plan is incomplete). Failure to submit the OEL Report (or report is incomplete). OELs will be discussed in
the next lesson.
2013 Stage 2 DBPR Water Supplier Training Lesson 4: Compliance
4‐4
Violation Response & Resolution
Monitoring and Reporting Violations
If you failed to monitor or report, you will receive a “Compliance Notice” from DEP.
Here is what you will have to do:
Issue Public Notification
Collect the sample(s) you missed. If the next required compliance sample is due, you might not be asked to collect the sample you missed.
If results from any additional samples indicate a problem, DEP has the option to require you to conduct additional monitoring (revert to routine/increased frequency or conduct special sampling).
MCL Violations
If you incurred an MCL violation, you will receive a Notice of Violation from DEP.
Here is what you will need to do after an MCL violation:
Issue PN
Conduct routine/increased quarterly monitoring (dual sampling all compliance locations).
Of course, the system works to correct the problem as well. Let’s look at returning to compliance.
Return to Compliance
So, if you are incurring a violation, how do you return to “in compliance”? It depends...
To return to compliance, you may have entered a Compliance Order and Agreement (CO&A) with DEP. This establishes a schedule for you.
If there is no enforcement document/schedule, then the system returns to compliance when it no longer exceeds the MCL. This can be achieved by various treatment and non-treatment methods:
Quarterly monitoring indicates that the MCL is being met (minimum of 2 Qs).
Treatment has been installed and quarterly monitoring indicates that the MCL is being met (minimum of 1 Q).
Operational changes have been made and quarterly monitoring indicates that the MCL is being met (minimum of 1 Q)
2013 Stage 2 DBPR Water Supplier Training Lesson 4: Compliance
4‐5
If non-treatment methods are used to come into compliance (i.e., sources and/or EPs are taken off-line, sources are blended), permits may need to be amended to specify blending ratios and pumping rates, to ensure that sources and/or EPs are not returned to service without first installing treatment, or to indicate that sources have been abandoned.
Public Notice (PN) Requirements Tier 2 PN Requirements:
MCL violations are Tier 2 violations (requiring Tier 2 PN) because TTHMs/HAA5s are considered chronic contaminants.
Issue a notice (that meets all 10 content elements) within 30 days using appropriate delivery methods.
Submit to DEP a copy of the PN and the Certification of Delivery form within 10 days of the date PN was issued.
Repeat PN every 90 days for as long as the violation persists.
Repeat PN as often the same as the new PN that is required each quarter the system incurs a violation. It is rare that a system incurs a violation that is unresolved long enough to require repeat PN before the next quarter’s violation occurs.
Reminder: 1-hour reporting to DEP is required for any MCL exceedance, regardless of whether the exceedance causes a violation.
Tier 3 PN requirements
Monitoring and reporting violations are Tier 3 violations.
Issue a notice (that meets all 10 content elements) within 1 year using appropriate delivery methods.
Submit to DEP a copy of the PN and the Certification of Delivery form within 10 days of the date PN was issued.
Repeat PN every 12 months for as long as the violation persists.
Community water systems can use their annual Consumer Confidence Report (CCR) to issue PN, but remember:
The CCR must be delivered within the PN deadline
The CCR must contain all 10 content elements to qualify as public notification. A statement that monitoring was missed or the MCL was exceeded does not count as public notification. We suggest that systems create the public notification as a separate page and insert it into the CCR (i.e. use the CCR as the delivery mechanism, not as the public notice).
2013 Stage 2 DBPR Water Supplier Training Lesson 4: Compliance
4‐6
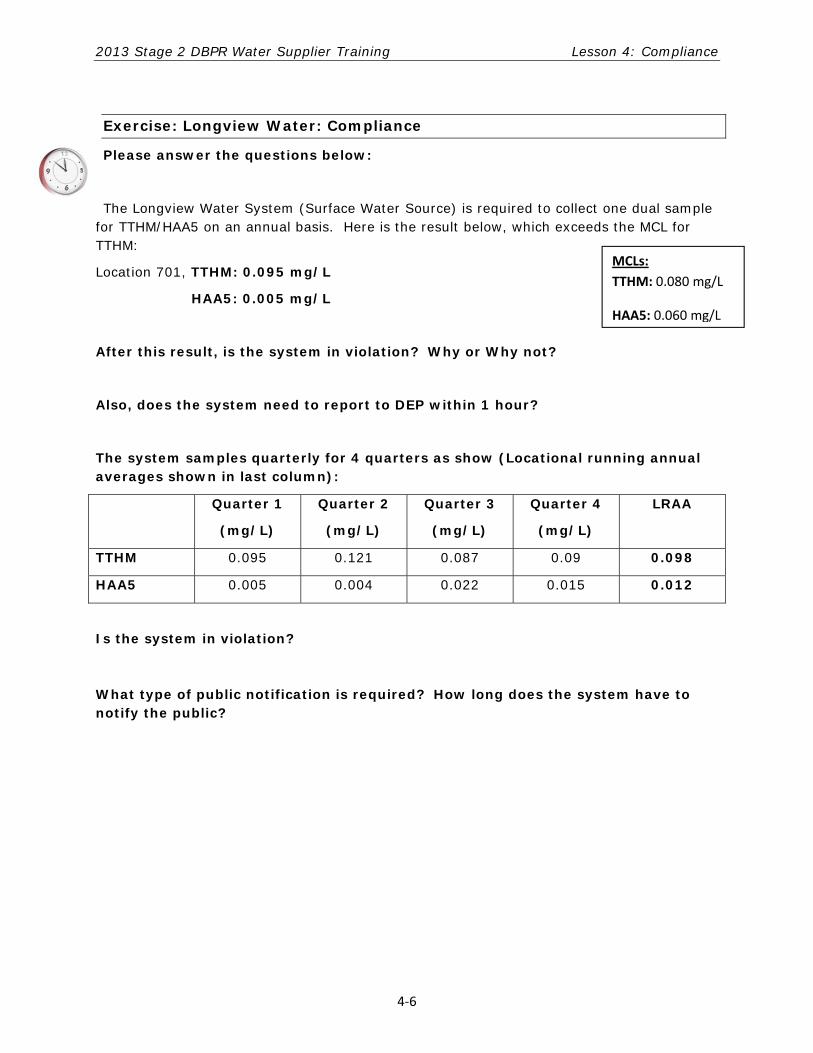
Exercise: Longview Water: Compliance
Please answer the questions below:
The Longview Water System (Surface Water Source) is required to collect one dual sample for TTHM/HAA5 on an annual basis. Here is the result below, which exceeds the MCL for TTHM:
Location 701, TTHM: 0.095 mg/L
HAA5: 0.005 mg/L
After this result, is the system in violation? Why or Why not?
Also, does the system need to report to DEP within 1 hour?
The system samples quarterly for 4 quarters as show (Locational running annual averages shown in last column):
Quarter 1
(mg/L)
Quarter 2
(mg/L)
Quarter 3
(mg/L)
Quarter 4
(mg/L)
LRAA
TTHM 0.095 0.121 0.087 0.09 0.098
HAA5 0.005 0.004 0.022 0.015 0.012
Is the system in violation? What type of public notification is required? How long does the system have to notify the public?
MCLs:
TTHM: 0.080 mg/L
HAA5: 0.060 mg/L
2013 Stage 2 DBPR Water Supplier Training Lesson 4: Compliance
4‐7
Consumer Confidence Report (CCR) Requirements
All violations and results of all detected contaminants must be reported in the CCR.
The basic CCR requirements have not changed, so we’ll only review how the TTHM/HAA5 results are reported in the detected contaminants table.
NOTE: Systems with multiple sampling locations may combine the results from all locations in the same table.
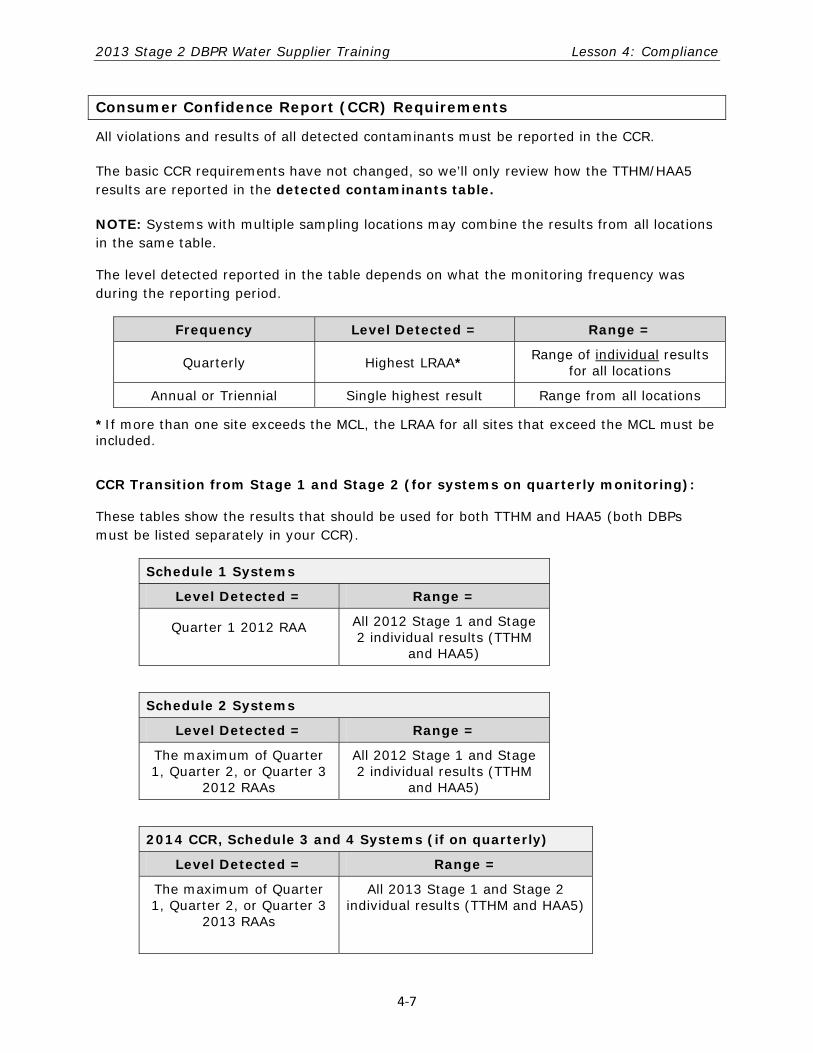
The level detected reported in the table depends on what the monitoring frequency was during the reporting period.
Frequency Level Detected = Range =
Quarterly Highest LRAA* Range of individual results
for all locations
Annual or Triennial Single highest result Range from all locations
*If more than one site exceeds the MCL, the LRAA for all sites that exceed the MCL must be included.
CCR Transition from Stage 1 and Stage 2 (for systems on quarterly monitoring):
These tables show the results that should be used for both TTHM and HAA5 (both DBPs must be listed separately in your CCR).
Schedule 1 Systems
Level Detected = Range =
Quarter 1 2012 RAA
All 2012 Stage 1 and Stage 2 individual results (TTHM
and HAA5)
Schedule 2 Systems
Level Detected = Range =
The maximum of Quarter 1, Quarter 2, or Quarter 3
2012 RAAs
All 2012 Stage 1 and Stage 2 individual results (TTHM
and HAA5)
2014 CCR, Schedule 3 and 4 Systems (if on quarterly)
Level Detected = Range =
The maximum of Quarter 1, Quarter 2, or Quarter 3
2013 RAAs
All 2013 Stage 1 and Stage 2 individual results (TTHM and HAA5)
2013 Stage 2 DBPR Water Supplier Training Lesson 4: Compliance
4‐8
Simultaneous Compliance
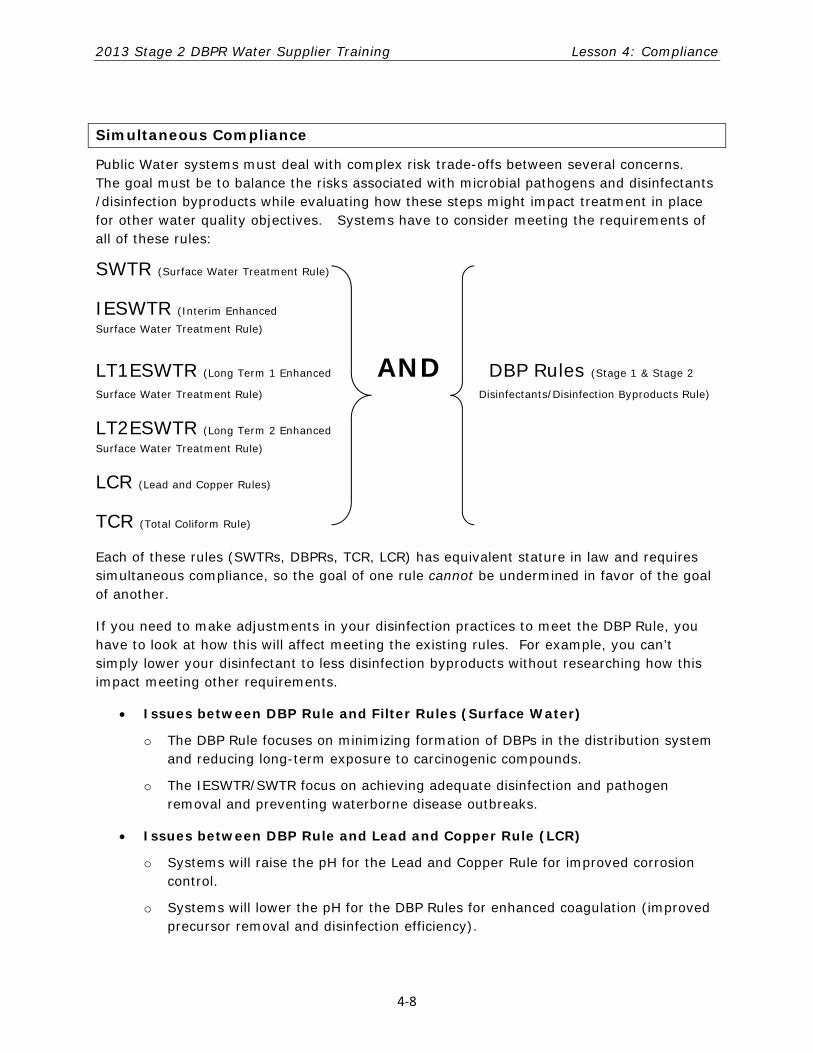
Public Water systems must deal with complex risk trade-offs between several concerns. The goal must be to balance the risks associated with microbial pathogens and disinfectants /disinfection byproducts while evaluating how these steps might impact treatment in place for other water quality objectives. Systems have to consider meeting the requirements of all of these rules:
SWTR (Surface Water Treatment Rule)
IESWTR (Interim Enhanced
Surface Water Treatment Rule)
LT1ESWTR (Long Term 1 Enhanced AND DBP Rules (Stage 1 & Stage 2
Surface Water Treatment Rule) Disinfectants/Disinfection Byproducts Rule)
LT2ESWTR (Long Term 2 Enhanced
Surface Water Treatment Rule)
LCR (Lead and Copper Rules)
TCR (Total Coliform Rule)
Each of these rules (SWTRs, DBPRs, TCR, LCR) has equivalent stature in law and requires simultaneous compliance, so the goal of one rule cannot be undermined in favor of the goal of another.
If you need to make adjustments in your disinfection practices to meet the DBP Rule, you have to look at how this will affect meeting the existing rules. For example, you can’t simply lower your disinfectant to less disinfection byproducts without researching how this impact meeting other requirements.
Issues between DBP Rule and Filter Rules (Surface Water)
o The DBP Rule focuses on minimizing formation of DBPs in the distribution system and reducing long-term exposure to carcinogenic compounds.
o The IESWTR/SWTR focus on achieving adequate disinfection and pathogen removal and preventing waterborne disease outbreaks.
Issues between DBP Rule and Lead and Copper Rule (LCR)
o Systems will raise the pH for the Lead and Copper Rule for improved corrosion control.
o Systems will lower the pH for the DBP Rules for enhanced coagulation (improved precursor removal and disinfection efficiency).
2013 Stage 2 DBPR Water Supplier Training Lesson 4: Compliance
4‐9
Issues between DBP Rule and Total Coliform Rule (TCR)
o The Total Coliform Rule (TCR) focuses on protecting distribution systems against microbial contamination from regrowth or outside sources of contamination from a pipeline break or cross-connection.
o Modifying treatment practices to comply with the DBP Rule may cause violations of the TCR. These problems can arise from a number of changes to the chemistry and biology of the distribution system.
Issues water systems need to consider
If you find that you are continually exceeding MCLs, systems may be forced to change types and dosages of oxidants and disinfectants. Surface water systems may have to change types and dosages of coagulants and the pH of coagulation. These changes may present several operational problems including:
o Corrosion of both treatment structures and equipment due to pH changes and oxidant/disinfectant changes.
o Changes in the type of chemical feed equipment and the location of chemical feed points.
o Changes in water taste and odor due to the use of new oxidants and disinfectants.
What you need to remember about simultaneous compliance issues
o There is no 1 “fix-all” option.
o There are potential treatment conflicts that might result from changes to meet the DBP rule.
o Any change requires careful planning that includes evaluation of potential impacts before implementing any process changes.
o Any treatment change will likely require a permit amendment, so the water system needs to contact their DEP Regional Office BEFORE any change is made. Even if a permit amendment is not required, there is language in the federal regulations that requires State review/approval for any long-term treatment change that will affect disinfection efficacy or water corrosivity.
o There are several guidance manuals available from EPA to assist water systems in addressing simultaneous compliance issues.
2013 Stage 2 DBPR Water Supplier Training Lesson 4: Compliance
4‐10
Key Points
1-hour reporting is required for any MCL exceedance, regardless of whether the exceedance causes a violation.
MCL compliance is determined by a Locational Running Annual Average. MCL violations are Tier 2 violations. M/R compliance is also determined for each sampling location. M/R violations are Tier 3 violations.
Systems will have a 1-week window in which to collect TTHM/HAA5 samples for M/R compliance. Samples taken outside of that window will not count for M/R compliance, but will be used to determine MCL compliance.
Tier 2 PN must be issued within 30 days; Tier 3 PN must be issued within 12 months. A copy of the PN and the Certification of Delivery must be submitted to DEP within 10 days of the date the notice is issued.
All violations and results of all detected contaminants must be reported in the CCR. Systems with multiple sampling locations may combine the results from all locations in the same table.
The goal of simultaneous compliance is to balance the risks associated with microbial pathogens and disinfectants /disinfection byproducts while evaluating how these steps might impact treatment in place for other water quality objectives. The goal of one rule cannot be undermined in favor of the goal of another.
Points not covered in detail during the course:
Systems required to comply with the enhanced coagulation treatment technique that cannot meet the Step 1 removal requirements (or ACC) after optimizing their treatment processes are required to identify and comply with a Step 2 removal requirement.
SW/GUDI systems wishing to achieve reduced TTHM/HAA5 monitoring must conduct source water TOC sampling. Failure to conduct this monitoring for 2 or more quarters will require the system to resume their routine frequency.
The criteria to qualify for, and remain on, reduced bromate monitoring is based on the bromate RAA calculated from samples analyzed by specific methods.
2013 Stage 2 DBPR Water Supplier Training Lesson 4: Compliance
4‐11
Additional Compliance Information:
Total Organic Carbon (TOC) – Surface Water Systems
Stage 1 DBPR requirements.
Enhanced Coagulation
Disinfection byproducts (DBPs) are formed when chemical oxidants react with natural organic matter found in many rivers, lakes and reservoirs. This organic matter is very difficult and expensive to measure, so we use TOC as an indicator. Under the Stage 1 rule, SW/GUDI systems using conventional filtration have to comply with the Enhanced Coagulation Treatment Technique, which requires that a certain percentage of TOC is removed from the source water. This percentage is based on the source water alkalinity and source water TOC levels.
(NOTE: Systems using other filtration technologies such as direct, diatomaceous earth, slow sand or membrane filtration are excluded because their source waters are typically lower in TOC and these technologies lack 1 or more of the steps necessary to remove TOC.)
o The amount of required TOC removal is detailed in a 3x3 matrix and is known as Step 1. There are also several alternative compliance criteria (ACC), both monthly and yearly for systems that do not meet the required TOC percent removal.
o Systems that cannot meet the Step 1 schedule will need to meet requirements known as Step 2. Although the Stage 2 rule did not change any of these requirements, few systems have pursued Step 2.
Step 2 is an alternate (lower) required percent removal determined by a jar test using specific protocol (detailed in EPA guidance). However, it should not be an automatic “easy out” for systems that have not optimized their treatment processes.
Systems that incur treatment technique violations that are due to a failure to remove the required percent TOC (as opposed to a violation caused by missed monitoring) should be required to first optimize their treatment processes before pursuing Step 2.
Systems that have optimized treatment (as demonstrated in an FPPE) will have to conduct a series of jar tests to determine what TOC percent removal they can reliably achieve. This then becomes their removal requirement for compliance purposes.
Systems that have chronic treatment technique violations should work with the regional FPPE and engineering staff to investigate and proceed to Step 2.
Optional TOC Monitoring
Any system with SW/GUDI sources wishing to qualify for reduced TTHM/HAA5 monitoring must also conduct source water TOC monitoring. This monitoring is
2013 Stage 2 DBPR Water Supplier Training Lesson 4: Compliance
4‐12
considered optional because if the system does not do it, there is no automatic M/R violation. The only consequence to not doing this monitoring is that reduced TTHM/HAA5 monitoring will not be granted (or could be revoked).
o If the TTHM/HAA5 frequency is routine, source water TOC is required monthly.
o If the TTHM/HAA5 frequency is reduced, source water TOC is required quarterly.
The Stage 2 DBPR revised the monthly monitoring to be monthly, every 30 days, and added the requirement that TOC monitoring be continued quarterly, every 90 days once the reduced TTHM/HAA5 frequency is granted. The new criteria for reduced TTHM/HAA5 monitoring went into effect April 1, 2009.
Systems with conventional filtration may use the source water TOC data for the enhanced coagulation treatment technique to also qualify for reduced TTHM/HAA5 monitoring as long as the minimum amount of samples required for this option are collected.
Bromate
Bromate is another DBP that is formed when a strong oxidant (e.g. ozone) reacts with bromide in the source water. So, any system using ozone as a disinfectant or oxidant must monitor for bromate. Bromate monitoring is required at each entry point (EP) that is supplying water treated with ozone.
o Routine monitoring is required monthly while the ozone treatment is operating.
o Reduced monitoring is required quarterly.
o Compliance is determined for each EP by a RAA.
Under the Stage 1 rule, source water bromide was required to qualify for and remain on reduced bromate monitoring. However, under the Stage 2 rule, bromide monitoring is no longer required. To qualify for, and remain on, a reduced bromate frequency, the bromate RAA must be < 0.0025 mg/L using specific methods. Reduced monitoring is EP specific.
o Samples for routine monitoring may be analyzed by DEP methods 120, 172, 173 or 174.
o Samples for reduced monitoring must be analyzed by method 172, 173 or 174. Systems using method 120 will remain or (or revert to) routine monitoring.
o This new criteria for reduced bromate monitoring went into effect April 1, 2009.
Additionally, the Stage 2 rule requires that Tier 3 PN be issued by any system on reduced monitoring if/when a bromate RAA exceeds 0.0025 mg/L (i.e. the system/EP reverts to routine monthly monitoring).
2013 Stage 2 DBPR Water Supplier Training Lesson 4: Compliance
4‐13
Chlorine and Chlorine Dioxide
The Stage 2 DBPR did not change any of the provisions of the Stage 1 rule as they relate to these parameters.
Bottled, Vended, Retail & Bulk (BVRB) Water Systems
The Stage 2 DBPR will change who has to conduct TTHM/HAA5 monitoring. Under the Stage 1 rule, bottled water systems using sources that were not treated with a chlorine-based chemical or oxidant were not required to monitor. However, under Stage 2, ALL BVRB systems that use a chemical disinfectant or oxidant (including ozone) will be required to monitor.
Monitoring begins in October 2013 and is required annually from each entry point in the month of warmest water temperature.
Systems monitoring under Stage 1 will continue to do so until Oct 2013.

2013 DBP Stage 2 Water Supplier Training Lesson 5: OEL
5‐1
Lesson 5 Operational Evaluation Levels
Objectives
Define OEL
Why OELs?
Who must calculate (which systems)
How and when do you calculate it
What if you exceed?
Who does this affect?
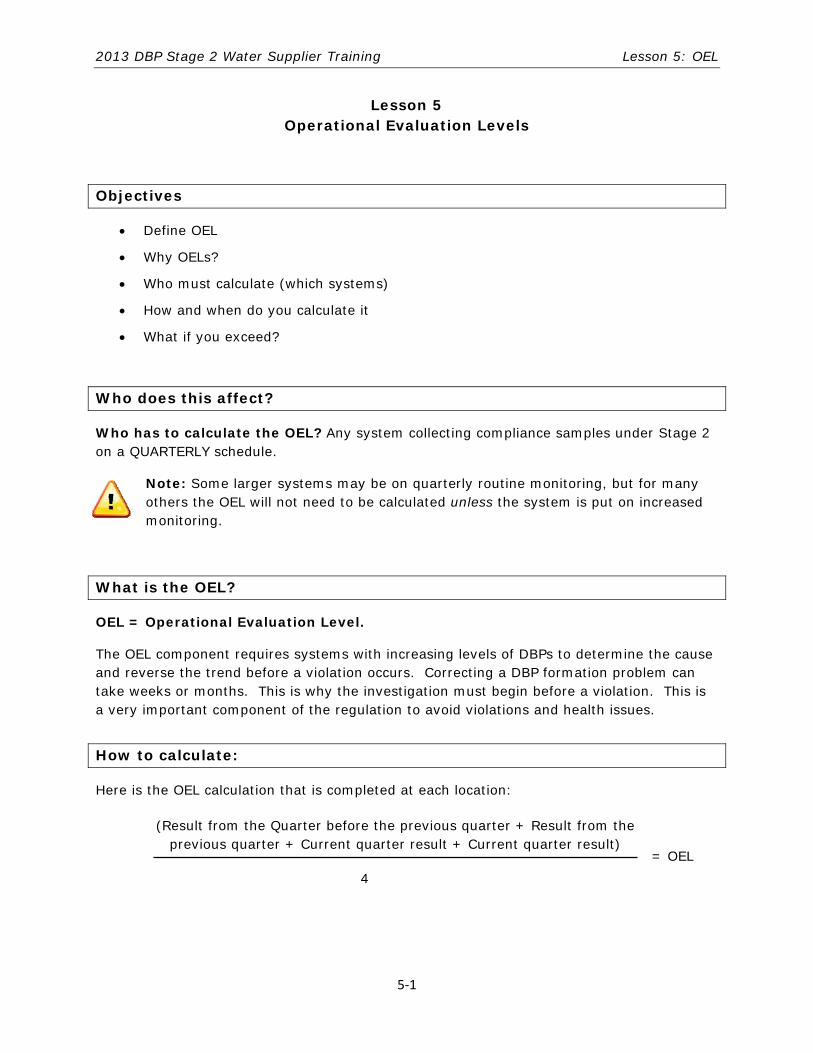
Who has to calculate the OEL? Any system collecting compliance samples under Stage 2 on a QUARTERLY schedule.
Note: Some larger systems may be on quarterly routine monitoring, but for many others the OEL will not need to be calculated unless the system is put on increased monitoring.
What is the OEL?
OEL = Operational Evaluation Level.
The OEL component requires systems with increasing levels of DBPs to determine the cause and reverse the trend before a violation occurs. Correcting a DBP formation problem can take weeks or months. This is why the investigation must begin before a violation. This is a very important component of the regulation to avoid violations and health issues.
How to calculate:
Here is the OEL calculation that is completed at each location:
(Result from the Quarter before the previous quarter + Result from the previous quarter + Current quarter result + Current quarter result)
4
= OEL
2013 DBP Stage 2 Water Supplier Training Lesson 5: OEL
5‐2
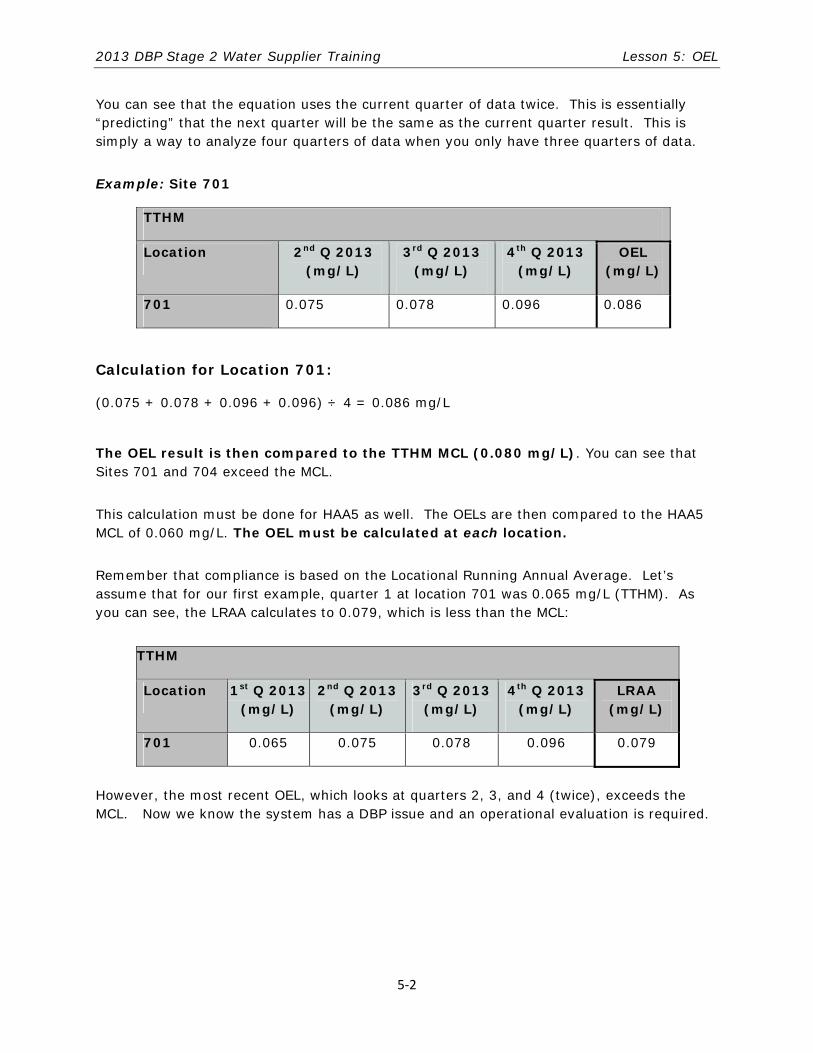
You can see that the equation uses the current quarter of data twice. This is essentially “predicting” that the next quarter will be the same as the current quarter result. This is simply a way to analyze four quarters of data when you only have three quarters of data.
Example: Site 701
TTHM
Location 2nd Q 2013 (mg/L)
3rd Q 2013 (mg/L)
4th Q 2013 (mg/L)
OEL (mg/L)
701 0.075 0.078 0.096 0.086
Calculation for Location 701:
(0.075 + 0.078 + 0.096 + 0.096) ÷ 4 = 0.086 mg/L
The OEL result is then compared to the TTHM MCL (0.080 mg/L). You can see that Sites 701 and 704 exceed the MCL.
This calculation must be done for HAA5 as well. The OELs are then compared to the HAA5 MCL of 0.060 mg/L. The OEL must be calculated at each location.
Remember that compliance is based on the Locational Running Annual Average. Let’s assume that for our first example, quarter 1 at location 701 was 0.065 mg/L (TTHM). As you can see, the LRAA calculates to 0.079, which is less than the MCL:
TTHM
Location 1st Q 2013 (mg/L)
2nd Q 2013 (mg/L)
3rd Q 2013 (mg/L)
4th Q 2013 (mg/L)
LRAA (mg/L)
701 0.065 0.075 0.078 0.096 0.079
However, the most recent OEL, which looks at quarters 2, 3, and 4 (twice), exceeds the MCL. Now we know the system has a DBP issue and an operational evaluation is required.
2013 DBP Stage 2 Water Supplier Training Lesson 5: OEL
5‐3
System must calculate OEL
The OEL calculations must be done by the water system. The DEP data system, PADWIS, will calculate the OEL, but it will be after the system can calculate it. PADWIS will wait until the end of the quarter to run compliance and OEL. It’s important the system calculates it because there are deadlines for taking actions and reporting if there is an exceedance.
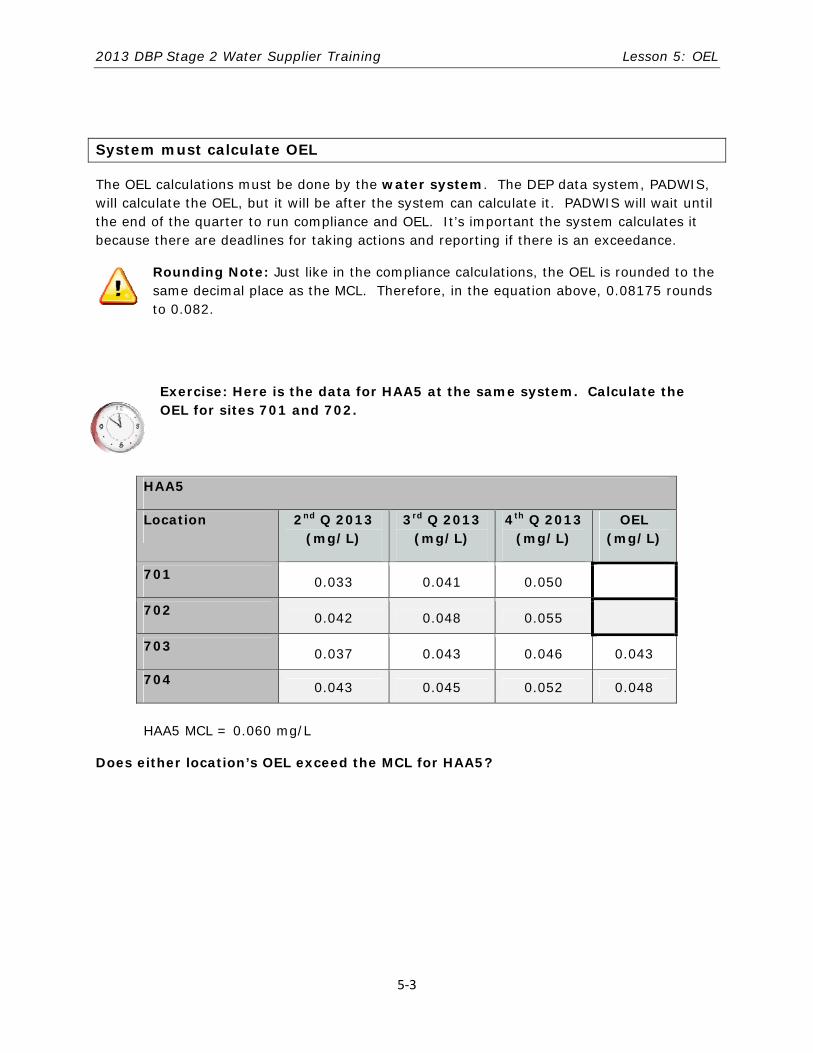
Rounding Note: Just like in the compliance calculations, the OEL is rounded to the same decimal place as the MCL. Therefore, in the equation above, 0.08175 rounds to 0.082.
Exercise: Here is the data for HAA5 at the same system. Calculate the OEL for sites 701 and 702.
HAA5
Location 2nd Q 2013 (mg/L)
3rd Q 2013 (mg/L)
4th Q 2013 (mg/L)
OEL (mg/L)
701 0.033 0.041 0.050
702 0.042 0.048 0.055
703 0.037 0.043 0.046 0.043
704 0.043 0.045 0.052 0.048
HAA5 MCL = 0.060 mg/L
Does either location’s OEL exceed the MCL for HAA5?
2013 DBP Stage 2 Water Supplier Training Lesson 5: OEL
5‐4
10
Days
90
Days
When?
The first determination of OELs occurs after the completion of your first three quarterly monitoring periods. Thereafter, the determination of OELs is completed each quarter when new monitoring results are available.
The OEL must be calculated at each location by the system once the sample result is received from the lab.
Again, do not wait to do the calculation! If there is an OEL exceedance, there are some deadlines that we’ll discuss in a minute.
Also, a system could choose to grab another sample if it is in the same quarter. The results from the same quarter are averaged together before being placed in the OEL calculation.
What if a location exceeds the OEL?
If a location’s OEL value exceeds the MCL for either TTHM or HAA5, notify DEP within 10 days of the end of quarter in which the OEL was exceeded.
Give DEP the following information:
• Monitoring location
• Date notified of sample result causing exceedance
• Calculated OELs
DEP has a form available for reporting the OEL exceedance to DEP. You may obtain the form electronically from your local DEP office, or from the eLibrary (at the time of this workbook printing, the OEL form has not been finalized for the eLibrary yet):
Go to eLibrary: www.elibrary.dep.state.pa.us In the search box at the top right, type “OEL exceedance”
Conduct an operational evaluation to identify the cause of the exceedance. Submit a report to the DEP (Regional/District Office) within 90 days after being notified of the sample result that caused the exceedance (not the end of the quarter).

2013 DBP Stage 2 Water Supplier Training Lesson 5: OEL
5‐5
Full Evaluation and Report:
There is a provision for a limited scope evaluation that we will discuss later. First, let’s
review the full evaluation and report.
Checklists: There are checklists available to help conduct the investigation and find the cause of the elevated DBPs! These are not just paperwork – they are a helpful troubleshooting guide.
Source Water Evaluation Checklist
Distribution System Evaluation Checklist
Treatment Process Evaluation Checklist
The guidance manual has more information for each checklist item. It’s a good idea to look at this information to help you identify the cause of the higher levels.
The checklists and the OEL Guidance Manual is available on DEP’s DBP website:
Go to www.depweb.state.pa.us
On the left side, click on “DEP Programs A-Z”
Find “Drinking Water” under the letter “D”
On the right side of the Drinking Water page, click on “Regulations”
Then click on Stage 2 DBP
Operational Evaluation:
The evaluation must include an examination of the raw water source, system treatment and distribution practices that may contribute to TTHM and HAA5
formation.
And, of course, the operational evaluation must also include what steps could be considered to “correct” the issue and minimize future exceedances.
2013 DBP Stage 2 Water Supplier Training Lesson 5: OEL
5‐6
Question: Since the exceedance occurred only at one location, and this is a large system, where would you investigate first? (Source, Treatment, or Distribution?)
Appendix C contains a full evaluation report for the Elm City system exceedance in the Pineville neighborhood. This system used the EPA checklists to guide their evaluation. In the report portion, you can see that they narrowed the issue down to the distribution system.
Essentially, a main break occurred in the Pineville neighborhood on June 2 in the Pineville neighborhood. System pressure dropped much lower than normal. The Pineville tank did not refill prior to the morning peak demand. Under normal conditions, the tank supplies water from the bottom portion of the tank where turnover is expected to be good and water age is expected to be relatively low (newer water). This means there is probably significant short circuiting that has been occurring in the tank. During the main break, water was introduced from the top portion of the tank in which water is relatively unmixed and of high water age. This high water age increases DBP levels.
The last piece of the puzzle is for the system to determine how to minimizing future exceedances. Based on their description of the cause of the exceedance, you can probably already see that they need better mixing in their tank. In the report, they outline their plans to reduce the inlet diameter to increase the inlet velocity. This should provide better mixing. They should get a mixing expert involved.
Example Case:
Elm City Water Department: Pineville Neighborhood Exceedance
Large surface water system that is required to collect 8 DBPs samples per quarter.
Exceeded TTHM OEL at location #2 (702) in the Pineville neighborhood. The calculation was done after the 6/03/12 sample result was obtained.
An OEL exceedance has not occurred at this location in the past. No other sampling locations exceeded the OEL based on the June results.
They cannot immediately determine the cause of the exceedance, so the system must conduct a full evaluation.
2013 DBP Stage 2 Water Supplier Training Lesson 5: OEL
5‐7
Section 6 of the guidance is called “Minimizing Future Operational Evaluation Level Exceedances.”
(FROM OEL GUIDANCE) Exhibit 6.1 Examples of Operational Strategies to Reduce DBPs
Turn over water in finished water tanks and reservoirs more frequently to reduce water age. (6.1.1.1)
Use blowoffs or flush dead ends in the distribution system to reduce water age. (6.1.1.2)
Conduct periodic flushing. (6.1.2.2)
Increase TOC removal by optimizing coagulation. (6.2.1.1)
Clean settling basins before your peak DBP period. (6.2.1.3)
Optimize filtration. (6.2.1.4)
Review disinfection practices. Note that you MUST contact your State first before making any changes to disinfection practices. (6.2.3)
Monitor source water and manage intake operations to draw raw water with the lowest possible TOC. (6.3)
Note: As per the rule, the written report must be made available to the public upon request.
How to Obtain OEL Guidance:
Go to DEP’s DBP site as described above on page 5-5.
Limited Scope Evaluation and Report:
If the system can determine the cause of the OEL exceedance to DEP’s satisfaction, the system may request that DEP allow a limited scope operational evaluation. The State must then approve the limited scope of the evaluation in writing and the system must keep the written approval with the completed report.
Note that submitting this request will not extend the 90 day deadline for submitting the operational evaluation report.
Examples where the cause of the OEL exceedance may be known include the following:
Total organic carbon (TOC) source water and finished water data indicate poor TOC removal across the plant.
Source water and finished water data indicate a sudden increase in temperature.
Plant flows were reduced due to lower demand, resulting in a much longer contact time between the chlorine and DBP precursors.
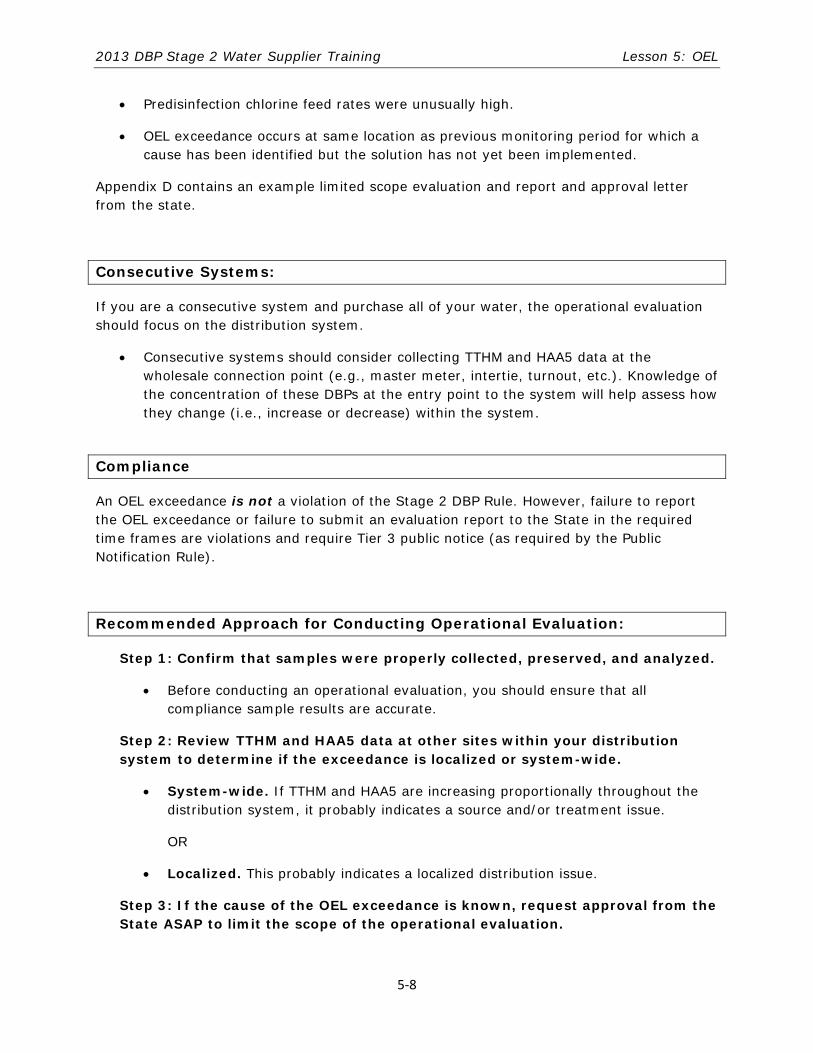
2013 DBP Stage 2 Water Supplier Training Lesson 5: OEL
5‐8
Predisinfection chlorine feed rates were unusually high.
OEL exceedance occurs at same location as previous monitoring period for which a cause has been identified but the solution has not yet been implemented.
Appendix D contains an example limited scope evaluation and report and approval letter from the state.
Consecutive Systems:
If you are a consecutive system and purchase all of your water, the operational evaluation should focus on the distribution system.
Consecutive systems should consider collecting TTHM and HAA5 data at the wholesale connection point (e.g., master meter, intertie, turnout, etc.). Knowledge of the concentration of these DBPs at the entry point to the system will help assess how they change (i.e., increase or decrease) within the system.
Compliance
An OEL exceedance is not a violation of the Stage 2 DBP Rule. However, failure to report the OEL exceedance or failure to submit an evaluation report to the State in the required time frames are violations and require Tier 3 public notice (as required by the Public Notification Rule).
Recommended Approach for Conducting Operational Evaluation:
Step 1: Confirm that samples were properly collected, preserved, and analyzed.
Before conducting an operational evaluation, you should ensure that all compliance sample results are accurate.
Step 2: Review TTHM and HAA5 data at other sites within your distribution system to determine if the exceedance is localized or system-wide.
System-wide. If TTHM and HAA5 are increasing proportionally throughout the distribution system, it probably indicates a source and/or treatment issue.
OR
Localized. This probably indicates a localized distribution issue.
Step 3: If the cause of the OEL exceedance is known, request approval from the State ASAP to limit the scope of the operational evaluation.
2013 DBP Stage 2 Water Supplier Training Lesson 5: OEL
5‐9
Step 4: Conduct a detailed or limited operational evaluation depending on State response in Step 3.
Step 5: Identify steps to minimize exceedances.
Step 6: Prepare the operational evaluation report and submit it to the State.
Key Points
OEL calculated by any system on quarterly monitoring under DBP
OEL must be calculated by water system
If OEL exceeds MCL:
o Notify DEP in 10 days from end of quarter in which exceedance occurred.
o Conduct an operational evaluation and submit report to DEP within 90 days of being notified of high result.
Use EPA checklists and guidance manual to help evaluate why the exceedance occurred. The checklists and associated attachments may also serve as the report.

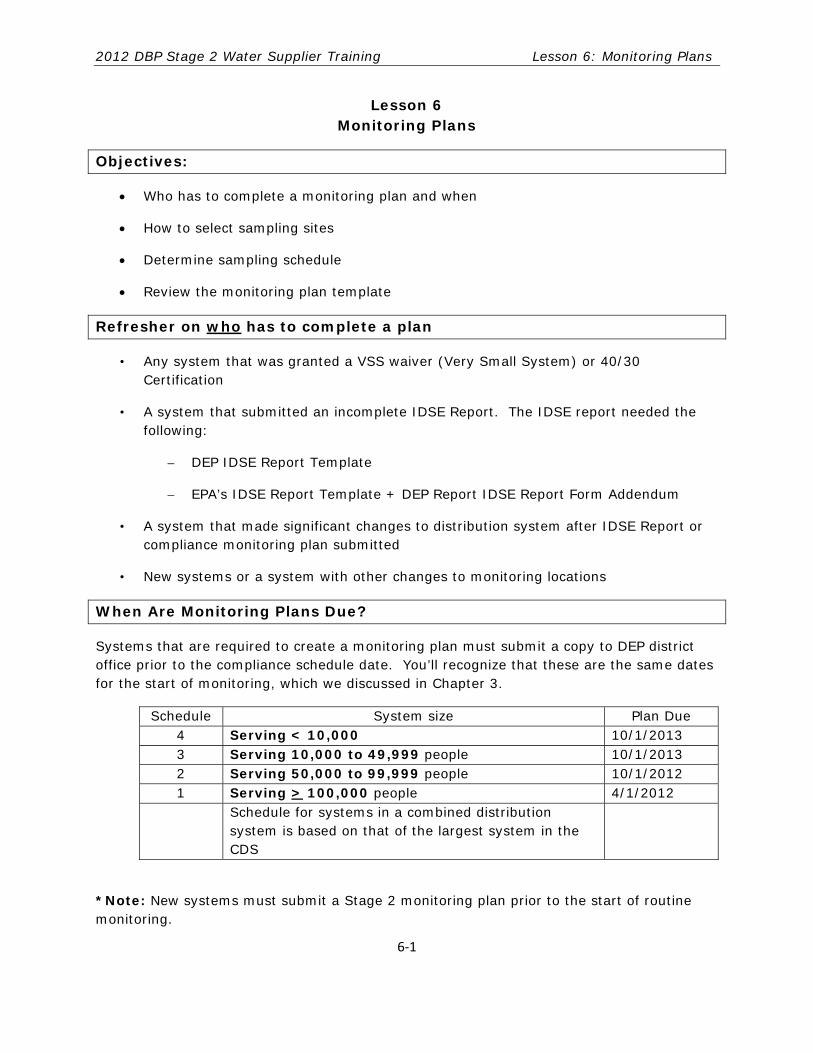
2012 DBP Stage 2 Water Supplier Training Lesson 6: Monitoring Plans
6‐1
Lesson 6 Monitoring Plans
Objectives:
Who has to complete a monitoring plan and when
How to select sampling sites
Determine sampling schedule
Review the monitoring plan template
Refresher on who has to complete a plan
• Any system that was granted a VSS waiver (Very Small System) or 40/30 Certification
• A system that submitted an incomplete IDSE Report. The IDSE report needed the following:
– DEP IDSE Report Template
– EPA’s IDSE Report Template + DEP Report IDSE Report Form Addendum
• A system that made significant changes to distribution system after IDSE Report or compliance monitoring plan submitted
• New systems or a system with other changes to monitoring locations
When Are Monitoring Plans Due?
Systems that are required to create a monitoring plan must submit a copy to DEP district office prior to the compliance schedule date. You’ll recognize that these are the same dates for the start of monitoring, which we discussed in Chapter 3.
Schedule System size Plan Due 4 Serving < 10,000 10/1/2013 3 Serving 10,000 to 49,999 people 10/1/2013 2 Serving 50,000 to 99,999 people 10/1/2012 1 Serving > 100,000 people 4/1/2012 Schedule for systems in a combined distribution
system is based on that of the largest system in the CDS
*Note: New systems must submit a Stage 2 monitoring plan prior to the start of routine monitoring.
2012 DBP Stage 2 Water Supplier Training Lesson 6: Monitoring Plans
6‐2
Creating the Monitoring Plan
You have to create a monitoring plan to establish your system’s Stage 2:
• Monitoring Locations
• Sampling Schedule (when are you sampling)
Monitoring locations and schedules must be determined for routine monitoring and increased monitoring. If a system is on reduced monitoring, the reduced monitoring locations and schedule must be shown in the plan as well.
NOTE: Even if a system is able to stay on reduced monitoring from Stage 1 to Stage 2, the system must identify all routine and increased monitoring locations in the plan (increased monitoring involves collecting dual samples at every routine location).
DEP has developed a monitoring plan template to help you.
Before looking at the template, this lesson reviews two key pieces that you’ll need to determine before you fill in the template. These include:
Selecting Stage 2 DBP routine sampling locations
Determining your monitoring schedule
How do I determine my sampling locations?
Again, here we will focus on TTHM/HAA5 since all systems under the Rule have to collect for these parameters.
The first step is to figure out how many sample locations are required under Stage 2 ROUTINE MONITORING in each cycle for your system. To determine this, we can go to the Compliance Summary Sheet job aid.
Let’s look at the first two rows in the job aid for Surface Water (<500 and 500 to 3,300 served) and the first row for Groundwater (systems <500)
Both of these size systems require 2 sampling locations per period. Please notice that these are “individual” samples. Remember the individual sample exception we discussed in the monitoring lesson?
IF the highest TTHM and highest HAA5 sites are the same location AND the highest TTHM and highest HAA5 concentrations occur in the same month, only 1 dual sample is required. This would be determined by looking at the system’s Stage 1 compliance data and any other relevant results they may have.
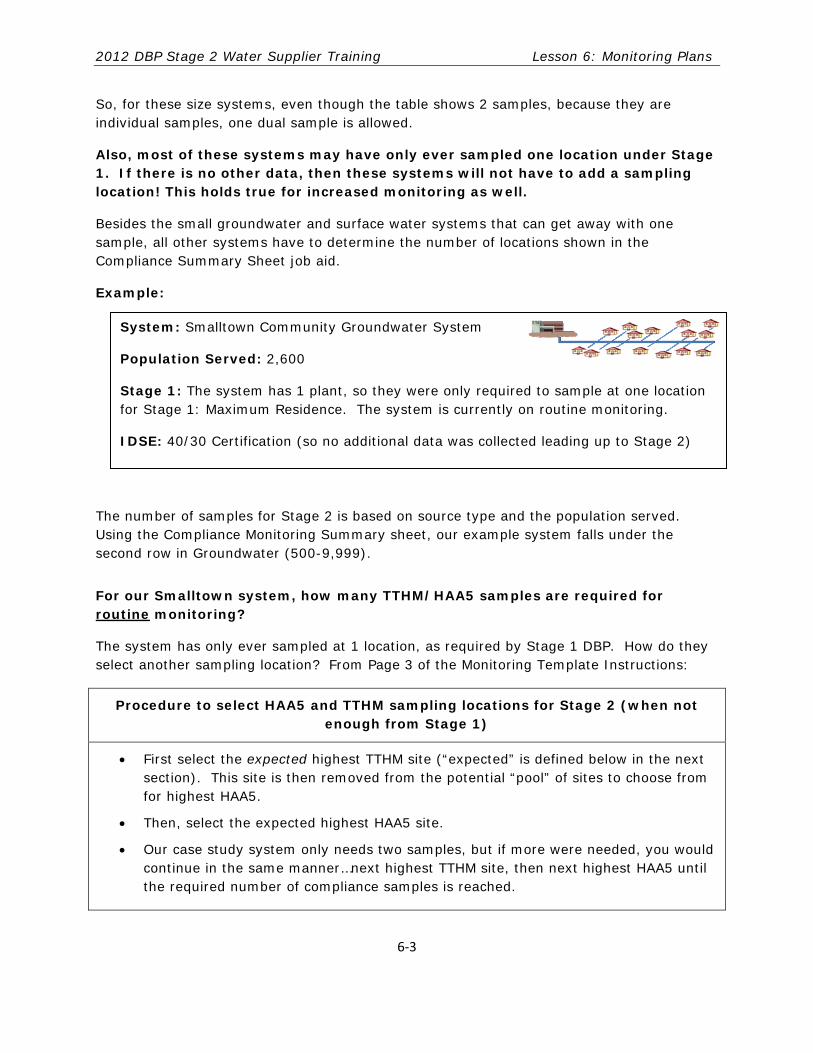
2012 DBP Stage 2 Water Supplier Training Lesson 6: Monitoring Plans
6‐3
So, for these size systems, even though the table shows 2 samples, because they are individual samples, one dual sample is allowed.
Also, most of these systems may have only ever sampled one location under Stage 1. If there is no other data, then these systems will not have to add a sampling location! This holds true for increased monitoring as well.
Besides the small groundwater and surface water systems that can get away with one sample, all other systems have to determine the number of locations shown in the Compliance Summary Sheet job aid.
Example:
The number of samples for Stage 2 is based on source type and the population served. Using the Compliance Monitoring Summary sheet, our example system falls under the second row in Groundwater (500-9,999).
For our Smalltown system, how many TTHM/HAA5 samples are required for routine monitoring?
The system has only ever sampled at 1 location, as required by Stage 1 DBP. How do they select another sampling location? From Page 3 of the Monitoring Template Instructions:
Procedure to select HAA5 and TTHM sampling locations for Stage 2 (when not enough from Stage 1)
First select the expected highest TTHM site (“expected” is defined below in the next section). This site is then removed from the potential “pool” of sites to choose from for highest HAA5.
Then, select the expected highest HAA5 site.
Our case study system only needs two samples, but if more were needed, you would continue in the same manner…next highest TTHM site, then next highest HAA5 until the required number of compliance samples is reached.
System: Smalltown Community Groundwater System
Population Served: 2,600
Stage 1: The system has 1 plant, so they were only required to sample at one location for Stage 1: Maximum Residence. The system is currently on routine monitoring.
IDSE: 40/30 Certification (so no additional data was collected leading up to Stage 2)
2012 DBP Stage 2 Water Supplier Training Lesson 6: Monitoring Plans
6‐4
Expected highest TTHM
The longer the contact time between the disinfectant and the precursors, the greater the amount of TTHM that can be formed. TTHM continues to form in drinking water as long as a disinfectant residual and precursors are present. So, the highest TTHM site is expected to be at a point in the distribution with the longest water age.
Note: The first expected highest TTHM location will mostly be the Stage 1 maximum residence sampling site.
Higher water temperatures also lead to higher TTHM concentrations. Higher water temperatures during summer seasons can increase DBPs as the chemical reactions happen faster at higher temperatures. Also, higher water temperatures often cause a higher chlorine demand, requiring an increased disinfectant dose and resulting in higher DBP formation potential.
Expected highest HAA5
Now let’s look at how you determine the expected highest HAA5, which is the other set of DBPs we are concerned about. Unlike TTHMs, HAA5s may not be highest in areas of longest water age. HAA5s will increase as water age increases, but only up to a point. This is because HAA5s can biodegrade in areas of very low residual and where biological activity (i.e. biofilms) is present. The main intention in selecting HAA5 sites is to avoid areas of biofilms and any other biological activity.
Let’s summarize the sites to consider for expected highest TTHM:
Longest water age
Downstream of tanks or reservoirs (Storage facilities typically increase water age and possibly temperature)
Hydraulic dead-ends (but still at the last customer). Be sure to locate TTHM sites before or at the last group of customers on a dead end line. Samples taken at the very end of a dead end line are not representative of the water received by customers.
Sparsely populated residential areas (longer water age due to less flow)
If your system had booster chlorination, select a site AFTER the booster is applied.
Any known long water age AND warmer temperature sites
2012 DBP Stage 2 Water Supplier Training Lesson 6: Monitoring Plans
6‐5
More than enough samples (note – this situation will most likely not be the case for Schedule 3 and 4 systems):
Some larger systems (Schedule 1 and 2), may have more sampling locations from Stage 1 than they need for Stage 2. In this case, here is the procedure:
Gather the most recent calendar year of data
Calculate the locational running annual average (LRAA) for TTHM and HAA5 concentrations at each Stage 1 DBP monitoring site.
Determine the highest TTHM site and “set this site aside”.
Next determine the highest HAA5 site (not considering the highest TTHM site already selected)
Determine the next highest TTHM site from the remaining sites.
Continue alternating your selections.
Selecting expected highest HAA5:
First look at chlorine residuals in the distribution system. Remember that under Stage 1 chlorine was sampled at each TCR location. Select sites that have less than average site residual (indicating a long residence time), but not very low or no residual.
o Do not select sites that regularly or in the summer months have free chlorine residuals less than 0.2 mg/L or with chloramine residuals less than 0.5 mg/L
Avoid areas of low flow rates and dead-ends (more biological activity here)
If you use booster chlorination, the sampling point should be after booster disinfection is applied.
Select sites with warmer temperatures, since this increases HAA5 concentrations (unless biological activity is present)
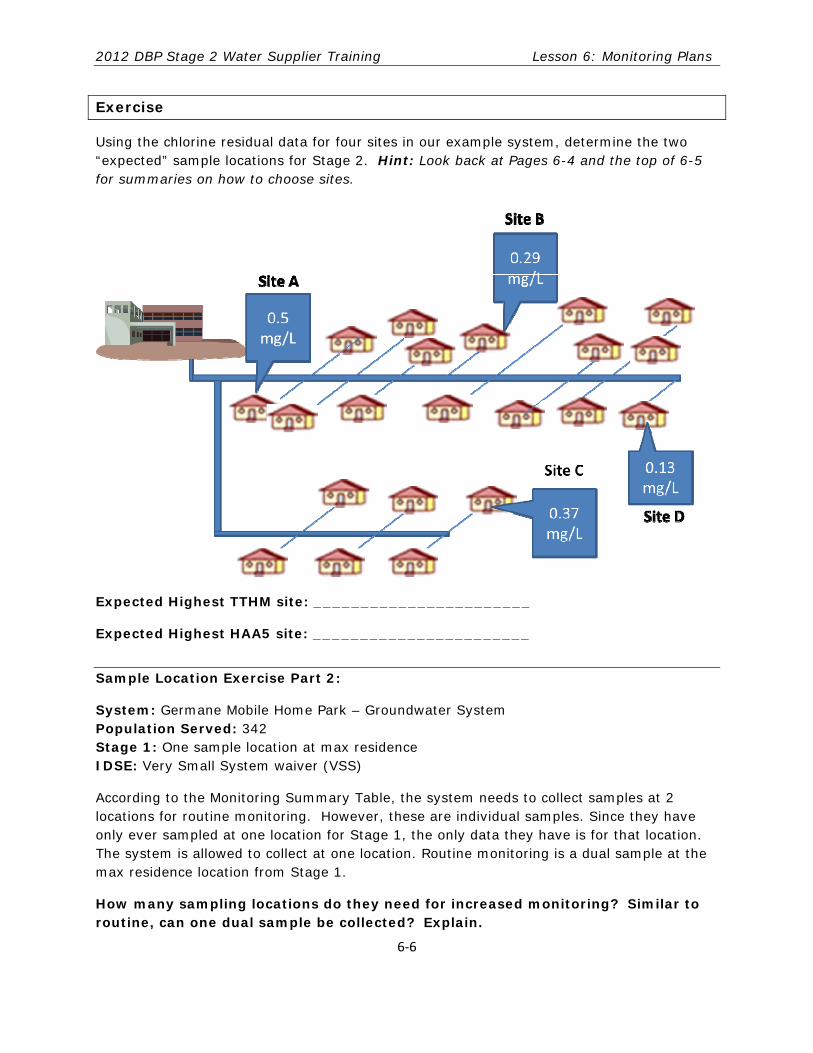
2012 DBP Stage 2 Water Supplier Training Lesson 6: Monitoring Plans
6‐6
Exercise
Using the chlorine residual data for four sites in our example system, determine the two “expected” sample locations for Stage 2. Hint: Look back at Pages 6-4 and the top of 6-5 for summaries on how to choose sites.
Expected Highest TTHM site: _______________________
Expected Highest HAA5 site: _______________________
Sample Location Exercise Part 2:
System: Germane Mobile Home Park – Groundwater System Population Served: 342 Stage 1: One sample location at max residence IDSE: Very Small System waiver (VSS)
According to the Monitoring Summary Table, the system needs to collect samples at 2 locations for routine monitoring. However, these are individual samples. Since they have only ever sampled at one location for Stage 1, the only data they have is for that location. The system is allowed to collect at one location. Routine monitoring is a dual sample at the max residence location from Stage 1.
How many sampling locations do they need for increased monitoring? Similar to routine, can one dual sample be collected? Explain.
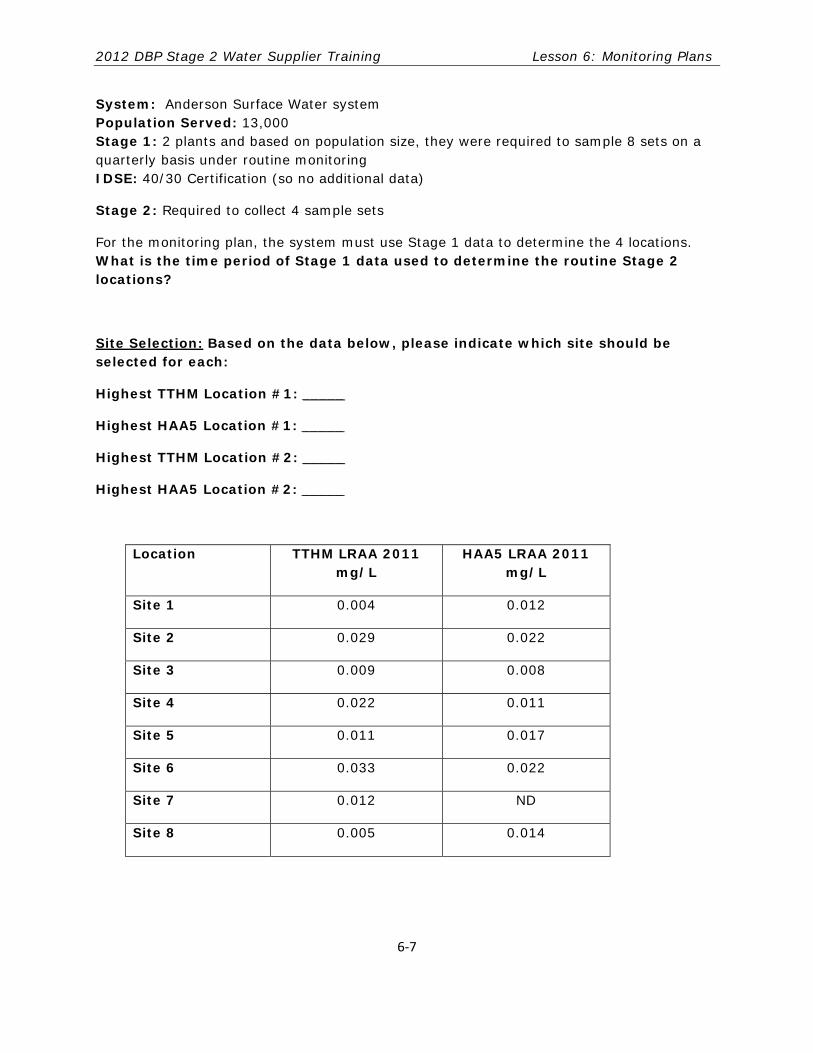
2012 DBP Stage 2 Water Supplier Training Lesson 6: Monitoring Plans
6‐7
System: Anderson Surface Water system Population Served: 13,000 Stage 1: 2 plants and based on population size, they were required to sample 8 sets on a quarterly basis under routine monitoring IDSE: 40/30 Certification (so no additional data)
Stage 2: Required to collect 4 sample sets
For the monitoring plan, the system must use Stage 1 data to determine the 4 locations. What is the time period of Stage 1 data used to determine the routine Stage 2 locations?
Site Selection: Based on the data below, please indicate which site should be selected for each:
Highest TTHM Location #1: _____
Highest HAA5 Location #1: _____
Highest TTHM Location #2: _____
Highest HAA5 Location #2: _____
Location TTHM LRAA 2011 mg/L
HAA5 LRAA 2011 mg/L
Site 1 0.004 0.012
Site 2 0.029 0.022
Site 3 0.009 0.008
Site 4 0.022 0.011
Site 5 0.011 0.017
Site 6 0.033 0.022
Site 7 0.012 ND
Site 8 0.005 0.014
2012 DBP Stage 2 Water Supplier Training Lesson 6: Monitoring Plans
6‐8
Monitoring Plan Template: Part 2
Part 2 starts with a sample site inventory. Here you are indicating which parameters that you monitor for in relation to the DBP rule. Please note that you also have to indicate the sampler and the analyzer for each parameter. There is a sample type key below the top table.
“Sampling Information (for TTHM/HAA5)” Table – page 3
What is the DEP Site ID? It is a 3-digit code from 700-799. This is needed now since TTHM/HAA5 compliance is determined for each sampling location. DEP now requires a unique 3-digit location code for each specific distribution location for this rule. The water system assigns this number and it is then used to report sample results to the state.
Since many water systems already have “Site IDs”, you place this number in the 4th column. By doing this, we know how each “System Site ID” corresponds to each “DEP Site ID.”
Sampling Information Table: Location Reason and Justification columns
If a system had plenty of Stage 1 locations to select Stage 2 sites, like the system in our last exercise, then the location reason is simply “high TTHM” or “High HAA5.” The justification column can be left blank.
If, however, the system did not have enough Stage 1 sites and had to determine “expected” high sites, “Other” should be selected in the Location Reason column. The justification column should then be completed.
For our example Smalltown system, the reason could be:
TTHM Site: Based on chlorine residual level and the distribution map, this location is believed to have the longest residence time and was therefore selected as the expected highest TTHM.
HAA5 Site: Based on chlorine residual levels, this site has lower than average chlorine residual levels, but not the lowest.
2012 DBP Stage 2 Water Supplier Training Lesson 6: Monitoring Plans
6‐9
Monitoring Schedules: When to sample
Chlorine:
In the monitoring plan, you have to show the proposed monitoring schedules for each parameter.
The first table is for chlorine.
As you learned in the monitoring chapter, all systems treated with chlorine and chloramines must monitor for chlorine in the distribution.
As a refresher, chlorine samples are collected at the same times and from the same locations as coliform samples (as collected for compliance samples under the TCR).
TTHM/HAA5
Page 7 of the monitoring plan.
First you identify the “Peak Historical Month” for both TTHM and HAA5. The peak historical month is based on all of your Stage 1 DBP data. You’ll probably have annual or quarterly data on both TTHM and HAA5 for the last 10 years or so (depending on when you started Stage 1). Using this data, you should be able to determine the months in which the highest DBP concentrations occur.
You’ll notice in the first column, it lists “Routine”, “Reduced”, and “Increased.” As we mentioned earlier, every system must complete the routine and increased monitoring portions. Also, if the system is staying on reduced monitoring in Stage 2, it must complete this information as well.
The routine and reduced monitoring requirements for your system can be transferred form the Compliance Summary Sheet job aid to the table on page 7.
Sampling Dates:
Compliance sampling must occur during the peak historical month. We’ve already identified the peak historical month from Stage 1 data for the top of the table. If you are only monitoring for DBPs annually, then you must sample during the peak historical month.
If on quarterly: Sampling must occur during the peak historical month and then at 90 day intervals before and/or after the peak historical month.
Note: The water supplier may choose to use the TCR sample site plan to identify the sample locations and the sample collector and schedule, instead of entering the same information in the monitoring plan template.
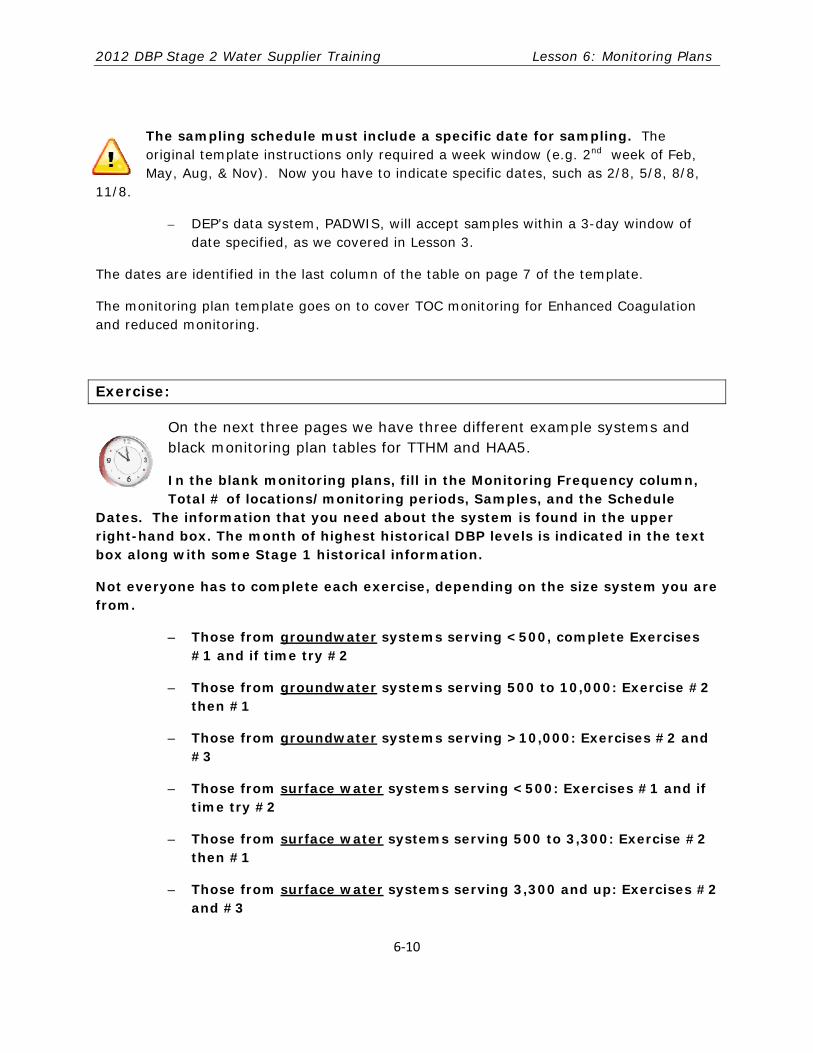
2012 DBP Stage 2 Water Supplier Training Lesson 6: Monitoring Plans
6‐10
The sampling schedule must include a specific date for sampling. The original template instructions only required a week window (e.g. 2nd week of Feb, May, Aug, & Nov). Now you have to indicate specific dates, such as 2/8, 5/8, 8/8,
11/8.
– DEP’s data system, PADWIS, will accept samples within a 3-day window of date specified, as we covered in Lesson 3.
The dates are identified in the last column of the table on page 7 of the template.
The monitoring plan template goes on to cover TOC monitoring for Enhanced Coagulation and reduced monitoring.
Exercise:
On the next three pages we have three different example systems and black monitoring plan tables for TTHM and HAA5.
In the blank monitoring plans, fill in the Monitoring Frequency column, Total # of locations/monitoring periods, Samples, and the Schedule
Dates. The information that you need about the system is found in the upper right-hand box. The month of highest historical DBP levels is indicated in the text box along with some Stage 1 historical information.
Not everyone has to complete each exercise, depending on the size system you are from.
– Those from groundwater systems serving <500, complete Exercises #1 and if time try #2
– Those from groundwater systems serving 500 to 10,000: Exercise #2 then #1
– Those from groundwater systems serving >10,000: Exercises #2 and #3
– Those from surface water systems serving <500: Exercises #1 and if time try #2
– Those from surface water systems serving 500 to 3,300: Exercise #2 then #1
– Those from surface water systems serving 3,300 and up: Exercises #2 and #3
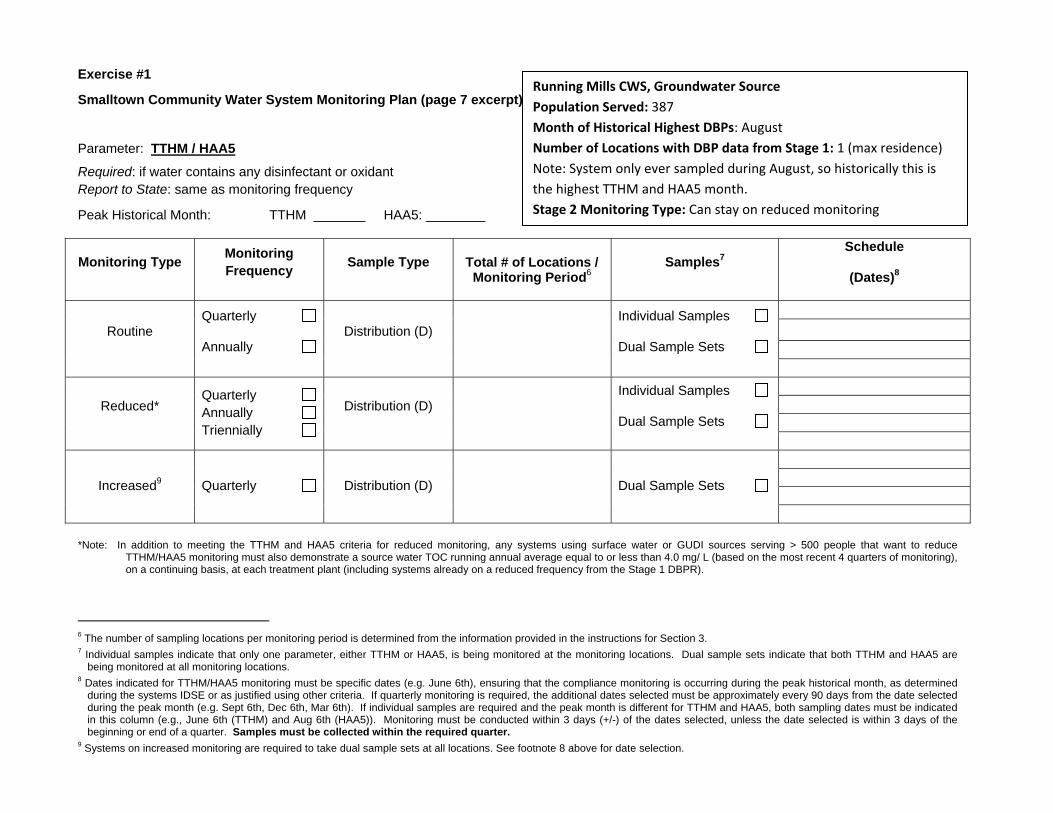
Exercise #1
Smalltown Community Water System Monitoring Plan (page 7 excerpt)
Parameter: TTHM / HAA5
Required: if water contains any disinfectant or oxidant Report to State: same as monitoring frequency
Peak Historical Month: TTHM _______ HAA5: ________
Monitoring Type Monitoring Frequency
Sample Type Total # of Locations / Monitoring Period6
Samples7 Schedule
(Dates)8
Routine Quarterly
Annually Distribution (D)
Individual Samples
Dual Sample Sets
Reduced* Quarterly Annually Triennially
Distribution (D) Individual Samples
Dual Sample Sets
Increased9 Quarterly Distribution (D) Dual Sample Sets
*Note: In addition to meeting the TTHM and HAA5 criteria for reduced monitoring, any systems using surface water or GUDI sources serving > 500 people that want to reduce TTHM/HAA5 monitoring must also demonstrate a source water TOC running annual average equal to or less than 4.0 mg/ L (based on the most recent 4 quarters of monitoring), on a continuing basis, at each treatment plant (including systems already on a reduced frequency from the Stage 1 DBPR).
6 The number of sampling locations per monitoring period is determined from the information provided in the instructions for Section 3. 7 Individual samples indicate that only one parameter, either TTHM or HAA5, is being monitored at the monitoring locations. Dual sample sets indicate that both TTHM and HAA5 are
being monitored at all monitoring locations. 8 Dates indicated for TTHM/HAA5 monitoring must be specific dates (e.g. June 6th), ensuring that the compliance monitoring is occurring during the peak historical month, as determined
during the systems IDSE or as justified using other criteria. If quarterly monitoring is required, the additional dates selected must be approximately every 90 days from the date selected during the peak month (e.g. Sept 6th, Dec 6th, Mar 6th). If individual samples are required and the peak month is different for TTHM and HAA5, both sampling dates must be indicated in this column (e.g., June 6th (TTHM) and Aug 6th (HAA5)). Monitoring must be conducted within 3 days (+/-) of the dates selected, unless the date selected is within 3 days of the beginning or end of a quarter. Samples must be collected within the required quarter.
9 Systems on increased monitoring are required to take dual sample sets at all locations. See footnote 8 above for date selection.
Running Mills CWS, Groundwater Source
Population Served: 387
Month of Historical Highest DBPs: August
Number of Locations with DBP data from Stage 1: 1 (max residence)
Note: System only ever sampled during August, so historically this is
the highest TTHM and HAA5 month.
Stage 2 Monitoring Type: Can stay on reduced monitoring
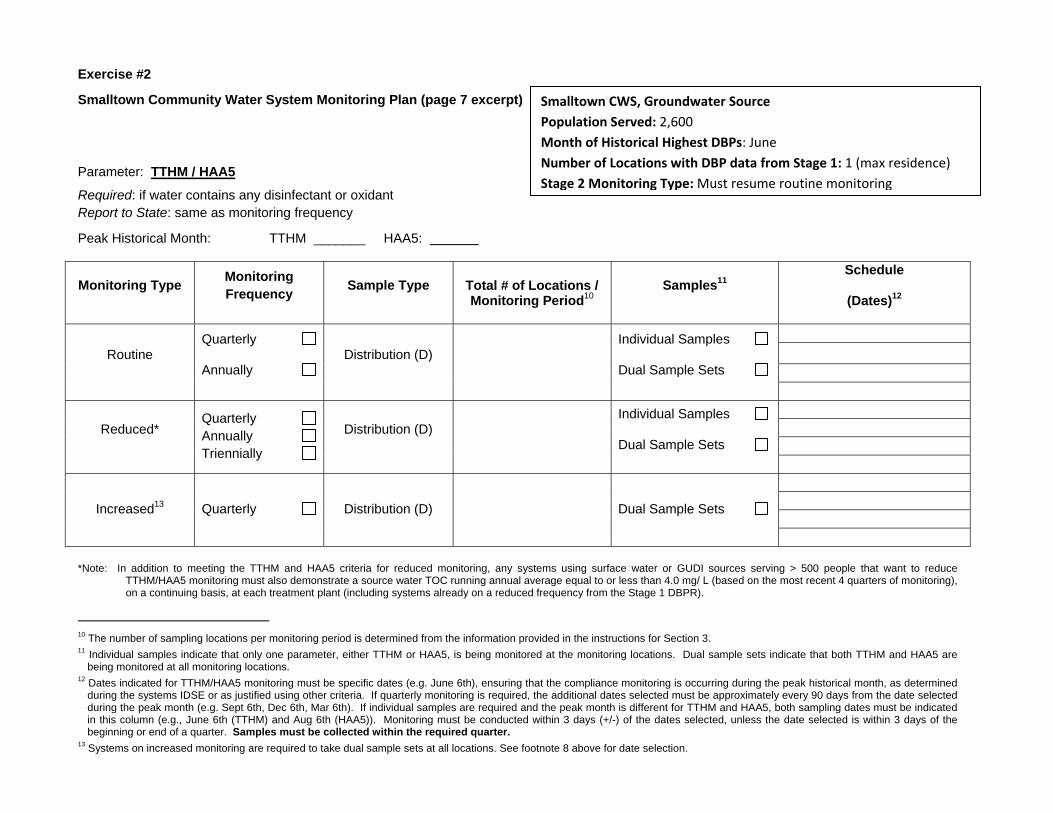
Exercise #2
Smalltown Community Water System Monitoring Plan (page 7 excerpt)
Parameter: TTHM / HAA5
Required: if water contains any disinfectant or oxidant Report to State: same as monitoring frequency
Peak Historical Month: TTHM _______ HAA5:
Monitoring Type Monitoring Frequency
Sample Type Total # of Locations / Monitoring Period10
Samples11 Schedule
(Dates)12
Routine Quarterly
Annually Distribution (D)
Individual Samples
Dual Sample Sets
Reduced* Quarterly Annually Triennially
Distribution (D) Individual Samples
Dual Sample Sets
Increased13 Quarterly Distribution (D) Dual Sample Sets
*Note: In addition to meeting the TTHM and HAA5 criteria for reduced monitoring, any systems using surface water or GUDI sources serving > 500 people that want to reduce TTHM/HAA5 monitoring must also demonstrate a source water TOC running annual average equal to or less than 4.0 mg/ L (based on the most recent 4 quarters of monitoring), on a continuing basis, at each treatment plant (including systems already on a reduced frequency from the Stage 1 DBPR).
10 The number of sampling locations per monitoring period is determined from the information provided in the instructions for Section 3. 11 Individual samples indicate that only one parameter, either TTHM or HAA5, is being monitored at the monitoring locations. Dual sample sets indicate that both TTHM and HAA5 are
being monitored at all monitoring locations. 12 Dates indicated for TTHM/HAA5 monitoring must be specific dates (e.g. June 6th), ensuring that the compliance monitoring is occurring during the peak historical month, as determined
during the systems IDSE or as justified using other criteria. If quarterly monitoring is required, the additional dates selected must be approximately every 90 days from the date selected during the peak month (e.g. Sept 6th, Dec 6th, Mar 6th). If individual samples are required and the peak month is different for TTHM and HAA5, both sampling dates must be indicated in this column (e.g., June 6th (TTHM) and Aug 6th (HAA5)). Monitoring must be conducted within 3 days (+/-) of the dates selected, unless the date selected is within 3 days of the beginning or end of a quarter. Samples must be collected within the required quarter.
13 Systems on increased monitoring are required to take dual sample sets at all locations. See footnote 8 above for date selection.
Smalltown CWS, Groundwater Source
Population Served: 2,600
Month of Historical Highest DBPs: June
Number of Locations with DBP data from Stage 1: 1 (max residence)
Stage 2 Monitoring Type: Must resume routine monitoring
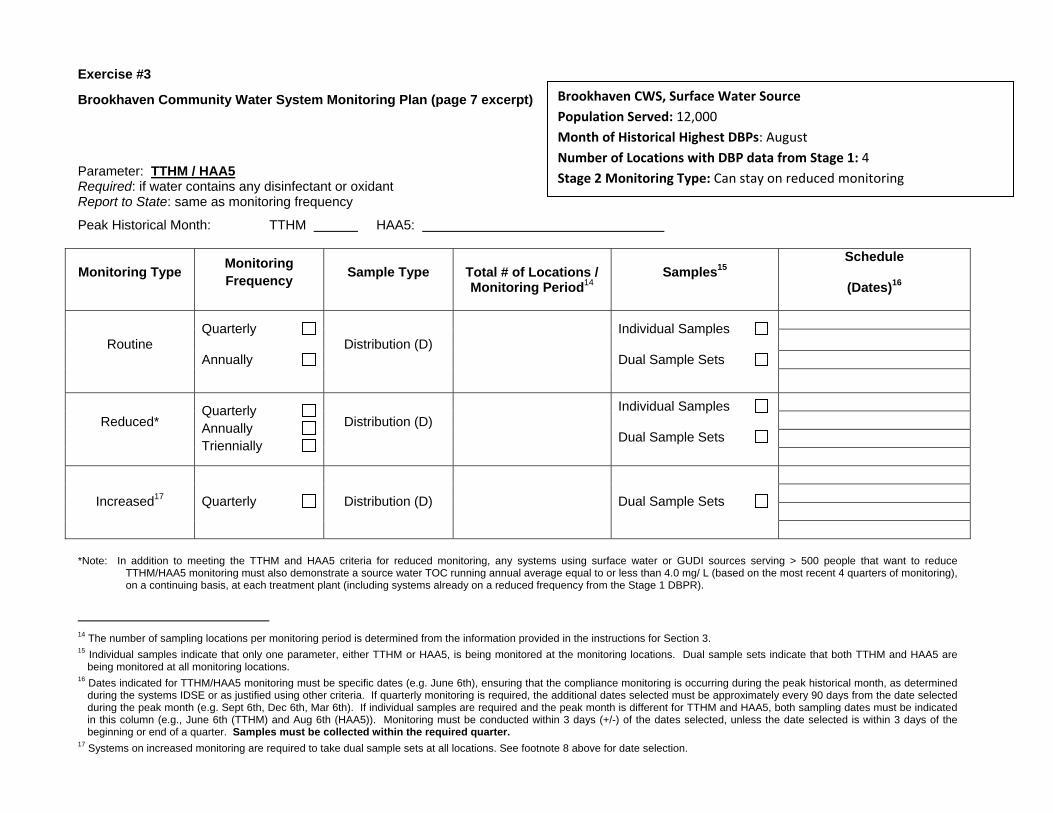
Exercise #3
Brookhaven Community Water System Monitoring Plan (page 7 excerpt)
Parameter: TTHM / HAA5 Required: if water contains any disinfectant or oxidant Report to State: same as monitoring frequency
Peak Historical Month: TTHM HAA5:
Monitoring Type Monitoring Frequency
Sample Type Total # of Locations / Monitoring Period14
Samples15 Schedule
(Dates)16
Routine Quarterly
Annually Distribution (D)
Individual Samples
Dual Sample Sets
Reduced* Quarterly Annually Triennially
Distribution (D) Individual Samples
Dual Sample Sets
Increased17 Quarterly Distribution (D) Dual Sample Sets
*Note: In addition to meeting the TTHM and HAA5 criteria for reduced monitoring, any systems using surface water or GUDI sources serving > 500 people that want to reduce TTHM/HAA5 monitoring must also demonstrate a source water TOC running annual average equal to or less than 4.0 mg/ L (based on the most recent 4 quarters of monitoring), on a continuing basis, at each treatment plant (including systems already on a reduced frequency from the Stage 1 DBPR).
14 The number of sampling locations per monitoring period is determined from the information provided in the instructions for Section 3. 15 Individual samples indicate that only one parameter, either TTHM or HAA5, is being monitored at the monitoring locations. Dual sample sets indicate that both TTHM and HAA5 are
being monitored at all monitoring locations. 16 Dates indicated for TTHM/HAA5 monitoring must be specific dates (e.g. June 6th), ensuring that the compliance monitoring is occurring during the peak historical month, as determined
during the systems IDSE or as justified using other criteria. If quarterly monitoring is required, the additional dates selected must be approximately every 90 days from the date selected during the peak month (e.g. Sept 6th, Dec 6th, Mar 6th). If individual samples are required and the peak month is different for TTHM and HAA5, both sampling dates must be indicated in this column (e.g., June 6th (TTHM) and Aug 6th (HAA5)). Monitoring must be conducted within 3 days (+/-) of the dates selected, unless the date selected is within 3 days of the beginning or end of a quarter. Samples must be collected within the required quarter.
17 Systems on increased monitoring are required to take dual sample sets at all locations. See footnote 8 above for date selection.
Brookhaven CWS, Surface Water Source
Population Served: 12,000
Month of Historical Highest DBPs: August
Number of Locations with DBP data from Stage 1: 4
Stage 2 Monitoring Type: Can stay on reduced monitoring
2012 DBP Stage 2 Staff Training Lesson 6: Monitoring Plans
6‐14
Surface Water Systems Completing the Monitoring Plan:
Surface water and GUDI systems have additional requirements for TOC monitoring (Pages 10 and 11 of the Monitoring Plan Template). For more explanations, please see the additional TOC information at the ends of chapters 4 and 6.
Key Reminders:
Even if a system qualifies for reduced monitoring under Stage 2, the monitoring plan must still include the required number of routine monitoring sites (and therefore increased monitoring as well). Quarterly dates identified for increased monitoring only apply if/when the system triggers increased monitoring (we need them now to program into PADWIS).
If not enough locations from Stage 1, follow the procedure and recommendations to determine “expected” highest HAA5 and TTHM
How to obtain templates from the eLibrary:
o Go to: http://www.elibrary.dep.state.pa.us/
o Click on “Forms”
o “Bureau of Safe Drinking Water”
o In the Search box in the top right type “monitoring plan”
The monitoring plan sets locations for the 1st round of monitoring. Locations may change after routine or increased monitoring based on the most recent data.
Appendix A
IDSE Report Form Addendum

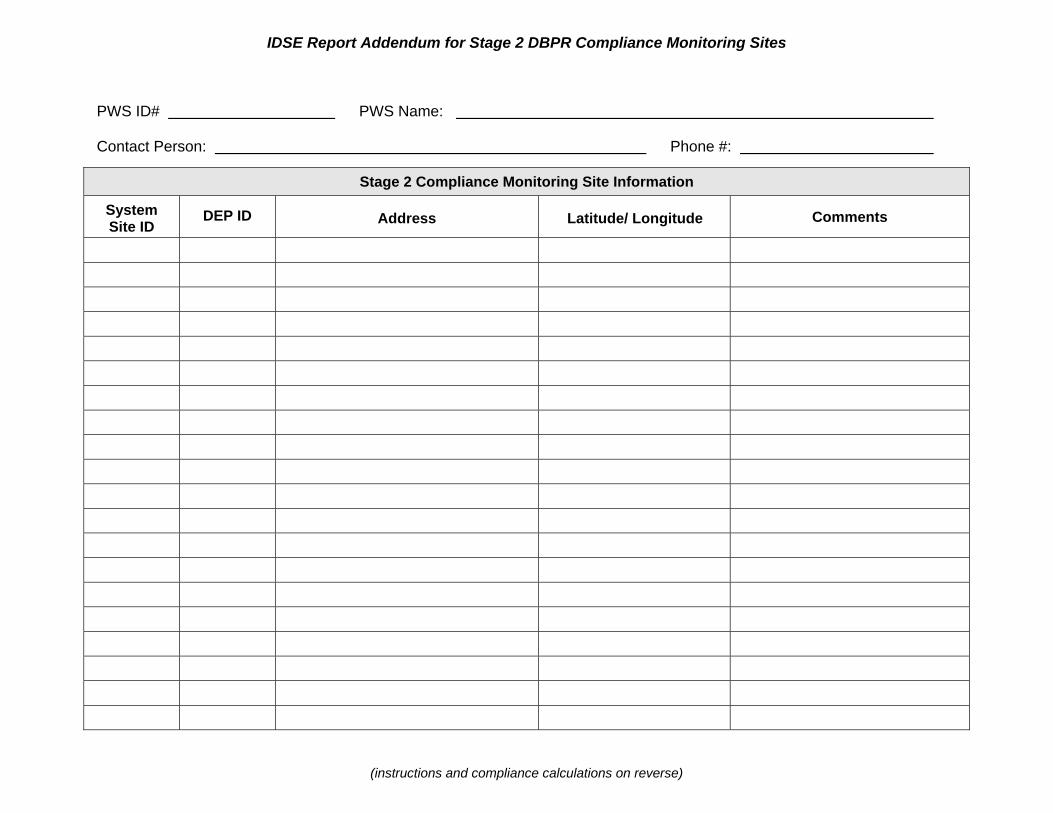
IDSE Report Addendum for Stage 2 DBPR Compliance Monitoring Sites
(instructions and compliance calculations on reverse)
PWS ID# PWS Name:
Contact Person: Phone #:
Stage 2 Compliance Monitoring Site Information
System Site ID
DEP ID Address Latitude/ Longitude Comments
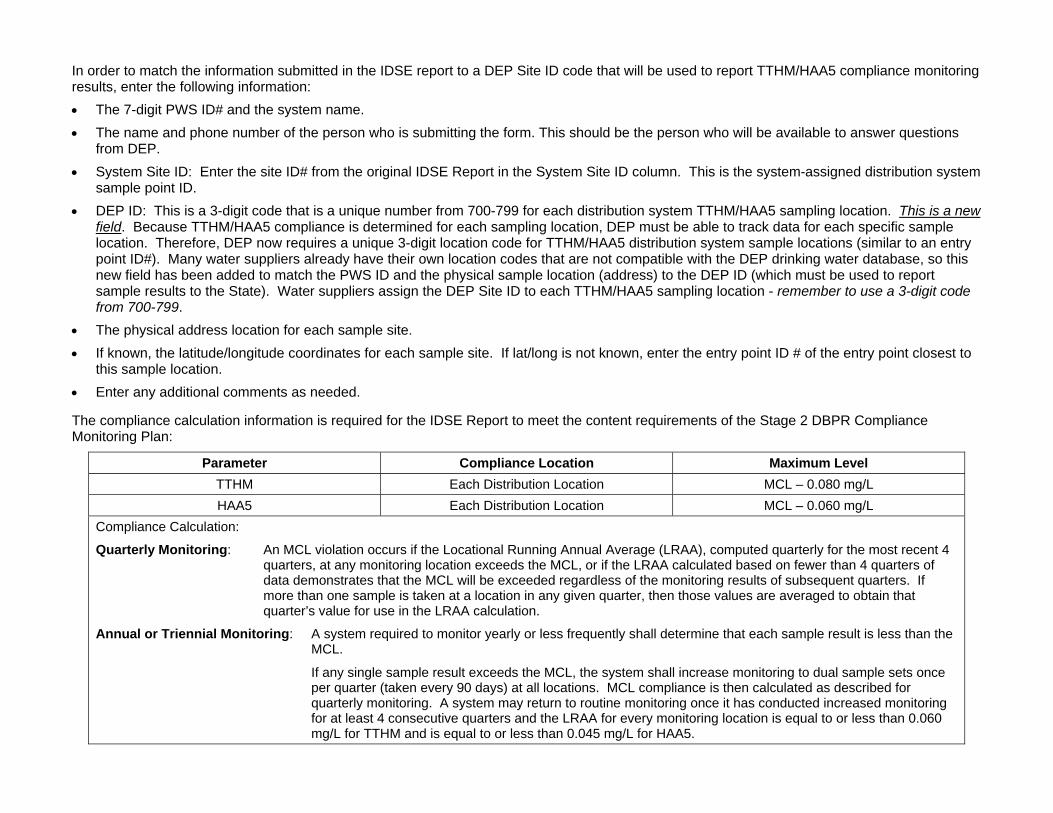
In order to match the information submitted in the IDSE report to a DEP Site ID code that will be used to report TTHM/HAA5 compliance monitoring results, enter the following information:
The 7-digit PWS ID# and the system name.
The name and phone number of the person who is submitting the form. This should be the person who will be available to answer questions from DEP.
System Site ID: Enter the site ID# from the original IDSE Report in the System Site ID column. This is the system-assigned distribution system sample point ID.
DEP ID: This is a 3-digit code that is a unique number from 700-799 for each distribution system TTHM/HAA5 sampling location. This is a new field. Because TTHM/HAA5 compliance is determined for each sampling location, DEP must be able to track data for each specific sample location. Therefore, DEP now requires a unique 3-digit location code for TTHM/HAA5 distribution system sample locations (similar to an entry point ID#). Many water suppliers already have their own location codes that are not compatible with the DEP drinking water database, so this new field has been added to match the PWS ID and the physical sample location (address) to the DEP ID (which must be used to report sample results to the State). Water suppliers assign the DEP Site ID to each TTHM/HAA5 sampling location - remember to use a 3-digit code from 700-799.
The physical address location for each sample site.
If known, the latitude/longitude coordinates for each sample site. If lat/long is not known, enter the entry point ID # of the entry point closest to this sample location.
Enter any additional comments as needed.
The compliance calculation information is required for the IDSE Report to meet the content requirements of the Stage 2 DBPR Compliance Monitoring Plan:
Parameter Compliance Location Maximum Level
TTHM Each Distribution Location MCL – 0.080 mg/L
HAA5 Each Distribution Location MCL – 0.060 mg/L
Compliance Calculation:
Quarterly Monitoring: An MCL violation occurs if the Locational Running Annual Average (LRAA), computed quarterly for the most recent 4 quarters, at any monitoring location exceeds the MCL, or if the LRAA calculated based on fewer than 4 quarters of data demonstrates that the MCL will be exceeded regardless of the monitoring results of subsequent quarters. If more than one sample is taken at a location in any given quarter, then those values are averaged to obtain that quarter’s value for use in the LRAA calculation.
Annual or Triennial Monitoring: A system required to monitor yearly or less frequently shall determine that each sample result is less than the MCL.
If any single sample result exceeds the MCL, the system shall increase monitoring to dual sample sets once per quarter (taken every 90 days) at all locations. MCL compliance is then calculated as described for quarterly monitoring. A system may return to routine monitoring once it has conducted increased monitoring for at least 4 consecutive quarters and the LRAA for every monitoring location is equal to or less than 0.060 mg/L for TTHM and is equal to or less than 0.045 mg/L for HAA5.
Appendix B
Compliance Monitoring Summary Table

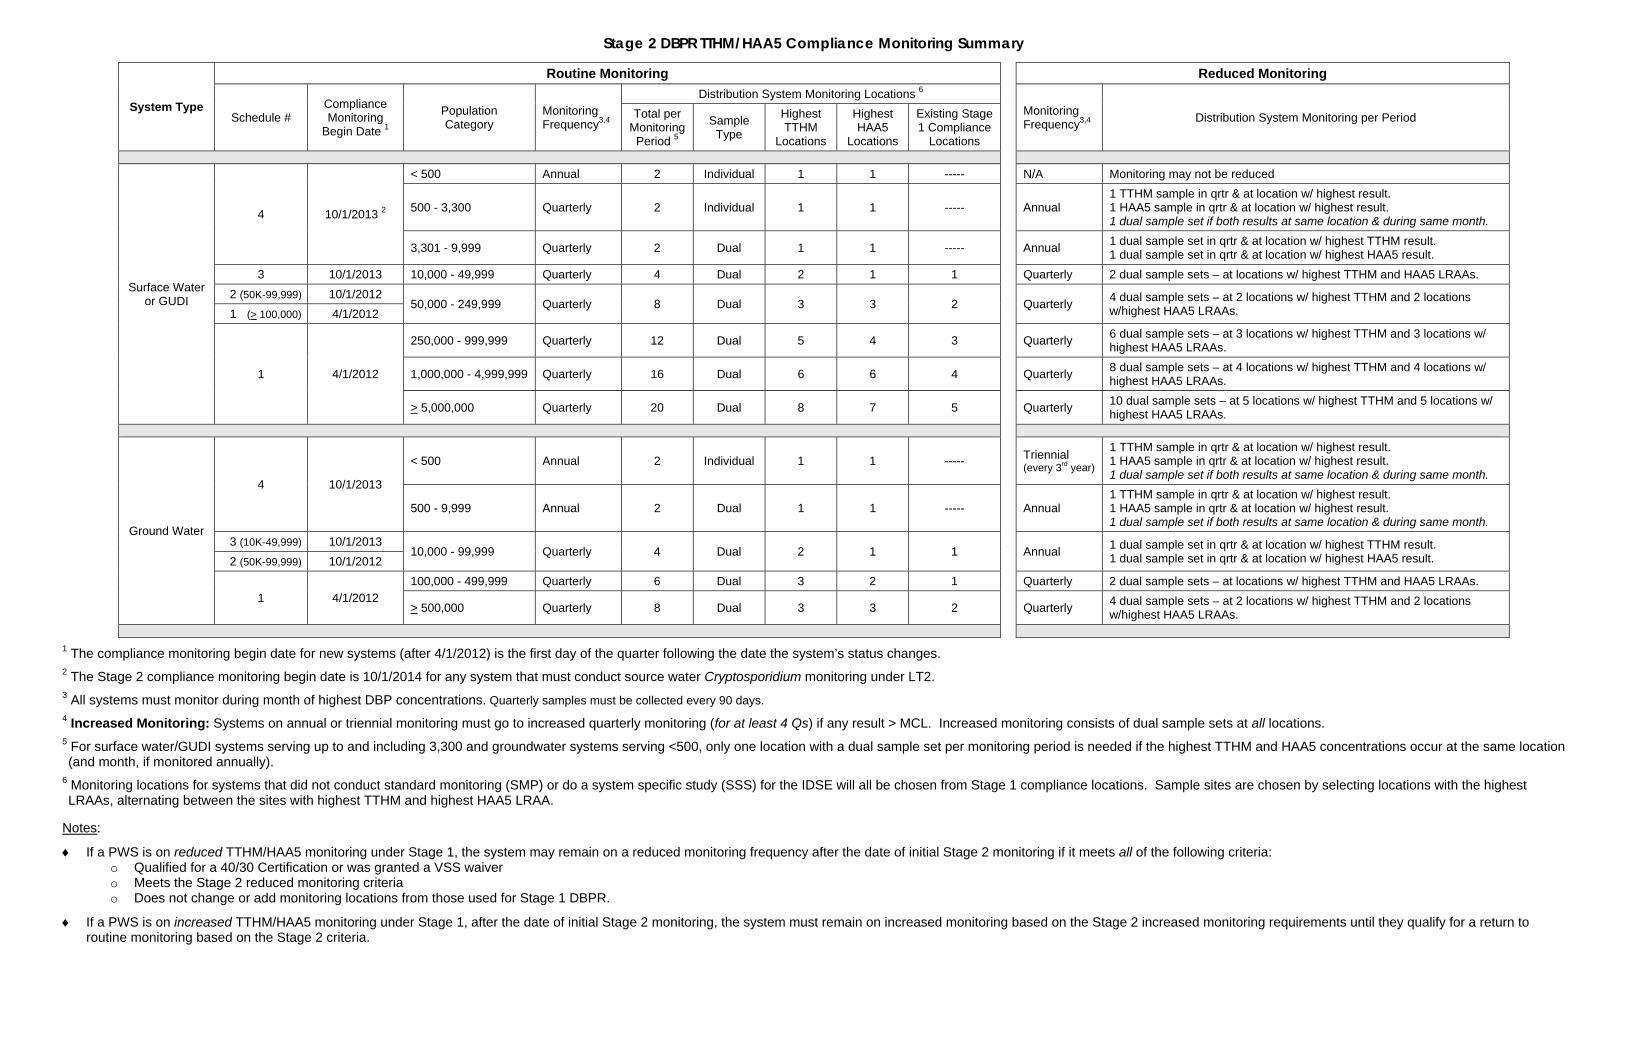
Stage 2 DBPR TTHM/HAA5 Compliance Monitoring Summary
System Type
Routine Monitoring
Reduced Monitoring
Schedule # Compliance Monitoring
Begin Date 1
Population Category
Monitoring Frequency3,4
Distribution System Monitoring Locations 6 Monitoring Frequency3,4
Distribution System Monitoring per Period Total per Monitoring
Period 5
Sample Type
Highest TTHM
Locations
Highest HAA5
Locations
Existing Stage 1 Compliance
Locations
Surface Water or GUDI
4 10/1/2013 2
< 500 Annual 2 Individual 1 1 ----- N/A Monitoring may not be reduced
500 - 3,300 Quarterly 2 Individual 1 1 ----- Annual 1 TTHM sample in qrtr & at location w/ highest result. 1 HAA5 sample in qrtr & at location w/ highest result. 1 dual sample set if both results at same location & during same month.
3,301 - 9,999 Quarterly 2 Dual 1 1 ----- Annual 1 dual sample set in qrtr & at location w/ highest TTHM result. 1 dual sample set in qrtr & at location w/ highest HAA5 result.
3 10/1/2013 10,000 - 49,999 Quarterly 4 Dual 2 1 1 Quarterly 2 dual sample sets – at locations w/ highest TTHM and HAA5 LRAAs.
2 (50K-99,999) 10/1/2012 50,000 - 249,999 Quarterly 8 Dual 3 3 2 Quarterly
4 dual sample sets – at 2 locations w/ highest TTHM and 2 locations w/highest HAA5 LRAAs. 1 (> 100,000) 4/1/2012
1 4/1/2012
250,000 - 999,999 Quarterly 12 Dual 5 4 3 Quarterly 6 dual sample sets – at 3 locations w/ highest TTHM and 3 locations w/ highest HAA5 LRAAs.
1,000,000 - 4,999,999 Quarterly 16 Dual 6 6 4 Quarterly 8 dual sample sets – at 4 locations w/ highest TTHM and 4 locations w/ highest HAA5 LRAAs.
> 5,000,000 Quarterly 20 Dual 8 7 5 Quarterly 10 dual sample sets – at 5 locations w/ highest TTHM and 5 locations w/ highest HAA5 LRAAs.
Ground Water
4 10/1/2013
< 500 Annual 2 Individual 1 1 ----- Triennial (every 3rd year)
1 TTHM sample in qrtr & at location w/ highest result. 1 HAA5 sample in qrtr & at location w/ highest result. 1 dual sample set if both results at same location & during same month.
500 - 9,999 Annual 2 Dual 1 1 ----- Annual 1 TTHM sample in qrtr & at location w/ highest result. 1 HAA5 sample in qrtr & at location w/ highest result. 1 dual sample set if both results at same location & during same month.
3 (10K-49,999) 10/1/2013 10,000 - 99,999 Quarterly 4 Dual 2 1 1 Annual
1 dual sample set in qrtr & at location w/ highest TTHM result. 1 dual sample set in qrtr & at location w/ highest HAA5 result. 2 (50K-99,999) 10/1/2012
1 4/1/2012
100,000 - 499,999 Quarterly 6 Dual 3 2 1 Quarterly 2 dual sample sets – at locations w/ highest TTHM and HAA5 LRAAs.
> 500,000 Quarterly 8 Dual 3 3 2 Quarterly 4 dual sample sets – at 2 locations w/ highest TTHM and 2 locations w/highest HAA5 LRAAs.
1 The compliance monitoring begin date for new systems (after 4/1/2012) is the first day of the quarter following the date the system’s status changes. 2 The Stage 2 compliance monitoring begin date is 10/1/2014 for any system that must conduct source water Cryptosporidium monitoring under LT2. 3 All systems must monitor during month of highest DBP concentrations. Quarterly samples must be collected every 90 days. 4 Increased Monitoring: Systems on annual or triennial monitoring must go to increased quarterly monitoring (for at least 4 Qs) if any result > MCL. Increased monitoring consists of dual sample sets at all locations. 5 For surface water/GUDI systems serving up to and including 3,300 and groundwater systems serving <500, only one location with a dual sample set per monitoring period is needed if the highest TTHM and HAA5 concentrations occur at the same location (and month, if monitored annually).
6 Monitoring locations for systems that did not conduct standard monitoring (SMP) or do a system specific study (SSS) for the IDSE will all be chosen from Stage 1 compliance locations. Sample sites are chosen by selecting locations with the highest LRAAs, alternating between the sites with highest TTHM and highest HAA5 LRAA.
Notes:
If a PWS is on reduced TTHM/HAA5 monitoring under Stage 1, the system may remain on a reduced monitoring frequency after the date of initial Stage 2 monitoring if it meets all of the following criteria: o Qualified for a 40/30 Certification or was granted a VSS waiver o Meets the Stage 2 reduced monitoring criteria o Does not change or add monitoring locations from those used for Stage 1 DBPR.
If a PWS is on increased TTHM/HAA5 monitoring under Stage 1, after the date of initial Stage 2 monitoring, the system must remain on increased monitoring based on the Stage 2 increased monitoring requirements until they qualify for a return to routine monitoring based on the Stage 2 criteria.
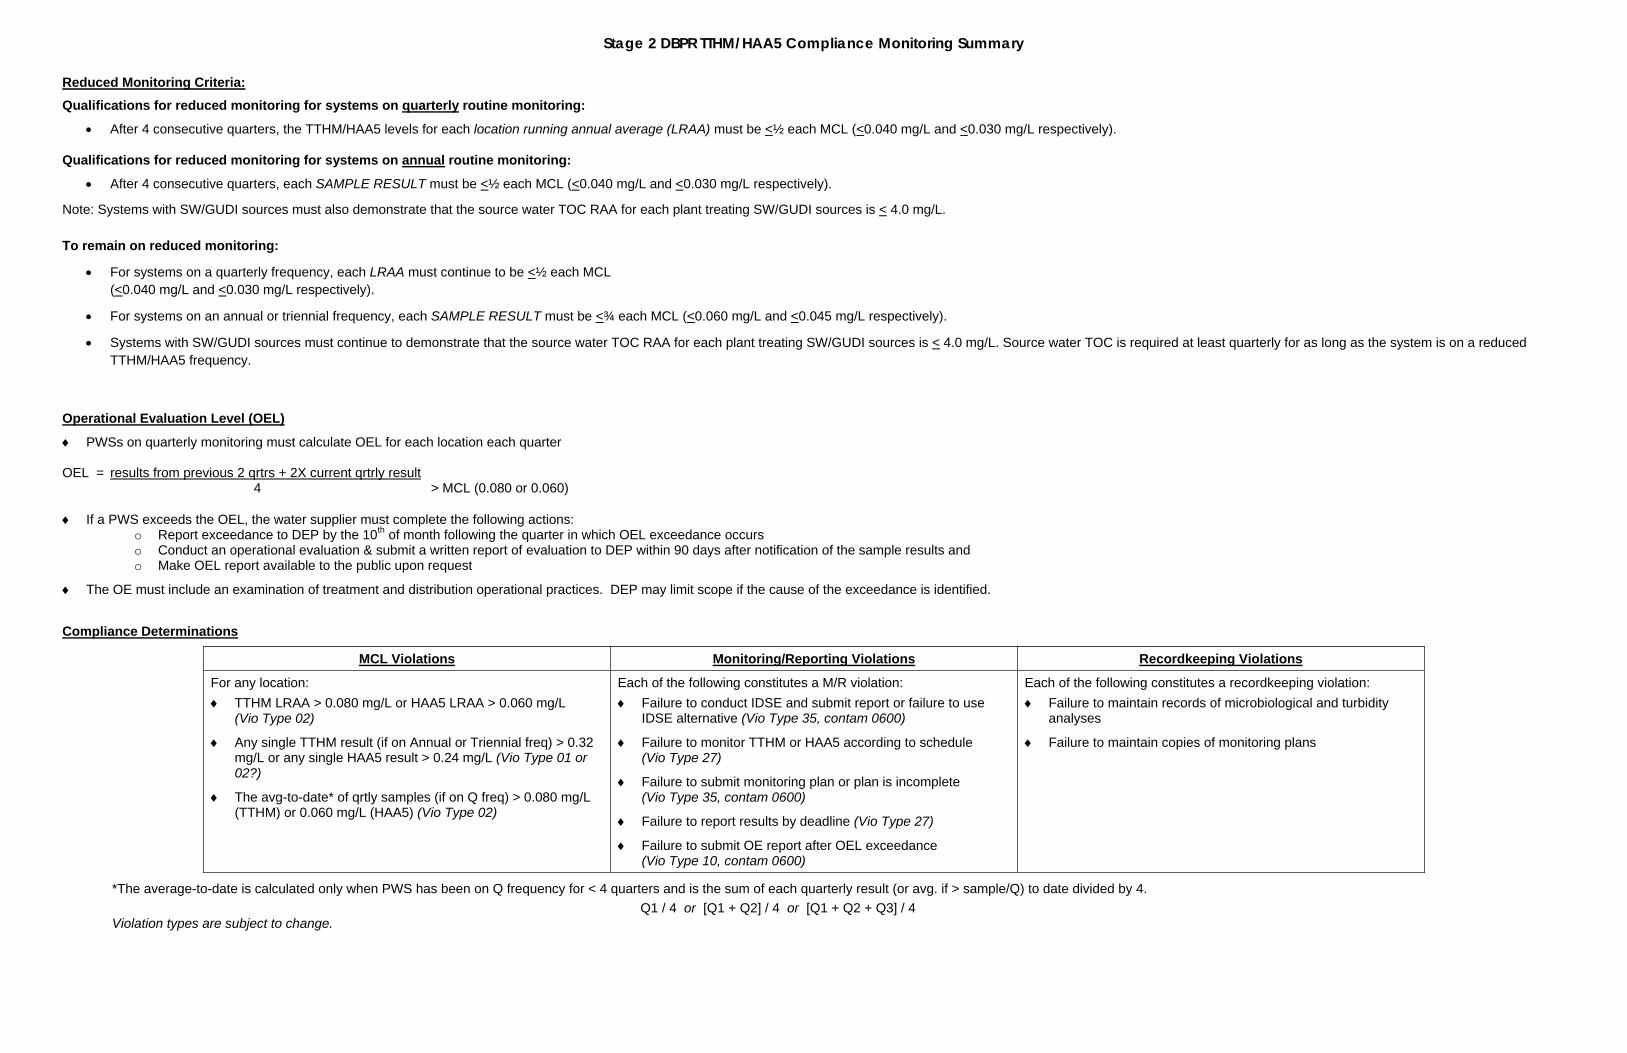
Stage 2 DBPR TTHM/HAA5 Compliance Monitoring Summary Reduced Monitoring Criteria:
Qualifications for reduced monitoring for systems on quarterly routine monitoring:
After 4 consecutive quarters, the TTHM/HAA5 levels for each location running annual average (LRAA) must be <½ each MCL (<0.040 mg/L and <0.030 mg/L respectively).
Qualifications for reduced monitoring for systems on annual routine monitoring:
After 4 consecutive quarters, each SAMPLE RESULT must be <½ each MCL (<0.040 mg/L and <0.030 mg/L respectively).
Note: Systems with SW/GUDI sources must also demonstrate that the source water TOC RAA for each plant treating SW/GUDI sources is < 4.0 mg/L.
To remain on reduced monitoring:
For systems on a quarterly frequency, each LRAA must continue to be <½ each MCL (<0.040 mg/L and <0.030 mg/L respectively).
For systems on an annual or triennial frequency, each SAMPLE RESULT must be <¾ each MCL (<0.060 mg/L and <0.045 mg/L respectively).
Systems with SW/GUDI sources must continue to demonstrate that the source water TOC RAA for each plant treating SW/GUDI sources is < 4.0 mg/L. Source water TOC is required at least quarterly for as long as the system is on a reduced TTHM/HAA5 frequency.
Operational Evaluation Level (OEL)
PWSs on quarterly monitoring must calculate OEL for each location each quarter OEL = results from previous 2 qrtrs + 2X current qrtrly result 4 > MCL (0.080 or 0.060) If a PWS exceeds the OEL, the water supplier must complete the following actions:
o Report exceedance to DEP by the 10th of month following the quarter in which OEL exceedance occurs o Conduct an operational evaluation & submit a written report of evaluation to DEP within 90 days after notification of the sample results and o Make OEL report available to the public upon request
The OE must include an examination of treatment and distribution operational practices. DEP may limit scope if the cause of the exceedance is identified.
Compliance Determinations
MCL Violations Monitoring/Reporting Violations Recordkeeping Violations
For any location:
TTHM LRAA > 0.080 mg/L or HAA5 LRAA > 0.060 mg/L (Vio Type 02)
Any single TTHM result (if on Annual or Triennial freq) > 0.32 mg/L or any single HAA5 result > 0.24 mg/L (Vio Type 01 or 02?)
The avg-to-date* of qrtly samples (if on Q freq) > 0.080 mg/L (TTHM) or 0.060 mg/L (HAA5) (Vio Type 02)
Each of the following constitutes a M/R violation:
Failure to conduct IDSE and submit report or failure to use IDSE alternative (Vio Type 35, contam 0600)
Failure to monitor TTHM or HAA5 according to schedule (Vio Type 27)
Failure to submit monitoring plan or plan is incomplete (Vio Type 35, contam 0600)
Failure to report results by deadline (Vio Type 27)
Failure to submit OE report after OEL exceedance (Vio Type 10, contam 0600)
Each of the following constitutes a recordkeeping violation:
Failure to maintain records of microbiological and turbidity analyses
Failure to maintain copies of monitoring plans
*The average-to-date is calculated only when PWS has been on Q frequency for < 4 quarters and is the sum of each quarterly result (or avg. if > sample/Q) to date divided by 4.
Q1 / 4 or [Q1 + Q2] / 4 or [Q1 + Q2 + Q3] / 4 Violation types are subject to change.
Appendix C
Example Full Operational Evaluation and Report

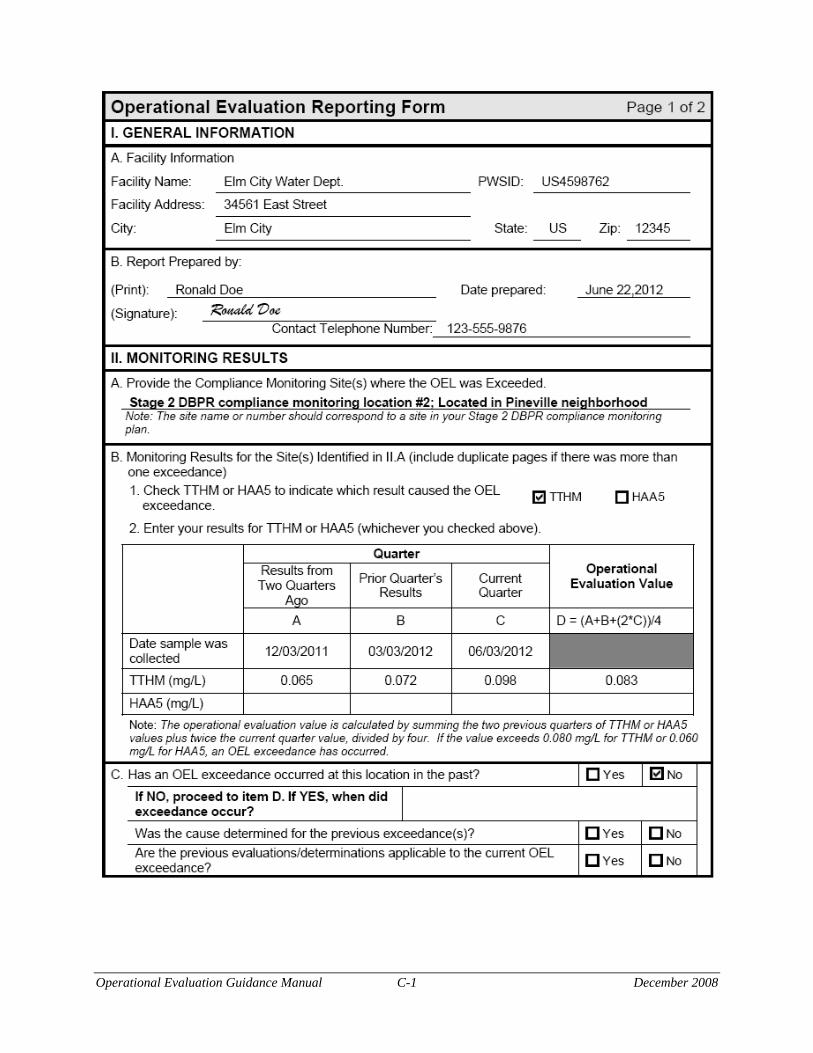
Operational Evaluation Guidance Manual C-1 December 2008
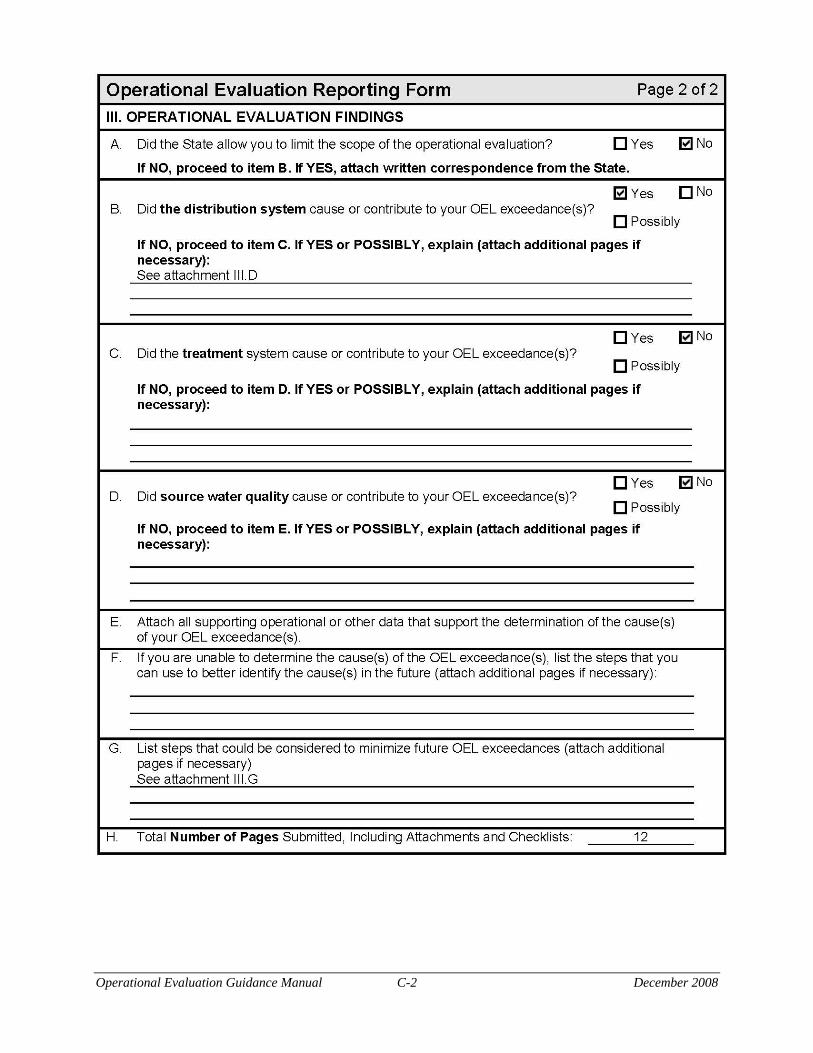
Operational Evaluation Guidance Manual C-2 December 2008
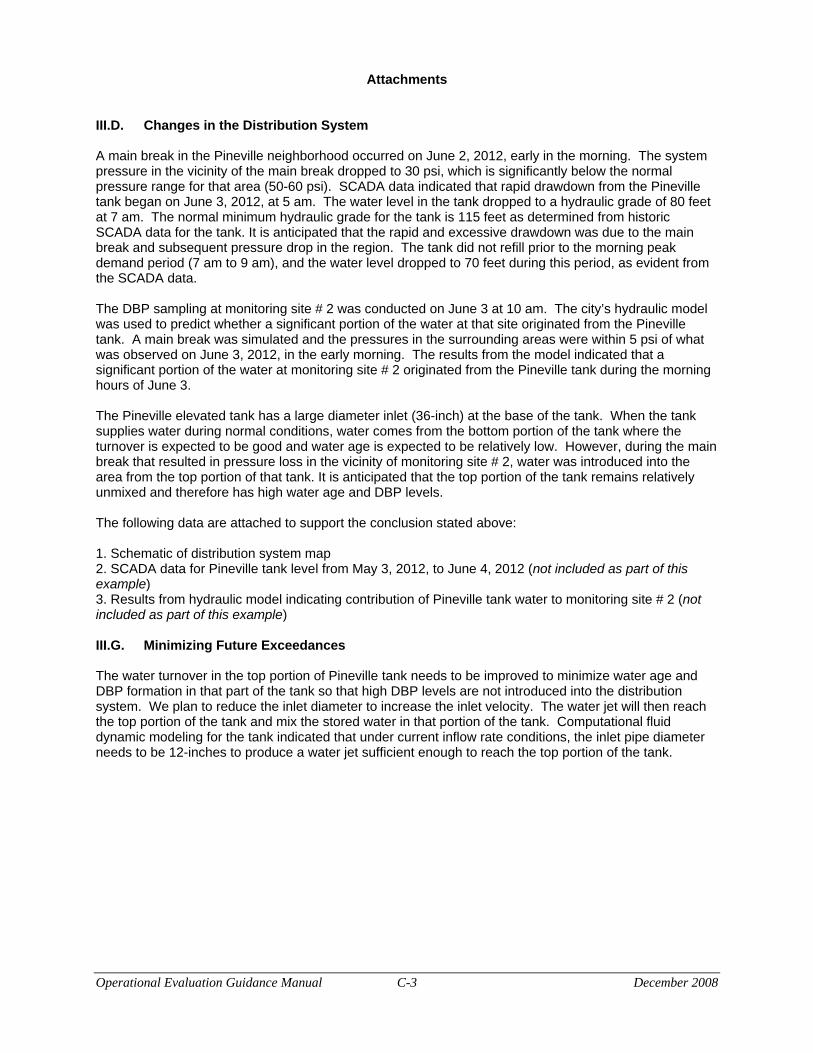
Attachments
III.D. Changes in the Distribution System
A main break in the Pineville neighborhood occurred on June 2, 2012, early in the morning. The system pressure in the vicinity of the main break dropped to 30 psi, which is significantly below the normal pressure range for that area (50-60 psi). SCADA data indicated that rapid drawdown from the Pineville tank began on June 3, 2012, at 5 am. The water level in the tank dropped to a hydraulic grade of 80 feet at 7 am. The normal minimum hydraulic grade for the tank is 115 feet as determined from historic SCADA data for the tank. It is anticipated that the rapid and excessive drawdown was due to the main break and subsequent pressure drop in the region. The tank did not refill prior to the morning peak demand period (7 am to 9 am), and the water level dropped to 70 feet during this period, as evident from the SCADA data.
The DBP sampling at monitoring site # 2 was conducted on June 3 at 10 am. The city’s hydraulic model was used to predict whether a significant portion of the water at that site originated from the Pineville tank. A main break was simulated and the pressures in the surrounding areas were within 5 psi of what was observed on June 3, 2012, in the early morning. The results from the model indicated that a significant portion of the water at monitoring site # 2 originated from the Pineville tank during the morning hours of June 3.
The Pineville elevated tank has a large diameter inlet (36-inch) at the base of the tank. When the tank supplies water during normal conditions, water comes from the bottom portion of the tank where the turnover is expected to be good and water age is expected to be relatively low. However, during the main break that resulted in pressure loss in the vicinity of monitoring site # 2, water was introduced into the area from the top portion of that tank. It is anticipated that the top portion of the tank remains relatively unmixed and therefore has high water age and DBP levels.
The following data are attached to support the conclusion stated above:
1. Schematic of distribution system map 2. SCADA data for Pineville tank level from May 3, 2012, to June 4, 2012 (not included as part of this example) 3. Results from hydraulic model indicating contribution of Pineville tank water to monitoring site # 2 (not included as part of this example)
III.G. Minimizing Future Exceedances
The water turnover in the top portion of Pineville tank needs to be improved to minimize water age and DBP formation in that part of the tank so that high DBP levels are not introduced into the distribution system. We plan to reduce the inlet diameter to increase the inlet velocity. The water jet will then reach the top portion of the tank and mix the stored water in that portion of the tank. Computational fluid dynamic modeling for the tank indicated that under current inflow rate conditions, the inlet pipe diameter needs to be 12-inches to produce a water jet sufficient enough to reach the top portion of the tank.
Operational Evaluation Guidance Manual C-3 December 2008
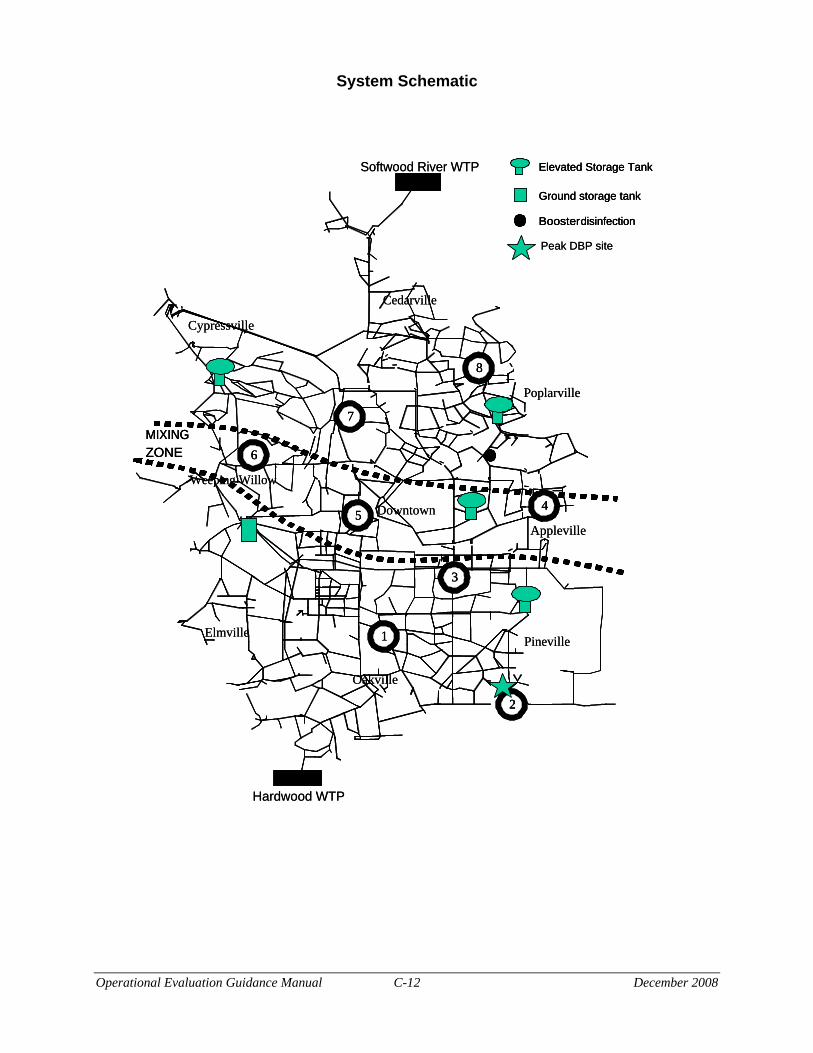
System Schematic
Softwood River WTP Elevated Storage TankSoftwood River WTP Elevated Storage TankElevated Storage Tank
Ground storage tankGround storage tankGround storage tank
BoosterdisinfectionBoosterBoosterdisinfectiondisinfection
Peak DBP sitePeak DBP site
CedarvilleCedarville
CypressvilleCypressville
888
777
666
PoplarvillePoplarville
MIXINGMIXINGMIXINGZONEZONEZONE
Weeping WillowWeeping Willow
DowntownDowntown 444555
ApplevilleAppleville
333
111ElmvilleElmvillePinevillePineville
OakvilleOakville
Hardwood WTPHardwood WTP
222
Operational Evaluation Guidance Manual C-12 December 2008
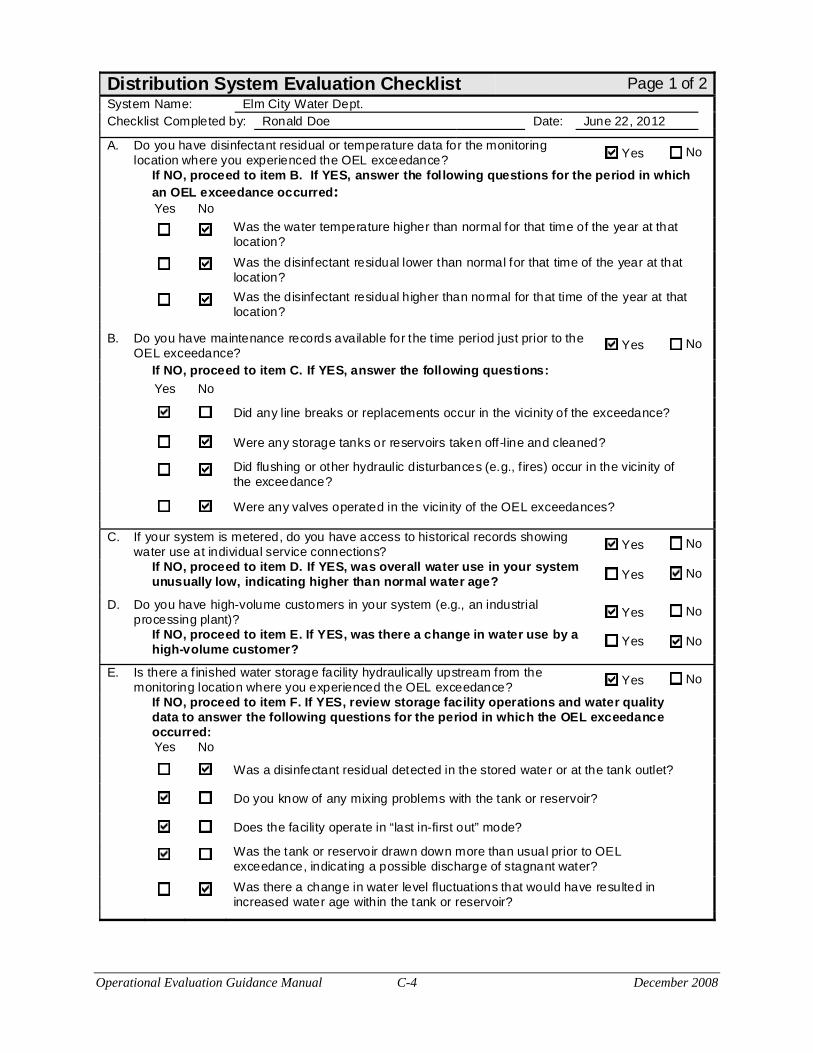
Distribution System Evaluation Checklist Page 1 of 2 System Name: Elm City Water Dept. Checklist Completed by: Ronald Doe Date: June 22, 2012
A. Do you have disinfectant residual or temperature data for the monitoring location where you experienced the OEL exceedance? Yes No
If NO, proceed to item B. If YES, answer the following questions for the period in which an OEL exceedance occurred:
Yes No
Was the water temperature higher than normal for that time of the year at that location?
Was the disinfectant residual lower than normal for that time of the year at that location?
Was the disinfectant residual higher than normal for that time of the year at that location?
B. Do you have maintenance records available for the t ime period just prior to the OEL exceedance?
Yes No
If NO, proceed to item C. If YES, answer the following questions:
Yes No
Did any line breaks or replacements occur in the vicinity of the exceedance?
Were any storage tanks or reservoirs taken off-line and cleaned?
Did flushing or other hydraulic disturbances (e.g., f ires) occur in the vicinity of the exceedance?
Were any valves operated in the vicinity of the OEL exceedances?
C. If your system is metered, do you have access to historical records showing water use at individual service connections? Yes No
If NO, proceed to item D. If YES, was overall water use in your system unusually low, indicating higher than normal water age? Yes No
D. Do you have high-volume customers in your system (e.g., an industrial processing plant)?
Yes No
If NO, proceed to item E. If YES, was there a change in water use by a high-volume customer?
Yes No
E. Is there a f inished water storage facility hydraulically upstream from the monitoring location where you experienced the OEL exceedance?
Yes No
If NO, proceed to item F. If YES, review storage facility operations and water quality data to answer the following questions for the period in which the OEL exceedance occurred:
Yes No
Was a disinfectant residual detected in the stored water or at the tank outlet?
Do you know of any mixing problems with the tank or reservoir?
Does the facility operate in “last in-first out” mode?
Was the tank or reservoir drawn down more than usual prior to OEL exceedance, indicating a possible discharge of stagnant water?
Was there a change in water level fluctuations that would have resulted in increased water age within the tank or reservoir?
Operational Evaluation Guidance Manual C-4 December 2008
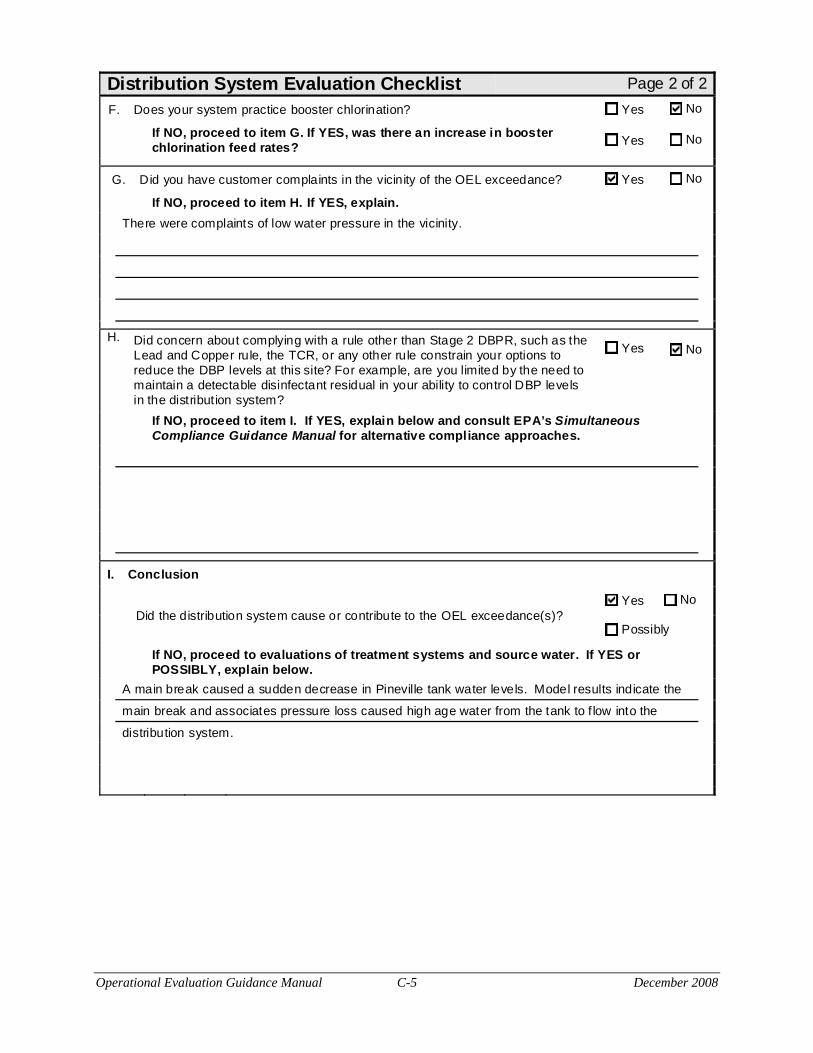
Distribution System Evaluation Checklist Page 2 of 2
F. Does your system practice booster chlorination? Yes No
If NO, proceed to item G. If YES, was there an increase in booster chlorination feed rates?
Yes No
G. Did you have customer complaints in the vicinity of the OEL exceedance? Yes No
If NO, proceed to item H. If YES, explain.
There were complaints of low water pressure in the vicinity.
H. Did concern about complying with a rule other than Stage 2 DBPR, such as the Lead and Copper rule, the TCR, or any other rule constrain your options to reduce the DBP levels at this site? For example, are you limited by the need to maintain a detectable disinfectant residual in your ability to control DBP levels in the distribution system?
Yes No
If NO, proceed to item I. If YES, explain below and consult EPA’s Simultaneous Compliance Guidance Manual for alternative compliance approaches.
I. Conclusion
Yes No Did the distribution system cause or contribute to the OEL exceedance(s)?
Possibly
If NO, proceed to evaluations of treatment systems and source water. If YES or POSSIBLY, explain below.
A main break caused a sudden decrease in Pineville tank water levels. Model results indicate the
main break and associates pressure loss caused high age water from the tank to f low into the
distribution system.
Operational Evaluation Guidance Manual C-5 December 2008
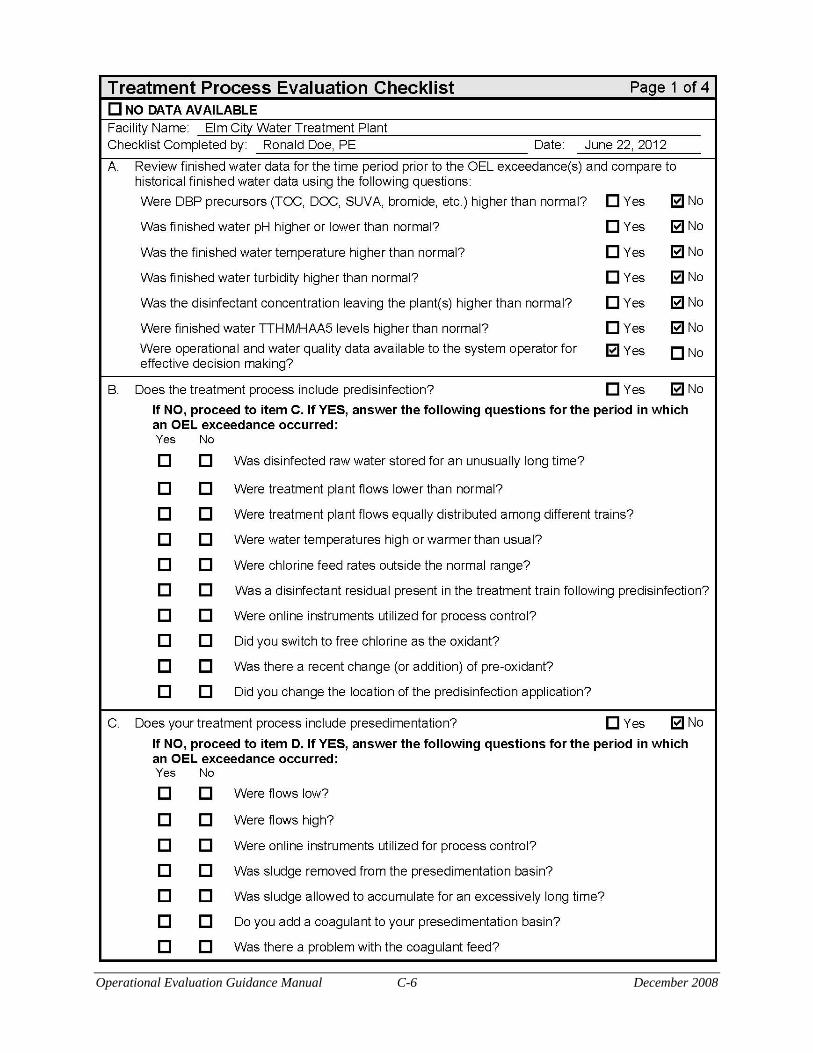
Operational Evaluation Guidance Manual C-6 December 2008
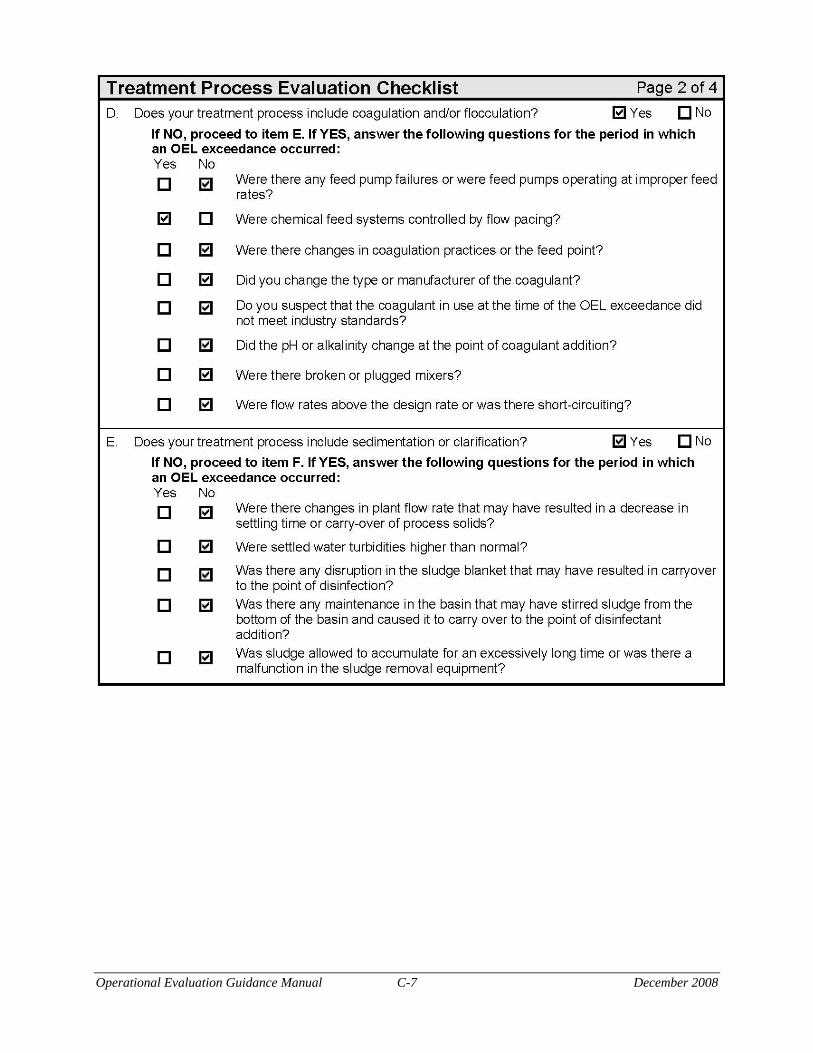
Operational Evaluation Guidance Manual C-7 December 2008
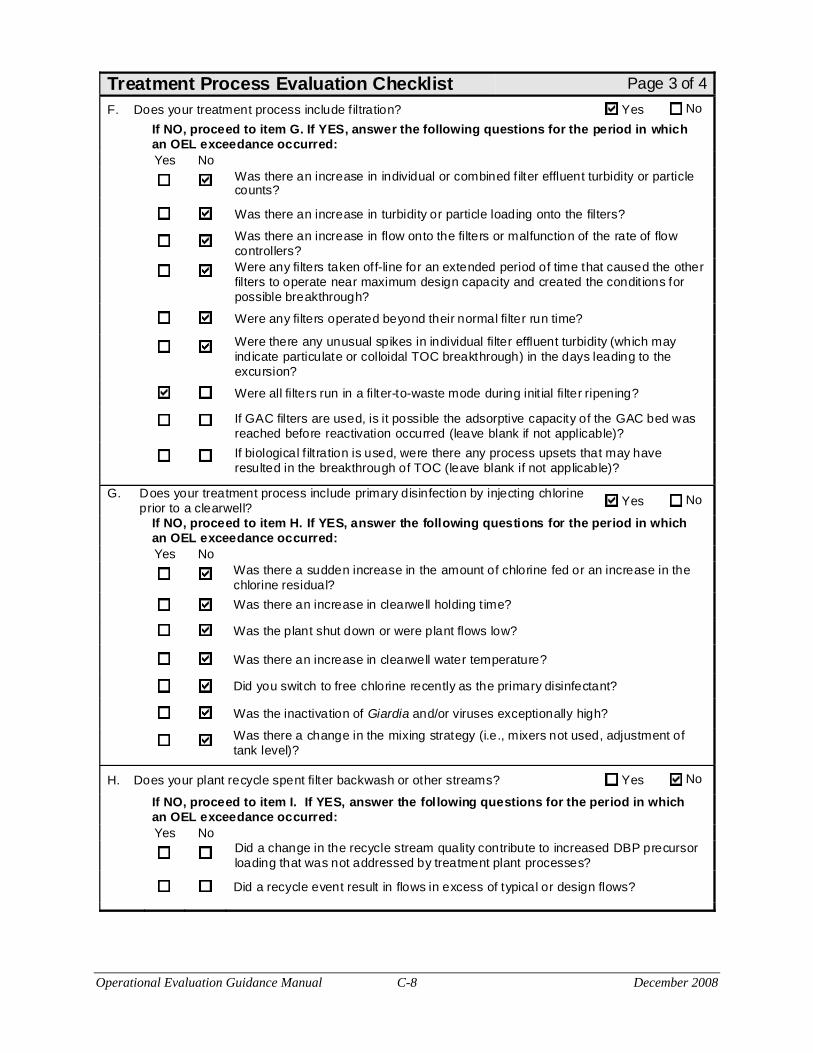
Treatment Process Evaluation Checklist Page 3 of 4
F. Does your treatment process include filtration? Yes No
If NO, proceed to item G. If YES, answer the following questions for the period in which an OEL exceedance occurred:
Yes No Was there an increase in individual or combined f ilter effluent turbidity or particle counts?
Was there an increase in turbidity or particle loading onto the filters?
Was there an increase in flow onto the filters or malfunction of the rate of flow controllers? Were any filters taken off-line for an extended period of time that caused the other filters to operate near maximum design capacity and created the condit ions for possible breakthrough?
Were any filters operated beyond their normal filter run time?
Were there any unusual spikes in individual filter effluent turbidity (which may indicate particulate or colloidal TOC breakthrough) in the days leading to the excursion?
Were all filters run in a filter-to-waste mode during init ial filter ripening?
If GAC filters are used, is it possible the adsorptive capacity of the GAC bed was reached before reactivation occurred (leave blank if not applicable)?
If biological f iltration is used, were there any process upsets that may have resulted in the breakthrough of TOC (leave blank if not applicable)?
G. Does your treatment process include primary disinfection by injecting chlorine prior to a clearwell?
Yes No
If NO, proceed to item H. If YES, answer the following questions for the period in which an OEL exceedance occurred:
Yes No Was there a sudden increase in the amount of chlorine fed or an increase in the chlorine residual?
Was there an increase in clearwell holding time?
Was the plant shut down or were plant flows low?
Was there an increase in clearwell water temperature?
Did you switch to free chlorine recently as the primary disinfectant?
Was the inactivation of Giardia and/or viruses exceptionally high?
Was there a change in the mixing strategy (i.e., mixers not used, adjustment of tank level)?
H. Does your plant recycle spent filter backwash or other streams? Yes No
If NO, proceed to item I. If YES, answer the following questions for the period in which an OEL exceedance occurred:
Yes No Did a change in the recycle stream quality contribute to increased DBP precursor loading that was not addressed by treatment plant processes?
Did a recycle event result in flows in excess of typical or design flows?
Operational Evaluation Guidance Manual C-8 December 2008
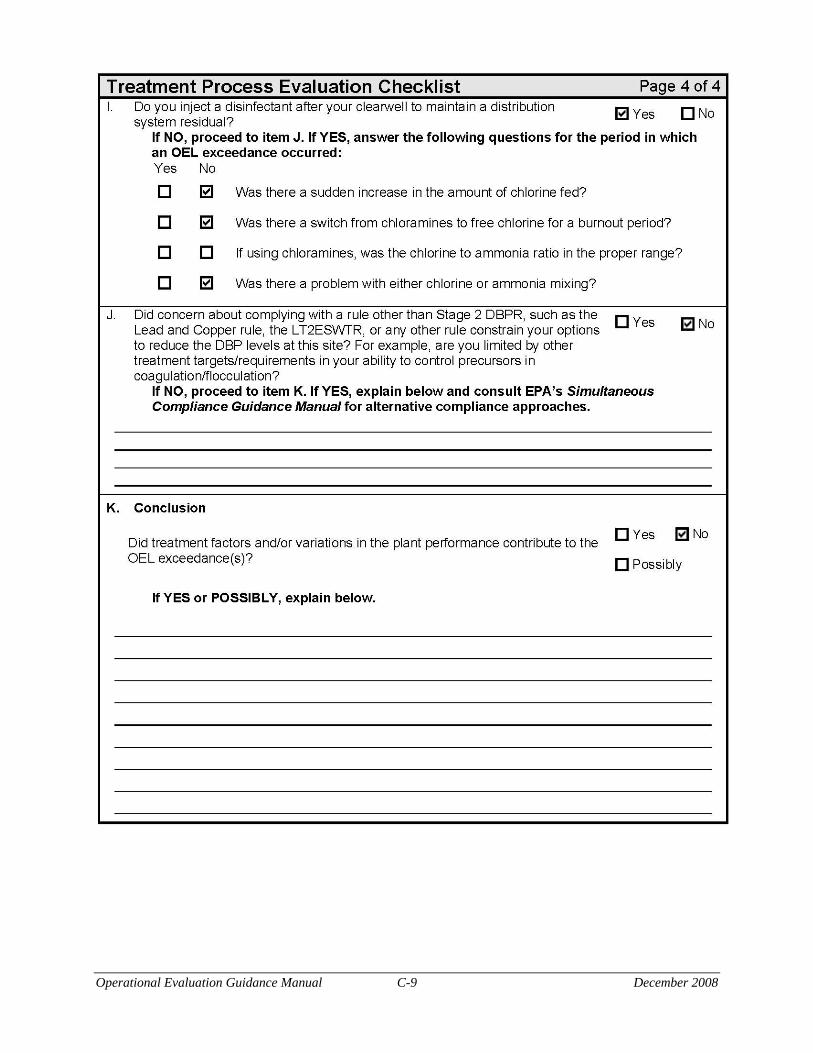
Operational Evaluation Guidance Manual C-9 December 2008
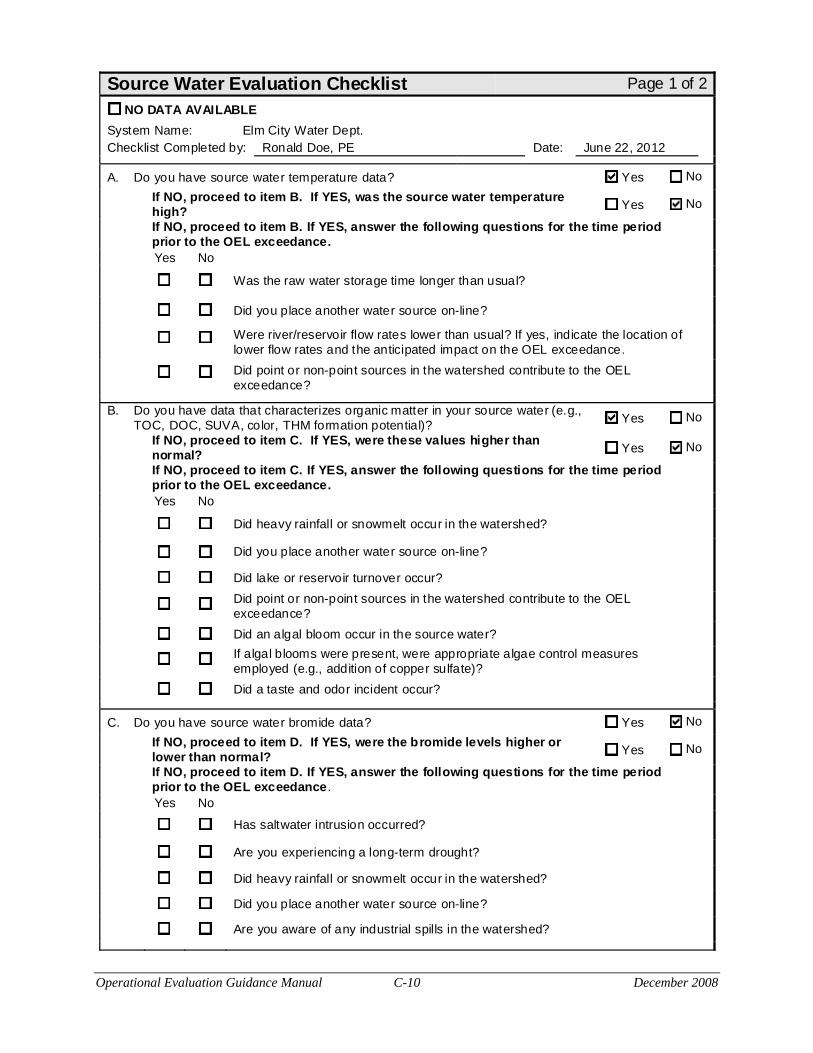
Source Water Evaluation Checklist Page 1 of 2
NO DATA AVAILABLE
System Name: Elm City Water Dept. Checklist Completed by: Ronald Doe, PE Date: June 22, 2012
A. Do you have source water temperature data? Yes No
If NO, proceed to item B. If YES, was the source water temperature high? Yes No
If NO, proceed to item B. If YES, answer the following questions for the time period prior to the OEL exceedance.
Yes No
Was the raw water storage time longer than usual?
Did you place another water source on-line?
Were river/reservoir flow rates lower than usual? If yes, indicate the location of lower flow rates and the anticipated impact on the OEL exceedance.
Did point or non-point sources in the watershed contribute to the OEL exceedance?
B. Do you have data that characterizes organic matter in your source water (e.g., TOC, DOC, SUVA, color, THM formation potential)? Yes No
If NO, proceed to item C. If YES, were these values higher than normal? Yes No
If NO, proceed to item C. If YES, answer the following questions for the time period prior to the OEL exceedance.
Yes No
Did heavy rainfall or snowmelt occur in the watershed?
Did you place another water source on-line?
Did lake or reservoir turnover occur?
Did point or non-point sources in the watershed contribute to the OEL exceedance?
Did an algal bloom occur in the source water?
If algal blooms were present, were appropriate algae control measures employed (e.g., addition of copper sulfate)?
Did a taste and odor incident occur?
C. Do you have source water bromide data? Yes No
If NO, proceed to item D. If YES, were the b romide levels higher or lower than normal? Yes No
If NO, proceed to item D. If YES, answer the following questions for the time period prior to the OEL exceedance.
Yes No
Has saltwater intrusion occurred?
Are you experiencing a long-term drought?
Did heavy rainfall or snowmelt occur in the watershed?
Did you place another water source on-line?
Are you aware of any industrial spills in the watershed?
Operational Evaluation Guidance Manual C-10 December 2008
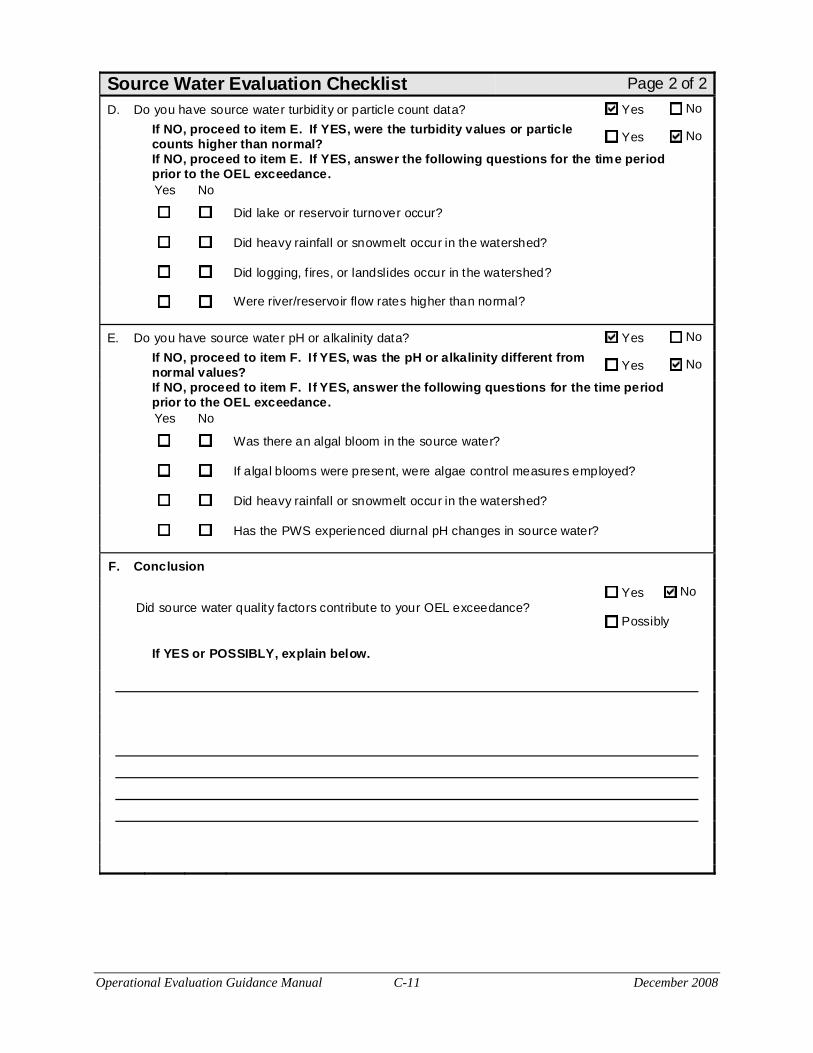
Source Water Evaluation Checklist Page 2 of 2
D. Do you have source water turbidity or particle count data? Yes No
If NO, proceed to item E. If YES, were the turbidity values or particle counts higher than normal? Yes No
If NO, proceed to item E. If YES, answer the following questions for the time period prior to the OEL exceedance.
Yes No
Did lake or reservoir turnover occur?
Did heavy rainfall or snowmelt occur in the watershed?
Did logging, f ires, or landslides occur in the watershed?
Were river/reservoir flow rates higher than normal?
E. Do you have source water pH or alkalinity data? Yes No
If NO, proceed to item F. If YES, was the pH or alkalinity different from normal values? Yes No
If NO, proceed to item F. If YES, answer the following questions for the time period prior to the OEL exceedance.
Yes No
Was there an algal bloom in the source water?
If algal blooms were present, were algae control measures employed?
Did heavy rainfall or snowmelt occur in the watershed?
Has the PWS experienced diurnal pH changes in source water?
F. Conclusion
Yes No Did source water quality factors contribute to your OEL exceedance?
Possibly
If YES or POSSIBLY, explain below.
Operational Evaluation Guidance Manual C-11 December 2008

Appendix D
Example Limited Scope Operational Evaluation and
Report

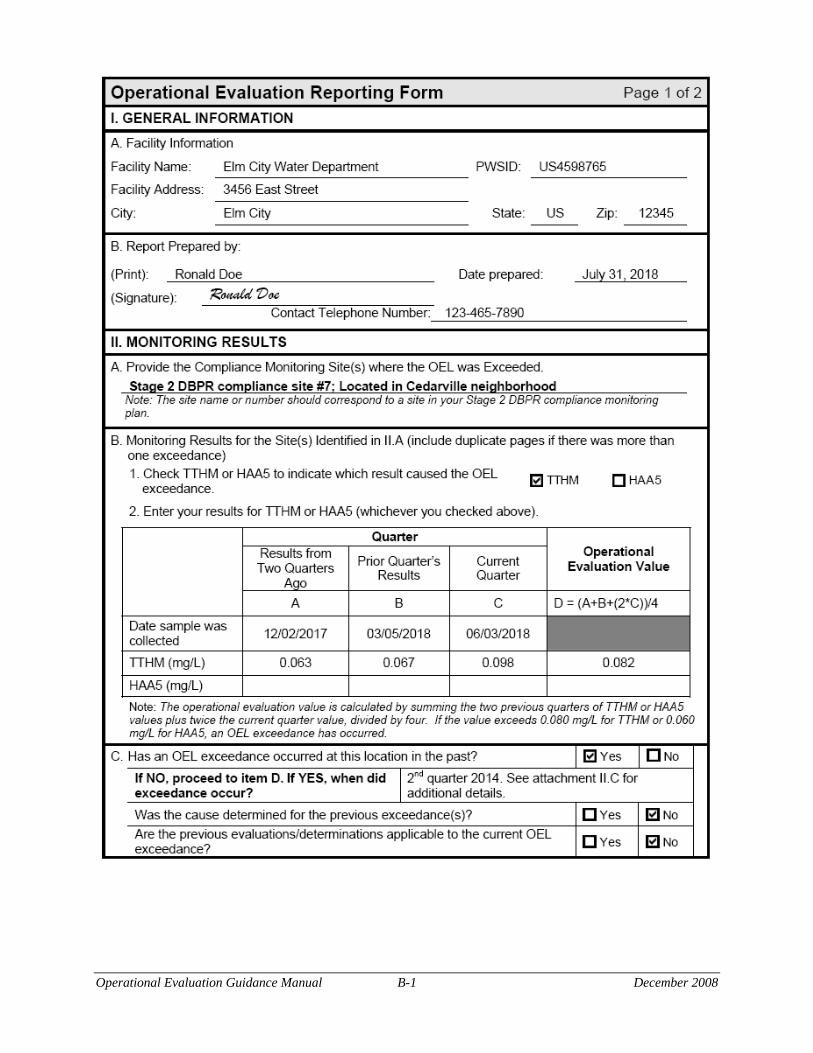
Operational Evaluation Guidance Manual B-1 December 2008
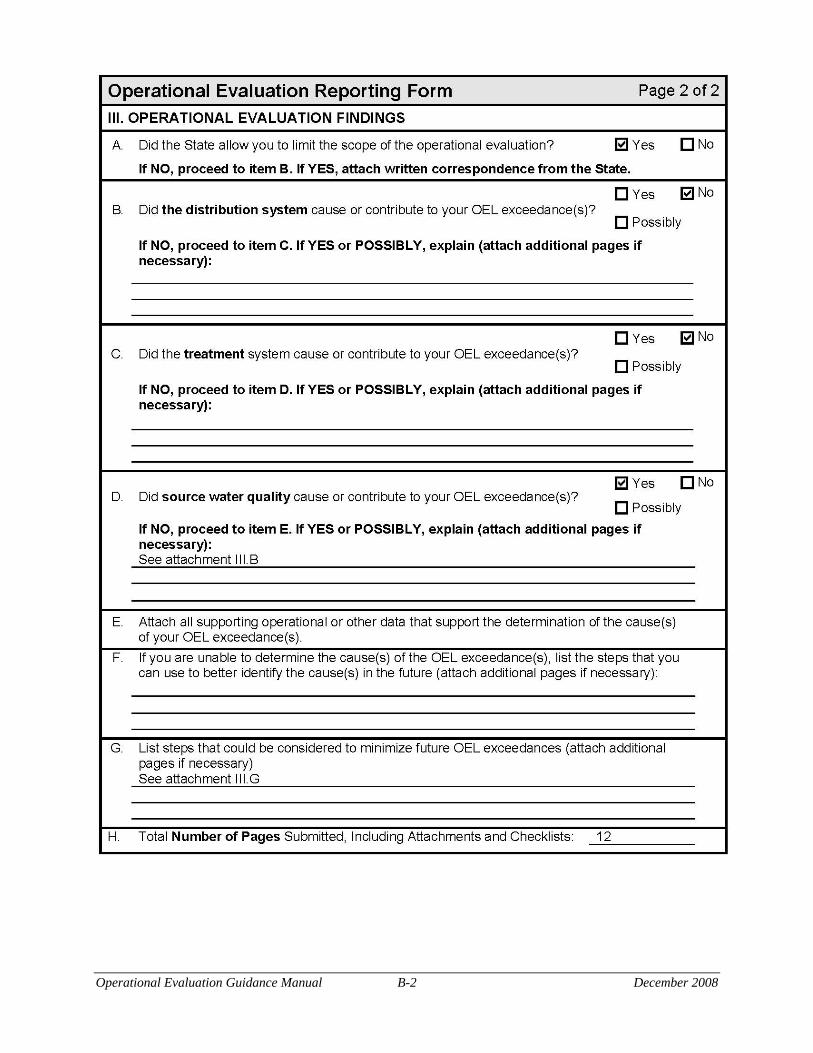
Operational Evaluation Guidance Manual B-2 December 2008
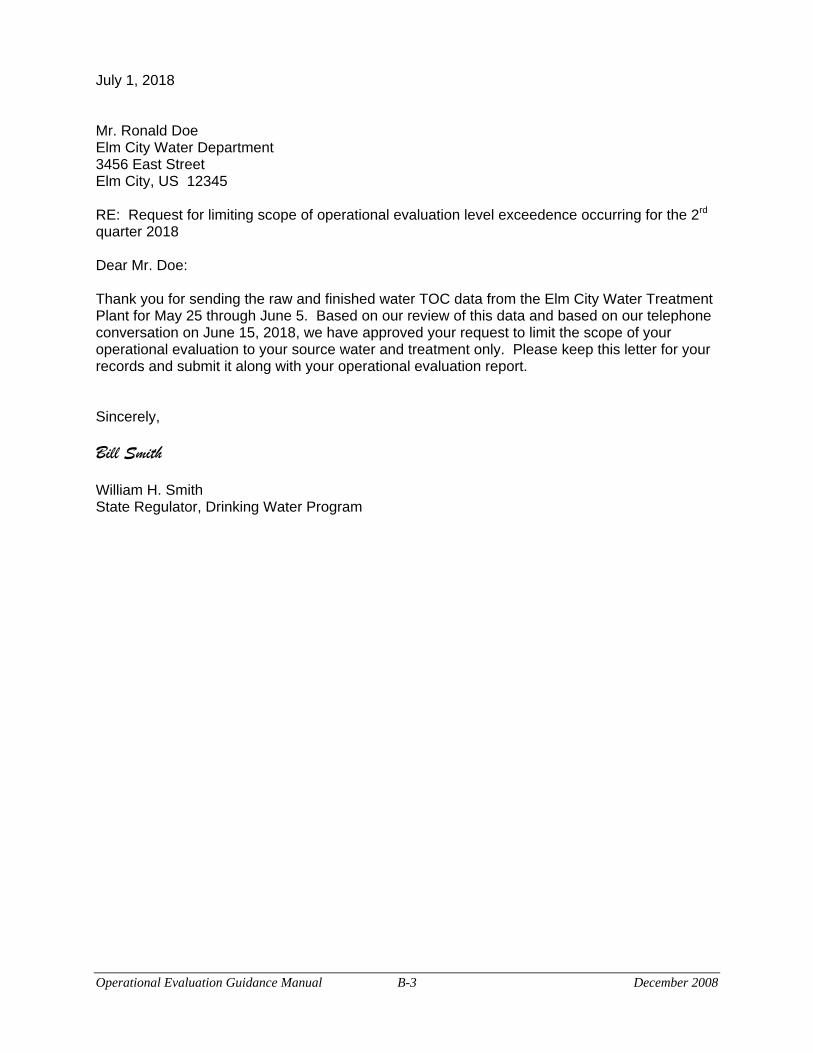
July 1, 2018
Mr. Ronald Doe Elm City Water Department 3456 East Street Elm City, US 12345
RE: Request for limiting scope of operational evaluation level exceedence occurring for the 2rd
quarter 2018
Dear Mr. Doe:
Thank you for sending the raw and finished water TOC data from the Elm City Water Treatment Plant for May 25 through June 5. Based on our review of this data and based on our telephone conversation on June 15, 2018, we have approved your request to limit the scope of your operational evaluation to your source water and treatment only. Please keep this letter for your records and submit it along with your operational evaluation report.
Sincerely,
Bill Smith
William H. Smith State Regulator, Drinking Water Program
Operational Evaluation Guidance Manual B-3 December 2008
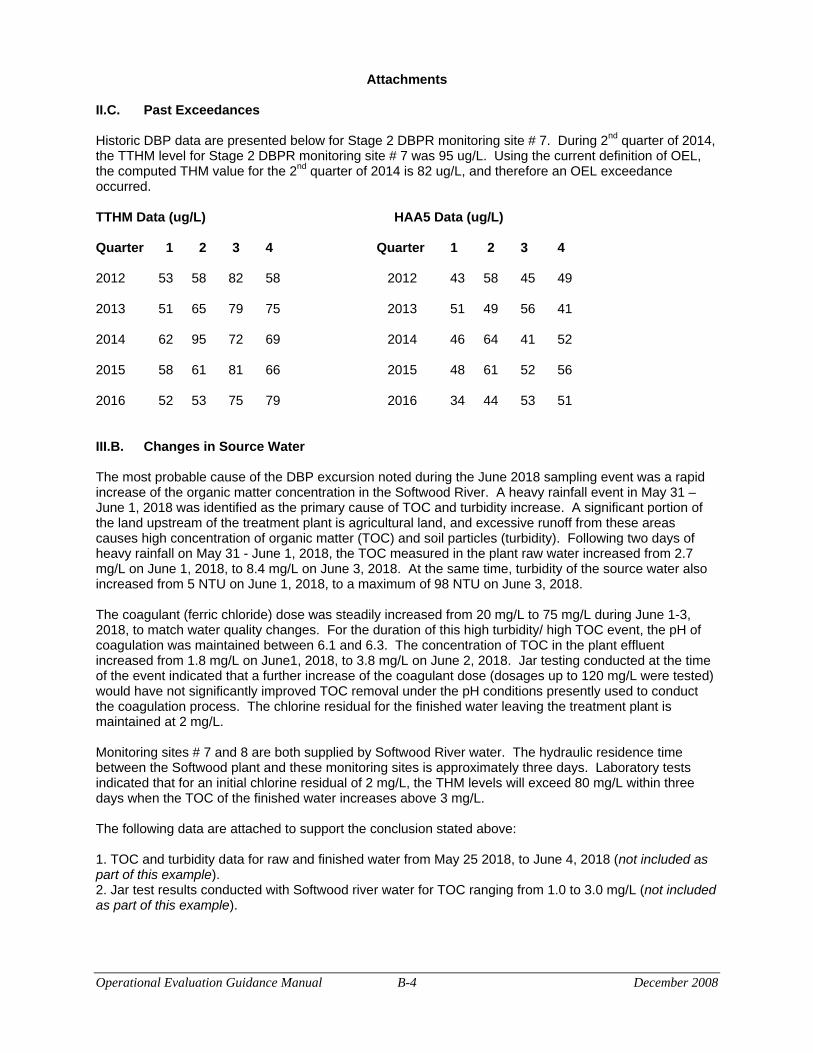
Attachments
II.C. Past Exceedances
Historic DBP data are presented below for Stage 2 DBPR monitoring site # 7. During 2nd quarter of 2014, the TTHM level for Stage 2 DBPR monitoring site # 7 was 95 ug/L. Using the current definition of OEL, the computed THM value for the 2nd quarter of 2014 is 82 ug/L, and therefore an OEL exceedance occurred.
TTHM Data (ug/L) HAA5 Data (ug/L)
Quarter 1 2 3 4 Quarter 1 2 3 4
2012 53 58 82 58 2012 43 58 45 49
2013 51 65 79 75 2013 51 49 56 41
2014 62 95 72 69 2014 46 64 41 52
2015 58 61 81 66 2015 48 61 52 56
2016 52 53 75 79 2016 34 44 53 51
III.B. Changes in Source Water
The most probable cause of the DBP excursion noted during the June 2018 sampling event was a rapid increase of the organic matter concentration in the Softwood River. A heavy rainfall event in May 31 – June 1, 2018 was identified as the primary cause of TOC and turbidity increase. A significant portion of the land upstream of the treatment plant is agricultural land, and excessive runoff from these areas causes high concentration of organic matter (TOC) and soil particles (turbidity). Following two days of heavy rainfall on May 31 - June 1, 2018, the TOC measured in the plant raw water increased from 2.7 mg/L on June 1, 2018, to 8.4 mg/L on June 3, 2018. At the same time, turbidity of the source water also increased from 5 NTU on June 1, 2018, to a maximum of 98 NTU on June 3, 2018.
The coagulant (ferric chloride) dose was steadily increased from 20 mg/L to 75 mg/L during June 1-3, 2018, to match water quality changes. For the duration of this high turbidity/ high TOC event, the pH of coagulation was maintained between 6.1 and 6.3. The concentration of TOC in the plant effluent increased from 1.8 mg/L on June1, 2018, to 3.8 mg/L on June 2, 2018. Jar testing conducted at the time of the event indicated that a further increase of the coagulant dose (dosages up to 120 mg/L were tested) would have not significantly improved TOC removal under the pH conditions presently used to conduct the coagulation process. The chlorine residual for the finished water leaving the treatment plant is maintained at 2 mg/L.
Monitoring sites # 7 and 8 are both supplied by Softwood River water. The hydraulic residence time between the Softwood plant and these monitoring sites is approximately three days. Laboratory tests indicated that for an initial chlorine residual of 2 mg/L, the THM levels will exceed 80 mg/L within three days when the TOC of the finished water increases above 3 mg/L.
The following data are attached to support the conclusion stated above:
1. TOC and turbidity data for raw and finished water from May 25 2018, to June 4, 2018 (not included as part of this example). 2. Jar test results conducted with Softwood river water for TOC ranging from 1.0 to 3.0 mg/L (not included as part of this example).
Operational Evaluation Guidance Manual B-4 December 2008
III.G. Minimizing Future Exceedances
Because some of the runoff comes from agricultural areas, the turbidity causing suspended soil particles are also a source of TOC because of the adsorbed organic matter to the soil particles. The raw water intake needs to be skillfully managed during rainfall events. The raw water intake has two levels. During a storm event, the suspended particles from agricultural runoff are likely to remain in suspension as a result of turbulence, and therefore the top level intake can be closed. Water can be withdrawn from the lower intake during the storm. As the storm subsides and turbulence decreases, particles will tend to settle down, and the lower level intake can be closed allowing water to be withdrawn from the upper level intake only. After the turbidity returns to normal, the bottom intake level can be opened also. We will conduct additional testing to determine the optimum operation of the intake system during storm events.
In addition to evaluating intake operations, we will investigate the use of a coagulant aid to address short term turbidity and TOC spikes. We will identify various options and perform jar testing. We will also investigate whether or not lower sedimentation flow rates would have helped reduce TOC concentrations in the plant effluent.
Operational Evaluation Guidance Manual B-5 December 2008
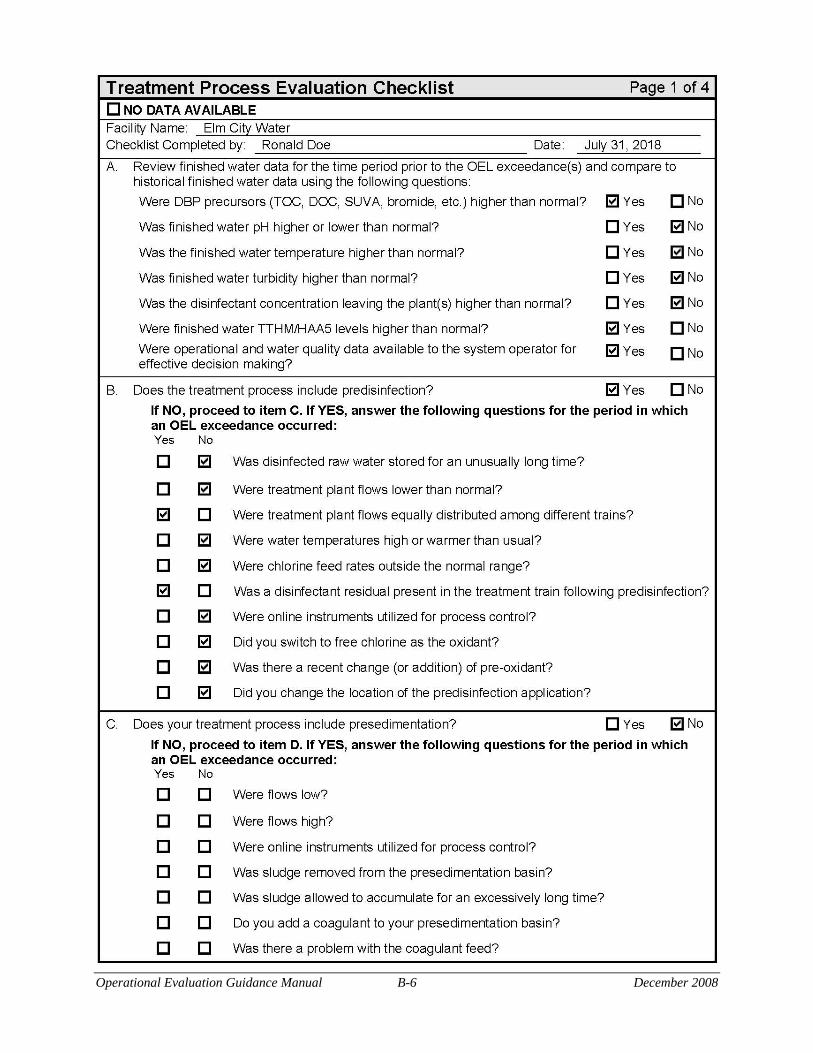
Operational Evaluation Guidance Manual B-6 December 2008
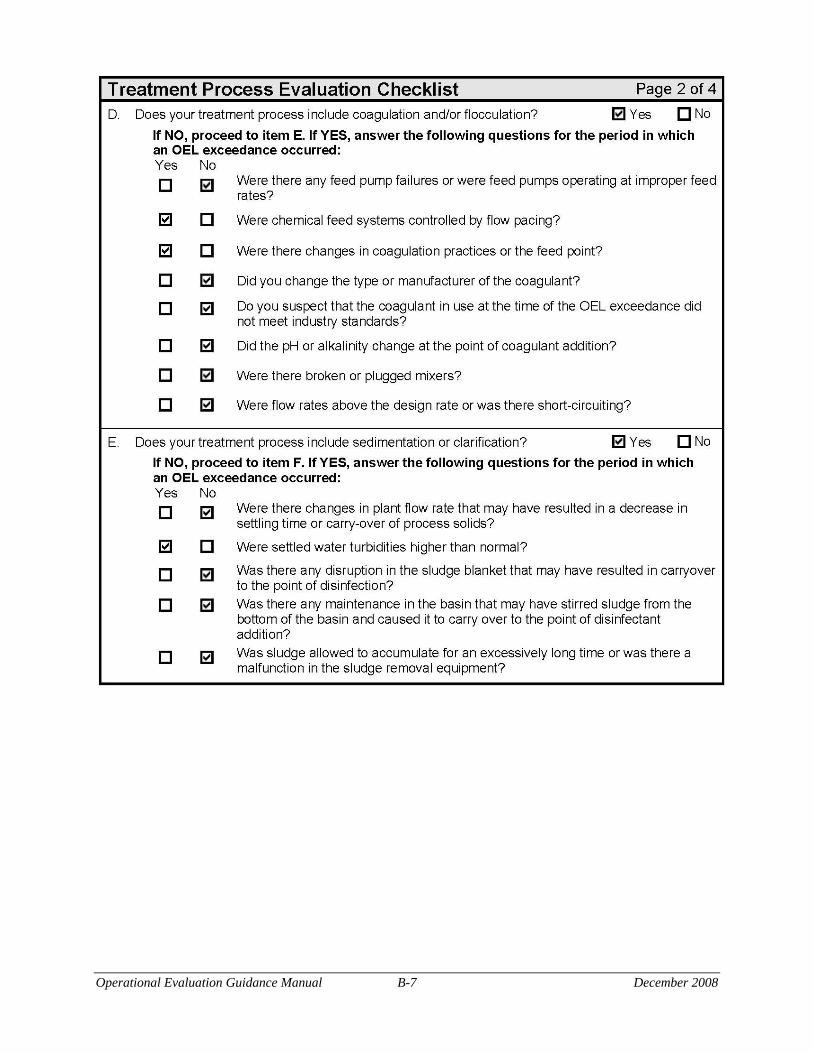
Operational Evaluation Guidance Manual B-7 December 2008
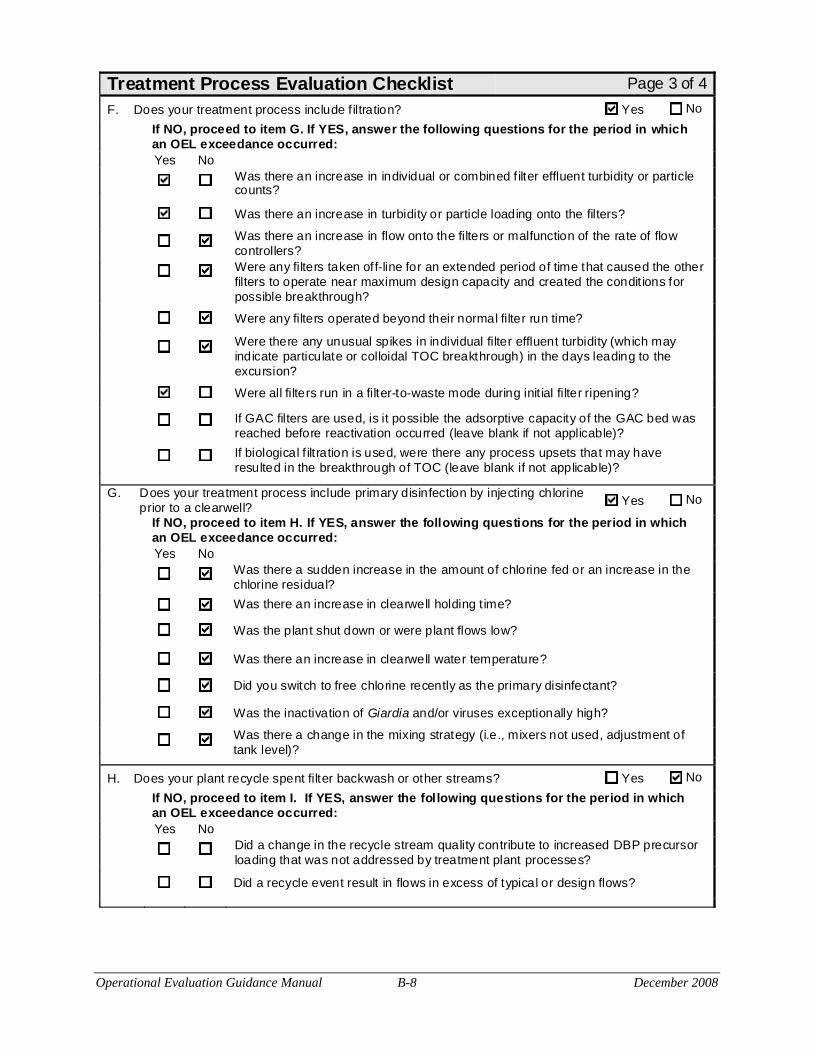
Treatment Process Evaluation Checklist Page 3 of 4
F. Does your treatment process include filtration? Yes No
If NO, proceed to item G. If YES, answer the following questions for the period in which an OEL exceedance occurred:
Yes No Was there an increase in individual or combined f ilter effluent turbidity or particle counts?
Was there an increase in turbidity or particle loading onto the filters?
Was there an increase in flow onto the filters or malfunction of the rate of flow controllers? Were any filters taken off-line for an extended period of time that caused the other filters to operate near maximum design capacity and created the condit ions for possible breakthrough?
Were any filters operated beyond their normal filter run time?
Were there any unusual spikes in individual filter effluent turbidity (which may indicate particulate or colloidal TOC breakthrough) in the days leading to the excursion?
Were all filters run in a filter-to-waste mode during init ial filter ripening?
If GAC filters are used, is it possible the adsorptive capacity of the GAC bed was reached before reactivation occurred (leave blank if not applicable)?
If biological f iltration is used, were there any process upsets that may have resulted in the breakthrough of TOC (leave blank if not applicable)?
G. Does your treatment process include primary disinfection by injecting chlorine prior to a clearwell? Yes No
If NO, proceed to item H. If YES, answer the following questions for the period in which an OEL exceedance occurred:
Yes No Was there a sudden increase in the amount of chlorine fed or an increase in the chlorine residual?
Was there an increase in clearwell holding time?
Was the plant shut down or were plant flows low?
Was there an increase in clearwell water temperature?
Did you switch to free chlorine recently as the primary disinfectant?
Was the inactivation of Giardia and/or viruses exceptionally high?
Was there a change in the mixing strategy (i.e., mixers not used, adjustment of tank level)?
H. Does your plant recycle spent filter backwash or other streams? Yes No
If NO, proceed to item I. If YES, answer the following questions for the period in which an OEL exceedance occurred:
Yes No Did a change in the recycle stream quality contribute to increased DBP precursor loading that was not addressed by treatment plant processes?
Did a recycle event result in flows in excess of typical or design flows?
Operational Evaluation Guidance Manual B-8 December 2008
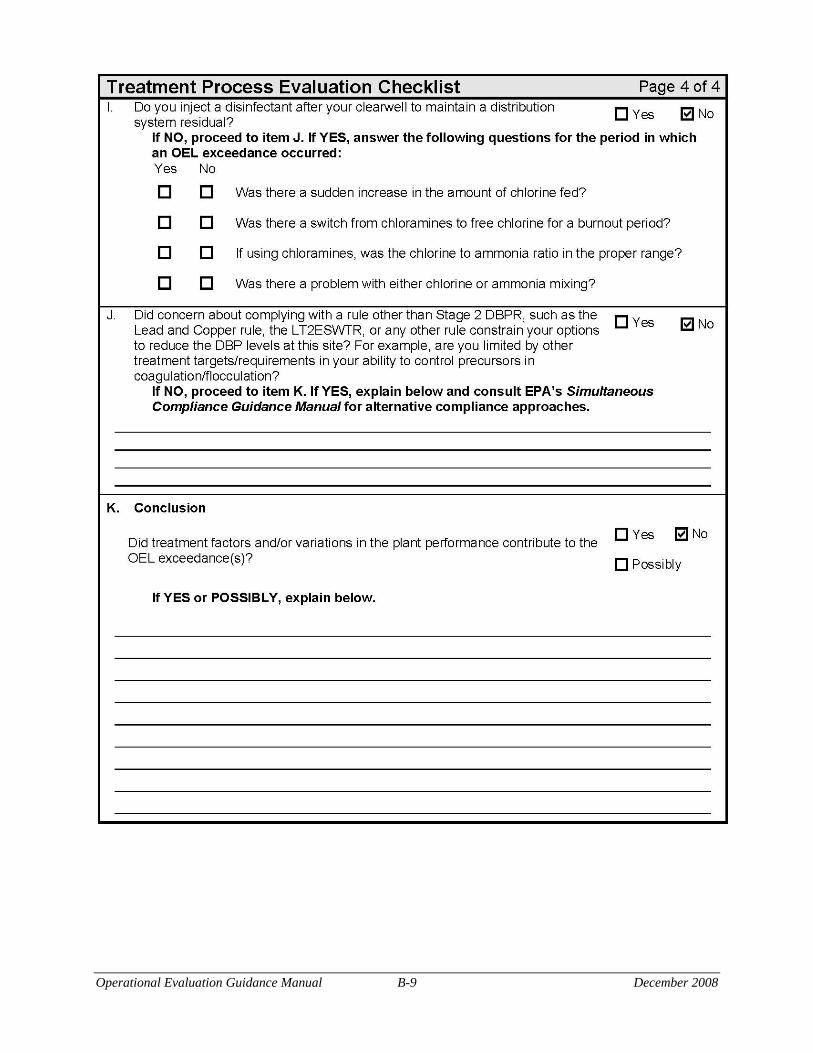
Operational Evaluation Guidance Manual B-9 December 2008
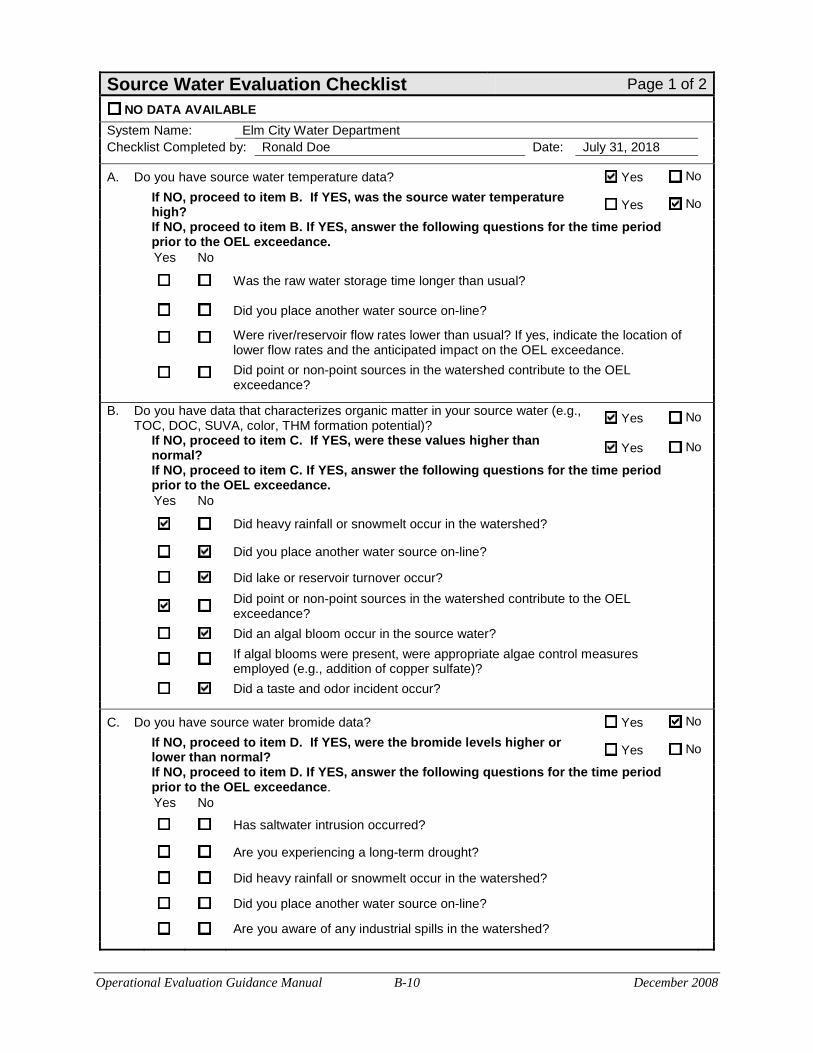
Source Water Evaluation Checklist Page 1 of 2
NO DATA AVAILABLE
System Name: Elm City Water Department Checklist Completed by: Ronald Doe Date: July 31, 2018
A. Do you have source water temperature data? Yes No
If NO, proceed to item B. If YES, was the source water temperature high? Yes No
If NO, proceed to item B. If YES, answer the following questions for the time period prior to the OEL exceedance.
Yes No
Was the raw water storage time longer than usual?
Did you place another water source on-line?
Were river/reservoir flow rates lower than usual? If yes, indicate the location of lower flow rates and the anticipated impact on the OEL exceedance.
Did point or non-point sources in the watershed contribute to the OEL exceedance?
B. Do you have data that characterizes organic matter in your source water (e.g., TOC, DOC, SUVA, color, THM formation potential)?
Yes No
If NO, proceed to item C. If YES, were these values higher than normal?
Yes No
If NO, proceed to item C. If YES, answer the following questions for the time period prior to the OEL exceedance.
Yes No
Did heavy rainfall or snowmelt occur in the watershed?
Did you place another water source on-line?
Did lake or reservoir turnover occur?
Did point or non-point sources in the watershed contribute to the OEL exceedance?
Did an algal bloom occur in the source water?
If algal blooms were present, were appropriate algae control measures employed (e.g., addition of copper sulfate)?
Did a taste and odor incident occur?
C. Do you have source water bromide data? Yes No
If NO, proceed to item D. If YES, were the bromide levels higher or lower than normal? Yes No
If NO, proceed to item D. If YES, answer the following questions for the time period prior to the OEL exceedance.
Yes No
Has saltwater intrusion occurred?
Are you experiencing a long-term drought?
Did heavy rainfall or snowmelt occur in the watershed?
Did you place another water source on-line?
Are you aware of any industrial spills in the watershed?
Operational Evaluation Guidance Manual B-10 December 2008
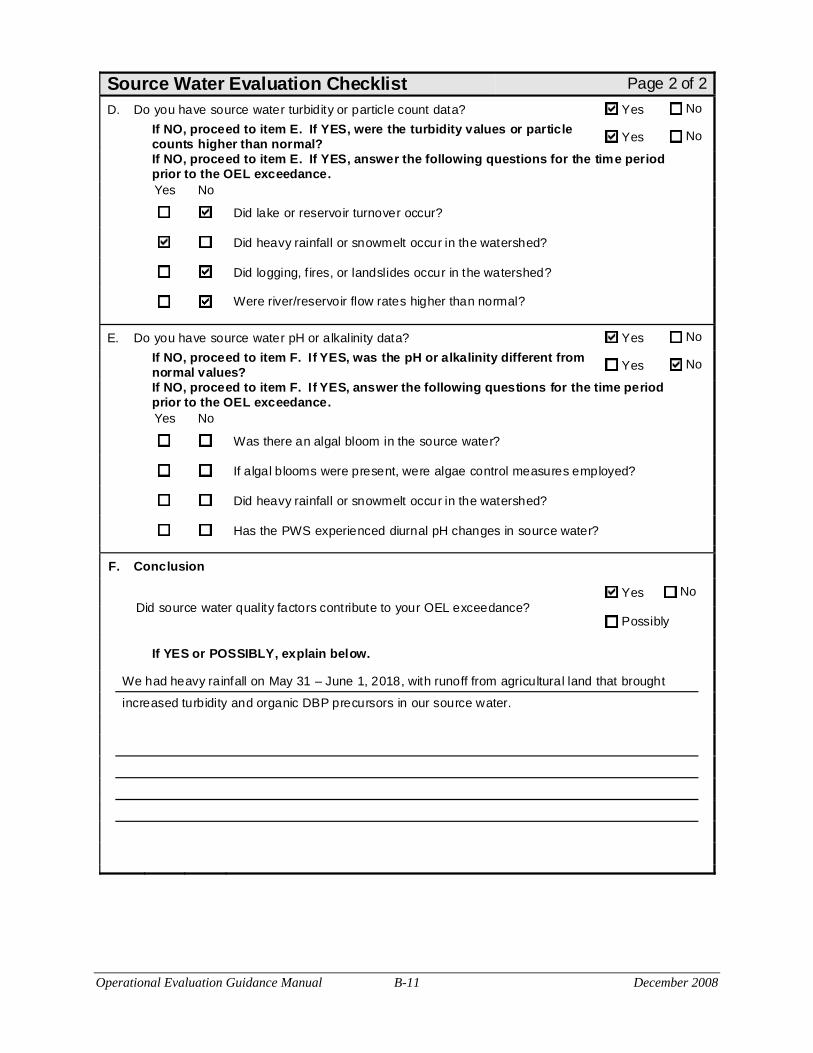
Source Water Evaluation Checklist Page 2 of 2
D. Do you have source water turbidity or particle count data? Yes No
If NO, proceed to item E. If YES, were the turbidity values or particle counts higher than normal? Yes No
If NO, proceed to item E. If YES, answer the following questions for the time period prior to the OEL exceedance.
Yes No
Did lake or reservoir turnover occur?
Did heavy rainfall or snowmelt occur in the watershed?
Did logging, f ires, or landslides occur in the watershed?
Were river/reservoir flow rates higher than normal?
E. Do you have source water pH or alkalinity data? Yes No
If NO, proceed to item F. If YES, was the pH or alkalinity different from normal values? Yes No
If NO, proceed to item F. If YES, answer the following questions for the time period prior to the OEL exceedance.
Yes No
Was there an algal bloom in the source water?
If algal blooms were present, were algae control measures employed?
Did heavy rainfall or snowmelt occur in the watershed?
Has the PWS experienced diurnal pH changes in source water?
F. Conclusion
Yes No Did source water quality factors contribute to your OEL exceedance?
Possibly
If YES or POSSIBLY, explain below.
We had heavy rainfall on May 31 – June 1, 2018, with runoff from agricultural land that brought
increased turbidity and organic DBP precursors in our source water.
Operational Evaluation Guidance Manual B-11 December 2008

Appendix E
Monitoring Plan Template and Instructions

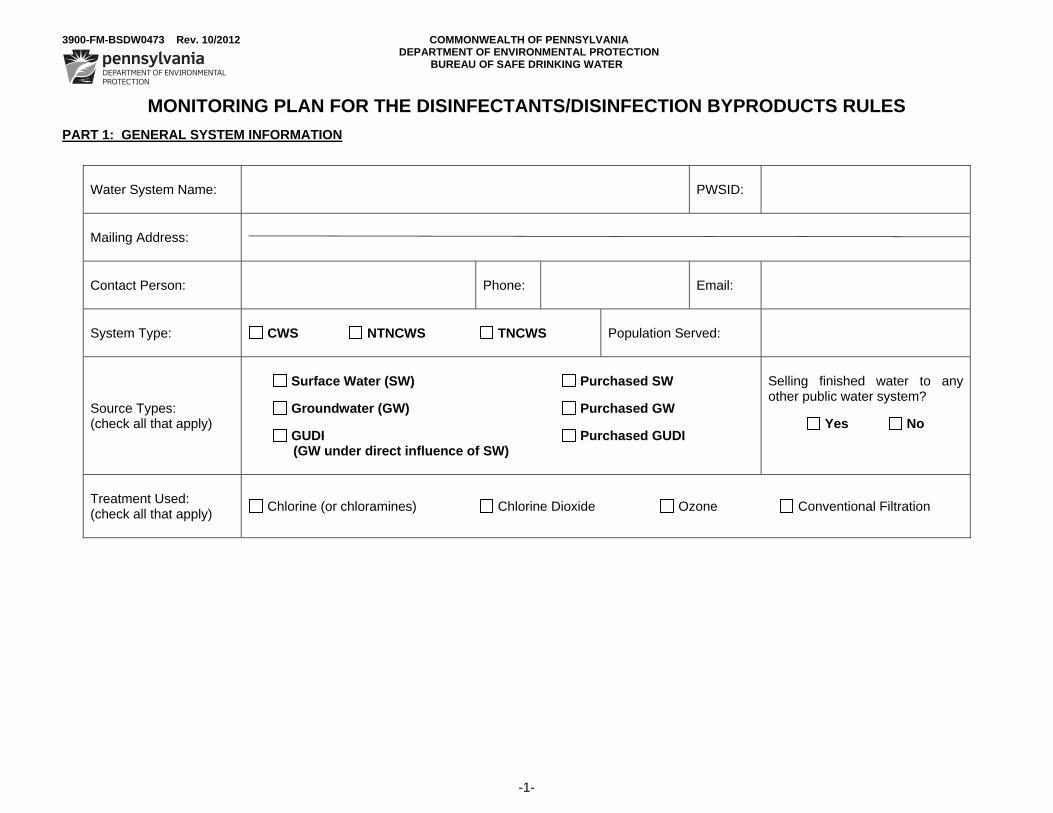
3900-FM-BSDW0473 Rev. 10/2012 COMMONWEALTH OF PENNSYLVANIA DEPARTMENT OF ENVIRONMENTAL PROTECTION
BUREAU OF SAFE DRINKING WATER
-1-
MONITORING PLAN FOR THE DISINFECTANTS/DISINFECTION BYPRODUCTS RULES
PART 1: GENERAL SYSTEM INFORMATION
Water System Name: PWSID:
Mailing Address:
Contact Person: Phone: Email:
System Type: CWS NTNCWS TNCWS Population Served:
Source Types: (check all that apply)
Surface Water (SW) Purchased SW
Groundwater (GW) Purchased GW
GUDI Purchased GUDI (GW under direct influence of SW)
Selling finished water to any other public water system?
Yes No
Treatment Used: (check all that apply)
Chlorine (or chloramines) Chlorine Dioxide Ozone Conventional Filtration
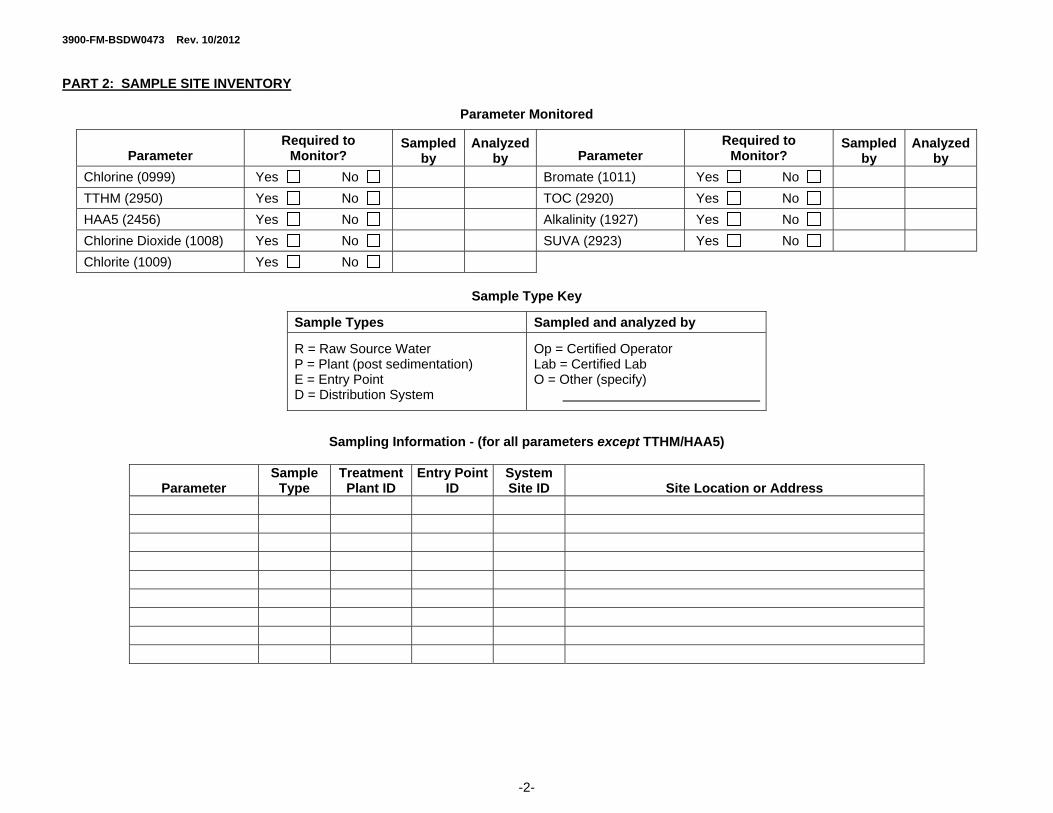
3900-FM-BSDW0473 Rev. 10/2012
-2-
PART 2: SAMPLE SITE INVENTORY
Parameter Monitored
Parameter Required to
Monitor? Sampled
by Analyzed
by Parameter Required to
Monitor? Sampled
by Analyzed
by
Chlorine (0999) Yes No Bromate (1011) Yes No
TTHM (2950) Yes No TOC (2920) Yes No
HAA5 (2456) Yes No Alkalinity (1927) Yes No
Chlorine Dioxide (1008) Yes No SUVA (2923) Yes No
Chlorite (1009) Yes No
Sample Type Key
Sample Types Sampled and analyzed by
R = Raw Source Water P = Plant (post sedimentation) E = Entry Point D = Distribution System
Op = Certified Operator Lab = Certified Lab O = Other (specify)
Sampling Information - (for all parameters except TTHM/HAA5)
Parameter Sample
Type Treatment
Plant ID Entry Point
ID System Site ID Site Location or Address
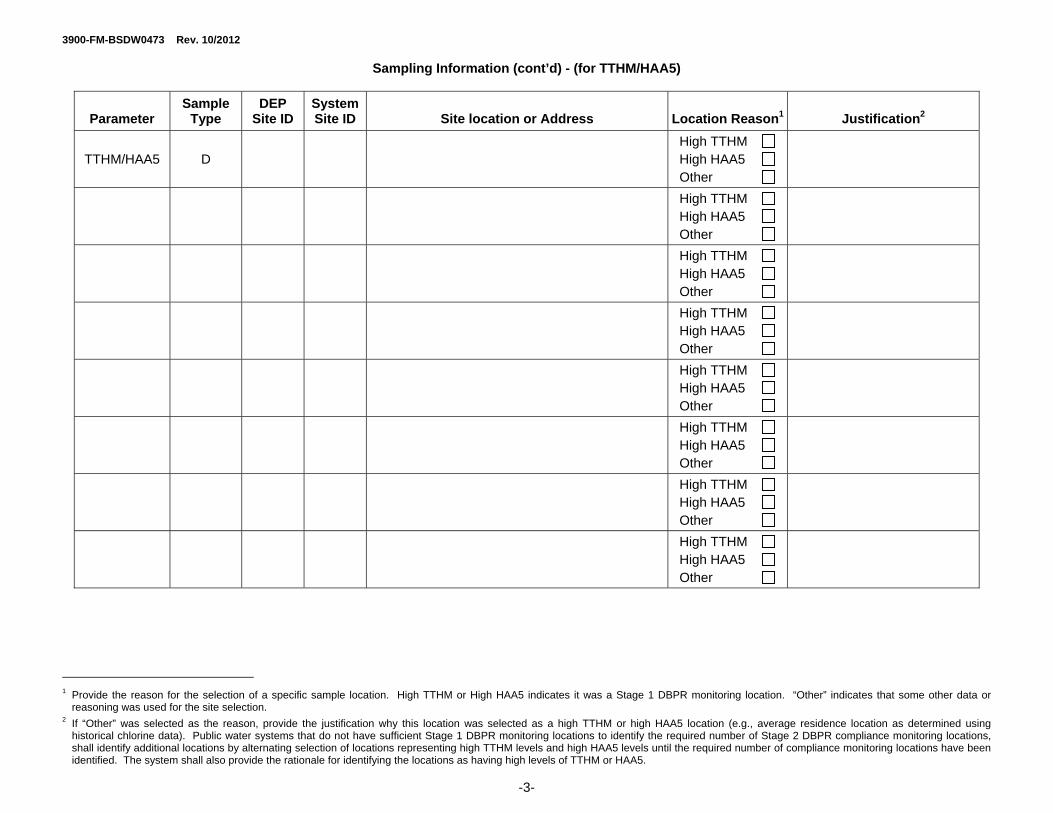
3900-FM-BSDW0473 Rev. 10/2012
-3-
Sampling Information (cont’d) - (for TTHM/HAA5)
Parameter Sample
Type DEP
Site ID System Site ID Site location or Address Location Reason1 Justification2
TTHM/HAA5 D High TTHM High HAA5 Other
High TTHM High HAA5 Other
High TTHM High HAA5 Other
High TTHM High HAA5 Other
High TTHM High HAA5 Other
High TTHM High HAA5 Other
High TTHM High HAA5 Other
High TTHM High HAA5 Other
1 Provide the reason for the selection of a specific sample location. High TTHM or High HAA5 indicates it was a Stage 1 DBPR monitoring location. “Other” indicates that some other data or
reasoning was used for the site selection. 2 If “Other” was selected as the reason, provide the justification why this location was selected as a high TTHM or high HAA5 location (e.g., average residence location as determined using
historical chlorine data). Public water systems that do not have sufficient Stage 1 DBPR monitoring locations to identify the required number of Stage 2 DBPR compliance monitoring locations, shall identify additional locations by alternating selection of locations representing high TTHM levels and high HAA5 levels until the required number of compliance monitoring locations have been identified. The system shall also provide the rationale for identifying the locations as having high levels of TTHM or HAA5.
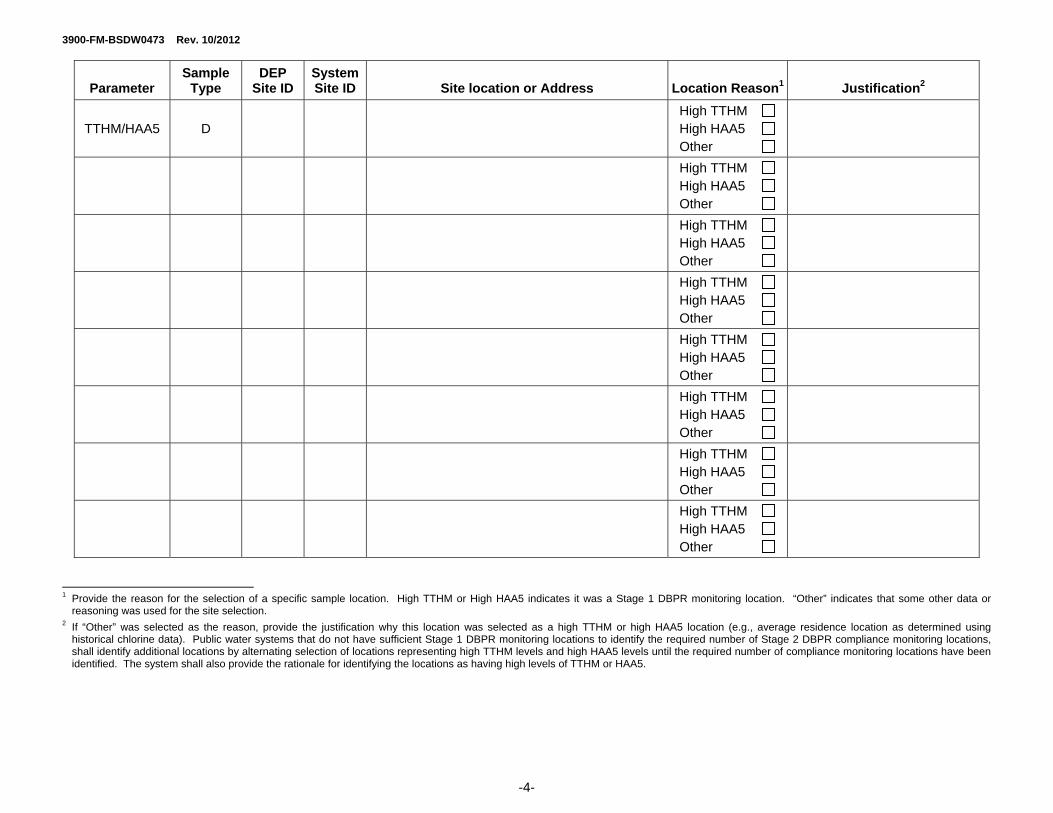
3900-FM-BSDW0473 Rev. 10/2012
-4-
Parameter Sample
Type DEP
Site ID System Site ID Site location or Address Location Reason1 Justification2
TTHM/HAA5 D High TTHM High HAA5 Other
High TTHM High HAA5 Other
High TTHM High HAA5 Other
High TTHM High HAA5 Other
High TTHM High HAA5 Other
High TTHM High HAA5 Other
High TTHM High HAA5 Other
High TTHM High HAA5 Other
1 Provide the reason for the selection of a specific sample location. High TTHM or High HAA5 indicates it was a Stage 1 DBPR monitoring location. “Other” indicates that some other data or
reasoning was used for the site selection. 2 If “Other” was selected as the reason, provide the justification why this location was selected as a high TTHM or high HAA5 location (e.g., average residence location as determined using
historical chlorine data). Public water systems that do not have sufficient Stage 1 DBPR monitoring locations to identify the required number of Stage 2 DBPR compliance monitoring locations, shall identify additional locations by alternating selection of locations representing high TTHM levels and high HAA5 levels until the required number of compliance monitoring locations have been identified. The system shall also provide the rationale for identifying the locations as having high levels of TTHM or HAA5.
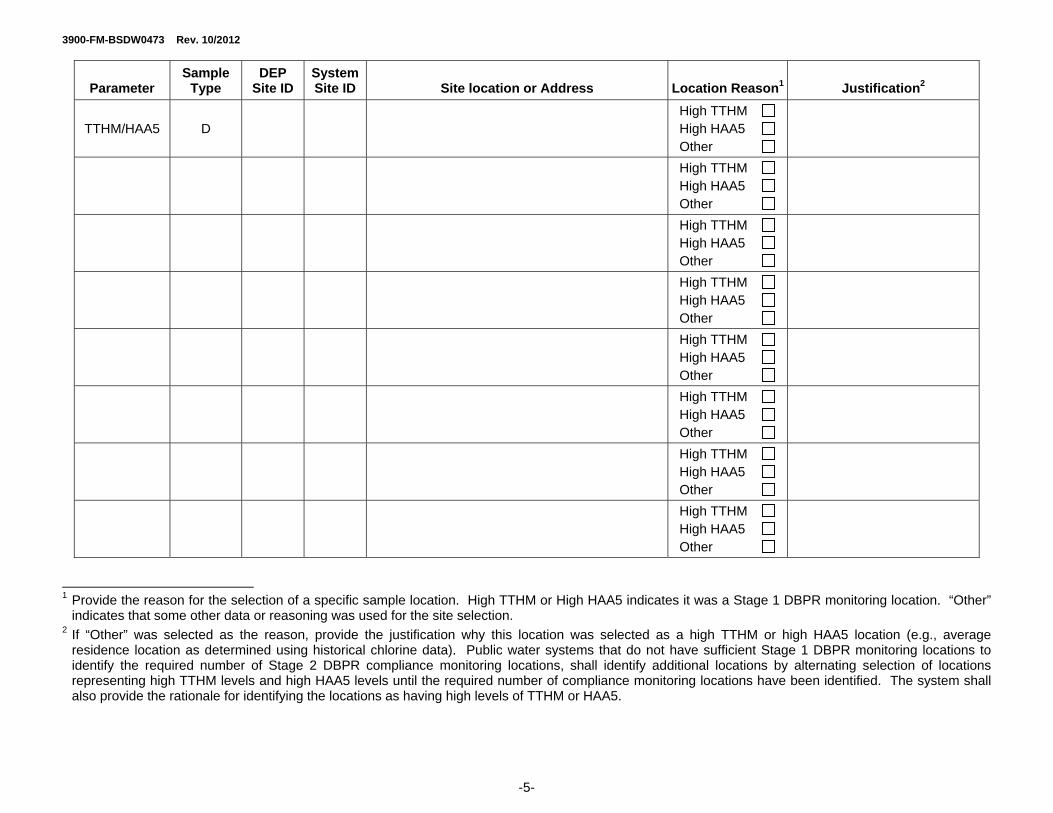
3900-FM-BSDW0473 Rev. 10/2012
-5-
Parameter Sample
Type DEP
Site ID System Site ID Site location or Address Location Reason1 Justification2
TTHM/HAA5 D High TTHM High HAA5 Other
High TTHM High HAA5 Other
High TTHM High HAA5 Other
High TTHM High HAA5 Other
High TTHM High HAA5 Other
High TTHM High HAA5 Other
High TTHM High HAA5 Other
High TTHM High HAA5 Other
1 Provide the reason for the selection of a specific sample location. High TTHM or High HAA5 indicates it was a Stage 1 DBPR monitoring location. “Other”
indicates that some other data or reasoning was used for the site selection. 2 If “Other” was selected as the reason, provide the justification why this location was selected as a high TTHM or high HAA5 location (e.g., average
residence location as determined using historical chlorine data). Public water systems that do not have sufficient Stage 1 DBPR monitoring locations to identify the required number of Stage 2 DBPR compliance monitoring locations, shall identify additional locations by alternating selection of locations representing high TTHM levels and high HAA5 levels until the required number of compliance monitoring locations have been identified. The system shall also provide the rationale for identifying the locations as having high levels of TTHM or HAA5.
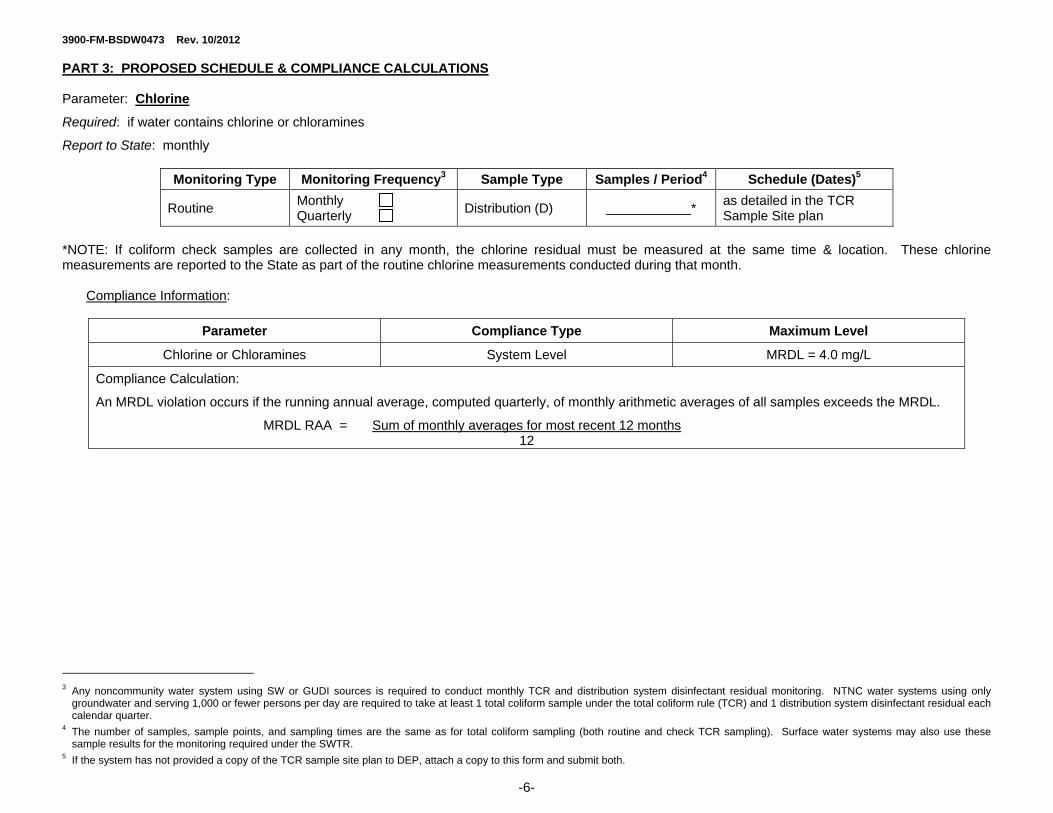
3900-FM-BSDW0473 Rev. 10/2012
-6-
PART 3: PROPOSED SCHEDULE & COMPLIANCE CALCULATIONS Parameter: Chlorine
Required: if water contains chlorine or chloramines
Report to State: monthly
Monitoring Type Monitoring Frequency3 Sample Type Samples / Period4 Schedule (Dates)5
Routine Monthly Quarterly
Distribution (D) * as detailed in the TCR Sample Site plan
*NOTE: If coliform check samples are collected in any month, the chlorine residual must be measured at the same time & location. These chlorine measurements are reported to the State as part of the routine chlorine measurements conducted during that month.
Compliance Information:
Parameter Compliance Type Maximum Level
Chlorine or Chloramines System Level MRDL = 4.0 mg/L
Compliance Calculation:
An MRDL violation occurs if the running annual average, computed quarterly, of monthly arithmetic averages of all samples exceeds the MRDL.
MRDL RAA = Sum of monthly averages for most recent 12 months 12
3 Any noncommunity water system using SW or GUDI sources is required to conduct monthly TCR and distribution system disinfectant residual monitoring. NTNC water systems using only
groundwater and serving 1,000 or fewer persons per day are required to take at least 1 total coliform sample under the total coliform rule (TCR) and 1 distribution system disinfectant residual each calendar quarter.
4 The number of samples, sample points, and sampling times are the same as for total coliform sampling (both routine and check TCR sampling). Surface water systems may also use these sample results for the monitoring required under the SWTR.
5 If the system has not provided a copy of the TCR sample site plan to DEP, attach a copy to this form and submit both.
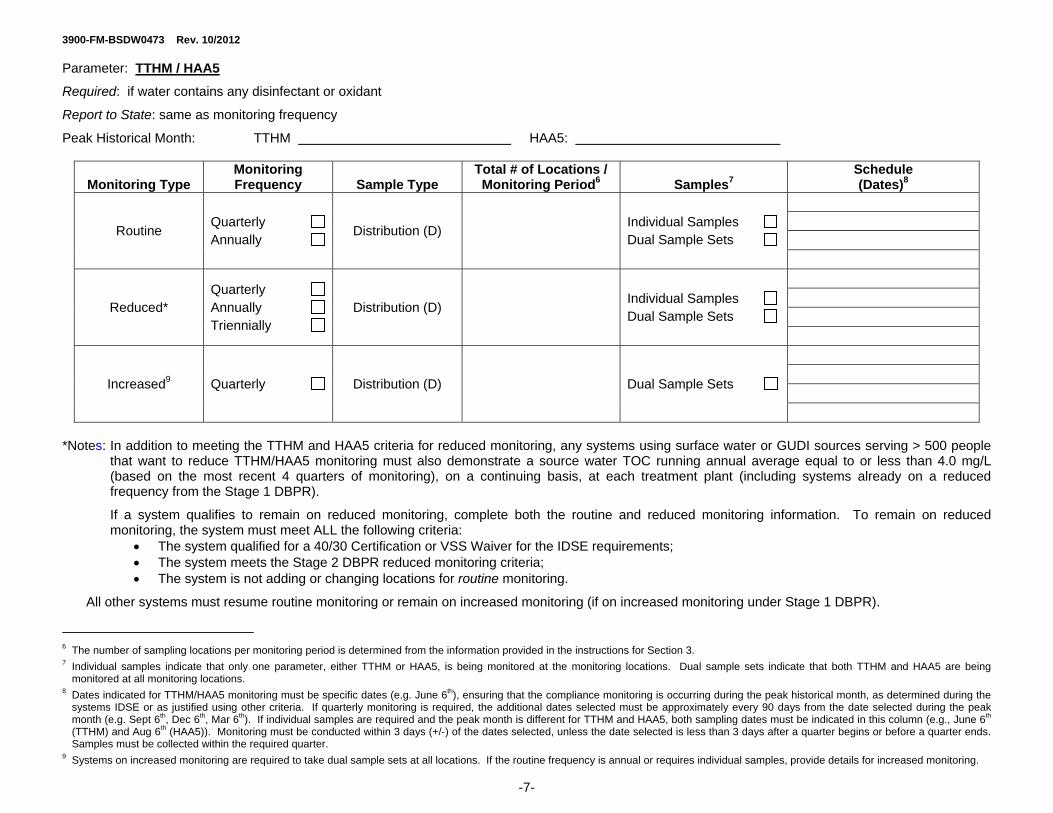
3900-FM-BSDW0473 Rev. 10/2012
-7-
Parameter: TTHM / HAA5
Required: if water contains any disinfectant or oxidant
Report to State: same as monitoring frequency
Peak Historical Month: TTHM HAA5:
Monitoring Type Monitoring Frequency Sample Type
Total # of Locations / Monitoring Period6 Samples7
Schedule (Dates)8
Routine Quarterly Annually
Distribution (D) Individual Samples Dual Sample Sets
Reduced* Quarterly Annually Triennially
Distribution (D) Individual Samples Dual Sample Sets
Increased9 Quarterly Distribution (D) Dual Sample Sets
*Notes: In addition to meeting the TTHM and HAA5 criteria for reduced monitoring, any systems using surface water or GUDI sources serving > 500 people that want to reduce TTHM/HAA5 monitoring must also demonstrate a source water TOC running annual average equal to or less than 4.0 mg/L (based on the most recent 4 quarters of monitoring), on a continuing basis, at each treatment plant (including systems already on a reduced frequency from the Stage 1 DBPR).
If a system qualifies to remain on reduced monitoring, complete both the routine and reduced monitoring information. To remain on reduced monitoring, the system must meet ALL the following criteria:
The system qualified for a 40/30 Certification or VSS Waiver for the IDSE requirements; The system meets the Stage 2 DBPR reduced monitoring criteria; The system is not adding or changing locations for routine monitoring.
All other systems must resume routine monitoring or remain on increased monitoring (if on increased monitoring under Stage 1 DBPR).
6 The number of sampling locations per monitoring period is determined from the information provided in the instructions for Section 3. 7 Individual samples indicate that only one parameter, either TTHM or HAA5, is being monitored at the monitoring locations. Dual sample sets indicate that both TTHM and HAA5 are being
monitored at all monitoring locations. 8 Dates indicated for TTHM/HAA5 monitoring must be specific dates (e.g. June 6th), ensuring that the compliance monitoring is occurring during the peak historical month, as determined during the
systems IDSE or as justified using other criteria. If quarterly monitoring is required, the additional dates selected must be approximately every 90 days from the date selected during the peak month (e.g. Sept 6th, Dec 6th, Mar 6th). If individual samples are required and the peak month is different for TTHM and HAA5, both sampling dates must be indicated in this column (e.g., June 6th (TTHM) and Aug 6th (HAA5)). Monitoring must be conducted within 3 days (+/-) of the dates selected, unless the date selected is less than 3 days after a quarter begins or before a quarter ends. Samples must be collected within the required quarter.
9 Systems on increased monitoring are required to take dual sample sets at all locations. If the routine frequency is annual or requires individual samples, provide details for increased monitoring.
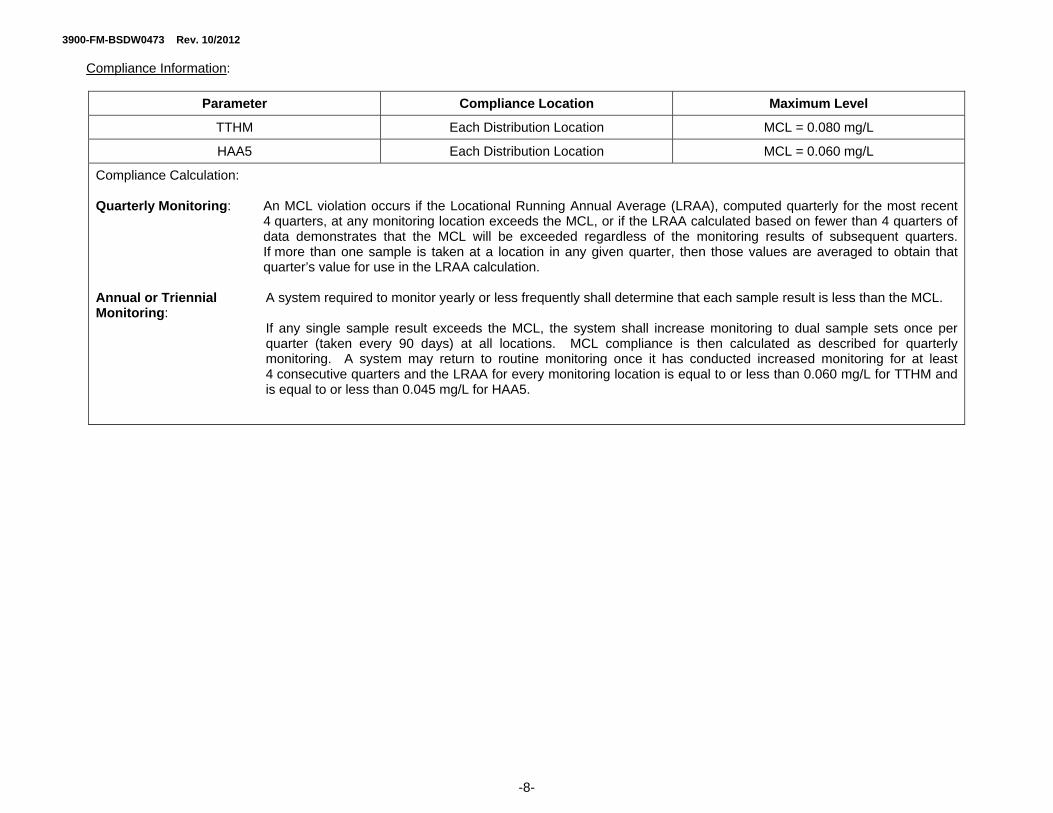
3900-FM-BSDW0473 Rev. 10/2012
-8-
Compliance Information:
Parameter Compliance Location Maximum Level
TTHM Each Distribution Location MCL = 0.080 mg/L
HAA5 Each Distribution Location MCL = 0.060 mg/L
Compliance Calculation: Quarterly Monitoring: An MCL violation occurs if the Locational Running Annual Average (LRAA), computed quarterly for the most recent
4 quarters, at any monitoring location exceeds the MCL, or if the LRAA calculated based on fewer than 4 quarters of data demonstrates that the MCL will be exceeded regardless of the monitoring results of subsequent quarters. If more than one sample is taken at a location in any given quarter, then those values are averaged to obtain that quarter’s value for use in the LRAA calculation.
Annual or Triennial A system required to monitor yearly or less frequently shall determine that each sample result is less than the MCL. Monitoring:
If any single sample result exceeds the MCL, the system shall increase monitoring to dual sample sets once per quarter (taken every 90 days) at all locations. MCL compliance is then calculated as described for quarterly monitoring. A system may return to routine monitoring once it has conducted increased monitoring for at least 4 consecutive quarters and the LRAA for every monitoring location is equal to or less than 0.060 mg/L for TTHM and is equal to or less than 0.045 mg/L for HAA5.

3900-FM-BSDW0473 Rev. 10/2012
-9-
Operational Evaluation Level Information:
Parameter Compliance Location Maximum Level
TTHM Each Distribution Location OEL = 0.080 mg/L
HAA5 Each Distribution Location OEL = 0.060 mg/L
Compliance Calculation:
Quarterly Monitoring: Each quarter, public water systems shall calculate the TTHM and HAA5 OEL for each monitoring location. The operational evaluation level for TTHM and HAA5 is the sum of the two previous quarterly results plus twice the current quarter's result, divided by 4.
OEL = (current quarter result*2) + (1st previous quarter result) + (2nd previous quarter result) 4
If the TTHM operational evaluation level exceeds 0.080 mg/L, or the HAA5 operational evaluation level exceeds 0.060 mg/L at any monitoring location, the system shall conduct an operational evaluation to identify the cause of the exceedance and submit a written report of the evaluation to DEP no later than 90 days after being notified of the analytical result that causes the system to exceed the operational evaluation level. The written report must be made available to the public upon request.
Annual or Triennial OEL calculations are not required. Monitoring:
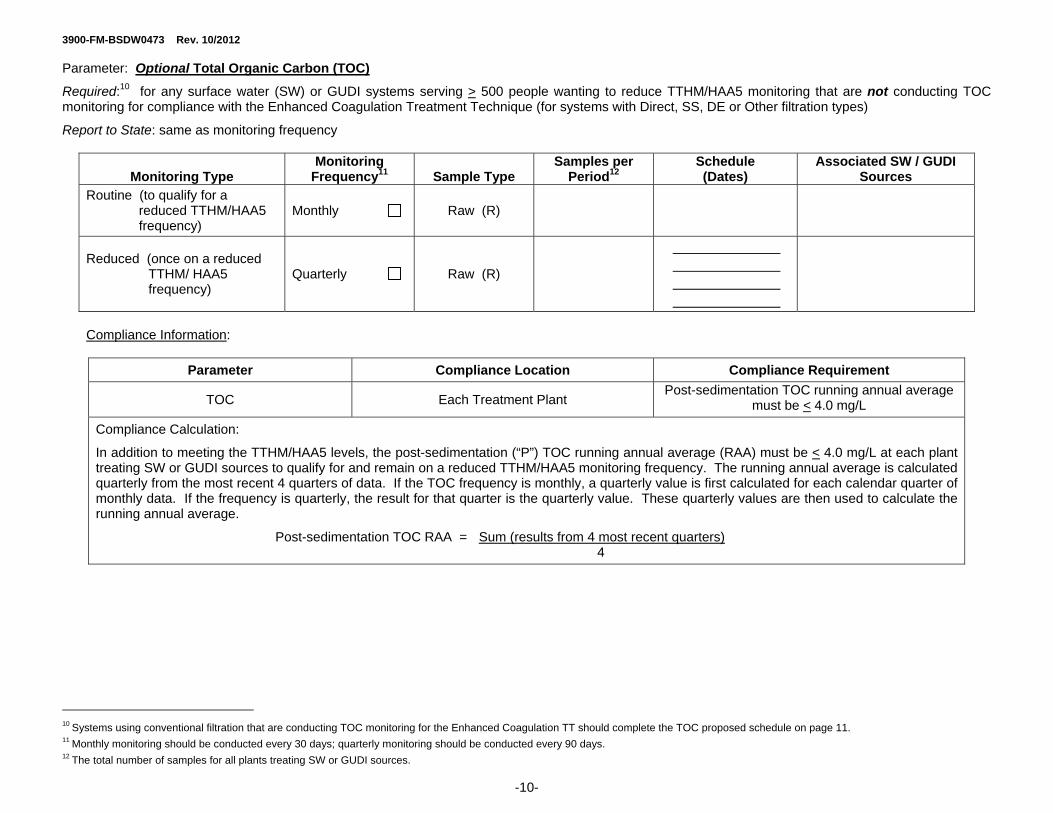
3900-FM-BSDW0473 Rev. 10/2012
-10-
Parameter: Optional Total Organic Carbon (TOC)
Required:10 for any surface water (SW) or GUDI systems serving > 500 people wanting to reduce TTHM/HAA5 monitoring that are not conducting TOC monitoring for compliance with the Enhanced Coagulation Treatment Technique (for systems with Direct, SS, DE or Other filtration types)
Report to State: same as monitoring frequency
Monitoring Type Monitoring
Frequency11 Sample Type Samples per
Period12 Schedule (Dates)
Associated SW / GUDI Sources
Routine (to qualify for a reduced TTHM/HAA5 frequency)
Monthly Raw (R)
Reduced (once on a reduced TTHM/ HAA5 frequency)
Quarterly Raw (R)
Compliance Information:
Parameter Compliance Location Compliance Requirement
TOC Each Treatment Plant Post-sedimentation TOC running annual average
must be < 4.0 mg/L
Compliance Calculation:
In addition to meeting the TTHM/HAA5 levels, the post-sedimentation (“P”) TOC running annual average (RAA) must be < 4.0 mg/L at each plant treating SW or GUDI sources to qualify for and remain on a reduced TTHM/HAA5 monitoring frequency. The running annual average is calculated quarterly from the most recent 4 quarters of data. If the TOC frequency is monthly, a quarterly value is first calculated for each calendar quarter of monthly data. If the frequency is quarterly, the result for that quarter is the quarterly value. These quarterly values are then used to calculate the running annual average.
Post-sedimentation TOC RAA = Sum (results from 4 most recent quarters) 4
10 Systems using conventional filtration that are conducting TOC monitoring for the Enhanced Coagulation TT should complete the TOC proposed schedule on page 11. 11 Monthly monitoring should be conducted every 30 days; quarterly monitoring should be conducted every 90 days. 12 The total number of samples for all plants treating SW or GUDI sources.
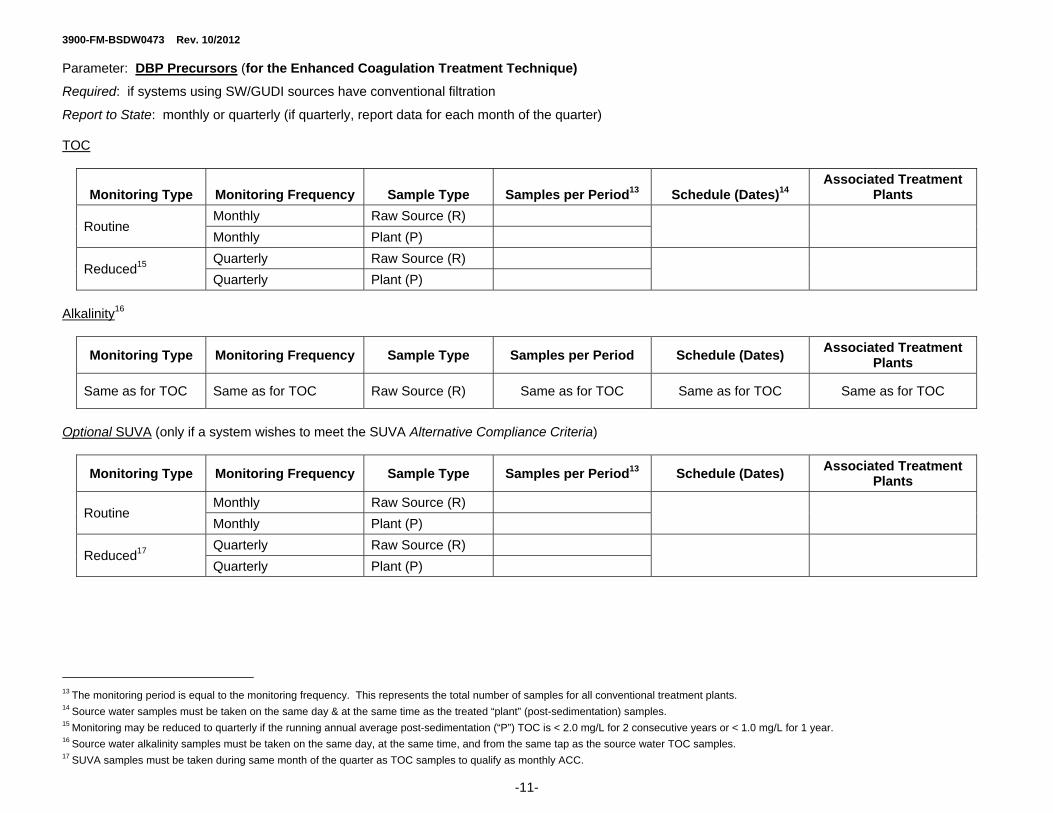
3900-FM-BSDW0473 Rev. 10/2012
-11-
Parameter: DBP Precursors (for the Enhanced Coagulation Treatment Technique)
Required: if systems using SW/GUDI sources have conventional filtration
Report to State: monthly or quarterly (if quarterly, report data for each month of the quarter) TOC
Monitoring Type Monitoring Frequency Sample Type Samples per Period13 Schedule (Dates)14 Associated Treatment
Plants
Routine Monthly Raw Source (R)
Monthly Plant (P)
Reduced15 Quarterly Raw Source (R)
Quarterly Plant (P)
Alkalinity16
Monitoring Type Monitoring Frequency Sample Type Samples per Period Schedule (Dates) Associated Treatment
Plants
Same as for TOC Same as for TOC Raw Source (R) Same as for TOC Same as for TOC Same as for TOC
Optional SUVA (only if a system wishes to meet the SUVA Alternative Compliance Criteria)
Monitoring Type Monitoring Frequency Sample Type Samples per Period13 Schedule (Dates) Associated Treatment
Plants
Routine Monthly Raw Source (R)
Monthly Plant (P)
Reduced17 Quarterly Raw Source (R)
Quarterly Plant (P)
13 The monitoring period is equal to the monitoring frequency. This represents the total number of samples for all conventional treatment plants. 14 Source water samples must be taken on the same day & at the same time as the treated “plant” (post-sedimentation) samples. 15 Monitoring may be reduced to quarterly if the running annual average post-sedimentation (“P”) TOC is < 2.0 mg/L for 2 consecutive years or < 1.0 mg/L for 1 year. 16 Source water alkalinity samples must be taken on the same day, at the same time, and from the same tap as the source water TOC samples. 17 SUVA samples must be taken during same month of the quarter as TOC samples to qualify as monthly ACC.
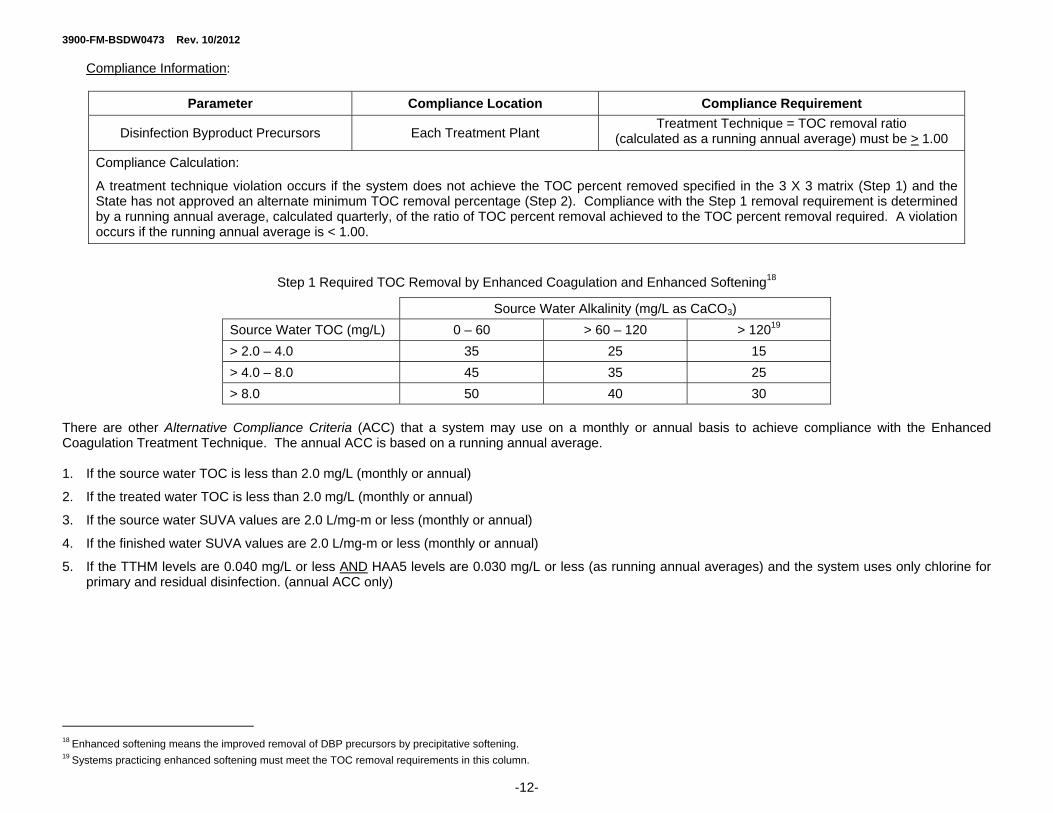
3900-FM-BSDW0473 Rev. 10/2012
-12-
Compliance Information:
Parameter Compliance Location Compliance Requirement
Disinfection Byproduct Precursors Each Treatment Plant Treatment Technique = TOC removal ratio
(calculated as a running annual average) must be > 1.00
Compliance Calculation:
A treatment technique violation occurs if the system does not achieve the TOC percent removed specified in the 3 X 3 matrix (Step 1) and the State has not approved an alternate minimum TOC removal percentage (Step 2). Compliance with the Step 1 removal requirement is determined by a running annual average, calculated quarterly, of the ratio of TOC percent removal achieved to the TOC percent removal required. A violation occurs if the running annual average is < 1.00.
Step 1 Required TOC Removal by Enhanced Coagulation and Enhanced Softening18
Source Water Alkalinity (mg/L as CaCO3)
Source Water TOC (mg/L) 0 – 60 > 60 – 120 > 12019
> 2.0 – 4.0 35 25 15
> 4.0 – 8.0 45 35 25
> 8.0 50 40 30
There are other Alternative Compliance Criteria (ACC) that a system may use on a monthly or annual basis to achieve compliance with the Enhanced Coagulation Treatment Technique. The annual ACC is based on a running annual average. 1. If the source water TOC is less than 2.0 mg/L (monthly or annual)
2. If the treated water TOC is less than 2.0 mg/L (monthly or annual)
3. If the source water SUVA values are 2.0 L/mg-m or less (monthly or annual)
4. If the finished water SUVA values are 2.0 L/mg-m or less (monthly or annual)
5. If the TTHM levels are 0.040 mg/L or less AND HAA5 levels are 0.030 mg/L or less (as running annual averages) and the system uses only chlorine for primary and residual disinfection. (annual ACC only)
18 Enhanced softening means the improved removal of DBP precursors by precipitative softening. 19 Systems practicing enhanced softening must meet the TOC removal requirements in this column.
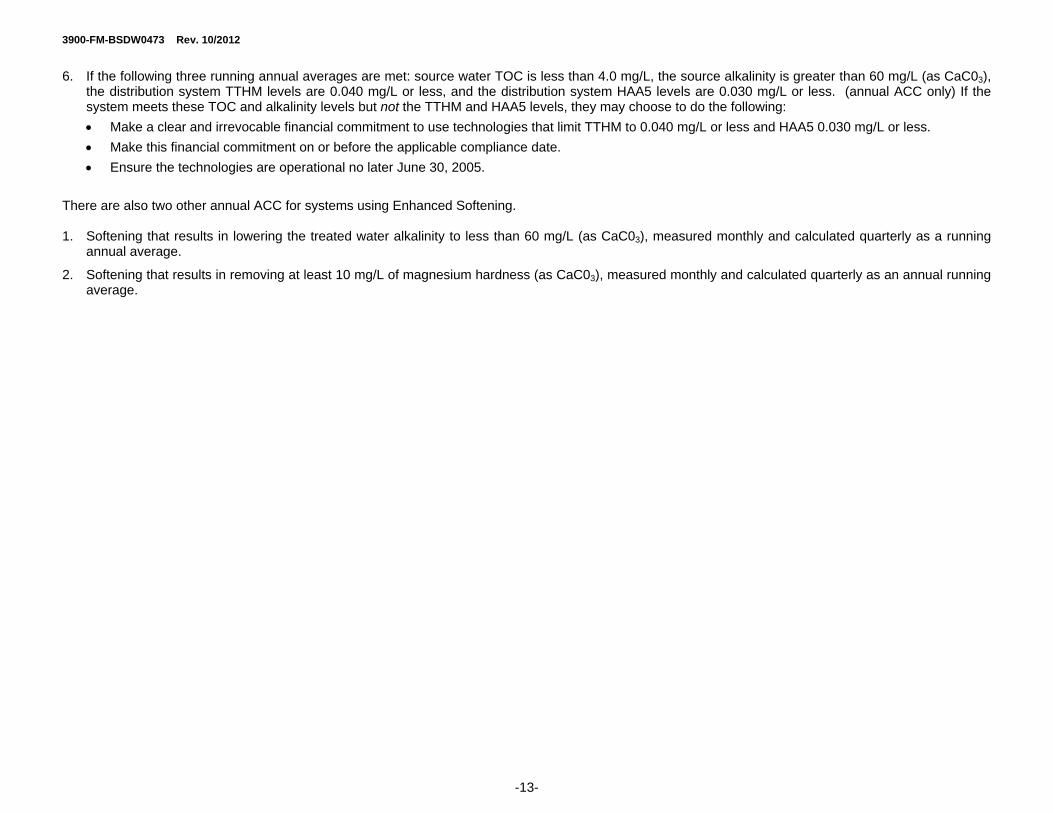
3900-FM-BSDW0473 Rev. 10/2012
-13-
6. If the following three running annual averages are met: source water TOC is less than 4.0 mg/L, the source alkalinity is greater than 60 mg/L (as CaC03), the distribution system TTHM levels are 0.040 mg/L or less, and the distribution system HAA5 levels are 0.030 mg/L or less. (annual ACC only) If the system meets these TOC and alkalinity levels but not the TTHM and HAA5 levels, they may choose to do the following:
Make a clear and irrevocable financial commitment to use technologies that limit TTHM to 0.040 mg/L or less and HAA5 0.030 mg/L or less.
Make this financial commitment on or before the applicable compliance date.
Ensure the technologies are operational no later June 30, 2005.
There are also two other annual ACC for systems using Enhanced Softening. 1. Softening that results in lowering the treated water alkalinity to less than 60 mg/L (as CaC03), measured monthly and calculated quarterly as a running
annual average.
2. Softening that results in removing at least 10 mg/L of magnesium hardness (as CaC03), measured monthly and calculated quarterly as an annual running average.
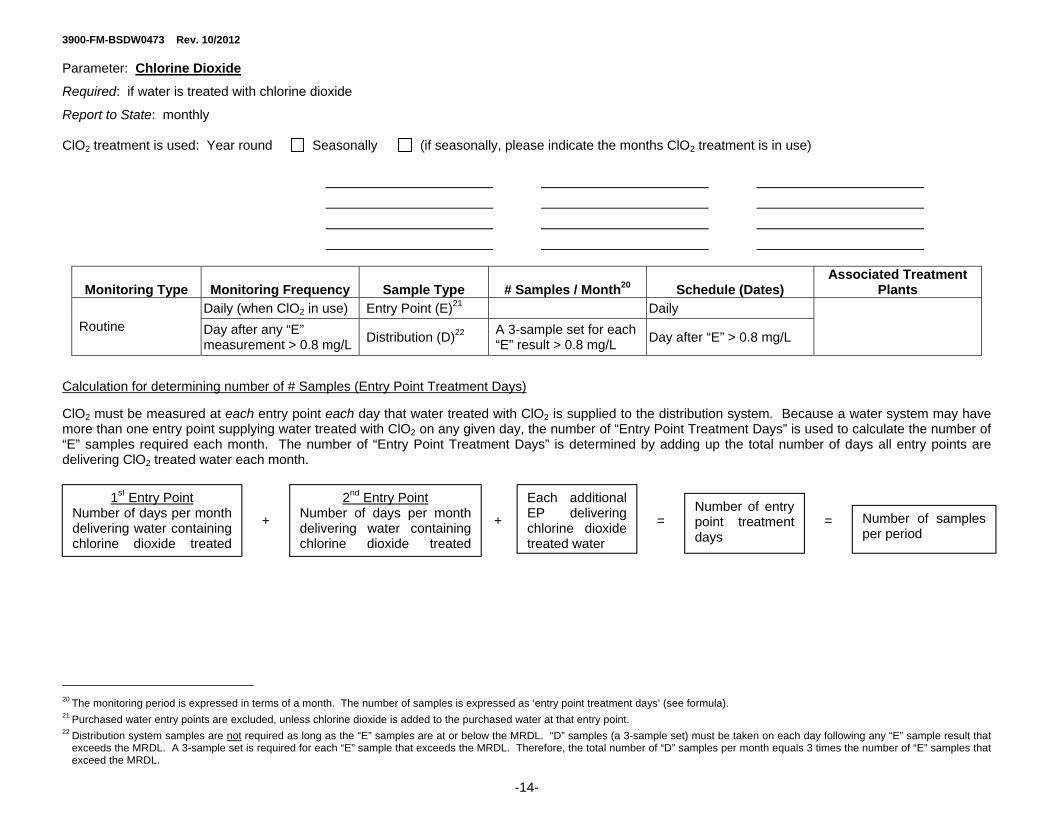
3900-FM-BSDW0473 Rev. 10/2012
-14-
Parameter: Chlorine Dioxide
Required: if water is treated with chlorine dioxide
Report to State: monthly ClO2 treatment is used: Year round Seasonally (if seasonally, please indicate the months ClO2 treatment is in use)
Monitoring Type Monitoring Frequency Sample Type # Samples / Month20 Schedule (Dates) Associated Treatment
Plants
Routine Daily (when ClO2 in use) Entry Point (E)21 Daily
Day after any “E” measurement > 0.8 mg/L
Distribution (D)22 A 3-sample set for each “E” result > 0.8 mg/L
Day after “E” > 0.8 mg/L
Calculation for determining number of # Samples (Entry Point Treatment Days)
ClO2 must be measured at each entry point each day that water treated with ClO2 is supplied to the distribution system. Because a water system may have more than one entry point supplying water treated with ClO2 on any given day, the number of “Entry Point Treatment Days” is used to calculate the number of “E” samples required each month. The number of “Entry Point Treatment Days” is determined by adding up the total number of days all entry points are delivering ClO2 treated water each month. + + = =
20 The monitoring period is expressed in terms of a month. The number of samples is expressed as ‘entry point treatment days’ (see formula). 21 Purchased water entry points are excluded, unless chlorine dioxide is added to the purchased water at that entry point. 22 Distribution system samples are not required as long as the “E” samples are at or below the MRDL. “D” samples (a 3-sample set) must be taken on each day following any “E” sample result that
exceeds the MRDL. A 3-sample set is required for each “E” sample that exceeds the MRDL. Therefore, the total number of “D” samples per month equals 3 times the number of “E” samples that exceed the MRDL.
1st Entry Point Number of days per month delivering water containing chlorine dioxide treated
2nd Entry Point Number of days per month delivering water containing chlorine dioxide treated
Number of entry point treatment days
Number of samples per period
Each additional EP delivering chlorine dioxide treated water
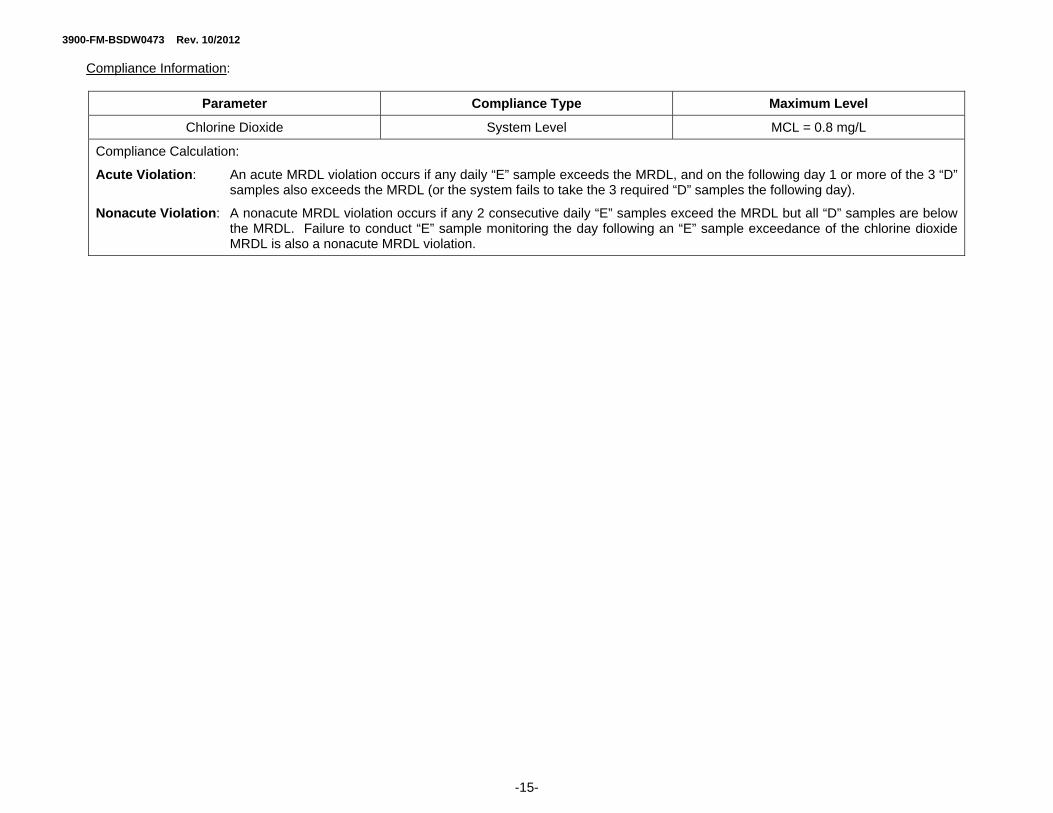
3900-FM-BSDW0473 Rev. 10/2012
-15-
Compliance Information:
Parameter Compliance Type Maximum Level
Chlorine Dioxide System Level MCL = 0.8 mg/L
Compliance Calculation:
Acute Violation: An acute MRDL violation occurs if any daily “E” sample exceeds the MRDL, and on the following day 1 or more of the 3 “D” samples also exceeds the MRDL (or the system fails to take the 3 required “D” samples the following day).
Nonacute Violation: A nonacute MRDL violation occurs if any 2 consecutive daily “E” samples exceed the MRDL but all “D” samples are below the MRDL. Failure to conduct “E” sample monitoring the day following an “E” sample exceedance of the chlorine dioxide MRDL is also a nonacute MRDL violation.
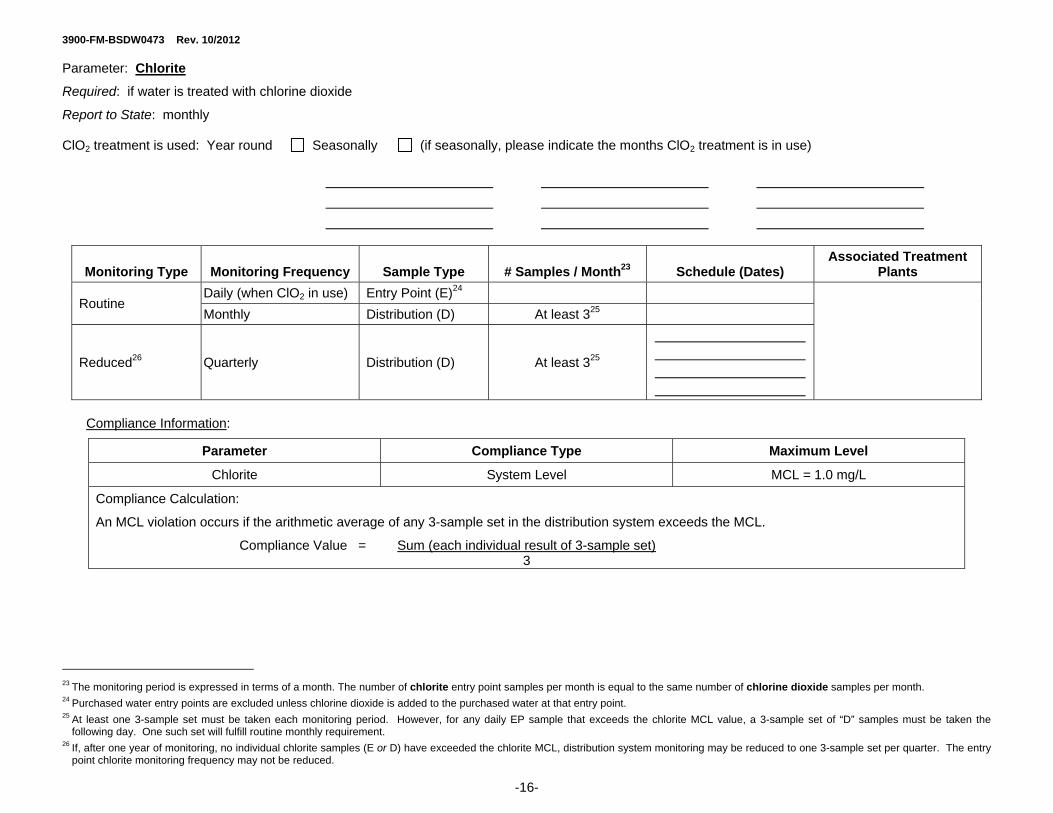
3900-FM-BSDW0473 Rev. 10/2012
-16-
Parameter: Chlorite
Required: if water is treated with chlorine dioxide
Report to State: monthly ClO2 treatment is used: Year round Seasonally (if seasonally, please indicate the months ClO2 treatment is in use)
Monitoring Type Monitoring Frequency Sample Type # Samples / Month23 Schedule (Dates) Associated Treatment
Plants
Routine Daily (when ClO2 in use) Entry Point (E)24
Monthly Distribution (D) At least 325
Reduced26 Quarterly Distribution (D) At least 325
Compliance Information:
Parameter Compliance Type Maximum Level
Chlorite System Level MCL = 1.0 mg/L
Compliance Calculation:
An MCL violation occurs if the arithmetic average of any 3-sample set in the distribution system exceeds the MCL.
Compliance Value = Sum (each individual result of 3-sample set) 3
23 The monitoring period is expressed in terms of a month. The number of chlorite entry point samples per month is equal to the same number of chlorine dioxide samples per month. 24 Purchased water entry points are excluded unless chlorine dioxide is added to the purchased water at that entry point. 25 At least one 3-sample set must be taken each monitoring period. However, for any daily EP sample that exceeds the chlorite MCL value, a 3-sample set of “D” samples must be taken the
following day. One such set will fulfill routine monthly requirement. 26 If, after one year of monitoring, no individual chlorite samples (E or D) have exceeded the chlorite MCL, distribution system monitoring may be reduced to one 3-sample set per quarter. The entry
point chlorite monitoring frequency may not be reduced.
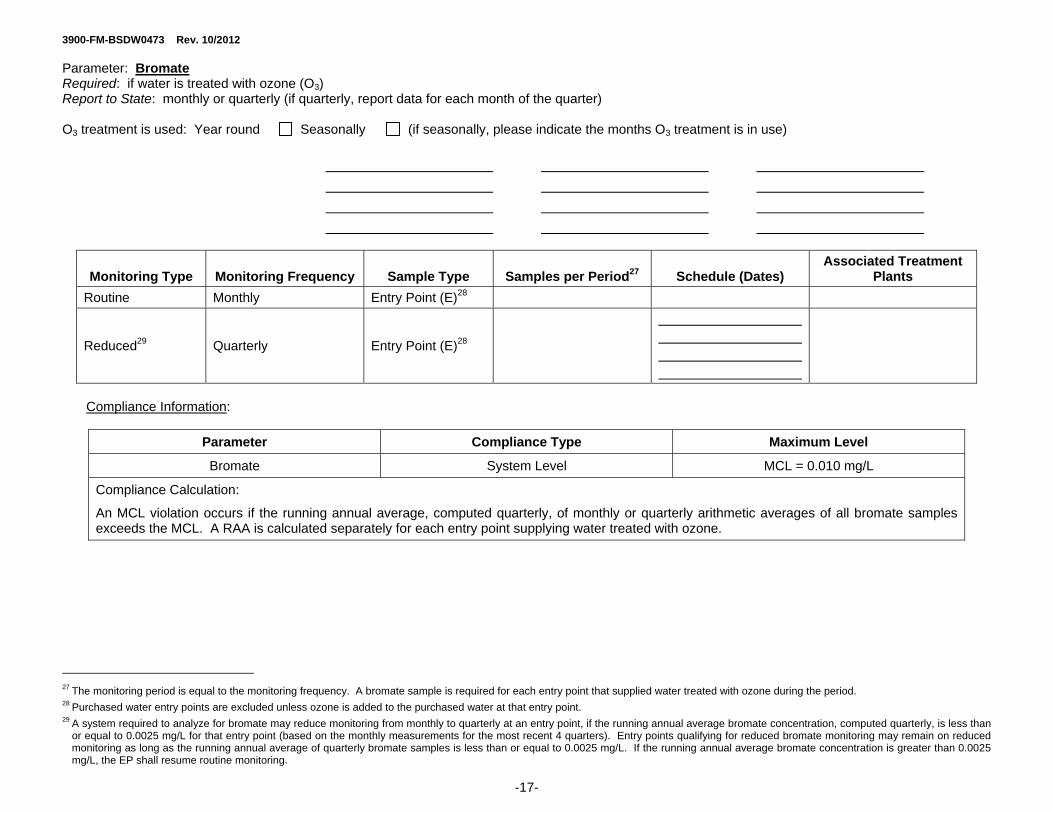
3900-FM-BSDW0473 Rev. 10/2012
-17-
Parameter: Bromate Required: if water is treated with ozone (O3) Report to State: monthly or quarterly (if quarterly, report data for each month of the quarter) O3 treatment is used: Year round Seasonally (if seasonally, please indicate the months O3 treatment is in use)
Monitoring Type Monitoring Frequency Sample Type Samples per Period27 Schedule (Dates) Associated Treatment
Plants
Routine Monthly Entry Point (E)28
Reduced29 Quarterly Entry Point (E)28
Compliance Information:
Parameter Compliance Type Maximum Level
Bromate System Level MCL = 0.010 mg/L
Compliance Calculation:
An MCL violation occurs if the running annual average, computed quarterly, of monthly or quarterly arithmetic averages of all bromate samples exceeds the MCL. A RAA is calculated separately for each entry point supplying water treated with ozone.
27 The monitoring period is equal to the monitoring frequency. A bromate sample is required for each entry point that supplied water treated with ozone during the period. 28 Purchased water entry points are excluded unless ozone is added to the purchased water at that entry point. 29 A system required to analyze for bromate may reduce monitoring from monthly to quarterly at an entry point, if the running annual average bromate concentration, computed quarterly, is less than
or equal to 0.0025 mg/L for that entry point (based on the monthly measurements for the most recent 4 quarters). Entry points qualifying for reduced bromate monitoring may remain on reduced monitoring as long as the running annual average of quarterly bromate samples is less than or equal to 0.0025 mg/L. If the running annual average bromate concentration is greater than 0.0025 mg/L, the EP shall resume routine monitoring.
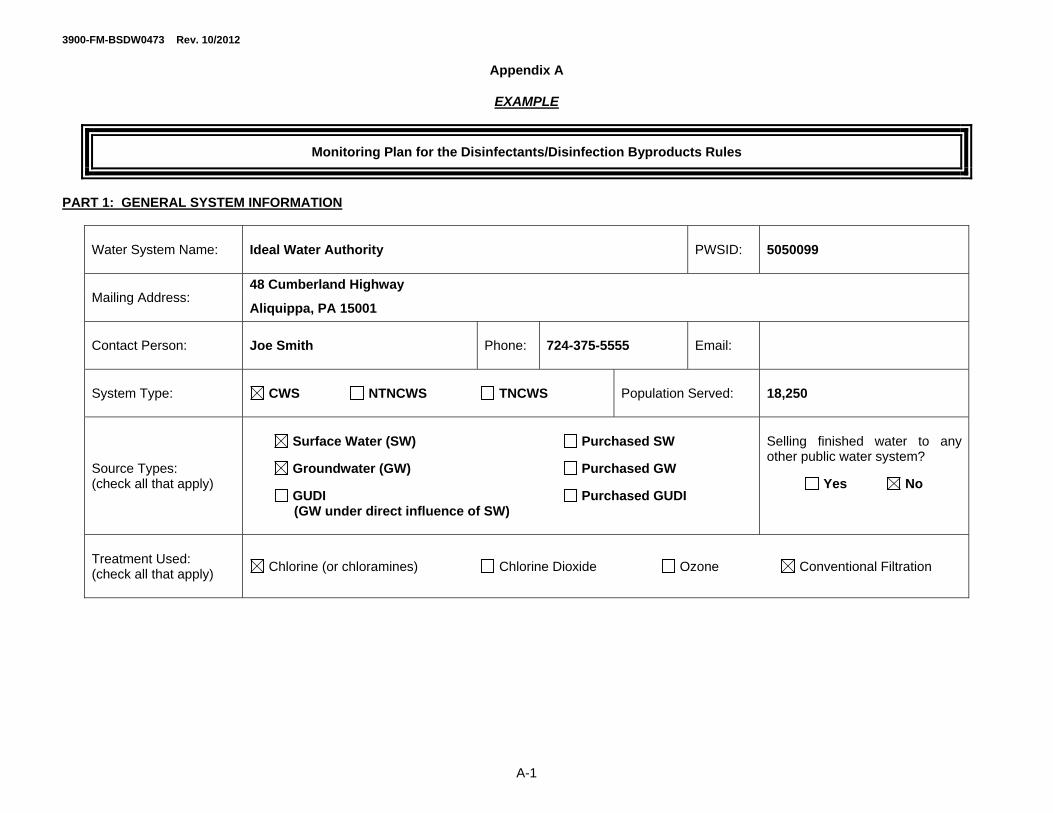
3900-FM-BSDW0473 Rev. 10/2012
A-1
Appendix A
EXAMPLE
Monitoring Plan for the Disinfectants/Disinfection Byproducts Rules
PART 1: GENERAL SYSTEM INFORMATION
Water System Name: Ideal Water Authority PWSID: 5050099
Mailing Address: 48 Cumberland Highway
Aliquippa, PA 15001
Contact Person: Joe Smith Phone: 724-375-5555 Email:
System Type: CWS NTNCWS TNCWS Population Served: 18,250
Source Types: (check all that apply)
Surface Water (SW) Purchased SW
Groundwater (GW) Purchased GW
GUDI Purchased GUDI (GW under direct influence of SW)
Selling finished water to any other public water system?
Yes No
Treatment Used: (check all that apply)
Chlorine (or chloramines) Chlorine Dioxide Ozone Conventional Filtration
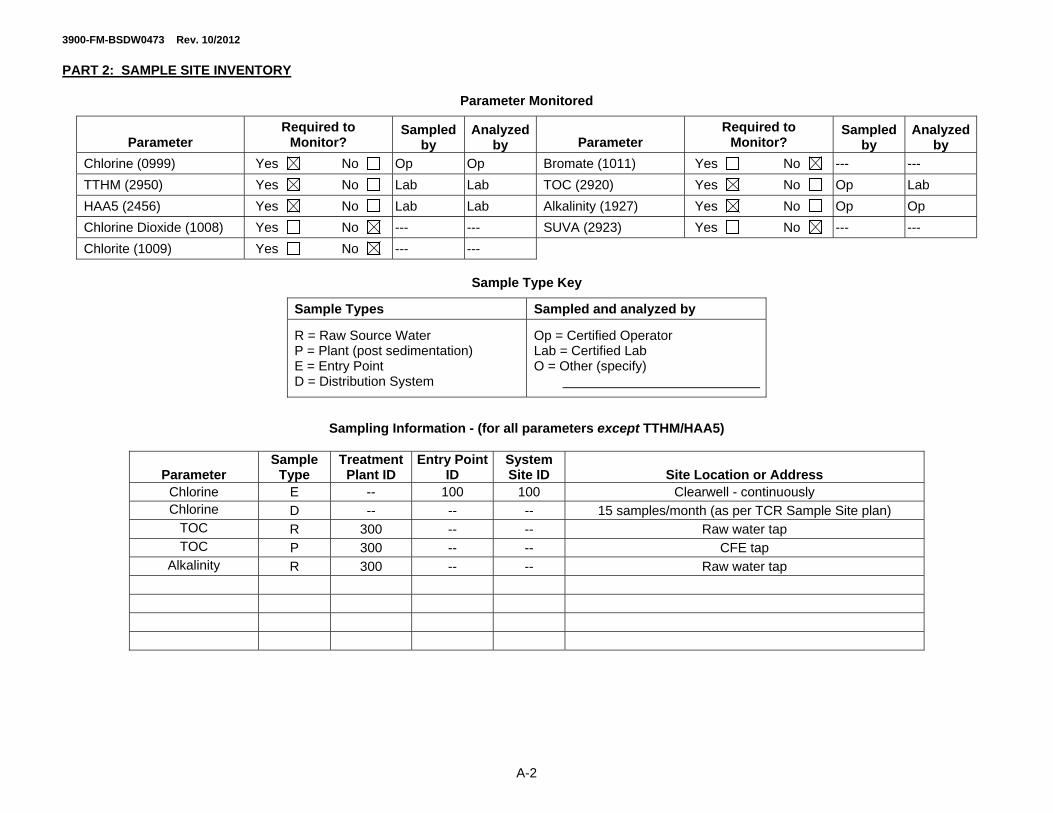
3900-FM-BSDW0473 Rev. 10/2012
A-2
PART 2: SAMPLE SITE INVENTORY
Parameter Monitored
Parameter Required to
Monitor? Sampled
by Analyzed
by Parameter Required to
Monitor? Sampled
by Analyzed
by
Chlorine (0999) Yes No Op Op Bromate (1011) Yes No --- ---
TTHM (2950) Yes No Lab Lab TOC (2920) Yes No Op Lab
HAA5 (2456) Yes No Lab Lab Alkalinity (1927) Yes No Op Op
Chlorine Dioxide (1008) Yes No --- --- SUVA (2923) Yes No --- ---
Chlorite (1009) Yes No --- ---
Sample Type Key
Sample Types Sampled and analyzed by
R = Raw Source Water P = Plant (post sedimentation) E = Entry Point D = Distribution System
Op = Certified Operator Lab = Certified Lab O = Other (specify)
Sampling Information - (for all parameters except TTHM/HAA5)
Parameter Sample
Type Treatment
Plant ID Entry Point
ID System Site ID Site Location or Address
Chlorine E -- 100 100 Clearwell - continuously Chlorine D -- -- -- 15 samples/month (as per TCR Sample Site plan)
TOC R 300 -- -- Raw water tap TOC P 300 -- -- CFE tap
Alkalinity R 300 -- -- Raw water tap
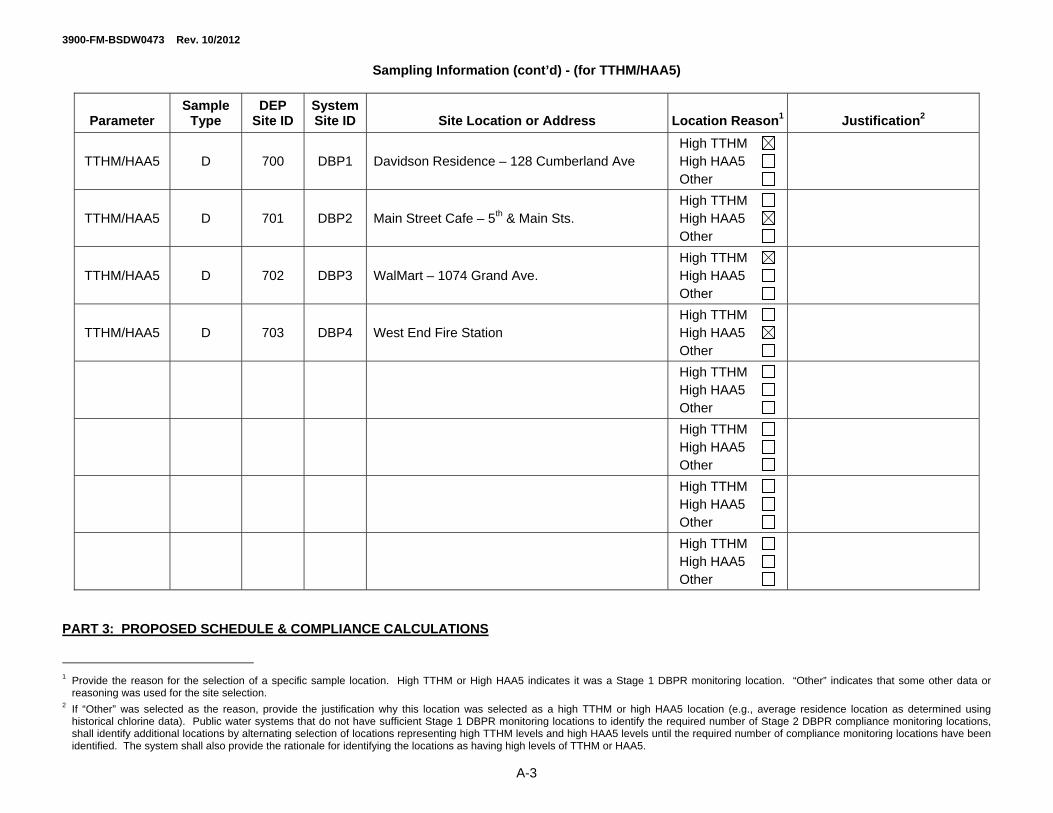
3900-FM-BSDW0473 Rev. 10/2012
A-3
Sampling Information (cont’d) - (for TTHM/HAA5)
Parameter Sample
Type DEP
Site ID System Site ID Site Location or Address Location Reason1 Justification2
TTHM/HAA5 D 700 DBP1 Davidson Residence – 128 Cumberland Ave High TTHM High HAA5 Other
TTHM/HAA5 D 701 DBP2 Main Street Cafe – 5th & Main Sts. High TTHM High HAA5 Other
TTHM/HAA5 D 702 DBP3 WalMart – 1074 Grand Ave. High TTHM High HAA5 Other
TTHM/HAA5 D 703 DBP4 West End Fire Station High TTHM High HAA5 Other
High TTHM High HAA5 Other
High TTHM High HAA5 Other
High TTHM High HAA5 Other
High TTHM High HAA5 Other
PART 3: PROPOSED SCHEDULE & COMPLIANCE CALCULATIONS 1 Provide the reason for the selection of a specific sample location. High TTHM or High HAA5 indicates it was a Stage 1 DBPR monitoring location. “Other” indicates that some other data or
reasoning was used for the site selection. 2 If “Other” was selected as the reason, provide the justification why this location was selected as a high TTHM or high HAA5 location (e.g., average residence location as determined using
historical chlorine data). Public water systems that do not have sufficient Stage 1 DBPR monitoring locations to identify the required number of Stage 2 DBPR compliance monitoring locations, shall identify additional locations by alternating selection of locations representing high TTHM levels and high HAA5 levels until the required number of compliance monitoring locations have been identified. The system shall also provide the rationale for identifying the locations as having high levels of TTHM or HAA5.
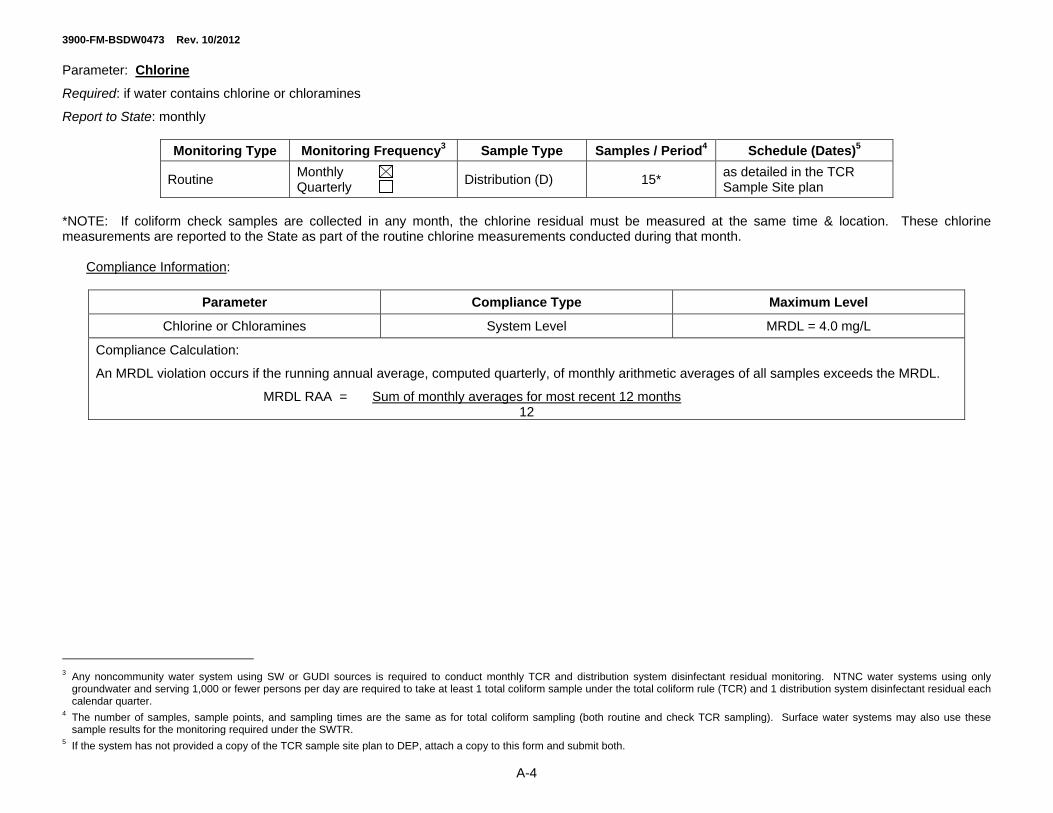
3900-FM-BSDW0473 Rev. 10/2012
A-4
Parameter: Chlorine
Required: if water contains chlorine or chloramines
Report to State: monthly
Monitoring Type Monitoring Frequency3 Sample Type Samples / Period4 Schedule (Dates)5
Routine Monthly Quarterly
Distribution (D) 15* as detailed in the TCR Sample Site plan
*NOTE: If coliform check samples are collected in any month, the chlorine residual must be measured at the same time & location. These chlorine measurements are reported to the State as part of the routine chlorine measurements conducted during that month.
Compliance Information:
Parameter Compliance Type Maximum Level
Chlorine or Chloramines System Level MRDL = 4.0 mg/L
Compliance Calculation:
An MRDL violation occurs if the running annual average, computed quarterly, of monthly arithmetic averages of all samples exceeds the MRDL.
MRDL RAA = Sum of monthly averages for most recent 12 months 12
3 Any noncommunity water system using SW or GUDI sources is required to conduct monthly TCR and distribution system disinfectant residual monitoring. NTNC water systems using only
groundwater and serving 1,000 or fewer persons per day are required to take at least 1 total coliform sample under the total coliform rule (TCR) and 1 distribution system disinfectant residual each calendar quarter.
4 The number of samples, sample points, and sampling times are the same as for total coliform sampling (both routine and check TCR sampling). Surface water systems may also use these sample results for the monitoring required under the SWTR.
5 If the system has not provided a copy of the TCR sample site plan to DEP, attach a copy to this form and submit both.
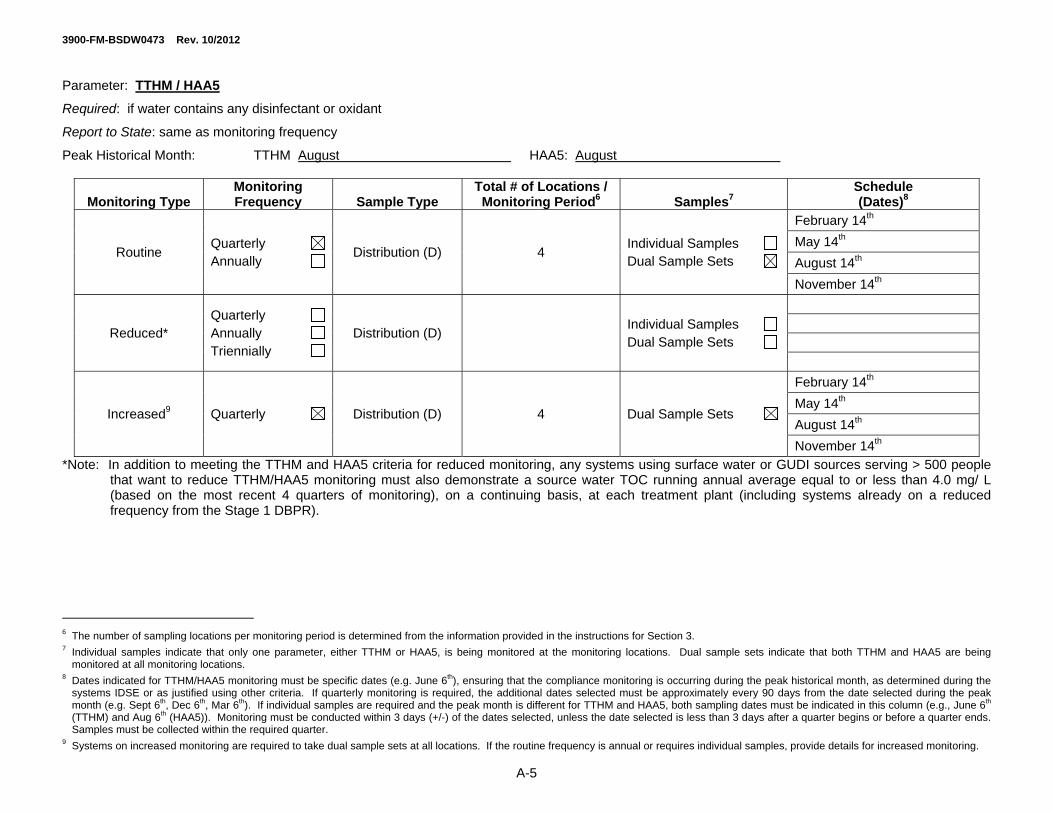
3900-FM-BSDW0473 Rev. 10/2012
A-5
Parameter: TTHM / HAA5
Required: if water contains any disinfectant or oxidant
Report to State: same as monitoring frequency
Peak Historical Month: TTHM August HAA5: August
Monitoring Type Monitoring Frequency Sample Type
Total # of Locations / Monitoring Period6 Samples7
Schedule (Dates)8
Routine Quarterly Annually
Distribution (D) 4 Individual Samples Dual Sample Sets
February 14th
May 14th
August 14th
November 14th
Reduced* Quarterly Annually Triennially
Distribution (D) Individual Samples Dual Sample Sets
Increased9 Quarterly Distribution (D) 4 Dual Sample Sets
February 14th
May 14th
August 14th
November 14th
*Note: In addition to meeting the TTHM and HAA5 criteria for reduced monitoring, any systems using surface water or GUDI sources serving > 500 people that want to reduce TTHM/HAA5 monitoring must also demonstrate a source water TOC running annual average equal to or less than 4.0 mg/ L (based on the most recent 4 quarters of monitoring), on a continuing basis, at each treatment plant (including systems already on a reduced frequency from the Stage 1 DBPR).
6 The number of sampling locations per monitoring period is determined from the information provided in the instructions for Section 3. 7 Individual samples indicate that only one parameter, either TTHM or HAA5, is being monitored at the monitoring locations. Dual sample sets indicate that both TTHM and HAA5 are being
monitored at all monitoring locations. 8 Dates indicated for TTHM/HAA5 monitoring must be specific dates (e.g. June 6th), ensuring that the compliance monitoring is occurring during the peak historical month, as determined during the
systems IDSE or as justified using other criteria. If quarterly monitoring is required, the additional dates selected must be approximately every 90 days from the date selected during the peak month (e.g. Sept 6th, Dec 6th, Mar 6th). If individual samples are required and the peak month is different for TTHM and HAA5, both sampling dates must be indicated in this column (e.g., June 6th (TTHM) and Aug 6th (HAA5)). Monitoring must be conducted within 3 days (+/-) of the dates selected, unless the date selected is less than 3 days after a quarter begins or before a quarter ends. Samples must be collected within the required quarter.
9 Systems on increased monitoring are required to take dual sample sets at all locations. If the routine frequency is annual or requires individual samples, provide details for increased monitoring.
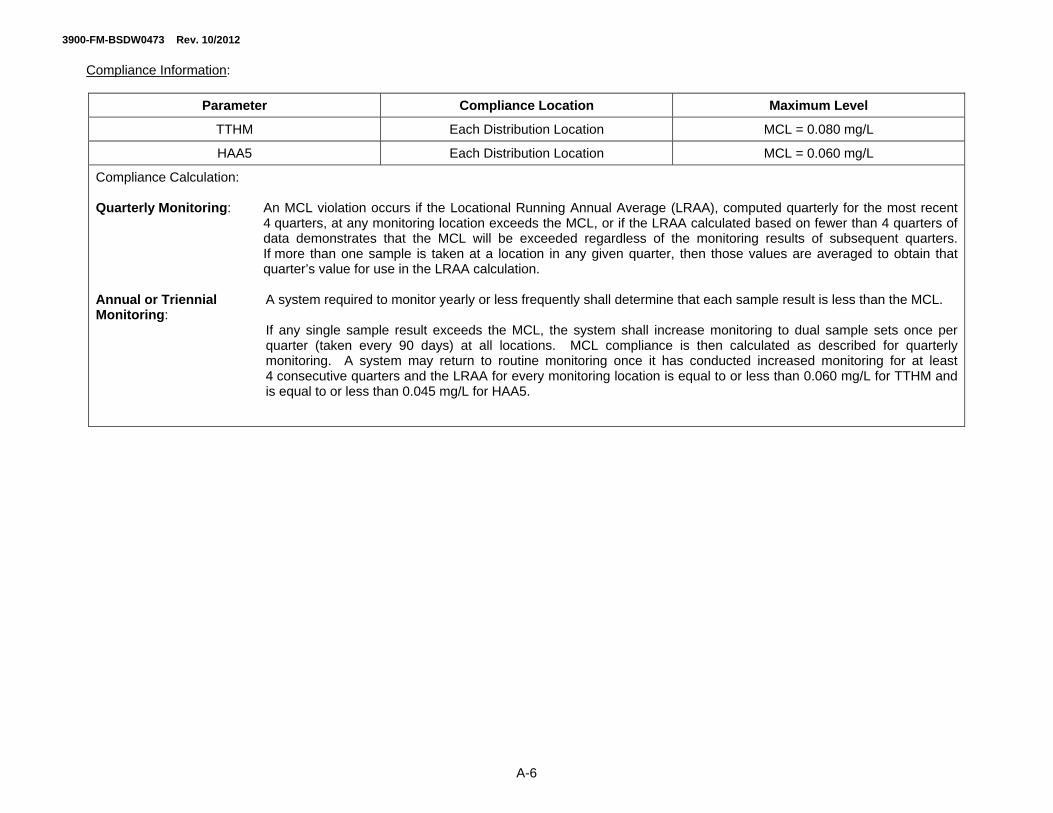
3900-FM-BSDW0473 Rev. 10/2012
A-6
Compliance Information:
Parameter Compliance Location Maximum Level
TTHM Each Distribution Location MCL = 0.080 mg/L
HAA5 Each Distribution Location MCL = 0.060 mg/L
Compliance Calculation: Quarterly Monitoring: An MCL violation occurs if the Locational Running Annual Average (LRAA), computed quarterly for the most recent
4 quarters, at any monitoring location exceeds the MCL, or if the LRAA calculated based on fewer than 4 quarters of data demonstrates that the MCL will be exceeded regardless of the monitoring results of subsequent quarters. If more than one sample is taken at a location in any given quarter, then those values are averaged to obtain that quarter’s value for use in the LRAA calculation.
Annual or Triennial A system required to monitor yearly or less frequently shall determine that each sample result is less than the MCL. Monitoring: If any single sample result exceeds the MCL, the system shall increase monitoring to dual sample sets once per
quarter (taken every 90 days) at all locations. MCL compliance is then calculated as described for quarterly monitoring. A system may return to routine monitoring once it has conducted increased monitoring for at least 4 consecutive quarters and the LRAA for every monitoring location is equal to or less than 0.060 mg/L for TTHM and is equal to or less than 0.045 mg/L for HAA5.
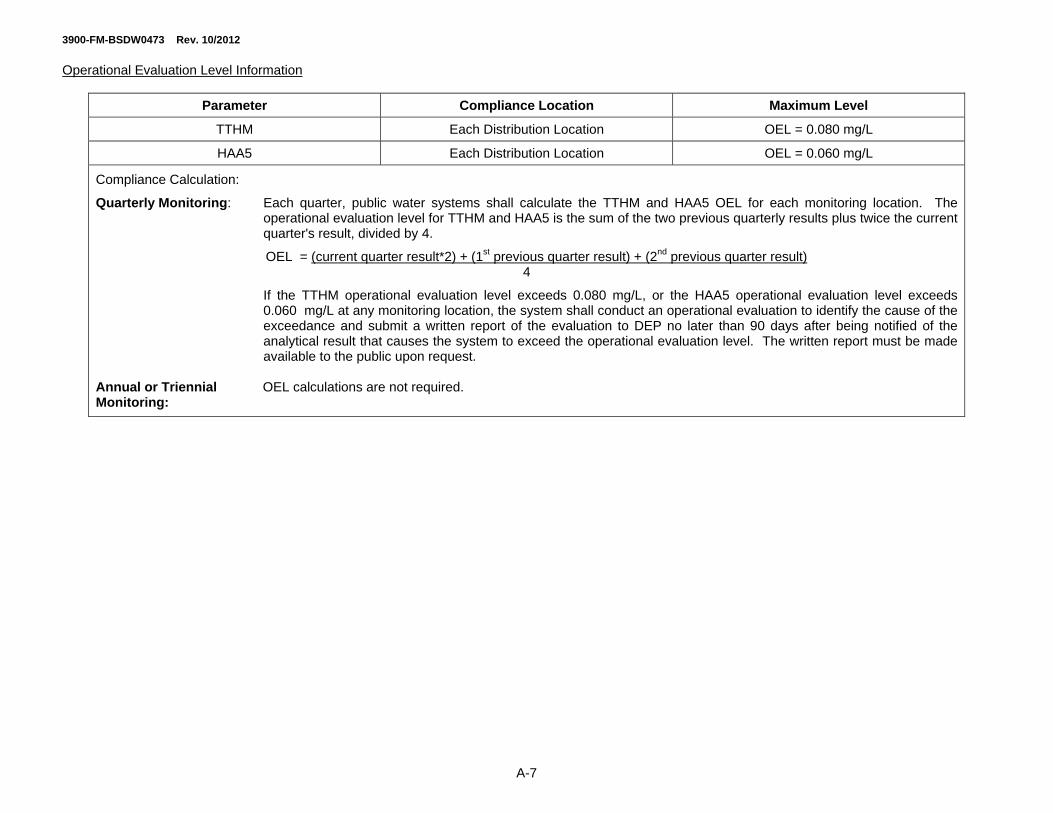
3900-FM-BSDW0473 Rev. 10/2012
A-7
Operational Evaluation Level Information
Parameter Compliance Location Maximum Level
TTHM Each Distribution Location OEL = 0.080 mg/L
HAA5 Each Distribution Location OEL = 0.060 mg/L
Compliance Calculation:
Quarterly Monitoring: Each quarter, public water systems shall calculate the TTHM and HAA5 OEL for each monitoring location. The operational evaluation level for TTHM and HAA5 is the sum of the two previous quarterly results plus twice the current quarter's result, divided by 4.
OEL = (current quarter result*2) + (1st previous quarter result) + (2nd previous quarter result) 4
If the TTHM operational evaluation level exceeds 0.080 mg/L, or the HAA5 operational evaluation level exceeds 0.060 mg/L at any monitoring location, the system shall conduct an operational evaluation to identify the cause of the exceedance and submit a written report of the evaluation to DEP no later than 90 days after being notified of the analytical result that causes the system to exceed the operational evaluation level. The written report must be made available to the public upon request.
Annual or Triennial OEL calculations are not required. Monitoring:
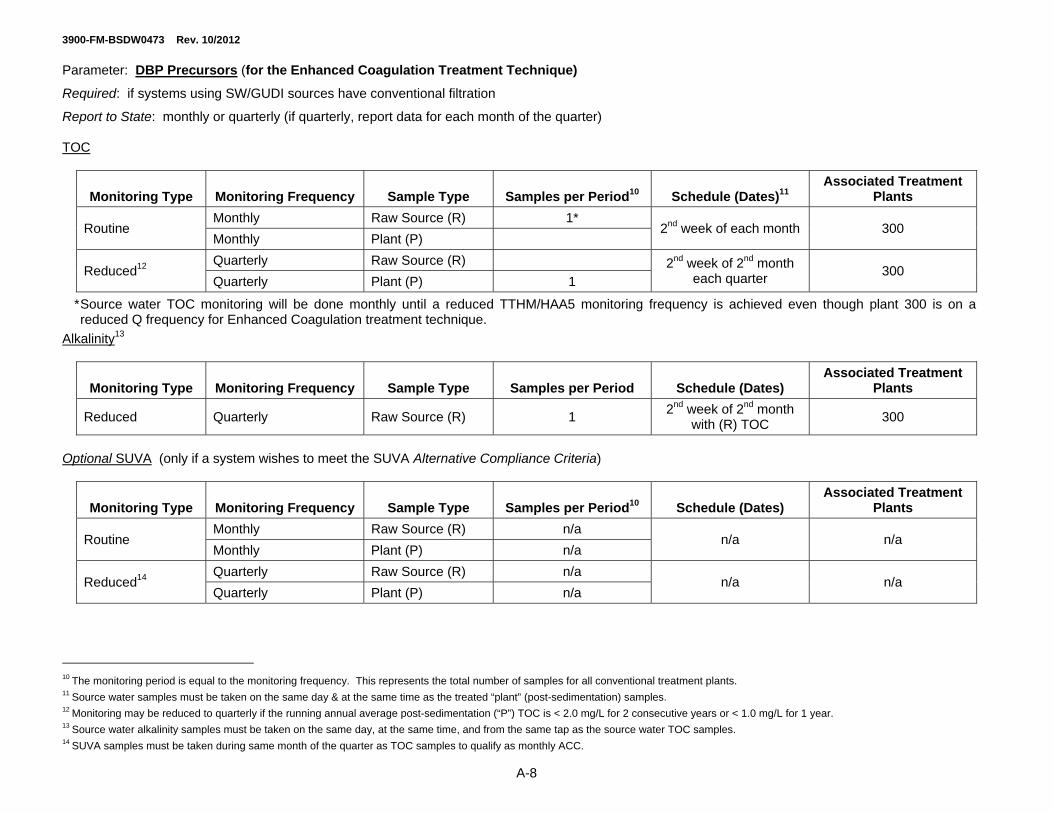
3900-FM-BSDW0473 Rev. 10/2012
A-8
Parameter: DBP Precursors (for the Enhanced Coagulation Treatment Technique)
Required: if systems using SW/GUDI sources have conventional filtration
Report to State: monthly or quarterly (if quarterly, report data for each month of the quarter) TOC
Monitoring Type Monitoring Frequency Sample Type Samples per Period10 Schedule (Dates)11 Associated Treatment
Plants
Routine Monthly Raw Source (R) 1*
2nd week of each month 300 Monthly Plant (P)
Reduced12 Quarterly Raw Source (R) 2nd week of 2nd month
each quarter 300
Quarterly Plant (P) 1
* Source water TOC monitoring will be done monthly until a reduced TTHM/HAA5 monitoring frequency is achieved even though plant 300 is on a reduced Q frequency for Enhanced Coagulation treatment technique.
Alkalinity13
Monitoring Type Monitoring Frequency Sample Type Samples per Period Schedule (Dates) Associated Treatment
Plants
Reduced Quarterly Raw Source (R) 1 2nd week of 2nd month
with (R) TOC 300
Optional SUVA (only if a system wishes to meet the SUVA Alternative Compliance Criteria)
Monitoring Type Monitoring Frequency Sample Type Samples per Period10 Schedule (Dates) Associated Treatment
Plants
Routine Monthly Raw Source (R) n/a
n/a n/a Monthly Plant (P) n/a
Reduced14 Quarterly Raw Source (R) n/a
n/a n/a Quarterly Plant (P) n/a
10 The monitoring period is equal to the monitoring frequency. This represents the total number of samples for all conventional treatment plants. 11 Source water samples must be taken on the same day & at the same time as the treated “plant” (post-sedimentation) samples. 12 Monitoring may be reduced to quarterly if the running annual average post-sedimentation (“P”) TOC is < 2.0 mg/L for 2 consecutive years or < 1.0 mg/L for 1 year. 13 Source water alkalinity samples must be taken on the same day, at the same time, and from the same tap as the source water TOC samples. 14 SUVA samples must be taken during same month of the quarter as TOC samples to qualify as monthly ACC.
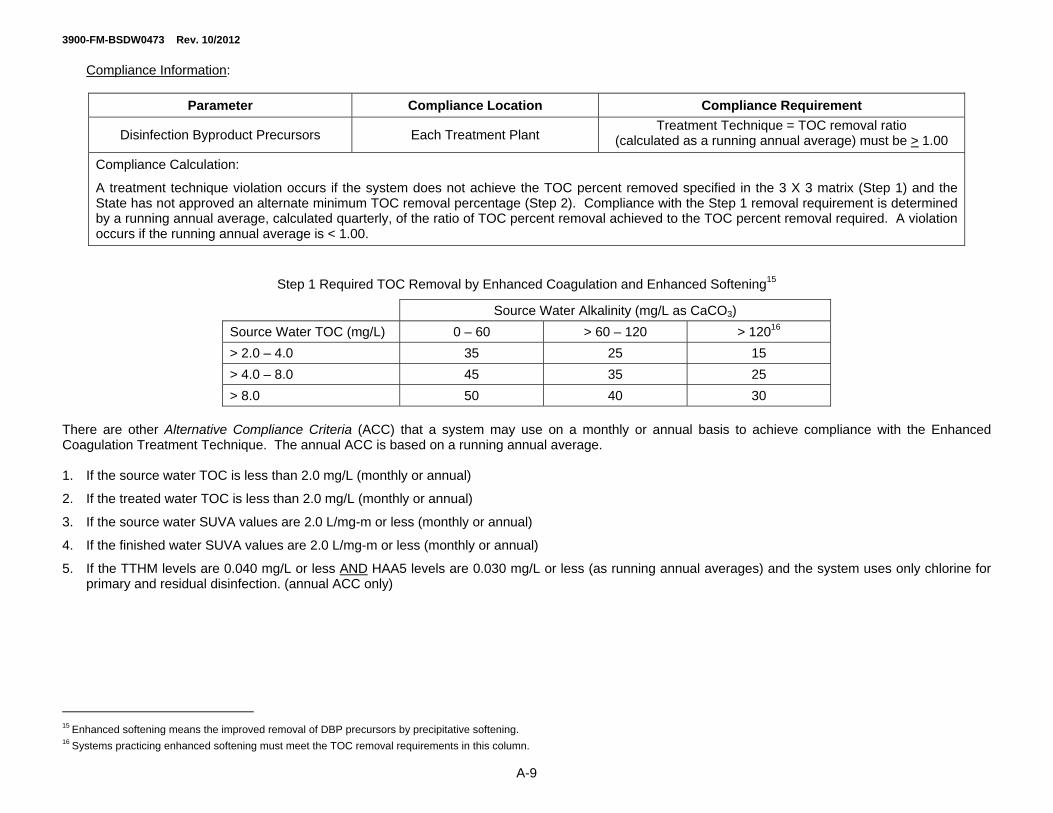
3900-FM-BSDW0473 Rev. 10/2012
A-9
Compliance Information:
Parameter Compliance Location Compliance Requirement
Disinfection Byproduct Precursors Each Treatment Plant Treatment Technique = TOC removal ratio
(calculated as a running annual average) must be > 1.00
Compliance Calculation:
A treatment technique violation occurs if the system does not achieve the TOC percent removed specified in the 3 X 3 matrix (Step 1) and the State has not approved an alternate minimum TOC removal percentage (Step 2). Compliance with the Step 1 removal requirement is determined by a running annual average, calculated quarterly, of the ratio of TOC percent removal achieved to the TOC percent removal required. A violation occurs if the running annual average is < 1.00.
Step 1 Required TOC Removal by Enhanced Coagulation and Enhanced Softening15
Source Water Alkalinity (mg/L as CaCO3)
Source Water TOC (mg/L) 0 – 60 > 60 – 120 > 12016
> 2.0 – 4.0 35 25 15
> 4.0 – 8.0 45 35 25
> 8.0 50 40 30 There are other Alternative Compliance Criteria (ACC) that a system may use on a monthly or annual basis to achieve compliance with the Enhanced Coagulation Treatment Technique. The annual ACC is based on a running annual average. 1. If the source water TOC is less than 2.0 mg/L (monthly or annual)
2. If the treated water TOC is less than 2.0 mg/L (monthly or annual)
3. If the source water SUVA values are 2.0 L/mg-m or less (monthly or annual)
4. If the finished water SUVA values are 2.0 L/mg-m or less (monthly or annual)
5. If the TTHM levels are 0.040 mg/L or less AND HAA5 levels are 0.030 mg/L or less (as running annual averages) and the system uses only chlorine for primary and residual disinfection. (annual ACC only)
15 Enhanced softening means the improved removal of DBP precursors by precipitative softening. 16 Systems practicing enhanced softening must meet the TOC removal requirements in this column.

3900-FM-BSDW0473 Rev. 10/2012
A-10
6. If the following three running annual averages are met: source water TOC is less than 4.0 mg/L, the source alkalinity is greater than 60 mg/L (as CaC03), the distribution system TTHM levels are 0.040 mg/L or less, and the distribution system HAA5 levels are 0.030 mg/L or less. (annual ACC only) If the system meets these TOC and alkalinity levels but not the TTHM and HAA5 levels, they may choose to do the following:
Make a clear and irrevocable financial commitment to use technologies that limit TTHM to 0.040 mg/L or less and HAA5 0.030 mg/L or less.
Make this financial commitment on or before the applicable compliance date.
Ensure the technologies are operational no later June 30, 2005.
There are also two other annual ACC for systems using Enhanced Softening. 1. Softening that results in lowering the treated water alkalinity to less than 60 mg/L (as CaC03), measured monthly and calculated quarterly as a running
annual average.
2. Softening that results in removing at least 10 mg/L of magnesium hardness (as CaC03), measured monthly and calculated quarterly as an annual running average.
3900-FM-BSDW0473 10/2012 COMMONWEALTH OF PENNSYLVANIA Instructions DEPARTMENT OF ENVIRONMENTAL PROTECTION
BUREAU OF SAFE DRINKING WATER
- 1 -
Stage 2 Disinfectants and Disinfection Byproducts Rules Monitoring Plan Instructions
The PA Safe Drinking Water Regulations section § 109.701(e) requires systems monitoring for disinfection byproducts (DBPs), DBP precursors under section § 109.301(12) or disinfectant residuals under section § 109.301(13) to develop and implement a monitoring plan.
Stage 1 DBPR Monitoring Plan (effective until applicable Stage 2 compliance date) Systems required to monitor for disinfection byproducts under § 109.301(12)(i), disinfection byproduct precursors under § 109.301(12)(v) or disinfectant residuals under § 109.301(13) shall develop and implement a monitoring plan.
All community water systems (CWS) and nontransient noncommunity (NTNC) water systems using a primary or residual disinfectant other than ultraviolet light or that deliver water that has been treated with a primary or residual disinfectant other than ultraviolet light in existence at the time the Stage 1 DBPR was promulgated were required to develop a Stage 1 Disinfectants/Disinfection Byproducts Rule (Stage 1 DBPR) monitoring plan. Systems were required to submit a copy of their plan to DEP in either 2002 or 2004.
The Department of Environmental Protection (DEP) may also require systems that begin operation after 2004 to develop and submit a Stage 1 DBPR monitoring plan. After review, DEP may require changes in any of the plan components.
At a minimum each monitoring plan must include:
Specific schedule and locations for collecting DBPs or disinfectant residual samples.
Calculations for determining compliance with the MCLs, MRDLs and treatment techniques.
Distribution sampling locations for both selling water systems and purchasing water systems (i.e. must be reflective of the entire distribution system involved in the sampling.)
The monitoring plan must be maintained and made available for inspection by DEP and the general public. Water systems must notify DEP of any monitoring plan revisions when they occur and submit a revised monitoring plan within 30 days of notifying DEP of the revision. Water systems may add a schematic drawing of sources, treatment facilities and chemicals applied, and sampling points for further clarification of the sampling plan. Please include source IDs, treatment plant IDs and sample point IDs with any such drawings.
Stage 2 DBPR Monitoring Plan
Under the Stage 2 Disinfectants/Disinfection Byproducts Rule (Stage 2 DBPR), all CWS and NTNC systems using a primary or residual disinfectant other than ultraviolet light or that delivers water that has been treated with a primary or residual disinfectant other than ultraviolet light shall develop and implement a Stage 2 DBPR monitoring plan. The plan must be kept on file for DEP and public review. A public water system shall also submit a copy of its Stage 2 DBPR monitoring plan to DEP prior to the date specified below unless the system submits an Initial Distribution System Evaluation (IDSE) report containing all the information required in a monitoring plan.
Water systems serving 100,000 or more people must submit a copy of the DBP monitoring plan prior to April 1, 2012
Water systems serving from 50,000 to 99,999 people must submit a copy of the DBP monitoring plan prior to October 1, 2012
Water systems serving from 10,000 to 49,999 people must submit a copy of the DBP monitoring plan prior to October 1, 2013
Water systems serving less than 10,000 people must submit a copy of the DBP monitoring plan prior to:
o October 1, 2013, if Cryptosporidium monitoring is not required under the Long Term 2 Enhanced Surface Water Treatment Rule
o October 1, 2014, if Cryptosporidium monitoring is required under the Long Term 2 Enhanced Surface Water Treatment Rule
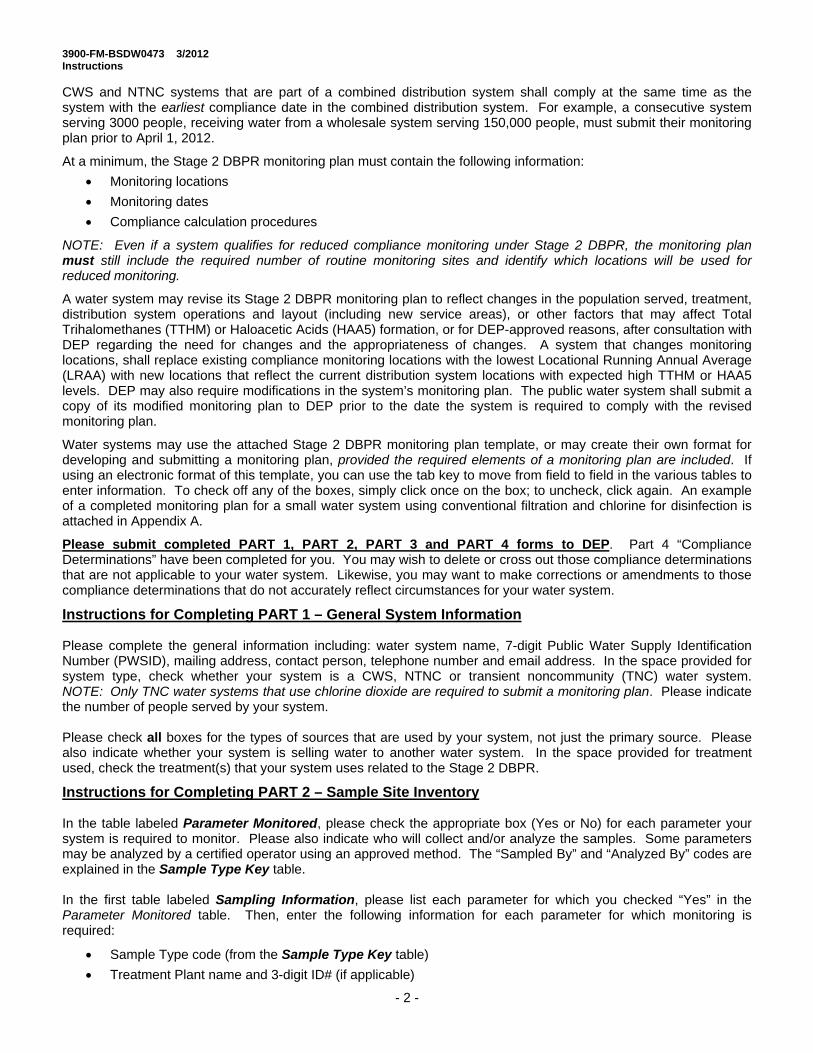
3900-FM-BSDW0473 3/2012 Instructions
- 2 -
CWS and NTNC systems that are part of a combined distribution system shall comply at the same time as the system with the earliest compliance date in the combined distribution system. For example, a consecutive system serving 3000 people, receiving water from a wholesale system serving 150,000 people, must submit their monitoring plan prior to April 1, 2012.
At a minimum, the Stage 2 DBPR monitoring plan must contain the following information:
Monitoring locations
Monitoring dates
Compliance calculation procedures
NOTE: Even if a system qualifies for reduced compliance monitoring under Stage 2 DBPR, the monitoring plan must still include the required number of routine monitoring sites and identify which locations will be used for reduced monitoring.
A water system may revise its Stage 2 DBPR monitoring plan to reflect changes in the population served, treatment, distribution system operations and layout (including new service areas), or other factors that may affect Total Trihalomethanes (TTHM) or Haloacetic Acids (HAA5) formation, or for DEP-approved reasons, after consultation with DEP regarding the need for changes and the appropriateness of changes. A system that changes monitoring locations, shall replace existing compliance monitoring locations with the lowest Locational Running Annual Average (LRAA) with new locations that reflect the current distribution system locations with expected high TTHM or HAA5 levels. DEP may also require modifications in the system’s monitoring plan. The public water system shall submit a copy of its modified monitoring plan to DEP prior to the date the system is required to comply with the revised monitoring plan.
Water systems may use the attached Stage 2 DBPR monitoring plan template, or may create their own format for developing and submitting a monitoring plan, provided the required elements of a monitoring plan are included. If using an electronic format of this template, you can use the tab key to move from field to field in the various tables to enter information. To check off any of the boxes, simply click once on the box; to uncheck, click again. An example of a completed monitoring plan for a small water system using conventional filtration and chlorine for disinfection is attached in Appendix A.
Please submit completed PART 1, PART 2, PART 3 and PART 4 forms to DEP. Part 4 “Compliance Determinations” have been completed for you. You may wish to delete or cross out those compliance determinations that are not applicable to your water system. Likewise, you may want to make corrections or amendments to those compliance determinations that do not accurately reflect circumstances for your water system.
Instructions for Completing PART 1 – General System Information Please complete the general information including: water system name, 7-digit Public Water Supply Identification Number (PWSID), mailing address, contact person, telephone number and email address. In the space provided for system type, check whether your system is a CWS, NTNC or transient noncommunity (TNC) water system. NOTE: Only TNC water systems that use chlorine dioxide are required to submit a monitoring plan. Please indicate the number of people served by your system. Please check all boxes for the types of sources that are used by your system, not just the primary source. Please also indicate whether your system is selling water to another water system. In the space provided for treatment used, check the treatment(s) that your system uses related to the Stage 2 DBPR.
Instructions for Completing PART 2 – Sample Site Inventory In the table labeled Parameter Monitored, please check the appropriate box (Yes or No) for each parameter your system is required to monitor. Please also indicate who will collect and/or analyze the samples. Some parameters may be analyzed by a certified operator using an approved method. The “Sampled By” and “Analyzed By” codes are explained in the Sample Type Key table. In the first table labeled Sampling Information, please list each parameter for which you checked “Yes” in the Parameter Monitored table. Then, enter the following information for each parameter for which monitoring is required:
Sample Type code (from the Sample Type Key table)
Treatment Plant name and 3-digit ID# (if applicable)
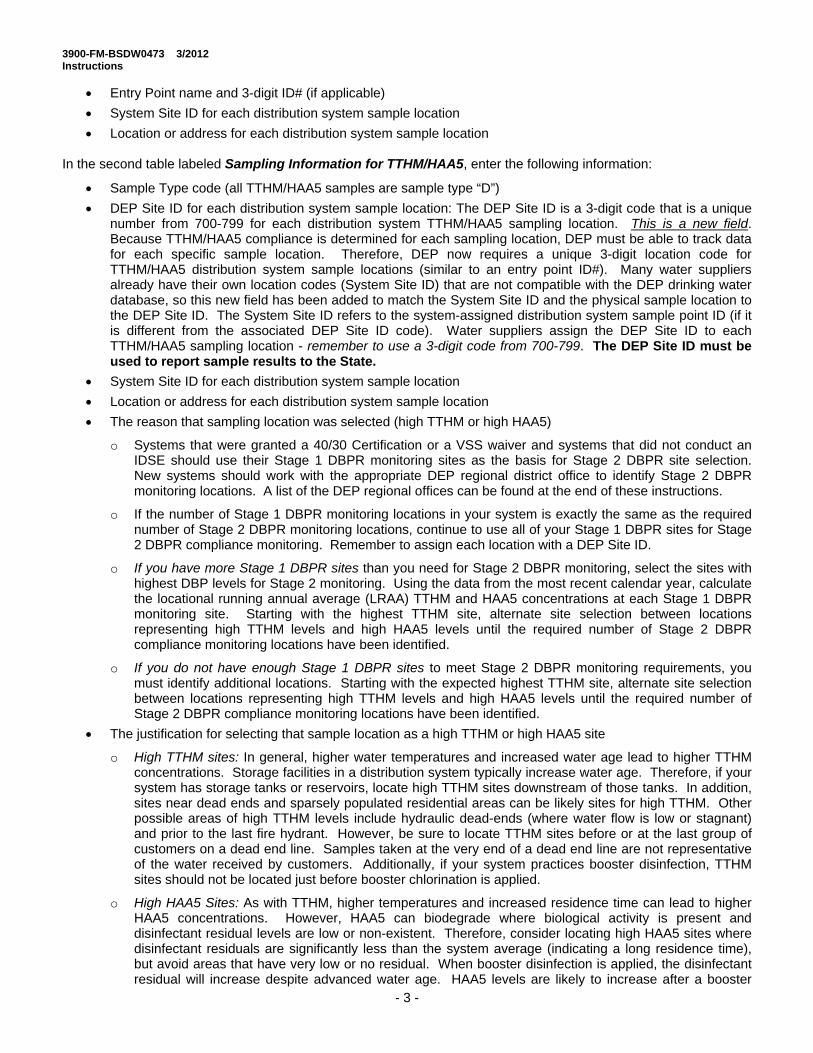
3900-FM-BSDW0473 3/2012 Instructions
- 3 -
Entry Point name and 3-digit ID# (if applicable)
System Site ID for each distribution system sample location
Location or address for each distribution system sample location In the second table labeled Sampling Information for TTHM/HAA5, enter the following information:
Sample Type code (all TTHM/HAA5 samples are sample type “D”)
DEP Site ID for each distribution system sample location: The DEP Site ID is a 3-digit code that is a unique number from 700-799 for each distribution system TTHM/HAA5 sampling location. This is a new field. Because TTHM/HAA5 compliance is determined for each sampling location, DEP must be able to track data for each specific sample location. Therefore, DEP now requires a unique 3-digit location code for TTHM/HAA5 distribution system sample locations (similar to an entry point ID#). Many water suppliers already have their own location codes (System Site ID) that are not compatible with the DEP drinking water database, so this new field has been added to match the System Site ID and the physical sample location to the DEP Site ID. The System Site ID refers to the system-assigned distribution system sample point ID (if it is different from the associated DEP Site ID code). Water suppliers assign the DEP Site ID to each TTHM/HAA5 sampling location - remember to use a 3-digit code from 700-799. The DEP Site ID must be used to report sample results to the State.
System Site ID for each distribution system sample location
Location or address for each distribution system sample location
The reason that sampling location was selected (high TTHM or high HAA5)
o Systems that were granted a 40/30 Certification or a VSS waiver and systems that did not conduct an IDSE should use their Stage 1 DBPR monitoring sites as the basis for Stage 2 DBPR site selection. New systems should work with the appropriate DEP regional district office to identify Stage 2 DBPR monitoring locations. A list of the DEP regional offices can be found at the end of these instructions.
o If the number of Stage 1 DBPR monitoring locations in your system is exactly the same as the required number of Stage 2 DBPR monitoring locations, continue to use all of your Stage 1 DBPR sites for Stage 2 DBPR compliance monitoring. Remember to assign each location with a DEP Site ID.
o If you have more Stage 1 DBPR sites than you need for Stage 2 DBPR monitoring, select the sites with highest DBP levels for Stage 2 monitoring. Using the data from the most recent calendar year, calculate the locational running annual average (LRAA) TTHM and HAA5 concentrations at each Stage 1 DBPR monitoring site. Starting with the highest TTHM site, alternate site selection between locations representing high TTHM levels and high HAA5 levels until the required number of Stage 2 DBPR compliance monitoring locations have been identified.
o If you do not have enough Stage 1 DBPR sites to meet Stage 2 DBPR monitoring requirements, you must identify additional locations. Starting with the expected highest TTHM site, alternate site selection between locations representing high TTHM levels and high HAA5 levels until the required number of Stage 2 DBPR compliance monitoring locations have been identified.
The justification for selecting that sample location as a high TTHM or high HAA5 site
o High TTHM sites: In general, higher water temperatures and increased water age lead to higher TTHM concentrations. Storage facilities in a distribution system typically increase water age. Therefore, if your system has storage tanks or reservoirs, locate high TTHM sites downstream of those tanks. In addition, sites near dead ends and sparsely populated residential areas can be likely sites for high TTHM. Other possible areas of high TTHM levels include hydraulic dead-ends (where water flow is low or stagnant) and prior to the last fire hydrant. However, be sure to locate TTHM sites before or at the last group of customers on a dead end line. Samples taken at the very end of a dead end line are not representative of the water received by customers. Additionally, if your system practices booster disinfection, TTHM sites should not be located just before booster chlorination is applied.
o High HAA5 Sites: As with TTHM, higher temperatures and increased residence time can lead to higher HAA5 concentrations. However, HAA5 can biodegrade where biological activity is present and disinfectant residual levels are low or non-existent. Therefore, consider locating high HAA5 sites where disinfectant residuals are significantly less than the system average (indicating a long residence time), but avoid areas that have very low or no residual. When booster disinfection is applied, the disinfectant residual will increase despite advanced water age. HAA5 levels are likely to increase after a booster
3900-FM-BSDW0473 3/2012 Instructions
- 4 -
disinfectant is applied due to the greater concentration of disinfectant available to react with DBP precursors and the lack of biological activity in these areas. Therefore, if your system practices booster disinfection, locate high HAA5 sites after booster disinfection is applied. Do not select high HAA5 sites in locations that regularly or in the summer months have free chlorine residuals less than 0.2 mg/L or with chloramine residuals less than 0.5 mg/L.
o Final Site Selection: Consider the following issues when making the final site selections:
Select sites that provide the best geographic and hydraulic representation.
Locate sites in as many key areas as possible, including isolated portions of the distribution system, areas downstream of tanks, areas downstream of booster chlorination, and within each pressure zone.
Consider site access issues as each selected site must remain accessible over the long term.
Remember, even if a system qualifies for reduced compliance monitoring under Stage 2 DBPR, the monitoring plan must still include the required number of routine monitoring sites and identify which locations will be used for reduced monitoring.
Instructions for Completing Part 3 - Proposed Schedule & Compliance Calculations The initial number of samples required for each parameter is based on the source water type (SW, groundwater, GUDI or purchased water), population served, and type of treatment (chemicals used). For chlorine dioxide, chlorite and bromate, please indicate whether the treatment (ClO2 or ozone) is used year round or seasonally by checking the appropriate box. If seasonal, please indicate the months the treatment is normally used in the lines below the seasonal check box. Please check the appropriate monitoring period and fill in the number of samples by sample type in accordance with the sampling frequency information as described in the “General Monitoring Information” section. You should also fill in the dates for each monitoring period (e.g., 3rd week of August) that you anticipate collecting samples.
For TTHM/HAA5, always fill in the information for the “Routine” and “Increased” monitoring type. Also, please indicate the peak historical month for both TTHM and HAA5 (i.e. the month with the known or suspected maximum TTHM and HAA5 concentrations), as determined during the systems IDSE or as justified using other criteria identified in these instructions. The monitoring period indicated for TTHM/HAA5 monitoring must be specific dates (e.g. June 6th). Ensure that the compliance monitoring is occurring during the peak historical month. If individual samples are required and the peak month is different for TTHM and HAA5, both sampling dates must be indicated. If quarterly monitoring is required, the additional dates selected must be approximately every 90 days from the date selected during the peak month (e.g. Sept 6th, Dec 6th, Mar 6th). Monitoring must be conducted within 3 days (+/-) of the dates selected, unless the date selected is less than 3 days after a quarter begins or before a quarter ends. Samples must be collected within the required quarter.
Systems that were on reduced monitoring under the Stage 1 DBPR at the time of their Stage 2 DBPR compliance begin date and qualify to remain on reduced monitoring should complete the routine, reduced, increased monitoring information. To remain on reduced monitoring from Stage 1 to Stage 2, the system must meet ALL of the following criteria:
The system qualified for a 40/30 Certification or VSS Waiver for the IDSE requirements; The system meets the Stage 2 DBPR reduced monitoring criteria; The system is not adding or changing locations for routine monitoring.
All other systems must resume routine monitoring or, if on increased monitoring under the Stage 1 DBPR, remain on increased monitoring under the Stage 2 DBPR. You only need to submit proposed schedules for the parameters you are required to monitor, and those parameters you choose to monitor as an option for reduced monitoring or meeting an ACC for TOC removal. For instance, all systems will be required to monitor for TTHM/HAA5 as well as distribution system disinfectant (chlorine) residuals. Only systems using conventional filtration will be required to monitor for TOC and alkalinity, but any system with SW or GUDI sources may choose to monitor for TOC. In Pennsylvania, compliance determinations will be performed by the state. The compliance calculations that are provided are for reference only. These calculations fulfill the requirements of the S2 DBPR and may be submitted “as
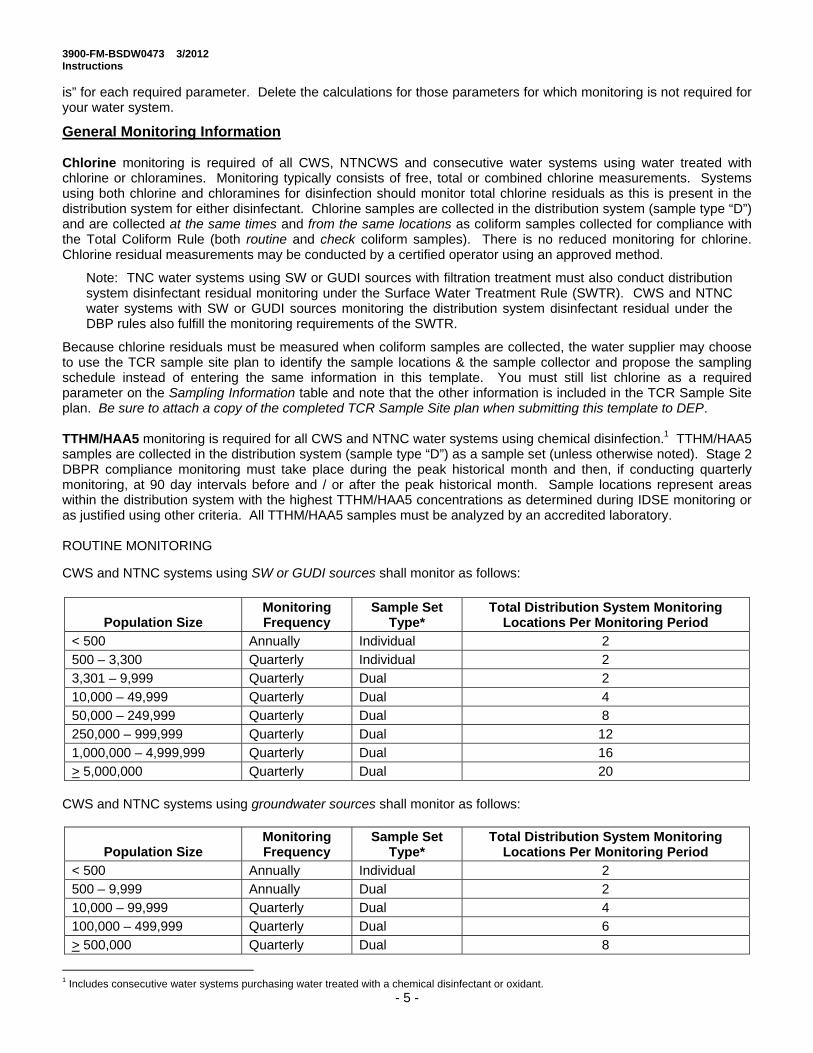
3900-FM-BSDW0473 3/2012 Instructions
- 5 -
is” for each required parameter. Delete the calculations for those parameters for which monitoring is not required for your water system.
General Monitoring Information Chlorine monitoring is required of all CWS, NTNCWS and consecutive water systems using water treated with chlorine or chloramines. Monitoring typically consists of free, total or combined chlorine measurements. Systems using both chlorine and chloramines for disinfection should monitor total chlorine residuals as this is present in the distribution system for either disinfectant. Chlorine samples are collected in the distribution system (sample type “D”) and are collected at the same times and from the same locations as coliform samples collected for compliance with the Total Coliform Rule (both routine and check coliform samples). There is no reduced monitoring for chlorine. Chlorine residual measurements may be conducted by a certified operator using an approved method.
Note: TNC water systems using SW or GUDI sources with filtration treatment must also conduct distribution system disinfectant residual monitoring under the Surface Water Treatment Rule (SWTR). CWS and NTNC water systems with SW or GUDI sources monitoring the distribution system disinfectant residual under the DBP rules also fulfill the monitoring requirements of the SWTR.
Because chlorine residuals must be measured when coliform samples are collected, the water supplier may choose to use the TCR sample site plan to identify the sample locations & the sample collector and propose the sampling schedule instead of entering the same information in this template. You must still list chlorine as a required parameter on the Sampling Information table and note that the other information is included in the TCR Sample Site plan. Be sure to attach a copy of the completed TCR Sample Site plan when submitting this template to DEP. TTHM/HAA5 monitoring is required for all CWS and NTNC water systems using chemical disinfection.1 TTHM/HAA5 samples are collected in the distribution system (sample type “D”) as a sample set (unless otherwise noted). Stage 2 DBPR compliance monitoring must take place during the peak historical month and then, if conducting quarterly monitoring, at 90 day intervals before and / or after the peak historical month. Sample locations represent areas within the distribution system with the highest TTHM/HAA5 concentrations as determined during IDSE monitoring or as justified using other criteria. All TTHM/HAA5 samples must be analyzed by an accredited laboratory. ROUTINE MONITORING
CWS and NTNC systems using SW or GUDI sources shall monitor as follows:
Population Size Monitoring Frequency
Sample Set Type*
Total Distribution System Monitoring Locations Per Monitoring Period
< 500 Annually Individual 2
500 – 3,300 Quarterly Individual 2
3,301 – 9,999 Quarterly Dual 2
10,000 – 49,999 Quarterly Dual 4
50,000 – 249,999 Quarterly Dual 8
250,000 – 999,999 Quarterly Dual 12
1,000,000 – 4,999,999 Quarterly Dual 16
> 5,000,000 Quarterly Dual 20 CWS and NTNC systems using groundwater sources shall monitor as follows:
Population Size Monitoring Frequency
Sample Set Type*
Total Distribution System Monitoring Locations Per Monitoring Period
< 500 Annually Individual 2
500 – 9,999 Annually Dual 2
10,000 – 99,999 Quarterly Dual 4
100,000 – 499,999 Quarterly Dual 6
> 500,000 Quarterly Dual 8
1 Includes consecutive water systems purchasing water treated with a chemical disinfectant or oxidant.
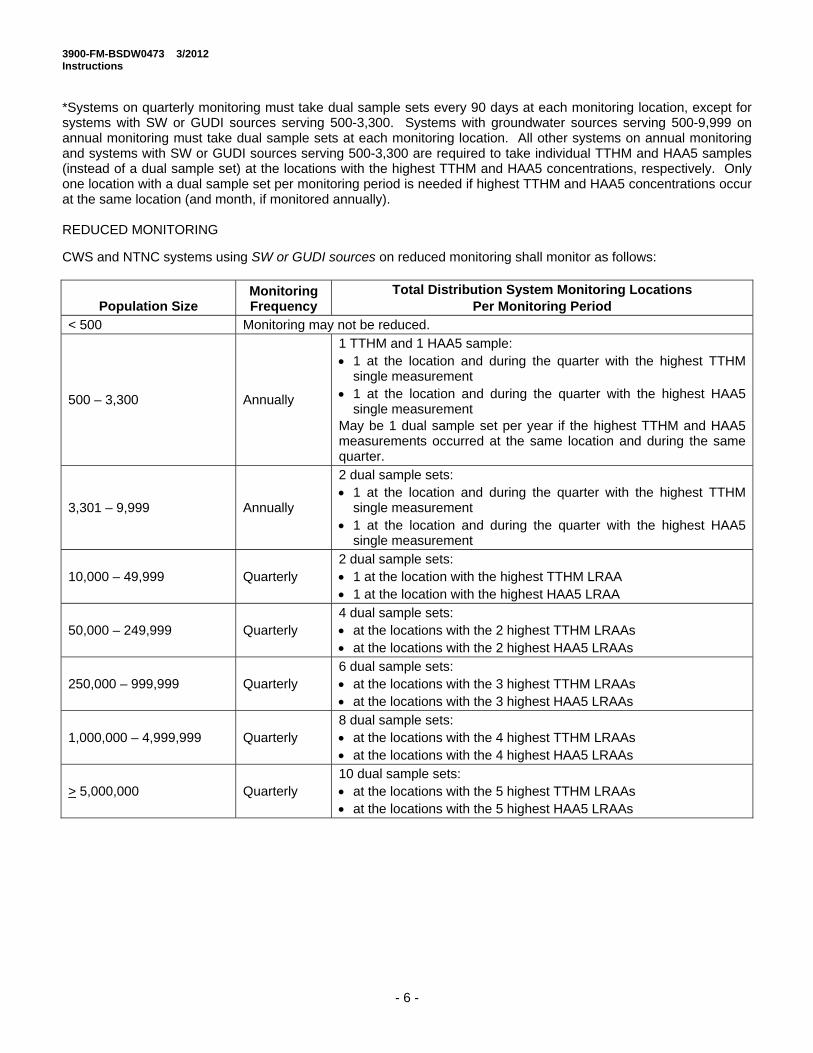
3900-FM-BSDW0473 3/2012 Instructions
- 6 -
*Systems on quarterly monitoring must take dual sample sets every 90 days at each monitoring location, except for systems with SW or GUDI sources serving 500-3,300. Systems with groundwater sources serving 500-9,999 on annual monitoring must take dual sample sets at each monitoring location. All other systems on annual monitoring and systems with SW or GUDI sources serving 500-3,300 are required to take individual TTHM and HAA5 samples (instead of a dual sample set) at the locations with the highest TTHM and HAA5 concentrations, respectively. Only one location with a dual sample set per monitoring period is needed if highest TTHM and HAA5 concentrations occur at the same location (and month, if monitored annually). REDUCED MONITORING
CWS and NTNC systems using SW or GUDI sources on reduced monitoring shall monitor as follows:
Population Size Monitoring Frequency
Total Distribution System Monitoring Locations Per Monitoring Period
< 500 Monitoring may not be reduced.
500 – 3,300 Annually
1 TTHM and 1 HAA5 sample: 1 at the location and during the quarter with the highest TTHM
single measurement 1 at the location and during the quarter with the highest HAA5
single measurement May be 1 dual sample set per year if the highest TTHM and HAA5 measurements occurred at the same location and during the same quarter.
3,301 – 9,999 Annually
2 dual sample sets: 1 at the location and during the quarter with the highest TTHM
single measurement 1 at the location and during the quarter with the highest HAA5
single measurement
10,000 – 49,999 Quarterly 2 dual sample sets: 1 at the location with the highest TTHM LRAA 1 at the location with the highest HAA5 LRAA
50,000 – 249,999 Quarterly 4 dual sample sets: at the locations with the 2 highest TTHM LRAAs at the locations with the 2 highest HAA5 LRAAs
250,000 – 999,999 Quarterly 6 dual sample sets: at the locations with the 3 highest TTHM LRAAs at the locations with the 3 highest HAA5 LRAAs
1,000,000 – 4,999,999 Quarterly 8 dual sample sets: at the locations with the 4 highest TTHM LRAAs at the locations with the 4 highest HAA5 LRAAs
> 5,000,000 Quarterly 10 dual sample sets: at the locations with the 5 highest TTHM LRAAs at the locations with the 5 highest HAA5 LRAAs
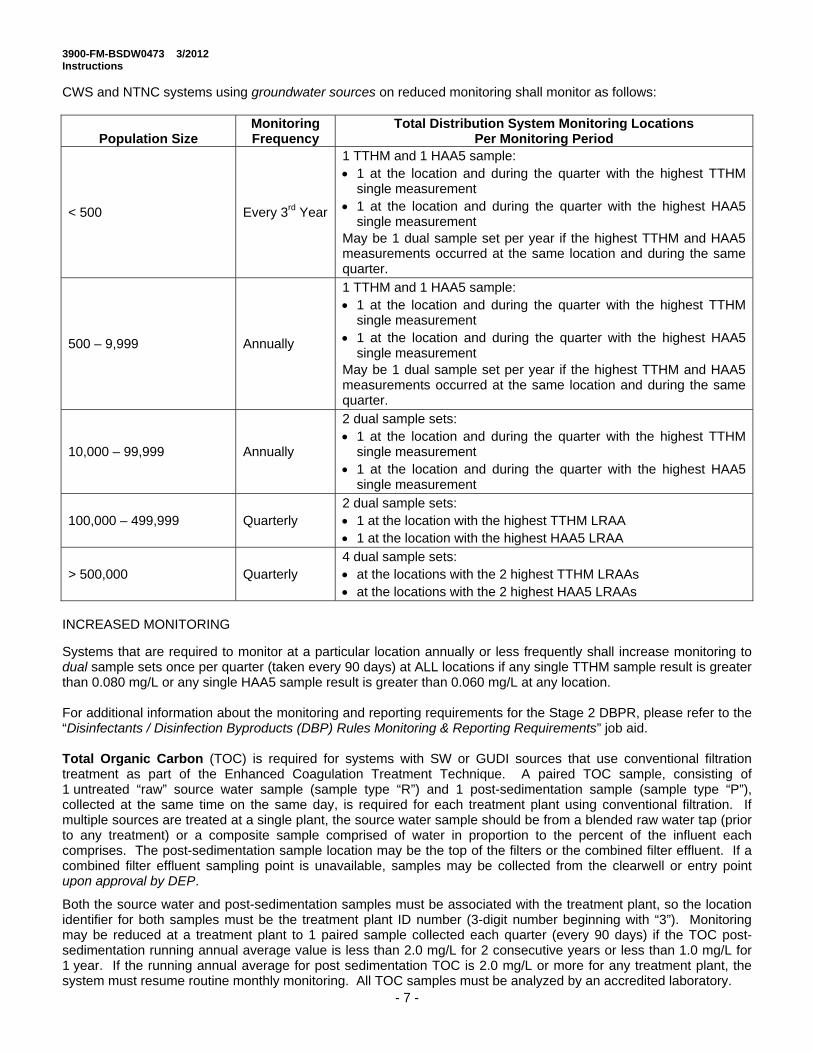
3900-FM-BSDW0473 3/2012 Instructions
- 7 -
CWS and NTNC systems using groundwater sources on reduced monitoring shall monitor as follows:
Population Size Monitoring Frequency
Total Distribution System Monitoring Locations Per Monitoring Period
< 500 Every 3rd Year
1 TTHM and 1 HAA5 sample: 1 at the location and during the quarter with the highest TTHM
single measurement 1 at the location and during the quarter with the highest HAA5
single measurement May be 1 dual sample set per year if the highest TTHM and HAA5 measurements occurred at the same location and during the same quarter.
500 – 9,999 Annually
1 TTHM and 1 HAA5 sample: 1 at the location and during the quarter with the highest TTHM
single measurement 1 at the location and during the quarter with the highest HAA5
single measurement May be 1 dual sample set per year if the highest TTHM and HAA5 measurements occurred at the same location and during the same quarter.
10,000 – 99,999 Annually
2 dual sample sets: 1 at the location and during the quarter with the highest TTHM
single measurement 1 at the location and during the quarter with the highest HAA5
single measurement
100,000 – 499,999 Quarterly 2 dual sample sets: 1 at the location with the highest TTHM LRAA 1 at the location with the highest HAA5 LRAA
> 500,000 Quarterly 4 dual sample sets: at the locations with the 2 highest TTHM LRAAs at the locations with the 2 highest HAA5 LRAAs
INCREASED MONITORING
Systems that are required to monitor at a particular location annually or less frequently shall increase monitoring to dual sample sets once per quarter (taken every 90 days) at ALL locations if any single TTHM sample result is greater than 0.080 mg/L or any single HAA5 sample result is greater than 0.060 mg/L at any location. For additional information about the monitoring and reporting requirements for the Stage 2 DBPR, please refer to the “Disinfectants / Disinfection Byproducts (DBP) Rules Monitoring & Reporting Requirements” job aid. Total Organic Carbon (TOC) is required for systems with SW or GUDI sources that use conventional filtration treatment as part of the Enhanced Coagulation Treatment Technique. A paired TOC sample, consisting of 1 untreated “raw” source water sample (sample type “R”) and 1 post-sedimentation sample (sample type “P”), collected at the same time on the same day, is required for each treatment plant using conventional filtration. If multiple sources are treated at a single plant, the source water sample should be from a blended raw water tap (prior to any treatment) or a composite sample comprised of water in proportion to the percent of the influent each comprises. The post-sedimentation sample location may be the top of the filters or the combined filter effluent. If a combined filter effluent sampling point is unavailable, samples may be collected from the clearwell or entry point upon approval by DEP.
Both the source water and post-sedimentation samples must be associated with the treatment plant, so the location identifier for both samples must be the treatment plant ID number (3-digit number beginning with “3”). Monitoring may be reduced at a treatment plant to 1 paired sample collected each quarter (every 90 days) if the TOC post-sedimentation running annual average value is less than 2.0 mg/L for 2 consecutive years or less than 1.0 mg/L for 1 year. If the running annual average for post sedimentation TOC is 2.0 mg/L or more for any treatment plant, the system must resume routine monthly monitoring. All TOC samples must be analyzed by an accredited laboratory.
3900-FM-BSDW0473 3/2012 Instructions
- 8 -
Alkalinity monitoring is also required for systems with SW or GUDI sources that use conventional filtration treatment as part of the Enhanced Coagulation Treatment Technique in order to determine the percent of required TOC removal. Source water alkalinity samples (sample type “R”) are collected from each treatment plant with conventional filtration at the same time (either monthly or quarterly) and location as the source water TOC sample. Alkalinity measurements may be conducted by a certified operator using an approved method. Optional TOC: Additionally, systems serving > 500 customers with SW or GUDI source wishing to qualify for (and remain on) a reduced TTHM/HAA5 monitoring frequency are required to monitor TOC in the source water (sample type “R”). The TOC concentration, based on a running annual average calculated quarterly (using results from the 4 most recent quarters), must be 4.0 mg/L or less at each treatment plant treating SW or GUDI sources (in addition to meeting the TTHM/HAA5 criteria for a reduced frequency). Therefore, systems with SW or GUDI sources using direct, slow sand, diatomaceous earth, other, or no filtration may also choose to collect source water TOC samples. If multiple sources are treated at a single plant, the source water sample should be from a blended raw water tap (prior to any treatment). Monthly source water TOC monitoring (every 30 days) is required to qualify for the reduced TTHM/HAA5 frequency and quarterly source water TOC monitoring (every 90 days) is required once the reduced TTHM/HAA5 frequency has been granted.
NOTE: The required monitoring done by systems using conventional filtration also satisfies the monitoring needed for reduced TTHM/HAA5 monitoring. Specific Ultraviolet Absorbance (SUVA) is optional for systems with SW or GUDI sources using conventional filtration treatment. These systems may use SUVA data to meet the TOC removal requirements of the Enhanced Coagulation Treatment Technique as an Alternative Compliance Criteria (ACC) if the source or treated water running annual average SUVA value is 2.0 L/mg-m or less. SUVA may also be used as a monthly ACC if the source (or treated) water SUVA value is 2.0 L/mg-m or less in that month. Samples to determine SUVA values consist of separate measurements of UV absorption at 254 nm (UV254) and dissolved organic carbon (DOC).
The SUVA monitoring frequency is the same as the paired TOC sampling (monthly every 30 days or quarterly every 90 days). Samples for source water SUVA are sample type “R” and samples for treated water SUVA are sample type “P”. These samples must be of water prior to the addition of any oxidant or disinfectant, so ‘treated’ water SUVA samples are collected as the result of a jar test. The UV254 and DOC samples must be collected at the same times from the same locations. All samples for the SUVA calculation must be analyzed by an accredited laboratory.
NOTE: SUVA monitoring does not replace the TOC monitoring requirements of the Enhanced Coagulation Treatment Technique. SUVA monitoring is an option that is in addition to the TOC monitoring required for systems using conventional filtration. Chlorine Dioxide (ClO2) is required for all public water systems using chlorine dioxide.2 Chlorine dioxide samples are collected at each entry point treated with ClO2. Distribution system samples are collected only when an entry point sample exceeds the chlorine dioxide MRDL. Chlorine dioxide samples may be analyzed by a certified operator using an approved method. A ClO2 sample is collected daily at each entry point (sample type “E”) supplying water treated with ClO2 each day that chlorine dioxide treatment is in use. If any daily sample exceeds 0.8 mg/L, the system must collect 3 ClO2 samples the following day from the distribution system (sample type “D”) as follows:
Systems without booster chlorination must collect 3 ClO2 samples at intervals of at least 6 hours as close as possible to the first customer.
Systems with booster chlorination must collect 3 ClO2 samples; one as close as possible to the first customer, one at a location representative of average residence time, and one at the maximum residence time, which is usually near the end of the distribution system.
2 Includes consecutive water systems if the consecutive system treats with chlorine dioxide.
3900-FM-BSDW0473 3/2012 Instructions
- 9 -
Chlorite monitoring is required for all CWS and NTNCWS using chlorine dioxide.2 TNC water systems that use chlorine dioxide are not required to monitor for chlorite. Chlorite samples are collected at each entry point treated with chlorine dioxide and in the distribution system. The daily entry point chlorite samples may be analyzed by a certified operator using an approved method. All chlorite distribution samples must be analyzed by an accredited laboratory. A chlorite sample is collected daily at each entry point (sample type “E”) supplying water treated with ClO2 each day that chlorine dioxide treatment is in use. Chlorite sampling is also conducted monthly at 3 different locations within the distribution system (sample type “D”) during each month that chlorine dioxide treatment is in use. The distribution system samples are all collected on the same day from the following locations:
as close as possible to the first customer, a location representative of average residence time, a location representing the maximum residence time (usually near the end of the distribution system).
Whenever a daily chlorite sample at the entry point exceeds 1.0 mg/L, the system is required to collect 3 additional distribution samples at the same locations as the monthly chlorite sample the following day after exceeding 1.0 mg/L. This additional set of daily chlorite samples may be used to meet the monthly routine monitoring for chlorite in the distribution system (if the monthly samples have not yet been collected). If, after 1 year of monitoring, none of the chlorite samples (daily or monthly) exceeded 1.0 mg/L, systems qualify for reduced quarterly distribution chlorite sampling (3 distribution system samples per quarter). If any chlorite sample (daily or monthly) exceeds 1.0 mg/L while a system is on reduced quarterly monitoring, the system must resume routine monthly monitoring. There is no reduced monitoring for the daily entry point chlorite samples. Bromate monitoring is required for all CWS and NTNCWS using ozone.3 Bromate sampling is conducted monthly during the months ozone treatment is in use at each entry point (sample type “E”) supplying water treated with ozone. Systems may qualify for reduced bromate monitoring (1 sample per quarter) at an entry point if the running annual average of monthly bromate samples is no more than 0.0025 mg/L. If the bromate running annual average exceeds 0.0025 mg/L in any quarter, the system must resume monthly bromate monitoring. All bromate samples must be analyzed by an accredited laboratory.
2 Includes consecutive water systems if the consecutive system treats with chlorine dioxide. 3 Includes consecutive water systems if the consecutive system treats with ozone.
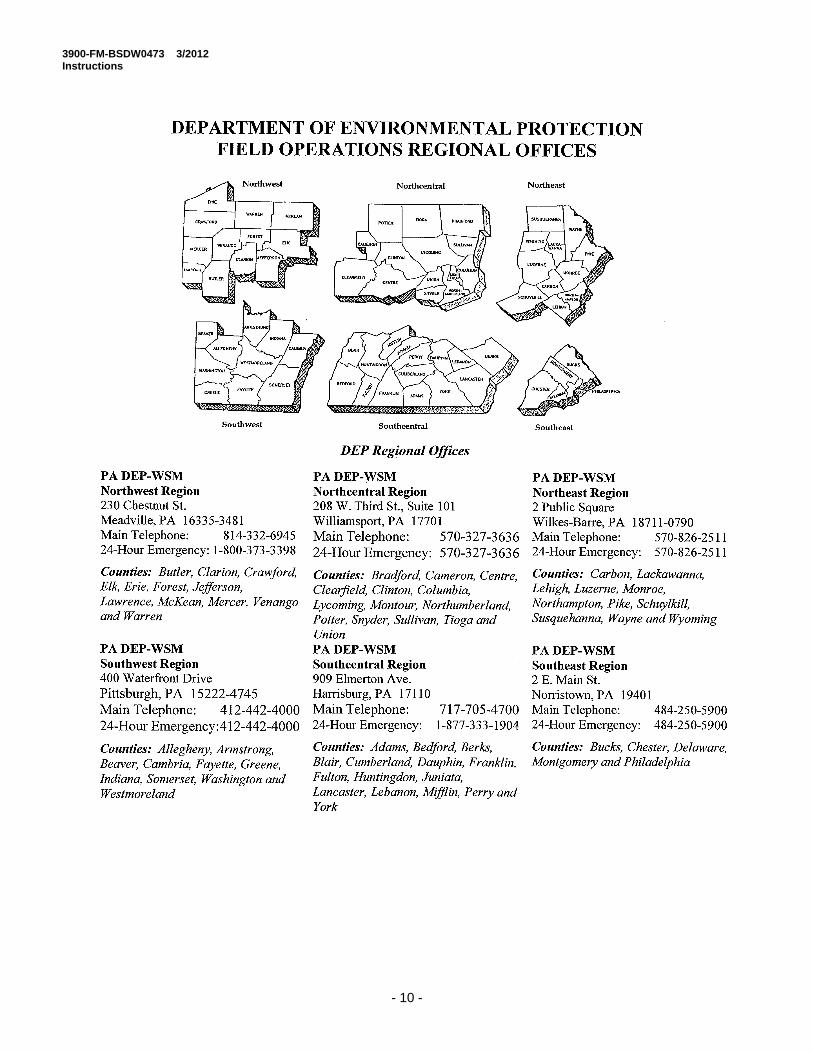
3900-FM-BSDW0473 3/2012 Instructions
- 10 -