Embed Size (px)
Citation preview

Stakeholder Consultation Workshop: Preparation of the Second Edition of the State of
Renewable Energy in South Africa Report Market Overview and Current Levels of Renewable Energy Deployment
Maduna Ngobeni 25 November 2016

1 December 2016 2
Outline
• Energy policy context for the IPPPP
• IPP Office – mandate and role
• Market overview and renewable energy deployment
• Selected REIPPPP achievements
• Gains made by REIPPPP so far
• Potential losses to the country if the rest of the procured REIPPPP projects are not signed
• Potential total losses to the country (including losses from current procured projects not announced and not signed)

Energy Policy Context of the IPPPP
33

Regulatory Framework
• Energy Regulator Act
• Integrated Energy Plan (IEP)
• Integrated Resources Plan (IRP) 2010
o Update in progress
• Ministerial Determinations
• Nersa concurrence
• Competitive Bidding
• Nersa licensing
• Nersa letter to Eskom confirming that they can sign the PPA with cost recovery.
• National Treasury 66/70 concurrence
• Department of Public Enterprise Section 54 approval
• Government Support Framework Agreement
• Implementation Agreement
4

Energy Policy Context of the IPPPP
5
Global context and commitments
National strategies, plans, policy and processes
IPPP Programme mandate
1
2
3
Global trends Global Commitments
Political Economic
Social Environmental
Technical Legal
COP 21 (UN Convention on Climate Change)
Regional Integration
Bilateral & Multi-lateral
National Development
Plan (NDP) Identifies long-term plans to meet
SA’s economic, social and
environmental needs. Energy
infrastructure is a critical
component. The NDP proposes
diversity and alternative
energy resources and energy
supply options, both in terms of
power generation and the supply
of liquid fuels.
National Infrastructure
Plan 17 Catalytic Strategic
Infrastructure Plans (SIPs) for
social and economic
infrastructure across all 9
provinces
National Legislation Electricity Regulation Act
(ERA) and Electricity
Regulations on New
Generation Capacity
Integrated Energy Planning
Processes Long-term (2050) Integrated Energy Plan
being developed - informed by key sectoral
Masterplans and Road Maps (Gas, Liquid
Fuels, Coal, Hydro, Renewables, etc.
Integrated Resource Plan (IRP) The IRP 2010 developed the preferred
energy mix with which to meet the electricity
needs over a 20 year planning horizon to
2030, and informs Ministerial Determinations
on energy capacity. The IRP is currently being
updated.
Ministerial Determinations
14 725 MW for renewable IPPs
15 390 MW for non-renewable IPPs
DoE Strategic Plan
IPP Office planning informed by Department of
Energy (DoE) 5-year plans

IRP 2010 and Ministerial Determinations
6 Note 1. Only applicable for project finance.
New build options
Coal Import hydro Gas – CCGT Peak – OCGT Wind CSP Solar PV
MW MW MW MW MW MW MW
2010 0 0 0 0 0 0 0
2011 0 0 0 0 0 0 0
2012 0 0 0 0 0 0 300
2013 0 0 0 0 0 0 300
2014 500 0 0 0 400 0 300
2015 500 0 0 0 400 0 300
2016 0 0 0 0 400 100 300
2017 0 0 0 0 400 100 300
2018 0 0 0 0 400 100 300
2019 250 0 237 0 400 100 300
2020 250 0 237 0 400 100 300
2021 250 0 237 0 400 100 300
2022 250 1 143 0 805 400 100 300
2023 250 1 183 0 805 400 100 300
2024 250 283 0 0 800 100 300
2025 250 0 0 805 1 600 100 1 000
2026 1 000 0 0 0 400 0 500
2027 250 0 0 0 1 600 0 500
2028 1 000 0 474 690 0 0 500
2029 250 0 237 805 0 0 1 000
2030 1 000 0 948 0 0 0 1 000
Total 6 250 2 609 2 370 3 910 8 400 1 000 8 400
RE First Determination: 3 725 MW Aug 2011
RE Second Determination: 3 200 MW Dec 2012
RE Third Determination: 6 300 MW Apr 2015
Solar Parks Determination: 1 500 MW May 2016
Coal Domestic Determination: 2 500 MW Dec 2012
Imported Hydro Determination: 2 609 MW Dec 2012
Gas Determination: 3 126 MW Aug 2015
Coal from Cross Border: 3 750 MW Apr 2016

Summary of IRP Targets and Ministerial Determinations
7
Technology IRP targets by 2030 IPP Determinations to be implemented
by IPP Office
Renewable Wind 8 400 6 360 CSP 1 000 1 200 PV (including Solar Parks) 8 400 6 225
Landfill, Hydro, Biomass 125 940
Total RE 17 925 14 725
Non renewable and cross border
Coal 6 250 2 500
Cross-border Coal (part of total Coal target) 3 750 Gas (Combine Cycle Gas Turbine CCGT and Open Cycle Gas Turbine OCGT) 6280 3 726
Cross-border Hydro 2 609 2 609
Cogen * 1 500 1 800
Nuclear 9 600
Peaker Plants 1 020 1 005 Total Non-RE 27 259 15 390
Total capacity 45 184 30 115
* Co-generation (Co-gen / Own-gen supply side options identified in Table 1 of Annexure E of IRP for reducing the medium-term supply demand shortfall – conservative view)

REIPPP and Ministerial Determinations
8
14 725 MW Renewable Energy through 4 determinations
1
3
2
4
3 725 MW
3 200 MW
6 300 MW
1 500 MW Solar Parks
6 Bid rounds completed Large REIPPP Bid Windows 1, 2, 3, 3.5, 4 Smalls BW1)
64 Projects signed from Large REIPPP Bid Windows 1, 2, 3 and 3.5 (1 project)
51 Operational IPPs - 2 738 MW reached Commercial Operation by 30 Sept 2016
PROCURED 6 376 MW to date through the rolling bid-window programme
• Release Requests for Proposals for Large REIPPP Bid Window 5, Smalls Bid Window 3, and Solar Parks Programme
8
38
102 Projects signed from Large REIPPP Bid Windows 1, 2, 3 and 3.5 (1 project)
SIGNED 4 006 MW to date
Projects contracted from Large REIPPP Bid Windows 3 (1 project) and 3.5 (1 project) 4 (26 projects) and Smalls (10 projects)
PROCURED, ANNOUNCED BUT NOT YET SIGNED 2 370 MW
PROCURED, NOT YET ANNOUNCED 1 825 MW
Expedited Bid Window projects, with option to double-up to 28 projects totalling 3 550 MW
19
PLANNED

Role of the IPPPP in the national planning context
9
The National Development Plan (NDP) identifies the need for South Africa to invest in a strong network of economic infrastructure.
Energy infrastructure is a critical component.
The NDP requires the development of 10 000 MWs additional electricity capacity to be established by 2025 against the 2013 baseline of 44 000 MWs.
NDP IRP
The Integrated Resource Plan (IRP) 2010 developed the preferred energy mix with which to meet the electricity needs over a 20 year planning horizon to 2030.
IPPPP
The Independent Power Producer Procurement Programme (IPPPP) is a key vehicle for securing electricity capacity from the private Sector for renewable and non-renewable energy sources as determined by the Minister of Energy.
Determinations
The DoE gazetted the New Generation Regulations under the Electricity Regulation Act (ERA) and made the following determinations to date: − 14 725 MW RE − 6 250 from coal-fired plants − 1 800 MW of cogeneration
under the MTRM plan − 3 726 MW of Gas-fired
power plants − 2 609 MW of imported
hydro

Role and mandate of the IPPPP Office
• Primary mandate is to secure electrical energy from the private sector for renewable and non-renewable energy sources.
- Established (Nov 2010) by the South African Department of Energy (DoE), National Treasury (NT) and the Development Bank of Southern Africa (DBSA)
• Designed to contribute to the broader national development objectives of job creation, social upliftment and broadening of economic ownership.
10

Market Overview and Renewable Energy Deployment
311

Major renewable energy milestones are being realised globally…
12 IPPPP Quarterly Report | Quarter 1 2016/17

…and South Africa is following suit
13 IPPPP Quarterly Report | Quarter 1 2016/17

Macroeconomic Context
14
• Weak macroeconomic environment with year-on-year growth in Gross Domestic Product (GDP) expected around 0.2% in 2016 before improving.
• Similarly, net Foreign Direct Investment (FDI) Inflows as a share of GDP on the decline and equivalent to 0.5% of GDP in 2015.
Source: IHS Global Insight and World Bank Databank
0.0%
0.5%
1.0%
1.5%
2.0%
2.5%
0.0%
0.5%
1.0%
1.5%
2.0%
2.5%
3.0%
3.5%
2010 2011 2012 2013 2014 2015 2016 2017 2018FD
I N
et
Infl
ow
s as
% o
f G
DP
GD
P G
row
th (
%Y
/Y)
GDP Growth (%Y/Y) FDI Net Inflows (% GDP)
Forecast
IPPPP Supports Domestic Growth,
FDI and Employment
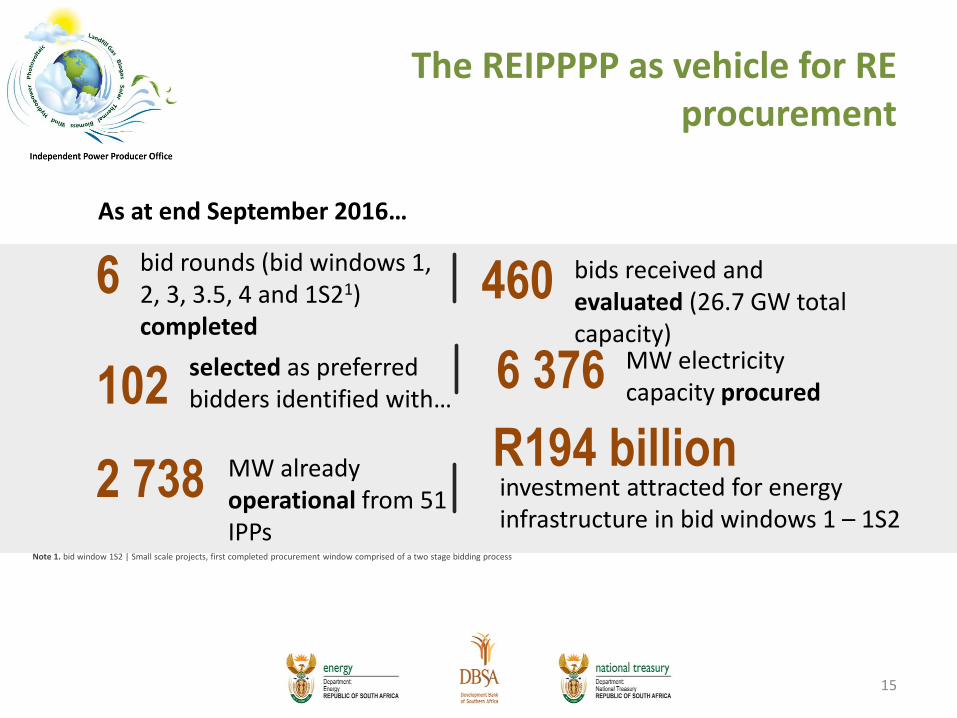
The REIPPPP as vehicle for RE procurement
6 bid rounds (bid windows 1, 2, 3, 3.5, 4 and 1S21) completed
460 bids received and evaluated (26.7 GW total capacity)
102 selected as preferred bidders identified with…
6 376 MW electricity capacity procured
2 738 MW already operational from 51 IPPs
R194 billion
investment attracted for energy infrastructure in bid windows 1 – 1S2
15
Note 1. bid window 1S2 | Small scale projects, first completed procurement window comprised of a two stage bidding process
As at end September 2016…

Progress of the current procured RE portfolio
1 December 2016 16
BW1
BW2
BW3
BW3.5
BW4
1S2
2011 2012 2013 2014 2015 2016 2017 Capacity procured Commercial Operation
RFP Bid submissions Bid announcement Financial close
3 Aug 2011 4 Nov 2011 6 Dec 2011
5 Nov 2012
9 May 2013 21 May 2012
5 Mar 2012 3 Aug 2011
11 Dec 2015 – Q4 2016/17 29 Oct 2013
3 May 2013 19 Aug 2013
12 May 2016 – Q3 2016/17 15 Dec 2014
31 Mar 2014
18 Aug 2014
26 May 2014
16 Apr 2015 Q3 – Q4 2016/17
Q4 2016/17
4 Oct 2015
3 Nov 2014
1 425 MW
1 040 MW
1 457 MW
200 MW
2 205 MW
49 MW
100%
100%
19%
Procurement milestones and bid window status as at 30 September 2015

RE capacity development is taking big strides
• 6 different renewable energy technologies with wind energy contributing more than half of total capacity, followed by solar PV
Capacity Capacity Capacity Capacity Capacity Capacity Capacity
MW MW MW MW MW MW MW
Wind 648 8 559 7 787 7 1 362 12 9 2 3 365 36
Solar PV 627 18 417 9 435 6 813 12 30 6 2 322 51
Solar CSP 150 2 50 1 200 2 200 2 600 7
Landfill Gas 18 1 18 1
Biomass 17 1 25 1 10 2 52 4
Small Hydro 14 2 5 1 19 3
Contracted 1 425 28 1 040 19 1 457 17 200 2 2 205 26 49 10 6 376 102
Commercial
Operation1 415 28 1 033 19 289 4 0 0 0 0 0 0 2 738 51
Smalls
2 205 MW200 MW1 457 MW1 040 MW 49 MW 6 376 MW
ALL
No. of
Projects
No. of
Projects
No. of
Projects
No. of
Projects
No. of
Projects
No. of
Projects
No. of
Projects
BW1 BW2 BW3 BW3.5 BW 4
1 425 MW45%
44%
11%
54%30
%
14%
100%
62%
37% 53
%37%
9%18%
61%
21%
54%
40%
5%

7 M
W
19
1 M
W
63
9 M
W
1 0
54
MW
1 5
22
MW
1 7
09
MW
1 8
60
MW
2 0
21
MW
2 0
21
MW
2 1
45
MW
2 2
20
MW
2 7
38
MW
Q3 Q4 Q1 Q2 Q3 Q4 Q1 Q2 Q3 Q4 Q1 Q2
2013/14 2014/15 2015/16 2016/17
planned: 2773 MW of IPPs have reached commercial operation as scheduled1
98%
REIPPs have consistently delivered capacity according to schedule since the end of 2013, delivering critical generation capacity quickly and generally on time.
megawatts
operational
Note 1. prices expressed in 2016 terms, using April CPI to inflate; Note 2. Contracted price (at which power is sold to Eskom) per IPP was weighted with consideration of the technologies and their relative, projected annual energy contribution (P50) (in April 2016 terms). BW 3 estimated rate incorporates the peak tariff (270% of base rate) applicable to CSP. BW 3.5 is not included as it is technology specific.
The REIPPPP is bringing electricity online quickly and on time
18

1 December 2016 19
REIPPPP Progress against determinations REIPPPP BW1 – 1S2

1 December 2016 20
REIPPPP Progress against determinations Wind

1 December 2016 21
REIPPPP Progress against determinations Solar PV

1 December 2016 22
REIPPPP Progress against determinations CSP

1 December 2016 23
REIPPPP Progress against determinations Hydro, Landfill gas, Biomass

1 December 2016 24
REIPPPP Progress against determinations Small REIPPPP

1 December 2016 25
South Africa’s growing RE footprint
IPP Project status OW PV CSP SH LG BM
No financial close yet
Under construction
Operational
Came online last
quarter
Expected to come
online next quarter
Completed – no Grid
connection

The REIPPPP is procuring energy at increasingly cost competitive rates
26
Prices stated in April 2016 terms. Energy weighted average (R/kWh) considering average technology RFP submission price (published) per BW and projected, annual energy contribution per technology type.
Contracted price (at which power is sold to Eskom) per IPP was weighted with consideration of the technologies and their relative, projected annual energy contribution (P50) (in April 2016 terms). BW3 estimated rate incorporates the peak tariff (270% of base rate) applicable to CSP. BW3.5 is not included as it is technology specific

Solar PV Price Trend
27 Contracted price (at which power is sold to Eskom) per IPP was weighted with consideration of the technologies and their relative, projected annual energy contribution (P50) (in April 2016 terms). BW3 estimated rate incorporates the peak tariff (270% of base rate) applicable to CSP. BW3.5 is not included as it is technology specific
Note: All tariffs are contracted to increase by CPI or less per annum over the PPA term. 6 BW 2 and 1 BW 3 projects are partially indexed resulting in a reduced tariff in real terms over the PPA term. Further tariff reductions are possible through
refinancing i.e. sharing of the refinancing gain with consumers.
Price trend (R/kWh) - April 2016 terms - Solar Photovoltaic
BW 1 627 MW
BW 2417 MW
BW 3435 MW
BW 4813 MW
BW Expedited591 MW
Average 3.65 2.18 1.17 0.91 0.62
Min 3.22 1.85 1.02 0.86 0.60
Max 3.77 2.54 1.30 0.97 0.64
R 3.65 kWh
R 2.18 kWh
R 1.17 kWh R 0.91 kWh
R 0.62 kWh
- 46%
- 40%
- 22% - 32%
83%
decrease

Onshore Wind Price Trend
28
Contracted price (at which power is sold to Eskom) per IPP was weighted with consideration of the technologies and their relative, projected annual energy contribution (P50) (in April 2016 terms). BW3 estimated rate incorporates the peak tariff (270% of base rate) applicable to CSP. BW3.5 is not included as it is technology specific
Price trend (R/kWh) - April 2016 terms - Onshore Wind
BW 1 649 MW
BW 2559 MW
BW 3787 MW
BW 41363 MW
BW Expedited681 MW
Average 1.51 1.19 0.87 0.75 0.62
Min 1.47 1.06 0.78 0.62 0.58
Max 1.52 1.29 0.94 0.84 0.64
R 1.51 kWh
R 1.19 kWh
R 0.87 kWh R 0.75 kWh
R 0.62 kWh
- 27%
- 22%
- 13%
- 18%
59%
decrease
Note: All tariffs are contracted to increase by CPI or less per annum over the PPA term. 4 BW 2 and 1 BW 3 projects are partially indexed resulting in a reduced tariff in real terms over the PPA term. Further tariff reductions are possible through
refinancing i.e. sharing of the refinancing gain with consumers.

CSP Price Trend
29
Contracted price (at which power is sold to Eskom) per IPP was weighted with consideration of the technologies and their relative, projected annual energy contribution (P50) (in April 2016 terms). BW3 estimated rate incorporates the peak tariff (270% of base rate) applicable to CSP. BW3.5 is not included as it is technology specific
Price trend (R/kWh) - April 2016 terms - Concentrated Solar Power
BW 1 150 MW
BW 250 MW
BW 3200 MW
BW 3.5200 MW
BW Expedited450 MW
Average 3.55 3.32 1.93 1.80 1.25
Min 3.48 3.32 1.92 1.70 1.15
Max 3.63 3.32 1.94 1.90 1.36
R 3.55 kWh R 3.32 kWh
R 1.93 kWh R 1.80 kWh
R 1.25 kWh
- 42% - 6%
- 7%
- 31%
65%
decrease
Note: All tariffs are contracted to increase by CPI or less per annum over the PPA term. Further tariff reductions are possible through refinancing i.e. sharing of the refinancing gain with consumers. It should also note that BW1 and BW2 cannot be
compared with the BW3 and later bid windows due to a structural change.

1 December 2016 30
Selected REIPPPP Achievements
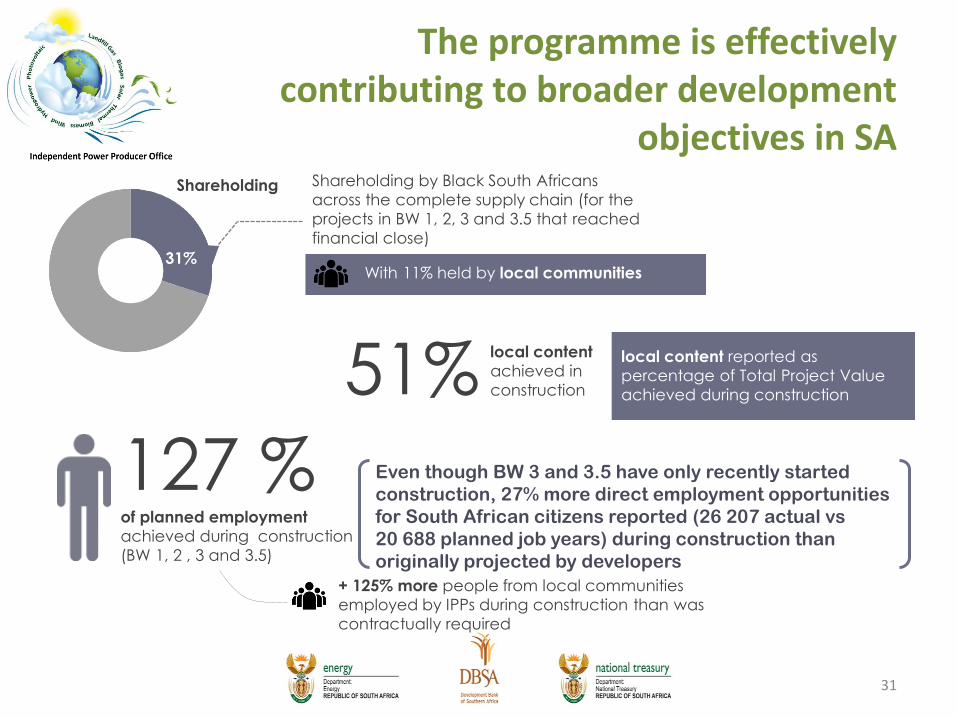
51%
local content
achieved in
construction
local content reported as
percentage of Total Project Value
achieved during construction
Shareholding by Black South Africans
across the complete supply chain (for the
projects in BW 1, 2, 3 and 3.5 that reached
financial close)
Shareholding
31% With 11% held by local communities
Even though BW 3 and 3.5 have only recently started
construction, 27% more direct employment opportunities
for South African citizens reported (26 207 actual vs
20 688 planned job years) during construction than
originally projected by developers
127 %
of planned employment
achieved during construction
(BW 1, 2 , 3 and 3.5)
+ 125% more people from local communities
employed by IPPs during construction than was
contractually required
The programme is effectively contributing to broader development
objectives in SA
31

Note 1. Small projects bid window analysis included.
Whilst securing equity for South Africans, the REIPPPP has also attracted significant
FDI into the country
32
For bid windows 1 – 4 and small projects1
R53.4 billion out of R194 billion from foreign investors and financiers across the globe
27.5% i.e.:

Potential Macroeconomic Benefits from Renewable Energy Deployment
The impact if the global share of renewables in the energy mix is doubled1 by 2030
Accelerating the deployment of renewable energy will fuel economic
growth, create new employment
opportunities, enhance human welfare, and
contribute to a climate safe future
Image and data (unless stated otherwise) sourced from IRENA Measuring the Economics 2016 report. Note 1. All impacts based on IRENA’s REmap case (unless stated otherwise): The global
share of renewables in the energy mix is increased to 36%. Note 2. The percentage increase impacts refers to the percentage change from the Reference Case. Note 3. The combined
indicator for welfare considers a number of factors including: economic impacts based on consumption and investment; social impacts based on expenditure on health and education; and
environmental impacts, measured as greenhouse gas emissions and materials consumption. Note 4. Greenpeace, South African Energy Sector Jobs to 2030. The figure is based on Energy
[R[evolution scenario i.e. By 2030, renewable energy supplies 36% of South Africa’s electricity. Note 5. In the [R]evolution scenario 72 400 new renewable energy jobs are created by 2030, and
an additional 33 700 jobs could be created by 2030 by pursuing policies to boost South African renewable manufacturing capability. Note 6. Numbers derived from graphs provided in IRENA
Measuring the Economics 2016 report.

1 December 2016 34
Gains made by REIPPPP so far
(Commitments from signed projects)

35
64 active projects │ 4 006 MW
11 784 gigawatt hours / a
ENERGY (P50)
The investments, from active projects in BW1 to BW3.5, will contribute to South Africa as follows:
out of 102 projects procured by REIPPPP to date (in BW1 – 4 and smalls)
out of 6 376 MW procured by REIPPPP to date (in BW1 – 4 and smalls)
Investment The REIPPPP has attracted R135.6 billion in investment since inception (from projects that have signed contracts in BW1 – 3.5). Of this, R35 billion (25.8%) is from foreign financiers and investors across the globe.
Jobs In only three years, the REIPPPP has created 26 790 jobs for SA citizens, of which 24 838 were in construction and 1 952 in operations. The 64 active projects (that have signed contracts and commenced construction) have committed to create 57 627 jobs for SA citizens, but since IPPs have consistently been overachieving on job creation targets, it is expected that employment opportunities will grow beyond original expectations. The programme is contributing to youth (47% of jobs for youth) and women employment (10% of jobs for women of which 33% women in top management in construction and 32% in top management in operations)
Gains made by REIPPPP so far

36
Localisation
•A total of R32.1 billion local content spend has been achieved in the REIPPPP.
•It is expected that the active projects will spend more than R42.5 billion on local content during construction.
BBBEE
•The REIPPPP is creating opportunities for black industrialists. A total of R65.5 billion have been procured from BBBEEE firms for the projects that have signed.
Socio-Economic Development (SED)
•By June 2016, R216 million has been spent on socio-economic development by the 44 IPPs that have come into operation since November 2013.
•A total of R9.2 billion have been committed by the 64 active projects (projects that have signed contracts and have commenced construction) for Social Economic Development (SED), over the 20 years life-cycle of the IPPs.
Enterprise Development (ED)
•By June 2016, the first 44 operational IPPs have spent R66.1 million on enterprise development.
•A total of R2.6 billion have been committed by active IPPs over the project 20 years life-cycle.
Community Development
•The total commitment over the life-cycle of the active projects is R23.1 billion.
Gains made by REIPPPP so far

37
Gains made by REIPPPP so far
THE REIPPPP IS PROVIDING BENEFITS TO SEVEN OF NINE PROVINCES
Province Number of Projects Contracted Capacity (MW)
Northern Cape 33 2 127
Eastern Cape 13 1 080
Western Cape 9 453
Free State 4 203
Limpopo 3 118
Mpumalanga 0 0
KwaZulu-Natal 0 0
Gauteng 1 18
Northwest 1 7
Commitments for bid windows 1, 2, 3, and 3.5 (by IPPs that have signed contracts)

THANK YOU
35