Embed Size (px)
Citation preview

Stakeholder Focus Group Meetings Series: Current Conditions and Competitive Market Analysis
Las Vegas, Nevada: July 28, 2015; 9:00 a.m. PDT
Webinar: July 29, 2015; 9:00 a.m. PDT
Reno, Nevada: July 30, 2015; 9:00 a.m. PDT
The Nevada Department of Transportation (NDOT) is currently developing the Nevada State Freight Plan (NSFP). The NSFP will examine all modes of freight movement as a complete system highlighting issues, trends, challenges, and opportunities. Building upon and incorporating recently completed and ongoing local, regional, and statewide freight-related planning efforts, the NSFP will outline a strategic framework for strengthening Nevada’s role in the national and global freight networks, including recommendations for policy and infrastructure improvements to build a competitive advantage for the state that can help to foster continued growth and diversification of the state’s economy. The NSFP will also define how the state will meet federal and state strategic goals including improving economic efficiency, productivity, and competitiveness; reducing congestion; improving safety, security, and resilience; improving the state of good repair; making effective use of existing and emerging technologies; and reducing adverse environmental and community impacts. The NSFP will also conform to the programs and goals recognized by the National Freight Program established under the Moving Ahead for Progress in the 21st Century Act (MAP-21).
To ensure the NSFP and its recommendations are relevant to the needs of industry within the state and supports statewide, regional, and local economic development goals, NDOT has initiated an extensive stakeholder outreach effort to obtain input from public and private sector stakeholders. As part of this effort, interested public and private sector stakeholders from across the state and representing an array of public and private interests will be invited to participate in periodic Stakeholder Focus Group meetings. The purpose of these meetings will be to provide an opportunity for stakeholders to receive progress updates, review and comment on interim findings, provide additional data and other input, and share opinions and ideas for consideration at key milestones during the development of the NSFP.
The purpose of the Current Conditions and Market Analysis Focus Group meeting series was to:
• Provide an overview of the NSFP purpose, development schedule, and opportunities for additional stakeholder participation
• Present the NSFP Vision and proposed Strategic Goals for review and comment
• Review data collected to-date including existing freight flows and distribution of employment within key freight-dependent industries
• Review of existing statewide trucking, freight rail, air cargo, and pipeline infrastructure
• Present initial findings of competitive market analysis for review and comment
STAKEHOLDER FOCUS GROUP MEETINGS SUMMARY; JULY 2015
Page 2
This series included live meetings held in Las Vegas on July 28, 2015 and in Reno on July 30, 2015. A Webinar was held on July 29, 2015 for those interested stakeholders that were unable to attend the live meetings. The same material was presented for review and comment at each of the meetings in this series. The following is a summary of input received from stakeholders during this meeting series. The comments and themes presented within this summary are those expressed by the stakeholders in attendance and do not necessarily reflect the opinion or official positions of NDOT, the consultant team, or the participating organizations and agencies. NSFP team member responses to specific questions or to provide additional clarification are indicated within the summary with blue, italic font. Where possible, stakeholder input received has been generally categorized under the associated topics covered during the presentation. To preserve confidentiality and promote an open discourse, names and affiliations of the person(s) providing specific input have been excluded except in those instances where this information was felt to be essential for additional clarity.
Vision and Strategic Goals • Would like to know the perspective of NDOT and others as to where we currently are in meeting
some of these goals. Personally, I think the state is doing really well already with Goal #5 (“use of advanced technology”) whereas Goal #7 (“fully fund operations and maintenance”) and Goal #8 (“coordinate with local land use decisions”) could use a lot of work.
• Consider adding strategic goal for improving intermodal access and linkages.
• Goals should include timely implementation of needed improvements.
• We need aspirational goals, with incremental steps for achieving them.
• We need to consider and plan for emerging technologies.
Existing Freight Flows • We need to consider how flows are shifting, and attempt to estimate future flows based on
changing trends not just a projection of historical trends.
Inventory of Freight-Dependent Industries • Employment clusters in the Reno-Sparks CSA are likely more dispersed than southern Nevada due to
geography.
Inventory by Mode (Infrastructure) Truck
• Need to consider security/safety with regard to truck movements of hazardous materials. Recommend coordinating with local first responders to discuss emergency access issues safety around populated areas.
• Need better coordinated local response to emergency events that impact major trucking routes. Need to identify alternate routes that can be used by trucks and better communicate these to truck drivers when emergency events occur.
• Need to have better planning for winter storm events and better coordination with emergency services and locals during these events.
• Don’t really feel that there are any major truck bottlenecks in the state, with the exception of I-15, which Project NEON should alleviate once completed.

STAKEHOLDER FOCUS GROUP MEETINGS SUMMARY; JULY 2015
Page 3
• Need improved technology to communicate, in real-time, available parking spaces available at various locations so that truck drivers can better plan their routes and rest breaks (DMS, mobile apps, etc.).
• We need more freeway lanes through urban centers.
• Truck-only toll lanes would likely be opposed. The state would need to make a strong value proposition to show the advantages to the trucking industry.
• Most of Nevada’s roads are in good condition.
Rail
• Reno-Sparks intermodal facilities – while these facilities exist, it is our understanding that there is not a significant amount of use due to train scheduling and lack of overall demand. Are there opportunities to increase goods moving by rail through these facilities that could impact truck volumes through the area?
• Eastern Nevada’s growing energy sector could potentially be served well by improved rail connections/service.
• The I-11 corridor needs to include rail. We need a rail connection between Las Vegas and Reno.
• We need more rail options and competition.
• Can the State acquire right-of-way for rail? We can work with BLM to preserve corridors, but right-of-way acquisition is difficult until closer to development.
• The future Ivanpah Airport would be a good site for an intermodal facility.
• We need to consider the security of unit trains carrying hazardous materials, and coordinate with first responders.
Air
• Is there any way to obtain data on import versus export volumes for air cargo? We believe so and will research it.
• Reno-Tahoe International has ample air cargo capacity that is currently underutilized.
Pipeline
• Slide 48 of the presentation shows a petroleum refinery in Nye County, what is this? Are there no pipelines connecting to it? The referenced refinery is the Eagle Springs Refinery operated by the Foreland Refining Corporation – based on available information, crude is received by truck from wells around Gabbs, NV.
Competitive Market Analysis • Consider industries operating in the San Francisco Bay Area and what synergistic opportunities there
may be for northern Nevada.
• Fulfillment centers are growing in the Las Vegas commercial market.
General Comments • NDOT has done a great job of looking at the different components but it is important to note that
past performance is likely to be a conservative indication of future growth, particularly in northern Nevada. Growth in this region is forecasted to outpace anything that we have seen in the past 5-8 years. There are already significant new developments under construction or in the pipeline within the region.

STAKEHOLDER FOCUS GROUP MEETINGS SUMMARY; JULY 2015
Page 4
• Is the I-11 alignment through central Nevada passing through Winnemucca no longer being considered? The maps you have shown only identify a western Nevada corridor through Reno and continuing north. The maps presented in the Webinar have been corrected to show only an arrow north of I-80. No Federal, state, or local agency has studied I-11 corridor alternatives north of I-80. All possible alternatives would be considered in future studies.
• Lander County supports an I-11 alignment through Winnemucca to support mining and economic development in the County.
• Will I-11 be developed in segments from south to north? I-11 will have to be broken into reasonable segments for development, and then prioritized based on greatest need and opportunity, which may or may not occur sequentially from north to south, or south to north. The first segment of I-11 is under construction now around Boulder City, in the middle of the corridor.
• The state needs to identify and try to capture businesses and other opportunities to balance import/export volumes.
• Review EDAWN’s EPIC report which is due to come out soon and should have some good data/forecasts for northern Nevada that can be used.
• In making decisions regarding target industries for the state, GOED should consider industries that could take advantage of existing under-utilized modes such as air cargo. Just makes sense to target industries that need the services we are already able to provide.
• Have there been any studies regarding long-term implications 3-D printing might have on freight volumes? Not that we are aware of, but we will look into it.
Attachment 1 July 2015 Focus Group Participants

July 2015 Stakeholder Focus Group Meeting Series – ‘Current Conditions and Competitive Market Analysis’
Participants by Organization
Organization First Name Last Name Meeting Location
Apex Logistics, LLC Denny Wyatt Webinar
BNSF Connie Wilson Webinar
CH2M HILL Dan Andersen Vegas; Reno; Webinar
CH2M HILL Mark Gallegos Reno; Webinar
CH2M HILL Bardia Nezhati Vegas
City of Henderson Barbra Coffee Vegas
Clark County Kevin Gullette Vegas
Clark County Department of Aviation Tucker Field Webinar
Clark County Public Works Tyronne Doram Vegas
Dielco Crane Service, Inc. David Dieleman Vegas
Economic Development Authority of Western Nevada (EDAWN) Nacy McCormick Webinar
Elko Regional Airport Mark Gibbs Webinar
Federal Highway Administration Nevada Division Christina Leach Reno
Griffin Company Chelsea Capurro Reno
Griffin Company Marla Williams Vegas; Webinar
Lander County Economic Development Authority Jan Morrison Webinar
Las Vegas Global Economic Alliance Michael Vannozzi Webinar
Majestic Realty Rod Martin Vegas
Michael Gallis & Associates Laura Chris Webinar
Michael Gallis & Associates Michael Gallis Vegas; Reno; Webinar
Michael Gallis & Associates Bob James Vegas; Reno; Webinar
NAIOP Sallie Doebler Webinar

Organization First Name Last Name Meeting Location
Nevada Department of Transportation Tracy Larkin-Thomason Vegas
Nevada Department of Transportation Tony Rivera Webinar
Nevada Department of Transportation Sondra Rosenberg Vegas; Reno
Nevada Department of Transportation Bill Thompson Vegas; Reno; Webinar
Nevada Mining Association Joseph Riney Webinar
Nevada State Bank Shirley Alen-Kellerman Webinar
Nevada Trucking Association Paul Enos Reno
Nevada Trucking Association Jaron Hildebrand Reno
Nevada Trucking Association Kim Yaeger Reno
NV Energy Jeff Brigger Webinar
Olin Chlor Alkali Bruce Williams Vegas
Owner-Operator Independent Drivers Association Mike Matousek Webinar
Reno-Tahoe Airport Authority Daniel Bartholomew Reno
Reno-Tahoe Airport Authority Lissa Butterfield Reno
Reno-Tahoe Airport Authority James McCluskie Reno
Regional Transportation Commission of Southern Nevada Beth Xie Vegas
WIS:DOM Information Systems, Inc. Matthew Booher Webinar
Garrett Grime Webinar
Alex Marach Webinar
Attachment 2 Presentation Slides
July 2015
1
Stakeholder Focus Group Meeting
July 28, 2015: Las Vegas, NV
July 29, 2015: Webinar
July 30, 2015: Reno, NV1
INTRODUCTIONS
2
July 2015
2
AGENDA
Purpose Strategic Goals Update Public Involvement Plan
Existing Freight Flows Statewide Inventory Competitive Market Analysis
3
PLAN PURPOSE
The Nevada State Freight Plan is an industry‐driven initiativethat will identify and prioritize potential infrastructure policiesand improvements to facilitate efficient freight movementthroughout the State of Nevada, with the ultimate goal ofcreating a competitive advantage for the state that will result ina growing and diversifying economy.
4

July 2015
3
21The reliable, cost effective, andsafe movement of goods andproducts across the State ofNevada and to its producersand customers is an importantfoundation to sustain andgrow Nevada’s economy.
5
The State of Nevada and its major metro hubs shoulddevelop long‐term strategies to position themselveswithin the global and national trade patterns andstrengthen their role in the Western US freight network.
WITH
IN
N
EVADA
GLO
BAL
NEVADA
PROJECT STRATEGY
PROJECT SCHEDULE MILESTONES
WE
AR
E H
ER
E
JAN 2015 JULY 2016APR 2015 JUL 2015 OCT 2015 JAN 2016 APR 2016
6

July 2015
4
RELEVANT REPORTS/STUDIESTHAT INFORM THIS PLAN
And many, many more… 7
STRATEGIC GOALS
Vision: Nevada’s freight system provides a significant competitive advantage to businesses within the state and an incentive for businesses to relocate to Nevada.
Strategic goals:
• Consistent with, complementary to, and supportive of the aspirations of the communities and economic development organizations within the state; and
• Meet Federal MAP‐21 Requirements
8
July 2015
5
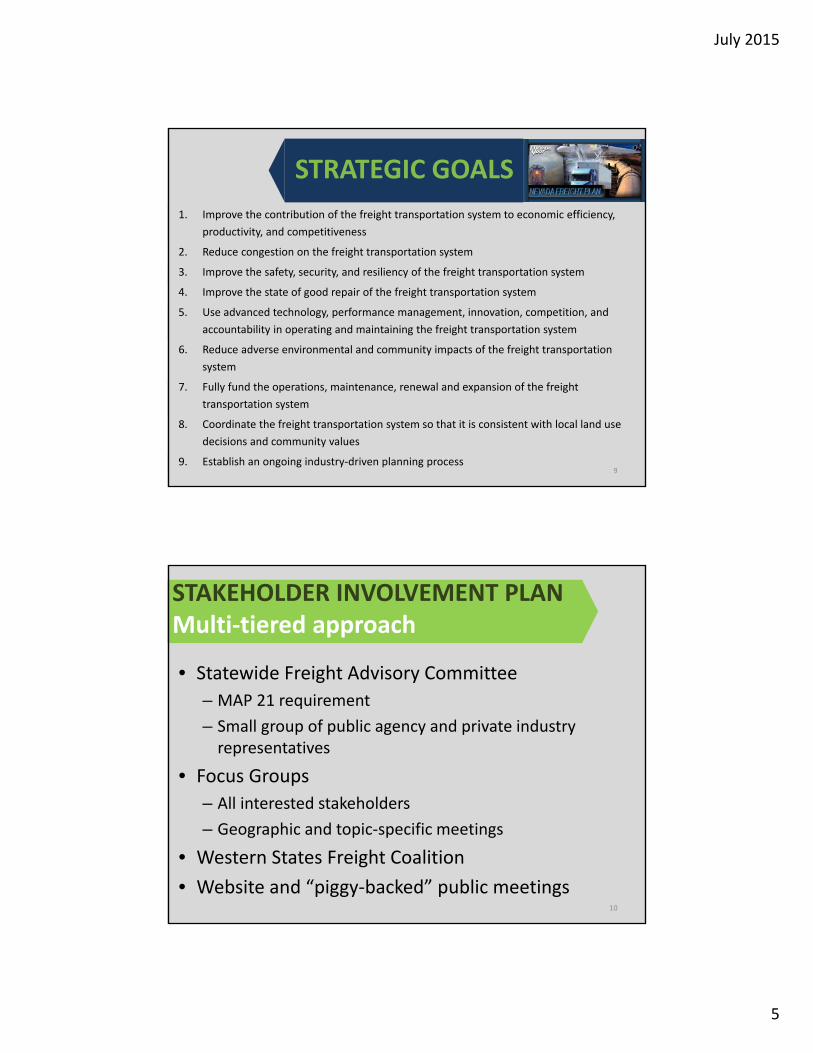
STRATEGIC GOALS
1. Improve the contribution of the freight transportation system to economic efficiency,
productivity, and competitiveness
2. Reduce congestion on the freight transportation system
3. Improve the safety, security, and resiliency of the freight transportation system
4. Improve the state of good repair of the freight transportation system
5. Use advanced technology, performance management, innovation, competition, and
accountability in operating and maintaining the freight transportation system
6. Reduce adverse environmental and community impacts of the freight transportation
system
7. Fully fund the operations, maintenance, renewal and expansion of the freight
transportation system
8. Coordinate the freight transportation system so that it is consistent with local land use
decisions and community values
9. Establish an ongoing industry‐driven planning process9
STAKEHOLDER INVOLVEMENT PLANMulti‐tiered approach
10
• Statewide Freight Advisory Committee
– MAP 21 requirement
– Small group of public agency and private industry representatives
• Focus Groups
– All interested stakeholders
– Geographic and topic‐specific meetings
• Western States Freight Coalition
• Website and “piggy‐backed” public meetings

July 2015
6
EXISTING FREIGHT FLOWS
11
12
EXISTING STATEWIDE FLOWSDISTRIBUTION BY TRADE PARTNER BY VALUE, 2012
Source: Cambridge Systematics, Inc. 2015
Note: All units are in millions of tons. Note: All units are in billions of dollars.
July 2015
7
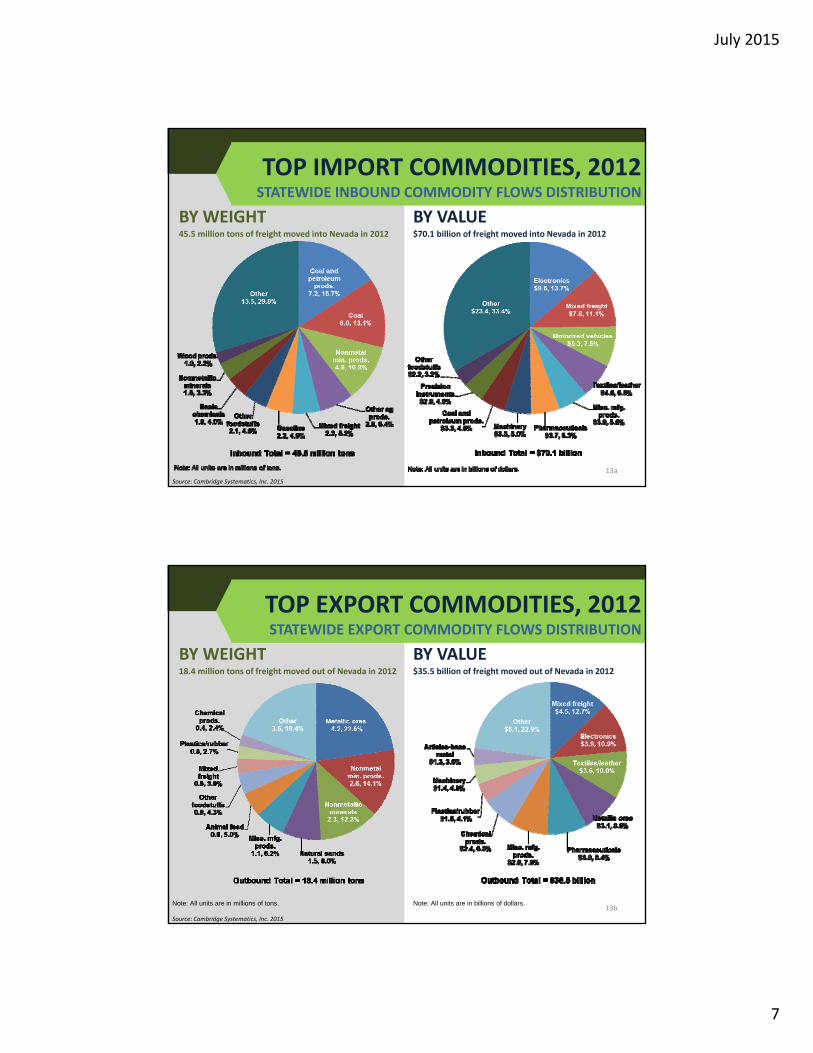
TOP IMPORT COMMODITIES, 2012STATEWIDE INBOUND COMMODITY FLOWS DISTRIBUTION
BY VALUEBY WEIGHT45.5 million tons of freight moved into Nevada in 2012 $70.1 billion of freight moved into Nevada in 2012
13a
Source: Cambridge Systematics, Inc. 2015
TOP EXPORT COMMODITIES, 2012STATEWIDE EXPORT COMMODITY FLOWS DISTRIBUTION
BY VALUEBY WEIGHT18.4 million tons of freight moved out of Nevada in 2012 $35.5 billion of freight moved out of Nevada in 2012
13b
Source: Cambridge Systematics, Inc. 2015
Note: All units are in millions of tons. Note: All units are in billions of dollars.
July 2015
8
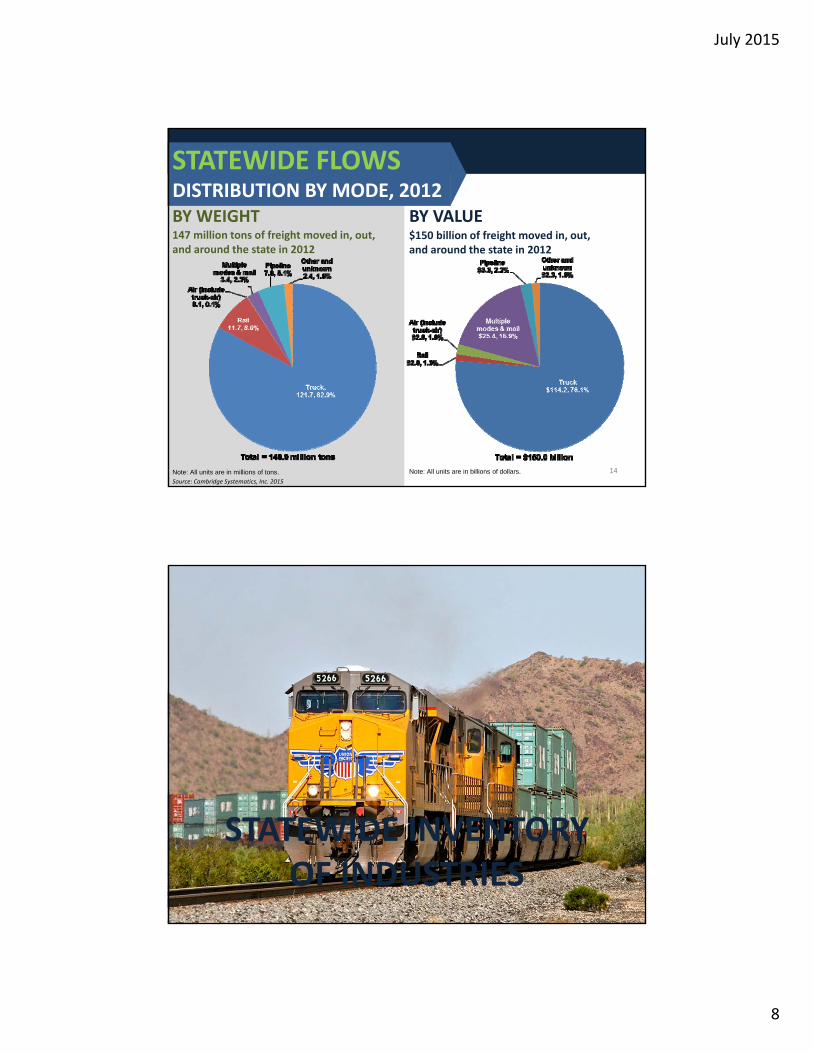
STATEWIDE FLOWSDISTRIBUTION BY MODE, 2012
BY VALUE$150 billion of freight moved in, out, and around the state in 2012
BY WEIGHT147 million tons of freight moved in, out, and around the state in 2012
14
Source: Cambridge Systematics, Inc. 2015
Note: All units are in millions of tons. Note: All units are in billions of dollars.
STATEWIDE INVENTORY OF INDUSTRIES
15

July 2015
9
16
TRANSPORTATION AND WAREHOUSING
WHERE IS FREIGHT COMING FROM & GOING TO?
1 ‐ 1920 ‐ 99 100 ‐ 299300 ‐ 599600+
Number of Employees
17
WHERE IS FREIGHT COMING FROM & GOING TO?
MANUFACTURING
1 ‐ 910 ‐ 24 25 ‐ 149150 ‐ 499500+
Number of Employees
July 2015
10
18
AGRICULTURE
WHERE IS FREIGHT COMING FROM & GOING TO?
1 ‐ 910 ‐ 1920 ‐ 4950 ‐ 8990+
Number of Employees
19
AGRICULTURE
WHERE IS FREIGHT COMING FROM & GOING TO?
1 ‐ 910 ‐ 1920 ‐ 4950 ‐ 8990+
Number of Employees

July 2015
11
20
MINING
WHERE IS FREIGHT COMING FROM & GOING TO?
15 ‐ 3940 ‐ 8990 ‐ 299300 ‐ 599600+
Number of Employees
21
CONSTRUCTION
WHERE IS FREIGHT COMING FROM & GOING TO?
30 ‐ 5051 ‐ 8081 ‐ 200201 ‐ 500500+
Number of Employees
July 2015
12
22
RETAIL, WHOLESALE, & FULFILLMENT CENTERS
WHERE IS FREIGHT COMING FROM & GOING TO?
50 ‐ 7071 ‐ 100101 ‐ 300301 ‐ 700700+
Number of Employees
23
ENTERTAINMENT & ACCOMMODATIONS
WHERE IS FREIGHT COMING FROM & GOING TO?
50 ‐ 150151 ‐ 350351 ‐ 750751 ‐ 20002000+
Number of Employees
July 2015
13
STATEWIDE INVENTORY: RENO‐SPARKS‐CARSON CITY CSA
24
25
TRANSPORTATION AND WAREHOUSING
WHERE IS FREIGHT COMING FROM & GOING TO?
1 ‐ 2930 ‐ 99 100 ‐ 299300 ‐ 599600+
Number of Employees

July 2015
14
26
WHERE IS FREIGHT COMING FROM & GOING TO?
MANUFACTURING
1 ‐ 910 ‐ 24 25 ‐ 149150 ‐ 499500+
Number of Employees
27
WHERE IS FREIGHT COMING FROM & GOING TO?
MANUFACTURING
1 ‐ 910 ‐ 24 25 ‐ 149150 ‐ 499500+
Number of Employees

July 2015
15
28
CONSTRUCTION
WHERE IS FREIGHT COMING FROM & GOING TO?
30 ‐ 5051 ‐ 8081 ‐ 200201 ‐ 500500+
Number of Employees
29
RETAIL, WHOLESALE, & FULFILLMENT CENTERS
WHERE IS FREIGHT COMING FROM & GOING TO?
20 ‐ 5051 ‐ 100101 ‐ 250251 ‐ 500500+
Number of Employees

July 2015
16
30
ENTERTAINMENT & ACCOMMODATIONS
WHERE IS FREIGHT COMING FROM & GOING TO?
50 ‐ 150151 ‐ 350351 ‐ 750751 ‐ 20002000+
Number of Employees
STATEWIDE INVENTORY: LAS VEGAS MSA
31

July 2015
17
32
TRANSPORTATION AND WAREHOUSING
WHERE IS FREIGHT COMING FROM & GOING TO?
1 ‐ 1920 ‐ 99 100 ‐ 299300 ‐ 599600+
Number of Employees
33
WHERE IS FREIGHT COMING FROM & GOING TO?
MANUFACTURING
1 ‐ 910 ‐ 24 25 ‐ 149150 ‐ 499500+
Number of Employees
July 2015
18
34
CONSTRUCTION
WHERE IS FREIGHT COMING FROM & GOING TO?
30 ‐ 5051 ‐ 8081 ‐ 200201 ‐ 500500+
Number of Employees
35
RETAIL, WHOLESALE, & FULFILLMENT CENTERS
WHERE IS FREIGHT COMING FROM & GOING TO?
50 ‐ 7071 ‐ 100101 ‐ 300301 ‐ 700700+
Number of Employees

July 2015
19
36
ENTERTAINMENT & ACCOMMODATIONS
WHERE IS FREIGHT COMING FROM & GOING TO?
50 ‐ 150151 ‐ 350351 ‐ 750751 ‐ 20002000+
Number of Employees
STATEWIDE INVENTORY BY MODE
37
July 2015
20
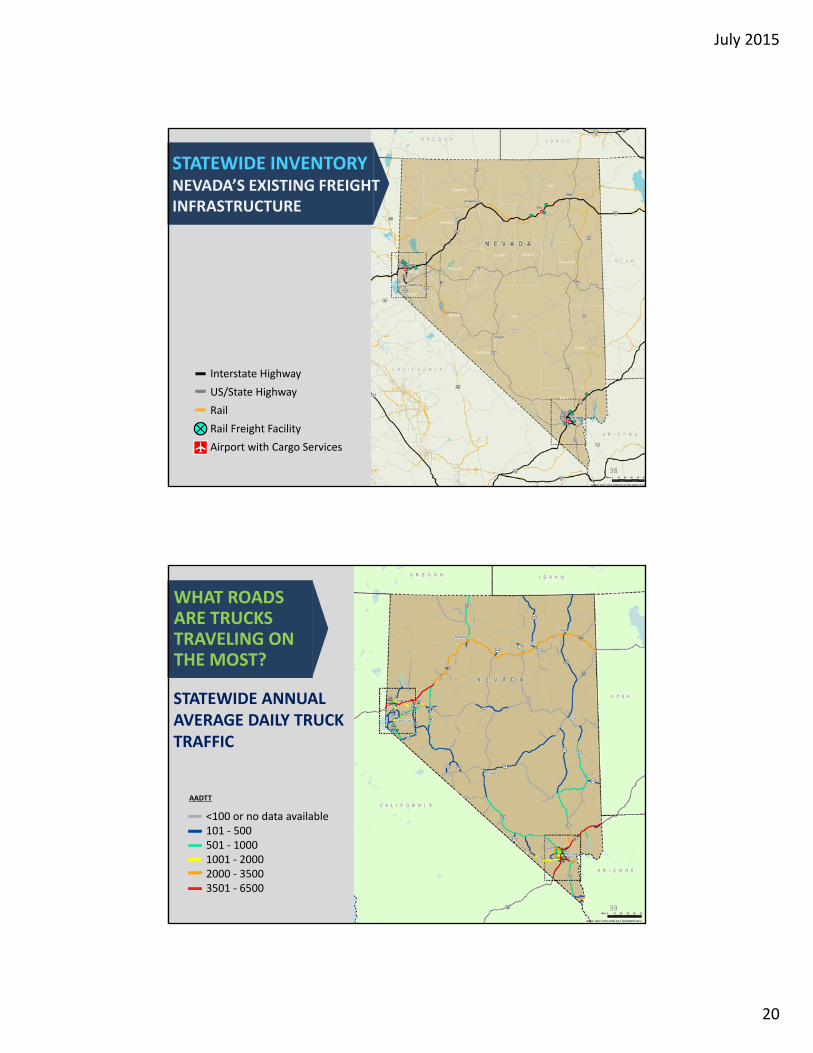
38
STATEWIDE INVENTORYNEVADA’S EXISTING FREIGHTINFRASTRUCTURE
Z
Interstate Highway
US/State Highway
Rail
Rail Freight Facility
Airport with Cargo Services
39
WHAT ROADS ARE TRUCKS TRAVELING ON THE MOST?
<100 or no data available101 ‐ 500501 ‐ 10001001 ‐ 20002000 ‐ 35003501 ‐ 6500
AADTT
STATEWIDE ANNUAL AVERAGE DAILY TRUCK TRAFFIC
July 2015
21
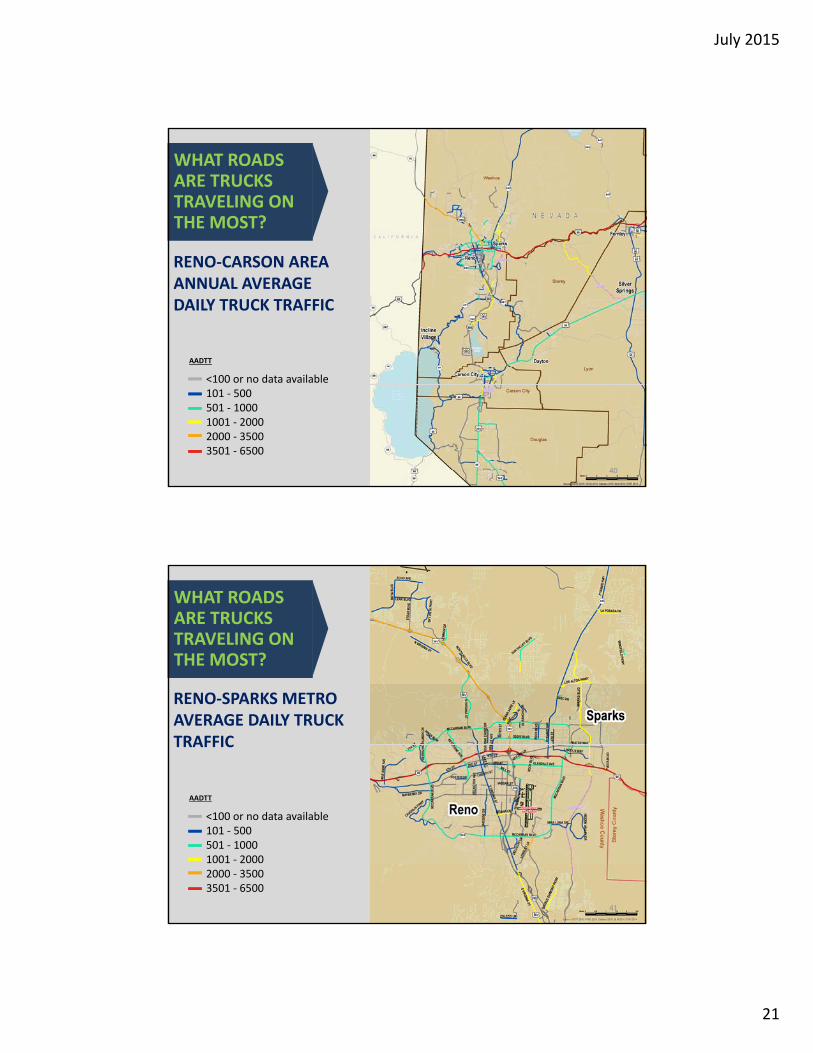
40
RENO‐CARSON AREA ANNUAL AVERAGE DAILY TRUCK TRAFFIC
WHAT ROADS ARE TRUCKS TRAVELING ON THE MOST?
<100 or no data available101 ‐ 500501 ‐ 10001001 ‐ 20002000 ‐ 35003501 ‐ 6500
AADTT
41
RENO‐SPARKS METRO AVERAGE DAILY TRUCK TRAFFIC
WHAT ROADS ARE TRUCKS TRAVELING ON THE MOST?
<100 or no data available101 ‐ 500501 ‐ 10001001 ‐ 20002000 ‐ 35003501 ‐ 6500
AADTT
July 2015
22
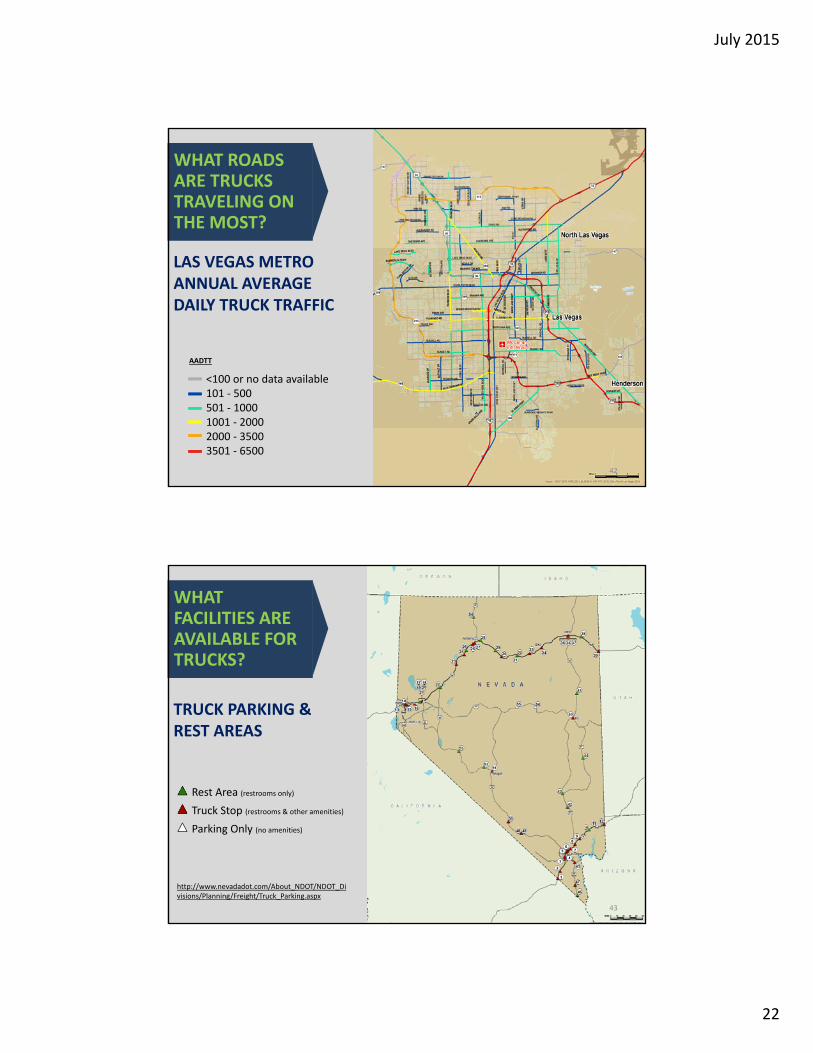
42
LAS VEGAS METRO ANNUAL AVERAGE DAILY TRUCK TRAFFIC
WHAT ROADS ARE TRUCKS TRAVELING ON THE MOST?
<100 or no data available101 ‐ 500501 ‐ 10001001 ‐ 20002000 ‐ 35003501 ‐ 6500
AADTT
43
TRUCK PARKING & REST AREAS
WHAT FACILITIES ARE AVAILABLE FOR TRUCKS?
Rest Area (restrooms only)
Truck Stop (restrooms & other amenities)
Parking Only (no amenities)
http://www.nevadadot.com/About_NDOT/NDOT_Divisions/Planning/Freight/Truck_Parking.aspx

July 2015
23
44
WHAT IS OUR RAIL NETWORK?
Mainline
Branch
Excursion
45
WHAT RAIL FREIGHT FACILITIESARE AVAILABLE?
Mainline
Branch
Excursion

July 2015
24
46
PROJECTED 2035 TRAIN VOLUMES VERSUS CAPACITY
47
WHERE ARE AIR CARGO FACILITIES LOCATED?
McCarran International: 100,000
Reno‐Tahoe International: 65,000
Elko Regional Airport: 17
2014 Cargo Volumes (in tons)
July 2015
25
48
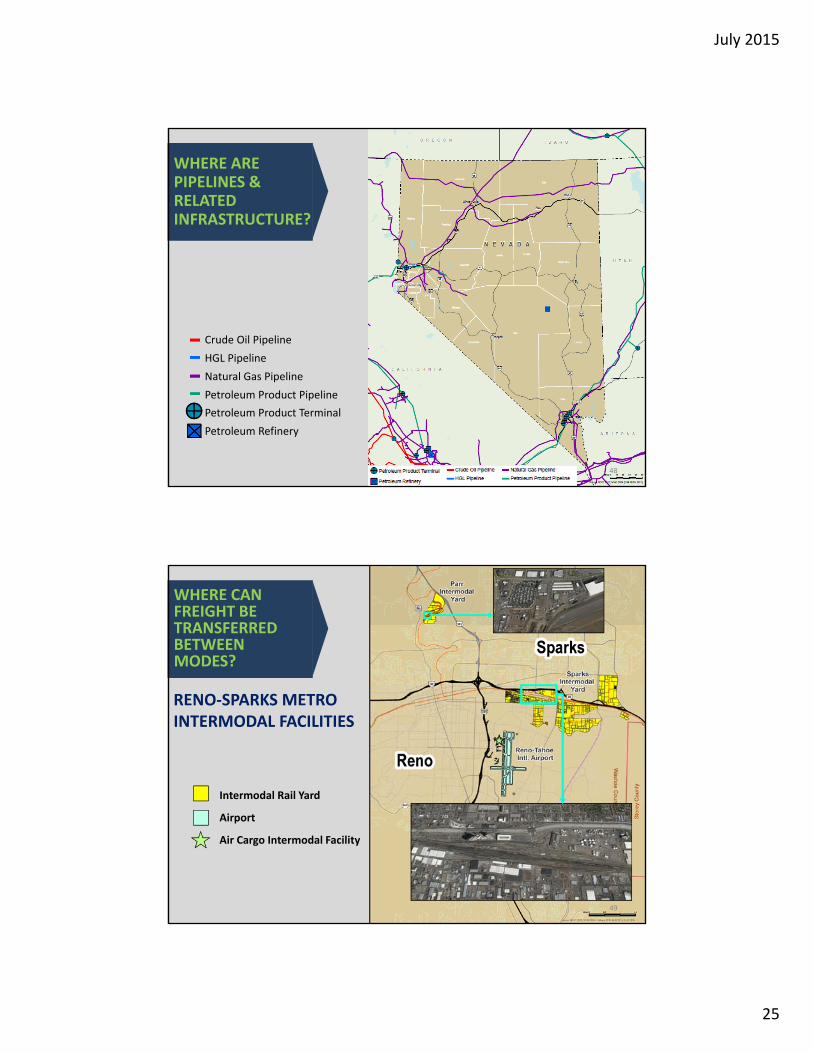
WHERE ARE PIPELINES & RELATED INFRASTRUCTURE?
Crude Oil Pipeline
HGL Pipeline
Natural Gas Pipeline
Petroleum Product Pipeline
Petroleum Product Terminal
Petroleum Refinery
49
RENO‐SPARKS METRO INTERMODAL FACILITIES
WHERE CAN FREIGHT BE TRANSFERRED BETWEEN MODES?
Intermodal Rail Yard
Airport
Air Cargo Intermodal Facility
July 2015
26
50
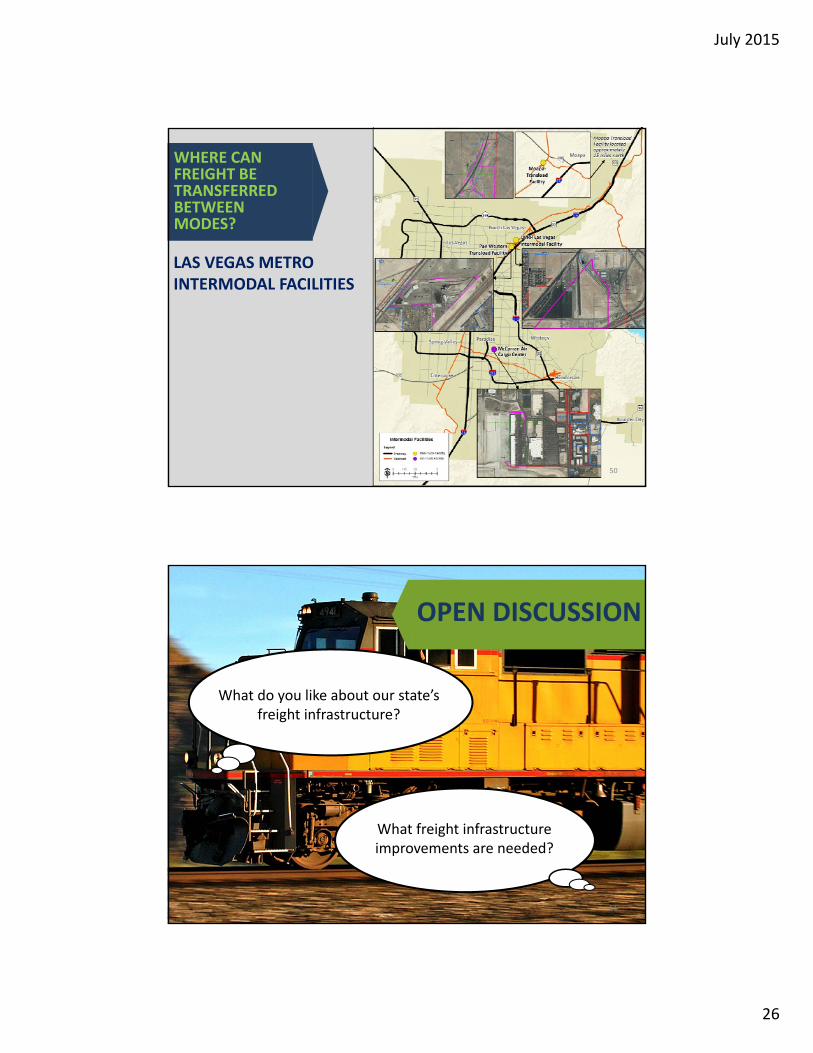
LAS VEGAS METRO INTERMODAL FACILITIES
WHERE CAN FREIGHT BE TRANSFERRED BETWEEN MODES?
OPEN DISCUSSION
What do you like about our state’s freight infrastructure?
51
What freight infrastructure improvements are needed?

July 2015
27
COMPETITIVE MARKET ANALYSIS
52
53
NEVADA’SCHANGING ECONOMIC RELATIONSHIPS
Northern Nevada/CaliforniaReno‐Sparks is becoming an integrated submarket of Northern California, with strong institutional assets, benefitting from the concentration of headquarters
Southern Nevada/CaliforniaLas Vegas remains an independent economy and a trade satellite of Southern CaliforniaEastern Nevada/UtahEastern Nevada is equally connected to Utah and Northern California

July 2015
28
54
Northern Nevada/CaliforniaReno‐Sparks has a competitive advantage within its trade area
Southern Nevada/CaliforniaLas Vegas has a cost parity within its trade area as the Inland Empire retains the cost advantageEastern Nevada/UtahThe Eastern Nevada market is a single tenant, industry‐specific real estate market serving local and regional industry
NEVADA’S INDUSTRIAL REAL ESTATE RELATIONSHIPS
55
1. Nevada’s Access limited access O & D points, only ‘Stops along Corridors’
2. Fragmented Hubs non‐optimal relationships between modes, road, rail, air, distribution and manufacturing centers
3. Capacity & Performance a wide range of conditions
EXISTINGHUBS & CORRIDORS

July 2015
29
LIMITATIONS OF THE EXISTING FREIGHT LOGISTICS NETWORKNevada’s existing Freight Logistics Model has evolved principally along two separate and independent corridors, I‐80 and I‐15. The logistics hubs that serve the large urban areas and small towns developed as O & D points or ‘Stops Along the Corridors.’
LOGISTICS RELATIONSHIPS ARE CHANGINGUrban growth and economic activity in the state of Nevada, its close relationship to California, and in the Western US is transforming the state and its potential for new relationship to the all domestic and global trading networks.
NEED FOR A NEW MODELThere is a need to redefine the existing freight logistics model in Nevada in order to initiate an evolutionary long‐term process towards a new and stronger position within the global marketplace. Only incremental improvements to the existing system will have no transformative effect on strengthening Nevada’s role in the global trading network.
Nevada is challenged to simultaneously improve its hub access, integration, and facilities to attract more economic activity from out‐of‐state sources and increase the generation of freight originating in the state.
56
COMPETITIVE MARKET ANALYSISTHE VISIONARY CONCEPT
1. FROM CORRIDORS TO CROSSROADS: RENO & LAS VEGAS
2. FROM FRAGMENTATION TO INTEGRATION
3. IMPROVE CAPACITY & PERFORMANCE57
COMPETITIVE MARKET ANALYSISDEVELOPING A COMPETITIVE ADVANTAGE
Corridors provide access in only two directions, limiting market access
Crossroads provide multidirectional access to a larger market space
Fragmented modal configurations cause increased conflicts and inefficiencies
Integrated modal configurations lead to highly efficient freight systems
July 2015
30
58
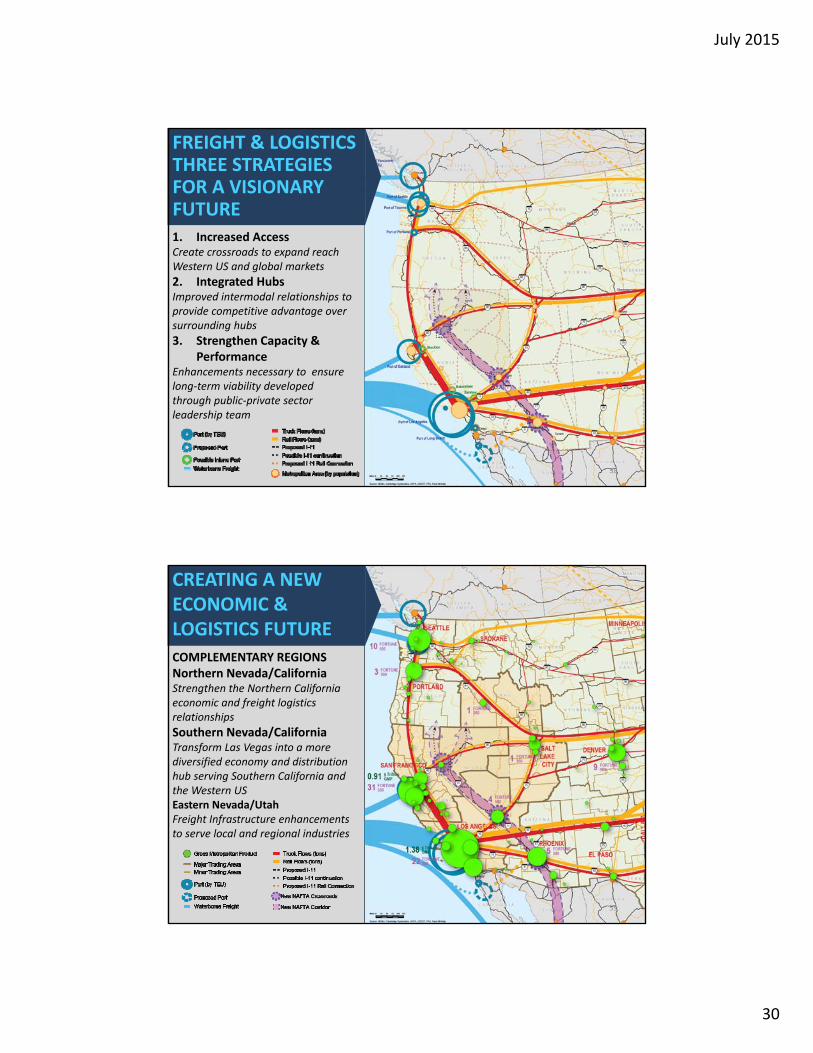
FREIGHT & LOGISTICS THREE STRATEGIES FOR A VISIONARY FUTURE1. Increased AccessCreate crossroads to expand reach Western US and global markets
2. Integrated Hubs Improved intermodal relationships to provide competitive advantage over surrounding hubs
3. Strengthen Capacity & Performance
Enhancements necessary to ensure long‐term viability developed through public‐private sector leadership team
59
CREATING A NEW ECONOMIC & LOGISTICS FUTURE
COMPLEMENTARY REGIONSNorthern Nevada/CaliforniaStrengthen the Northern California economic and freight logistics relationships
Southern Nevada/CaliforniaTransform Las Vegas into a more diversified economy and distribution hub serving Southern California and the Western USEastern Nevada/UtahFreight Infrastructure enhancements to serve local and regional industries

July 2015
31
60
OPEN DISCUSSION
How do you view Nevada’s position within the Western US?
How do you see the direction of economic relationships between Nevada and California, Northern
and Southern?
How could increased access to the Western US markets benefit
Nevada’s hubs?
How could Nevada’s hubs create a competitive advantage?
NEXT STEPS & CONTACTS
Confirm Current Conditions & Trends, and Competitive Market Analysis
Analyze Key Supply Chains Establish and Assess Performance Measures Identify Opportunities
Bill Thompson, NDOT Project Manager: 775.888.7354, [email protected]
Dan Andersen, CH2M Freight Planner: 702.953.1246, [email protected]
61
Attachment 3 Webinar Transcript

Webinar Transcript: July 29, 2015 The following is a transcript of the focus group webinar held on July 29, 2015 as part of the stakeholder outreach effort for the Nevada State Freight Plan. This transcript was produced in real-time by a third-party webinar hosting service using voice-recognition software. The content has not been edited, proofread, or otherwise altered by NDOT or its project consultant team and may contain mistranslations, omissions, inaccurate references, misspellings, or errors in grammar and word usage resulting from electronic transmission errors or other limitations related to the speech-recognition software employed. This transcript is provided for reference purposes only.
Operator: This is Conference ID # 79787857.
Good afternoon. My name is Jeff and I will be your conference operator today. At
this time I would like to welcome everyone to the Nevada State Freight Plan
conference call.
All lines have been placed on mute to prevent any background noise. After the
speakers' remarks, there will be a question and answer session.
If you would like to ask a question during this time, simply press star then the
number one on your telephone keypad. If you would like to withdraw your
question, press the pound key.
Thank you.
Dan Andersen, you may begin your conference.
Dan Andersen: Thank you, everybody, for joining this call. We appreciate it. My name is Dan
Andersen, I am with (MLD) facilitating the discussion. There were will several others
presenting on this call including (Mark Agerson) from CH2M, (Bill Thompson) who is
the program manager, the freight program manager for [NDOT], who will also share
some insights with us, and Bill is also our project manager for this project. And (Bob
James) from Michael Garrison Associates.
And finally, I am going to turn the time over now to (Michael Galas) (inaudible). Let
me go to slide number two – slide number three. Let me go to the agenda real
quick and then I am going to turn the time over to (Michael Galas) who is the prime
consultant for this project.
So, real quickly, what we wanted to accomplish today is to share with you all brief
purpose of the Nevada State Freight Plan and what are some of the goals that we
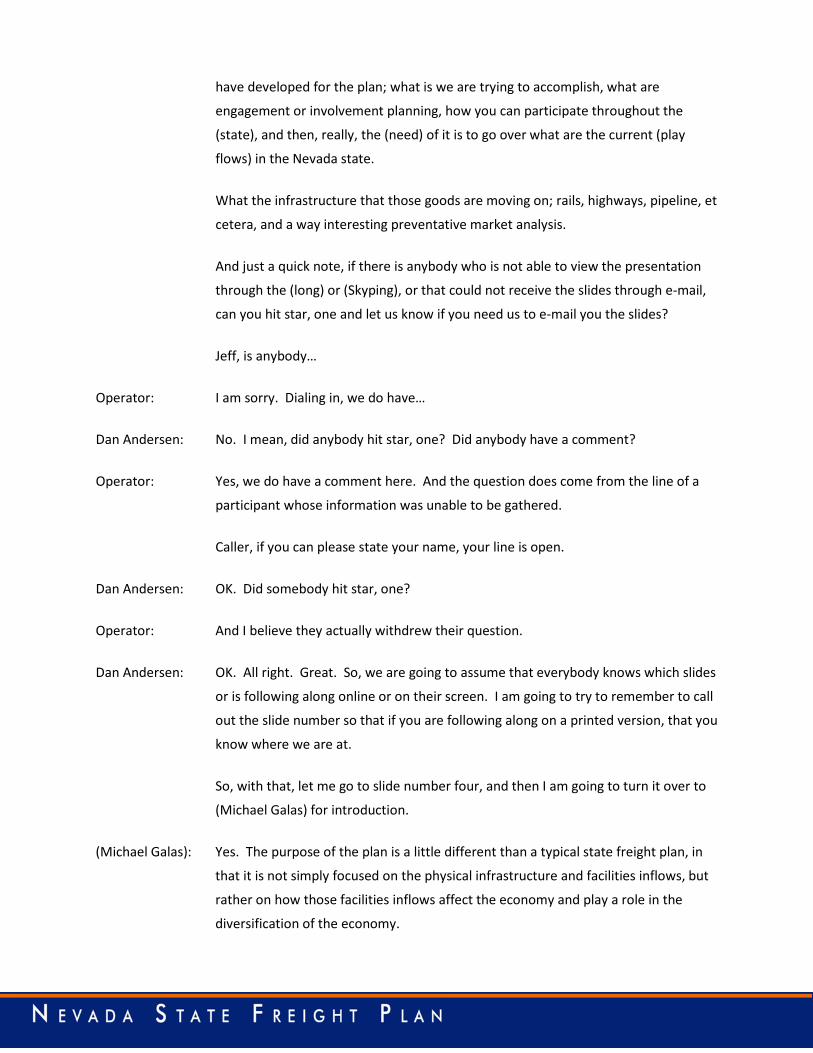
have developed for the plan; what is we are trying to accomplish, what are
engagement or involvement planning, how you can participate throughout the
(state), and then, really, the (need) of it is to go over what are the current (play
flows) in the Nevada state.
What the infrastructure that those goods are moving on; rails, highways, pipeline, et
cetera, and a way interesting preventative market analysis.
And just a quick note, if there is anybody who is not able to view the presentation
through the (long) or (Skyping), or that could not receive the slides through e-mail,
can you hit star, one and let us know if you need us to e-mail you the slides?
Jeff, is anybody…
Operator: I am sorry. Dialing in, we do have…
Dan Andersen: No. I mean, did anybody hit star, one? Did anybody have a comment?
Operator: Yes, we do have a comment here. And the question does come from the line of a
participant whose information was unable to be gathered.
Caller, if you can please state your name, your line is open.
Dan Andersen: OK. Did somebody hit star, one?
Operator: And I believe they actually withdrew their question.
Dan Andersen: OK. All right. Great. So, we are going to assume that everybody knows which slides
or is following along online or on their screen. I am going to try to remember to call
out the slide number so that if you are following along on a printed version, that you
know where we are at.
So, with that, let me go to slide number four, and then I am going to turn it over to
(Michael Galas) for introduction.
(Michael Galas): Yes. The purpose of the plan is a little different than a typical state freight plan, in
that it is not simply focused on the physical infrastructure and facilities inflows, but
rather on how those facilities inflows affect the economy and play a role in the
diversification of the economy.
And developing the plan, therefore, we must be looking at each of the proposed
new projects investments within the light of not only how will they affect the
current performance of the freight system, but also how they will affect the
economy state in Nevada, and how they would act to increase its diversity and
stability.
So, in that, this plan much achieve two things simultaneously: Improvements to the freight system,
but also looks strategically at how those improvements will affect the economy.
Now, to achieve this, on slide five, what you will see is there is two maps; in fact the
one on the left shows the state of Nevada. And often times in transportation
planning, we tend to take the edge of the state as our – because it is a jurisdictional
boundary, as the planning boundary.
And as such then, we (walk) to the facilities and the quarters, the flows within that
line and then try to determine what we would do to improve the freight movements
within the state.
However, the map to the right shows the Western United States, and then it puts
that next to it, against the global background, to ask, how does the state of Nevada
fit into the larger flows of goods that take place 24/7 around the world every day.
And to understand that Nevada, in fact, is part of a global system of freight
movements, and to ask ourselves what role and function to do we play in that larger
picture. That raises other issues with respect to both the facilities and
infrastructure, as well as our economy and how it is evolving and changing.
So, this project establishes two context: One, within the state; and the second, the state within the
broader Western United States, continental, North America and the world trade
(flows).
Then next slide, slide six, Dan will go through to explain here we are in the project
today.
Dan Andersen: Thank you.
So, we begin the project in January; we have gone through the preliminary analysis
and some developing goals and objectives, then in existing conditions and trends
analysis, competitive market analysis. Those (add-ins) are what we will share with
you today.
And then certainly, after the fact we have already initiated supply chain analysis and
as well as a developing performance majors, and using those then to identify a
range of solutions and strategies for improving our network, which we will report on
(extensively).
We go to slide number seven. Just a quick reminder that there are many studies
conducted that we are drawing on, as well as a host of data. And so, these are just
some (similarity) of a few of the studies that could have been informative to the
process.
Slide number eight are strategic goals. So, I normally do not read (slides), but this is
important, I want to read this.
So, our vision: Nevada's freight system provides a significant, competitive advantage to businesses
within the state and an incentive for businesses to relocate to Nevada. That is the
bottom line. That is what it is we are trying to achieve.
We want to create a freight system in the state that is attractive, that benefits our
local businesses and our population, serves them well and is a place where other
businesses want to do business; what to set up show here, because we have such a
great network.
And so, we have developed goals that are complementary to that, that try to fulfill
that, and it also fulfill basic Federal requirements for freight setting.
So, on slide nine, and this is – I am not going to read every word. So these are the
broad framework goals that we are developing; there is nine of them and I am just
going to summarize each, but again, the first rule is relative to economic
competitiveness.
So, we want a system that creates economic advantage; number two, reduce
congestion for our freight system; number three, a good safety; number four, a
state of good repair, have our network be in good operating order; number five,
take advantage of technologies, emerging technologies, autonomous vehicles,
connecting vehicles, figure out how to make our system work with some of the
emerging technologies and take advantage of them.
Number six, reducing the adverse environmental or community impact; number
seven, look for funding opportunities so that we can implement these ideas;
number eight, coordinate our system with local (ranges), decisions and community
(value); and then finally, establish an ongoing process. So this is not just a lot of
environment goals that is on the shelf, but it is something that can be used and
updated, and it is a living, breathing document.
If you are probably just first looking through these – well, the next one was just
project (permitted). If anybody has a comment – are there other goals that maybe
we have missed that somebody would like us to consider? And if so, again, if you
could hit star, one on your phone and queue Jeff that you want to make a comment.
Operator: Again, if you would like to ask a question, press star then the number one on your
telephone keypad.
There are no questions at this time. I will turn the call back over to the presenters.
Dan Andersen: OK. So, and just a note, you know, if you do think of other goals, something you
want us to address, then be sure to send an e-mail and we will incorporate that.
So, moving on to slide number 10, (sequel) their involvement plan. Were these
meetings, were holding meetings – we held a meeting yesterday in Las Vegas,
tomorrow we will hold a meeting in Reno, and this meeting is for anybody that is
not able to attend, in person, at one of those two locations.
And so, we will make every effort we can to reach out to as many interested parties
as possible. So, if you are aware of anybody else that you feel would be interested
to meeting, let me know so that I can add them to our distribution list and we will
keep everybody (prior) and posted on what we are doing.
And we will report back with (you all) periodically through the study, and also to let
you know, we have also formed what we are calling a freight advisory committee. It
is a Federal requirement but also a great idea, and those freight advisory committee
is a very small group of public agency and private industry representatives, private
industry representatives from some key businesses, representing a handful of key
industries around the state that are – that we meet with on a quarterly basis, and
that are senior advisors for the project.
Let me move on to slide 11. We will now address freight (flows). I am going to slide
12. So, with freight (flows), what that means is just where it is coming from and
going to, and what type of goods are moving on the state and by what volume. And
these are typically analyzed by weight and by value, by dollar value. The data
comes, primarily comes from (inaudible) way through their Freight Analysis
Framework or FAF, and these all are what we say current flows that the data
through 2012.
So, it is still a little bit outdated and things have been changing, and we are in the
process now of evaluating (problems); what may have changed, and also looking at
the future trend.
But real quickly on this slide 12, what this shows is the, where goods are coming
from; who are our major trading partners. And so, on the left hand side, the pie
chart shows the tons of goods, on the right hand side, it is the dollar value.
So, by both (kind) and dollar value, the largest trading partner is what you call (in
trail) of Nevada, which means just ourselves; it is goods flowing around the state.
So, really, our largest trading partner outside of the state is SCAG, which is an
abbreviation for Southern California Association of Governments, and it represents
the whole Southern California region. Utah, Wyoming, San Jose, and Arizona,
between both value and weight.
Certainly, not surprising, the entire neighboring state, with an emphasis on
Southern California, and (ineffable) (inaudible) again, major trading partner would
be Northern California.
Moving to slide number 13, this is the import commodities. So these are what are
the kind of goods we are importing. And again, I am going to – so you can see what
we are reporting by weight, a lot of heavier materials.
I think kind of what is interesting to me is the value. So what are the higher value
items that are coming in? I will try to mix phrase it; it is kind of a combination of
stuff, things that you would typically find in a retail store, general goods.
So, we are trying to mix (free) motorized vehicle textiles, pharmaceuticals is a big
one. (Pharma) language is (turn) yesterday, probably because (Natco), that is the
name of…?
Male: Yes.
Dan Andersen: (Natco) is a major pharmaceutical distributor. They were just learning to save and move
out of the state. So that may be a different – so those that are falling online, I am

going to go to slide 13B, we added a slide because it came up yesterday in our
meeting.
Those of you that are looking with the PDF copy I sent out yesterday do not have
this slide, but this shows the top export commodity, you know. So, it is an
instructive of what it is we were exporting.
And an interesting note is that by value, the import about $70 billion worth of
goods, my value export about half that, $35 billion. So we are a net, a net importer
of goods. And the other instructive piece of this is that – because (the other) is we
are exporting (mixed-free) electronic textiles, (metallic large), pharmaceutical is a
fairly big chunk. Again, that may change, chemical products.
So, let me move on to slide number 14. The situation by (mode); how it is moving
around, how we are getting it. It should be out by, you know, far and away. Truck is
our number one (mode).
Probably the more chunk of the heavier stuff goes by (rail), and of course, some of
the higher value stuff comes in by (air).
Slide number 16, state-wide inventory industry that we (inaudible) get. Slide
number 16.
So, I am going to turn it over to Mark in a minute to describe the (risk). This is,
really, the bottom line is we are looking at (arc). So here are the – we just talked
about what are the goods coming in and out of the state.
So now, (I want to know), well, where? Where are they going to and where are they
coming from?
And so, Mark, you want to describe the next slides?
(Mark Agerson): Sure. Thanks, Dan.
Potentially, what we have done is take in data from the state Department of
Employment Training and Rehabilitation, I believe, and kind of map up who the
largest employers were, and mostly to look at where the clusters landed in the
state, and kind of try to get an idea of why these clusters are where they are.
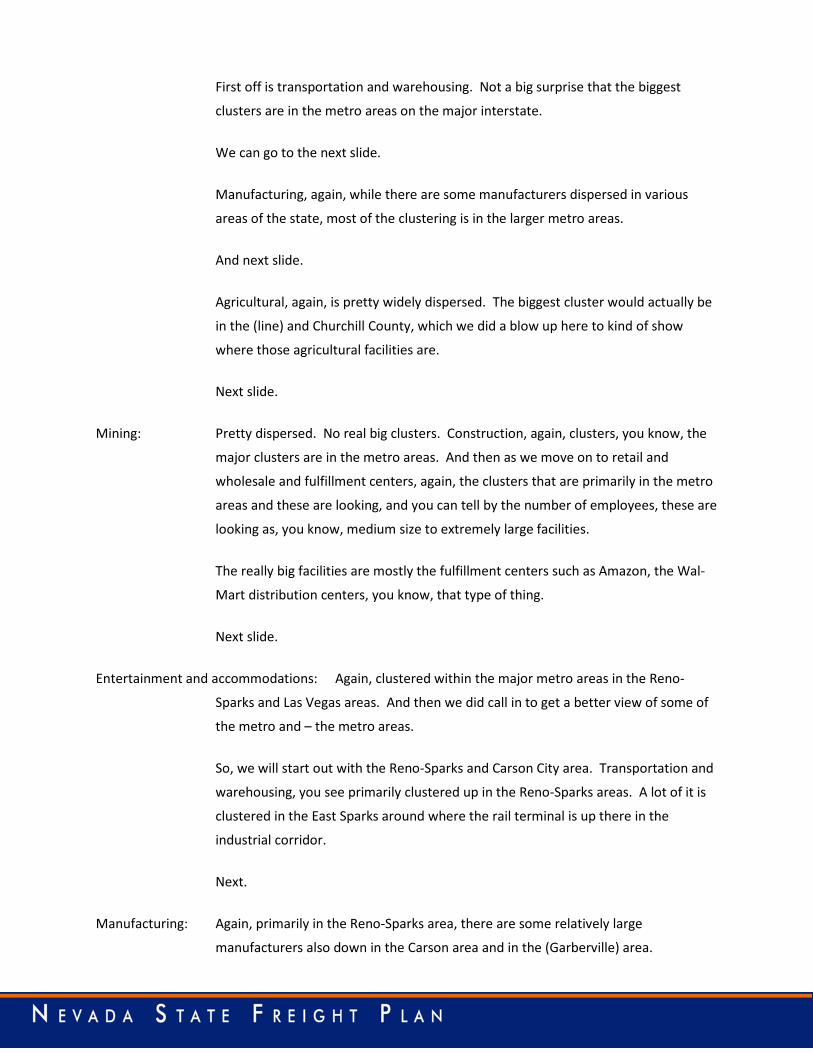
First off is transportation and warehousing. Not a big surprise that the biggest
clusters are in the metro areas on the major interstate.
We can go to the next slide.
Manufacturing, again, while there are some manufacturers dispersed in various
areas of the state, most of the clustering is in the larger metro areas.
And next slide.
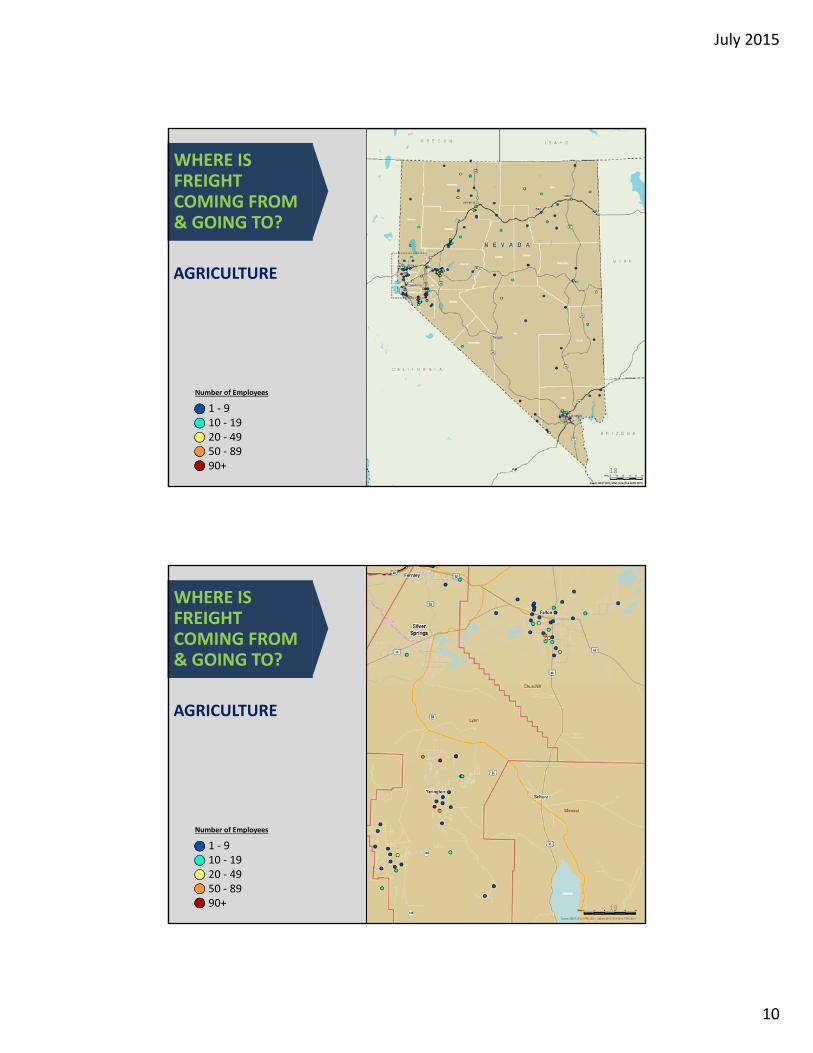
Agricultural, again, is pretty widely dispersed. The biggest cluster would actually be
in the (line) and Churchill County, which we did a blow up here to kind of show
where those agricultural facilities are.
Next slide.
Mining: Pretty dispersed. No real big clusters. Construction, again, clusters, you know, the
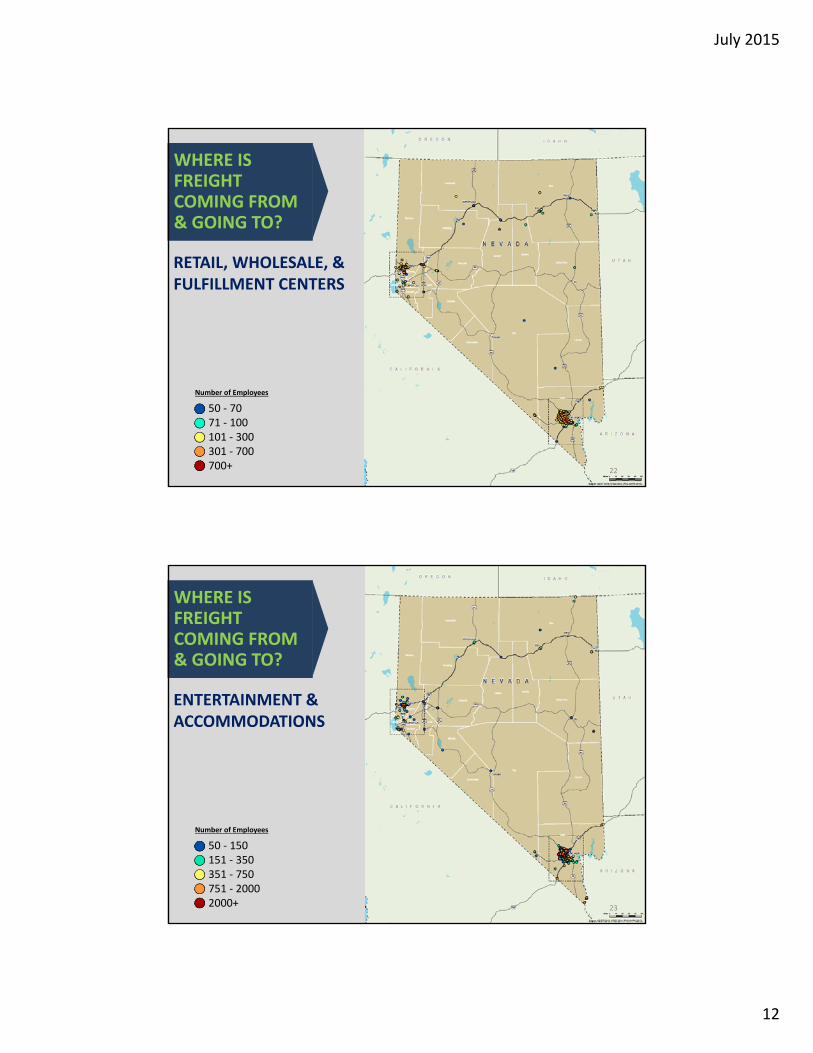
major clusters are in the metro areas. And then as we move on to retail and
wholesale and fulfillment centers, again, the clusters that are primarily in the metro
areas and these are looking, and you can tell by the number of employees, these are
looking as, you know, medium size to extremely large facilities.
The really big facilities are mostly the fulfillment centers such as Amazon, the Wal-
Mart distribution centers, you know, that type of thing.
Next slide.
Entertainment and accommodations: Again, clustered within the major metro areas in the Reno-
Sparks and Las Vegas areas. And then we did call in to get a better view of some of
the metro and – the metro areas.
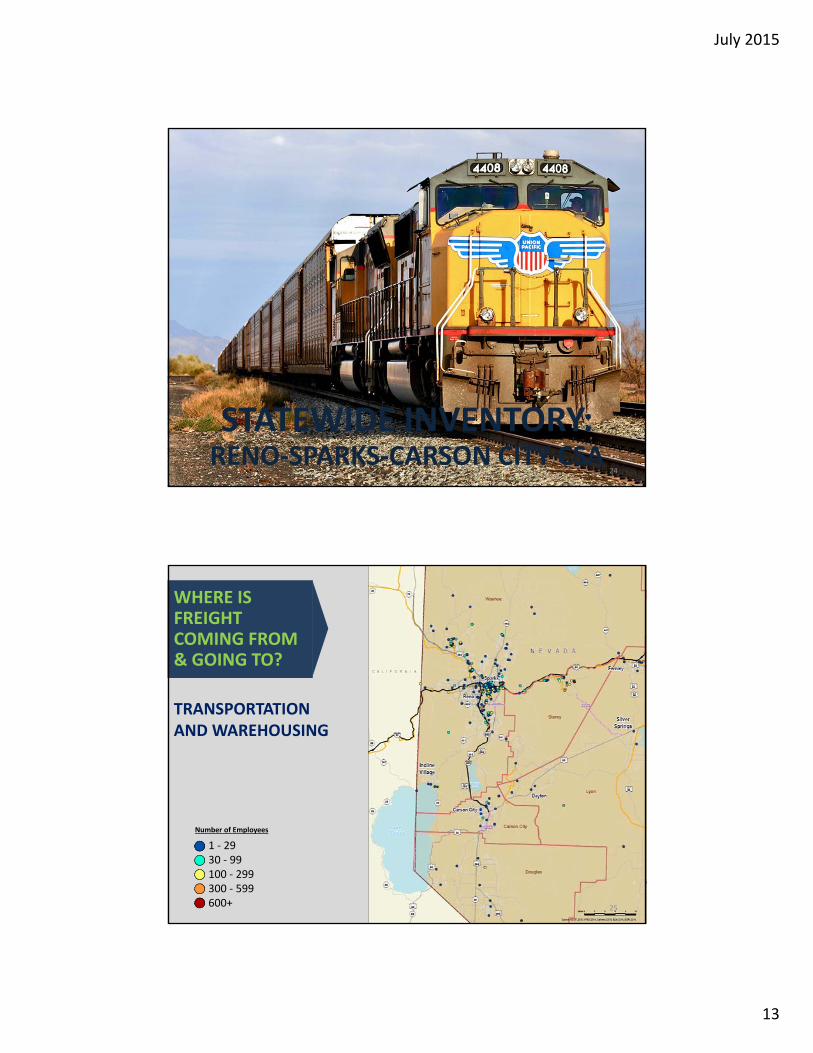
So, we will start out with the Reno-Sparks and Carson City area. Transportation and
warehousing, you see primarily clustered up in the Reno-Sparks areas. A lot of it is
clustered in the East Sparks around where the rail terminal is up there in the
industrial corridor.
Next.
Manufacturing: Again, primarily in the Reno-Sparks area, there are some relatively large
manufacturers also down in the Carson area and in the (Garberville) area.

Next slide.
And this is just a zoom of the Reno-Sparks area, the metro area. For manufacturing,
again, you can see it is pretty dispersed throughout the southern part of Reno and
also very clustered in the East Sparks industrial corridor along (IE).
Next slide.
Construction: Primarily, you see the biggest cluster, again, in the Sparks industrial area around the
rail terminal out there, as well as, you know, scattered out throughout Southern
Reno.
Retail, hotel and fulfillment centers kind of scattered throughout. Again, this does
include larger retail outlets as well. So, that is why we see a lot of – along the I-580
south of the spaghetti bowl. That is obviously that is where our largest retail stores
and (big box) stores and what not are typically located.
And the entertainment and accommodations that we can see here that you know in
the Reno area, well, we still have some, you know, some of the larger resort casinos
doing well. I think this kind of shares the, you know, manufacturing and other
industries that are actually trying to play a bigger role in the Northern Nevada
economy.
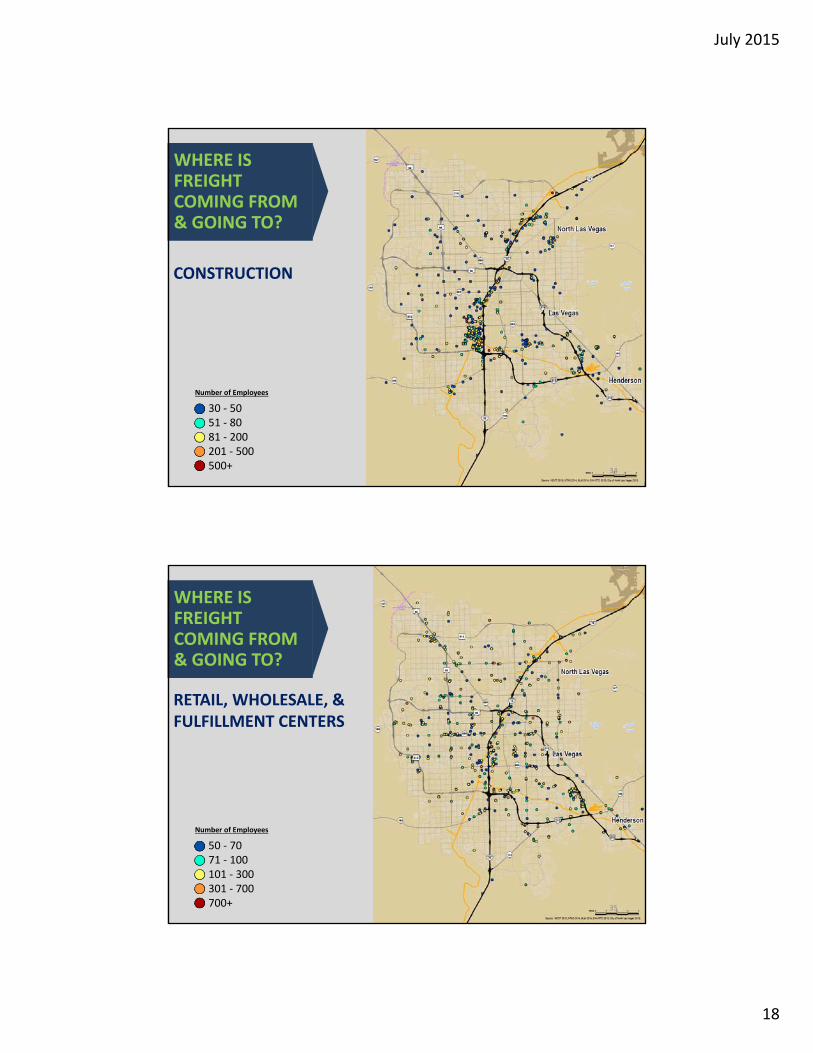
And we move on to the Las Vegas area. Transportation and warehousing, we see
that it clusters, although scattered all over, we do see that a lot of it is clustered on
the I-15 corridor.
Next slide.
Manufacturing, again, we see most of the primary cluster along the I-15 corridor.
There is also some in the south – sorry – yes, the southeast and northeast area.
Construction are very clustered along the I-15 corridor.
Retail and wholesale, not a lot of clustering; it is scattered pretty much throughout
the Las Vegas alley. Entertainment and accommodation is no real big surprise; very
clustered right along the resort corridor on I-15.
And we go into state-wide inventory by mode. I will turn this back over to Dan.
Dan Andersen: Hey. Thanks, Mark.
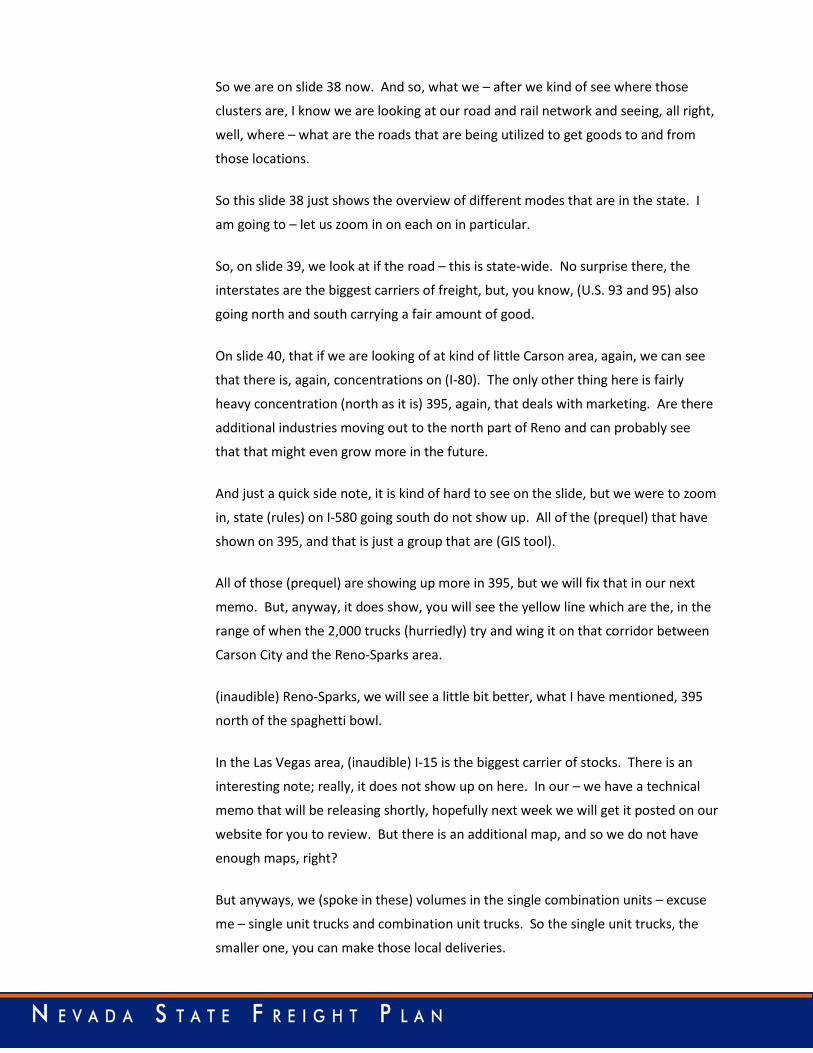
So we are on slide 38 now. And so, what we – after we kind of see where those
clusters are, I know we are looking at our road and rail network and seeing, all right,
well, where – what are the roads that are being utilized to get goods to and from
those locations.
So this slide 38 just shows the overview of different modes that are in the state. I
am going to – let us zoom in on each on in particular.
So, on slide 39, we look at if the road – this is state-wide. No surprise there, the
interstates are the biggest carriers of freight, but, you know, (U.S. 93 and 95) also
going north and south carrying a fair amount of good.
On slide 40, that if we are looking of at kind of little Carson area, again, we can see
that there is, again, concentrations on (I-80). The only other thing here is fairly
heavy concentration (north as it is) 395, again, that deals with marketing. Are there
additional industries moving out to the north part of Reno and can probably see
that that might even grow more in the future.
And just a quick side note, it is kind of hard to see on the slide, but we were to zoom
in, state (rules) on I-580 going south do not show up. All of the (prequel) that have
shown on 395, and that is just a group that are (GIS tool).
All of those (prequel) are showing up more in 395, but we will fix that in our next
memo. But, anyway, it does show, you will see the yellow line which are the, in the
range of when the 2,000 trucks (hurriedly) try and wing it on that corridor between
Carson City and the Reno-Sparks area.
(inaudible) Reno-Sparks, we will see a little bit better, what I have mentioned, 395
north of the spaghetti bowl.
In the Las Vegas area, (inaudible) I-15 is the biggest carrier of stocks. There is an
interesting note; really, it does not show up on here. In our – we have a technical
memo that will be releasing shortly, hopefully next week we will get it posted on our
website for you to review. But there is an additional map, and so we do not have
enough maps, right?
But anyways, we (spoke in these) volumes in the single combination units – excuse
me – single unit trucks and combination unit trucks. So the single unit trucks, the
smaller one, you can make those local deliveries.
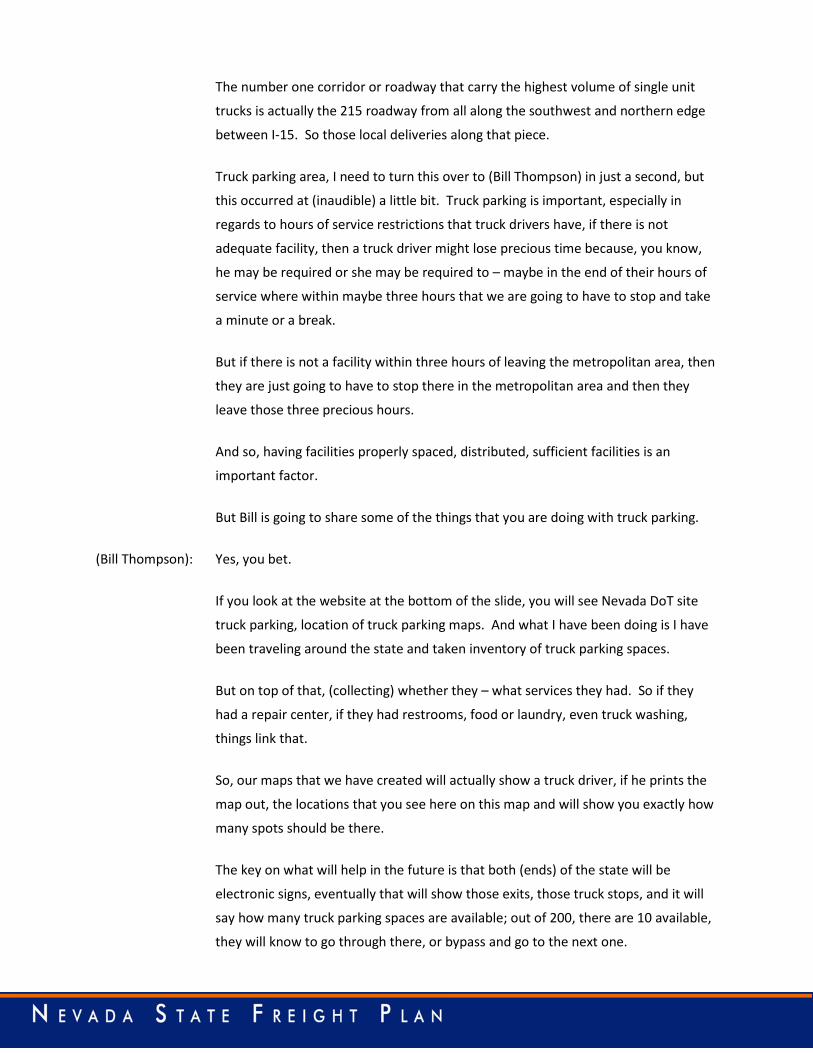
The number one corridor or roadway that carry the highest volume of single unit
trucks is actually the 215 roadway from all along the southwest and northern edge
between I-15. So those local deliveries along that piece.
Truck parking area, I need to turn this over to (Bill Thompson) in just a second, but
this occurred at (inaudible) a little bit. Truck parking is important, especially in
regards to hours of service restrictions that truck drivers have, if there is not
adequate facility, then a truck driver might lose precious time because, you know,
he may be required or she may be required to – maybe in the end of their hours of
service where within maybe three hours that we are going to have to stop and take
a minute or a break.
But if there is not a facility within three hours of leaving the metropolitan area, then
they are just going to have to stop there in the metropolitan area and then they
leave those three precious hours.
And so, having facilities properly spaced, distributed, sufficient facilities is an
important factor.
But Bill is going to share some of the things that you are doing with truck parking.
(Bill Thompson): Yes, you bet.
If you look at the website at the bottom of the slide, you will see Nevada DoT site
truck parking, location of truck parking maps. And what I have been doing is I have
been traveling around the state and taken inventory of truck parking spaces.
But on top of that, (collecting) whether they – what services they had. So if they
had a repair center, if they had restrooms, food or laundry, even truck washing,
things link that.
So, our maps that we have created will actually show a truck driver, if he prints the
map out, the locations that you see here on this map and will show you exactly how
many spots should be there.
The key on what will help in the future is that both (ends) of the state will be
electronic signs, eventually that will show those exits, those truck stops, and it will
say how many truck parking spaces are available; out of 200, there are 10 available,
they will know to go through there, or bypass and go to the next one.
We found that on I-80 is that we are approximately 1,200 truck parking spaces
short. So when there are problems at the California and Nevada state line, when
they close it for snow events or truck accidents, and we found trucks are parking on
the side of the road in lane one and two on approximately five miles all the way up
to state line in Reno.
So, that would be another objective of us, is to find more locations.
And with that, Dan…
Dan Andersen: All right. Let us look at – let us see, I think we are on slide 61. It says what is our
(rail network). This shows what the rail lines are in the state, again, primarily
following the I-15 corridor and the I-80 corridors, and there are some other
(inaudible) lines and facilities.
And the next slide, slide 61, shows – it is hard to see and move the slide, but where
it is, key facilities are – I will (go) a little just a minute on another slide. So why do
not we just keep going.
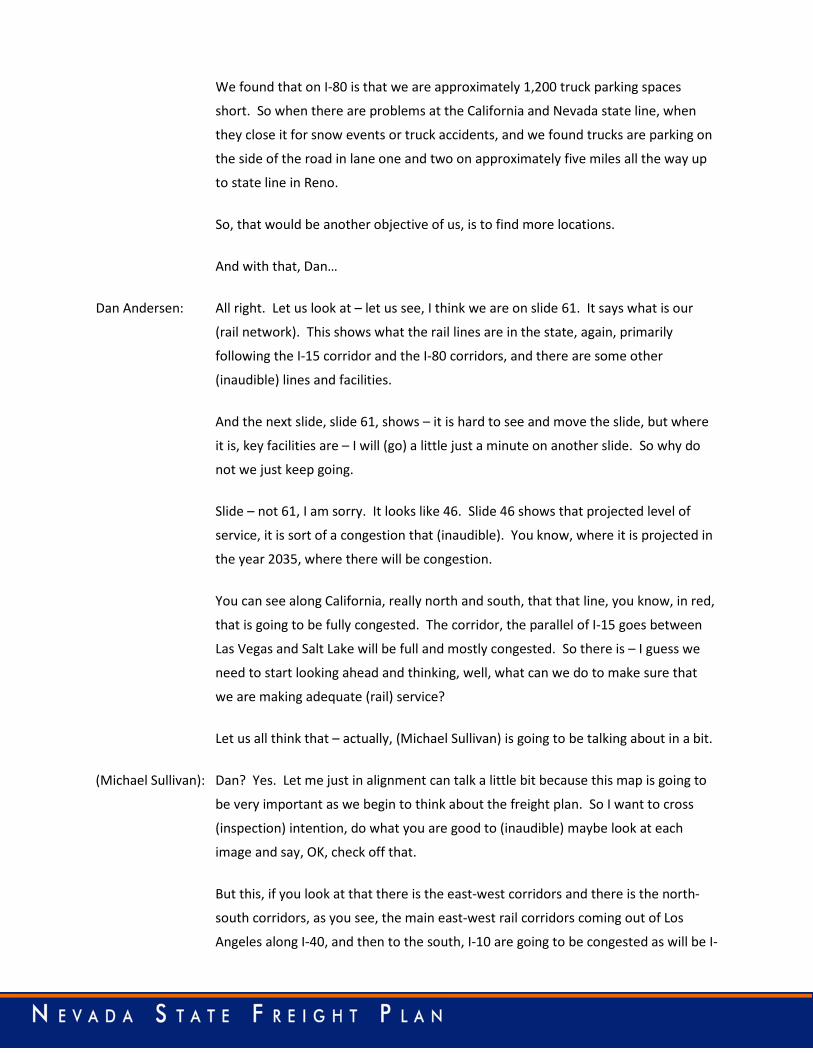
Slide – not 61, I am sorry. It looks like 46. Slide 46 shows that projected level of
service, it is sort of a congestion that (inaudible). You know, where it is projected in
the year 2035, where there will be congestion.
You can see along California, really north and south, that that line, you know, in red,
that is going to be fully congested. The corridor, the parallel of I-15 goes between
Las Vegas and Salt Lake will be full and mostly congested. So there is – I guess we
need to start looking ahead and thinking, well, what can we do to make sure that
we are making adequate (rail) service?
Let us all think that – actually, (Michael Sullivan) is going to be talking about in a bit.
(Michael Sullivan): Dan? Yes. Let me just in alignment can talk a little bit because this map is going to
be very important as we begin to think about the freight plan. So I want to cross
(inspection) intention, do what you are good to (inaudible) maybe look at each
image and say, OK, check off that.
But this, if you look at that there is the east-west corridors and there is the north-
south corridors, as you see, the main east-west rail corridors coming out of Los
Angeles along I-40, and then to the south, I-10 are going to be congested as will be I-
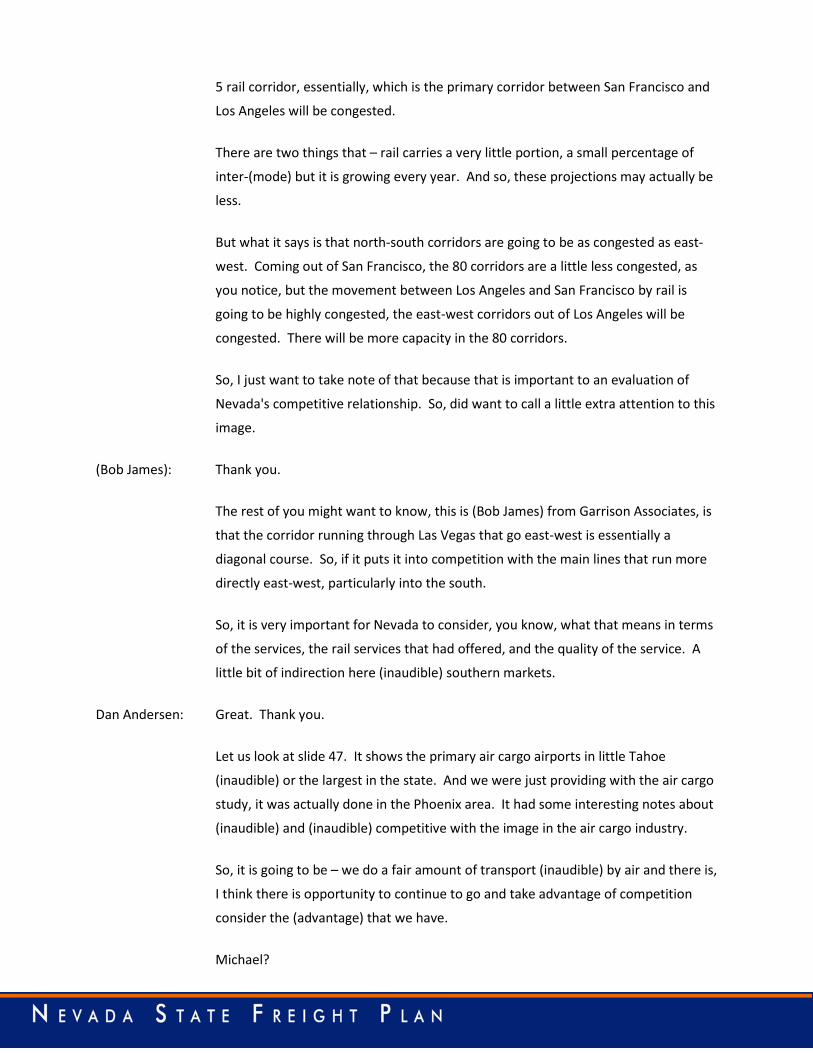
5 rail corridor, essentially, which is the primary corridor between San Francisco and
Los Angeles will be congested.
There are two things that – rail carries a very little portion, a small percentage of
inter-(mode) but it is growing every year. And so, these projections may actually be
less.
But what it says is that north-south corridors are going to be as congested as east-
west. Coming out of San Francisco, the 80 corridors are a little less congested, as
you notice, but the movement between Los Angeles and San Francisco by rail is
going to be highly congested, the east-west corridors out of Los Angeles will be
congested. There will be more capacity in the 80 corridors.
So, I just want to take note of that because that is important to an evaluation of
Nevada's competitive relationship. So, did want to call a little extra attention to this
image.
(Bob James): Thank you.
The rest of you might want to know, this is (Bob James) from Garrison Associates, is
that the corridor running through Las Vegas that go east-west is essentially a
diagonal course. So, if it puts it into competition with the main lines that run more
directly east-west, particularly into the south.
So, it is very important for Nevada to consider, you know, what that means in terms
of the services, the rail services that had offered, and the quality of the service. A
little bit of indirection here (inaudible) southern markets.
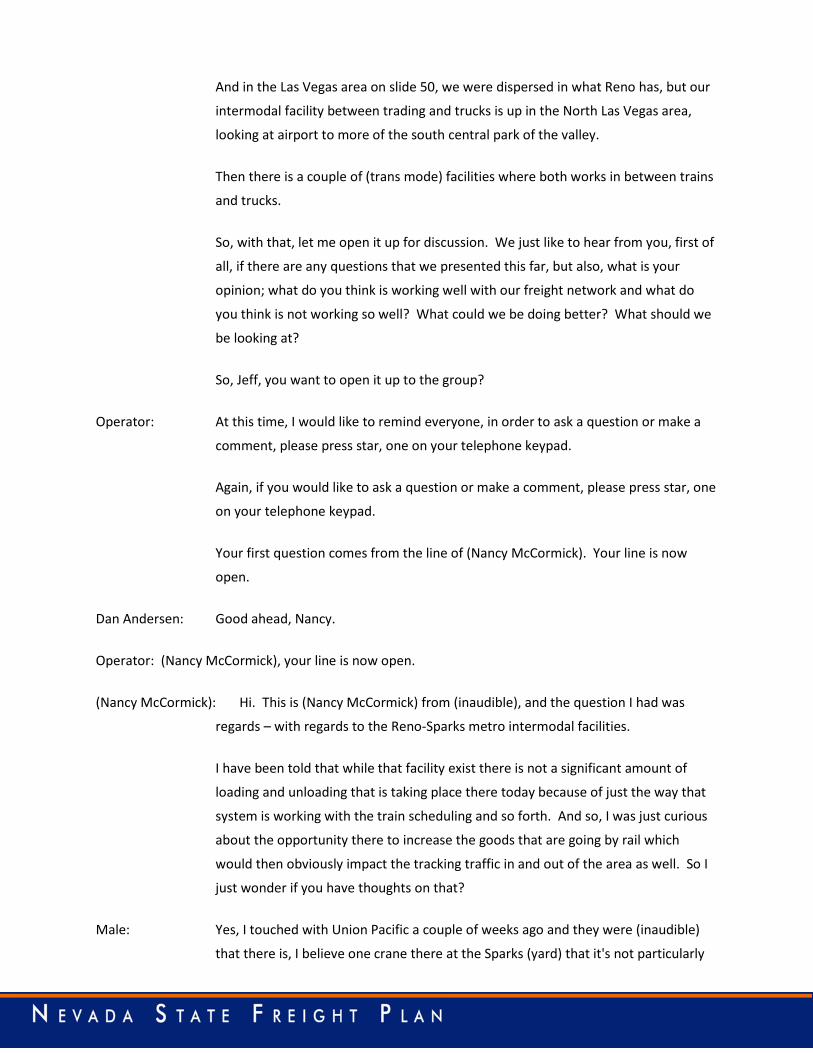
Dan Andersen: Great. Thank you.
Let us look at slide 47. It shows the primary air cargo airports in little Tahoe
(inaudible) or the largest in the state. And we were just providing with the air cargo
study, it was actually done in the Phoenix area. It had some interesting notes about
(inaudible) and (inaudible) competitive with the image in the air cargo industry.
So, it is going to be – we do a fair amount of transport (inaudible) by air and there is,
I think there is opportunity to continue to go and take advantage of competition
consider the (advantage) that we have.
Michael?

(Michael Galas): Right. Another thing to take note of is that while the passenger volumes between
(inaudible) and Reno Tahoe, the disparity is quite large for (inaudible) and
(inaudible) passengers. But in freight, the numbers are much closer.
Which speaks to the fact of the changing economy in Reno-Sparks that is generating
our impropriation; our percentage are much higher volumes with freight.
Dan Andersen: Good point. And then go through some of (nasty) Mark was talking about,
(inaudible). If you, you know, the manufacturing with some of the largest and
(raise) number of manufacturers are up in that after the Reno, Carson, Sparks area
of Northern Nevada.
Male: I have had a chance to look at these figures closely, but another interesting asset
that the figures for future study here is the difference between cargo that is
originating in Nevada and cargo that is coming in to Nevada.
And I would think that we may see in the figures, just when we see more traffic
proportionally at Reno Tahoe, that might be driven more by cargo going out from
the region as we would see (inaudible), which probably well along with the
passenger, it serves a strong, you know, strong import of cargo into the area.
Dan Andersen: So let me show you – Jeff, I think we just have three more slides, and then I will
open it up to questions and comments.
On slide 48, this shows where our pipelines are. I think this is important because
pipelines interface with trucks, and then if you get fuel, it comes by pipeline, goes to
(inaudible) doing that in the trucks and then trucks come over to our gas stations
and (inaudible) with other users. So understanding where those facilities are
located.
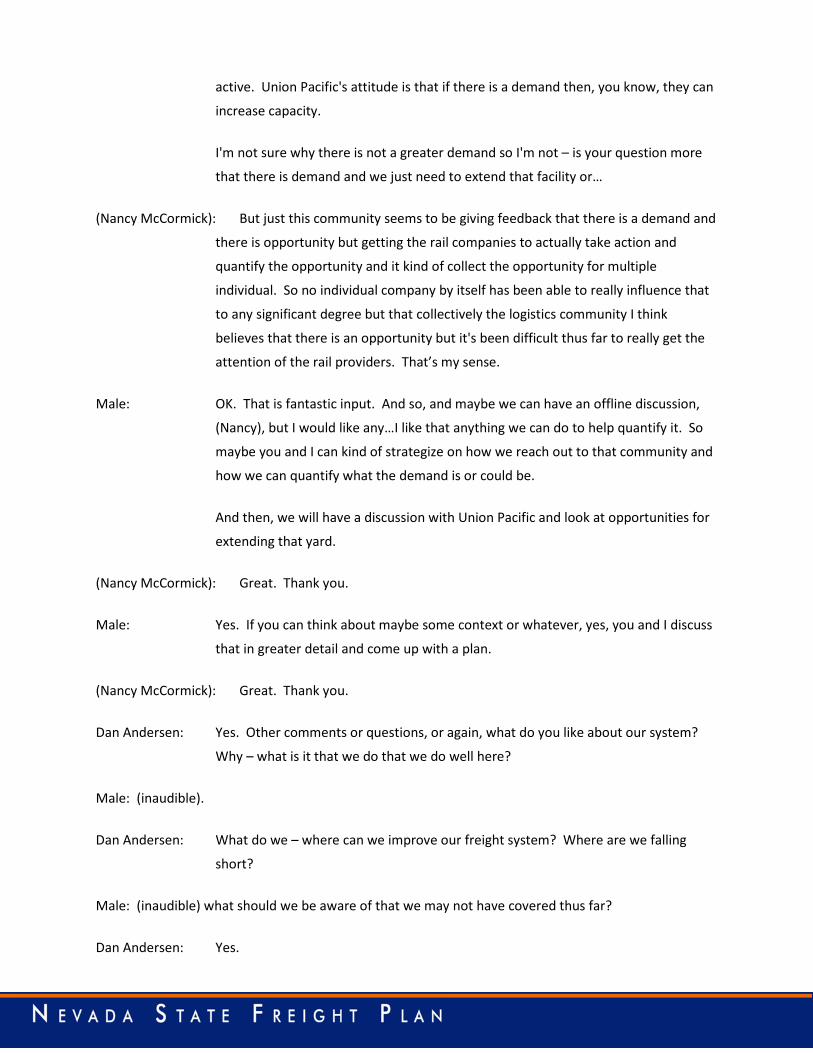
Slide 49, now we are looking at these couple of slides in the Reno-Sparks area and
then the next one is Las Vegas area, shows where these ports come together; where
the modes come together.
And so, in the Reno area, as Mark mentioned, marks rail yard, and there is an
industrial park with it, as an intermodal, is this intermodal rail yard facility. It is just
right there close to the airport; pipeline comes in it, that is where they think
(inaudible). And so that is where a lot of goods of modes intersect.
And in the Las Vegas area on slide 50, we were dispersed in what Reno has, but our
intermodal facility between trading and trucks is up in the North Las Vegas area,
looking at airport to more of the south central park of the valley.
Then there is a couple of (trans mode) facilities where both works in between trains
and trucks.
So, with that, let me open it up for discussion. We just like to hear from you, first of
all, if there are any questions that we presented this far, but also, what is your
opinion; what do you think is working well with our freight network and what do
you think is not working so well? What could we be doing better? What should we
be looking at?
So, Jeff, you want to open it up to the group?
Operator: At this time, I would like to remind everyone, in order to ask a question or make a
comment, please press star, one on your telephone keypad.
Again, if you would like to ask a question or make a comment, please press star, one
on your telephone keypad.
Your first question comes from the line of (Nancy McCormick). Your line is now
open.
Dan Andersen: Good ahead, Nancy.
Operator: (Nancy McCormick), your line is now open.
(Nancy McCormick): Hi. This is (Nancy McCormick) from (inaudible), and the question I had was
regards – with regards to the Reno-Sparks metro intermodal facilities.
I have been told that while that facility exist there is not a significant amount of
loading and unloading that is taking place there today because of just the way that
system is working with the train scheduling and so forth. And so, I was just curious
about the opportunity there to increase the goods that are going by rail which
would then obviously impact the tracking traffic in and out of the area as well. So I
just wonder if you have thoughts on that?
Male: Yes, I touched with Union Pacific a couple of weeks ago and they were (inaudible)
that there is, I believe one crane there at the Sparks (yard) that it's not particularly
active. Union Pacific's attitude is that if there is a demand then, you know, they can
increase capacity.
I'm not sure why there is not a greater demand so I'm not – is your question more
that there is demand and we just need to extend that facility or…
(Nancy McCormick): But just this community seems to be giving feedback that there is a demand and
there is opportunity but getting the rail companies to actually take action and
quantify the opportunity and it kind of collect the opportunity for multiple
individual. So no individual company by itself has been able to really influence that
to any significant degree but that collectively the logistics community I think
believes that there is an opportunity but it's been difficult thus far to really get the
attention of the rail providers. That’s my sense.
Male: OK. That is fantastic input. And so, and maybe we can have an offline discussion,
(Nancy), but I would like any…I like that anything we can do to help quantify it. So
maybe you and I can kind of strategize on how we reach out to that community and
how we can quantify what the demand is or could be.
And then, we will have a discussion with Union Pacific and look at opportunities for
extending that yard.
(Nancy McCormick): Great. Thank you.
Male: Yes. If you can think about maybe some context or whatever, yes, you and I discuss
that in greater detail and come up with a plan.
(Nancy McCormick): Great. Thank you.
Dan Andersen: Yes. Other comments or questions, or again, what do you like about our system?
Why – what is it that we do that we do well here?
Male: (inaudible).
Dan Andersen: What do we – where can we improve our freight system? Where are we falling
short?
Male: (inaudible) what should we be aware of that we may not have covered thus far?
Dan Andersen: Yes.
Male: Are there issues?
Operator: Again, if you have a question or make a comment, please press star one.
Male: Yes. If you feel there is an issue we haven’t addressed or something we should be
aware of, please feel free to call it to our attention at this very (time).
Operator: There are currently no questions over the phone.
Actually, I do apologize. We have a question from (Nancy McCormick). Your line is
now open.
(Nancy McCormick): I'm sorry. I just have another comment.
You all have done a great job by looking at all the different components, and so
great work. What I would throw out is that the, you know, past performances likely
to be conservative indicator of what's going to happen in the future in at least in
Northern Nevada.
So, the forecast for things…I'm not sure if you have added in some sort of additional
calculation based on the forecasted growth in the region but, you know, certainly
it's going to outpace probably anything that we have seen in the area at least in the
last five to eight years. So the using of historical data would need to be really I
guess modified and extended because of what currently exist in the pipeline in
terms of new development in the region. So I just wondered about that that being
factored in at this point.
Male: Yes. Thank you. That’s a good point. And we are doing our best, so we are working
on that right now looking at what are the future projections and indicators. And
one of the things that we are – and you are right, past history doesn’t necessarily
predict the future not only in terms of volume but also in terms of types of
industries, you know, what the changing phase of industries.
And so we are – one of our next steps that we are working on right now is looking at
game analysis of key industries within the state not necessarily those industry that
maybe real stronger now but that are emerging or industries that we want to grow
and looking at what are their supply chain, and what can we do to make things
better for them.

So again, maybe when we talk you can – any data or ideas that you have will fall in
to our analysis.
(Nancy McCormick): Yes. And I think the upcoming (ethic) report which should be out within the
next few weeks which is very comprehensive about projections for the different
regions in Northern Nevada will be very helpful to take a look at.
Male: Within the (circle)?
(Nancy McCormick): Economic planning indicator committee (ethic) and they have – it has
representation by all sorts of public and private sector entities in Northern Nevada.
And it has really focused on job growth and population growth but there is going to
be a lot of very detailed statistics in that report that I think maybe have helped you
as well.
Male: What year was that published, (Nancy)?
(Nancy McCormick): It's being published within the next two weeks. This committee has been
meeting for the last 10 months or so and it will be coming out probably within the
next two weeks. The (RTC) is a part of that team as well as cities, counties,
government agencies and individual entity so it's coming out soon.
Male: And where would we – could we acquire it from, (Nancy)? Who would be
contacted?
(Nancy McCormick): Yes, anybody…probably the Regional Authentication Commission would be the
best place to get it from.
Male: The (RTC)?
(Nancy McCormick): Yes.
Male: OK. You are exactly right. and I want to call attention to exactly your point about
historical statistics and the Reno Sparks area, it's very important part of the next
section of the presentation competitive analysis because we totally agree with you
that historic trends are no – are not substantially going to indicate what's coming in
the future.
We noticed in…to reinforce that, we noticed in all the previous reports that Dan
pointed to that had been done on freight in north and south, and along the various

quarters. Many of them were done during their recessionary period using statistics
that were recorded at the bottom of the recession which showed, you know,
various flow growth or no growth, big vacancy rates, et cetera.
And if you go back further then they show (Boomtags) like everything is on the
upward conductor. So we are very aware as we do this of taking a long term view
and realizing the (peaks and) valleys that you cannot face a long-term plan simply on
the latest statistics. But have to do that forward looking issue and that’s why we call
the attention to, for instance, the freight congestion in 2035.
And we look forward to reviewing your report because it's going to be forward-
looking data that we really need to focus on in the context of current and past data
to understand how the future is really maybe very different than what we are used
to seeing in the past.
(Nancy McCormick): Right. Thanks.
Male: Just for epigram sake, I would like to add something here that the past is prolonged
but it's not destiny. And the only forecast that I have seen that have been generally
untrue are straight line forecast based on present data even if you just have a few
years of historic trend.
So, if you want to know what's not going to just project forward but they are – give
us the general framework and they allow us to ask some important questions. And
when we move into this next session we will see, we are proposing an aspirational
approach, our framework that would help us draw out the important differences
that would occur between what you see in the straight line and what maybe
happening in the under (current) that would changes and how you could put
yourself in a position in the future to become more competitive.
Dan Andersen: All right. Any other comments? Questions?
Operator: There are no further…
Male: There is one more in the queue.
Operator: Yes. We do have one from (Danny Wyatt). Your line is now open.
Male: I think that answered (inaudible).

Male: Excellent.
Operator: We do have another question from (Mathew Doora). Your line is now open.
(Mathew Doora): Hi. Good morning. I've just got a question on slide 48, it shows that petroleum
refinery in (Ennai) county. I just wondered what that was. I wasn’t aware of that. I
don’t see any pipelines connected to it.
Male: (Marc), do you remember we had a similar…we (were one) on the same thing, I can't remember if
we came to this conclusion. If not, we will have…
Male: I actually – that raise my echoes too when I saw it's a really small refinery that’s out
there. It mostly gets shipments by track from a couple of different facilities that are
located in the vicinity. And actually where our folks are listening in over here had
mentioned that he knows and he believes that a lot of the activity is actually asphalt
that’s being manufactured out there but I think there are some other products as
well.
I can't remember the name of the actual company that’s out there but it is just a
small (inaudible) local firm and there are no pipelines that connect it. They have
received all their product by truck.
(Mathew Doora): OK, great. Thank you.
Male: You are welcome.
Operator: Again, if you would like to ask a question or make comment, please press star one.
And we have a question from the line of (Danny Wyatt). Your line is now open.
(Danny Wyatt): Good morning. I want to complement you on the report, excellent report. I think
one thing that I see that needs to be considered and especially in this day and age is
security. And both with truck movements of hazardous materials and including
munitions and unit train issues that we have seen around the country I think some
consideration from the local first responders and with regard to where those
facilities are and their access to those facilities where (inaudible) parking and safe
havens for hazardous materials in the future as it relates to housing and other
important general population areas.
Male: Yes, very interesting. I know we will – we've had some dialog (inaudible) meet with,
I believe (inaudible) first responders way, way back when we first started, and that’s
a good point. We will continue to that dialog and look at those issues.
(Danny Wyatt): Thank you.
Operator: Once again, if you have – if you would like to ask a question or make a comment,
please press star one.
And there are no questions or comments at this time.
Dan Andersen: OK. So we move forward. So let's look at, let's say, yes. So it's like 52, I'm on the
slide 53 that’s the beginning of the competitive market analysis and turn that over
to (Michael Galas).
(Michael Galas): Thanks, Dan.
As we discussed the regional purpose of the freight plan was to relate back
economic activity. So the first thing that you are seeing here is an image that the
Western United States, those green circle show the signs of the economy and the
number in green next to it is the size of the economy in trillions of dollars.
And what we looked at, and you could see here is that when you look at the State of Nevada it really is
divided between three large trade areas: one centered in the north, in San
Francisco which is the major trade area, in the south Los Angeles the major trade
area, and to the east Salt Lake.
Los Angeles bound by Phoenix Trade area to the east and San Francisco in the north
by Portland. Within each of those trade areas it subdivided into a series of what I
referred to as minor trade areas. And you see Northern California has a number of
them. Reno is essentially the center of the large, Nevada which is a single large
trade area.
As this Las Vegas defines a large eastern trade area within the Los Angeles trade
area. Now, when you look at…we looked at the total economy because in looking at
the economic relationships at freight system it's really not the State of Nevada but
it's rather each of these, the northern area, its relationship to the San Francisco
economy and in Las Vegas relationship primarily to Los Angeles economy and its
competitive relationship to the Phoenix economy.
In Eastern Nevada, you get the overlap with the Salt Lake economy. And while you
see the dark heavy line, it's really not that criss (inaudible) edge. These are rather
blurred edges we might say but they do kind of help you get a feeling for how that
works. So the entire 80 quarter is, and of course, Nevada is considered part of the
San Francisco trade area although the more eastern section we know has a heavy
overlap with Salt Lake so it's not really that kind of cotton dried to dimension.
When we look at it, the Northern California, Northern Nevada economy is $910
billion or close to a trillion dollars, Los Angeles larger population based about 1.4
trillion. Now, interest statistic, we wanted to look at which companies are
headquarted in each area. San Francisco area has more and then Northern
California have 31 Fortune 500 although if you put them into various economic
sectors 16 of those companies are in technology so it's heavy technology biased
economy in the north.
In the south well there is 22 in Los Angeles, there are four in Las Vegas although we
learned yesterday tehre is actually five of financial services company has moved
here. So there is actually five which equals Phoenix's number.
But of those 22 in the Los Angeles area they are actually in 12 sectors more
balanced. And as (Bob James) have said, San Francisco, the northern area is more
technology economy. Los Angeles is more of commerce economy based on a huge
straight flows and more diversified.
Now, what we are seeing though is a very different evolution of the economy in the
north than there is in the south.
In the north, as we have seen the major investments in Reno area, new
manufacturing and they really are investments made by Northern California
companies. And what we are seeing is an evolution of the Reno Sparks versus the
economy as essentially a sub-market of the Northern California economy.
The San Francisco bay area company had already extended itself outward in
Sacramento. And as you see, a huge portion of the 99 quarter because the growth
of technology has really pushed out industrial and manufacturing out into the
central valley. And the next logical step is over to Reno and with Reno's relationship
to Lake Tahoe and the amenities of the (CRS). It is really transforming into an
integrated component of that economy. At the same time with (UNR) up there,
Flagship Institution, its institutional assets match the economic profile of the

Northern California economy and you can see technology companies, et cetera,
would see that as a logical next step (in) market.
We don’t see the same thing happening in Southern Nevada that major investments
remain in Southern Nevada in tourism, Genting and then (inaudible) next door
multi-billion dollar investment by Genting, billion dollar investment next door to it in
tourism. So Las Vegas continues as an independent kind of global destination for
entertainment tourism although there is some significant movements towards a
diversification but not of the type that we see happening with the Reno economy.
So Las Vegas and the Southern Nevada is really not becoming a sub-market of Los
Angeles economy. It retains…it's kind of self-identity as a separate independent
kind of economic center.
Next slide, as we – and I want to say that relationship to us heavily placed into what
we see as a future logistics model, freight logistics model that we will talk about to
accommodate the significant changes, economic relationships between California
and the rest of the western economic structure that really need to become
foundation elements in the freight plan.
Now, the second thing we look at was industrial real estate. And as you will see on
this, what we did is the size of the circle indicates the size of the market and the
color indicates the current price first quarter of 2015 from CB Richard Ellis, CBRE. So
we had to pick a national global data source that would cover all these markets,
CBRE seemed to be the most comprehensive so we are using their numbers.
What you will see in the north is interesting, the highest priced markets in the west
coast are really in the San Francisco area, Silicon Valley and San Francisco,
Peninsula, and there are four of these markets including Sacramento and Oakland,
the total only 540 million square feet. Reno as you see is the lower priced market
and therefore has a price advantage over the northern, other Northern California
markets that are really attending to our (tire) and hired (red) structures.
So here, we have Northern Nevada with the cost advantage over the northern
markets which reinforces this Reno as a value based sub-market with high
institutional asset value and with cost advantage.
We don’t see the same thing in the south. What we see in the south in fact is that
it's more moderately priced and the Las Vegas is kind of a mid-price, and Inland
Empire retains to be priced advantage over Las Vegas.
Now, one of the interesting things about the markets is that Las Vegas has a very
low land potion in relationship to industrial, one of the lowest in the country and
therefore it's a highly constricted market which tends to push up the price of (re-
instituted ) the market constraints.
You see it's kind of competitive with Phoenix and so in Southern California, Southern
Nevada you don’t see a price advantage in Las Vegas over Phoenix or over Inland
Empire but there is more (apparent) pursue with Phoenix.
So this idea that Las Vegas is an independent market that kind of compete in a
global sense more independently is reinforced by the industrial data.
Now, one of the things we look at is in the freight flow data is the core (interim) hub
structure of the Western United States. And what we have here is a major ports
and the thickness of the minds are to show relative size of the flows. So what you
see is Los Angeles is not only the dominant port in the United States, it's really the
dominant Pacific port of North and South America. It works to every other port
from the tip of South America, Keyport and all the way to Alaska, I mean there is no
port in South America, Mexico, Canada that equals that size.
And there is no port in North America that combined Los Angeles and Long Beach is
simply the largest container, ocean container freight flow.
If you look on the – notice the size of Los Angeles industrial market at 1,880,000,000
square feet, almost two billion square feet of industrial space is by far the largest
industrial market in North America or the Americas period is the dominant market.
Now, what we see here is coming out of the three big locations: Los Angeles, San Francisco and the
Northwest which is very different than the east coast or Gulf Coast which are more
fractured, they have many more ports going up and down the Atlantic or along the
Gulf Coast. And the freight flows are much more equally divided between multiple
ports as supposed to a single dominant port we have here, and multiple locations as
supposed to only three.
Therefore, you only have three big quarters coming out of the west, one coming out
of Los Angeles. And you see the dominant quarter being (i40). And the two lines
there is red is truck and it's measured in tons not value because we are very
different (with) value, truck flows and rail flows.
And you see the (i40) quarter in Los Angeles, and you have the (i10) which go south
through Phoenix and on to Houston, (i40) goes through Dallas and on in to Atlanta.
The Houston quarter ends up in Jacksonville, Florida. Then you see the (i15) that
swings up that (inaudible) quarter that (Bob) talked about going into Salt Lake
where it joins with the (80 quarter) coming out of San Francisco and the (84 quarter)
coming down from Portland.
So what we have here then is to say, what we have is that the good news is that
both Reno and Las Vegas are along the major trunk line (corridors) in the Western
United States. So they are both along the major flow, diagrams connected to the
major port structures, Las Vegas to the largest of course of them all, Las Angeles.
The bad news is they are long the (corridor). And what we mean by that is that in
hub structures or crossroads, and you see that of course the gateway experiences
where you would take it off the ship and put it on a surface road or rail, or comes in
by air are transfer points. And what happens there is they build very diverse
economies because when you offload from one mode and unload to another rather
than do it directly. There is an opportunity to perform value added services.
The greater the diversity of flows from more places in the world than what you have
is goods coming together that can be combined in supply chain activity as sub-
assemblies. It then attracts a lot of industry that wants to take advantage of the fact
that flows are coming from multiple points of the world, you have multiple loads
available to you and therefore it's a wonderful place to do business.
And since Los Angeles is huge trade (place), you see the huge industrial market, the
huge economy so the crossroads is very important. You see the same thing taking
place in Salt Lake. You don’t see quite the same thing happening in Denver, for
instance.
And what we have then in Northern Nevada and Southern Nevada is we call them
"Stops along the (corridor)" and I thought (Bob James) is going to phrase and
(inaudible) it which was there is essentially stop and drop location. And what does
that mean? They are not crossroads, they don’t bring goods from multiple areas.
They simply grew up and response to local demand.
And as a result, what we have here is that typically a freight plan would simply look
at what we are doing now, how can we make it a little efficient. But, will that really
lead to diversification in the way we see it in an L.A., San Francisco or even at Salt
Lake where you are a crossroads, and that’s very important.
So we have to recognize our market is currently in north and south, and east are
simply O and D, origin and destination point freight, goes to them, freight leaves
them. Freight really is not transferred there. It is a drop off and a pick up point.
The other one we evaluated is in the competitive advantage across the United
States typically freight infrastructure was developed to different times in history,
different places. And is highly fragmented and it induces a lot of traffic just moving
goods between different facilities, and created environmental issues, creates traffic
issues and is costly in the economic side.
So Dan's analysis of the freight infrastructure in each region was very important to
us to say what's the level of integration or fragmentation in each one. Reno area
seems to have a much tighter relationship between the rail yards, the airport, the
inter-states than you find in Las Vegas.
Now, what we – and (Bob), if you want to jump in on this, feel free.
(Bob James): So we are in (inaudible) following along.
Male: We are in slide 55.
(Bob James): We are still in 55?
Male: Yes.
(Bob James): OK, sorry.
Male: On 56, we will move to 56.
(Bob James): OK.
Male: Now, in 56, you see three big bullets here. Limitations of the existing freight
logistics network, and what we point out there is essentially the points I have just
went over. We have a freight system that is growing up in relationship to demands
that have been put on it.

The comment earlier by (Nancy) about the rail service basically say, "Well, the way
we think of Nevada is what's the demand?" And we just simply provide for the
demand. Are we thinking forward of how Nevada fits in the (west) are changing?
No.
So, the tractors would say about the same thing and we would say, "Aero service
would about the same." And that’s basically the model that we are looking at. But
going back to (Nancy's) question about, you know, let's look at Reno in a new way
because of massive investments, we think all the freight statistics are going to be
dramatically different within the next couple of years as many of the large
manufacturing companies and some of the smaller ones start coming online, and we
think there is going to be a dramatic shift in the steps.
And so, we really can't just plan it on what we are now, that would lead us to a
serious of simply incremental improvement as supposed to creating perhaps the
third bullet that we actually need a new model. And this freight plan, (shoot) this
freight plan. And so the question we are going to want to pursue and we want to
get it on the table now, should we begin to think of a new long-term framework for
the freight system in the state that would be significantly different than what we
have now?
And, what would it be? What it would really have to address our geometry in the
west? You know, should we just remain stop and drops or O and D points on
quarter? Should we change our access structure?
Second one, our level of model integration, should we look long-term, begin to think
about how to connect these and how to integrate them a new ways. And three, the
issue of capacity and performance. You can look at within the existing system or
what would capacity and performance look like within a new model?
Now, some people have raised a question, why do you talk about our new model
and changing it, how would you pay for it? But let's take a longer issue of what do
we after and over a period of time, how would we address these issues? Now, I'm
going to ask (Bob) to talk about the issue of each of these issues of access
fragmentation and capacity.
(Bob James): So this is slide 57.
Male: We are on 57 now, diagrams, developing a competitive advantage should be the
title in front of you.
(Bob James): Right. I will be referring to this slide and back to two slides ago about the existing
hubs and quarter.
I must point out that about maybe 10 percent of the value of the Nevada economy
deals with trade. But 80 percent of the world's purchasing power is abroad. And an
overseas trade is a very important way to reach that 80 percent.
The other thing that’s important and it shows up in the statistics is that we, if
Nevada does significant but perhaps underperforms and snap the trade which is its
relationships with Mexico and Canada. So if it's much to reach 80 percent of that
purchasing power it needs good, inter-model connections to (the port) but it also
needs to be able to facilitate movements between the trading partners to the north
and to the south.
And we – (Nancy) asked a question about the status of inter-model rail service in
Reno and then that question should also come up regarding Los Angeles as well. In
the future, ports are having, struggling with congestion issue. And these congestion
issues are driven less by issues of Panama Canal expansion and what will happen
with the change in the vessels that are serving (for us). They are simply getting
much larger and larger than what's predicted with the Panama Canal was expanded.
We now see ships dumping 18,000 (PEUs) at one time. Los Angeles and San Pedro
bay ports could handle ships about (asset) size very efficiently, and (there are) so
many ports of United States could do that. But the difficulty is that that’s becoming
increasingly hard to get the economy to scale in the truck to make that system work
well. So therefore, an inter-model rail connection is very important.
So you want to build your inter-model assets around a system that creates the
highest amount of economic value so that means two things. That means a
crossroads pattern that delivers freight from a multi-directional opportunity that’s
why we are talking about the importance say of (i11) to the future, and (i11) as an
inter-model quarter. And we are also talking about moving from a pattern of
fragmentation integration.
Whenever you pick transportation forces together in an organized way you create
synergy. And you will find in our appendix material models of where that’s

particularly true. And (Michael) and I have both experienced with working the
Columbus area with respect to that fact, and (Michael) has worked in Charlotte.
So, there are two things you want to do here. one is you want to develop this –
your aspiration is to be a crossroads but your other aspiration more locally is
improve the capacity and performance through integration of your model system
Male: Yes, slide 58.
Look at the (i11) quarter within a new light. What we see is that the large (next)
quarter which is not shown here, goes from Mexico City to Monterey, through San
Antonio up into Chicago, the big west serving the Eastern United States and it
stands up into Toronto and farther to Montreal, Canada.
On the Western United States, the primary trade quarters really the (i5) quarter that
extends down into Tijuana and into Encinitas. It doesn’t extend further into Mexico.
Goes up a little into the northwest into Vancouver, and really doesn’t go further
because of the train north of Vancouver doesn’t extend. So really it's a coastal
quarter that connects the major postal economy.
What we see in the current (i11) thinking is to get the quarter coming up through
Phoenix up into Las Vegas. We feel that the growing statistics in Reno really says
we've got to think about that quarter extending to the Reno area. And that its
further extensions north would take it up into Alberta, Canada, up into the Calgary
the large oil producing areas of Canada and agricultural areas.
That quarter would be a truly international quarter connecting Canada to Mexico
because on the south and it goes right down the west coast to Mexico, through the
major Pacific ports and into Mexico City, and north end is we extend deep up into
Canada and would extend to the north – east-west Canadian quarters.
That then, as the west coast quarters become increasingly impacted creates
essentially the large NAFTA which would transform both the Southern Nevada and
Northern Nevada, and you see the trade areas indicated in those blue lines into
crossroads. In that, they could then become distributors north-south as well as
east-west and address our first one, increase (access).
The second was integrated hubs. (Those) part of the model (inaudible) to say as one
would evolve the (i11) and commit to that as a new model. And in that, we are
looking at rail as well as road. So people said, "Well, how are they going to get that
done?" Well, what we are saying is we are looking at a long-term change of
reference and saying, "Instead of just having a model that we incrementally improve
along quarters, perhaps we should have a new framework." And that’s one of the
questions in this plan as we move through the next set of steps that we are going to
be calling on the stakeholders, and those of you on the phone for input to look at
this issue.
Because if you just create a crossroads and don’t have model integration then you
don’t have the full competitive advantage that (Bob James) talked about. Because
what is driving freight in today's world is reliability; number one, ahead of cost. Cost
is number two, and safety number three.
Integration of modes within single point locations provides greater reliability, lower
cost and greater safety because now you have to secure one main transfer facility
versus separate ones all over the place.
Now, so the new model really depends on those things. The changing the access
from quarter stops to crossroads, integrating the hubs and then beginning to ask,
what are the capacity and performance issues that we go with that. Next.
So, the final slide from the competitive advantage takes those quarters overlay
(from) on the economic. And now, you begin to see something. What the (i11)
really is, is not simply an international quarter but becomes crossroads in Nevada
that it can now see the west coast (markets), and build stronger relationships going
west as well as goods moving from the east coast ports which are Europe dominant
or Europe equivalent.
And moving goods in could be transferred in the Nevada hubs, in the south and
north, and then move into the California market. this would give Reno and
Northern Nevada tremendous improvement in its access because they are crossing
over this area is sometimes a question of snow and interruptions, lack of reliability
could now move south and give access…improved access to the ports in L.A. at the
same time it – for the Las Vegas markets it would give an improved more than
access to the California markets, and in fact, become a dominant west coast NAFTA
quarter.
So we see the potential here of the new model that in doing that would lay a new
foundation for greater diversity to attract industries that would now see that they
are not typically to stop on a quarter and that we would customize some facilities
for them but would be through crossroads that we give them access to a much
broader continental markets versus simply quarter markets.
Male: Just following up on that point, you will see in the trades statistics andreport as we
have really shortly that there is significant trade to the east from both Las Vegas,
particularly Las Vegas and from Nevada and points to the east, that means you can
get the freight there. But how efficiently you get the freight there? It's going to
become very important because access to such markets in Southeast Asia maybe
better accomplished from the east coast than it is from west coast.
And one of the early reports indicated that once upon a time Reno was the back
door in California when the flows were coming from the east. We may see that the
way port flows are going a ship that would go back a bit more to that pattern. I'm
not predicting your major shift in the volume coming through the west coast port
because they are fed by an (Asian) growth but (inaudible) to South Asia and
becomes much more significant.
And then, Nevada even in Las Vegas particularly you've got to contemplate what will
be the relationship to this growing southeast. And an important issue was what are
your inter-model and highway connections in that direction.
When you have a crisscross system, when you have inter-model services, your
ability to respond flexibly to the ways that you can grow your business particularly
in Reno area becoming the, you know, the new back door opportunity for the
Northern California economy is much enhanced by having this kind of relationship.
Male: So let's open up real quick and get some comments or question. So regarding this
competitive market analysis, are there any questions or any comments? What do
you feel about this competitive market analysis? Do you agree? What (inaudible)
input do you have through it? And again, what questions do you have?
Male: What is (inaudible).
Operator: Again, if you would like to ask a questions press star then the number one on your
telephone keypad.
Your first question comes from the name of (Jean Marson). Your line is open.
(Jean Marson): Thank you. I have a question on the (i11) alignment. There is another alignment
that goes through Central Nevada along Winnemucca. And is that not being
considered?
Male: The (inaudible) living and (dreaming) (i11) for a while so the only – really (i11)
designation – the recommendation from the (i11) state is recently concluded late
last year was a broad (corridor) from the ports (inaudible) through Phoenix area of
the 93 to Las Vegas and then continue on north connecting similar in the Reno area
not specified but similar about (i80).
North of inter-state 80, we did not study that. So there are a host of options for
extending (i11) to Canada. North of (i80) was not yet been studied so go through
Winnemucca up to (inaudible) is an option there or moving the other direction. So
those are all open for discussion right now.
(Jean Marson): OK. We are obviously extremely interested in that and it goes to where mining
(belt) that’s really important logistically but I guess when I see that you don’t have
(inaudible) then you have the other one with the NAFTA quarter, I wasn’t sure that
that was even on the plan of stages, is it?
Male: Say that again?
(Jean Marson): Well, on the NAFTA pages and I didn’t see where that was a quarter, I guess when I
see something on what one of these slides it tends to guide where the thought is for
the future.
Male: It does. And so, and you know what (creek)? OK, I know, we are disconnected.
That question came up yesterday at our meeting in Las Vegas and so we updated
the slide and so anybody that’s looking at it online would (see at) the slide. But
again, send it out to everybody else.
What we did was we just make north of (i80), we made that purple NAFTA quarter
into an aero that just (plays) more. So you are correct, what's on our slide
misleading. And so when you – next week when you get our meeting (summary) we
will have the corrected slides that again that shows an (error) going north with (IE)
and not a specific or a specified (corridor).
(Jean Marson): Great. I will look – I will definitely look forward to that.
Male: And can I ask you a question? Is it (Jean)?

(Jean Marson): Yes, (Jean).
Male: And you are with, what organization?
(Jean Marson): At Lander County.
Male: OK. And you would mention your interest (briefly) in (i11) going through
Winnemucca (inaudible), did you say to serve the mining industry? I didn’t quite
hear you.
(Jean Marson): Well, mining and tracking, you bet. Central Nevada of course logistically were on
(i80) and we are in between Salt Lake, Reno, San Francisco, and obviously for
economic development we want to maintain that quarter. And to be able to have
(i11) go through our area, it could be really crucial to us.
Male: Got it.
Male: (Jean), there is two thoughts on that matter. One is as 80 hits north there, it could be that 11
because of the growth manufacturing in the Reno Sparks area would make all the
sense in the world on the southern quarter to maintain its current location into the
Reno area although it could become 80, it could be combined with 11 going north
and then depart north towards Canada from Winnemucca at the top of the 80
there.
(Jean Marson): Right.
Male: So 80-11 quarter combined and then the northern section depart so I'm sure that’s
one potential that would save on (dual) quarter going north. So there is a kind of
(next) proposal and 11 proposal. And as Dan said, I don’t think that has really been
studied but certainly following 80 to Winnemucca and then heading north out of
Winnemucca would certainly have a cost advantage will get you further north.
(Jean Marson): Sure, and I think you would…I'm sorry. Go ahead.
Male: Please continue.
(Jean Marson): I was just going to say, I think it would server Nevada far better in the long run.
Male: Yes, it is interesting comment. I'm glad you brought that up.
Male: You know, I don’t quite (inaudible) make it. We are talking about an aspiration of
framework. What happens with this general planning is they tend to be
incremental. You are going to add it up say where the gaps and we are going to fill
the gap. And what we are seeing is it really need another way to be thinking about
these things.
So our framework allows us to (bid) issues like this. There is, you know, there is no
particular say right way and probably outside of a very conceptual stage, you know,
moving northward but it's likely to consider what those consequences would be and
what our best for the State of Nevada in the Western state.
What we said in our framework is this is both the western states in an integrated
relationship to large California market is our key here. And this allows us to see and
think about what those relationships are. Just like we said straight (light) planning
based on historical data won't be your future. The proposal we are making in any
specific terms won't be the future either but it will be the framework and the
platform to develop and improve transportation system.
Male: So, thank you, (Jean).
(Jean Marson): OK. Thank you.
Dan Andersen: Yes. Let me throw back (inaudible). If we look at slide number 60, we put a number
of questions on there. But we are interested in hearing your feedback, it doesn’t
have to be on one of these topics but there is – these are some questions that we
are interested in, you know, how do you view Nevada's position within the Western
U.S.? How could Nevada hubs create a competitive advantage? How to increase
access the Western U.S. market benefit (this day)? How do you see the direction of
economic relationships between Nevada and California, the Southern California?
Anybody have some thoughts on any of those questions that they could share with
us?
Operator: Your next question comes from the line of (Matthew Burr). Your line is open.
(Matthew Burr): Good morning, again. I've got two questions and then a comment.
Number one, when looking…I'm looking at slide 56 which I think is excellent, I mean
that really shows (inaudible) together makes it easy. As I understand it, I'm looking

at (i11) that is going to be done in stages, is that correct like you would go Phoenix
to Vegas first and then Vegas to Reno Sparks next?
Male: I don’t – I can't – my understanding is that it will certainly be done in segments. I
don’t know that it will necessarily – it doesn’t necessarily need to occur in
geographic order. It doesn’t necessarily need to be (incurred) from south to north.
I think it will be improved based on developed and improved based on priority,
based on need.
And so, you know, most of the corridor already exist in U.S. 93, south of Las Vegas
and U.S. 95 north of Las Vegas and up to the rural area. And so, you know,
developing into a full (freeway) status or maybe adding rail, I mean those
components will take place. Absolutely it's going to have to take place
incrementally just for funding purposes. It will take a while to get there but what
pieces are developed and when has not yet been determined.
Male: Yes. I myself think would be growth of manufacturing in the Reno area, there is
going to be some demand for the quarter to extend south out of Reno as much as
north out of Phoenix. So, this issue you bring up I think really, if we studied in
today's world and today's statistics it would be bias towards extending in from
Phoenix north to Las Vegas if we project ahead, and we are looking forward to
seeing that report.
There maybe some basis for saying, it really needs to extend from Reno south as
well. The big (lithium) mines as we understand it are along the proposed 11 porter
and you are going to have a lot of commodity flow from that (lead) point down
there north into Reno so there is a series of movements that I think that haven’t
been really documented or studied well up to this point but we've got to
understand.
Also, the Tesla has already announced plan to expand its facilities and Reno is not
even finished yet and they are already expanding it. That would tend to indicate
they are looking at broader market for that world market and that supports
accessing the port in L.A. may become a support in San Francisco which would also
say that extending 11 south from Reno maybe one of the important characteristics.
So all these issues as Dan says, it cannot be answered right now but it is an
important question to raise and not simply to say, "Well, it's going to have to grow
north out of Phoenix." There is lot of reasons for that as well as other factors along
that quarter.
Dan Andersen: Do you have a follow-up question or comment, (Matthew)?
(Matthew Burr): I just – I've kind of agree with (Jean). I think that everything looks great, you know.
I understand the Phoenix, Las Vegas that I have understand more Las Vegas to Reno.
I think if we had an (i11) going up between those two cities that would just
tremendously help our abilities and economically it would be great.
But the stage after that to go further north, I think at least to me it just makes more
sense to move it more easternly and to go up from that direction through
Winnemucca because I think that would really help out not just their economy but it
kind of makes it a quicker way to get up to the northwest that way.
Dan Andersen: OK. Thank you.
OK. Are there comments or questions?
Operator: There are no further questions at this time. I turn the call back over to presenters.
Dan Andersen: Let me – I'm going to turn it back over to (John). We are going to ask one more time
on those…
Male: Let me propose something, Dan. As we move forward, as we said in the very
beginning, we really going to need your help on this. Typically freight plans are
done within the state boundary looking at incremental improvements to the system
and serving the industries we have now.
If we are looking at economic diversity, we feel that it can only be fully achieved if
we develop the kind of competitive advantage in our freight network that would
say, would say to the world that we now have a different structure and a different
kind of cost reliability strategy in mind which is we called the new model, which is
should we adopt a long range commitment to say, were you going to transform our
(inaudible) areas into crossroads. We are going to support the building of a (truly)
international quarter. And that the integration of modes which would provide us
with great reliability as the west coast quarter.
That’s a big undertaking but we think that it is (incumbent) upon us to put that in
front of people and get feedback. And so, this is what's coming forward at the end
of our analysis of where Nevada fits in to the world which is just along the corridor.
And should we take this another step?
And so, for us to make decisions about whether to do that as a proposal and to
write it into the final which will be next summer, we are going to need a lot of
feedback one way or another in terms of the interest and commitment to a new
model to say we want to fit in to world little differently.
We see the choices as essentially (incrementalism), improve our system, take those
steps, its modest cost, we can budget those things. The other one is
transformational, we think you will have profound, much more profound effects in
our economy and diversity, and attract many more businesses across the broader
spectrum to the state and potentially plus we undertake.
So, we are going to need feedback on that because we can't just make that decision
in isolation as a kind of consultant or recommendation. So we encourage you
whether you want to voice an opinion now but this will be on the table going
forward. If you want to write in, drop an e-mail or stay abreast of this we are going
to need feedback.
So thank you very much.
Male: Another key area we should stress for feedback is that very much relating to the
plan is the ability for the State of Nevada to (create) its output. It's either through
manufacturing or the logistic services that are offered to the broader economy, to
add (gravitas) to the idea to convince the (railroads) for example for improved inter-
model services that we will have show.
And I think (Nancy) was certainly headed in the right direction which we will be
talking about that, you know, the ability to produce logistics output and that it gives
you the ability for them to think about you as a new way.
I think Tesla is an example of, you know, of a game changing event where people
think of the state differently to the extent that we can identify businesses and
opportunities that add to the reason why Nevada, for example, can balance, you
know, its transportation, its input to (outlook) is very important. And to understand
the disadvantage in Nevada as an input is also right now inbound is in volume can
be as high as four to one, it's generally about two to one in value.
It's very important to capture that as an opportunity because you've got a low cost
back-up into the California market and to other places. So this is a key part of
moving forward that can be captured in incremental steps but it certainly needs, we
believe, it needs a vision, a long-term framework that allows us to add in the
direction where the state goes to that important goal of economic diversification.
Male: All right. Are there any other final comments before we wrap up? I've got one
more slide to show us what are next steps are, but before we jump there I just want
to make one more request for questions or comments.
Operator: Again, if you would like to ask a question, press star then the number one on your
telephone keypad.
There are no questions at this time. I turn the call back over to presenters.
Male: OK. So the very last slide then it shows our next steps. I think we have already been
talking about this throughout the presentation. But we are going to be looking at
supply key – key supply chain performance measures. We talked about what our
transportation network is that, you know, we are looking at how well is it
performing.
And then, again, we are already starting to identify some opportunities and
strategies, and we will do that in (full) here shortly.
Contact information is there on that slide and then you can get my e-mail. Let me
know if you've got any additional comments or questions, shoot me an e-mail
(inaudible) team.
So, thank you everybody for participating. We greatly appreciate. I hope it's been
interesting benefit to you all. Have a great day.
Operator: This concludes today's conference call. You may now disconnect.
END