Embed Size (px)
Citation preview
STAKEHOLDERS’ ANALYSIS ON KARAIKUDI AS
A RURAL TOURISM DESTINATION
A THESIS
Submitted by
YAVANA RANI.S.
Register No: 200902212
In partial fulfillment for the award of the degree
of
DOCTOR OF PHILOSOPHY
DEPARTMENT OF BUSINESS ADMINISTRATIONKALASALINGAM UNIVERSITY
ANAND NAGARKRISHNANKOIL – 626 126
AUGUST 2013
ii
KALASALINGAM UNIVERSITY
KRISHNANKOIL 626 126
BONAFIDE CERTIFICATE
Certified that this Thesis title “STAKEHOLDERS’ ANALYSIS ON
KARAIKUDI AS A RURAL TOURISM DESTINATION” is the bonafide
work of Ms. YAVANA RANI.S., who carried out the research under my
supervision. Certified further, that to the best of my knowledge the work reported
herein does not form part of any other thesis or dissertation on the basis of which
a degree or award was conferred on an earlier occasion on this or any other
scholar.
Signature of the supervisor
Dr.M.Jeyakumaran
SUPERVISOR
Professor
Department of Business Administration
Kalasalingam University
Krishnankoil
iii
ABSTRACT
Identification of stakeholders’ involvement in destination tourism planning and
development, as well as the factors that might influence their level of
involvement, is not only important for tourism destination planners, but also the
host community’s support for destination tourism development and competitive
strategies. This study tests the structural equation model between stakeholders’
perceptions and opinions about the impacts of tourism development, community
participation and further to determine their willingness to support the competitive
development strategies. The implications of social exchange theory and
stakeholders’ theory provide the theoretical underpinning for this study. The
study is descriptive in nature, and is based on both quantitative and qualitative
methodologies to investigate the relationships between different constructs. This
study also examined how demographic characteristics affect community
participation and support for rural tourism in the destination. The study area is a
rural tourism spot Karaikudi, Sivaganga District in Tamilnadu, India.
Convenience and quota sampling methods were adapted to collect quantitative
data from different tourism stakeholders. Convenience sampling was used
because difficulty in approaching households for interviews due to the
conventional nature of the society. Quota sampling was used to ensure different
subgroups of the population have been included. The sample size is 320. The
data was analyzed using Structural Equation Modeling (SEM) with the statistical
iv
package Analysis of Moment Structures (AMOS).The research shows some
statistical significance between tourism development impacts people may
experience and their desire for more participation in the decision-making
process. The results will help the rural tourism planners, governments and
support organizations in other areas to better evaluate and understand the
stakeholders’ attitude and perceptions before implementing the project.
Keywords: Rural Tourism, Stakeholders’ Attitude, Community Satisfaction,
Tourism Support, Tourism Development Impacts.

v
ACKNOWLEDGEMENT
My sincere thanks to our Chairman Kalvivallal Mr.T.KALASALINGAM,
Illayavallal Mr.K.SRIDHARAN Chancellor, Dr. S. SARAVANA SHANKAR,
Vice-Chancellor Kalasalingam University, for providing opportunity to carry out
the research work in our University.
DR. M.JEYAKUMARAN, Professor, Department of Business
Administration, Kalasalingam University, my mentor and supervisor have
extended his valuable guidance and motivation throughout this research. His
approach and kindness has motivated me to execute this research lively. It was
possible to maintain quality throughout the research only because of his freedom
and trust.
I extend my thanks to Dr.S.SAKTHIVEL RANI, Associate Professor,
Head, Department of Business Administration, Kalasalingam University, who
gave all moral support behind the screen.
I dedicate all my work to my Father R.SUBRAMANIAN and mother,
husband, in-laws and my children. I express my gratitude to the effort and pain
they have taken in this regard.
I extend my thanks to the Dean, Research and Development and faculty
members of MBA department for their moral support and encouragement. I
thank my friends Mr. Kamal Dhayalan, Advocate and Mr. V.Ramesh, IBM for
extending their valuable support for my research
I express my pleasure in thanking the students, friends, and my colleagues
for the support and valuable suggestions for the improvement of this research.
There are many others, who have helped me directly and indirectly to complete
this research. I thank them whole-heartedly.
YAVANA RANI.S
vi
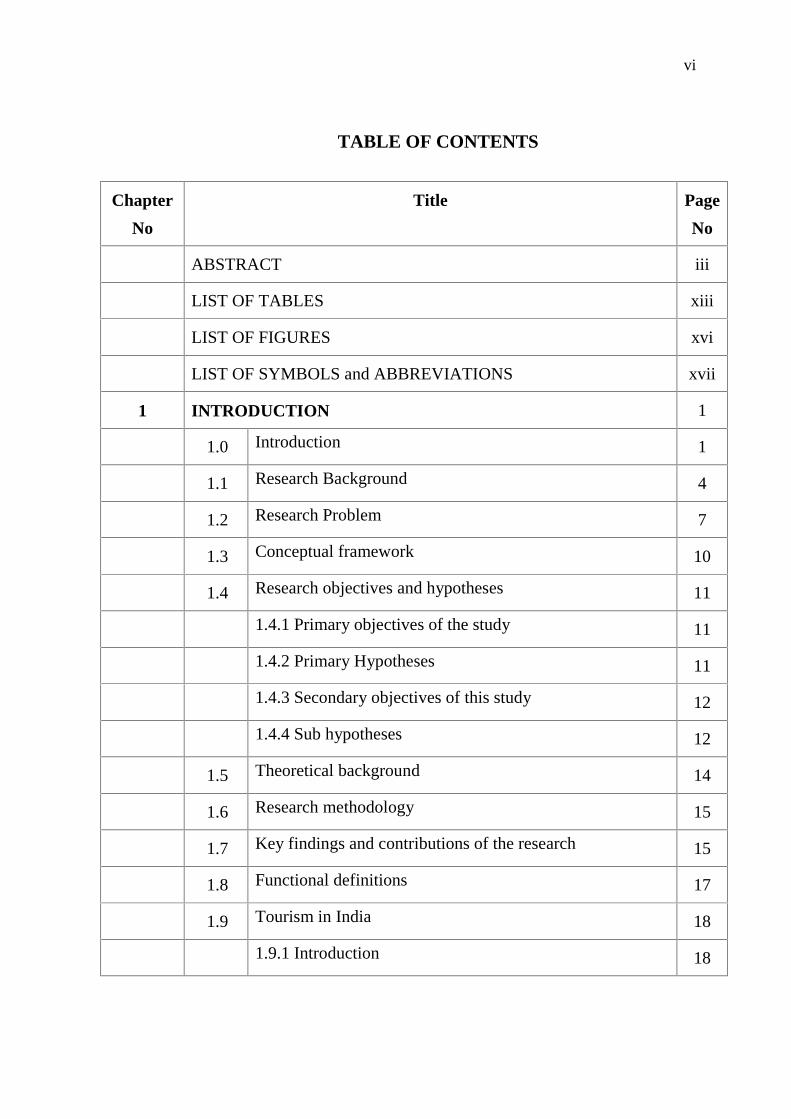
TABLE OF CONTENTS
Chapter
No
Title Page
No
ABSTRACT iii
LIST OF TABLES xiii
LIST OF FIGURES xvi
LIST OF SYMBOLS and ABBREVIATIONS xvii
1 INTRODUCTION 1
1.0 Introduction 1
1.1 Research Background 4
1.2 Research Problem 7
1.3 Conceptual framework 10
1.4 Research objectives and hypotheses 11
1.4.1 Primary objectives of the study 11
1.4.2 Primary Hypotheses 11
1.4.3 Secondary objectives of this study 12
1.4.4 Sub hypotheses 12
1.5 Theoretical background 14
1.6 Research methodology 15
1.7 Key findings and contributions of the research 15
1.8 Functional definitions 17
1.9 Tourism in India 18
1.9.1 Introduction 18

vii
1.9.2 India tourism statistics at a glance 2010 19
1.9.3 Rural tourism in India 23
1.9.4 Tourism in Tamilnadu 24
1.9.5 Rural tourism in Tamilnadu 28
1.9.6 Karaikudi’s destination competitiveness 30
1.10 Structure of the Thesis 32
2 LITERATURE REVIEW 34
2.1 Introduction 34
2.2 Tourism background literature 34
2.2.1 Perspectives on rural tourism 34
2.2.1.1 Rural tourism –A multi-faceted activity 37
2.2.1.2 Tourism as a tool for local development 42
2.2.2 Tourism and its systematic approaches 47
2.2.3 Tourism planning and development concepts 49
2.2.3.1 Tourism destination development life cycle 51
2.2.3.2 Doxey's Irridex Model (1975) 54
2.3 Theoretical background of tourism theories 57
2.3.1 Social exchange theory 59
2.3.2 The Social exchange theory and tourism 61
2.3.3 Stakeholder theory 64
2.3.4 Stakeholder theory and tourism 66
2.4 Conceptual framework and hypotheses 67
2.4.1 Tourism development impacts 68
viii
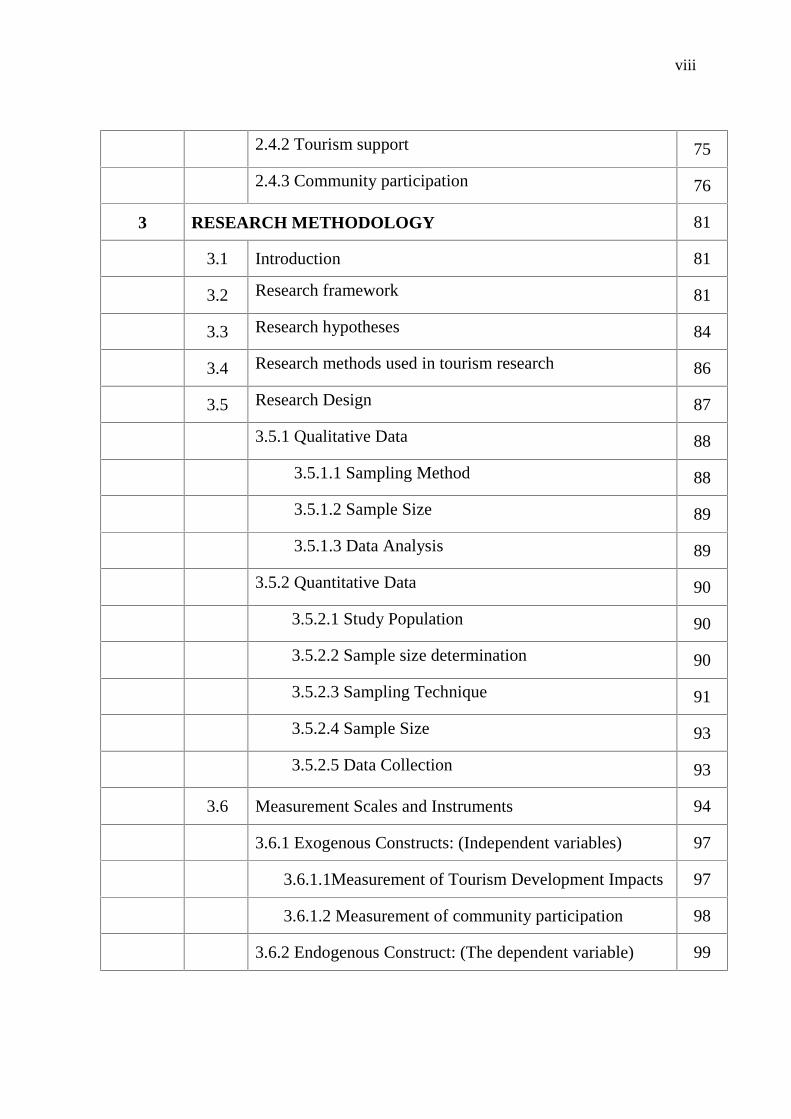
2.4.2 Tourism support 75
2.4.3 Community participation 76
3 RESEARCH METHODOLOGY 81
3.1 Introduction 81
3.2 Research framework 81
3.3 Research hypotheses 84
3.4 Research methods used in tourism research 86
3.5 Research Design 87
3.5.1 Qualitative Data 88
3.5.1.1 Sampling Method 88
3.5.1.2 Sample Size 89
3.5.1.3 Data Analysis 89
3.5.2 Quantitative Data 90
3.5.2.1 Study Population 90
3.5.2.2 Sample size determination 90
3.5.2.3 Sampling Technique 91
3.5.2.4 Sample Size 93
3.5.2.5 Data Collection 93
3.6 Measurement Scales and Instruments 94
3.6.1 Exogenous Constructs: (Independent variables) 97
3.6.1.1Measurement of Tourism Development Impacts 97
3.6.1.2 Measurement of community participation 98
3.6.2 Endogenous Construct: (The dependent variable) 99
ix
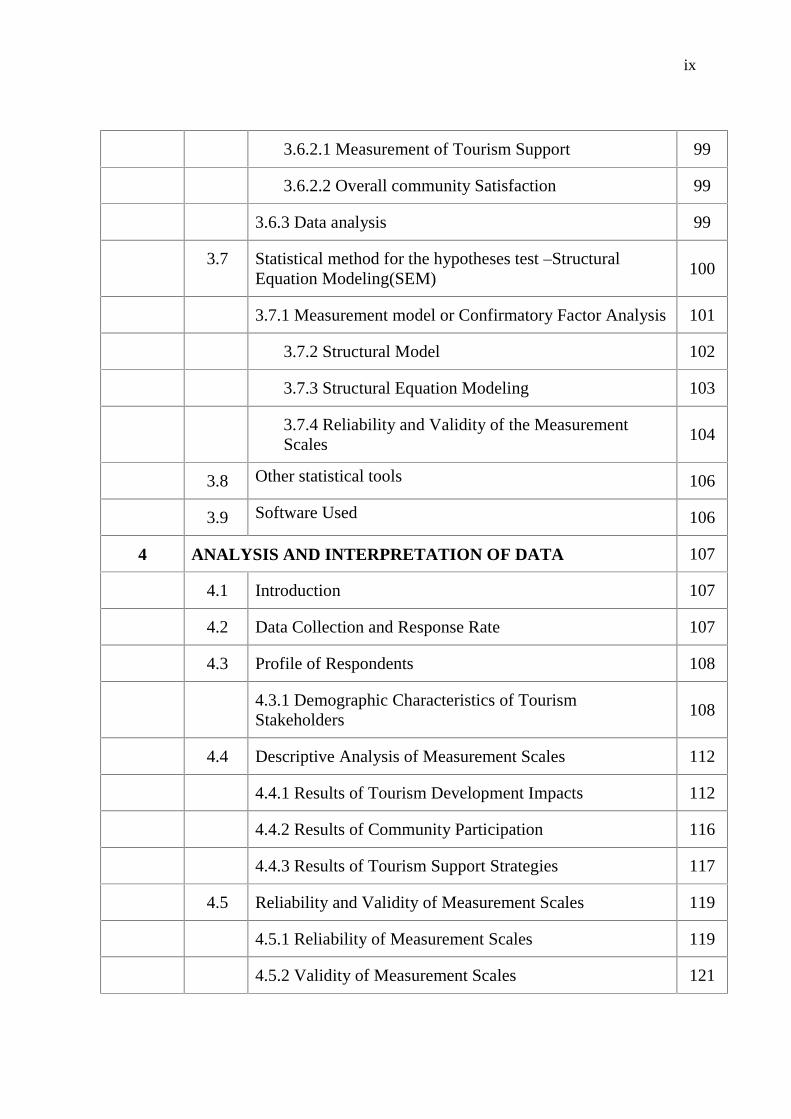
3.6.2.1 Measurement of Tourism Support 99
3.6.2.2 Overall community Satisfaction 99
3.6.3 Data analysis 99
3.7 Statistical method for the hypotheses test –StructuralEquation Modeling(SEM)
100
3.7.1 Measurement model or Confirmatory Factor Analysis 101
3.7.2 Structural Model 102
3.7.3 Structural Equation Modeling 103
3.7.4 Reliability and Validity of the MeasurementScales
104
3.8 Other statistical tools 106
3.9 Software Used 106
4 ANALYSIS AND INTERPRETATION OF DATA 107
4.1 Introduction 107
4.2 Data Collection and Response Rate 107
4.3 Profile of Respondents 108
4.3.1 Demographic Characteristics of TourismStakeholders
108
4.4 Descriptive Analysis of Measurement Scales 112
4.4.1 Results of Tourism Development Impacts 112
4.4.2 Results of Community Participation 116
4.4.3 Results of Tourism Support Strategies 117
4.5 Reliability and Validity of Measurement Scales 119
4.5.1 Reliability of Measurement Scales 119
4.5.2 Validity of Measurement Scales 121
x
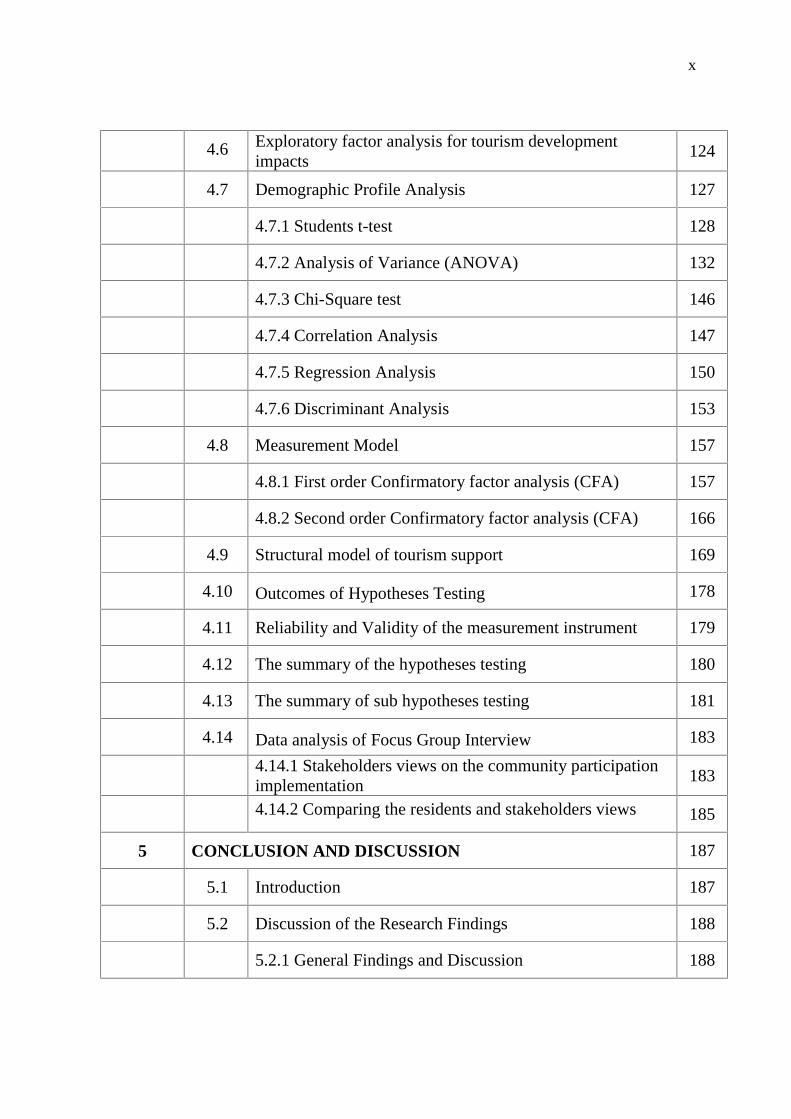
4.6 Exploratory factor analysis for tourism developmentimpacts
124
4.7 Demographic Profile Analysis 127
4.7.1 Students t-test 128
4.7.2 Analysis of Variance (ANOVA) 132
4.7.3 Chi-Square test 146
4.7.4 Correlation Analysis 147
4.7.5 Regression Analysis 150
4.7.6 Discriminant Analysis 153
4.8 Measurement Model 157
4.8.1 First order Confirmatory factor analysis (CFA) 157
4.8.2 Second order Confirmatory factor analysis (CFA) 166
4.9 Structural model of tourism support 169
4.10 Outcomes of Hypotheses Testing 178
4.11 Reliability and Validity of the measurement instrument 179
4.12 The summary of the hypotheses testing 180
4.13 The summary of sub hypotheses testing 181
4.14 Data analysis of Focus Group Interview 183
4.14.1 Stakeholders views on the community participationimplementation
183
4.14.2 Comparing the residents and stakeholders views 185
5 CONCLUSION AND DISCUSSION 187
5.1 Introduction 187
5.2 Discussion of the Research Findings 188
5.2.1 General Findings and Discussion 188
xi
5.2.2 Demographic characteristics of the respondents 189
5.2.3 Dimensions of tourism development impacts of ruraltourism.
191
5.2.4 Impact of demographic characteristics on communityparticipation
193
5.2.5 Impact of demographic characteristics on overallcommunity satisfaction
194
5.2.6 Impact of demographic characteristics on tourismsupport
195
5.3 Findings of structural equation modeling 198
5.4 Contributions and Implications of the research findings 200
5.4.1 Theoretical contribution 200
5.4.2 Utilization of SEM for key construct relationshiptesting
200
5.4.3 Development of measures and scales. 201
5.4.4 Managerial contributions 201
5.5 Suggestions and recommendations 202
5.5.1 General suggestions 202
5.5.2 Suggestion from findings 203
5.5.3 Recommendations 205
5.6 Limitations and directions for future research 206
5.7 Concluding Comments 208
APPENDICES 210
Appendix 1 - Questionnaire 210
Appendix 2 – List of rural tourism sites in India 215
Appendix 3 – Snap Shots of rural tourism site-Karaikudi 220

xii
REFERENCES 225
LIST OF PUBLICATIONS 240
CURRICULUM VITAE 241
xiii
LIST OF TABLES
TABLE
NO
TITLE PAGE
NO
1.1 Foreign Tourist Arrivals (FTAs) in India, from 1997 to2011
22
1.2 Tourist visit to Tamilnadu 27
2.1 A list of contrasting features between urban tourism andrural tourism
41
2.2 A framework for analyzing the social impacts of tourism 51
2.3 Doxey’s index of irritation (irridex’) 56
3.1 The proportionate numbers of samples 93
3.2 Measurement of variables 95
4.1 Demographic profile of respondents 110
4.2 Descriptive analysis of tourism development impact 114
4.3 Descriptive analysis of community participation 117
4.4 Descriptive analysis of tourism support strategies 118
4.5 Summary of the measurement reliability (cronbach’salpha)
120
4.6 Rotated factor matrix for tourism development impacts 125
4.7 Student t-test- Gender with community participation intourism development
128
4.8 Student t-test- Gender with community satisfaction 129
4.9 Student t-test- Gender with tourism support 129
4.10 Student t-test- Nature of business and tourism support 130
4.11 Student t-test- Closer to the destination or far away andtourism support
131
4.12 Student t- test - consolidated result 132
4.13 ANOVA - Age with community participation in tourismdevelopment
132
4.13.1 Overall mean agreeability score 133
4.14 ANOVA - Occupation with community participation 134
4.14.1 Overall mean agreeability score 134
xiv
4.15 ANOVA - Marital status with community participation 135
4.15.1 Overall mean agreeability score 136
4.16 ANOVA - length of residency with community participation 137
4.16.1 Overall mean agreeability score 137
4.17 ANOVA - Age with overall community satisfaction 138
4.17.1 Overall mean agreeability score 138
4.18 ANOVA - Length of residency with community satisfaction 139
4.18.1 Overall mean agreeability score 139
4.19 ANOVA - Age with tourism support strategies 140
4.19.1 Overall mean agreeability score 140
4.20 ANOVA - Occupation with tourism support strategies 141
4.20.1 Overall mean agreeability score 142
4.21 ANOVA- Education with tourism support strategies 143
4.21.1 Overall mean agreeability score 143
4.22 ANOVA - length of residency with tourism supportstrategies
144
4.22.1 Overall mean agreeability score 144
4.23 ANOVA - consolidated result 145
4.24 Chi-square test for association between years of residencyand support for tourism
146
4.25 Inter-correlation matrix of economic impact variables 147
4.26 Inter-correlation matrix of socio-cultural impact variables 148
4.27 Inter-correlation matrix of environmental impact variables 149
4.28 Inter-correlation matrix of community participationvariables
149
4.29 Inter-correlation matrix of tourism support strategies 150
4.30 Variables in the multiple regression analysis 152
4.31 F tests of equality of group means 154
4.32 Canonical discriminant function unstandardized coefficients 155
4.33 Discriminant analysis classification results 156

xv
4.34 Model Fit Indices- First order CFA 162
4.35 I order - Standardized Regression Weight Factor Loadings 163
4.36 Model Fit Indices – Second order CFA 166
4.37 II order CFA - Standardised Regression Weight FactorLoadings
168
4.38 Model Fit indices – Structural model 170
4.39 Structural model - standardized regression weight factorloadings
177
4.40 Summary of hypotheses testing 178
4.41 Reliability and validity of the measurement instrument 179
4.42 The summary of the Structural Model Hypotheses Findings 180
4.43 The summary of the Sub Hypotheses Finding –Demographic Profile
181
xvi
LIST OF FIGURES
FIGURE
NO
TITLE PAGE NO
1.1 The initial conceptual framework for rural tourismsupport
10
1.2 Percentage share of top 10 states in foreign tourist visitsto states in 2011
21
1.3 Percentage share of top 10 States in domestic touristvisits in 2011
21
1.4 Census 2011 Highlights for Tamilnadu 25
1.5 Karaikudi, Sivaganga District, Tamilnadu Map 30
2.1 A scheme of sustainable development of the region 39
2.2 Tourism origin-destination model 48
2.3 Tourist area (destination) life cycle 52
3.1 The initial conceptual framework for rural tourismsupport
82
4.1 First order standardized CFA – model 1 159
4.2 Standardized CFA – model 2 161
4.3 Overall measurement model - Second order CFA 167
4.4 Structural model 173
4.5 Standardized Structural model 175
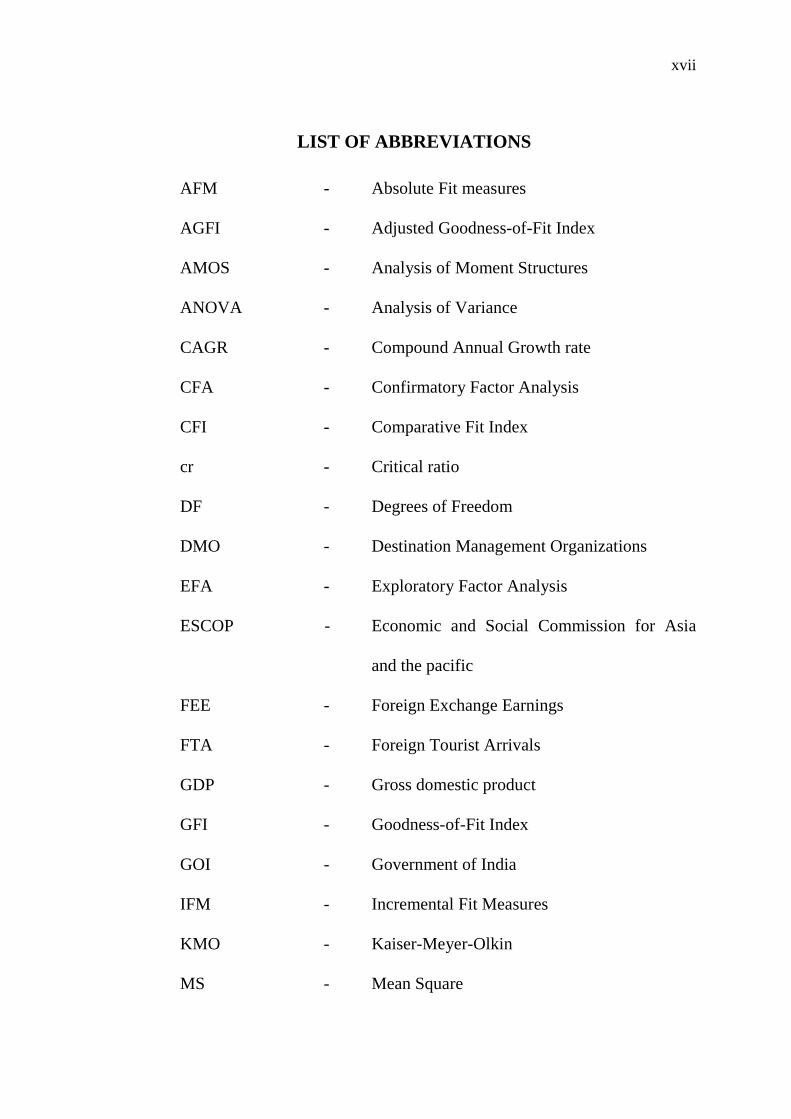
xvii
LIST OF ABBREVIATIONS
AFM - Absolute Fit measures
AGFI - Adjusted Goodness-of-Fit Index
AMOS - Analysis of Moment Structures
ANOVA - Analysis of Variance
CAGR - Compound Annual Growth rate
CFA - Confirmatory Factor Analysis
CFI - Comparative Fit Index
cr - Critical ratio
DF - Degrees of Freedom
DMO - Destination Management Organizations
EFA - Exploratory Factor Analysis
ESCOP - Economic and Social Commission for Asia
and the pacific
FEE - Foreign Exchange Earnings
FTA - Foreign Tourist Arrivals
GDP - Gross domestic product
GFI - Goodness-of-Fit Index
GOI - Government of India
IFM - Incremental Fit Measures
KMO - Kaiser-Meyer-Olkin
MS - Mean Square
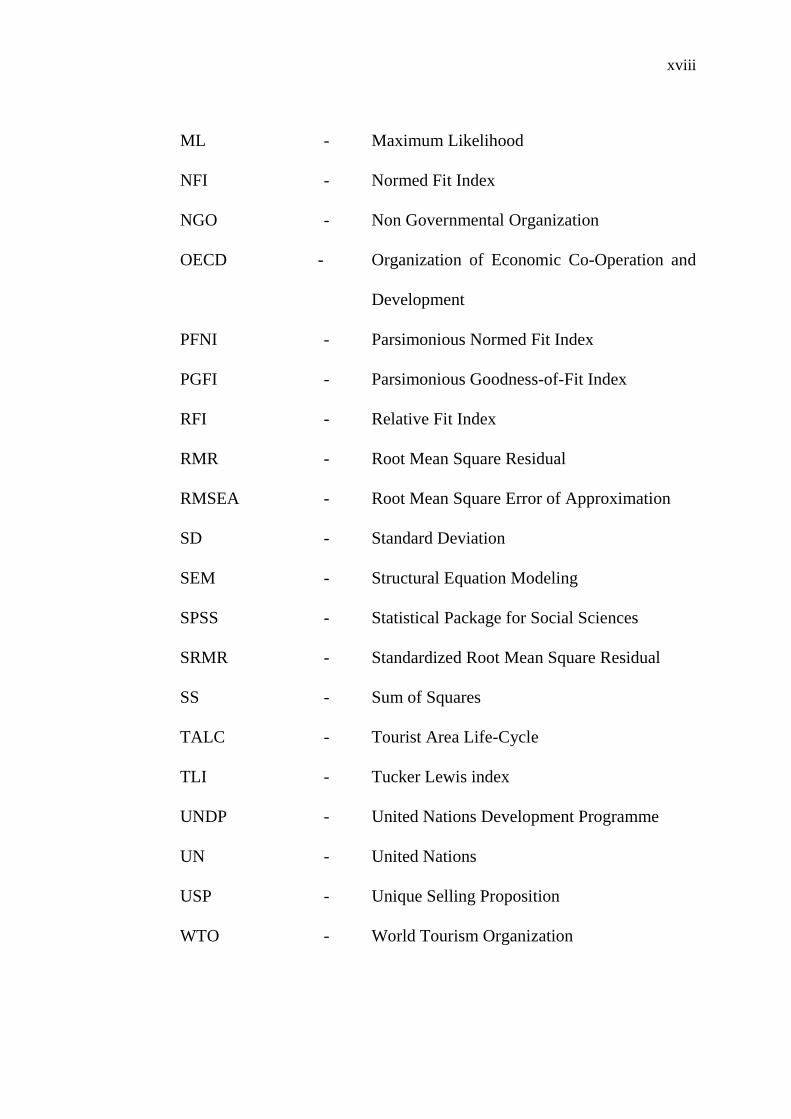
xviii
ML - Maximum Likelihood
NFI - Normed Fit Index
NGO - Non Governmental Organization
OECD - Organization of Economic Co-Operation and
Development
PFNI - Parsimonious Normed Fit Index
PGFI - Parsimonious Goodness-of-Fit Index
RFI - Relative Fit Index
RMR - Root Mean Square Residual
RMSEA - Root Mean Square Error of Approximation
SD - Standard Deviation
SEM - Structural Equation Modeling
SPSS - Statistical Package for Social Sciences
SRMR - Standardized Root Mean Square Residual
SS - Sum of Squares
TALC - Tourist Area Life-Cycle
TLI - Tucker Lewis index
UNDP - United Nations Development Programme
UN - United Nations
USP - Unique Selling Proposition
WTO - World Tourism Organization

xix
LIST OF SYMBOLS
α - Cronbach's alpha
β - Beta estimate


1
CHAPTER I
INTRODUCTION
1.0 INTRODUCTION
Identification of stakeholders’ involvement in destination tourism
planning and development, as well as the factors that might influence their level
of involvement, is not only important for tourism destination planners, but also
the host community’s support for destination tourism development and
competitive strategies. Tourism destinations need to plan their development
strategies and actions to succeed internationally and gain a competitive
advantage (Dowling, 1993; Riege & Perry, 2000; Ritchie, 1993; Yuksel et al.,
1999). Places that do not develop strategic planning of their destinations can
suffer from economic, social, and environmental problems, as well as a decline
in their competitiveness as a tourism destination (Dowling, 1993).
This study presents an integrated approach to understanding the
competitiveness of rural tourism destinations, and attempts to extend the
theoretical and empirical evidence about the structural relationships among the
following constructs: 1) Tourism development impacts, 2) community
participation and 3) support for enhancement strategies for destination
competitiveness. This study was approached from the tourism stakeholders’
perspective about support for rural tourism destination competitiveness. Their
perceptions, attitudes and behaviors in terms of tourism were assessed as
critical sources of testing the proposed structural model in this study.
2
Worldwide tourism is ranked second highest revenue-generating
industry next to the oil industry. Tourism is one of the leading Global industries
(11% of global Gross domestic product GDP) of the world. The World Tourism
Organization (WTO) estimates that there will be 1.6 billion Tourists in the
World, representing 21% of world population. Tourism industry contributes
high priority goals of developing country’s income, employment, foreign
exchange earnings (primary source of foreign exchange earnings in 46 of 49
developing countries). Now, tourism is one of the largest service industries in
India, with a contribution of 6.23 per cent to the national GDP and 8.78 per cent
of the total employment in India. (ACNielsen ORG-MARG, Ministry of
Tourism, Government of India). Tourism also encourages preservation of
monuments and heritage properties and helps the survival of art forms, crafts
and culture.
Tourists are now looking for a balance between tourism, nature and
culture, between conservation and development in every place they visit.
Increasingly in the 1990s there has been a growth of new types of tourists in
rural spaces, with behavior patterns clearly different from the homecoming
motivation of traditional rural tourism (Brown & Hall, 2000, Perales, 2002).
This paves the opportunity for developing non-traditional tourist destination,
such as the countryside tourism. The tourists are more attracted by rural
tourism, which is developed at a smaller scale than mass tourism. Because of
tourist’s inclination towards novelty, culture, history, adventure, heritage and
interaction with local people, the policy makers are now aware of and anxious
to develop. Rural tourism is a new trend in tourism since it satisfies the current
needs of the tourists that are unhappy with mass tourism. It constitutes an
alternative to traditional mass tourism.
3
In the 10th five year plan (2003-2007), the government of India planned
to develop 39 rural tourism sites with the UNDP (United Nations Development
Programme) under the innovative Endogenous Tourism Project, focusing on the
rural tourism experience and based on rural art and craft skills, cultural and
natural heritage. The development of strong platform around the concept of
rural tourism is definitely useful for a country like India, where almost 74% of
the population sites in its 7 million villages (Ministry of Tourism, Government
of India). Each village has its own distinctive performing arts and handicrafts,
the customs and traditions, colorful festivals, cuisine as well as different
cultures and historical heritage. In 2004, the government of India has identified
31 villages across the country as rural tourist spots. Among these, Karaikudi in
Sivaganga district and Kazhugumalai in Thoothugudi district are the two rural
villages located in Tamilnadu.
Tamil Nadu is the top state in attracting the maximum number of foreign
tourists in India. In the year 2008, 646.58 lakhs tourists visited Tamil Nadu.
During the year 2009, the tourist arrival was 804.07 lakhs. When compared the
tourist arrivals for the above two years, it has recorded an increase of 157.49
lakhs in the year 2009. (Tamilnadu Tourism, policy note 2010-2011). Against
the background of the solid economic development, potential of international
tourism, UN WTO recommends the participation of local communities and
other stakeholders in Tourism development.
The basic concept of rural tourism is to benefit the local community
through entrepreneurial opportunities, income generation, employment
opportunities, diversify the economy providing a stable base for the local
community, conservation and development of rural arts and crafts, investment
4
for infrastructure development and preservation of the environment and
heritage, discourage the out migration of youth (Gannon, 1994; Greffe, 1994;
Opperman, 1996; Riberio & Marques, 2002; MacDonald & Jolliffe, 2003; Liu,
2006). Liu (2006) contemplates “the promotion of rural tourism is a derivative
of political will, because of the perceived need to reduce disparities between
urban and rural areas.”
The scope of this research is to find and examine the factors that may
affect Karaikudi’s stakeholders’ (Government authorities -tourism related and
non-tourism related, Businesses- tourism related and non-tourism related, local
community(residents), faculty and students and Tourists) attitudes and
perceptions, community participation and in turn support for competitive
destination strategies.
1.1 RESEARCH BACKGROUND
Rural areas across the developed world have encountered economic
decline due to trends of industrialization and urbanization (Lane, 1994).
Increasingly in the 1990s there has been a growth of new types of tourists in
rural spaces, with behavior patterns clearly different from the homecoming
motivation of traditional rural tourism (Perales, 2002). Rural tourism is
increasingly being used as a development strategy to improve the social and
economic well being of rural areas. Rural tourism includes a huge range of
activities, natural or manmade attractions, crafts and heritage, amenities and
facilities, transportation, marketing and information systems (Sharpley 2004).
5
The damaging effects of the declining economy have persuaded
governments to recognize these problems and tourism has been presented as a
catalyst to revitalize disadvantaged rural areas (Riberio & Marques, 2002).
Tourism often represents a means of generating revenue and increasing
employment opportunities.
For rural tourism to be successful, collaboration needs to exist amongst
entrepreneurs (Wilson et al., 2001). Useful integrated approaches to rural
studies include acknowledging the importance of locally controlled agendas to
reach centralization, awareness of the benefits for shared ideas and funding
developments, and creating appropriate tourism plans for rural areas
(MacDonald & Jolliffe, 2003). There are numerous challenges when attempting
rural tourism development: the total product package must be sufficient;
significant investment may be required; there is the adoption to a service role;
the quality of products and services and the availability of skills and resources
for effective marketing (Sharpley, 2000). Tourism development requires
attractions, promotion, infrastructure and services and hospitality (Wilson et al.,
2001).
The tourism plan has a strong marketing focus and gives little attention
to local community values and the social, cultural and environmental effects of
tourism. Understanding destination resident’s attitudes and perceptions towards
tourism development and the factors that may influence their reactions is
essential in achieving a host community's support for tourism development.
Therefore, many researchers have been extensively paid attention towards
residents' reactions towards tourism development. (Ap, 1992, Akis et al.,1996;
6
Perdue et al., 1990., Long et al., 1990, Liu et al., 1987, Lankford, 1994, Milman
& Pizam, 1988, Yoon et al., 2001, Liu, 2006, Vargane,2010)
Various literatures has identified the major impacts of tourism on
governments and host communities to be economic, social, cultural,
environmental, and political (Brunt & Courtney, 1999; Davis et al,1988; Hall,
2004; Lieu et al., 1987;Perdue et al., 1987;Yooshik Yoon et al., 2001, Telfer &
Sharpley, 2008). The authors go on to state that “the overall outcome of the
impacts will influence the contribution of tourism to development” (Telfer &
sharpley 2008).The research by Yooshik Yoon et al., (2001) shows that
community opposition against tourism will be based on perceived negative
environmental and social impacts of tourism development.
During the preparation of the Karaikudi Structure Plan, local residents
have been provided with an opportunity to give their comment and suggestion.
Nevertheless, based on his study, Din (1993) questioned the effectiveness of the
public participation process during, since local residents can only participate
without influence the decision making-process. Mohd Saad (1998) stated that
government administrator has made most of the decisions without public
consultation. Due to that, most of issues related to tourism planning and
development failed to address the need of local residents (Din 1993, 1997)
Therefore, Din (1993) suggested that local residents should be given greater
chances to voice their opinions or ideas, despite of shortcomings in
implementation approach and the lack of their understanding. Local residents
need to be informed of tourism development since the lack of knowledge of
tourism might result in the low level of awareness in the participation process
and could contribute to negative perceptions. One of the main strategies to

7
improve the living standard of the rural population, in the context of rural
tourism development, is the promotion of community enterprise. It is a
collective activity initiated by the community themselves to raise socio-
economic standards, improve their environment and subsequently uplift their
quality of life. Based on the concept of self-help, mutual help and common
ownership, the community enterprise encourages the participation of the local
community in conceptualizing their development needs and in the decision
making over control of scarce economic resources.
By summation, the tourism literature suggests that the support for
destination competitiveness can be enhanced by proper linkages between
tourism development impacts and community stakeholders’ participation.
1.2 RESEARCH PROBLEM
In recent study on tourism, researchers have introduced concepts and
relevant models about tourism destination competitiveness and focused on how
effectively and efficiently destination competitiveness can be improved to
respond to escalating market competition (Crouch & Ritchie, 1999; Hassan,
2000; Thomas & Long,2000).They have also discussed that creating or
integrating value-added destination products and services enhances tourism
attractiveness. The most common evaluation method of tourism attractiveness
is from visitors’ or tourists’ perspectives. (Formica, 2000; Milman & Pizam,
1995) argued that this method is somewhat limited due to the short period of
visiting time, and a limited knowledge of or familiarity with attractions existing
in a given region. Liu (1988) and Formica (2000) suggested that rather than
using visitors’ perspectives, the use of tourism experts such as tourism
8
stakeholders have potential results and benefits. Their solid knowledge and
experiences of the entire portfolio of existing tourism resources and attractions
is useful in evaluating destination competitiveness. Although a number of
studies have addressed concepts and relevant models concerning destination
competitiveness, no empirical study has developed an integrative model
capable of investigating the destination competitiveness of an area by
examining the structural relationships among tourism stakeholders’ beliefs and
attitudes toward tourism, their development preferences for tourism
attractions/resources, and their support of enhancement strategies for
destination competitiveness.
The bottom-up or community approach (Keogh, 1990) which focuses on
participation of the local community in the decision-making and
implementation processes is noticed less frequently. Managing and marketing
the tourism destinations is very difficult, due to the complexities and diversity
of the relationships between local stakeholders (e.g. government organisations,
residents, businesses – tourism and non-tourism, tourism employees, tourism
faculty and students) involved in the development and production of tourism
products (Sautter & Leisen, 1999). Development initiatives in a community
should take into account the interests of all stakeholder groups (Ioannides,
1995; Markwick, 2000; Vincent & Thompson, 2002).Hence, strategies adopted
for planning and development of destination tourism strategies includes the
desire of all those who can influence the development of strategies to ensure
their support for the enhancement of the destination’s competitive strategies.
9
Stakeholders also have different attitudes and perceptions in regard to
tourism development impacts, attachment to a particular place and level of
empowerment, and their level of involvement in planning decision- making.
Stakeholders’ experiences and knowledge could help in enhancing the process
of evaluating the destination’s possessed competitive resources and attractions.
Of particular relevance are their perceptions, attitudes and behaviours about the
influencing factors on the tourism planning and development process regarding
tourism impacts (economic, social, cultural, political, and environmental),
perceived power and community satisfaction. The above factors have received
little attention in the past (Hall, 2000). This study investigates the
interrelationships between these constructs and the favourable competitive
strategies stakeholders are willing to support.
The data were collected from Karaikudi’s tourism stakeholders such as
government authorities (tourism related and non-tourism related), businesses
(tourism related and non-tourism related), residents, tourism faculty and
students, and tourists. The main objective was to examine their perceptions and
opinions about the impacts of tourism development, and further to determine
their willingness to support the most appropriate development strategies of
competitiveness.
There is only a little empirical research on rural destination
competitiveness, especially from the perception of public, private and local
tourism organisations’ stakeholders (Dredge, 2006; Yoon, 2002). Further, there
is little literature about the concepts of power and empowerment related to
tourism development (Hall, 2000; Reid, 2004). This study attempted to close
these gaps by creating and testing a model based on previous research work in
10
the field to deal with the above-mentioned research problem. In investigating
the research problem, a number of hypotheses were developed. These
hypotheses resulted from the review of the extant tourism planning,
development and management literature.
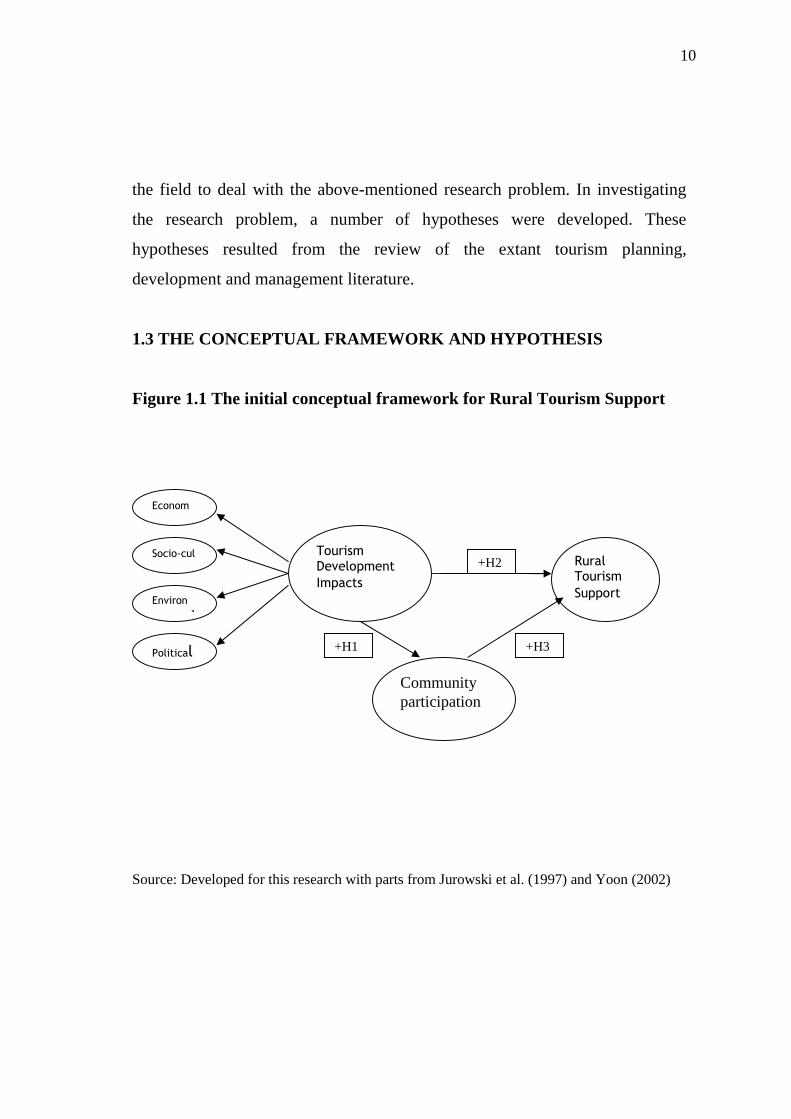
1.3 THE CONCEPTUAL FRAMEWORK AND HYPOTHESIS
Figure 1.1 The initial conceptual framework for Rural Tourism Support
Source: Developed for this research with parts from Jurowski et al. (1997) and Yoon (2002)
TourismDevelopmentImpacts
RuralTourismSupport
Econom
Socio-cul
Environ
mental
Political
+H2
Communityparticipation
+H1 +H3

11
1.4 RESEARCH OBJECTIVES AND HYPOTHESES
1.4.1 Primary objectives of the study
1. To make a contribution to under-researched areas in the academic literature
related to tourism development impacts, community participation, and
stakeholder support for rural tourism.
2. Developing a theoretical structural model depicting the interrelationships
between (1) tourism development impacts, (2) community participation
(stakeholders’ perceived power) and (3) support for tourism destination.
3. Then, empirically testing the constructed model on a developing country
(India) domain, which illustrates the concept of destination competitiveness
from a national developing country perspective.
1.4.2 Primary Hypotheses
H1: There is a relationship between tourism development impacts (economic,
social-cultural, environmental and political,) and the community stakeholders’
participation.
H2: There is a relationship between tourism development impacts (economic,
social-cultural, environmental and political,) and the support for rural
destination competitive strategies.
H3: There is a relationship between community participation and the support
for rural destination competitive strategies.
H4: There is a relationship between economic impacts and tourism
development impacts
12
H5: There is a relationship between socio-cultural impact and tourism
development impacts.
H6: There is a relationship between political impacts and tourism development
impacts.
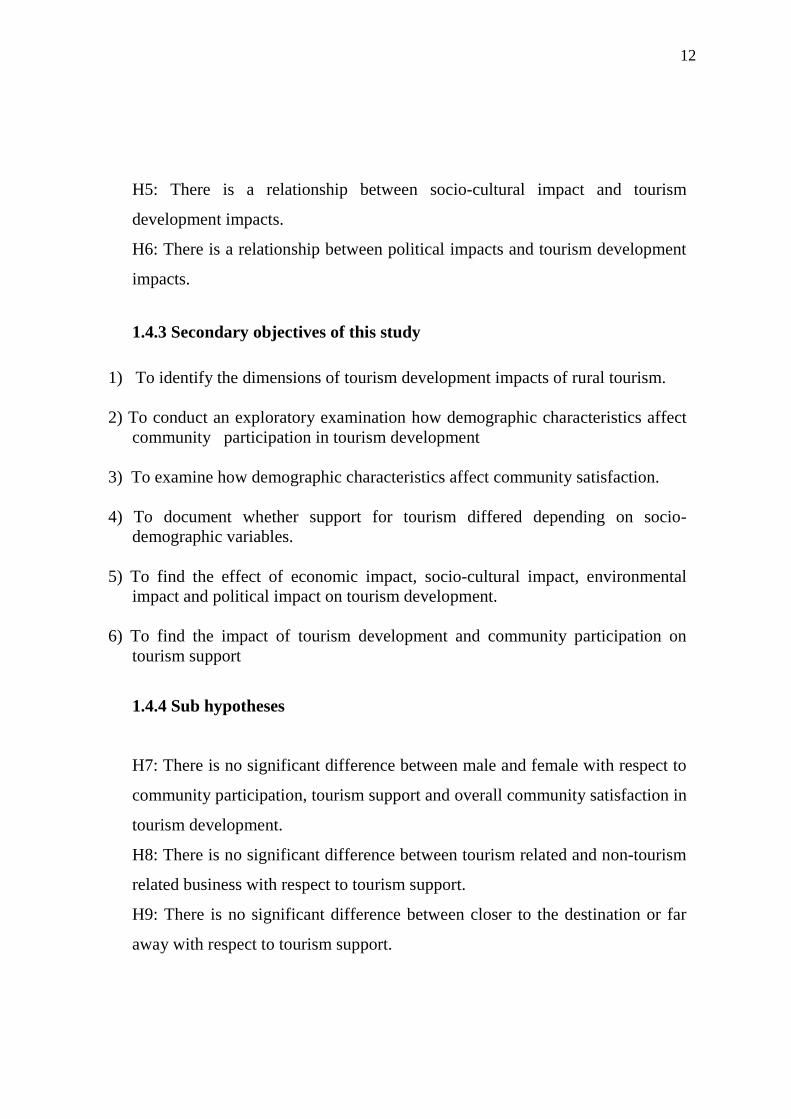
1.4.3 Secondary objectives of this study
1) To identify the dimensions of tourism development impacts of rural tourism.
2) To conduct an exploratory examination how demographic characteristics affectcommunity participation in tourism development
3) To examine how demographic characteristics affect community satisfaction.
4) To document whether support for tourism differed depending on socio-demographic variables.
5) To find the effect of economic impact, socio-cultural impact, environmentalimpact and political impact on tourism development.
6) To find the impact of tourism development and community participation ontourism support
1.4.4 Sub hypotheses
H7: There is no significant difference between male and female with respect to
community participation, tourism support and overall community satisfaction in
tourism development.
H8: There is no significant difference between tourism related and non-tourism
related business with respect to tourism support.
H9: There is no significant difference between closer to the destination or far
away with respect to tourism support.
13
H10: There is no significant difference among age group of the community
people with respect to community participation in tourism development
H11: There is no significant difference among occupation of the community
people with respect to community participation.
H12: There is no significant difference among marital status of the community
people with respect to community participation.
H13: There is no significant difference among length of residency of the
community people with respect to community participation.
H14: There is no significant difference between age group of the community
people with respect to overall community satisfaction
H15: There is no significant difference among length of residency of the
community people with respect to community satisfaction.
H16: There is no significant difference between age group of the community
people with respect to tourism support strategies
H17: There is no significant difference among occupation of the people with
respect to tourism support strategies.
H18: There is no significant difference among education qualification of the
people with respect to tourism support strategies.
H19: There is no significant difference between length of residency with
respect to tourism support strategies.
H20: There is no association between years of residency and support for
tourism
14
1.5 THEORETICAL BACKGROUND
Social Exchange Theory have been utilized by most of the researchers in
their study, related to relationships between different stakeholders in
destination development and residents’ attitudes and perceptions, which has
been considered the appropriate framework to develop an understanding of
residents’ perceptions and attitudes (Ap, 1992; Perdue et al., 1990).
Ap (1990) in his Social Exchange Theory suggests that when an
exchange of resources between residents and tourism is high and balanced,
tourism impacts are viewed positively by residents and vice versa. Perdue et al.
(1990) briefly mentioned that social exchange theory is a basis for investigating
residents’ attitudes about tourism. They concluded that support for additional
development was positively related in the case of people who perceived
positive impacts from tourism, and negatively correlated in the case of people
who perceived negative impacts from tourism.
According to Yoon et al. (2000), who studied residents’ attitudes and
support for tourism development by using a structural model, local residents are
likely to participate in exchange (support tourism development) as long as the
perceived benefits of tourism exceed the perceived costs of tourism. Since
tourism stakeholders have been considered as important key players or
components that influence the success or failure of tourism in a region, their
participation and involvement should be considered in tourism planning and
development. Thus, social exchange theory provides a theoretical foundation
for identifying tourism stakeholders’ perceptions of the benefits and costs of
tourism.
15
1.6 RESEARCH METHODOLOGY
The study is explanatory and descriptive in nature. Both quantitative and
qualitative methodologies are applied to investigate the relationships between
different constructs proposed in Figure 1.1. The research study used survey
questionnaire quantitatively and focus groups qualitatively. The sample size
taken was 320.Convenience and quota sampling methods were adapted to
collect quantitative data from different tourism stakeholders across various
villages around Karaikudi. The survey instrument was developed by the
researcher to measure all constructs. These measurement scales were pre-tested
at different stages to establish validity and reliability. The data was then
analysed using structural equation modeling (SEM) with AMOS 21. The
statistical analyses were done using SPSS 16.
1.7 KEY FINDINGS AND CONTRIBUTIONS OF THE RESEARCH
The findings and contributions of this research are discussed from the
perspectives of theoretical and methodological contributions and practical
implications.
The results indicated the impacts of economic, socio cultural and
political effects, community participation and their support for destination
competitive strategies. This finding substantiates the necessity for involving the
stakeholders in community decision making process to achieve sustainability
and enhance destination competitiveness. In addition, the research demonstrates
some statistical significance between tourism development impacts people may
experience and their emotional and functional attachment to their communities,
16
and their desire for more empowerment and involvement in tourism benefits
and the decision-making process. These relationships may lead to people’s
continuous support for future tourism development in the community. With
regard to the relationship between tourism development impacts and
community participation, the study demonstrates a positive relationship
between the two constructs. The study also detected a negative relationship
between tourism development impacts and tourism support. This is an
indication of people’s dissatisfaction about the benefits they receive from
tourism development. Further, the study’s outcomes did not support the
existence of environmental impacts of tourism development in karaikudi.
Finally, the government’s potential role in tourism planning and development
was not supported by destination stakeholders’ respondents in this study, which
contradicts the findings of existing literature.
This study fills the various gaps in the tourism literature that specifically
dealt with the relationship between stakeholders’ attitudes and support fortourism development, stakeholders’ participation, and destinationcompetitiveness. The study advances the tourism literature by introducing
conceptual framework (model) explaining the relationship between tourism
development impacts, community participation and support for tourism
destination competitiveness from the stakeholders perspective. This conceptual
model will contribute new knowledge to the area of rural tourism research. This
study supported the majority of the hypothesized relationships.
This study included a wide array of stakeholders in the participation
process has not been comprehensive in tourism research, this study calls for a
broader list of tourism stakeholders to be included in the consultation process.

17
Social exchange theory relating to people’s perceptions and attitudes is
widely used in tourism research, and stakeholder theory has mainly been used
in management and less used in tourism. This study tried to combine the two
theories in explaining the role of socio-economic costs/benefits and
stakeholders’ roles in tourism planning and development.
This research used the structural equation modeling (SEM) method and
AMOS 21 software in data analysis. There is little tourism literature using this
method in rural tourism research. Thus, this study contributes by expanding the
use of SEM in analyzing empirical data in the rural tourism discipline in the
rigorous testing of relationships between key constructs. This study is one of few
recent studies that have attempted to explain the relationships between different
perceived tourism development impacts, community participation and support
for destination tourism planning, development and competitive strategies.
1.8 FUNCTIONAL DEFINITIONS
Destination: Destinations are places that attract visitors for a temporary stay,
and range from continents to countries to states and cities to villages to purpose
built resort areas [Pike, 2004].
Tourism development impacts: Result from a complex process of
interchanges between tourists, host communities, and destinations (Mathieson
& Wall, 1982).
Tourism stakeholders: Persons or groups who can affect and be affected by
the tourism business within a particular market or community and who have
interest in the planning process, delivery and outcomes of the tourism
18
business.(Donaldson & Preston, 1995; Sautter & Leisen, 1999).The examples
of tourism stakeholders are Government tourism authorities, local tourism
agencies, non-government organizations, community people, tourism related
associations and councils, tourism planning and development companies,
Business people, tourism related faculty and professionals, visiting and
information centers.
Competitiveness: Combination of assets and processes where assets are
inherited (e.g. natural resources) or created (e.g. infrastructure), and processes
transform assets to economic results (Crouch & Ritchie, 1999).
Tourism destination competitiveness: Destination’s ability to create value
and thus increasing national wealth by managing assets and processes,
attractiveness, and proximity, and by integrating these relationships into an
economic and social model (Ritchie & Crouch, 2000).
Community participation: The degree of ability of the public to participate in
community- based tourism planning decision-making for the benefit of tourism
development (Hall, 2000; Jamal & Getz, 1995).
1.9 TOURISM IN INDIA
1.9.1 Introduction
The second highest revenue-generating industry in the world is a tourism
industry next to the oil industry. Tourism is one of the leading global industries
(11% of global GDP) of the world. The World Tourism Organization (WTO)
estimates that there will be 1.6 billion tourists in the world, representing 21% of
19
world population. Tourism industry contributes high priority goals of
developing country’s income, employment, foreign exchange earnings (Primary
source of foreign exchange earnings in 46 of 49 developing countries). Tourism
also supports preservation of monuments and heritage properties and helps the
survival of art forms, crafts and culture. Now, tourism is one of the largest
service industries in India. Tourism contribution to the national Gross Domestic
Product (GDP) is 6.23 per cent and for the total employment in India is 8.78 per
cent in 2010.
1.9.2 India Tourism Statistics at a Glance 2011
In 2011, the number of Foreign Tourist Arrivals (FTAs) in India has
been increased to 6.31 million as compared to 5.78 million in 2010. The growth
rate in FTAs during 2011 over 2010 was 9.2% as compared to 11.8% during
2010 over 2009. The growth rate of 9.2% in 2011 for India was better than
growth rate of 5% for the international tourist arrivals in 2010.The share of
India in international tourist arrivals in 2011 was 0.64%, while being 0.61% in
2010. However, India's rank in the world improved to 38 in 2011 from 42 in
2010. (www.tourism.gov.in)
India accounted for 2.9% of the tourist arrivals in Asia Pacific Region in
2011, occupying 9th rank in the region. About 92.0% of the FTAs entered India
through air routes followed by 7.2% by land routes and 0.8% by sea routes.
Delhi and Mumbai airports accounted for about 55.5% of the total FTAs in
India. Fifteen major countries contributing significantly by higher number of
FTAs in India in 2011 were USA, UK, Bangladesh, Sri Lanka, Canada,
Germany, France, Malaysia, Japan, Australia, Russian Fed., China(Main),

20
Singapore, Nepal and Republic of Korea. These 15 countries accounted for
about 71.43% of total FTAs in India in 2011.(www.tourism.gov.in)
The top 10 States in terms of foreign tourist visits during 2011 were
mostly the same as in 2010, with marginal changes in relative ranks of States
except that the State Karnataka has replaced Goa. Figure 1.2 shows the
percentage share of Top 10 states for foreign tourist arrivals in India in 2011.
(Ministry of tourism, GOI)
Tourism sector continues to play an important role as a foreign exchange
earner for the country. In 2011, foreign exchange earnings (FEE) from the
tourism were US$ 16.56 billion as compared to US$ 14.19 billion in 2010,
registering a growth of 16.7%. Number of domestic tourist visits in India during
2011 was 850.86 million as compared to 747.70 million in 2010, with a growth
rate of 13.8 %. Number of Indian national departures from India during 2011
was 13.99 million as compared to 12.99 million in 2010, registering a growth
rate of 7.7%. (www.tourism.gov.in).
The top 10 States in terms of domestic tourist visits during 2011 were
the same as in 2010. The following figure 1.3 shows the percentage share of top
10 States in terms of domestic tourist visits in 2011.
21
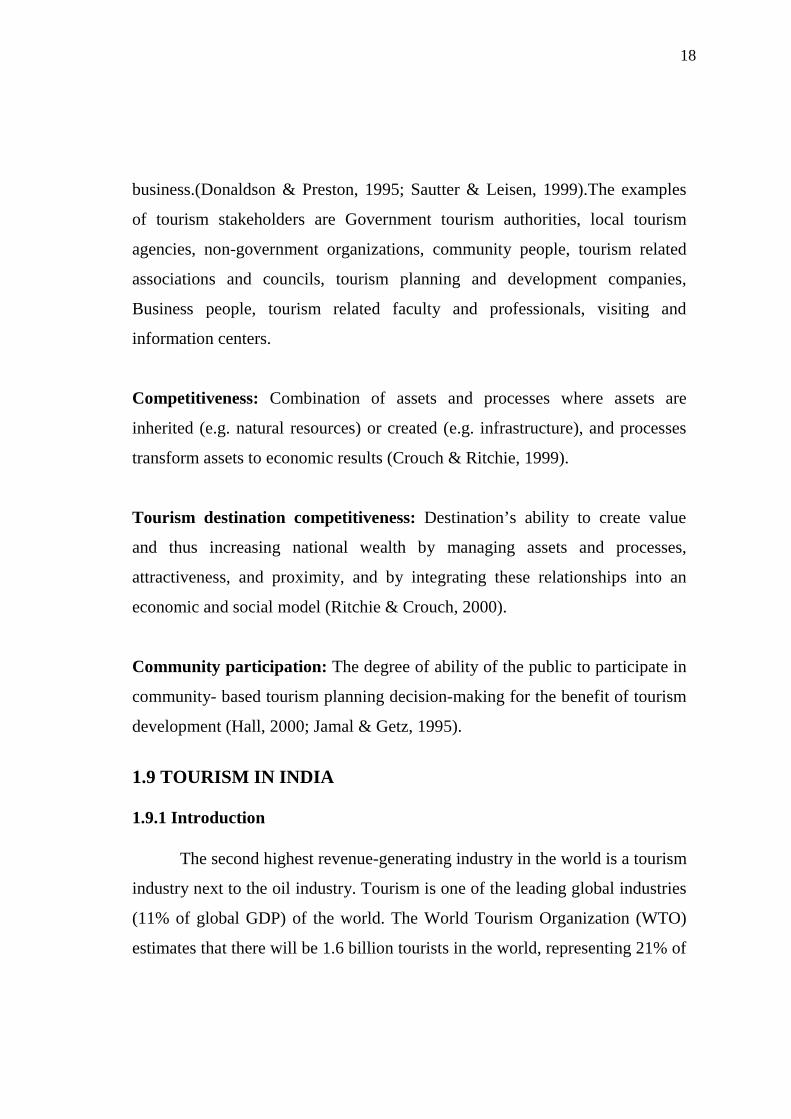
Figure 1.2 Percentage shares of top 10 states in foreign tourist visits to
states (2011)
Source: Secondary data- India Tourism statistics 2011 at a glance
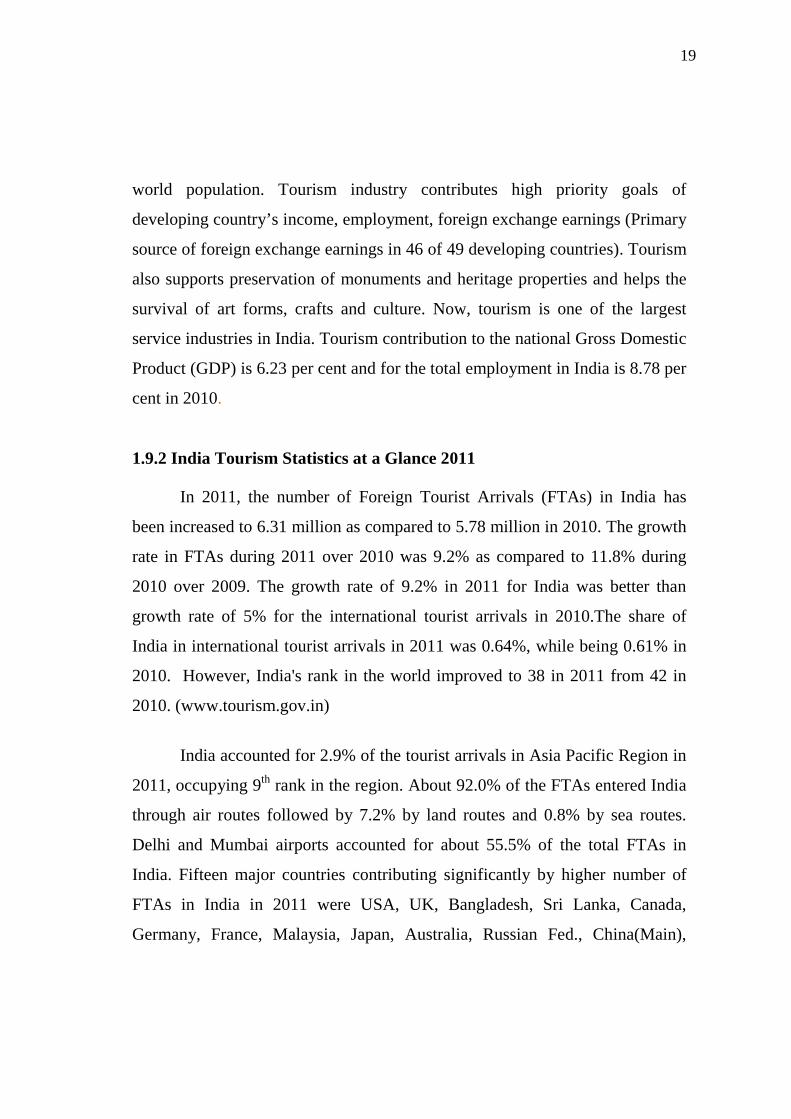
Figure 1.3 Percentage shares of top 10 States in domestic tourist visits
(2011)
Source: Secondary data- India Tourism statistics 2011 at a glance
22
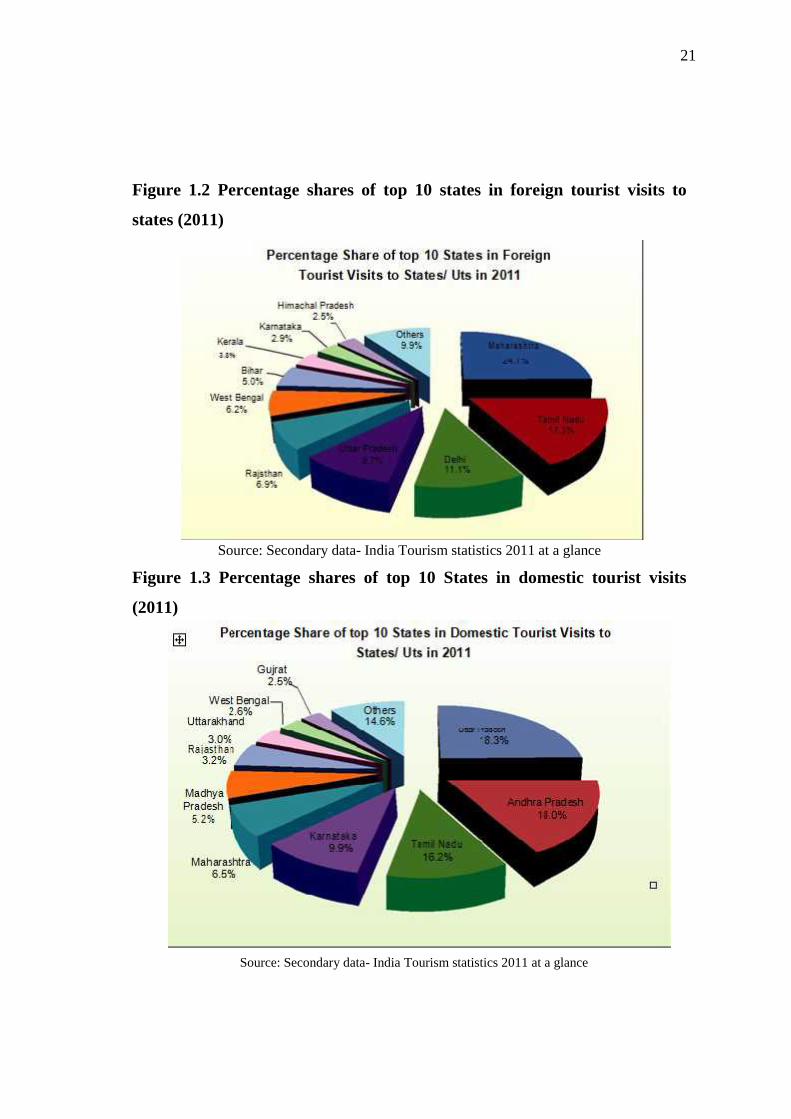
Table 1.1 Shows the Foreign Tourist arrivals (FTAs) in India, from 1997 to
2011 (India tourism statistics at a glance 2010, Incredible India)
Table 1.1: Foreign Tourist arrivals (FTAs) in India, from 1997 to 2011
Source: Secondary data- India Tourism statistics 2010 at a glance
Table 1.1 presents the statistics foreign tourist visits to various States
during the years 1997 to 2011. The foreign tourist visits have been increasing
over the years, though there was a decline in the years 1998, 2001, 2002 and
2009. The foreign tourist visits to all States during 1991 to 2011 witnessed a
compound annual growth rate CAGR of 10.07%. During 2011, the visits by
foreign tourists registered a growth of 8.85% over 2010.
23
1.9.3 Rural Tourism in India
Rural tourism is a subset of tourism that would consist of wide range
things such as farm/agricultural tourism, cultural tourism, nature tourism,
adventure tourism, and eco-tourism. Any form of tourism that showcases the
rural life, art, culture and heritage at rural locations, thereby benefiting the local
community economically and socially as well as enabling interaction between
the tourists and the locals for a more enriching tourism experience can be
termed as rural tourism. Rural tourism is essentially an activity that takes place
in the countryside. Rural tourism creates experiences for tourist who enjoys
locations that are sparsely populated, it is predominantly in natural
environment, and it meshes with seasonality and local events and is based on
preservation of culture, heritage and traditions. Rural tourism has become quite
admired since the last few years. In the 10th five year plan (2003-2007),
Ministry of Tourism, Government of India planned to develop 39 rural tourism
sites with the UNDP (United Nations Development Programme) under the
innovative endogenous tourism project, focusing on the rural tourism
experience and the rural art and craft skills, cultural and natural heritage.
Rural tourism is a vital means of developing employment and income
and can assist social and economic development of rural communities
(Sharpley, 2001). The development of strong platform around the concept of
rural tourism is definitely useful for a country like India, where almost 74% of
the population sites in its 7 million villages (Ministry of Tourism, Government
of India). Each village has its own distinctive performing arts and handicrafts,
the customs and traditions, colorful festivals, cuisine as well as different
cultures and historical heritage. The project is being implemented at 31 rural
24
locations in 20 states with community participation through NGO or Panchayat
Partners, District Collectors as focal points and specialized stakeholders. The
rural tourism sites in India and their Unique Selling Proposition (USP) is
presented in Appendix-2
Some Rural tourism destinations in India.
Pochampalli (Nalgonda District, Andhra Pradesh
Raghurajpur (Puri District, Orissa):
Hodka (Kachchh District, Gujarat):
Pranpur (Ashok Nagar District, Madhya Pradesh):
Aranmula (Pathanamthitta District, Kerala):
Lachen (North District, Sikkim):
Nagarnar (Bastar District, Chattisgarh):
Karaikudi (Sivaganga District, Tamil Nadu):
Mana (Chamoli District, Uttaranchal):
1.9.4 Tourism in Tamil Nadu
The State of Tamil Nadu, situated in the southern part of the Indian
Peninsula has over 20 centuries of cultural heritage and historic significance. It
has the potential to become a preferred tourism destination world-wide. With an
area of 130,058 sq. km and a population of over 70 million (Figure 1.4), Tamil
Nadu is the eleventh largest populated and the third most industrialized state in
India. It possess successful tourism infrastructure in its Western border,
Karnataka, and also enjoys a long unbroken coastline in the Bay of Bengal.
25
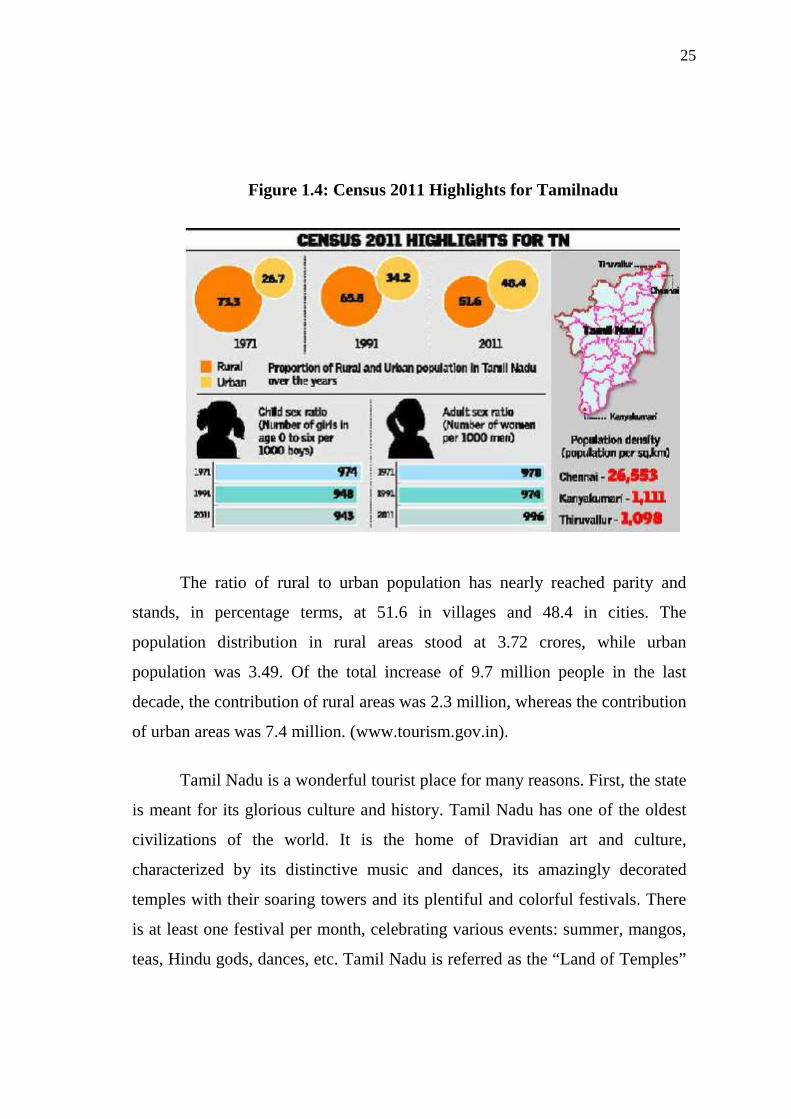
Figure 1.4: Census 2011 Highlights for Tamilnadu
The ratio of rural to urban population has nearly reached parity and
stands, in percentage terms, at 51.6 in villages and 48.4 in cities. The
population distribution in rural areas stood at 3.72 crores, while urban
population was 3.49. Of the total increase of 9.7 million people in the last
decade, the contribution of rural areas was 2.3 million, whereas the contribution
of urban areas was 7.4 million. (www.tourism.gov.in).
Tamil Nadu is a wonderful tourist place for many reasons. First, the state
is meant for its glorious culture and history. Tamil Nadu has one of the oldest
civilizations of the world. It is the home of Dravidian art and culture,
characterized by its distinctive music and dances, its amazingly decorated
temples with their soaring towers and its plentiful and colorful festivals. There
is at least one festival per month, celebrating various events: summer, mangos,
teas, Hindu gods, dances, etc. Tamil Nadu is referred as the “Land of Temples”
26
because there are more than 30,000 temples in this state. Secondly, its natural
beauty in villages is very attractive to tourists. Next only to the pilgrimage and
heritage locations in Tamil Nadu comes the scenic beauty of nature in and
around the state in the form of forests, wildlife sanctuaries, hill stations and the
long bio-diverse coastline. These locations provide immense opportunities for
sightseeing, pleasure and leisure, to the visitors of various categories including
adventure tourists.
The number of tourists arriving in Tamil Nadu has increased 2½ times
since 1990. As per 2001 statistics, 245.8 lakh tourists arrived in the state of
which 238.1 lakh were domestic tourists and 7.7 lakh, foreign tourists. Where
the years 1991 and 1992 experienced an unprecedented growth of 18.7% and
18.8% respectively, years 1997, 1999, and 2001 saw steep declines in growth
rate 4.0%, 3.8%, and 3.4% respectively. (www.tamiltourism.org). Chennai,
Madurai, Ooty, Kodaikanal, Rameshwaram, and Kanyakumari have attracted
maximum tourists of all the tourist places in Tamil Nadu over the past several
years. A substantial number of pilgrims visiting Tamil Nadu has consistently
grown over the years. Pilgrim tourists make 30% of the total tourists arriving in
the state; places of scenic beauty attract 40%; rest is shared by other tourism
categories (heritage, adventure, festival, and leisure).
27
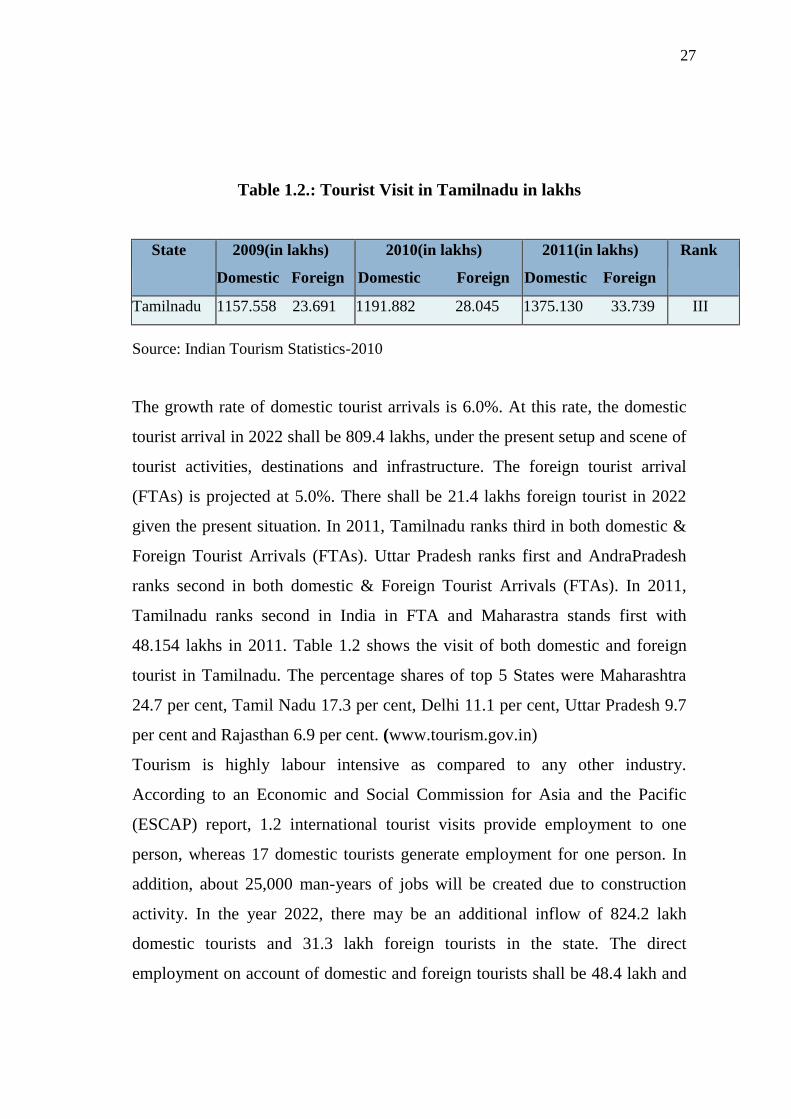
Table 1.2.: Tourist Visit in Tamilnadu in lakhs
State 2009(in lakhs)
Domestic Foreign
2010(in lakhs)
Domestic Foreign
2011(in lakhs)
Domestic Foreign
Rank
Tamilnadu 1157.558 23.691 1191.882 28.045 1375.130 33.739 III
Source: Indian Tourism Statistics-2010
The growth rate of domestic tourist arrivals is 6.0%. At this rate, the domestic
tourist arrival in 2022 shall be 809.4 lakhs, under the present setup and scene of
tourist activities, destinations and infrastructure. The foreign tourist arrival
(FTAs) is projected at 5.0%. There shall be 21.4 lakhs foreign tourist in 2022
given the present situation. In 2011, Tamilnadu ranks third in both domestic &
Foreign Tourist Arrivals (FTAs). Uttar Pradesh ranks first and AndraPradesh
ranks second in both domestic & Foreign Tourist Arrivals (FTAs). In 2011,
Tamilnadu ranks second in India in FTA and Maharastra stands first with
48.154 lakhs in 2011. Table 1.2 shows the visit of both domestic and foreign
tourist in Tamilnadu. The percentage shares of top 5 States were Maharashtra
24.7 per cent, Tamil Nadu 17.3 per cent, Delhi 11.1 per cent, Uttar Pradesh 9.7
per cent and Rajasthan 6.9 per cent. (www.tourism.gov.in)
Tourism is highly labour intensive as compared to any other industry.
According to an Economic and Social Commission for Asia and the Pacific
(ESCAP) report, 1.2 international tourist visits provide employment to one
person, whereas 17 domestic tourists generate employment for one person. In
addition, about 25,000 man-years of jobs will be created due to construction
activity. In the year 2022, there may be an additional inflow of 824.2 lakh
domestic tourists and 31.3 lakh foreign tourists in the state. The direct
employment on account of domestic and foreign tourists shall be 48.4 lakh and
28
40.4 lakh respectively. The indirect employment is estimated at 120.7 lakh. The
Government of Tamil Nadu has set ambitious goals for the tourism sector. It
predicts a tourist growth rate of 10-12 percent in lieu of the current 7-9 percent,
vows to increase the length of stay by at least 2-3 days and build good
infrastructural facilities at tourist spots. (www.incredibleindia.org)
1.9.5 Rural Tourism in Tamilnadu
Rural Tourism is a new concept in the field of tourism. The villages in
Tamil Nadu are a treasure of unadulterated culture, fine arts, martial arts,
handicrafts, herbal cures etc. The foreign tourists show keen interest in watching
the day-to-day activities of Indian villages. So Rural Tourism has a good chance of
development and popularity among domestic and foreign tourists. This shall help
in popularizing the rich cultural heritage of Tamil Nadu.
In 2004, the government of India has identified 31 villages across the
country as rural tourist spots. Among these, Karaikudi in Sivaganga district and
Kazhugumalai in Thoothugudi district are the two rural villages located in
Tamilnadu. Tamil Nadu is one of the top states which attract maximum number of
foreign tourists in India. During the year 2008, 646.58 lakhs tourists spent their
time in Tamil Nadu. The arrival of the tourist was 804.07 lakhs, during the year
2009. It has been found that the tourist arrival has an increase of 157.49 lakhs in
2009 when compared to the previous year. (Tamilnadu Tourism, policy note 2010-
2011). The tourist arrival was 926.28 lakhs and 987.75 lakhs for 2010 and 2011
respectively. (Tamilnadu Tourism, policy note 2011-2012, 2012-2013). Besides
the background of the economic development, potential of international tourism,
UN WTO recommends the participation of local communities and other
stakeholders in Tourism development. (www.tamiltourism.org)

29
The fundamental concept of rural tourism is to benefit the local
community by creating entrepreneurial opportunities, income generation,
employment opportunities, preservation and development of rural arts and
crafts, investment for infrastructure development and preservation of the
environment and heritage.
Development of “Rural Tourism” is undertaken with the assistance of
Government of India and United Nations Development Programme. Government
of India funds hardware infrastructure) component; United Nations Development
Programme funds software (Capacity Building) component and it is
implemented with the assistance of local NGOs. 18 Rural Tourism Projects have
been funded with a total outlay of Rs.6.21 Crores. Rural Tourism enables
exposure of children brought up in urban areas to rural life.
Rural Tourism spots in Tamilnadu
Karaikudi (Sivaganga district)
Kazhugumalai (Thoothukudi District)
Thadiyankudisai(Dindigul District),
Kurangani (Theni District),
30
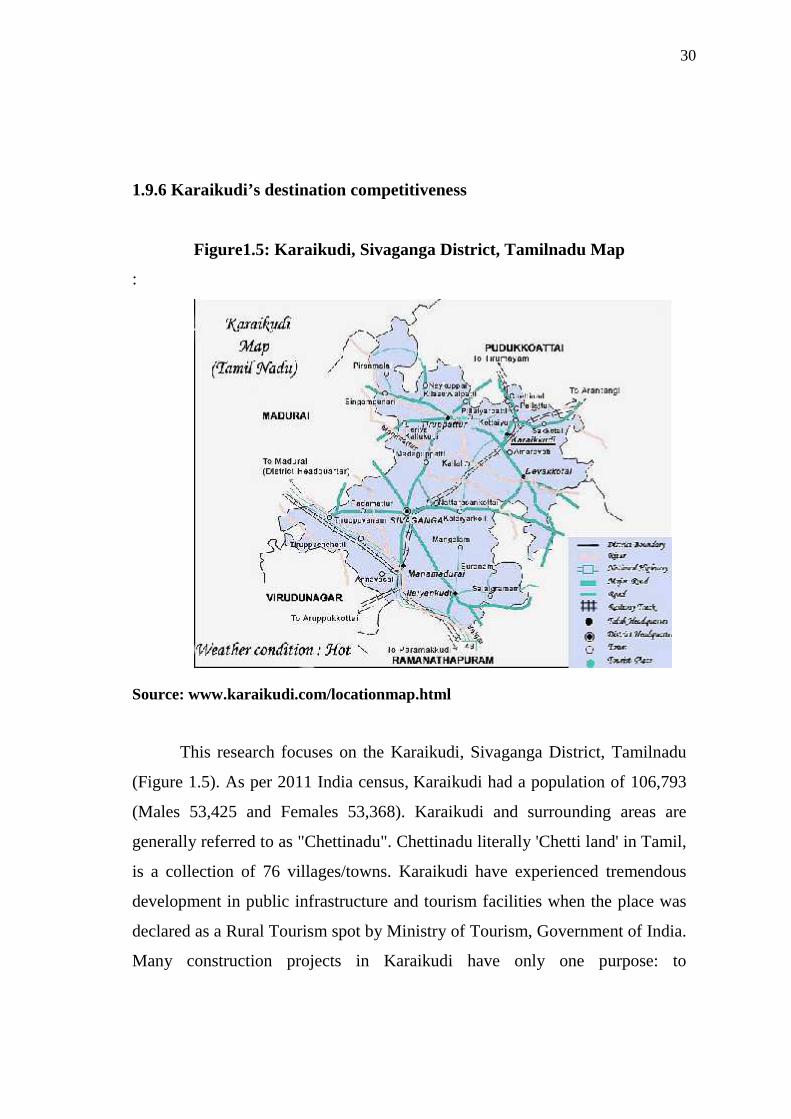
1.9.6 Karaikudi’s destination competitiveness
Figure1.5: Karaikudi, Sivaganga District, Tamilnadu Map
:
Source: www.karaikudi.com/locationmap.html
This research focuses on the Karaikudi, Sivaganga District, Tamilnadu
(Figure 1.5). As per 2011 India census, Karaikudi had a population of 106,793
(Males 53,425 and Females 53,368). Karaikudi and surrounding areas are
generally referred to as "Chettinadu". Chettinadu literally 'Chetti land' in Tamil,
is a collection of 76 villages/towns. Karaikudi have experienced tremendous
development in public infrastructure and tourism facilities when the place was
declared as a Rural Tourism spot by Ministry of Tourism, Government of India.
Many construction projects in Karaikudi have only one purpose: to
31
accommodate rural tourism development. To guide the progress of rural
tourism development in Karaikudi, the government prepared the Structure Plan,
which outlined the government policies and strategy for socio-economic and
physical planning and development for rural tourism.
Karaikudi is the bastion of Chettinad culture, captivating the visitor with
spectacular mansions, refined woodcarving and tangy Chettinad cuisine. The
Chettiar community, torch-bearers of modern banking, has now laid open
several of their magnificent homes, offering unique home-stay insights to the
venturing Chettinad spirit of enterprise. The visitor is welcomed to the family’s
history, the quest for success and the drive that has yielded these grandiose
buildings, their egg plastering technique leading on that magnificence to fine
silver handicrafts, woven saris, palm leaf baskets and unique hand-made
Athangudi tiles.
Ten villages and towns of Chettinad had been identified for their various
specialties. While Kanadukathan and Pallathur were notified for architecture,
Pillaiyar Patti for heritage temples, Kottaiyur and Karaikudi were noted as
famous for kandangi saris and wood carving. Brass metal work was famous in
Ariyakudi. Silver ornament and stone carving had earned a name for Kandanur
and Sakkottai respectively. Handmade tiles were really attracting tourists at
Athankudi. The focus would be to make the tourists visit all networking areas
and villages to market the area wise products of Chettinad. Self-help groups
were promoted to make use of the advantages of Chettinad tourism.
32
For development of Chettinad, Sivaganga District a sum of Rs. 50.00
lakhs was sanctioned under rural tourism during 2003-2004. Apart from this,
during 2004-05 Government of India has sanctioned Rs. 20.00 lakhs for rural
tourism project in Chettinad (soft ware components - Government of India
United Nations Development Programme Endogenous tourism project). Under
this scheme, apart from tourism promotion activities, promotion of activity
based self-help groups, skill buildings, linkages etc would be taken up.
1.10 STRUCTURE OF THE THESIS
Chapter 1 – Introduction
This chapter introduces the background of the study and the research
problems upon which the study is based. The research objectives and
hypothesis that are investigated in this study were presented and the
methodology adopted is briefly introduced. The relevant concepts and theories
of support for tourism destination competitiveness are delineated. A description
of the structural model to be tested in this study is presented. Contributions of
the study are discussed. Finally, the functional definitions were provided and
the limitations of the study were identified.
Chapter 2 – Review of Literature
This chapter starts with an extensive review of literature on the basis of
theoretical reviews and research reviews. It provides the summary of
contribution of various researchers to the field of tourism development impacts,
community participation and tourism support, identifies gaps in the literature,
examines various constructs of the research, and develops a theoretical
framework.
33
Chapter 3 – Research Methodology
The research methodology chapter describes in detail about the research
design, sampling design, the development of the survey instrument and scale,
sample size determination, method of data collection, tools used for data
analysis and the total frame work about this research.
Chapter 4 – Data Analysis and Results
This chapter reports the results of the empirical analyses of the proposed
theoretical model that was tested for the hypotheses and introduces the final
structural model for this study. It also reports the outcome of the focus groups
interview.
Chapter 5 – Conclusions and Discussion
This Chapter discusses the findings of the study; the implications and
conclusions of the research are delineated and future research suggestions and
directions based on this study are presented.
34
CHAPTER II
LITERATURE REVIEW
2.1 INTRODUCTION
This chapter reviews the literature of tourism development impacts,
Community participation, and stakeholders’ support for tourism development
and destination competitiveness. It consists of four parts: Rural Tourism
background literature, theoretical background, conceptual framework including
hypotheses and Tourism in India and Tamilnadu. In the first part, relevant
concepts and systematic approaches to tourism development and destination
competitiveness will be reviewed. This section serves as the research
background for the research problem and objectives. The second part provides
the theoretical framework by an introduction to background theories, such as
social exchange theory and stakeholder theory. Third part provides the
necessary background for the field’s research by showing the inter-relationships
between the theoretical background and framework constructs. Finally, an
overview of India’s and Tamilnadu’s historical, economic, political, and
tourism aspects is introduced.
2.2 TOURISM BACKGROUND LITERATURE
2.2.1 Perspectives on Rural Tourism
Rural tourism is an important trend in tourism since it satisfies the
current needs of the tourists that are unhappy with mass tourism. It constitutes
an alternative to traditional mass tourism.

35
Tourism is an economic activity that has often been cited, in relation to
rural economies, as a key strategy for regional development (Cawley &
Gillmor, 2007; Saxena et al., 2007; Fleisher & Falenstein, 2000). Negrusa et al.,
(2007) defines rural tourism as that form of tourism offered by people from
rural areas, with accommodation on small-scale and with the implication of
important components of their rural activities and customs of life. According to
(Roy A. Cook et al., 2007), tourism should be blended with the environment
and the local culture of an area. Tourism should evolve from the area’s natural
and historical/cultural attractions .With regard to principle of ecotourism, high
proportion of local materials should be used to fulfill tourists’ needs, from
construction materials to foodstuffs (Roy A. Cook et al., 2007).
Opperman (1997) argued that rural tourism can be defined as tourism in
a “non-urban territory where human (land related economic) activity is going
on, primarily agriculture. There is a growing consensus as to what actually
constitutes rural development activities which has expanded to include nature
conservation, region-specific products and rural tourism (Van der Ploeg et al.,
2000). Fleisher and Falenstein (2000: 1007) specifically state that “the
promotion of small scale tourism is intuitively perceived as a suitable form of
economic development for rural areas”. Rural spaces are no longer associated
purely with agricultural commodity production but are seen as locations for the
stimulation of new socio-economic activity (Na Gan et al., 2011). Tourism has
many potential benefits for rural areas (Frederick, 1992).
According to the Organization of Economic Co-Operation and
Development (OECD), rural tourism is defined as tourism taking place in the
countryside (Reichel et al., 2000). There are a variety of terms used to describe
36
tourism in rural areas, including farm tourism, agritourism, soft tourism and
even ecotourism (Beeton, 2006).Rural tourism provides employment for local
residents and prevents their immigration to cities (Sarjit S Gill, 2009). Rural
tourism can revitalize the conventional concepts and views on tourism, and
bring in a new dimension in the sustainable development (Sarjit S Gill, 2009).
Rural areas attract tourists because of their mystique and their distinct cultural,
historic, ethnic and geographic characteristics (Edgell & Harbaugh, 1993).
Roads and accommodation infrastructures were cited as the two main barriers
for growing rural tourism development (Sarjit S Gill, 2009). In fact, marketers
who do not promote the unique attributes of their destination may fail to attract
the interest of tourists (Fakeye & Crompton, 1991).
Destinations with strong, positive images are more likely to be chosen in
the travel decision process (Goodrich, 1978; Woodside & Lysonski, 1989).
According to Bontron and Lasnier (1997) rural tourism impact varies greatly
among rural regions and depends on a host of factors including work force
characteristics and seasonality issues. A model of integrated rural tourism,
which took account of the various resources (cultural, social, environmental,
economic), their use, and the role of pertinent stakeholders, was developed to
explore effective methods of promoting tourism as part of a rural development
strategy(Mary Cawley et al., 2008). Set of community-based rural tourism
development indicators can serve as a starting point for devising a set of
indicators at the local and regional level in order to be useful rural tourism
sector manager and administrators (Duk- Byeong Park et al., 2011).Butler et al.
(1998) note economic and social forces operating at the global level are
determining both the nature and form of the rural landscape and how we value
and use it.

37
2.2.1.1 Rural tourism –A multi-faceted activity
Rural tourism is a multi-faceted activity: it is not just farm-based tourism.
It includes farm-based holidays but also comprises special interest nature
holidays and ecotourism, walking, climbing and riding holidays, adventure, sport
and health tourism, hunting and angling, educational travel, arts and heritage
tourism, and, in some areas, ethnic tourism. There is also a large general interest
market for less specialised forms of rural tourism. The major requirement of the
main holiday is the ability to provide peace, quiet and relaxation in rural
surroundings; Because rural areas themselves are multi-faceted and rarely either
static entities or self-contained, and free from urban influence, a working and
reasonably universal definition of the subject is difficult to find. However, in
almost every case rurality is the central and unique selling point in the rural
tourism package. The search for a definition must, therefore, begin with an
understanding of the concept of rurality itself.
The definition given by the European Commission divides the definition of
rural tourism into two trends. The distinction used is the percentage of revenue
benefiting to the local community. The term ‘rural tourism’ is used when the
rural culture is a key component of the product.
Depending on the key activity proposed by this product, the terms ‘nature’,
‘agri’, ‘green’, ‘eco’, etc. are used. A more precise definition of each term can
be given.’ Rural tourism’ is a kind of tourism where the rural culture is a key
component.
38
‘Nature tourism’ is a kind of tourism where the observation and appreciation of
nature is the principal component (World Tourism Organization, 2002).
In ‘green tourism’, the landscape is a key variable and the principal
objective is the integration of the visitor into the local natural and human
environment (Garcia Henche, 2003).
‘Agri-tourism’ is an important part of rural tourism since the aims of
developing rural tourism are often to increase the revenue of farmers. The first
characteristic of ‘agri-tourism’ is that it is the business of farmers. It has to be
related to the agricultural activities and to complement the revenue of farmers
(Garcia Henche, 2003).
‘Sports tourism’ uses the natural environment as a resource and a base for
the practice of a sport activity (Garcia Henche, 2003).
The term ‘eco-tourism’ is used when the priority is to preserve the natural
environment where the activity takes place (Garcia Henche, 2003).
A definition according to Mac Nulty, P., (2002) in WTO Seminar, oriented
towards the alternative that rural tourism represents to mass tourism. It explains
that tourists seek “rural peace”, that rural tourism “is tourism away from areas of
intensive tourism activity” and that “it is engaged in by visitors who wish to
interact with the rural environment and the host community, in a meaningful and
authentic way”.

39
Rural tourism has to be adapted to the needs of the tourist, respond to the
needs of the local communities, be socio-economic and culturally well planned
and environmentally sound. The tourism must offer products that are operated
in harmony with the local environment, community attitudes and culture so that
they become permanent beneficiaries and not the victims of tourism. The basic
cultural identity of these local people should not be adversely affected.
Sustainability also ensures economically sustainable development process in
the efficient management of resources and such management to ensure that the
resource supports the future as well as the present generation.
Thus sustainable rural tourism aims to:
Improve the quality of life of people.
Provide good experience to the tourists
Maintain the quality of environment that is essential for both tourists and
the local community.
A scheme of sustainable development of the region (Figure 2.1)
Figure 2.1 A scheme of sustainable development of the region
Source: [P. Y. Baklanov, 2007, “Model of SD"]
Rural tourism includes a large variety of guest housing ways, activities,
events, festivities, sports and entertainment, and all happen in a typically rural
environment. It is a concept which covers touristic activity organized and led
by rural local people and which generates from a tight contact with the natural
and human environment. The village is something special for urban people:
human dimension, local village life, local arts and crafts, local pub, school, the
church, places that have been marking people’s lives for centuries. Here live
40
craftsmen, marketers, small investors, local actors who make village life easier.
It also represents the cradle of the most beautiful feasts, wedding and
christening customs, or those specific to winter time. The farm, the rural village
and space, taken together or separately, represent the charm of rural tourism
through attractiveness. Rural tourism must be understood as a form of activity
that provides urban dwellers the most adequate conditions of therapy against
stress, created by the uproar of everyday life. This form of tourism is strongly
influenced by psychological factors and mainly addresses nature lovers, those
who know how to use it for the benefit of their own health and mental comfort,
without destroying it.
Major attractive rural events: trades and crafts; peasant clothes, dances
and songs; traditional feasts; peasant architecture and technical equipment;
human communities. Trades and crafts show a great regional diversity. The
way rural people make their lives differ from a climatic type to another. They
are so attractive because the way they are used is different, as well as the tools
that are used, or the final result of human activities. Such trades and crafts are:
Cuisines, farm animals breeding, wood working, hunting and fishing, bee-
breeding, gold and iron working, pottery, spinning, weaving, whitewashing, etc.
According to (Garcia Ramon et al. 1995), tourism would be the 'saver' to
improve the quality of life in the countryside and slow down the rural migration
especially in less developed regions. Tourism would generate additional income
for farm and rural families and create new jobs, lead to the stabilization of the
rural economy, provide support to existing business and services, and
contribute to creating new ones.
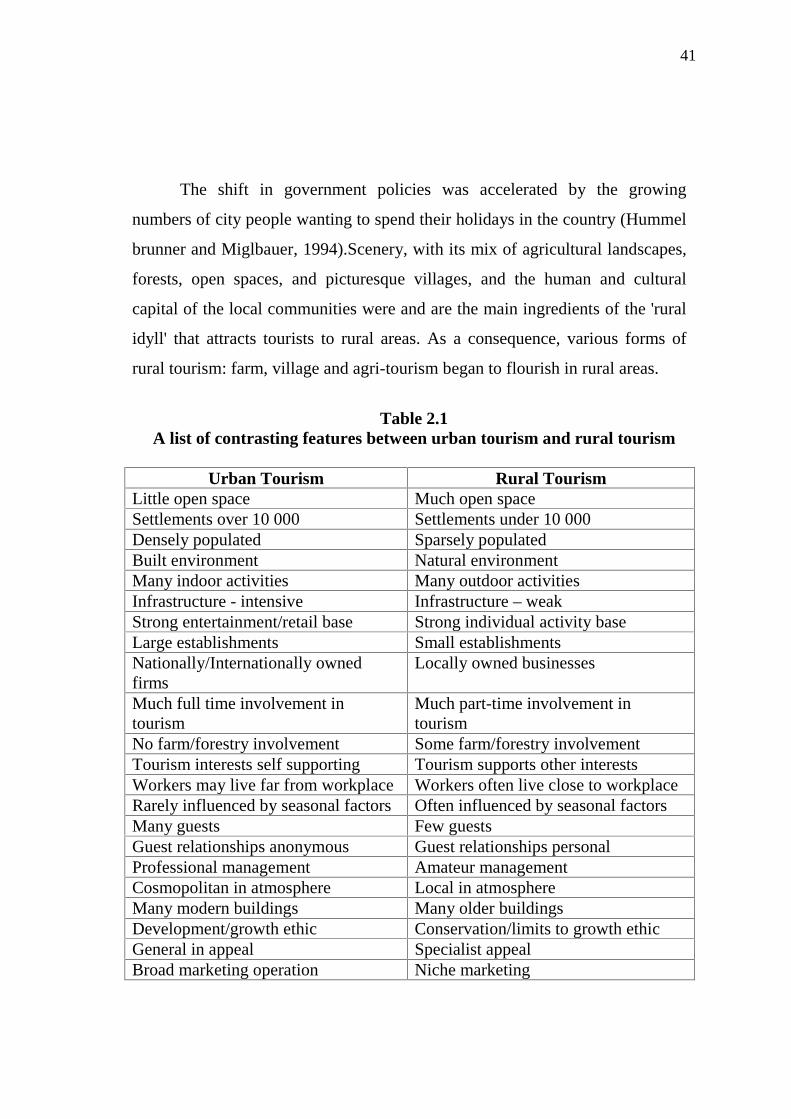
41
The shift in government policies was accelerated by the growing
numbers of city people wanting to spend their holidays in the country (Hummel
brunner and Miglbauer, 1994).Scenery, with its mix of agricultural landscapes,
forests, open spaces, and picturesque villages, and the human and cultural
capital of the local communities were and are the main ingredients of the 'rural
idyll' that attracts tourists to rural areas. As a consequence, various forms of
rural tourism: farm, village and agri-tourism began to flourish in rural areas.
Table 2.1A list of contrasting features between urban tourism and rural tourism
Urban Tourism Rural TourismLittle open space Much open spaceSettlements over 10 000 Settlements under 10 000Densely populated Sparsely populatedBuilt environment Natural environmentMany indoor activities Many outdoor activitiesInfrastructure - intensive Infrastructure – weakStrong entertainment/retail base Strong individual activity baseLarge establishments Small establishmentsNationally/Internationally ownedfirms
Locally owned businesses
Much full time involvement intourism
Much part-time involvement intourism
No farm/forestry involvement Some farm/forestry involvementTourism interests self supporting Tourism supports other interestsWorkers may live far from workplace Workers often live close to workplaceRarely influenced by seasonal factors Often influenced by seasonal factorsMany guests Few guestsGuest relationships anonymous Guest relationships personalProfessional management Amateur managementCosmopolitan in atmosphere Local in atmosphereMany modern buildings Many older buildingsDevelopment/growth ethic Conservation/limits to growth ethicGeneral in appeal Specialist appealBroad marketing operation Niche marketing

42
2.2.1.2 Tourism as a tool for local development
If rural tourism can partly be explained by the fact that it represents what
tourists need and want, the importance of rural tourism can also be explained by
the fact that it has been seen by the governments as a way to help rural areas to
develop.
Many researchers (e.g. Hall, Jenkins, 1998, etc) agree to say that tourism
is used to achieve several goals that can be:
- to sustain and create local income, employment and growth,
- to contribute to the costs of providing economic and social infrastructure,
- to encourage the development of other industrial sectors,
- to contribute to local resident amenities and services,
- to contribute to the conservation of environmental and cultural resources.
The main objective of rural tourism development is the increase of
quality of life for local residents through the achievement of social and
economic goals.
The tools of the governments to achieve these goals are framing policy
instruments that can influence the actions of the economic agents by providing
financial incentives for appropriate behavior or disincentives for inappropriate
ones (Hall and Jenkins, 1998).As rural tourism is part of local development, it is
a way to involve every people, not only because he can have a project, but also
“as a member of the local community and potential beneficiary of the expected
collective development” (Thibal, 1988).
According to Keane (2000) “lack of economic diversity is the main
reason for the rural development problem”. Economic diversification brings
43
stability and growth to the community. He insists on the fact that “in many
ways, development is something that occurs because of necessity”. Houee
(1989) has got the same point of view and insists on the fact that initiatives are
coming from the awareness that local community have of the problem. The
strength of rural tourism as a tool for development is that it is based on the
natural and human environment of the countryside. It is based on local
resources. Besides, the development of rural tourism not only leads to the
improvement of the structures for the tourists. Tourism is part of a global
process of improvement of the quality of life, for the tourists as well as for the
residents. In fact, if a territory is more attractive for tourists, it will also be more
attractive for new and current residents.
As a whole, tourism promises 16 potential benefits to rural development.
They are outlined in detail below.
1. Job retention is extremely important in rural areas where employment
decline is often common. Tourism cash flows can assist job retention in
services such as retailing, transport, hospitality and medical care. It can
also provide additional income for farmers, for foresters and Craftsmen.
Job retention helps the viability of small communities.
2. Job creation typically occurs in the hotel and catering trades, but can
also take place in transport, retailing, and in information/heritage
interpretation. Farmhouse accommodation and bed-and-breakfast, hotels
and caravan/campsites
3. Job diversity is encouraged by rural tourism development. Most rural
areas have little job variety outside farming and basic services. Better
job diversity enriches rural society, and helps retain population levels.
44
4. Pluriactivity is the term used when an individual or family carries out
more than one type of job to maintain their income. A part-time farmer
could also offer accommodation, assist the local administration in
service tasks and act as a ski-instructor. It is especially important in the
rural context because of the cultural importance of the family as a unit in
many traditional societies.
5. Service retention is very important in rural areas: rural tourism can
assist in three ways. Visitor information services can be provided by
existing outlets, such as shops, thus increasing income flows if payment
is made for acting as information outlets. Services can also benefit by the
additional customers which visitors provide. Finally, tourism’s
importance to national economies can strengthen the political case for
subsides to help retain services.
6. Farm support is a major issue on all political agendas. Many studies
have shown that farm incomes can be bolstered by rural tourism, through
accommodation enterprises of all kinds, by developing open farms and
other attractions, by increased sales of farm produce, and by increasing
female activity rates through additional off-farm employment. Visitors
bring variety and company to what can be a lonely and limited life style.
7. Forestry is an important activity in many upland and climatically
marginal regions. Rural tourism can assist forestry by diversifying
income sources for forest communities if the special qualities of the
forest environment for recreational use are realized and developed.
8. Landscape conservation has become an increasingly important form of
heritage protection. Landscape is of crucial importance to rural tourism
but, equally, visitor use is vital to the landscape conservation industry.
Visitor use brings political benefits, can bring economic gains, and can

45
provide jobs in maintaining and repairing traditional landscapes worn by
recreational activities.
9. Smaller settlements in the countryside have always been at greater risk
of losing viability because they are unable to support the many services
which now require larger threshold populations to support them. Rural
tourism can assist these smaller settlements to survive, because smaller
places have a special attraction for visitors. Careful management of this
process is required.
10. Rural arts and crafts have a special place in the cultural heritage of
regions and nations. Many commentators have noted that tourism can
assist arts and crafts, both by recognising their importance, and by
purchasing craft products. Income flows from these activities are well
documented. Support between the arts and tourism can be a two-way
process. Many communities now use arts and crafts festivals as a
marketing mechanism to encourage visitors to come to their areas.
11. Cultural provision has always been restricted in rural areas. The lack of
major facilities such as theatre, opera, music and galleries has been one of
the many factors encouraging rural depopulation. The festivals and other
events have enabled rural areas to broaden their cultural provision, buying
in artists and ensembles and supporting those purchases by ticket sales to
visitors.
12. Nature conservation, like landscape conservation, is a stated goal of
most modern governments. It is, however, an expensive process. Rural
tourism can valorize nature conservation in a monetary sense. Many
estimates have been made of the value of nature to tourism
13. The historic built environment can benefit from rural tourism in two
ways. Many historic properties now charge for admission in order to
46
maintain their fabrics and surrounding gardens and parklands. Secondly,
there are important buildings from the past which have become redundant.
The tourist industry can usually use these redundant buildings profitably
and imaginatively: they can become attractions in their own right.
14. Environmental improvements such as village paving and traffic
regulation schemes, sewage and litter disposal can be assisted by tourism
revenues and political pressures from tourism authorities. These help
develop pride of place, important in retaining existing population and
businesses, and in attracting new enterprises and families.
15. The role of women within the rural community was, in the past, a
restricted one. Farming, forestry and mining were very much male
occupations. Alternative jobs for women were few. Women were rarely
involved in local politics. The widespread liberation of women, coupled
with the possibilities which rural tourism offers, have together done much
in many areas to release the under-utilized talents and energies of the
female half of the population. The development of the role of women
could do much for the economic and social well-being of many rural
areas.
16. New ideas and initiatives will be essential if rural communities are to
prosper into the twenty-first century. Efforts to support agriculture,
forestry and service provision by state subsidies have done much to
develop a culture of dependency within the countryside. The new
challenges and the fiercely competitive nature of the tourism market
could do much to encourage enterprise and new methods. There is also
evidence that rural tourism can act as a catalyst to bring new businesses
of many kinds into rural communities.
47
2.2.2 Tourism and its Systematic approaches
A number of systematic approaches have been proposed in the tourism
literature to understand tourism components, and their functioning or
interactive roles (Leiper, 1979, 1990; Pearce, 1995; Mill & Morrison, 1995;
Witt & Moutinho, 1994). The researchers suggested two approaches: the origin
destination tourism system and the functioning tourism system in explaining
tourism as a system. In the origin-destination tourism system, tourism consists
of two types of region: an origin, is the region or country generating the
tourists, and a destination, is the locations visited by tourists. (Witt &
Montinho, 1994). An origin represents the demand-side of the tourism system
and a destination represents the supply-side of tourism, in that a certain region
or country may have specific powers of attraction to entice visitors (Uysal,
1998).
One of the core components of the regional and international tourism
system is the tourist destination. It comprises of multifaceted elements such as
natural resources (e.g. climate, water and landscape), authentic human
resources (e.g. culture and history) and industrial resources (e.g. museums,
theme parks, facilities, infrastructure and other physical attractions) (Butler
1999).
Murphy (1985) perceived tourist destinations as a marketplace where
supply and demand characteristics push for attention and consumption,
suggesting that the tourism resources base is a combination of physical and
human resources. Meanwhile, Hu and Ritchie (1993) conceptualized the tourist
destinations as “a package of tourism facilities and services, which like any
other consumer product, is composed of a number of multi- dimensional
attributes”. Smith (1994) acknowledged the importance of travel services in
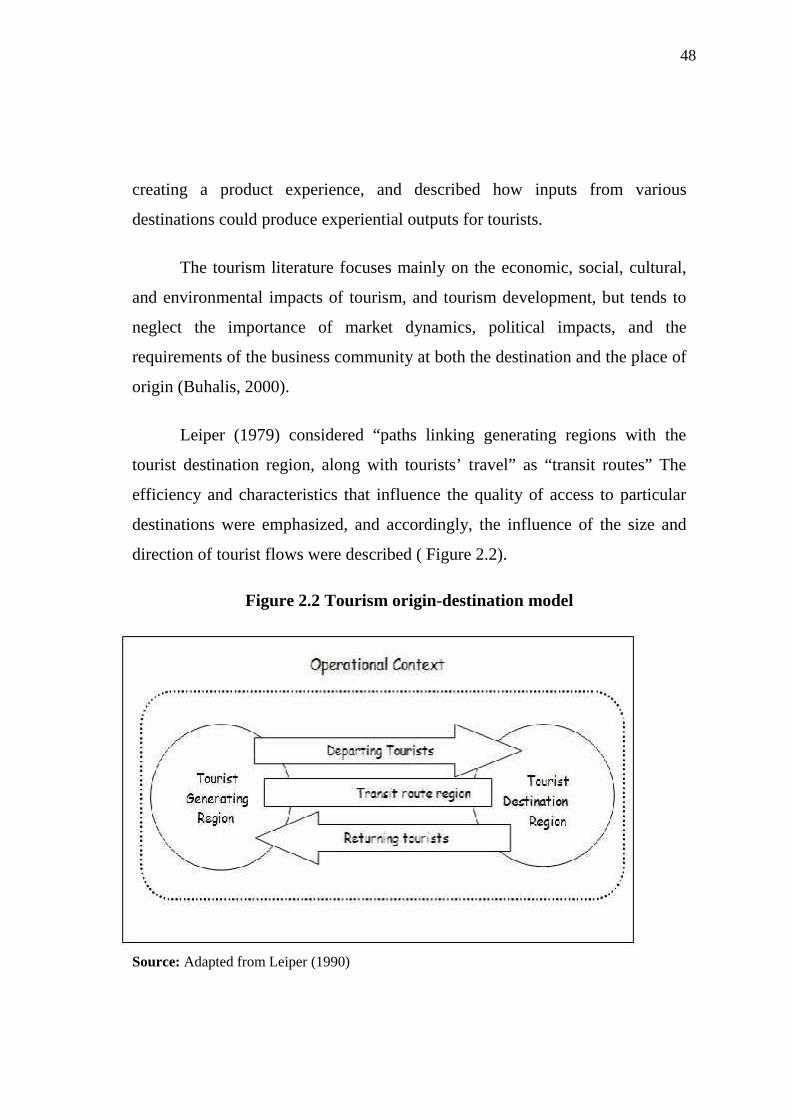
48
creating a product experience, and described how inputs from various
destinations could produce experiential outputs for tourists.
The tourism literature focuses mainly on the economic, social, cultural,
and environmental impacts of tourism, and tourism development, but tends to
neglect the importance of market dynamics, political impacts, and the
requirements of the business community at both the destination and the place of
origin (Buhalis, 2000).
Leiper (1979) considered “paths linking generating regions with the
tourist destination region, along with tourists’ travel” as “transit routes” The
efficiency and characteristics that influence the quality of access to particular
destinations were emphasized, and accordingly, the influence of the size and
direction of tourist flows were described ( Figure 2.2).
Figure 2.2 Tourism origin-destination model
Source: Adapted from Leiper (1990)

49
2.2.3 Tourism Planning and Development concepts
In the context of planning and development, tourism is defined as an
interdisciplinary, multi-faceted phenomenon that entitles the interrelated
components of tourism products, activities, and services provided by the public
and private sectors (Gunn, 1994; Pearce, 1995). Tourism planning is a process
of evaluation and analysis of related issues, including not only the
determination of goals, but also the development of different methods and
actions to further decision-making. Murphy (1985) in his study said that
tourism planning should fit within existing systems and should be used in urban
and regional development strategies. He also added that, community
involvement should be there for the planning process.
To have comprehensive tourism planning, the existing components and
resources that include tourism attractions, destination management
organizations (DMO), markets, and local related businesses and services within
a given region or destination, should be considered.
Tourism planning requires certain systematic processes and approaches.
Inkeep (1991) described several different approaches to tourism planning. The
approach which is frequently applied in tourism planning and development is
the community approach shows maximum involvement and participation of the
local community in the tourism planning process is sought (Inkeep, 1991).
Specifically, two different perspectives of community participation have been
discussed, including the decision making process and the benefits of tourism
development to the community (McIntosh & Goeldner, 1986; Timothy, 1999).
50
Among the various theory and conceptual models associated with the
examination of resident reactions to tourism, Butler’s (1980) destination
lifecycle model, Doxey’s (1975) Irridex model and, insights derived from
recent social exchange theory described by Ap (1992), Nash, 1989; Perdue et
al., 1990) stand out as significant contributions. Synthesizing these different
perspectives of tourism models, two broad dimensions of the tourism
development/community interface upon which they focus have been identified:
(1)The extrinsic dimension, which refers to characteristics of the location with
respect to its role as a tourist destination — including the nature and stage of
tourism development in the area and, reflecting this, the level of tourist activity
and the types of tourists involved; and
(2) The intrinsic dimension, which refers to characteristics of members of the
host community that affect variations in the impacts of tourism within the
community.
The variables associated with each dimension are summarized in Table 2.2,
where their broad alignment with the theoretical perspectives is also indicated.
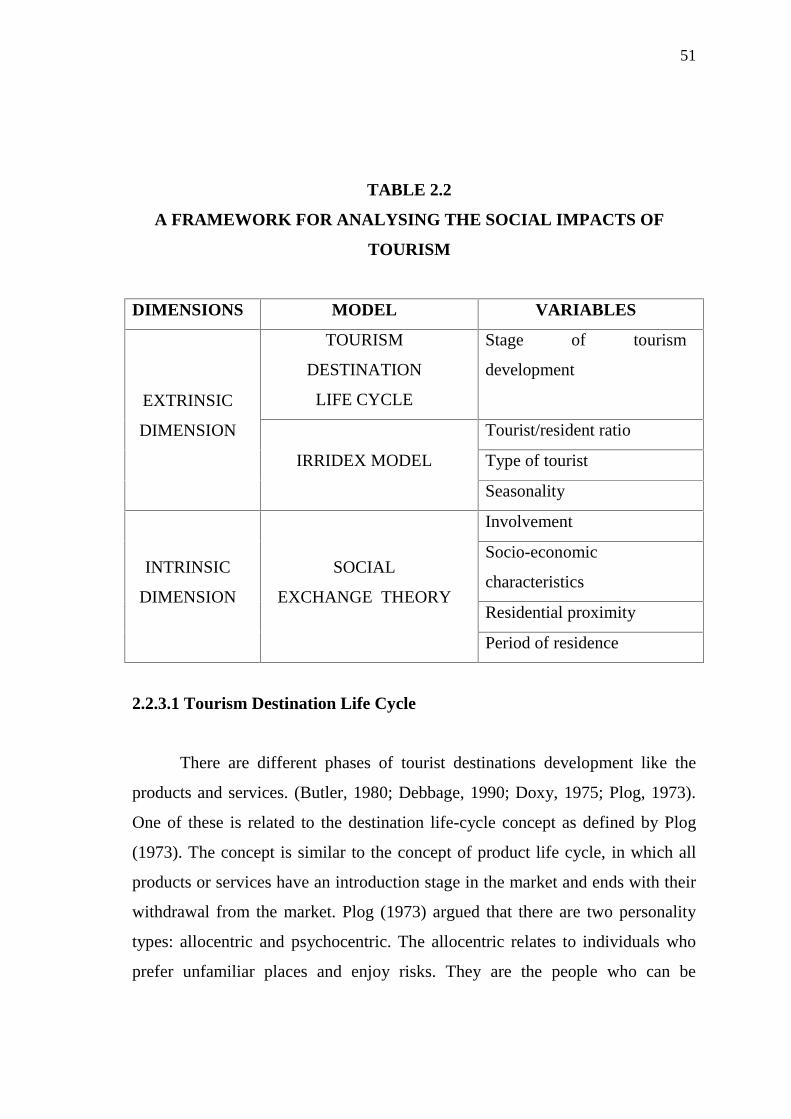
51
TABLE 2.2
A FRAMEWORK FOR ANALYSING THE SOCIAL IMPACTS OF
TOURISM
DIMENSIONS MODEL VARIABLES
EXTRINSIC
DIMENSION
TOURISM
DESTINATION
LIFE CYCLE
Stage of tourism
development
IRRIDEX MODEL
Tourist/resident ratio
Type of tourist
Seasonality
INTRINSIC
DIMENSION
SOCIAL
EXCHANGE THEORY
Involvement
Socio-economic
characteristics
Residential proximity
Period of residence
2.2.3.1 Tourism Destination Life Cycle
There are different phases of tourist destinations development like the
products and services. (Butler, 1980; Debbage, 1990; Doxy, 1975; Plog, 1973).
One of these is related to the destination life-cycle concept as defined by Plog
(1973). The concept is similar to the concept of product life cycle, in which all
products or services have an introduction stage in the market and ends with their
withdrawal from the market. Plog (1973) argued that there are two personality
types: allocentric and psychocentric. The allocentric relates to individuals who
prefer unfamiliar places and enjoy risks. They are the people who can be
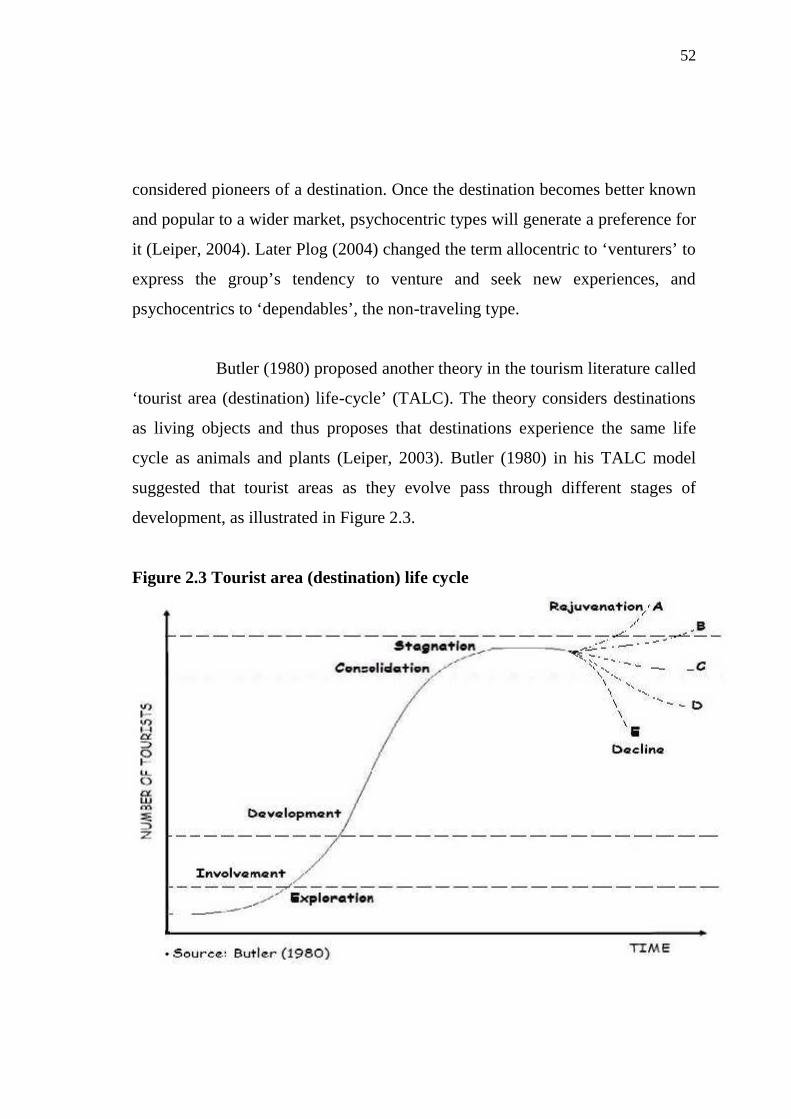
52
considered pioneers of a destination. Once the destination becomes better known
and popular to a wider market, psychocentric types will generate a preference for
it (Leiper, 2004). Later Plog (2004) changed the term allocentric to ‘venturers’ to
express the group’s tendency to venture and seek new experiences, and
psychocentrics to ‘dependables’, the non-traveling type.
Butler (1980) proposed another theory in the tourism literature called
‘tourist area (destination) life-cycle’ (TALC). The theory considers destinations
as living objects and thus proposes that destinations experience the same life
cycle as animals and plants (Leiper, 2003). Butler (1980) in his TALC model
suggested that tourist areas as they evolve pass through different stages of
development, as illustrated in Figure 2.3.
Figure 2.3 Tourist area (destination) life cycle

53
Note:
Exploration: characterized by small numbers of tourists;
Involvement: the number of visitor increases and the local residents will start to
become
involved by providing facilities to visitors;
Development: identified with well-developed tourist market and planned
advertising by the tourist-generating areas;
Consolidation: the rate of increase in numbers of visitors will start to decline
even though the total number is increasing;
Stagnation: the peak numbers of visitors will have been reached; the area will
have
established its image but will no longer be attractive;
Decline: the area will not be able to compete with new attractions and new
entrants into the tourism market; and
Rejuvenation: may occur if new man-made attractions are added or advantage is
taken of unutilized natural resources.
Many researchers considered the TALC model as useless and misleading,
as it did not explain the fluctuation in tourist numbers. They also argued that it
cannot be applied to all destinations as each destination is a unique case, thus
enhancing the success of tourism planning.
The outcome of many researchers is TALC model can be used for the
purpose of planning and to identify alternative strategies for the development and
marketing of a tourist destination (Choy, 1992). Even though the model has not
been tested on the Tamilnadu rural tourism case, the tourism authority in India
has placed Karaikudi in the developmental stage (Ministry of Tourism, 2006).
54
2.2.3.2 DOXEY'S IRRIDEX MODEL (1975)
In order to clarify the relationship between the impacts of tourism and
residents’ attitudes toward tourism, several models have been developed. One of
the most influential models is Doxey’s Irridex model (1975) which suggests that
residents’ attitudes toward tourism may pass through a series of stages from
“euphoria,” through “apathy” and “irritation.” to “antagonism,” as perceived
costs exceed the expected benefits. (Table 2.3) This model is supported by Long
et al.’s (1990), which indicate residents’ attitudes are initially favorable but
become negative after reaching a threshold. The Irridex model indicates that
residents’ attitudes toward tourism would change over time within a predicable
one-way sequence. It suggests that residents’ attitudes and reactions toward
tourism contain a sense of homogeneity (Mason et al. 2000).
Doxey's irritation index model
suggests that communities pass through a sequence of reactions as the
impacts of an evolving tourism industry in their area become more
pronounced and their perceptions change with experience.
justifies residents' attitudes at different growth stages of a tourist
destination.
assesses host – guest interactions and relationships.
is not based on detailed empirical research, but mainly on conjecture.
Limitation of this framework is the assumption that homogeneity
characterises a community.
The model assumes that it is the whole community that becomes hostile to
tourism, but often communities are heterogeneous and different sections
of the community have different reactions.

55
Entrepreneurs are likely to welcome any growth in tourism, as might any
unemployed people.
the model does postulate that the more common an identity is felt by a
community, the more likely it is able to make a constructive response
about what levels and types of tourism it wishes to host.
is simplistic but it does indicate a telling factor in tourism development,
and that is unbridled development will create
These stages parallel the more generally applicable product life cycle and
they are, implicitly, accompanied by increasingly adverse effects on the
local community as the nature of tourism in the area becomes
progressively mass-tourism oriented
associated reciprocal reactions of the community influence the
progression of Stages by undermining the appeal of the area to tourists
and thus reducing its viability as a tourist destination.
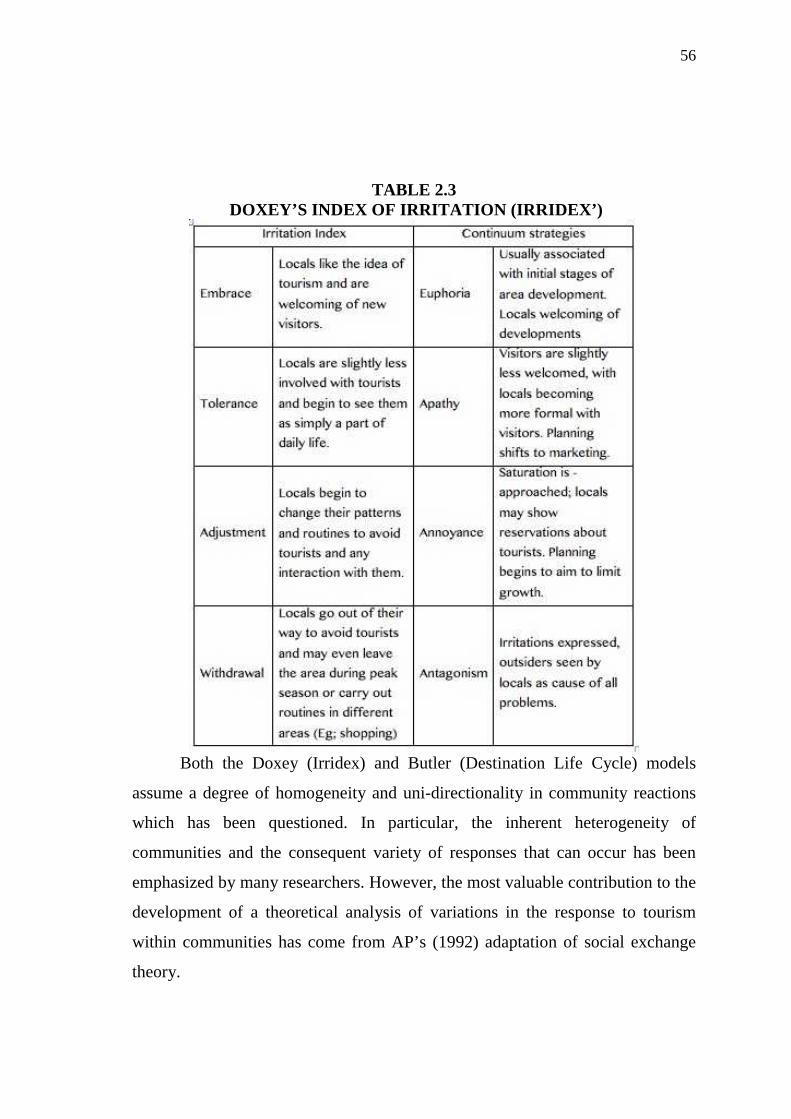
56
TABLE 2.3DOXEY’S INDEX OF IRRITATION (IRRIDEX’)
Both the Doxey (Irridex) and Butler (Destination Life Cycle) models
assume a degree of homogeneity and uni-directionality in community reactions
which has been questioned. In particular, the inherent heterogeneity of
communities and the consequent variety of responses that can occur has been
emphasized by many researchers. However, the most valuable contribution to the
development of a theoretical analysis of variations in the response to tourism
within communities has come from AP’s (1992) adaptation of social exchange
theory.
57
2.3 THEORETICAL BACKGROUND OF TOURISM THEORIES
Though many different disciplines have addressed the issue of tourism
development in general, there is a lack of so-called 'tourism theory' (Jafari,
1990). Rural tourism, in particular seems to be the 'poor relation', although
there are some exceptions to this commonly ignored issue. In this theoretical
'gap', tourism development has been studied from perspectives that reflect
several disciplines (i.e. geography, sociology, anthropology and economy).
Of special interest were those perspectives on and models of tourism
development that address the relationship between tourism development and
the local community, especially from the point of view of the formulation of
tourism policy at the local level and its implementation. Most models are
discussed within the tourism planning field, although issues such as policy and
politics of tourism development at the local as well as national level, are
generally neglected (Hall, 1994). However, it could be observed that there is
growing recognition of the finite limitations to tourism development not only in
terms of the environmental but as well as social impacts. 'Residents' responsive
tourism' (Ritchie, 1993), 'community-based' or 'community-driven' tourism
(Murphy, 1988), and 'sustainable community tourism' (Joppe, 1996) are the
buzz words of tomorrow.
Many authors argue (Pearce et al., 1996; Inskeep, 1991) that the role of
the local community must be centrally placed in sustainable tourism
development. In order to give it this central role it is crucial to understand the
internal dynamics and politics before any development can be considered (Hall,
1994; Reed, 1997).The majority of works on sustainable tourism development

58
places emphasis on the physical environment, and the views of local people are
in most cases of only peripheral interest (Jones, 1993; Joppe, 1996). Studies
that do have an important human aspect either make reference to the impacts of
tourism on communities already involved in tourism, or lay emphasis on local
community's involvement in tourism development without coming to grips with
the reality in which tourism develops and in which it will be continued (Hall,
1994; Pearce et al., 1996).However, such studies do not give enough weight to
the fact that people are engaged in many other activities, of which rural tourism
is perhaps one of many possible directions or options for their own and their
community's development. Most models give scant attention to such factors,
seeing local actors as merely pawns in the game of rural tourism.
None of the models mentioned look at the development of rural tourism
from the perspective of the local community and its members. More
importantly none of them focuses on the ideas that the members of the local
community have in mind for developing their community and area which will
include opportunities as offered by the ideals of rural tourism. Rural tourism
does not develop in a vacuum and local recipients of tourism opportunities are
not passive recipients of the consequences or impacts of tourism. Therefore,
issues that need to be explored are namely, the social and political context and
relationships that provide the context of rural tourism development, and the
context in which local people themselves have agency, thus capabilities to
'make a difference'. Thus, the aim is to understand the process of rural tourism
development, especially in relation to the participation of different (local and
external) stakeholders of the rural destinations, to know how the terms of
development are negotiated among them.

59
Various theoretical conceptions and models have been developed my
many researchers to explain the nature of residents’ perceptions and attitudes
towards the impacts of tourism. Nevertheless, most of the studies related to
relationships between different stakeholders in destination development, and
residents’ attitudes and perceptions have utilized the social exchange theory.
This theory has put forth the way to develop an understanding of residents’
perceptions and attitudes (Ap, 1992; Perdue et al., 1990).
2.3.1 The Social Exchange Theory
The social exchange theory explains how people react to and support
tourism development (Ap, 1992; Jurowski et al., 1997; Perdue et al., 1990;
Yoon et al., 1999, 2000). Social exchange theory has its origin in many
disciplines like anthropology (Levi-Strauss, 1969), economics (Blau, 1968,
1991), behavior psychology (Homans, 1991), and social psychology
(Chadwick-Jones, 1976). The common assumption that can be found in those
theoretical thoughts is “utilitarianism”.
From the perspectives of economists’ the people were seeking to
maximize their material benefits, or utility, from transactions or exchanges with
others in a free and competitive market (Tuner, 1986). In addition, the
utilitarian principle proposes that people rationally weigh costs against benefits
to maximize material benefits” (Turner, 1986).
Blau (1968) highlighted that the assumptions of the economics of social
exchange are that people try new social associations in the expectation of
intrinsic and extrinsic rewards, even though they continue their older
60
associations with others while they find them to be rewarding. He outlined the
difference between social exchanges and economic exchanges as based on the
assertion that obligations and costs incurred in social transactions are not
specified in advance, as they are in economic transactions. His assumed that
people’s choice between different social relations does not imply that they have
to choose the one which yields them the most profit to maximize benefits (Blau,
1964; Chadwick-Johns, 1976).
Anthropologists have identified that social interaction is done in not only
economic exchanges but also in symbolic exchanges or social relationships.
Under social or structural patterns, exchanging commodities among peoples
serves to satisfy their basic economic needs. (Turner, 1996) viewed that
exchange theory involves sustaining exchange relations due to the forces of
psychological needs rather than economic needs. Symbolic exchange is
emphasized for both individual psychological processes and patterns of social
integration. Levi-Strauss (1967), who developed a structural exchange
perspective, said that exchange must be viewed according to its function in
integrating the larger social structure. The exchange behavior can be explained
by viewing the consequences or functions of norms and values. As a result, this
structural view of exchange contributes that various forms of social structure
are critical factors in explaining exchange relations.
Some social exchange theorists modify this principle by affirming
alternative assumptions. Homans (1967) in his study stated that “humans do not
pursue to maximize profits, but they always attempt to make some profit in
their social transaction with others. Humans are not perfectly rational, but they
do engage in calculations of costs and benefits in social transactions.
61
Social exchange theory in the behavioral psychology perspective is
based on the principle that people are reward-seeking and they pursue
alternatives that will yield the most reward and the least punishment
(Chadwick-Jones, 1976). Psychological rewards and punishment are reconciled
with economic benefits (utility) and costs. Thus, the notion of reward and
punishment is used to reinterpret the utilitarian exchange heritage so that the
reward is used to reinforce or meet the needs of the people, and punishment is
used to deny reward. Thus, people will behave so as to yield the most reward
and the least punishment and also will repeat those behaviors that have proved
rewarding in the past.
2.3.2 The Social Exchange Theory and Tourism
In the tourism literature, a number of researchers have applied the
theoretical concepts of social exchange theory to explain residents’ reactions to
tourism planning and development (Ap, 1990, 1992; Jurowski et al., 1997;
Lindberg & Johnson, 1997; Madrigal, 1993; Mihalik, 1992; Perdue et al, 1987,
1990; Yoon, 1998; Yoon et al., 2000). Most of the studies have focused on how
residents assess the benefits and costs of tourism development and have
explained residents’ support for future tourism development in particular region
based on their evaluations of the benefits and costs of tourism (e.g. Jurowski et
al., 1997; Yoon et al., 2000).
Social exchange theory can be applied to residents’ attitudes on the basis
that residents seek various benefits in exchange for what they are able to offer
to different tourism agencies, such as resources provided to tourism developers,
tour operators, and tourists; support for tourism development; and being

62
tolerable towards the negative impacts created by tourism(Teye et al. 2002).The
community participation and involvement in tourism development and
decision-making processes tend to increase the viability of the exchange
process and create cohesiveness between residents’ expectations and tourism
development.
Harril,(2004) stated that the social exchange theory involves the trading
and sharing of tangible and intangible resources between individuals and
groups, where resources can be material, social, or psychological in nature.
Further many tourism researchers developed an interest in evaluating the
economic benefits of tourism development, which may come at the potential
detriment of social, cultural, and environmental impacts (Harril, 2004).
Perdue et al. (1990) revealed that social exchange theory is a basis for
investigating residents’ attitudes about tourism. They concluded that support for
additional development was positively related in the case of people who
perceived positive impacts from tourism, and negatively correlated in the case
of people who perceived negative impacts from tourism.
Madrigal (1993) revealed that this theory is related to an economic
analysis of interaction that focuses on the exchange and mutual dispensation of
rewards and costs between tourism actors. He also pointed out that the
underlying assumption of this exchange is a disposition to maximize the
rewards and
Participation of community (residents, government, and entrepreneurs)
in tourism development and the attraction of tourists to their communities is

63
mainly driven by the desire to improve the economic and social conditions of
the area (Ap, 1992).Since tourism stakeholders have been considered as
important key players who influence the success or failure of tourism in a
region, their participation and involvement should be considered in tourism
planning and development. Thus, social exchange theory provides a theoretical
foundation for identifying tourism stakeholders’ perceptions of the benefits and
costs of tourism.
Jurowski et al. (1997) explained how residents weigh and balance seven
components, and why residents of the same community have different views by
using the principles of social exchange theory and a path model. This path
model was designed to investigate how the potential economic gain, use of the
tourism resources, ecocentric attitude, and community attachment as the
exchange factors affect residents’ perceptions of tourism impacts, and affect
both directly and indirectly the support of tourism development.
Yoon et al. (2000), used structural model to find the relationship
between tourism impacts, residents’ attitudes and support for tourism
development, local residents are likely to participate in exchange (support
tourism development). As long as the perceived benefits of tourism exceed the
perceived costs of tourism. Their empirical findings support this statement in n
that the economic and cultural impacts were positively associated with the
“total impact of tourism,” while the social and environmental impacts
negatively affected the “total impact of tourism.” Further, the “total impact of
tourism” was positively associated with “the support for tourism development.”
Additionally, environmental impact was negatively associated with “the
support of tourism development.” As a result, if residents received benefits and
rewards from tourism, they were likely to support tourism development.
64
On conclusion, among various theories that have been proposed to
examine peoples’ attitudes about tourism, Social exchange theory has provided
theoretical advantages in facilitating a logical explanation of both the positive
and negative aspects of tourism. The principles of the theory can enable an
explanation of the process involved in the exchanges between tourism resources
and people. It also explains how the exchange factors affect the results or
outcomes of the exchange process. Therefore, this proposed study will utilize
social exchange theory as the underpinning theory for examining the structural
relationships among the constructs (tourism impacts, community participation),
and their results, the support of rural tourism destination competitive strategies.
2.3.3 Stakeholder Theory
Ioannides (2001) applied a stakeholder framework concept to analyze varying
stakeholder attitudes toward tourism and sustainable development at different stages
of destination development. Stakeholder identification and involvement has been
recognized as a key step toward achieving partnerships and collaboration within
tourism in the studies of both Jamal and Getz (2000) and Bramwell (1999).
Stakeholder theory has used as an ethical tool in sustainable tourism marketing by
Walsh, Jamrozy, and Burr,(2001).The application of Stakeholder theory to tourism so
far has been mostly superficial, with the exception of Hary and Beeton(2001) who
applied Stakeholder theory both to identify stakeholder groups and understand their
perceptions of sustainable tourism.
Center and Jackson (1995) stated that the efforts of the small group in an
organization are supported by their perceived power to influence the
organization’s decision process or support from the larger group within the
organization. Large shareholders in an organization ultimately are the powerful

65
stakeholder group. The existence of government bodies, such as tourism
planning and development agencies or Ministries, act as a safeguard or
guaranteeing agent to protect the interests of small groups (e.g. small
businesses, consumers) against the exploitation of larger groups (e.g. local
business elite or foreign investors).
Powerful stakeholder individuals or groups could be any organization’s
employees or interest groups (Bridges, 2004), who possess power to affect the
outcome of a particular issue in a particular organization (Carroll, 1991; Heath,
2003) because, they have access to the political process system or to the
influential mass media (Nasi et al., 1997). In conformity with stakeholder
theory logic, Heath (2003) suggested that any issue analysis must include an
analysis of the power of relevant stakeholder individuals or groups. The
stakeholders’ public includes both groups involved in the issue under
consideration itself and groups with a financial interest in supporting and
enhancing the development process (Hilgartrne & Bosk, 2003).
Post et al. (2002) suggested that the concept of stakeholder theory could
be an alternative to the input-output systems theory. While systems theory is
utilized to explain the communication behavior within and between
organisations (Farace et al., 1977), the stakeholder theory recognizes the mutual
benefits and interests of both the stakeholders and the organization.
As a strategic management tool, the stakeholder theory articulates that
the various stakeholder groups can and should have a direct influence on
managerial decision- making processes within an organization (Jones, 1995;
Suatter & Leisen, 1999). Management must pay close attention to the genuine
interests of all legitimate stakeholders to be effective (Donaldson & Preston,
66
1995). Clarkson (1995), emphasized the importance of retaining the
participation of even a single primary stakeholder group, otherwise the
organization may become vulnerable to failure and fragmentation.
2.3.4 Stakeholder theory and tourism
Applying the stakeholder theory concepts to tourism would require tourism
planners to realize, and be concerned with, the perspectives of diverse stakeholder
groups involved in the tourism system, and to recognize that their interests are not
exclusively touristic (Suatter & Leisen, 1999). Tourism planning bodies must not
underestimate the importance of various tourism stakeholders groups, which affect
or are affected by the tourism development and services. Meanwhile, Ioannides
(2001) applied the stakeholder framework in conjunction with the destination life-
cycle concept to analyse varying stakeholders’ attitudes toward tourism
development at different stages of destination development, with particular
reference to some Mediterranean Islands.
The stakeholder theory has been utilized to a very little extent in the
tourism planning, policy and strategy development literature (Getz & Timur,
2004); however, it is conceptualized as a normative tourism-planning tool that
can be used to promote collaboration among key players in the tourism
planning system (Donaldson & Preston, 1995; Suatter & Leisen, 1999).
Proactive approaches should be used by the Planning bodies to accommodate
the interests of various stakeholders and their needs, and in addition must
effectively manage the relationships among stakeholders to promote better
collaboration and sustainable tourism development (Suatter & Leisen, 1999).
As tourism in Karaikudi, the rural area is in the early development stage,
it is necessary that the tourism development planning authority to accommodate
the interests of all relevant stakeholders to achieve its planning objectives. The
67
regional planning may also need to be decentralized to cater the local
communities’ interests and diversity in regional areas.
From the above literature the research gap is identified as follows.
The most common evaluation method of tourism attractiveness is from visitors’
or tourists’ perspectives. (Formica, 2000; Milman & Pizam, 1995) argued that
this method is somewhat limited due to the short period of visiting time, and a
limited knowledge of or familiarity with attractions existing in a given region.
Liu (1988) and Formica (2000) suggested that rather than using visitors’
perspectives, the use of tourism experts such as tourism stakeholders have
potential results and benefits. Their solid knowledge and experiences of the
entire portfolio of existing tourism resources and attractions is useful in
evaluating destination competitiveness. Although a number of studies have
addressed concepts and relevant models concerning destination
competitiveness, no empirical study has developed an integrative model
capable of investigating the destination competitiveness of an area by
examining the structural relationships among tourism stakeholders’ beliefs and
attitudes toward tourism, their development preferences for tourism
attractions/resources, and their support of enhancement strategies for
destination competitiveness.
2.4 CONCEPTUAL FRAMEWORK AND HYPOTHESES
The constructs of the conceptual framework is explained in the
following section such as, tourism development impacts, community
participation (stakeholders’ perceived power) and stakeholders’ support for
tourism. Then, finally the composed initial model to be tested in Chapter 4 and
the proposed hypotheses relationships are introduced.

68
2.4.1 Tourism Development Impacts
Many researchers have observed the total development impacts of
tourism by stakeholders’. The stakeholders’ perceptions of total impact may be
influenced by the level of tourism development. The results of various studies
suggest that the stakeholders’ perception of the Tourism total impact is affected
by the perceived impact of costs and benefit factors on the stakeholders’ such
as economic, social and cultural, environmental (Yooshik Yoon et al.,2001 ;
McIntosh & Goeldner, 1990). Researchers have found residents perceive
positive and negative environmental impacts of tourism (Liu & Var, 1986; Liu
et al., 1987). Positive impacts include preservation of historic and cultural
resources, recreation opportunities for visitors and residents, and better roads
and public facilities. Negative environmental impacts include deterioration and
destruction of environment, pollution, and deterioration of cultural or historical
resources (Chen, 2000).
Allen et al. (1988: 16) have observed ‘Unfortunately, many state and
local governments attempt to optimize economic benefits of tourism with little
regard to the social and environmental cost associated with tourism expansion’.
To avoid the adverse effects, the impacts of tourism therefore need to be
monitored on a continuous basis for maximum benefits. This is necessary not
only for the purposes of protecting the community’s well-being, but also to
ensure that the quality and sustainability of the tourism product at individual
destinations is not undermined by adverse reactions of the resident population
(Getz, 1994; Inskeep, 1991).
The stakeholders perceived economic benefits as the most important
factor in support of tourism development (Akis et al., 1996). The economic
impact studies have mainly focused on job opportunities (Davis et al., 1988)

69
and the benefits derived from tourism activities (Murphy, 1983). Many studies
conclude that host community view tourism provides socio cultural benefits to
the community such as tourism creates opportunities for cultural exchange
(McCool &Martin, 1994). Friedman (1984) also recognizes that political, social
and cultural processes are interdependent with economic processes but not
reducible to them, and are themselves able to bring about change. The extensive
growth of tourism in the late 1960s stressed a need planning (Saarinen, 2008).
Hall (1998) has observed “tourism has emerged as one of the central means by
which rural areas can adjust themselves economically, socially and politically
to the new global environment”. The tourism and its impacts are a
multidimensional phenomenon that encompasses economic, social, cultural,
ecological, environmental, and political forces (Singh et al., 2003)
Positive Economic Impact- This will create employment for the rural people
and generate income for them. The villagers will able to provide better food and
education for their children. The quality of life will improve. They will have an
additional source of income along with their agricultural income.
• Create employment for the rural youth.
• Rise of Income level.
• Foreign exchange generation.
• With Quality of life will increase for example, education, health etc will rise.
• The price of the land will rise.
• Increase in demand for local made goods and services.
• Improvement in the public services.
• Generate revenue for the government.
• Modernization of agriculture and other rural activities.
• Local small businessman will be benefited.

70
Negative Economic Impact- The urban communities and entrepreneurs may be
benefited more. The rate of economic return to rural communities has been low.
The facilities provider and investors such as resorts, hotels and tour operators
will be mainly from cities; who will take away most of the profits. Most the
products will be imported from outside, not produced locally. There is a chance
that limited employment will be generated for the rural people due to their
limited knowledge and exposure.
• The rural people can be exploited.
• The rural people have to depend on the urban entrepreneur, so the benefit may
not reach them.
• The urban investor will take away most of the profit.
• Food, drink and necessary products will be imported from outside and not
produced locally.
• The entertainment tax will go to the government and the local people will not
get the benefit.
• Rural people may be under paid.
• Local artisan may not get benefited.
• Due to competition the local handicraft and farm produce products will be sold
at lower price.
• Demand for luxury items will increase.
• Increase in the price of local agro products.
Environmental Impact
The rural people can learn to build up the healthy environment with
proper sanitation, roads, electricity, telecommunication etc for better living.
Some times the tourist can exploit natural resources and have a negative impact
on the environment
71
Positive Environmental Impact – The rural people will gain knowledge of how
to lead healthy and hygienic life from the urban people visitors.
• Infrastructure development will lead to healthy tourism.
• The impact of rural environment can improve the state of body and mind.
• Creation and maintenance of natural park.
• Preservation of natural resources.
• Developing healthy environment with proper sanitation, roads, electricity,
telecommunication, etc.
• Usage of modern tools and technology.
• Preservation of the natural habitats, bio-diversity historical monuments.
Negative Environmental Impact - The tourists may exploit natural resources
and it can have a heavy negative impact on the environment. Rural tourism
requires infrastructure, transportation and other facilities which can cause
environmental distortion.
• Development of infrastructure may distort the natural beauty.
• Tourist activities like trekking and camping can cause environmental pollution.
• Huge number of visitors may exploit the natural resources
• Natural ecology will be disturbed.
• Huge buildings for tourist can spoil the scenic beauty.

72
Socio-cultural Impact
In spite of many negative effects, tourism has been accepted willingly in
many rural areas. This is due to the income from tourism is much higher than
what rural people can earn from agriculture. It is recognized that negative
impacts on rural communities have become more stronger, and that rural tourism
must be modified to give rural people its benefits.
Poorly planned tourism can mean that villages are invaded by foreign
visitors with different values, disrupting rural culture. The higher standards of
living in urban tourist destinations have caused emigration from nearby rural
neighbours, resulting in changes in the demographic structure and possible
culture shock. Furthermore, employment and education can have a negative
social impact. The younger generation may gain better prestige than their elders
as they gain experience, jobs and money from tourism.
Positive Socio-cultural Impact - The rural people can learn the modern culture.
And can come out of their traditional values and beliefs. They can adopt different
practice of modern society. The income from tourism is much higher than what
rural people can earn from agriculture and other allied services.
• Higher standard of living for the rural people.
• Improvement in education and health of the rural community
• Cultural understanding through fairs and festivals.
• Exchange of cultural beneficial.
• Demand for education will increase.
• Reduce migration of rural people to urban areas.
73
• Market for agro products and handicrafts will develop in rural areas
• Farmers and artisans can develop a direct contact with the customers.
Negative Socio-cultural Impact - Poorly planned tourism can affect the
villagers. It can disrupt the rural culture. It may affect the traditional and cultural
practices, agriculture and other allied activities.
• Can create disharmony in development
• Modernization can affect their traditional values and cultural practices.
• Traditional products may be replace by modern products
• Traditional houses are replaced by modern buildings.
• Increase in the rate of crime
• Sexual harassment.
• Overcrowding in schools.
• Rural people may shift from traditional business to tourism activities.
• Rural people try to copy tourist can affect their daily life.
• Decline in participation in rural traditional and cultural practices follows.
Tourism political impacts
The level of power structure of the local population may determine the
differentiation of perceptions and responses to tourism development and
implementation strategies (Dogan, 1989). The local population is usually
divided into various political groups, each with a different policy focus, and
consequently their responses to tourism development differ based on their
political orientation. The costs and benefits of tourism are not distributed
evenly within the local community, and this inconsistency leads to internal
power and interest conflicts between them (Dogan, 1989), the formation of
74
class and racial tensions in the society, the rich becoming richer and the poor
becoming poorer (Kadat, 1979), and redistribution of political power (those
negatively affected become hostile and angry toward the newly created elite),
which subsequently leads to resentment and unrest (Lundberg, 1990).
Thus, tourism development may lead to conflicts between different
interest groups, be they public, private businesses or nongovernmental
organisations, whose interests are differentially affected by tourism. Such
differences could develop further into hostilities and unrest, which ultimately
affect the safety and security of the destination
According to Snepenger and Johnson (1991) the residents who identified
themselves as ‘conservatives’ were more negatively disposed to tourism
development than those who identified themselves as ‘liberals’. Thus, the
political impacts of tourism are very much related to economic gain and
political power exerted by different groups. Tourism development depends on
government initiatives. Tourism cannot develop without active encouragement
of the state (Dogan, 1989).
The government plays a key role in visa policy, foreign exchange
requirements, and import regulations. It also supports facilitating regulations
for investment in the tourism industry, and providing the necessary incentives
for tourism development (e.g. infrastructure, supporting services). States’
efforts to minimize the negative consequences of tourism are also important
through educating local citizens to adopt friendly attitudes toward tourists, and
use of the media to promote positive images of the destination (Wood,
1980).Political balance among interest groups within a destination, political
75
freedom, and a government’s active role in regulating the industry are
important political factors for tourism development.
The study of political power arrangements is critically important in the
analysis of the political impacts of tourism (Hall, 1994), because power governs
“the interplay of individuals, organisations, and agencies influencing the
direction of policy”.
The positive impact is that the most advantaged persons within the
government circle may benefit at the expense of those less powerful in gaining
from development. On the negative side, it is most likely that the interests of
the politically powerful will win out over the interests of the politically weak
party (Hall, 1992). One of the negative political impacts of tourism is the loss
of local autonomy to international investors (Krippendorf, 1987).
2.4.2 Tourism support
The success of tourism depends on the active support of the local
population, without which the sustainability of the industry is threatened.
Residents should be the focal point of the tourism decision making process
(Choi & Sirakaya, 2005). The host community to tourists is vital in the visitor
experience and research proposes that it is impossible to sustain Tourism
destination that is not supported by the local people (Ahn, Lee & Shafer 2002;
Twinning-Ward & Butler 2002; McCool, Moisey & Nickerson 2001). The most
favorable perceptions toward tourism impacts are found to be associated with
economic and social and cultural aspects of tourism (Tatoglu et. al 2000). Many
researchers and professionals are currently suggesting for the inclusion of
76
stakeholders in the planning process (Hardy & Beeton 2001). Sustainable
tourism development cannot be achieved if imposed without regarding the
stakeholders’ interests (Ioannidis, 1995). The relationship between the
community leaders’ perceptions toward tourism impacts and their effort in
building support for tourism in local communities (Fariborz & Ma’rof 2009).
2.4.3 Community participation
Community participation is an important element of tourism
development of a destination. In other words, community participation acts like
a backbone of a destination. A number of tourism related organizations around
the world promote “people” in the “community” as the “centre” or “heart” of
tourism development. Murphy (1985) argues that often there are conflicts of
opinion amongst residents; with some residents acknowledging the benefits of
tourism development, whilst others such as Harrill (2004) argue that tourism is
having a negative effect on their life style.
The importance of local community involvement and cooperation in the
planning process has been emphasized in the Tourism planning literature (Gunn
& Var, 2002; Telfer, 2003; Tosun, 2000). Stakeholders’ participation in tourism
planning is a prospective component of tourism planning approaches and
sustainability. Stakeholders can be defined as an individual or an identified
group who affects or affected by the achievement of corporate objectives (Getz
& Timur, 2004; Glicken, 2000; Ryan, 2002). The community’s approach to
tourism planning (Gunn, 1994) and the sustainability of tourism approaches
(Hall, 2000) depend on various destination stakeholders’ participation. The
importance of public involvement in tourism planning is a consequence of
tourism impacts on host communities.

77
The outcome of several tourism studies (Liu & Var, 1986) substantiated
an increase of public participation in the decision-making process (i.e. higher
empowerment) through higher participation of stakeholders and collaboration
among concerned responsible authorities (Aas et al., 2005), by introducing a
more community-oriented approach to tourism planning and development
(Burns, 2004; Choi & Sirakaya, 2005; Fyall & Garrod, 2004; Hall, 2000;
Scheyvens, 2002).
Stakeholders’ participatory development approach would facilitate
implementation of principles of sustainable tourism development by creating
better opportunities for local people to gain larger and more balanced benefits
from tourism development taking place in their localities (Tosun, 2000),
resulting in more positive attitudes to tourism development and conservation of
local resources (Inskeep, 1994), and by increasing the limits of local tolerance
to tourism. Tosun (2000) states that community participation also has many
constrains like paternalism, racism, clientelism, lack of expertise and lack of
financial resources along with other structural problems in many developing
countries, which creates troubles in the actual process of community
participation..
Effective tourism planning requires resident involvement to overcome the
negative impacts and to channelise the benefits associated with tourism
development (Arnstein 1969).Ying and Zhou (2007) noted that community
participation in tourism can be examined from two viewpoints; first, the decision
making process, allowing residents to become empowered in tourism
development, expressing their concerns and desires; and secondly the tourism
benefits, example, the employment opportunities. According to Cook (1982),
78
community involvement within the planning and development process is
important for sustainable tourism development.
Dredge (2006) argues that there is a need to involve wider community in
tourism planning instead of that local government claiming that they represent
the wider communities. According to Hillery (1995), there are three main points
in community participation; community involves group of people who live in
geographically distinct area; the quality of relationships within the groups, with
members tied together with common characteristics such as culture, values and
attitudes; and a group of people engaged in social interaction, such as
neighbouring.
(Cook 1982, Haywood 1988) argued public participation in planning at
the local level, is important if the social and environmental effects of tourism
development are to be avoided, as social and environmental effects are
associated with the local community. In order to involve local community in
the tourism development process, community managers and planners need to
provide educational information and programs (e.g. workshops, awareness
programs) to residents (Sirakaya,2001).
Community participation holds the potential to transform the attitudes of
local people from passivity to responsibility and forms a new relationship
between individual and destination, based on a sharing power and decision
making (Dinham, 2005). Cheong and Miller (2000) argue that local
communities should become proactive and resistant to unwanted change; there
should be negotiation in the plans and development so that they can ensure
development in their community in best possible way. If tourism is to develop
79
within a community, the host community must become willing partners to
tourism development. Murphy(1981).
Community develops from creative processes (Day, 2006). The creative
processes determine whether a community continues or disappears. While
social institutions often support an initiative to build a community, it can only
come into being through interpretation of reality by community participants.
Interpretation of socio-economic elements of their environment occurs only due
to the process of social interaction. Community action emerges in result of
interactions among participants of social fields such as education, tourism and
recreation, environment, local governance, which are linked to specific rural
area (Theodori, 2005).
Wilkinson (1991) points up that interactional community development
stands for internal and external forces transforming social relationships among
community participants. Ties between the participants of different social fields
develop into local network of social ties, both formal and informal. Escalation
of the network usually impacts quality of information flow, also intensifying
overall interaction among social fields. Frequent interactions are empirical
demonstration of emerging community. Conflicts inside a community arise
from differences of interests and reflect heterogeneity of local society. Structure
and character of interaction also expose qualitative differences among
interactional communities. Increasing frequency and strengthening of
interactions increases potential for collective decision-making and realization of
locally delineated goal (Wilkinson, 1974), thus improves practice of local
democracy.
80
According to Tosun (2000), and Aref and Redzuan (2008) there are
certain limitations for community participation in the decision-making process of
tourism development in the context of developing countries. The limitations
across three heads i.e. (i) Operational Limitations (ii) Structural Limitations and
(iii) Cultural Limitations to community participation in the tourism development
process in many developing countries although they do not equally exist in every
tourist destination.

81
CHAPTER III
RESEARCH METHODOLOGY
3.1 INTRODUCTION
This chapter III features the research methodology used in the study to
empirically test the research hypotheses.
A conceptual framework shown in section 1.3 was tested empirically in
the case of karaikudi. In addition, the stakeholders’ perceptions, opinions, and
demographic attributes were collected from both secondary and primary
sources to help resolve the research problem. The study is explanatory and
descriptive in nature, and it is based on both quantitative and qualitative
analysis to investigate the relationships between tourism development impact
factors (economic, socio-cultural, political, environmental), community
participation (stakeholders’ perceived power), and in turn the support of
stakeholders for rural tourism competitive strategies.
3.2 RESEARCH FRAMEWORK
The proposed structural model (Figure 3.1) was tested in this study of
tourism stakeholders’ support of rural tourism destinations’ competitive
strategies as they relate to Tourism Development Impact factors (economic,
socio-cultural, political, environmental), community participation
(stakeholders’ perceived power). This study investigates the interrelationships

82
between these constructs and the favourable competitive strategies stakeholders
are willing to support. The main objective was to examine their perceptions and
opinions about the impacts of tourism development, and the community
participation further to determine their willingness to support the most
appropriate development strategies of competitiveness.
Figure 3.1 The initial conceptual framework for Rural Tourism Support
A thorough review of the existing literature has been performed to
achieve the objectives of the study, and consequently, gaps have been
discovered and a theoretical structural model was developed that incorporates
concepts from the fields of tourism, planning, and development. As presented
in Figure 3.1, the constructs in this study include tourism development impacts,
TourismDevelopmentImpacts
RuralTourismSupport
Econom
Socio-cul
Environ
mental
Political
+H2
Communityparticipation
+H1 +H3
83
community participation and support for tourism destination competitive
strategies. Since tourism stakeholders’ participation and involvement are
essential in tourism planning and its decision-making process, their perceptions
and attitudes about tourism are a critical source of success in tourism
development.
The tourism literature has suggested that people’s support about tourism
development is likely to be affected by several factors. For example, if tourism
stakeholders have a positive perception of tourism development impacts, they
are likely to support tourism development. If they have high ecocentric attitudes
toward environmental concerns, they are likely to support tourism
development. Additionally, if tourism stakeholders have a high participation in
tourism, they are likely to support tourism development.
In this structural model, the support of rural tourism destination
competitive strategies is considered as the ultimate dependent or endogenous
construct. It is thought to be affected directly by the two exogenous constructs:
1) tourism development impacts and 2) community participation. The tourism
development impact is measured by the four factors economic impacts, socio-
cultural impacts, environmental impacts and political impacts. The direct effect
of these two constructs on the support for tourism destination competitive
strategies will be contingent upon the manner in which they affect development
preferences about tourism attractions/resources. The direction of the arrows
specifies the relationship between the constructs. Additionally, each linkage
represents a hypothesis that was empirically tested by estimating the degree of
the relationship in this study. It is also assumed that the two exogenous
84
constructs are not correlated with each other: tourism development impacts,
community participation.
The stakeholders’ perceptions, attitudes and behaviors about the
influencing factors on tourism planning and development process regarding
tourism impacts (economic, social, cultural, political, and environmental),
community participation have received little attention in the past (Hall, 1994;
Yoon, 2002). This study will explore the interrelationships between these
constructs in order to reach a conclusion about the favourable competitive
strategies the stakeholders are willing to support and the level of power and
degree of stakeholders’ participation in the decision-making process. So
community participation is added as an exogenous construct(independent
variable) in this proposed model.
3.3 RESEARCH HYPOTHESES
H1: There is a relationship between tourism development impacts (economic,
social-cultural, environmental and political,) and the community participation.
H2: There is a relationship between tourism development impacts (economic,
social-cultural, environmental and political,) and the support for rural
destination competitive strategies.
H3: There is a relationship between community participation and the support
for rural destination competitive strategies.
H4: There is a relationship between economic impacts and tourism
development impacts
H5: There is a relationship between socio-cultural impact and tourism
development impacts.

85
H6: There is a relationship between political impacts and tourism development
impacts.
H7: There is no significant difference between male and female with respect to
community participation, Tourism support and overall community satisfaction
in tourism development.
H8: There is no significant difference between tourism related and non-tourism
related business with respect to tourism support.
H9: There is no significant difference between closer to the destination or far
away with respect to tourism support.
H10: There is no significant difference among age group of the community
people with respect to community participation in tourism development
H11: There is no significant difference among occupation of the community
people with respect to community participation.
H12: There is no significant difference among marital status of the community
people with respect to community participation.
H13: There is no significant difference among length of residency of the
community people with respect to community participation.
H14: There is no significant difference between age group of the community
people with respect to overall community satisfaction
H15: There is no significant difference among length of residency of the
community people with respect to community satisfaction.
H16: There is no significant difference between age group of the community
people with respect to tourism support strategies
H17: There is no significant difference among occupation of the people with
respect to tourism support strategies.
H18: There is no significant difference among education qualification of the
people with respect to tourism support strategies.

86
H19: There is no significant difference between length of residency with
respect to tourism support strategies.
H20: There is no association between years of residency and support for
tourism
3.4 RESEARCH METHODS USED IN TOURISM RESEARCH
Qualitative research methods nowadays are widely used in market
research and are gaining wide acceptance in the social sciences (e.g. Bonoma,
1985; Easter by-Smith et al., 2002; Miles & Huberman, 1994; Walle, 1997). In
travel and tourism research, anthropologists and sociologists have used
qualitative research, with the exception of research in consumer behaviour
(Decrop, 1999; Riley & Love, 2000). According to Riley (1996, p.22), “The
majority of tourism marketing research has relied on structured surveys and
quantification”. The qualitative methods were used explicitly in the exploratory
stage to initiate and provide information for further quantitative investigation or
to subordinate and enhance the empirical findings. This research incorporated
quantitative and qualitative methods in a three-stage process:
Step 1: Stakeholders’ interviews to refine the research problem. The study
began with conducting and collecting cross-sectional secondary data from
different literature sources such as books, periodicals, national and international
newspapers, government records and other studies about the topic. This was
followed by a few face-to-face informal interviews with different stakeholders’
(Government officials) in Tamilnadu and Karaikudi to further refine the
research problem.
87
Step 2: Pilot studies to develop and refine survey questions. At this stage, the
theoretical framework and the measurement scales were developed based on a
priori theories and review of the mass tourism literature. Then pilot was
conducted with various stakeholders’ to make sure it was understandable. A
few corrections were suggested and applied. The survey instrument established
its reliability which exceeded the recommended 0.7 level (Hair et al., 2003).
Step 3: (Interviewer-assisted) survey : The third stage was the collection of
primary data from various tourism stakeholders in Karaikudi. It involved
collecting and analyzing data quantitatively as the main part of this study to test
the proposed theoretical framework and hypotheses. . The data was then
integrated at the analysis and interpretation stages for presentation.
3.5 RESEARCH DESIGN
The study is explanatory and descriptive in nature, and it is based on
mixed methods design i.e. both quantitative and qualitative analysis to
investigate the relationships between tourism development impact factors
(economic, socio-cultural, political, and environmental), community
participation (stakeholders’ perceived power) and in turn the support for rural
tourism destination competitive strategies.
88
3.5.1 Qualitative Data
Yin (1993) hat qualitative data can be represented by perceptual and
attitudinal dimensions, and real-life events are not readily converted to
numerical values. Moreover, opinions and expectations about tourism planning
and development strategies can differ depending on which population or
occupational groups are considered (Krippendorf, 1987). The participants for
face to face interviews were selected from three different stakeholder segments
(government related and non-related tourism officials and private sector
representatives). The following section explains the qualitative research
method used to further explain the research problem.
The main objectives:
1. To identify the approach of the public participation framework in the study
area.
2.To study the strategy used and problems identified when implementing public
participation.
3.To determine how far the residents are allowed to participate during the
involvement program.
3.5.1.1 Sampling method
Qualitative research usually uses small samples, based on purposeful
sampling, of participants who are studied in-depth through face to face in-depth
interviews, case studies, focus groups, and observations (Easterby-Smith et al.,
2002; Fern, 2001; Gummesson, 2000; Miles & Huberman, 1994; Patton, 1990).
89
This study used face to face in-depth interviews. The data were collected
through open ended status questions from three different stakeholders’ about
their feelings, perceptions and opinions. The participants were the middle and
top management hierarchies in both government and private sector
organisations. They are the top planners and decision makers in their
organisations and, having been nominated by their superiors in the case of the
government groups, they were in addition the most knowledgeable about the
topic to be discussed.
3.5.1.2 Sample size
Gummesson (1991) proposed that it is not necessary to study a large
number of respondents to gain an in-depth understanding of the topic under
study. The sample size for the study is thirty participants who were selected on
the merits of their position, influence over decision-making processes,
experience, and involvement in the goal setting and strategy making of tourism
planning and development in Karaikudi. The response rate for this qualitative
research is 100%.
3.5.1.3 Data Analysis
In analyzing qualitative data, Miles and Huberman (1994) identified at
least three stages: data reduction, data display, and conclusion drawing and
verification. These stages would include certain analysis techniques (e.g.
contact summary sheet, codes and coding, pattern coding, memoing). In this
research project, the data was coded according to the predetermined themes
from literature and analysed using contact summary sheet and memoing.

90
3.5.2 QUANTITATIVE DATA
3.5.2.1 Study Population
Population of the study can be defined as the entire group under study as
specified by the objective of the research (Pedhazur & Schmelkin, 1991,
Sekaran, 2000). The objective of this study was to investigate Karaikudi’s
tourism stakeholders’ perceptions, attitudes, and behavior toward tourism and
its development, the population of this study was tourism stakeholders. In
particular, the target population includes members or groups that are related or
are not related to tourism activities in the state Tamilnadu and in Karaikudi.
Examples include state and local government officials, tourism, local tourism
agencies, private businesses, residents, tourists and tourism faculties and
students (researchers).
3.5.2.2 Determination of Sample Size
The determination of sample size is a very important issue, because
samples that are too large may waste time, resources and money. While
samples that are too small may lead to inaccurate results. According to
(Saunders et al., 2000) researchers normally work to a 95 percent level of
certainty. This means that if sample are selected 100 times, at least 95 of these
samples would be certain to represent the characteristics of the population. The
margin of errors describes the precision of the estimation of the
population.
It is suggested that a minimum sample size should be at least 200 (or
more) to ensure appropriate use of SEM and to minimize the chance of getting

91
exaggerated goodness-of-fit indices due to small sample size (Anderson &
Gerbing, 1988).
The sample size is determined by using the following formula
Sample size (n) = (ZS/E)2
Where
Z=Confidence interval (95%)
S=Standard deviation (from pilot study)
E=Error (5%)
Sample size n = [(1.96*0.48)/0.05]2
= 354
Sample size taken =365
No. of usable responses =320
Response rate =(320/365)*100
=87%
The research proposed to supply the instrument to 365 respondents in
which only 320 respondents were willing to turn back with fully filled
questionnaire. Therefore the response rate was 87%.
3.5.2.3 Sampling Technique
Sampling is a technique that uses a small number of units of a given
population for drawing conclusions about the whole population (Pedhazur &
Schmelkin, 1991; Zikmund, 1997). Sampling is an important method for
increasing the validity of the collected data and ensuring that the sample is
92
representative of a population. Convenience and quota sampling methods were
adapted methods from identified and independent sample frames to collect
quantitative data from the respondents. Convenience sampling refers to
“sampling by obtaining units or people who are most conveniently available”,
while quota sampling is “to ensure that various subgroups in a population are
represented on pertinent sample characteristics to the exact extent that the
investigators desire” (Zikmund, 2000 pp.380, 383).
Data were collected through questionnaire from the stakeholders such as
government authorities; tourism related and not related tourism businesses,
tourism agencies, tourist, residents, tourism faculty and students. Depending on
the size of each category of stakeholder, a proportional sample from each
category was selected to represent that particular category and provide
sufficient data for statistical analysis. The selection of sampling units was based
on the researcher’s intuitive judgment, desire and knowledge (Hair et al.,
2003).
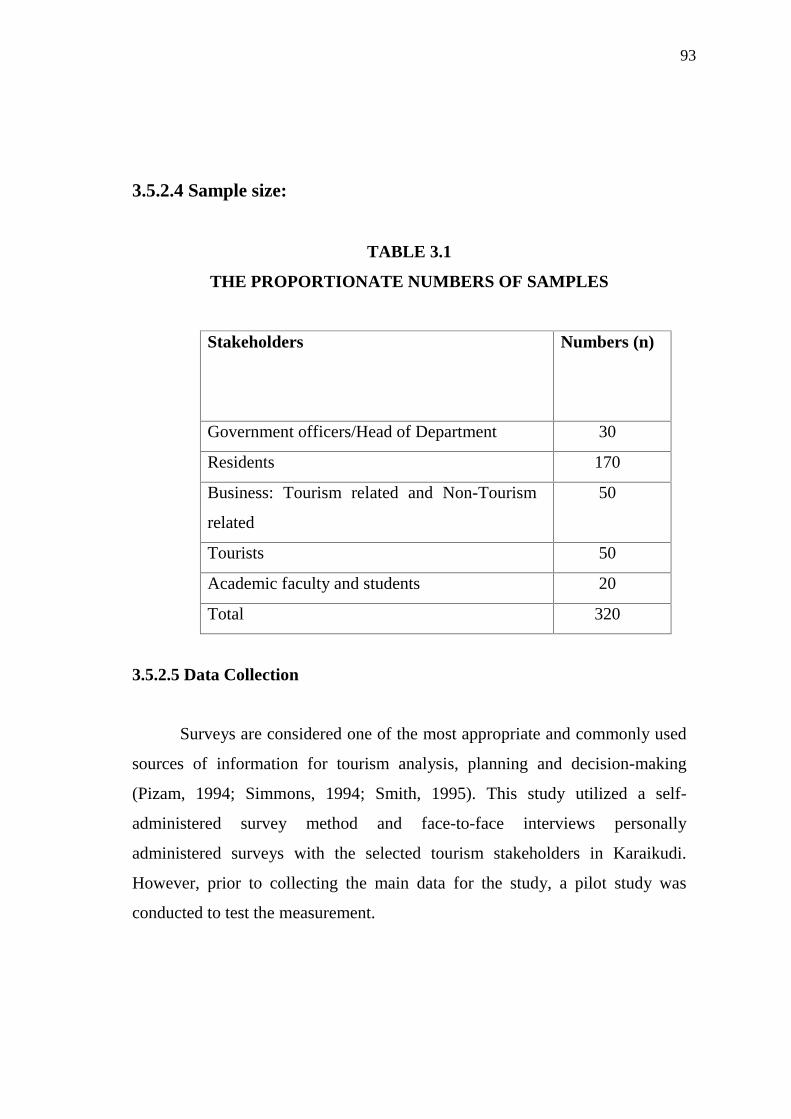
93
3.5.2.4 Sample size:
TABLE 3.1
THE PROPORTIONATE NUMBERS OF SAMPLES
Stakeholders Numbers (n)
Government officers/Head of Department 30
Residents 170
Business: Tourism related and Non-Tourism
related
50
Tourists 50
Academic faculty and students 20
Total 320
3.5.2.5 Data Collection
Surveys are considered one of the most appropriate and commonly used
sources of information for tourism analysis, planning and decision-making
(Pizam, 1994; Simmons, 1994; Smith, 1995). This study utilized a self-
administered survey method and face-to-face interviews personally
administered surveys with the selected tourism stakeholders in Karaikudi.
However, prior to collecting the main data for the study, a pilot study was
conducted to test the measurement.
94
3.6 MEASUREMENT SCALES AND RESEARCH INSTRUMENT
The conceptual framework of this study attempted to empirically test the
relationships proposed among two independent variables: Tourism
development impacts (economic, socio-cultural, political, environmental), and
community participation (stakeholders’ perceived power) and one ultimate
dependent variable was support for competitive destination strategies.
From the literature review and relevant theories the measurement scales
for this study were measured. The rating method, with a 5-point Likert scale
(ranging from 1=strongly disagree to 5=strongly agree, 1=strongly oppose and
5=strongly support) was used for the measurement of perceived tourism
development impacts, community participation (stakeholders’ perceived power)
and support for competitiveness strategies. The scale consists of a set of items
of equal value and a set of response categories constructed around a continuum
of agreement/ disagreement and support/oppose concerning a particular
attitudinal element to which respondents were asked to respond (Pizam, 1994;
Sarantakos, 1998; Zikmund, 2003).
For this study, the survey was divided into six parts: a) the socio-
demographic items b) tourism development impacts to measure the perceived
impacts of tourism development, c) community participation, to measure the
stakeholder’ perceived power d ) support for tourism e) overall community
satisfaction, and f) tourist opinion. Table 3.2 shows the different measured
variables with the sources of the measured scales.
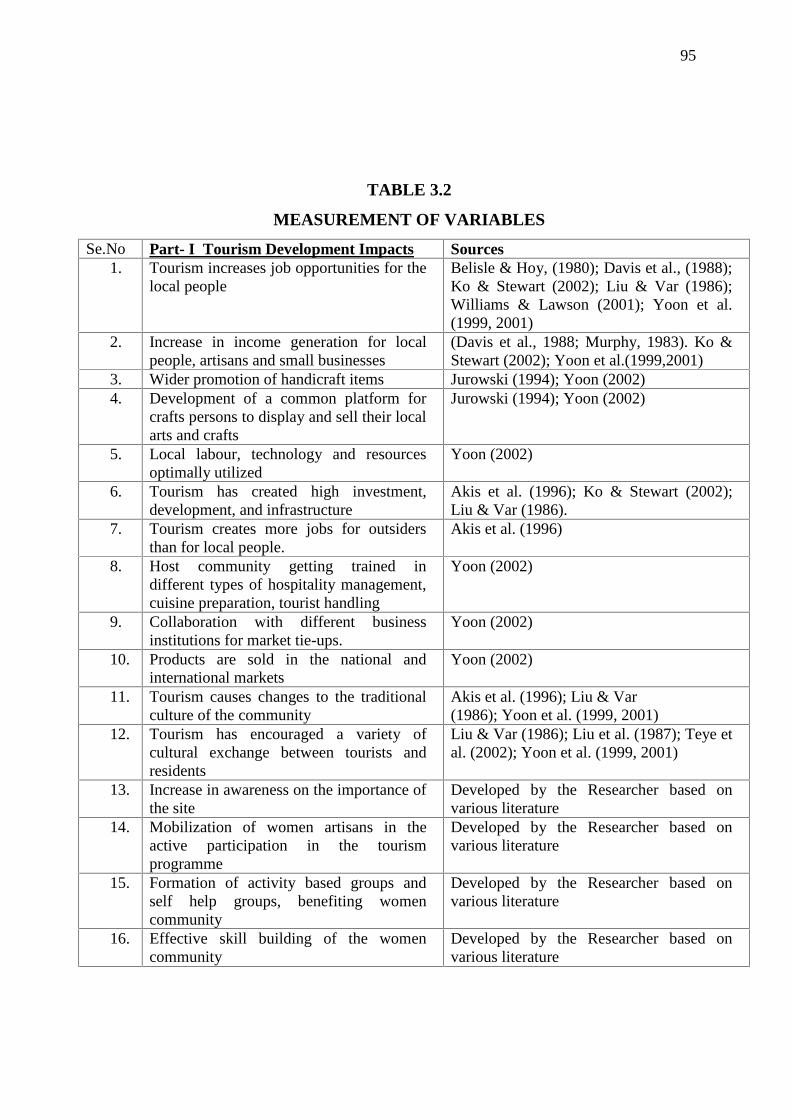
95
TABLE 3.2
MEASUREMENT OF VARIABLES
Se.No Part- I Tourism Development Impacts Sources1. Tourism increases job opportunities for the
local peopleBelisle & Hoy, (1980); Davis et al., (1988);Ko & Stewart (2002); Liu & Var (1986);Williams & Lawson (2001); Yoon et al.(1999, 2001)
2. Increase in income generation for localpeople, artisans and small businesses
(Davis et al., 1988; Murphy, 1983). Ko &Stewart (2002); Yoon et al.(1999,2001)
3. Wider promotion of handicraft items Jurowski (1994); Yoon (2002)4. Development of a common platform for
crafts persons to display and sell their localarts and crafts
Jurowski (1994); Yoon (2002)
5. Local labour, technology and resourcesoptimally utilized
Yoon (2002)
6. Tourism has created high investment,development, and infrastructure
Akis et al. (1996); Ko & Stewart (2002);Liu & Var (1986).
7. Tourism creates more jobs for outsidersthan for local people.
Akis et al. (1996)
8. Host community getting trained indifferent types of hospitality management,cuisine preparation, tourist handling
Yoon (2002)
9. Collaboration with different businessinstitutions for market tie-ups.
Yoon (2002)
10. Products are sold in the national andinternational markets
Yoon (2002)
11. Tourism causes changes to the traditionalculture of the community
Akis et al. (1996); Liu & Var(1986); Yoon et al. (1999, 2001)
12. Tourism has encouraged a variety ofcultural exchange between tourists andresidents
Liu & Var (1986); Liu et al. (1987); Teye etal. (2002); Yoon et al. (1999, 2001)
13. Increase in awareness on the importance ofthe site
Developed by the Researcher based onvarious literature
14. Mobilization of women artisans in theactive participation in the tourismprogramme
Developed by the Researcher based onvarious literature
15. Formation of activity based groups andself help groups, benefiting womencommunity
Developed by the Researcher based onvarious literature
16. Effective skill building of the womencommunity
Developed by the Researcher based onvarious literature
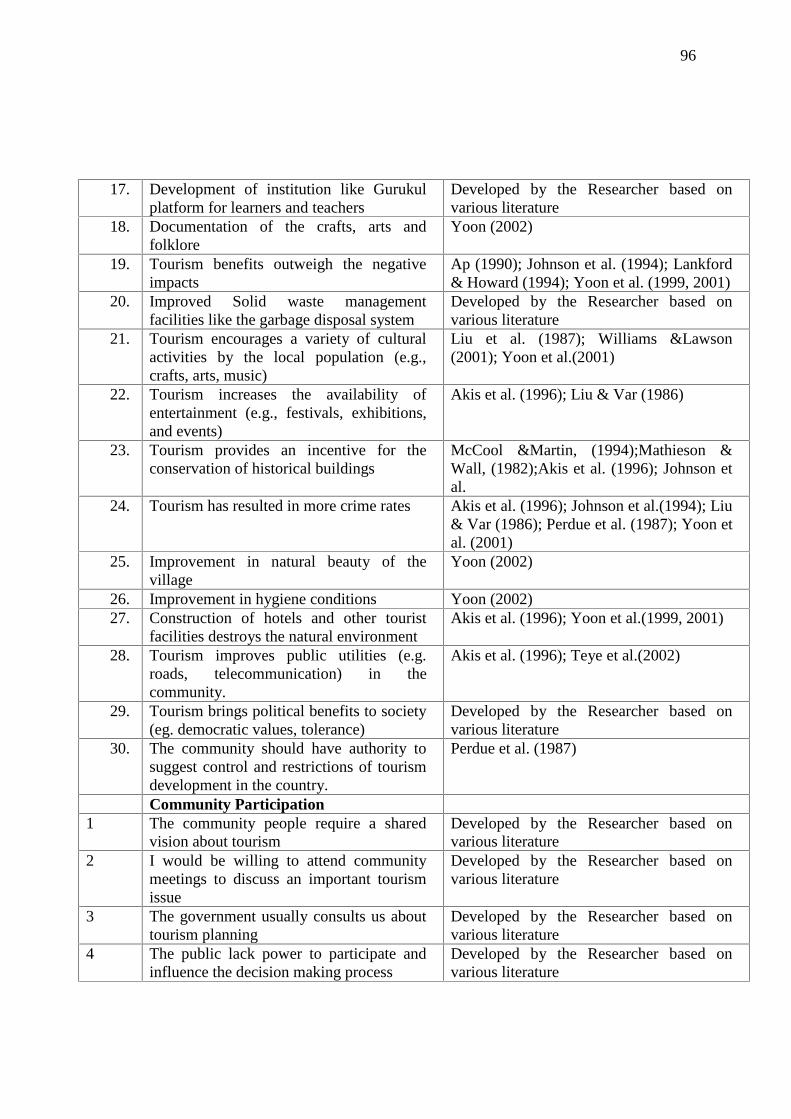
96
17. Development of institution like Gurukulplatform for learners and teachers
Developed by the Researcher based onvarious literature
18. Documentation of the crafts, arts andfolklore
Yoon (2002)
19. Tourism benefits outweigh the negativeimpacts
Ap (1990); Johnson et al. (1994); Lankford& Howard (1994); Yoon et al. (1999, 2001)
20. Improved Solid waste managementfacilities like the garbage disposal system
Developed by the Researcher based onvarious literature
21. Tourism encourages a variety of culturalactivities by the local population (e.g.,crafts, arts, music)
Liu et al. (1987); Williams &Lawson(2001); Yoon et al.(2001)
22. Tourism increases the availability ofentertainment (e.g., festivals, exhibitions,and events)
Akis et al. (1996); Liu & Var (1986)
23. Tourism provides an incentive for theconservation of historical buildings
McCool &Martin, (1994);Mathieson &Wall, (1982);Akis et al. (1996); Johnson etal.
24. Tourism has resulted in more crime rates Akis et al. (1996); Johnson et al.(1994); Liu& Var (1986); Perdue et al. (1987); Yoon etal. (2001)
25. Improvement in natural beauty of thevillage
Yoon (2002)
26. Improvement in hygiene conditions Yoon (2002)27. Construction of hotels and other tourist
facilities destroys the natural environmentAkis et al. (1996); Yoon et al.(1999, 2001)
28. Tourism improves public utilities (e.g.roads, telecommunication) in thecommunity.
Akis et al. (1996); Teye et al.(2002)
29. Tourism brings political benefits to society(eg. democratic values, tolerance)
Developed by the Researcher based onvarious literature
30. The community should have authority tosuggest control and restrictions of tourismdevelopment in the country.
Perdue et al. (1987)
Community Participation1 The community people require a shared
vision about tourismDeveloped by the Researcher based onvarious literature
2 I would be willing to attend communitymeetings to discuss an important tourismissue
Developed by the Researcher based onvarious literature
3 The government usually consults us abouttourism planning
Developed by the Researcher based onvarious literature
4 The public lack power to participate andinfluence the decision making process
Developed by the Researcher based onvarious literature
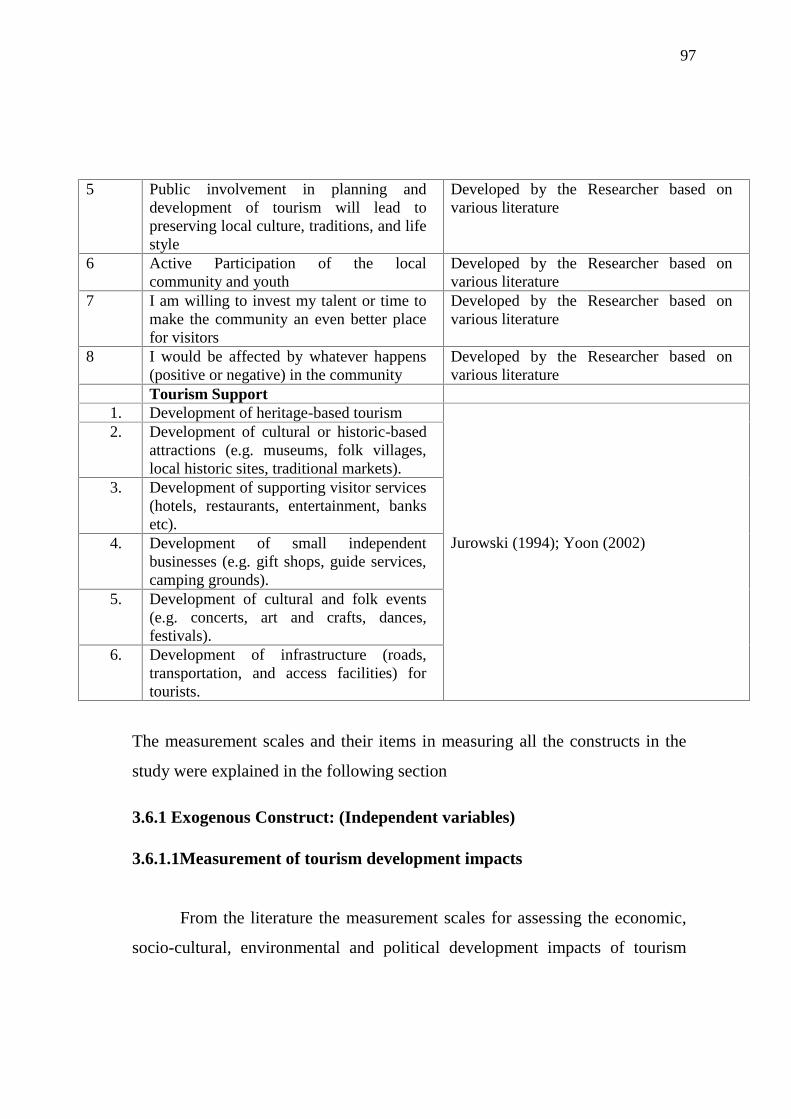
97
5 Public involvement in planning anddevelopment of tourism will lead topreserving local culture, traditions, and lifestyle
Developed by the Researcher based onvarious literature
6 Active Participation of the localcommunity and youth
Developed by the Researcher based onvarious literature
7 I am willing to invest my talent or time tomake the community an even better placefor visitors
Developed by the Researcher based onvarious literature
8 I would be affected by whatever happens(positive or negative) in the community
Developed by the Researcher based onvarious literature
Tourism Support1. Development of heritage-based tourism
Jurowski (1994); Yoon (2002)
2. Development of cultural or historic-basedattractions (e.g. museums, folk villages,local historic sites, traditional markets).
3. Development of supporting visitor services(hotels, restaurants, entertainment, banksetc).
4. Development of small independentbusinesses (e.g. gift shops, guide services,camping grounds).
5. Development of cultural and folk events(e.g. concerts, art and crafts, dances,festivals).
6. Development of infrastructure (roads,transportation, and access facilities) fortourists.
The measurement scales and their items in measuring all the constructs in the
study were explained in the following section
3.6.1 Exogenous Construct: (Independent variables)
3.6.1.1Measurement of tourism development impacts
From the literature the measurement scales for assessing the economic,
socio-cultural, environmental and political development impacts of tourism
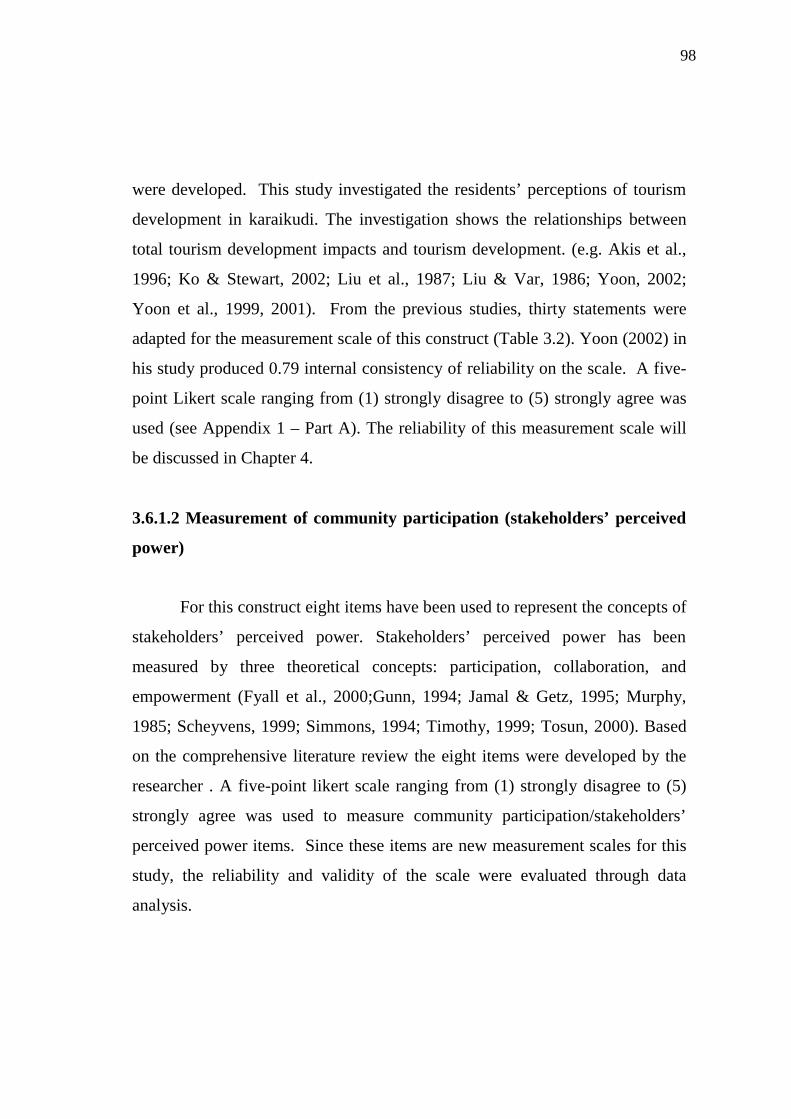
98
were developed. This study investigated the residents’ perceptions of tourism
development in karaikudi. The investigation shows the relationships between
total tourism development impacts and tourism development. (e.g. Akis et al.,
1996; Ko & Stewart, 2002; Liu et al., 1987; Liu & Var, 1986; Yoon, 2002;
Yoon et al., 1999, 2001). From the previous studies, thirty statements were
adapted for the measurement scale of this construct (Table 3.2). Yoon (2002) in
his study produced 0.79 internal consistency of reliability on the scale. A five-
point Likert scale ranging from (1) strongly disagree to (5) strongly agree was
used (see Appendix 1 – Part A). The reliability of this measurement scale will
be discussed in Chapter 4.
3.6.1.2 Measurement of community participation (stakeholders’ perceived
power)
For this construct eight items have been used to represent the concepts of
stakeholders’ perceived power. Stakeholders’ perceived power has been
measured by three theoretical concepts: participation, collaboration, and
empowerment (Fyall et al., 2000;Gunn, 1994; Jamal & Getz, 1995; Murphy,
1985; Scheyvens, 1999; Simmons, 1994; Timothy, 1999; Tosun, 2000). Based
on the comprehensive literature review the eight items were developed by the
researcher . A five-point likert scale ranging from (1) strongly disagree to (5)
strongly agree was used to measure community participation/stakeholders’
perceived power items. Since these items are new measurement scales for this
study, the reliability and validity of the scale were evaluated through data
analysis.

99
3.6.2. Endogenous Construct: (The dependent variable)
3.6.2.1 Measurement of Tourism Support
Six items are asked to the respondents to indicate if they supported or
opposed the proposed destination competitive strategies. The scale has been
based on Yoon’s (2002), the literature review, and tourism destination theories
(Buhalis, 2000; Crouch & Ritchie, 1999; Dwyer & Kim, 2001; Hassan, 2000;
Mihalic, 2000; Ritchie & Crouch, 1993, 2003; Ritchie et al., 2000). Yoon
(2002) reported reliability consistency of 0.94. A five-point Likert scale was
used to measure tourism destination competitive strategies and the degree of
support for or opposition to each suggested strategy. The scale ranges from (5)
strongly support to (1) strongly oppose.
3.6.2.2 Overall Community Satisfaction
The overall community satisfaction was measured with one item using a
five point likert scale ranging from (5) Highly satisfied to (1) Highly
dissatisfied.
3.6.3 DATA ANALYSIS
After data has been collected from the representative sample of the
population, the next step is coding of data and analyzing it to test the research
hypotheses. The statistical software SPSS 16(Statistical Package for Social
Sciences) and SEM (Structural Equation Modeling) with AMOS.21 (Analysis
of Moment Structures) software program was used for the quantitative data
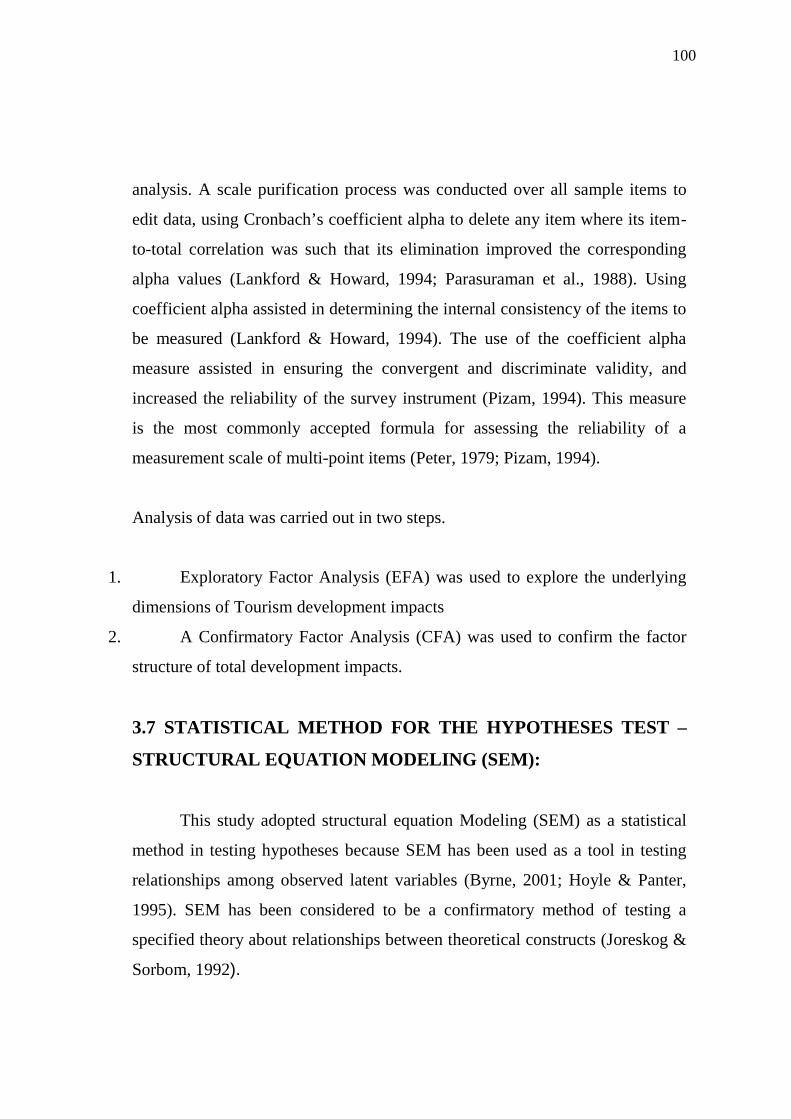
100
analysis. A scale purification process was conducted over all sample items to
edit data, using Cronbach’s coefficient alpha to delete any item where its item-
to-total correlation was such that its elimination improved the corresponding
alpha values (Lankford & Howard, 1994; Parasuraman et al., 1988). Using
coefficient alpha assisted in determining the internal consistency of the items to
be measured (Lankford & Howard, 1994). The use of the coefficient alpha
measure assisted in ensuring the convergent and discriminate validity, and
increased the reliability of the survey instrument (Pizam, 1994). This measure
is the most commonly accepted formula for assessing the reliability of a
measurement scale of multi-point items (Peter, 1979; Pizam, 1994).
Analysis of data was carried out in two steps.
1. Exploratory Factor Analysis (EFA) was used to explore the underlying
dimensions of Tourism development impacts
2. A Confirmatory Factor Analysis (CFA) was used to confirm the factor
structure of total development impacts.
3.7 STATISTICAL METHOD FOR THE HYPOTHESES TEST –
STRUCTURAL EQUATION MODELING (SEM):
This study adopted structural equation Modeling (SEM) as a statistical
method in testing hypotheses because SEM has been used as a tool in testing
relationships among observed latent variables (Byrne, 2001; Hoyle & Panter,
1995). SEM has been considered to be a confirmatory method of testing a
specified theory about relationships between theoretical constructs (Joreskog &
Sorbom, 1992).
101
3.7.1 Measurement model or Confirmatory Factor Analysis (CFA)
The two components of the structural equation modeling are: 1) the
measurement model and 2) the structural equation model. First, the
measurement model is the component of a general model in which latent
constructs are prescribed (Yoon, 2002). It is considered as the ‘null model’
(Garson, 2005). The latent constructs are unobserved variables disguised by the
covariances among two or more observed indicators (Hoyel & Panter, 1995).
The measurement model is that part of the SEM model which deals with the
latent (unobserved) variables or constructs and their indicators (observed
variables). According to Garson (2005) the pure measurement model is “a
confirmatory factor analysis (CFA) model in which there is unmeasured
covariance between each possible pair of latent variables, there are straight
arrows from the latent variables to their respective variables, but there are no
direct effects (straight arrows) connecting the latent variables”.
Each construct in the model has to be evaluated and analysed separately
through a series of model identification steps. Further, when each construct has
shown an acceptable fit to the model, then all constructs should be evaluated
together to produce a final model that is meaningful as well as statistically
acceptable. The measurement model is evaluated using goodness-of-fit
measures. Thus, the measurement model has to be firstly approved as valid
before proceeding further to the structural model testing and analysis (Garson,
2005).
102
3.7.2 Structural model
The structural model is the hypothetical model that prescribes
relationships among latent constructs and observed variables that are not
indicators of latent constructs (Hoyle & Panter, 1995). It is the set of exogenous
and endogenous variables in the model, together with direct effects (straight
arrows) connecting them (Garson, 2005). This model is the component of a
general model that relates the constructs to other constructs by providing path
coefficients (parameter values) for each of the research hypotheses.
Particularly, each estimated path coefficient can be tested for its statistical
significance for the hypotheses’ relationships, while including standard errors
(SE), and can calculate critical ratio (CR) or t-values (Bollen, 1989; Byrne,
2001; Hair et al., 1998).
In the structural model, a specific structure between latent endogenous
and exogenous constructs must be hypothesized, and the measurement model
for latent endogenous and exogenous constructs must be determined (Hair et
al., 1998; Mueller, 1996). Commonly, maximum likelihood (ML) is utilized for
the model estimation because these methods allow for the analysis of models
involving latent constructs and non-zero error covariances across structural
equations (Kline, 1998; Mueller, 1996). The structural model provides a
meaningful and parsimonious explanation for observed relationships within a
set of measured variables (MacCallum, 1995). The model also enables
explanations of direct, indirect, and total structural effects of the exogenous
latent constructs on the endogenous constructs.
103
3.7.3 Structural equation modeling
Three major types of overall model fit measures are used while
evaluating measurement and structural models: Absolute Fit measures (AFM),
Incremental Fit measures (IFM) and (Byrne, 1998; Hair et al., 1998;Hu &
Bentler, 1995; Maruyama, 1998). First, an absolute fit index is used to directly
evaluate how well an a priori theoretical model fits the sample data. Indexes of
absolute fit typically gauge ‘badness-of-fit’, though optimal fit is indicated by a
value of zero (Hoyle & Panter, 1995). Second, incremental fit index assesses
the proportionate fit by comparing a target model with a more restricted, nested
baseline model. This index concerns the degree to which the model in question
is superior to an alternative model, and typically gauges ‘goodness-of-fit’
(Hoyle & Panter, 1995). Thirdly Parsimonious Fit index measures include the
parsimonious normed fit index (PNFI) and parsimonious goodness-of-fit index
(PGFI). These measures were used to evaluate whether model fit has been
obtained by “over fitting” the data with too many coefficients.
There are different indexes to measure and evaluate the structural
equation models. Most researchers who have evaluated and compared extant
indexes encouraged reporting multiple indexes of overall fit representing the
two above-mentioned measures (Bollen, 1998; Garson, 2005; Hoyle & Panter,
1995). Kline (1998) recommended at least four tests, such as chi-square;
goodness-of-fit index (GFI); normed fit index (NFI) or comparative fit index
(CF); non-normed fit index (NNFI); and standardised root mean square residual
(SRMR). In this study I used indexes such as chi-square (χ2); degree of
freedom (DF); Akaike information criterion (AIC); root mean square residual
(RMR); root mean square error of approximation (RMSEA); normed fit index

104
(NFI); relative fit index (RFI); Tucker Lewis index (TLI); comparative fit index
(CFI); goodness-of-fit index (GFI); adjusted goodness-of-fit index (AGFI); and
Hoelter’s critical n (CN).
3.7.4 Reliability and Validity of the Measurement Scales
The internal consistency of the scale is usually assessed by using
Cronbach’s coefficient alpha, calculating the correlation between item to total,
and the overall Cronbach’s alpha of the measurement scale. The acceptable
level of reliability as recommended by Nunnally (1978) is when Cronbach’s
coefficient alpha is .70 or more. The Kaiser-Meyer-Olkin (KMO) value which
is a measure of sampling adequacy should be greater than 0.6, which indicates
that the sample was large enough to perform Factor analysis. (Hair et al., 1998)
The significance of the Bartlett’s Test of Sphericity indicates that the factor
analysis processes are correct and suitable for testing multidimensionality. The
Confirmatory factor analysis loadings also suggest that all the items taken for
scale construction qualify to develop the scale.
Further this study employed structural equation modeling as a statistical
method, the composite reliability was calculated for assessing the reliability of
a principle measure of each construct in the measurement model. A commonly
used cut-off point for composite construct reliability is 0.70 (Hair, Anderson,
Tatham, & Black, 1998; Gable & Wolf, 1993). However, values below 0.70
could be acceptable if the study is exploratory in nature. As another evaluation
method for construct reliability, the variance extracted measure can be
calculated to explain the overall variance in the indicators accounted for by the
latent construct. A higher variance extracted value explains that the indicators
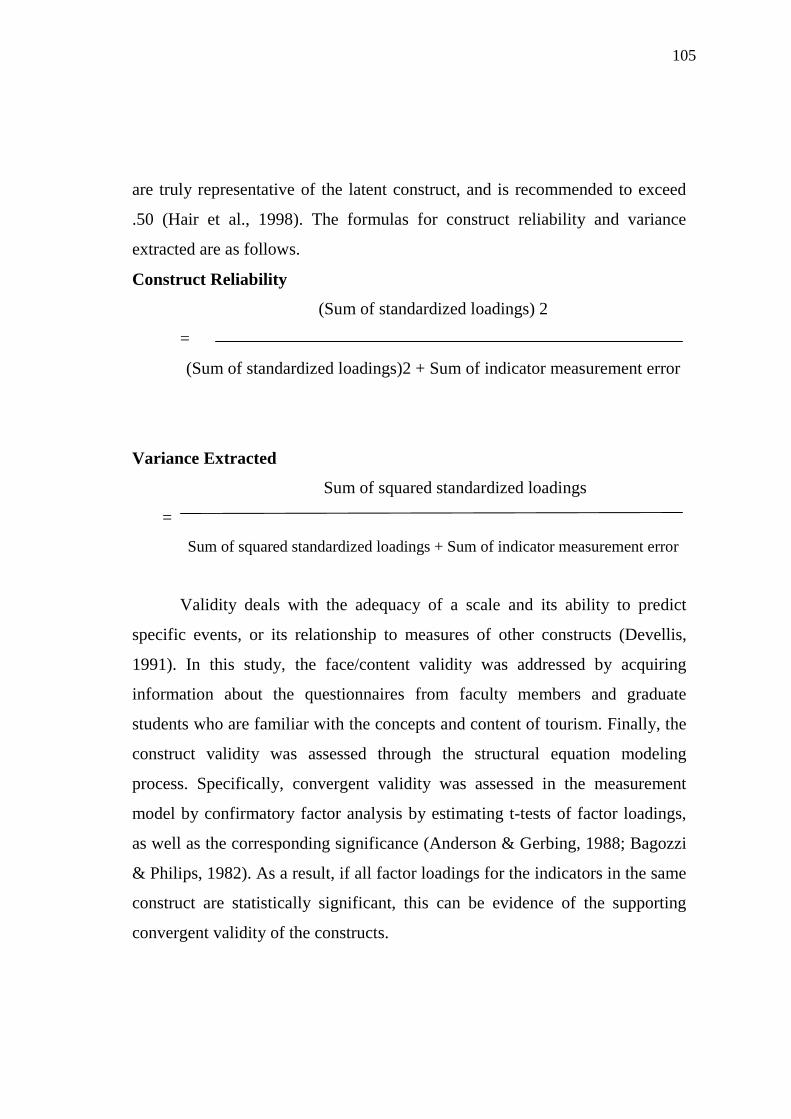
105
are truly representative of the latent construct, and is recommended to exceed
.50 (Hair et al., 1998). The formulas for construct reliability and variance
extracted are as follows.
Construct Reliability
(Sum of standardized loadings) 2
=
(Sum of standardized loadings)2 + Sum of indicator measurement error
Variance Extracted
Sum of squared standardized loadings
=
Sum of squared standardized loadings + Sum of indicator measurement error
Validity deals with the adequacy of a scale and its ability to predict
specific events, or its relationship to measures of other constructs (Devellis,
1991). In this study, the face/content validity was addressed by acquiring
information about the questionnaires from faculty members and graduate
students who are familiar with the concepts and content of tourism. Finally, the
construct validity was assessed through the structural equation modeling
process. Specifically, convergent validity was assessed in the measurement
model by confirmatory factor analysis by estimating t-tests of factor loadings,
as well as the corresponding significance (Anderson & Gerbing, 1988; Bagozzi
& Philips, 1982). As a result, if all factor loadings for the indicators in the same
construct are statistically significant, this can be evidence of the supporting
convergent validity of the constructs.

106
3.8 Other statistical tools
The Statistical tools used for data analysis are
1. Student t-test is used to compare the means between two samples.
2. Analysis Of Variance (ANOVA) is applied to compare means of two
variables.
3. Chi-Square test for the association between independent and dependent
variable.
4. Correlation test is used to prove the relationship between two variables.
5. Multiple regression is used for predicting the unknown value of a variable
from the known value of two or more variables.
3.9 Software Used
SPSS 16 (Statistical Package for Social Science)
AMOS 21 (Analysis of Moment Structure)
107
CHAPTER IV
ANALYSIS AND INTERPRETATION OF DATA
4.1 INTRODUCTION
The results and findings of data collection and statistical methods applied
are described and presented in this chapter. The preliminary tests of the collected
data are presented including the process of data coding and screening,
demographic profile of respondents. Next, the results of the descriptive statistics
of the measurement scales for the three constructs (1) tourism development
impacts, (2) community participation (stakeholders’ perceived power) and (3)
support for tourism destination competitiveness strategies are reported. Further,
Exploratory Factor Analysis (EFA) results of the three measurement scales are
reported, the overall measurement model versions are introduced, and validity
and reliability are approved. The results of the hypotheses tests applied using
Structural Equation Modeling (SEM) with AMOS version 21 are presented and
interpreted The other statistical tools like Student t-test, ANOVA, Chi-square,
Correlation and Regression analysis were applied using SPSS version 16 and
their results are reported. Finally, the qualitative data analysis is reported.
4.2 DATA COLLECTION AND RESPONSE RATE
The data is collected from the study samples of tourism stakeholders’
state and local government officials, local tourism agencies, private businesses,
residents, tourists and tourism faculties and students (researchers).This study
was limited to tourism stakeholders who reside in the state of Tamilnadu and in
the tourism destination Karaikudi. The self-administered survey questionnaire,
108
which was finalized from the pilot study was used to collect the responses from
365 tourism stakeholders between September 2010 and November 2010.
(Appendix 1 - Survey Instrument). Out of 365 survey instruments, after
eliminating the unusable responses, only 320 responses were coded and used
for the preliminary data analysis. As a result, 87% response rate was obtained.
4.3 PROFILE OF RESPONDENTS
4.3.1 Demographic Characteristics of Tourism Stakeholders
The demographic characteristics of tourism stakeholders in this study
were measured by gender, age, education, occupation, income, marital status,
family size, ethnic group, income, length of residency in Karaikudi, nature of
business and closeness to the tourism spot. Respondents were asked to provide
their answers to questions that were designed by nominal scales. The summary
of demographic characteristics of respondents is reported.(Table 4.1)
The respondents comprised male (55.6 %) and female (44.4 %), due to
socio-cultural constraints; females were less willing to participate in the survey.
Age groups have been recoded after merging small segments; the results showed
that 41.9 % of respondents were aged between 25 and 44 years, followed by age
ranges of 15-24 years (27.2%), then 44-65 years (25.6%), and 65+years
(5.3%).The results indicated that the majority of respondents (41.9%) were
middle-aged (between 25 and 44 years old).
Education levels of tourism stakeholders showed that 37.8% of
respondents had secondary level school education, 30.6% had higher
qualification, 30% elementary education while 1.6% are uneducated. This
implies that the majority of respondents (37.8%) had secondary level school
education.
109
In terms of respondents’ employment, it was found that 41.6% of the
respondents were engaged in self-employment, the government employs 6.2% of
respondents and 15.0% are employed by private sector organisations. The
students constitute 14.4 %, house-wives 7.2%, and the retired people were 4.7%.
The self help groups were 4.4% and the unemployed people were 6.6%.
From the monthly income level of the people, 40.9% have income
between Rs 5001 and Rs 10,000, followed by 24.7% less than Rs 5000. Then
20.6% of the people have Rs10,001 and Rs 15,000 and only 13.1% were above
Rs 15,000.From a marital status perspective, 61.6% of respondents were married,
and 30.3% were single. The widows and divorced respondents would constitute
only 8.1% of total respondents. 58.1% of the respondents had their family
members 4-6. Family members not more than 3 accounted for 31.6%. Only
10.3% of the respondents had their family members above seven.
In terms of respondents’ average length of residency in their place, the
nominal values revealed that 32.8% of respondents were residents of the same
place and living there for more than 20 years, followed by 6-10 years (21.2%).
17.2% of the respondents were living between 11-15 years and nearly 14% of the
respondents were between 0-5 years and 16-20 years. These results revealed how
closely the people are attached to their communities and are not frequent movers.
In terms of residence close to the tourist spots, 51.2% of the respondents
were living far away and 48.8% were living very close to the tourist spots. Of the
total respondents, 72.2 % considered themselves as working with non-tourism
related organisations; however, the remaining percentage was related directly or
indirectly to the tourism industry.
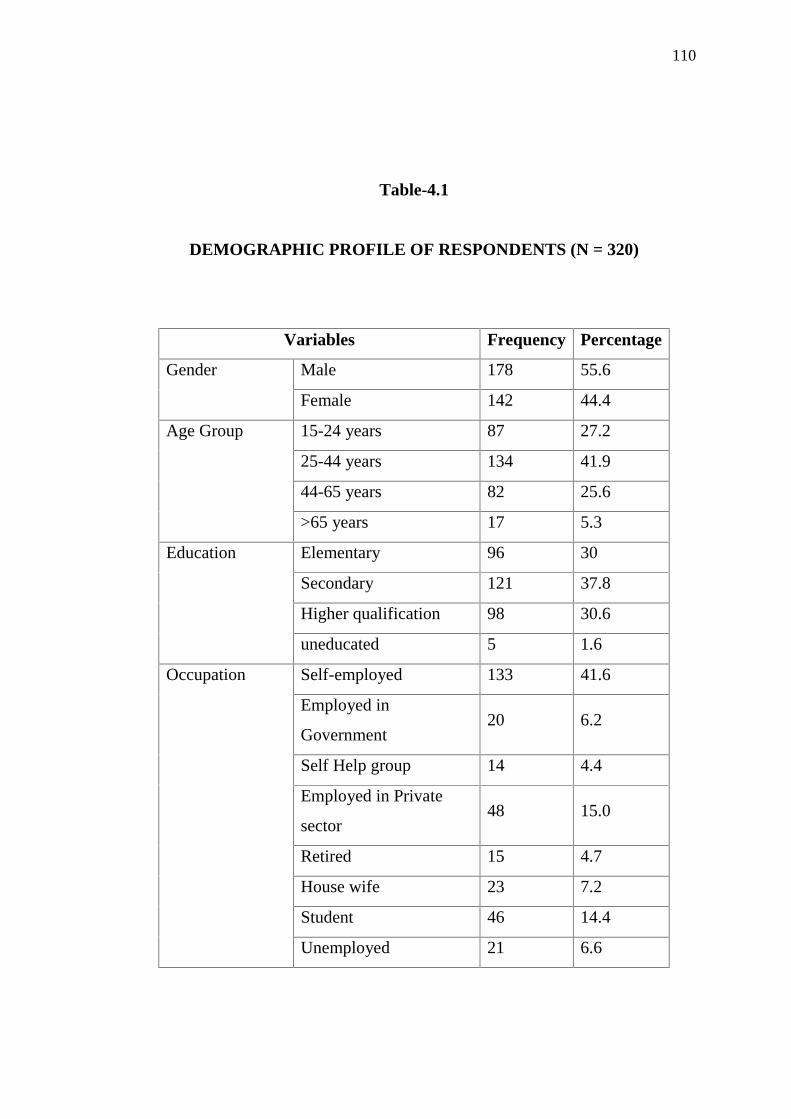
110
Table-4.1
DEMOGRAPHIC PROFILE OF RESPONDENTS (N = 320)
Variables Frequency Percentage
Gender Male 178 55.6
Female 142 44.4
Age Group 15-24 years 87 27.2
25-44 years 134 41.9
44-65 years 82 25.6
>65 years 17 5.3
Education Elementary 96 30
Secondary 121 37.8
Higher qualification 98 30.6
uneducated 5 1.6
Occupation Self-employed 133 41.6
Employed in
Government20 6.2
Self Help group 14 4.4
Employed in Private
sector48 15.0
Retired 15 4.7
House wife 23 7.2
Student 46 14.4
Unemployed 21 6.6
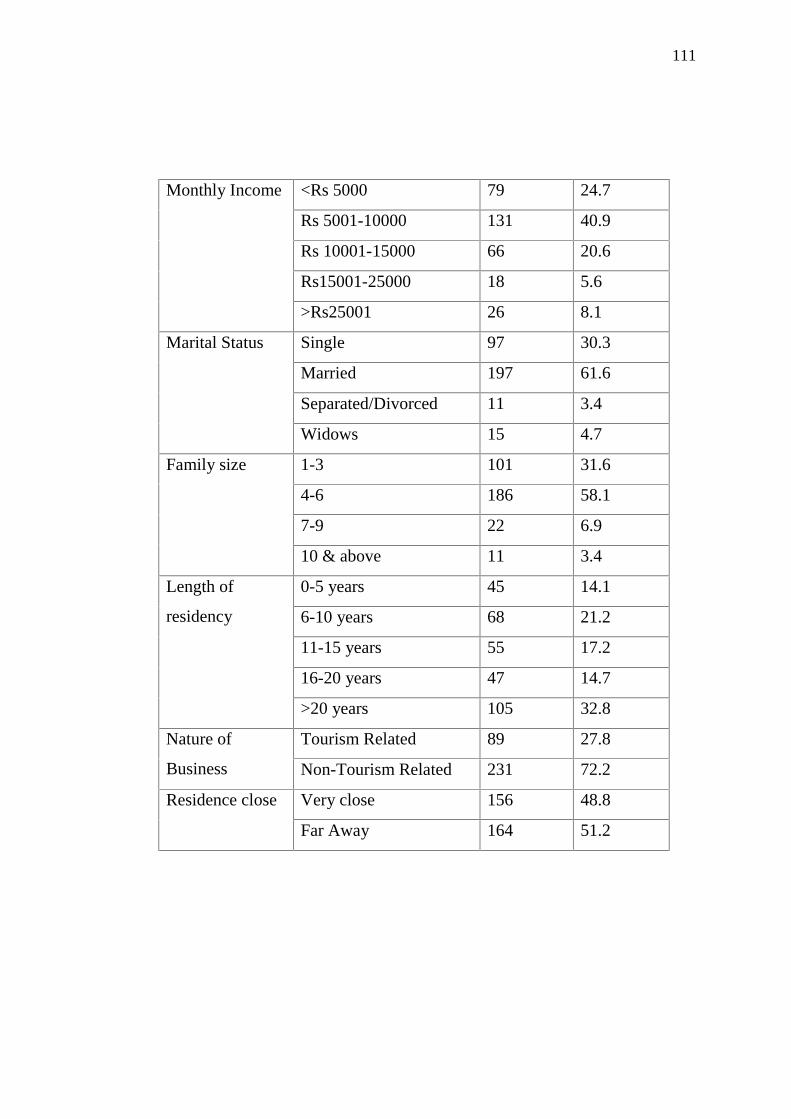
111
Monthly Income <Rs 5000 79 24.7
Rs 5001-10000 131 40.9
Rs 10001-15000 66 20.6
Rs15001-25000 18 5.6
>Rs25001 26 8.1
Marital Status Single 97 30.3
Married 197 61.6
Separated/Divorced 11 3.4
Widows 15 4.7
Family size 1-3 101 31.6
4-6 186 58.1
7-9 22 6.9
10 & above 11 3.4
Length of
residency
0-5 years 45 14.1
6-10 years 68 21.2
11-15 years 55 17.2
16-20 years 47 14.7
>20 years 105 32.8
Nature of
Business
Tourism Related 89 27.8
Non-Tourism Related 231 72.2
Residence close Very close 156 48.8
Far Away 164 51.2

112
4.4 DESCRIPTIVE ANALYSIS OF MEASUREMENT SCALES
4.4.1 Results of Tourism Development Impacts
The descriptive statistics for the different constructs of the conceptual
framework of this study were explained in this section. A higher mean score
indicates a high respondents’ rating of the item after recoding the order of the
measurement.
The results of the descriptive statistics analysis for the tourism
development impacts scale are presented in Table 4.2. This measurement scale
consisted of 30 items reflecting the perceived economic, socio-cultural,
environmental and political impacts of tourism development. Respondents were
asked to provide answers to each item based on a five-point Likert scale ranging
from 5=strongly agree to 1=strongly disagree.
Based on the descriptive statistic analysis, the mean score of each item
shows that from an economic perspective, respondents tended to disagree that
tourism increases job opportunities for the people of Karaikudi (M=2.79,
SD=1.39), and they agreed that Host community getting trained on hospitality
management (M= 3.43, SD=1.106). Additionally, they disagree the promotion of
handicraft items (M=2.65, SD=1.25). They also disagreed that Increase in
income generation to local people and small businesses (M=2.54, SD=1.10).
From a socio-cultural perspective, respondents tended to strongly agree
that tourism encourages formation of activity based groups (M=4.38, SD=1.10),
and further strongly agreed that tourism increases skill building of the women
community (M=4.30, SD=1.17). Additionally, respondents agreed that tourism
113
causes changes to the traditional culture of the community (M=3.70, SD=1.116)
in terms of, for example, lifestyle and language. Further, they strongly disagreed
that tourism Improved Solid waste management facilities like the garbage
disposal system (M=1.20, SD=1.12)
From an environmental perspective, respondents disagreed getting
incentive for the conservation of historical buildings (M=2.93, SD=1.20); on the
other hand they also disagreed that when people interfere with nature, disastrous
consequences may result such as environmental degradation and the
disappearance of certain species (M=2.75, SD=1.19). However, respondents
disagreed that the development of tourism improves public (M=2.62, SD=1.27).
From a political perspective, respondents disagree on political benefits to
society authority (M=2.36, SD=1.13) further disagreed on that they have control
and restrictions on tourism development (M=2.28, SD=1.12).

114
TABLE 4.2
DESCRIPTIVE ANALYSIS OF TOURISM DEVELOPMENT IMPACT
Se.No
VariablesMean
StandardDeviation
(SD)Part –I Tourism Development ImpactsEconomic Impact
1. Increases job opportunities 2.79 1.390
2. Increase in income generation 2.54 1.104
3. promotion of handicraft items 2.65 1.254
4. common platform to sell 2.45 1.157
5. optimally utilization of tech 1.60 1.235
6. created high investment 2.65 1.221
7. more jobs for outsiders 2.43 1.218
8. Host community trained on hospitalitymanagement
3.43 1.106
9. Collaboration for market tie-ups. 2.52 1.155
10. national and international markets 2.30 1.245
Socio-Cultural Impact11. changes to the traditional culture 3.70 1.116
12. cultural exchange between tourists andresidents
3.38 1.101
13. Increase in awareness on the importance ofthe site
1.12 1.016
14. Mobilization of women artisans 3.43 1.096
15. Formation of activity based groups 4.38 1.101
16. skill building of the women community 4.30 1.175
17. Gurukul platform to learners 2.25 1.202
18. Documentation of the crafts, arts 2.53 1.189
19. benefits outweigh negative impacts 2.33 1.166
20. Improved Solid waste management facilitieslike the garbage disposal system
1.02 1.121
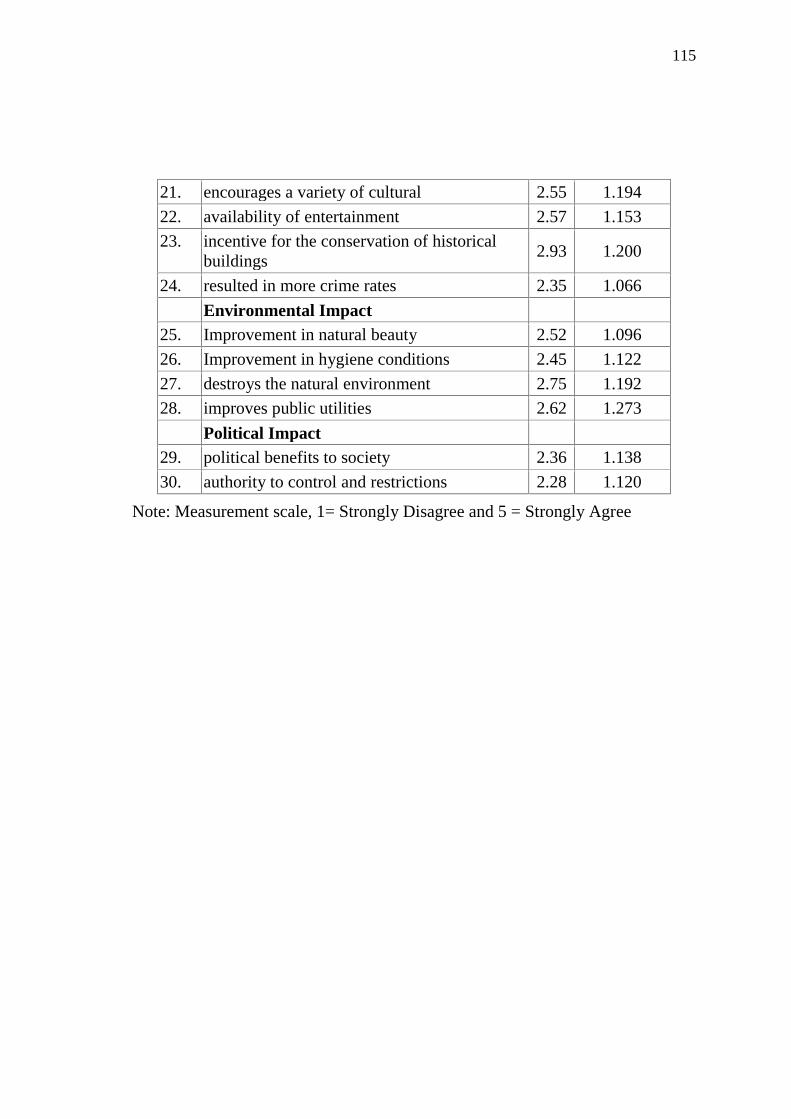
115
21. encourages a variety of cultural 2.55 1.194
22. availability of entertainment 2.57 1.153
23. incentive for the conservation of historicalbuildings
2.93 1.200
24. resulted in more crime rates 2.35 1.066
Environmental Impact25. Improvement in natural beauty 2.52 1.096
26. Improvement in hygiene conditions 2.45 1.122
27. destroys the natural environment 2.75 1.192
28. improves public utilities 2.62 1.273
Political Impact29. political benefits to society 2.36 1.138
30. authority to control and restrictions 2.28 1.120
Note: Measurement scale, 1= Strongly Disagree and 5 = Strongly Agree
116
4.4.2 Results of community participation (stakeholders’ perceived power)
The results of the descriptive statistics for stakeholders’ perceived power
is presented in Table 4.3. A total of 8 items were measured on a five-point Likert
scale ranging from 5=strongly agree to 1=strongly disagree. Higher mean scores
indicate a higher perceived level of participation, collaboration and
empowerment of tourism stakeholders. The aim of this scale is to measure the
level of satisfaction stakeholders generally have with their level of participation
in tourism planning and decision-making process, the level of collaboration
between stakeholders, and the level of empowerment granted to them by the
planning authority in Tamilnadu.
Based on respondents’ data analysis about their satisfaction with the level
of participation required a shared vision about tourism (M=4.05, SD=.91). They
also agreed that the public should have the opportunity, and even be encouraged,
to participate in planning and decision-making (M=3.98, SD=.82).
Further the respondents believed that public involvement in the planning
and development of tourism would lead to preserving local culture, traditions,
and lifestyle (M=3.62, SD=.85). Further, respondents expressed their willingness
to attend community meetings to discuss important tourism issues if they were
asked to do so (M=3.89, SD=.82). The government usually consults us about
tourism planning’ (M=3.82, SD=.60). These results indicate that respondents areseeking better involvement in tourism planning and they are sceptical about
government objectives of involving the community in the decision-making
process.

117
Table- 4.3
DESCRIPTIVE ANALYSIS OF COMMUNITY PARTICIPATIONPart-II Community Participation Mea
n
StandardDeviation
(SD)1. community require a shared vision about
tourism4.05 0.91
2. willing to attend community meetings 3.89 0.82
3. government consults us about tourismplanning
3.82 0.60
4. public lack power to participate in thedecision making process
3.98 0.821
5. Public involvement in planning anddevelopment
3.62 0.852
6. Active Participation of the local communityand youth
2.09 1.131
7. willing to invest my talent or time 3.45 1,15
8. would be affected by whatever happens in thecommunity
2.09 1.23
Note: Measurement scale, 1= Strongly Disagree and 5 = Strongly Agree
4.4.3 Results of Tourism Support Strategies
The results of the descriptive statistics for strategies favoured by
respondents to support destination competitive strategies are presented in Table
4.4. A total of 6 items were measured on a five-point Likert scale ranging from
5= strongly support and 1 = strongly oppose. Higher mean scores indicate high
of respondents on each item of the various competitive strategies.
The measurement scores of the different items shown on Table 4.4
indicate a mean scores range of between 2.01 and 4.69. The highest mean score
indicates that the strongly supportive strategy was ‘Development of cultural or
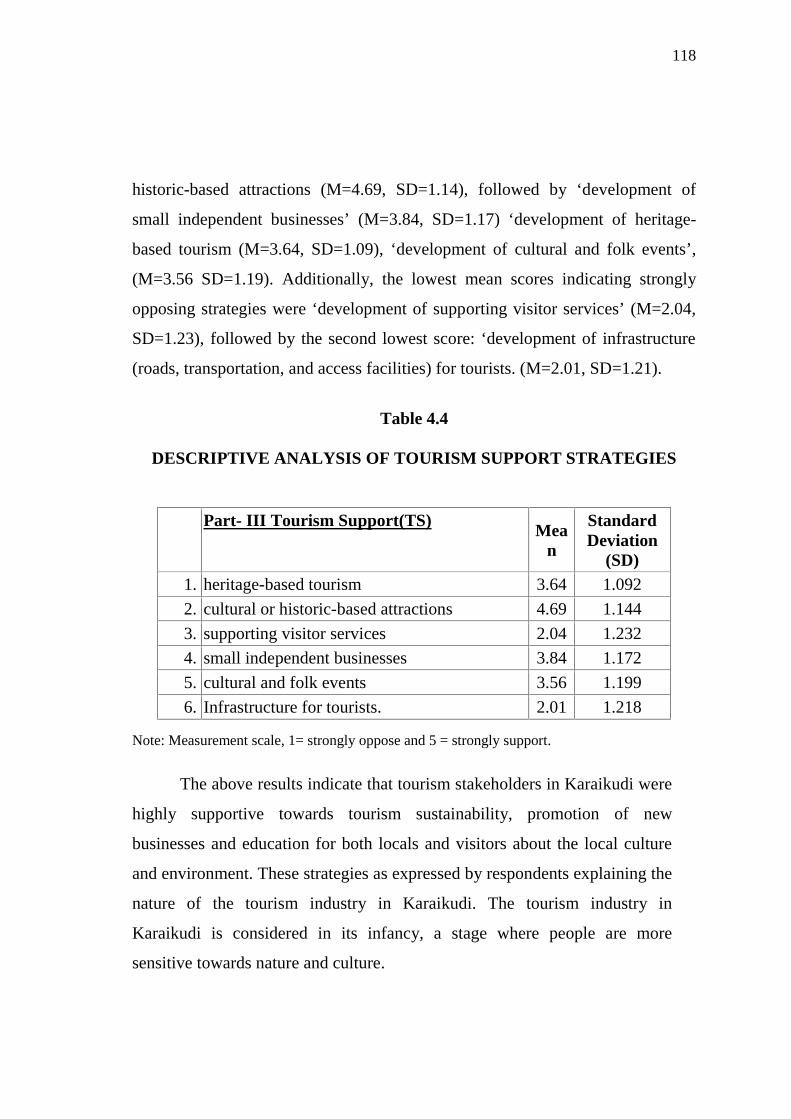
118
historic-based attractions (M=4.69, SD=1.14), followed by ‘development of
small independent businesses’ (M=3.84, SD=1.17) ‘development of heritage-
based tourism (M=3.64, SD=1.09), ‘development of cultural and folk events’,
(M=3.56 SD=1.19). Additionally, the lowest mean scores indicating strongly
opposing strategies were ‘development of supporting visitor services’ (M=2.04,
SD=1.23), followed by the second lowest score: ‘development of infrastructure
(roads, transportation, and access facilities) for tourists. (M=2.01, SD=1.21).
Table 4.4
DESCRIPTIVE ANALYSIS OF TOURISM SUPPORT STRATEGIES
Part- III Tourism Support(TS)Mea
n
StandardDeviation
(SD)1. heritage-based tourism 3.64 1.092
2. cultural or historic-based attractions 4.69 1.144
3. supporting visitor services 2.04 1.232
4. small independent businesses 3.84 1.172
5. cultural and folk events 3.56 1.199
6. Infrastructure for tourists. 2.01 1.218
Note: Measurement scale, 1= strongly oppose and 5 = strongly support.
The above results indicate that tourism stakeholders in Karaikudi were
highly supportive towards tourism sustainability, promotion of new
businesses and education for both locals and visitors about the local culture
and environment. These strategies as expressed by respondents explaining the
nature of the tourism industry in Karaikudi. The tourism industry in
Karaikudi is considered in its infancy, a stage where people are more
sensitive towards nature and culture.
119
The results of supporting tourism competitive strategies reflected
respondents’ knowledge and awareness level of the tourism industry and the
level of tourism development in the country. In addition to the above-mentioned
supportive strategies, tourism stakeholders in the interviews have mentioned
other strategies which they believed to be of more importance to the country as
well. These strategies are: ‘maintaining and promoting the exposure of a clean
environment’, ‘creating more facilities’ like rest-houses and other amenities,
‘encouraging local investments’, ‘good infrastructure’, providing proper signs in
English’, ‘increasing the number of small and middle range hotels and good
restaurants in the internal regions’, ‘utilization of many touristic sites not yet
utilized’, and ‘providing proper training for tour operators staff’.
4.5 RELIABILITY AND VALIDITY OF MEASUREMENT SCALES
4.5.1 Reliability of Measurement Scales
Reliability is a fundamental measure of any measurement scale. One of
the most popular reliability statistics is Cronbach's alpha (Cronbach, 1951).
Cronbach's alpha (α) determines the internal consistency or average correlation
of items in a survey instrument to gauge its reliability. The meaning of internal
consistency is the extent that its items are inter-correlated. The recommended
Cronabach’s coefficient (α) is above 0.70 (Nunnaly, 1978) and is acceptable as
an internally consistent scale so that further analysis can be possible. However, if
the scale has a coefficient alpha below 0.70, the scale should be examined for
any sources of measurement errors such as inadequate sampling of items,
administration errors, situational factors, sample characteristics, number of items,
and theoretical errors in developing a measurement scale.
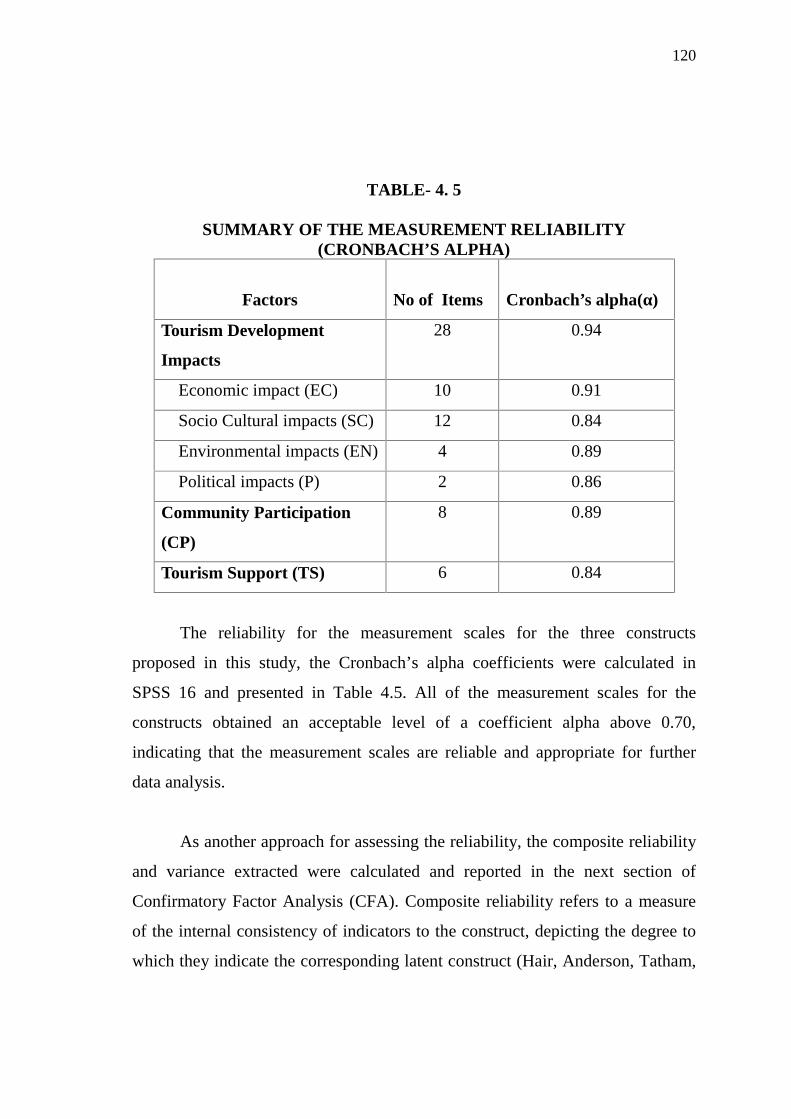
120
TABLE- 4. 5
SUMMARY OF THE MEASUREMENT RELIABILITY(CRONBACH’S ALPHA)
Factors No of Items Cronbach’s alpha(α)
Tourism Development
Impacts
28 0.94
Economic impact (EC) 10 0.91
Socio Cultural impacts (SC) 12 0.84
Environmental impacts (EN) 4 0.89
Political impacts (P) 2 0.86
Community Participation
(CP)
8 0.89
Tourism Support (TS) 6 0.84
The reliability for the measurement scales for the three constructs
proposed in this study, the Cronbach’s alpha coefficients were calculated in
SPSS 16 and presented in Table 4.5. All of the measurement scales for the
constructs obtained an acceptable level of a coefficient alpha above 0.70,
indicating that the measurement scales are reliable and appropriate for further
data analysis.
As another approach for assessing the reliability, the composite reliability
and variance extracted were calculated and reported in the next section of
Confirmatory Factor Analysis (CFA). Composite reliability refers to a measure
of the internal consistency of indicators to the construct, depicting the degree to
which they indicate the corresponding latent construct (Hair, Anderson, Tatham,
121
& Black, 1998). An acceptable level of composite reliability is .70. If the
composite reliability is above .70, the indicators for the latent construct are
reliable and are measuring the same construct. As a complementary measure of
the composite reliability, the variance extracted can be calculated to explain the
overall amount of variance in the indicators accounted for by the corresponding
latent construct. A commonly used acceptable value is .50. If the variance
extracted values are high, the indicators are truly representative of the latent
construct.
4.5.2 Validity of Measurement Scales
Validity refers the extent to which the indicators or the measurement
items measure what they are intend to measure (Hair et al., 1998).
Construct validity deals with the adequacy of a scale as a measure of a
specific variable. In general, there are two types of evidence for scale validity:
judgmental and empirical evidence (Gable & Keilty, 1998).
Judgmental validity can be obtained before the measurement scale is
administered to the target study population. It is mainly used as a method for
examining the adequacy of the conceptual and operational definition of the
measurement scale on the basis of the theoretical background. The face or
content validity provides evidence for the judgmental validity.
To verify the face or content validity, the measurement scales for the
constructs were examined by various professors, state tourism officers, economic
development specialists from the public service program, and also the director
from an NGO. Through examination of the contents of the measurement scales,
122
the content validity was achieved and further procedures and research for this
study were supported.
For the empirical evidence, after the measurement scale is administered to
the study population, the relationships among the items within the measurement
scale are examined as well as relationships to the measurements. The empirical
evidence for validity can be obtained by criterion-related validity and construct
validity.
Convergent validity was used to measure the extent to which items
implying to measure one construct indeed converge. This type of validity
evidence can be assessed by examining the t-tests for confirmatory factor
analysis loadings, since statistically significant t-tests for all confirmatory factor
loadings indicate effective measurement of the same construct (Hair et al., 1998).
The construct validity can be obtained by Exploratory Factor Analysis
(EFA). EFA provides a formal and well structured statistical basis for specifying
the minimum number of concepts required to describe the observed phenomena
with the specified degree of accuracy (Horst 1966). Factor analysis analyses a
large set of variables by identifying the common sets of variances called factors
or components. This technique helps the researcher to reduce information to a
manageable number of related variables prior to using them for further analyses
such as multiple regression or multivariate analysis of variance. Factor analysis
can be either exploratory in nature, where data are searched for the underlying
structure and to explore the interrelationships among a set of variables, or
confirmatory, where the researcher seeks to confirm a structure that has already
been identified by previous research aiming to confirm hypotheses or theories
123
concerning the structure of the underlying set of variables. In this study the
objective was to use exploratory factor analysis (EFA) and confirmatory factor
analysis (CFA) for data reduction purposes by using the Maximum Likelihood
Estimation (ML) method. Maximum likelihood estimation (ML) is an estimation
method commonly used in structure equation models (Chou & Bentler, 1995). It
is a procedure which iteratively
improves the parameter estimates to minimize a specified fit function (Hair et
al.,1998).
Before proceeding with the factor analysis, the issues related to the
factorability of data are the inspection of Bartlett’s test of sphericity whichshould be significant (p<. 05), and the Kaiser-Meyer-Olkin (KMO) measure of
sampling adequacy which should range from 0 to 1, with 0.6 suggested as the
minimum value for a good factor analysis (Hair et al., 1998, Tabachnick &
Fidell, 2001). The next assessment measure is the factor rotation and
interpretation. The most frequently used method is the Varimax method which
attempts to minimize the number of variables that have a high loading on each
factor (Tabachnick & Fidell, 2001). The greater the loading, the more the
variable is a pure measure of the factor. Comrey and Lee (1992) suggested that
loadings in excess of 0.71 (50% overlapping variance) are considered excellent,
.63 (40% overlapping variance) very good, 0.55 (30% overlapping variance)
good, 0.45 (20% overlapping variance) fair, and 0.32 (10% overlapping
variance) poor. The choice of the cut-off point for the size of loading is left to the
researcher’s preference.
124
4.6 EXPLORATORY FACTOR ANALYSIS FOR TOURISM
DEVELOPMENT IMPACTS
The measurement scale for tourism development impacts consisted of 30
items. Factor analysis was used for the purpose of condensing the number of
items in a small number of factors. Maximum likelihood estimation method was
used with varimax rotation, so the results were independent and not correlated.
The Kaiser-Meyer-Olkin (KMO) value which is a measure of sampling
adequacy is found to be 0.846, which indicates that the sample was large enough
to perform Exploratory Factor analysis. That is, a 10 to 1 ratio of the sample size
(N=320) is commonly found acceptable (Hair et al., 1998). The results of the
Bartlett’s Test of Sphericity are also significant, which indicates that the factor
analysis processes are correct and suitable for testing multidimensionality.
The 30 items were exposed to factor analysis to identify the underlying
factors, and latent root criterion (eigenvalue) value of above 1.0 (Pett et al.,
2003) and a factor loading of 0.40 were used as a benchmark for including items
in a factor. EFA was performed on the sample using the 30 variables related to
the Tourism Development Impacts. From EFA, four factors Economic impact
(EC), Socio Cultural impacts (SC)
Environmental impacts (EN) Political impacts (P) were extracted
accounting for 63.8 percent of the total variance explained. 28 items loaded
properly (Factor loadings>0.4). Two items, namely “Increase in awareness on
the importance of the site” and “Improved Solid waste management facilities like
the garbage disposal system” were removed because they did not load good
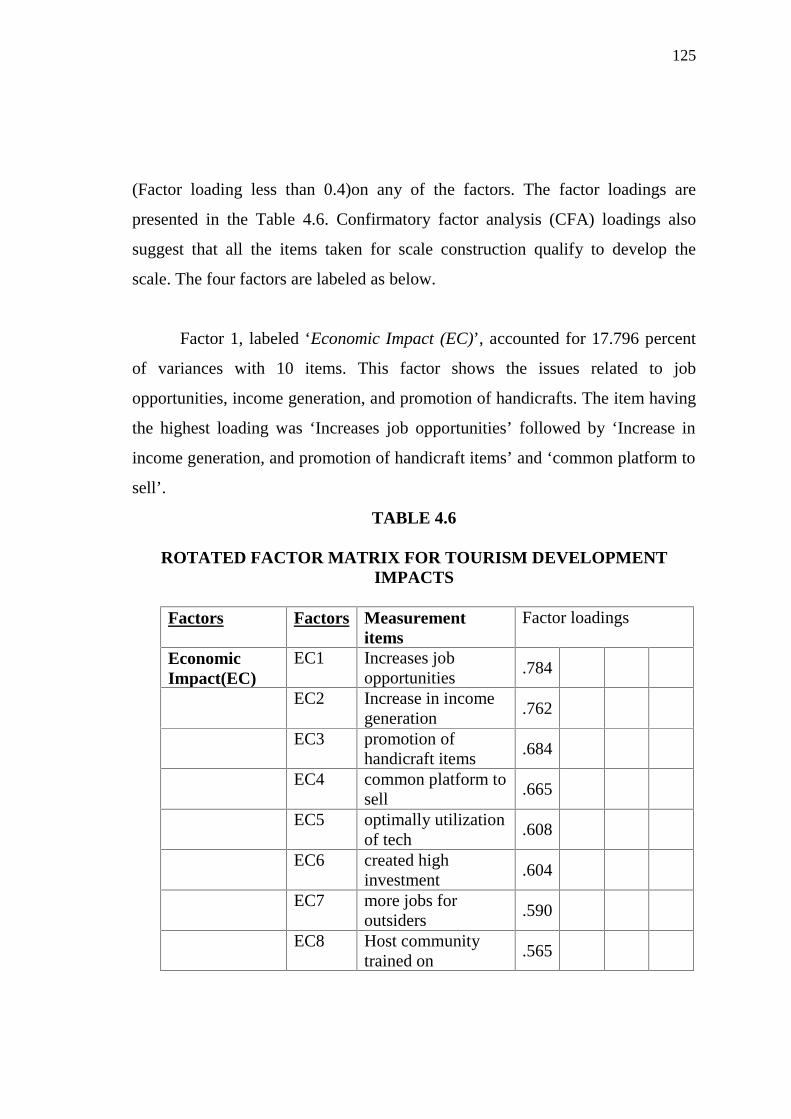
125
(Factor loading less than 0.4)on any of the factors. The factor loadings are
presented in the Table 4.6. Confirmatory factor analysis (CFA) loadings also
suggest that all the items taken for scale construction qualify to develop the
scale. The four factors are labeled as below.
Factor 1, labeled ‘Economic Impact (EC)’, accounted for 17.796 percent
of variances with 10 items. This factor shows the issues related to job
opportunities, income generation, and promotion of handicrafts. The item having
the highest loading was ‘Increases job opportunities’ followed by ‘Increase in
income generation, and promotion of handicraft items’ and ‘common platform to
sell’.
TABLE 4.6
ROTATED FACTOR MATRIX FOR TOURISM DEVELOPMENTIMPACTS
Factors Factors Measurementitems
Factor loadings
EconomicImpact(EC)
EC1 Increases jobopportunities
.784
EC2 Increase in incomegeneration
.762
EC3 promotion ofhandicraft items
.684
EC4 common platform tosell
.665
EC5 optimally utilizationof tech
.608
EC6 created highinvestment
.604
EC7 more jobs foroutsiders
.590
EC8 Host communitytrained on
.565
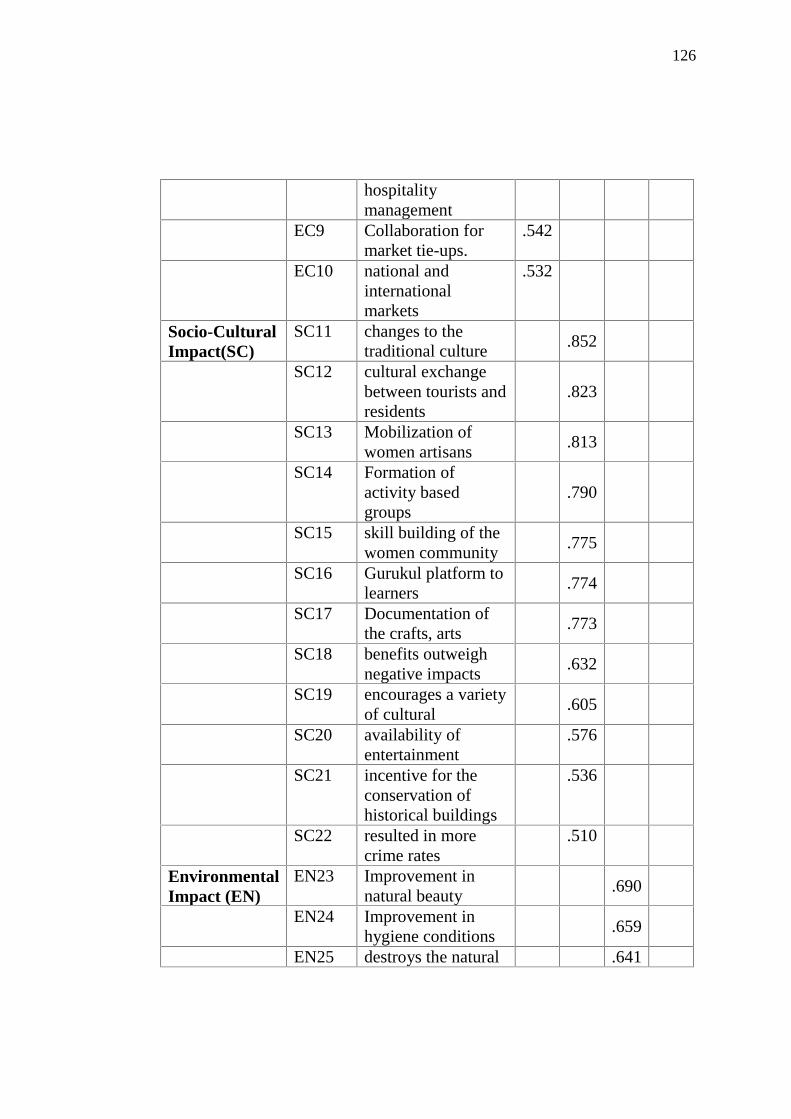
126
hospitalitymanagement
EC9 Collaboration formarket tie-ups.
.542
EC10 national andinternationalmarkets
.532
Socio-CulturalImpact(SC)
SC11 changes to thetraditional culture
.852
SC12 cultural exchangebetween tourists andresidents
.823
SC13 Mobilization ofwomen artisans
.813
SC14 Formation ofactivity basedgroups
.790
SC15 skill building of thewomen community
.775
SC16 Gurukul platform tolearners
.774
SC17 Documentation ofthe crafts, arts
.773
SC18 benefits outweighnegative impacts
.632
SC19 encourages a varietyof cultural
.605
SC20 availability ofentertainment
.576
SC21 incentive for theconservation ofhistorical buildings
.536
SC22 resulted in morecrime rates
.510
EnvironmentalImpact (EN)
EN23 Improvement innatural beauty
.690
EN24 Improvement inhygiene conditions
.659
EN25 destroys the natural .641
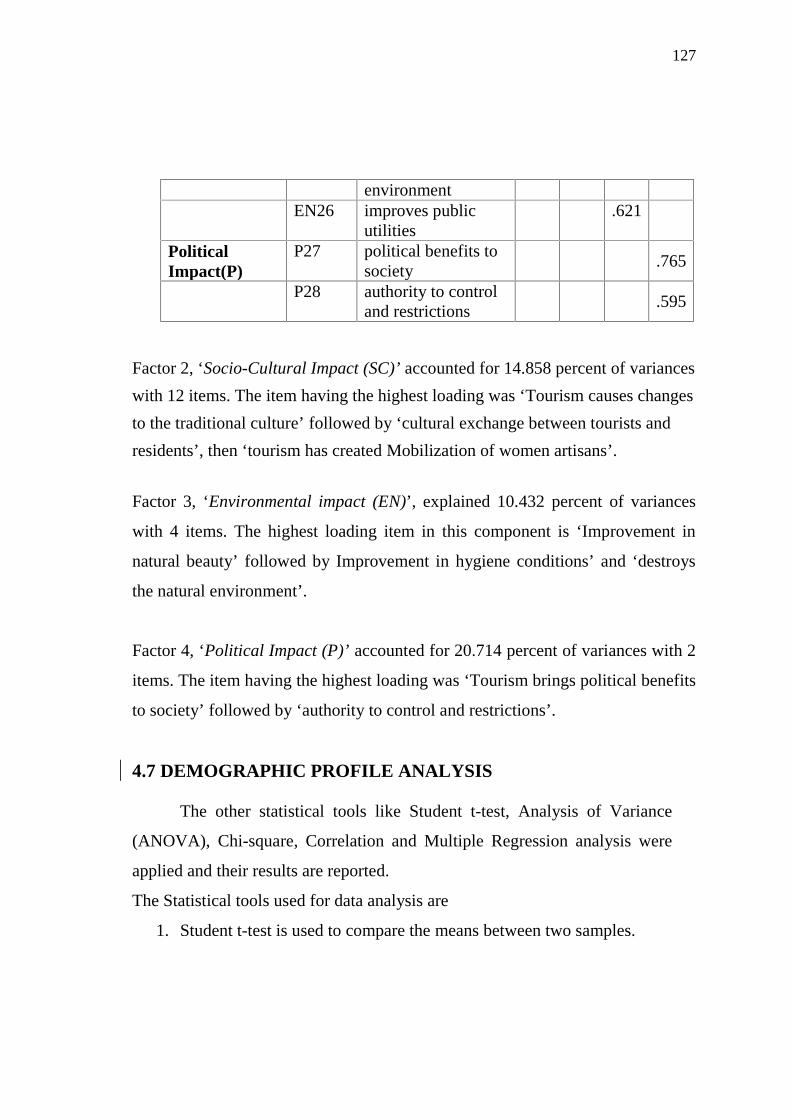
127
environmentEN26 improves public
utilities.621
PoliticalImpact(P)
P27 political benefits tosociety
.765
P28 authority to controland restrictions
.595
Factor 2, ‘Socio-Cultural Impact (SC)’ accounted for 14.858 percent of variances
with 12 items. The item having the highest loading was ‘Tourism causes changesto the traditional culture’ followed by ‘cultural exchange between tourists and
residents’, then ‘tourism has created Mobilization of women artisans’.
Factor 3, ‘Environmental impact (EN)’, explained 10.432 percent of variances
with 4 items. The highest loading item in this component is ‘Improvement in
natural beauty’ followed by Improvement in hygiene conditions’ and ‘destroys
the natural environment’.
Factor 4, ‘Political Impact (P)’ accounted for 20.714 percent of variances with 2
items. The item having the highest loading was ‘Tourism brings political benefits
to society’ followed by ‘authority to control and restrictions’.
4.7 DEMOGRAPHIC PROFILE ANALYSIS
The other statistical tools like Student t-test, Analysis of Variance
(ANOVA), Chi-square, Correlation and Multiple Regression analysis were
applied and their results are reported.
The Statistical tools used for data analysis are
1. Student t-test is used to compare the means between two samples.

128
2. Analysis Of Variance (ANOVA) is applied to compare means of two
variables.
3. Chi-Square test for test the association between independent and
dependent variable.
4. Correlation test is used to prove the relationship between two variables.
5. Multiple regression is used for predicting the unknown value of a variable
from the known value of two or more variables.
4.7.1 Students t-test
Differences between two groups in the mean scores of variables are
studied using Student t test was discussed in this section.
Null Hypothesis-7: There is no significant difference between male and female
with respect to community participation in Tourism development.
TABLE 4.7
GENDER WITH COMMUNITY PARTICIPATION IN TOURISMDEVELOPMENT
GENDER RESPONDENTS MEAN SD t value p value
Male 178 3.71 0.798
.122 0.903Female 142 3.72 0.799
Table 4.7 reveals the mean score and standard deviation between the
two groups male and female based on community participation in tourism
development. Since P value is greater than 0.05, the null hypothesis-7 is
accepted at 5 percent level of significance. Hence it is concluded that there is
no significant difference between male and female with respect to community
participation in the development of tourism. Both male and female actively
participate in tourism development.
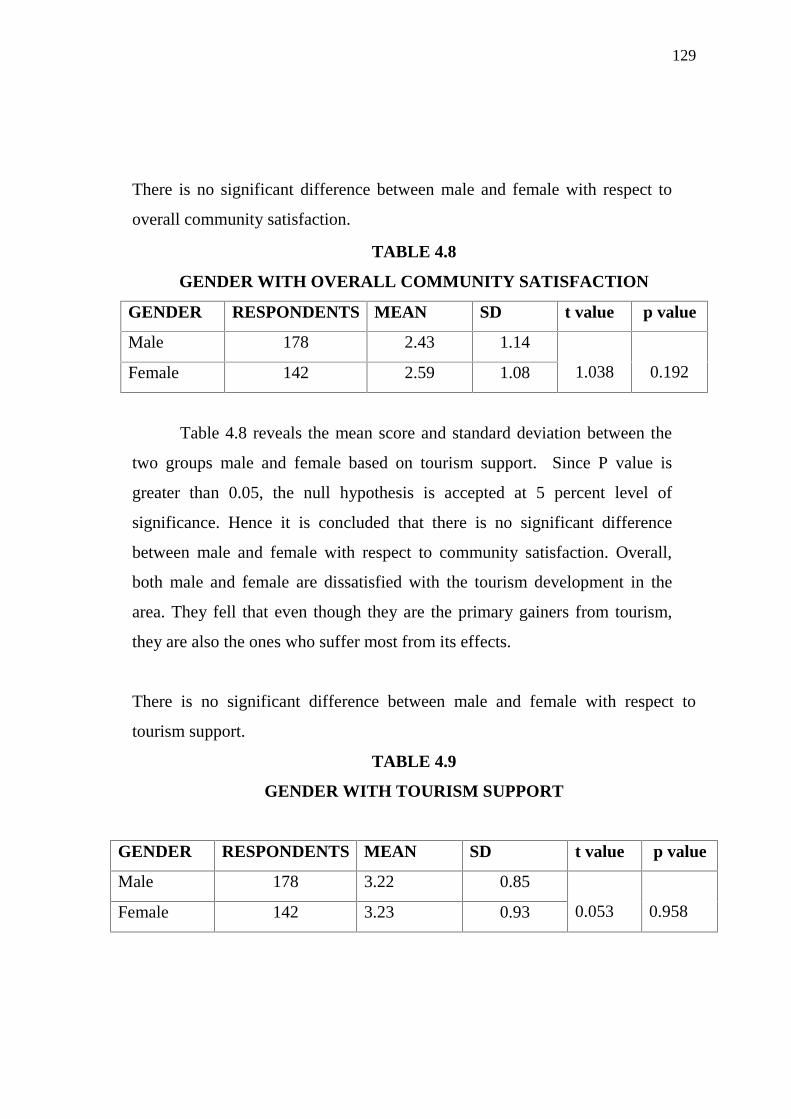
129
There is no significant difference between male and female with respect to
overall community satisfaction.
TABLE 4.8
GENDER WITH OVERALL COMMUNITY SATISFACTION
GENDER RESPONDENTS MEAN SD t value p value
Male 178 2.43 1.14
1.038 0.192Female 142 2.59 1.08
Table 4.8 reveals the mean score and standard deviation between the
two groups male and female based on tourism support. Since P value is
greater than 0.05, the null hypothesis is accepted at 5 percent level of
significance. Hence it is concluded that there is no significant difference
between male and female with respect to community satisfaction. Overall,
both male and female are dissatisfied with the tourism development in the
area. They fell that even though they are the primary gainers from tourism,
they are also the ones who suffer most from its effects.
There is no significant difference between male and female with respect to
tourism support.
TABLE 4.9
GENDER WITH TOURISM SUPPORT
GENDER RESPONDENTS MEAN SD t value p value
Male 178 3.22 0.85
0.053 0.958Female 142 3.23 0.93
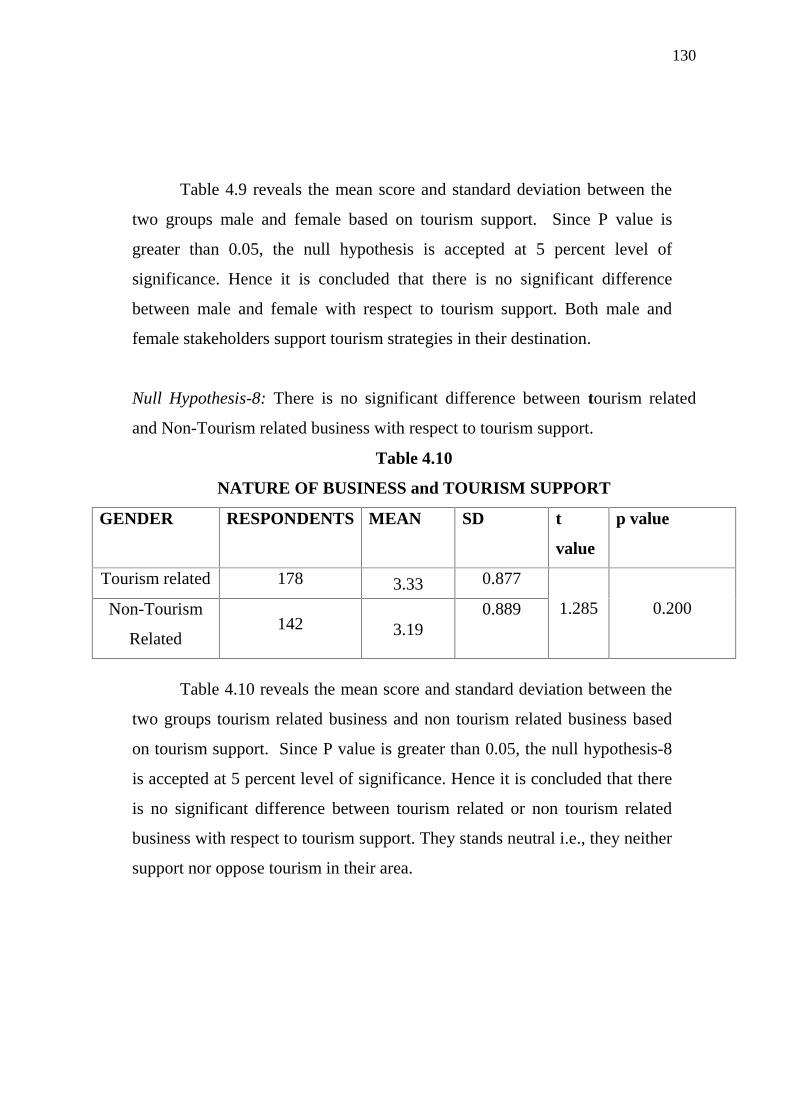
130
Table 4.9 reveals the mean score and standard deviation between the
two groups male and female based on tourism support. Since P value is
greater than 0.05, the null hypothesis is accepted at 5 percent level of
significance. Hence it is concluded that there is no significant difference
between male and female with respect to tourism support. Both male and
female stakeholders support tourism strategies in their destination.
Null Hypothesis-8: There is no significant difference between tourism related
and Non-Tourism related business with respect to tourism support.
Table 4.10
NATURE OF BUSINESS and TOURISM SUPPORT
GENDER RESPONDENTS MEAN SD t
value
p value
Tourism related 178 3.33 0.877
1.285 0.200Non-Tourism
Related142 3.19
0.889
Table 4.10 reveals the mean score and standard deviation between the
two groups tourism related business and non tourism related business based
on tourism support. Since P value is greater than 0.05, the null hypothesis-8
is accepted at 5 percent level of significance. Hence it is concluded that there
is no significant difference between tourism related or non tourism related
business with respect to tourism support. They stands neutral i.e., they neither
support nor oppose tourism in their area.

131
Null Hypothesis-9: There is no significant difference between closer to the
destination or far away with respect to tourism support.
Table 4.11
CLOSER TO THE DESTINATION OR FAR AWAY and TOURISM
SUPPORT
GENDER RESPONDENTS MEAN SD t value p value
Very close 178 3.37 0.80
2.814 0.005**Far away 142 3.09 0.945
Table 4.11 reveals the mean score and standard deviation between the
two groups’ people closer to the destination and far away from the destination
based on tourism support. Since P value is lesser than 0.01, the null
hypothesis-9 is rejected at 1 percent level of significance. Hence it is
concluded that there is significant difference between closeness to the
destination and faraway from the destination with respect to tourism support.
The people who are very close show more support than the people who are
far away from the destination.
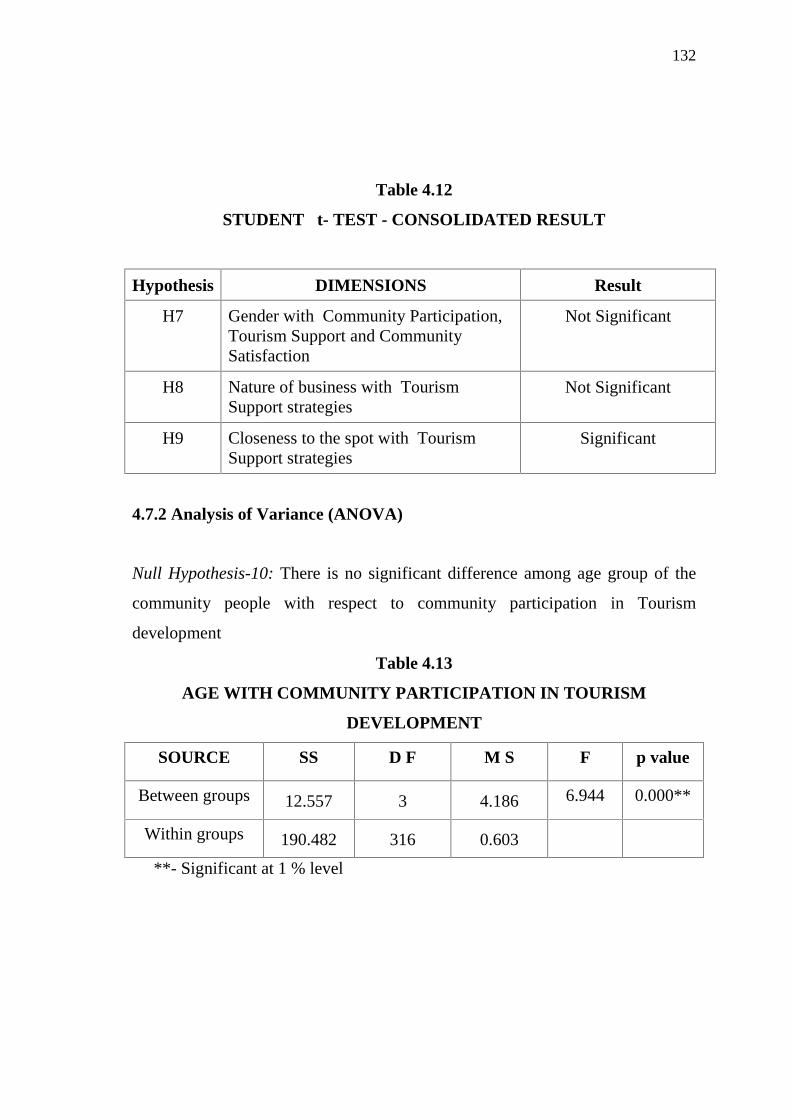
132
Table 4.12
STUDENT t- TEST - CONSOLIDATED RESULT
Hypothesis DIMENSIONS Result
H7 Gender with Community Participation,Tourism Support and CommunitySatisfaction
Not Significant
H8 Nature of business with TourismSupport strategies
Not Significant
H9 Closeness to the spot with TourismSupport strategies
Significant
4.7.2 Analysis of Variance (ANOVA)
Null Hypothesis-10: There is no significant difference among age group of the
community people with respect to community participation in Tourism
development
Table 4.13
AGE WITH COMMUNITY PARTICIPATION IN TOURISM
DEVELOPMENT
SOURCE SS D F M S F p value
Between groups 12.557 3 4.186 6.944 0.000**
Within groups 190.482 316 0.603
**- Significant at 1 % level

133
Table – 4.13.1
OVERALL MEAN AGREEABILITY SCORE
Age Group Mean SD F value p value
15-24 years 3.53ab 0.776
6.944 0.000**25-44 years 3.72bc 0.836
45-65 years 3.99c 0.665
>65 years 3.27a 0.793
Note: Different alphabet between age group denotes significant at 5% level using
Duncan Multiple Range test
From the table 4.13.1, P value is less than 0.01; the null hypothesis-10
is rejected at 1 percent level of significance. Hence it is concluded that there
is significant difference between age group of the community people with
respect to community participation in Tourism development. Based on
Duncan Multiple Range test, people with the age between 46-65 years show
higher participation (Mean=3.99) in tourism development than people with
the age groups 15-24 years and 25-44 years. The older people who are above
65 years show lower participation (Mean=3.27) in the tourism development.
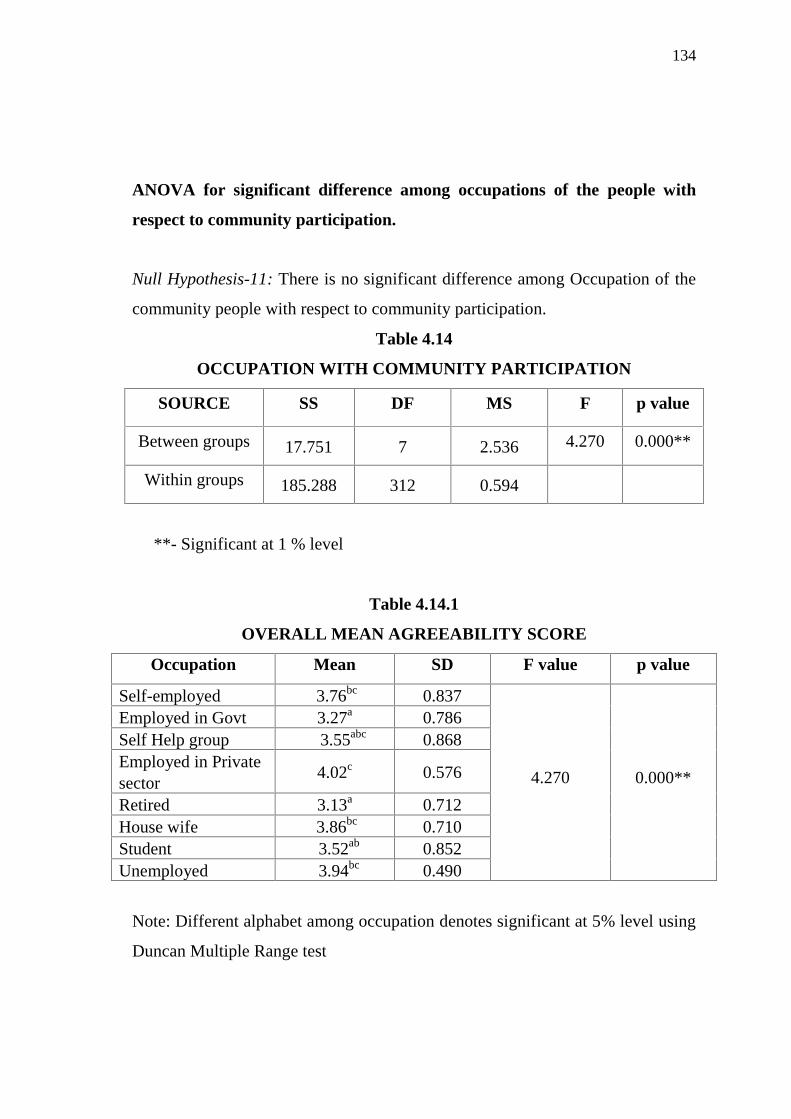
134
ANOVA for significant difference among occupations of the people with
respect to community participation.
Null Hypothesis-11: There is no significant difference among Occupation of the
community people with respect to community participation.
Table 4.14
OCCUPATION WITH COMMUNITY PARTICIPATION
SOURCE SS DF MS F p value
Between groups 17.751 7 2.536 4.270 0.000**
Within groups 185.288 312 0.594
**- Significant at 1 % level
Table 4.14.1
OVERALL MEAN AGREEABILITY SCORE
Occupation Mean SD F value p value
Self-employed 3.76bc 0.837
4.270 0.000**
Employed in Govt 3.27a 0.786Self Help group 3.55abc 0.868Employed in Privatesector
4.02c 0.576
Retired 3.13a 0.712House wife 3.86bc 0.710Student 3.52ab 0.852Unemployed 3.94bc 0.490
Note: Different alphabet among occupation denotes significant at 5% level using
Duncan Multiple Range test
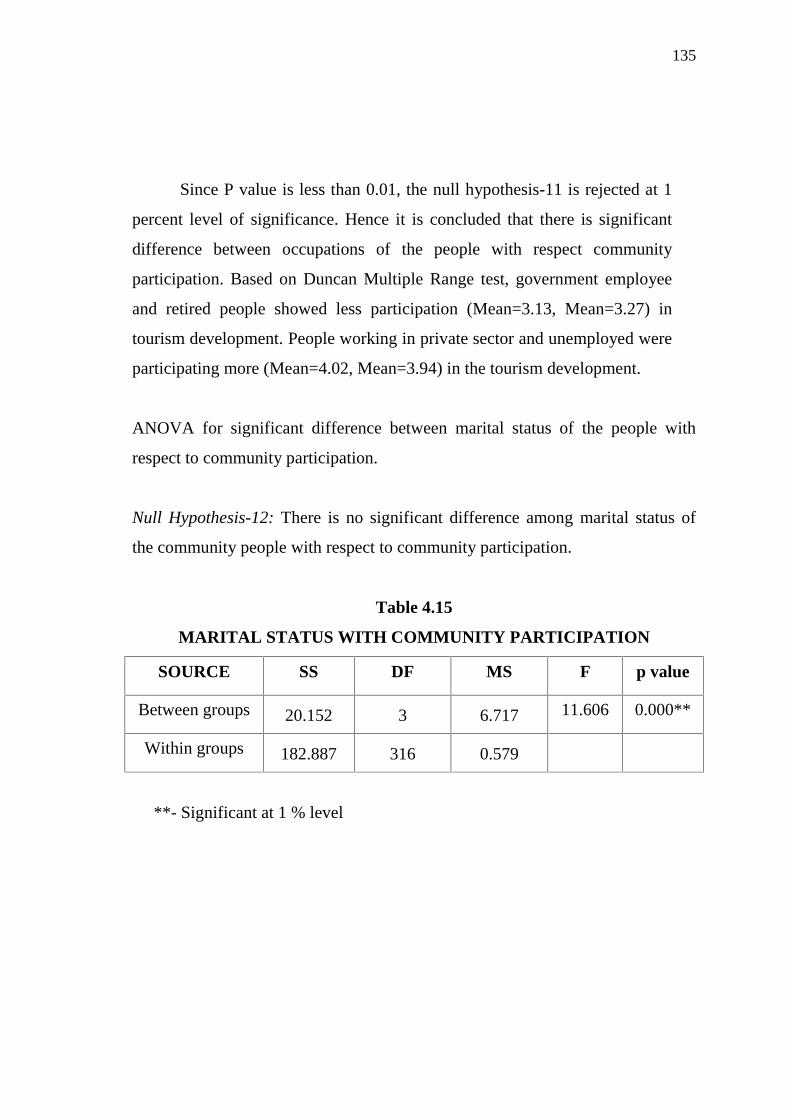
135
Since P value is less than 0.01, the null hypothesis-11 is rejected at 1
percent level of significance. Hence it is concluded that there is significant
difference between occupations of the people with respect community
participation. Based on Duncan Multiple Range test, government employee
and retired people showed less participation (Mean=3.13, Mean=3.27) in
tourism development. People working in private sector and unemployed were
participating more (Mean=4.02, Mean=3.94) in the tourism development.
ANOVA for significant difference between marital status of the people with
respect to community participation.
Null Hypothesis-12: There is no significant difference among marital status of
the community people with respect to community participation.
Table 4.15
MARITAL STATUS WITH COMMUNITY PARTICIPATION
SOURCE SS DF MS F p value
Between groups 20.152 3 6.717 11.606 0.000**
Within groups 182.887 316 0.579
**- Significant at 1 % level

136
Table – 4.15.1
OVERALL MEAN AGREEABILITY SCORE
Marital
Status
Mean SD F value p value
Single 3.46b 0.785
11.606 0.000**Married 3.86bc 0.766
Separated 2.85a 0.653
Divorced 4.01c 0.556
Note: Different alphabet between age group denotes significant at 5% level using
Duncan Multiple Range test
Since P value is less than 0.01, the null hypothesis-12 is rejected at 1
percent level of significance. Hence it is concluded that there is significant
difference between marital status of the people with respect community
participation. Based on Duncan Multiple Range test, the divorced people
showed more participation (Mean=4.01) in tourism development than the
other group of people who are staying alone and married ones. The separated
group of people showed less participation in tourism development.
ANOVA for significant difference between length of residency of the people
with respect to community participation.
Null Hypothesis-13: There is no significant difference among length of residency
of the community people with respect to community participation.

137
Table 4.16
LENGTH OF RESIDENCY WITH COMMUNITY PARTICIPATION
SOURCE SS DF MS F p value
Between groups 10.372 4 2.593 4.239 0.002*
Within groups 192.667 315 0.612
**- Significant at 1 % level
Table 4.16.1
OVERALL MEAN AGREEABILITY SCORE
Length of residency MEAN SD F value p value
0-5 years 3.70ab 0.856 4.239 0.002*6-10 years 3.59ab 0.82511-15 years 3.42a 0.898
16-20 years 3.83bc 0.700
>20 years 3.91c 0.683
Note: Different alphabet between age group denotes significant at 5% level using
Duncan Multiple Range test
Since P value is less than 0.01(Table:4.16.1), the null hypothesis - 13 is
rejected at 1 percent level of significance. Hence it is concluded that there is
significant difference among length of residency of the people with respect to
community participation. Based on Duncan Multiple Range test, the people who
live more than 20 years are more participative in the tourism development
followed by 16-20 years of residents. The people who are new to the place or
whose length of residence is less than 10 years showed less participation in
tourism development.

138
ANOVA for significant difference between age group of the people with
respect to community participation.
Null Hypothesis-14: There is no significant difference between age group of the
community people with respect to overall community satisfaction
Table 4.17
AGE WITH OVERALL COMMUNITY SATISFACTION
SOURCE SS D F M S F p value
Between groups 16.035 3 5.345 4.399 0.005**
Within groups 383.965 316 1.215
**- Significant at 1 % level
Table 4.17.1
OVERALL MEAN AGREEABILITY SCORE
Age Group Mean SD F value p value
15-24 years 2.61a 1.252
4.399 0.005**
25-44 years 2.54a 1.087
45-65 years 2.48a .970
>65 years 2.02b .993
Note: Different alphabet between age group denotes significant at 5% level using
Duncan Multiple Range test
Since P value is less than 0.01, the null hypothesis -14 is rejected at 1
percent level of significance. Hence it is concluded that there is significant
difference between age group of the community people with respect to overall
community satisfaction. Based on Duncan Multiple Range test, the older people
who are above 65 years were less satisfied (Mean=2.02) when compared to all
other age groups of people.
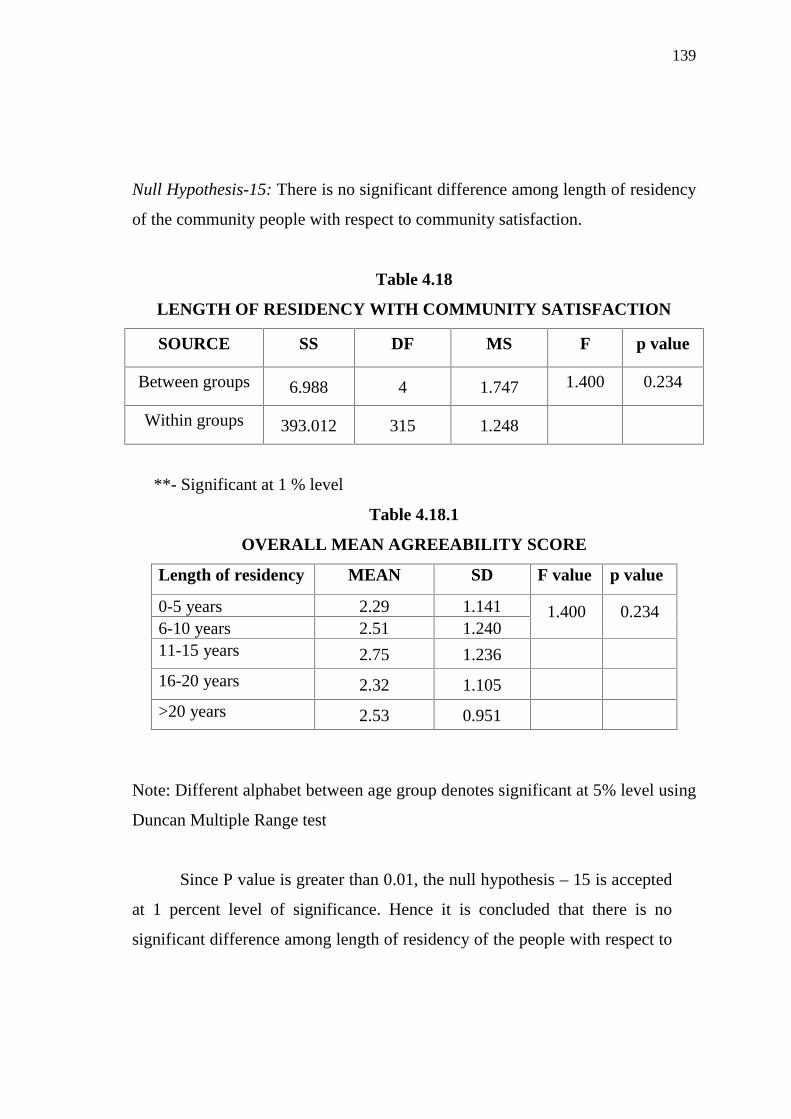
139
Null Hypothesis-15: There is no significant difference among length of residency
of the community people with respect to community satisfaction.
Table 4.18
LENGTH OF RESIDENCY WITH COMMUNITY SATISFACTION
SOURCE SS DF MS F p value
Between groups 6.988 4 1.747 1.400 0.234
Within groups 393.012 315 1.248
**- Significant at 1 % level
Table 4.18.1
OVERALL MEAN AGREEABILITY SCORE
Length of residency MEAN SD F value p value
0-5 years 2.29 1.141 1.400 0.2346-10 years 2.51 1.24011-15 years 2.75 1.236
16-20 years 2.32 1.105
>20 years 2.53 0.951
Note: Different alphabet between age group denotes significant at 5% level using
Duncan Multiple Range test
Since P value is greater than 0.01, the null hypothesis – 15 is accepted
at 1 percent level of significance. Hence it is concluded that there is no
significant difference among length of residency of the people with respect to

140
community satisfaction. The people are less satisfied with the tourism
development in the area irrespective of the period of residence.
ANOVA for significant difference between age group of the community
people with respect to Tourism Support strategies
Null Hypothesis-16: There is no significant difference between age group of the
community people with respect to Tourism Support strategies.
Table 4.19
ANOVA- AGE WITH TOURISM SUPPORT STRATEGIES
SOURCE SUM OF
SQUARES
DF MEAN
SQUARE
F p value
Between groups 7.826 3 2.609 3.391 0.018*
Within groups 243.943 316 0.769
*- Significant at 5 % level
Table 4.19.1
OVERALL MEAN AGREEABILITY SCORE
Age Group Mean SD F value p value
15-24 years 2.98a 0.852
3.391 0.018*25-44 years 3.35c 0.910
45-65 years 3.30b 0.836
>65 years 3.17a 0.934
Note: Different alphabet between age group denotes significant at 5% level using
Duncan Multiple Range test

141
Since P value is less than 0.05 (Table 4.19.1), the null hypothesis -16
is rejected at 5 percent level of significance. Hence it is concluded that there
is significant difference between age group of the community people with
respect to tourism Support strategies. The people with the age group between
15-24 years and above 65 years show less support for tourism. The people
with the age group between 25-44 years show high support for the tourism
Support strategies. The people with the age group between 45-65 years
neither support nor oppose the tourism strategies. The younger generation
people and elderly people are less supportive for tourism than the middle
aged people.
ANOVA for significant difference among occupation of the people with
respect to Tourism Support strategies
Null Hypothesis-17: There is no significant difference among occupation of the
people with respect to Tourism Support strategies.
Table 4.20
ANOVA- OCCUPATION WITH TOURISM SUPPORT STRATEGIES
SOURCE SS DF MS F p value
Between groups 35.499 7 5.071 7.344 0.000**
Within groups 215.444 312 0.691
**- Significant at 1 % level
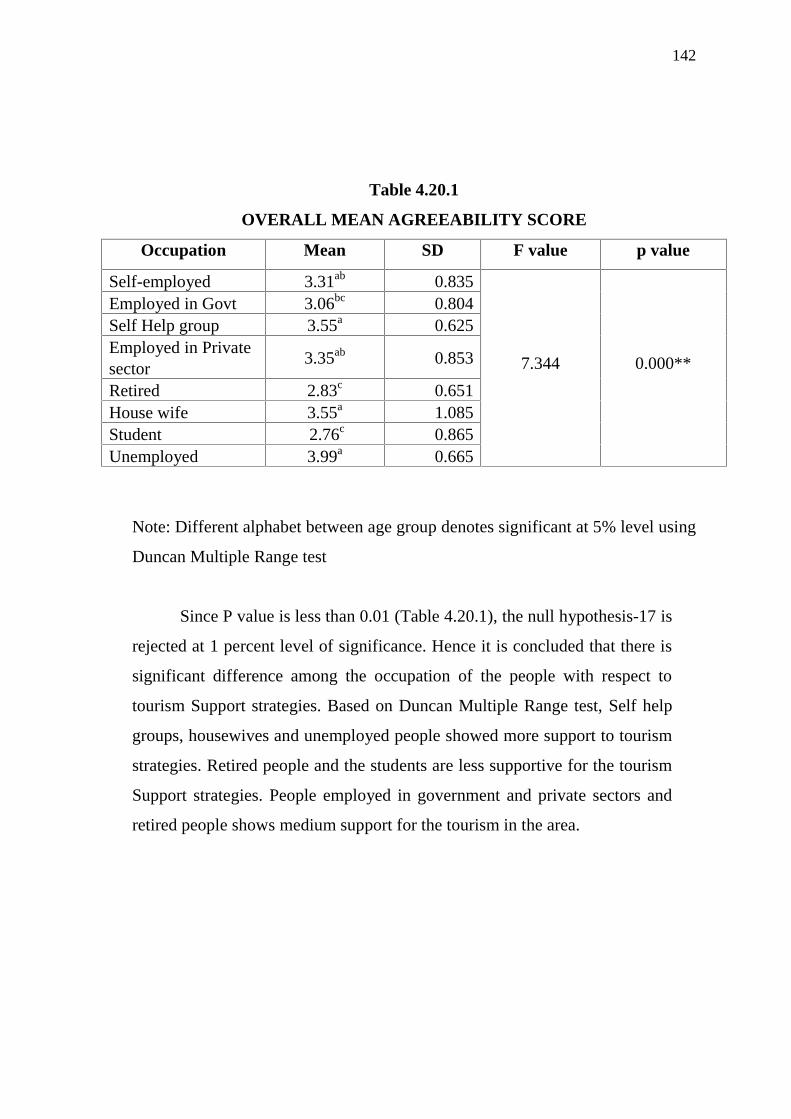
142
Table 4.20.1
OVERALL MEAN AGREEABILITY SCORE
Occupation Mean SD F value p value
Self-employed 3.31ab 0.835
7.344 0.000**
Employed in Govt 3.06bc 0.804Self Help group 3.55a 0.625Employed in Privatesector
3.35ab 0.853
Retired 2.83c 0.651House wife 3.55a 1.085Student 2.76c 0.865Unemployed 3.99a 0.665
Note: Different alphabet between age group denotes significant at 5% level using
Duncan Multiple Range test
Since P value is less than 0.01 (Table 4.20.1), the null hypothesis-17 is
rejected at 1 percent level of significance. Hence it is concluded that there is
significant difference among the occupation of the people with respect to
tourism Support strategies. Based on Duncan Multiple Range test, Self help
groups, housewives and unemployed people showed more support to tourism
strategies. Retired people and the students are less supportive for the tourism
Support strategies. People employed in government and private sectors and
retired people shows medium support for the tourism in the area.

143
ANOVA for significant difference among education qualification of the
people with respect to Tourism Support strategies
Null Hypothesis-18: There is no significant difference among education
qualification of the people with respect to Tourism Support strategies.
Table 4.21
ANOVA- EDUCATION WITH TOURISM SUPPORT STRATEGIES
SOURCE SS DF MS F p value
Between groups 13.662 3 4.554 6.065 0.001**
Within groups 237.281 316 0.751
**- Significant at 1 % level
Table 4.21.1
OVERALL MEAN AGREEABILITY SCORE
Education Mean SD F value p value
Elementary 3.43c 0.849
6.065 0.001**Secondary 3.30c 0.905Higher qualification 2.95ab 0.852Uneducated 2.67a 0.000
Note: Different alphabet between age group denotes significant at 5% level using
Duncan Multiple Range test
Since P value is less than 0.01 (Table 4.21.1), the null hypothesis-18 is
rejected at 1 percent level of significance. Hence it is concluded that there is
significant difference among education qualification of the people with
respect to tourism Support strategies. Based on Duncan Multiple Range test,
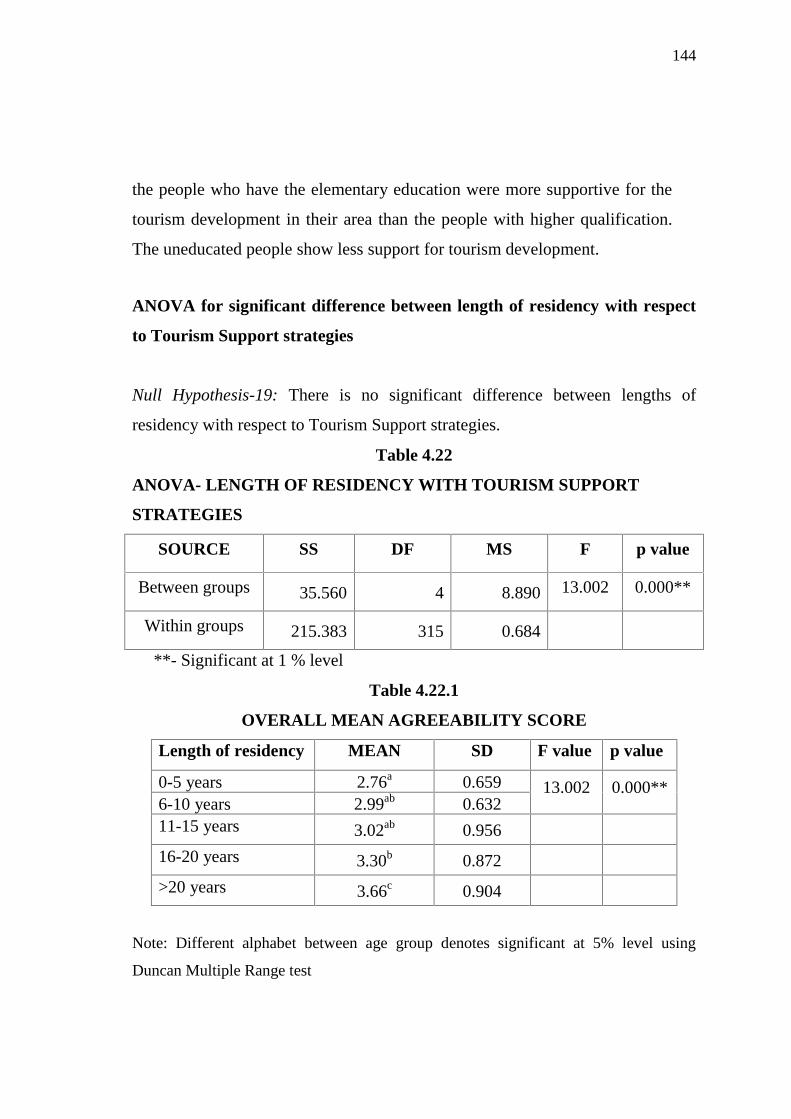
144
the people who have the elementary education were more supportive for the
tourism development in their area than the people with higher qualification.
The uneducated people show less support for tourism development.
ANOVA for significant difference between length of residency with respect
to Tourism Support strategies
Null Hypothesis-19: There is no significant difference between lengths of
residency with respect to Tourism Support strategies.
Table 4.22
ANOVA- LENGTH OF RESIDENCY WITH TOURISM SUPPORT
STRATEGIES
SOURCE SS DF MS F p value
Between groups 35.560 4 8.890 13.002 0.000**
Within groups 215.383 315 0.684
**- Significant at 1 % level
Table 4.22.1
OVERALL MEAN AGREEABILITY SCORE
Length of residency MEAN SD F value p value
0-5 years 2.76a 0.659 13.002 0.000**6-10 years 2.99ab 0.63211-15 years 3.02ab 0.956
16-20 years 3.30b 0.872
>20 years 3.66c 0.904
Note: Different alphabet between age group denotes significant at 5% level using
Duncan Multiple Range test
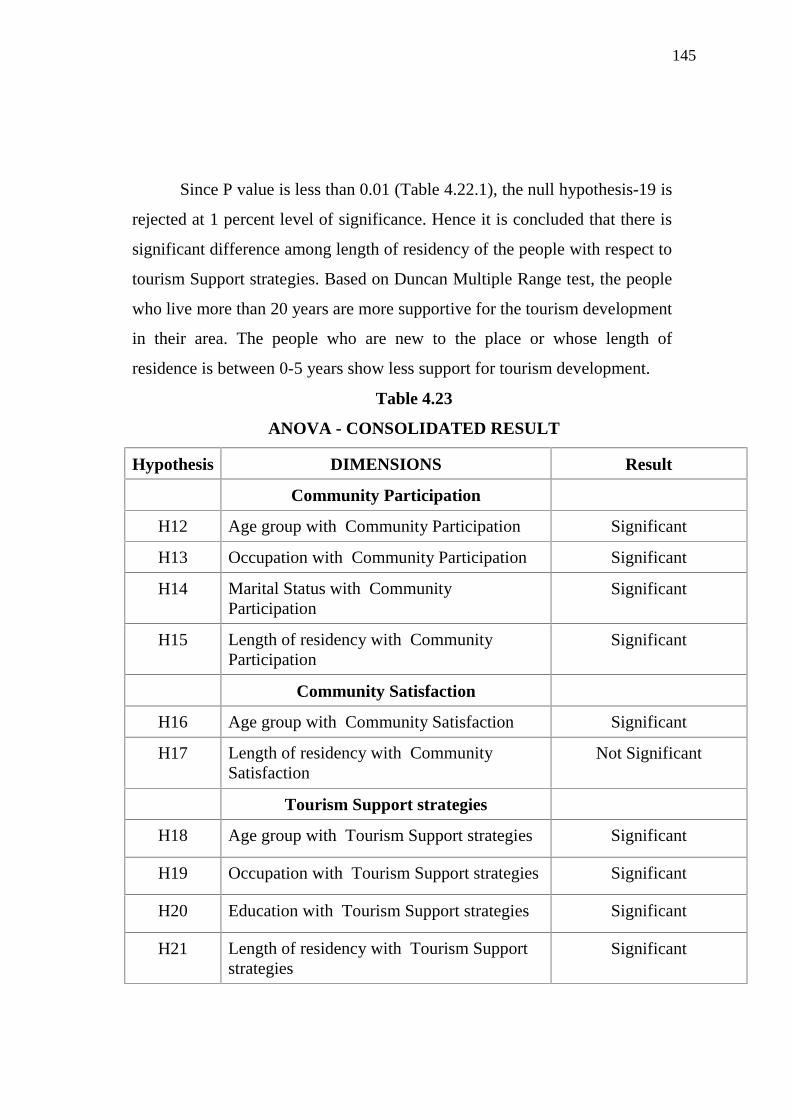
145
Since P value is less than 0.01 (Table 4.22.1), the null hypothesis-19 is
rejected at 1 percent level of significance. Hence it is concluded that there is
significant difference among length of residency of the people with respect to
tourism Support strategies. Based on Duncan Multiple Range test, the people
who live more than 20 years are more supportive for the tourism development
in their area. The people who are new to the place or whose length of
residence is between 0-5 years show less support for tourism development.
Table 4.23
ANOVA - CONSOLIDATED RESULT
Hypothesis DIMENSIONS Result
Community Participation
H12 Age group with Community Participation Significant
H13 Occupation with Community Participation Significant
H14 Marital Status with CommunityParticipation
Significant
H15 Length of residency with CommunityParticipation
Significant
Community Satisfaction
H16 Age group with Community Satisfaction Significant
H17 Length of residency with CommunitySatisfaction
Not Significant
Tourism Support strategies
H18 Age group with Tourism Support strategies Significant
H19 Occupation with Tourism Support strategies Significant
H20 Education with Tourism Support strategies Significant
H21 Length of residency with Tourism Supportstrategies
Significant
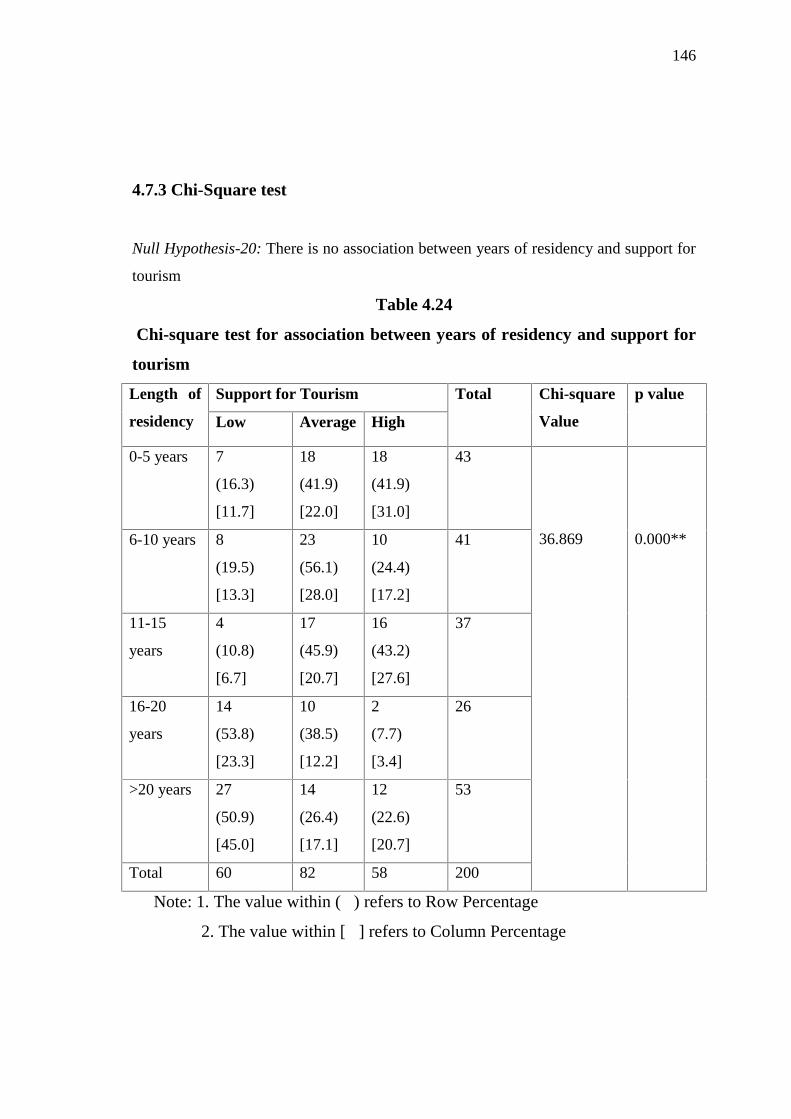
146
4.7.3 Chi-Square test
Null Hypothesis-20: There is no association between years of residency and support for
tourism
Table 4.24
Chi-square test for association between years of residency and support for
tourism
Length of
residency
Support for Tourism Total Chi-square
Value
p value
Low Average High
0-5 years 7
(16.3)
[11.7]
18
(41.9)
[22.0]
18
(41.9)
[31.0]
43
36.869 0.000**6-10 years 8
(19.5)
[13.3]
23
(56.1)
[28.0]
10
(24.4)
[17.2]
41
11-15
years
4
(10.8)
[6.7]
17
(45.9)
[20.7]
16
(43.2)
[27.6]
37
16-20
years
14
(53.8)
[23.3]
10
(38.5)
[12.2]
2
(7.7)
[3.4]
26
>20 years 27
(50.9)
[45.0]
14
(26.4)
[17.1]
12
(22.6)
[20.7]
53
Total 60 82 58 200
Note: 1. The value within ( ) refers to Row Percentage
2. The value within [ ] refers to Column Percentage
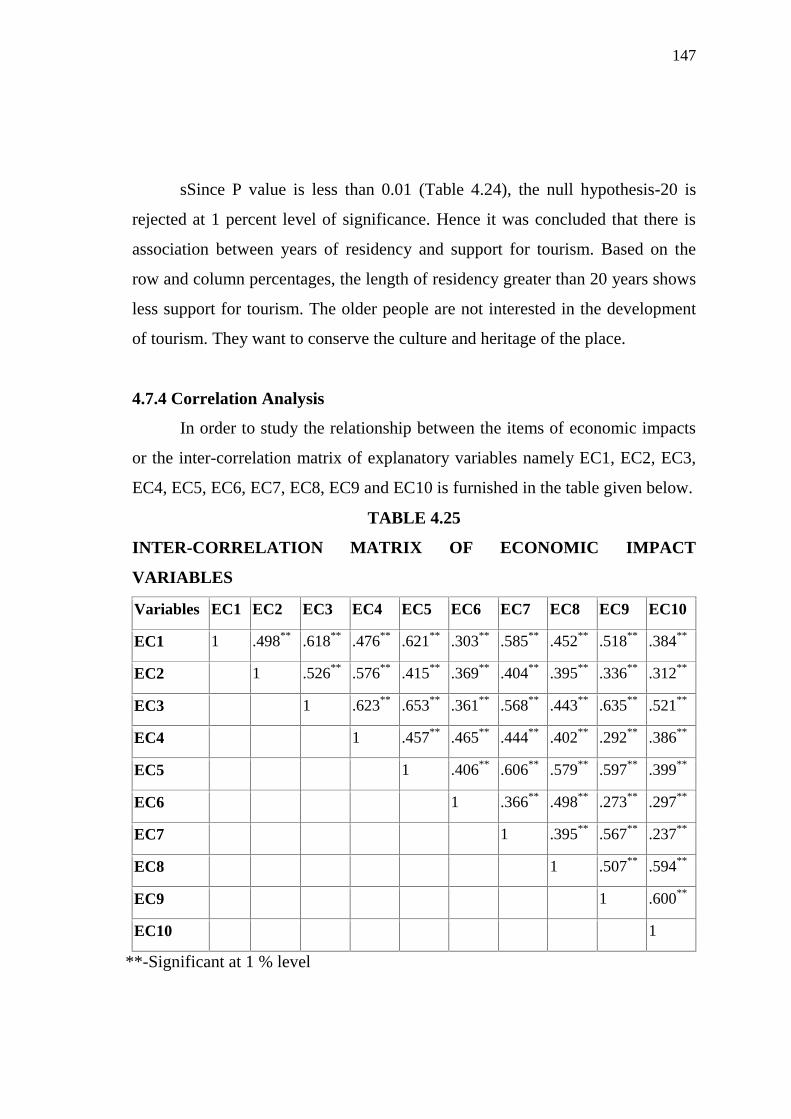
147
sSince P value is less than 0.01 (Table 4.24), the null hypothesis-20 is
rejected at 1 percent level of significance. Hence it was concluded that there is
association between years of residency and support for tourism. Based on the
row and column percentages, the length of residency greater than 20 years shows
less support for tourism. The older people are not interested in the development
of tourism. They want to conserve the culture and heritage of the place.
4.7.4 Correlation Analysis
In order to study the relationship between the items of economic impacts
or the inter-correlation matrix of explanatory variables namely EC1, EC2, EC3,
EC4, EC5, EC6, EC7, EC8, EC9 and EC10 is furnished in the table given below.
TABLE 4.25
INTER-CORRELATION MATRIX OF ECONOMIC IMPACT
VARIABLES
Variables EC1 EC2 EC3 EC4 EC5 EC6 EC7 EC8 EC9 EC10
EC1 1 .498** .618** .476** .621** .303** .585** .452** .518** .384**
EC2 1 .526** .576** .415** .369** .404** .395** .336** .312**
EC3 1 .623** .653** .361** .568** .443** .635** .521**
EC4 1 .457** .465** .444** .402** .292** .386**
EC5 1 .406** .606** .579** .597** .399**
EC6 1 .366** .498** .273** .297**
EC7 1 .395** .567** .237**
EC8 1 .507** .594**
EC9 1 .600**
EC10 1
**-Significant at 1 % level

148
It is seen from the above table 4.25 the correlation between all the
explanatory variables are highly significant and positive.
The inter-correlation matrix of explanatory variables namely SC11, SC12,
SC13, SC14, SC15, SC16, SC17, SC18, SC19, SC20, SC21, and SC22 is
furnished in the table 4.26 given below.
TABLE 4.26
INTER-CORRELATION MATRIX OF SOCIO-CULTURAL IMPACT
VARIABLES
Variables SC11 SC12 SC13 SC14 SC15 SC16 SC17 SC18 SC19 SC20 SC21 SC22
SC11 1 .218** .539** .236** .462** .400** .336** .254** .221** .239** .208** .409**
SC12 1 .364** .617** .338** .353** .364** .312** .411** .461** .296** .126*
SC13 1 .447** .680** .428** .505** .387** .452** .387** .341** .319**
SC14 1 .446** .481** .328** .450** .341** .379** .208** .251**
SC15 1 .306** .512** .464** .405** .445** .247** .312**
SC16 1 .426** .297** .207** .236** .239** .322**
SC17 1 .402** .521** .372** .416** .377**
SC18 1 .306** .521** .287** .371**
SC19 1 .546** .490** .215**
SC20 1 .492** .247**
SC21 1 .210**
SC22 1
**Significant at 1 % level
* Significant at 5 % level
It is seen from the above table 4.26 the correlation between all the socio
cultural variables are highly significant and positive.
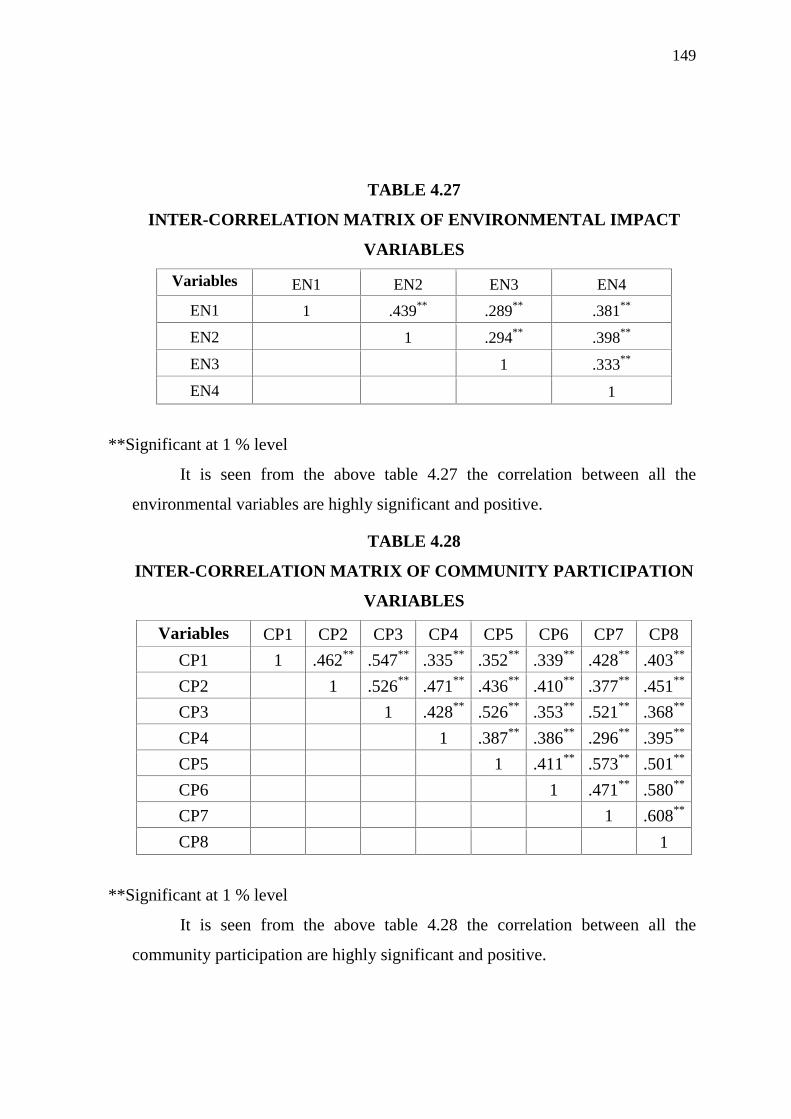
149
TABLE 4.27
INTER-CORRELATION MATRIX OF ENVIRONMENTAL IMPACT
VARIABLES
Variables EN1 EN2 EN3 EN4
EN1 1 .439** .289** .381**
EN2 1 .294** .398**
EN3 1 .333**
EN4 1
**Significant at 1 % level
It is seen from the above table 4.27 the correlation between all the
environmental variables are highly significant and positive.
TABLE 4.28
INTER-CORRELATION MATRIX OF COMMUNITY PARTICIPATION
VARIABLES
Variables CP1 CP2 CP3 CP4 CP5 CP6 CP7 CP8
CP1 1 .462** .547** .335** .352** .339** .428** .403**
CP2 1 .526** .471** .436** .410** .377** .451**
CP3 1 .428** .526** .353** .521** .368**
CP4 1 .387** .386** .296** .395**
CP5 1 .411** .573** .501**
CP6 1 .471** .580**
CP7 1 .608**
CP8 1
**Significant at 1 % level
It is seen from the above table 4.28 the correlation between all the
community participation are highly significant and positive.
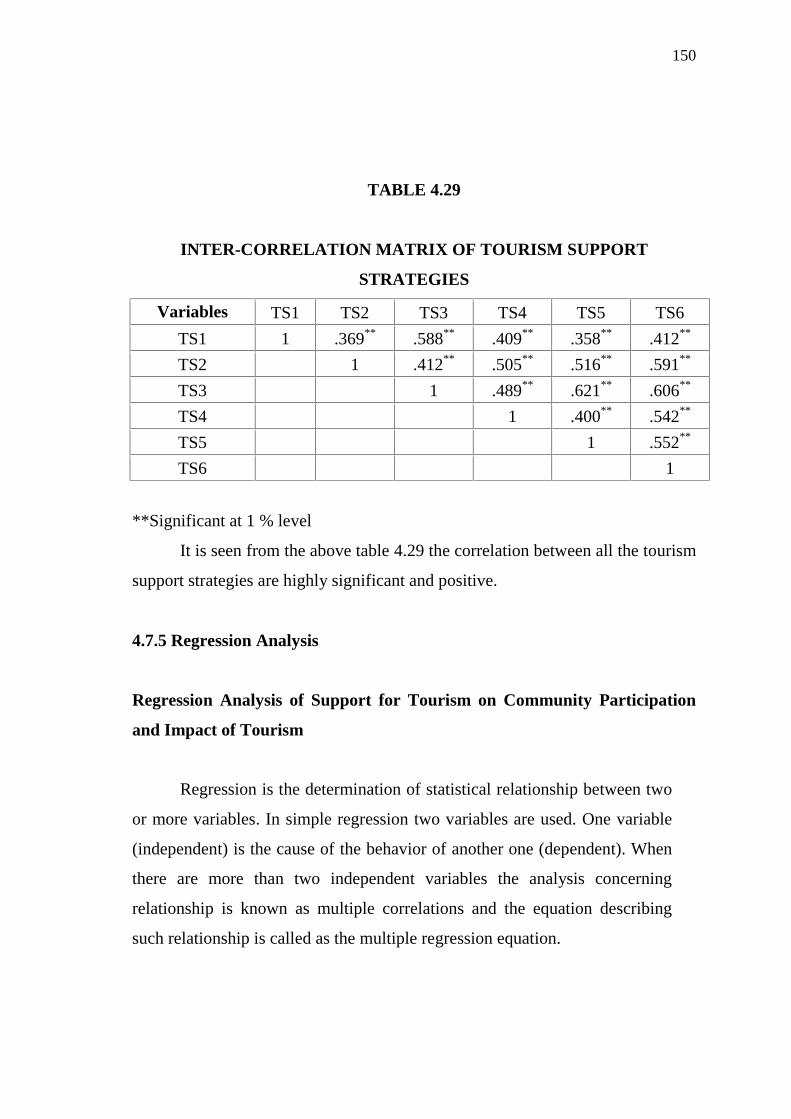
150
TABLE 4.29
INTER-CORRELATION MATRIX OF TOURISM SUPPORT
STRATEGIES
Variables TS1 TS2 TS3 TS4 TS5 TS6
TS1 1 .369** .588** .409** .358** .412**
TS2 1 .412** .505** .516** .591**
TS3 1 .489** .621** .606**
TS4 1 .400** .542**
TS5 1 .552**
TS6 1
**Significant at 1 % level
It is seen from the above table 4.29 the correlation between all the tourism
support strategies are highly significant and positive.
4.7.5 Regression Analysis
Regression Analysis of Support for Tourism on Community Participation
and Impact of Tourism
Regression is the determination of statistical relationship between two
or more variables. In simple regression two variables are used. One variable
(independent) is the cause of the behavior of another one (dependent). When
there are more than two independent variables the analysis concerning
relationship is known as multiple correlations and the equation describing
such relationship is called as the multiple regression equation.
151
Regression analysis is concerned with the derivation of an appropriate
mathematical expression is derived for finding values of a dependent variable
on the basis of independent variable. It is thus designed to examine the
relationship of a variable Y to a set of other variables X1, X2, X3………….An.
the most commonly used linear equation in Y=b1 X1 + b2 X2 +……+ ban An +
b0
Here Y is the dependent variable, which is to be found. X1 , X2 ,… and
An are the known variables with which predictions are to be made and b1, b2
,….ban are coefficient of the variables.
In this study, the dependent variable is support for tourism, independent
variables are tourism development impacts (economic, socio-cultural,
Environmental and political impact of tourism) and community participation.
The analysis is discussed as follows:
Dependent variable : Support for tourism (Y)
Independent variables : 1. Tourism Development Impacts (X1)
2. Community Participation (X2)
Multiple R value : 0.616
R Square value : 0.379
F value : 60.165
P value : 0.000**
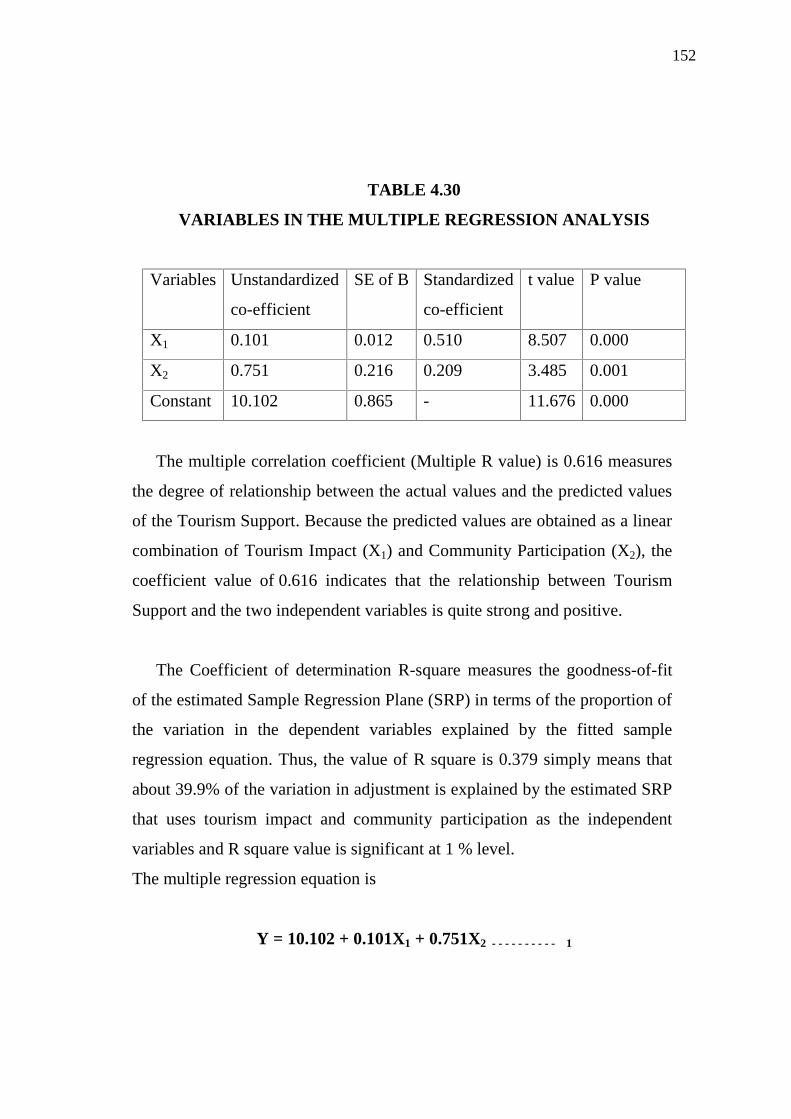
152
TABLE 4.30
VARIABLES IN THE MULTIPLE REGRESSION ANALYSIS
Variables Unstandardized
co-efficient
SE of B Standardized
co-efficient
t value P value
X1 0.101 0.012 0.510 8.507 0.000
X2 0.751 0.216 0.209 3.485 0.001
Constant 10.102 0.865 - 11.676 0.000
The multiple correlation coefficient (Multiple R value) is 0.616 measures
the degree of relationship between the actual values and the predicted values
of the Tourism Support. Because the predicted values are obtained as a linear
combination of Tourism Impact (X1) and Community Participation (X2), the
coefficient value of 0.616 indicates that the relationship between Tourism
Support and the two independent variables is quite strong and positive.
The Coefficient of determination R-square measures the goodness-of-fit
of the estimated Sample Regression Plane (SRP) in terms of the proportion of
the variation in the dependent variables explained by the fitted sample
regression equation. Thus, the value of R square is 0.379 simply means that
about 39.9% of the variation in adjustment is explained by the estimated SRP
that uses tourism impact and community participation as the independent
variables and R square value is significant at 1 % level.
The multiple regression equation is
Y = 10.102 + 0.101X1 + 0.751X2 - - - - - - - - - - 1
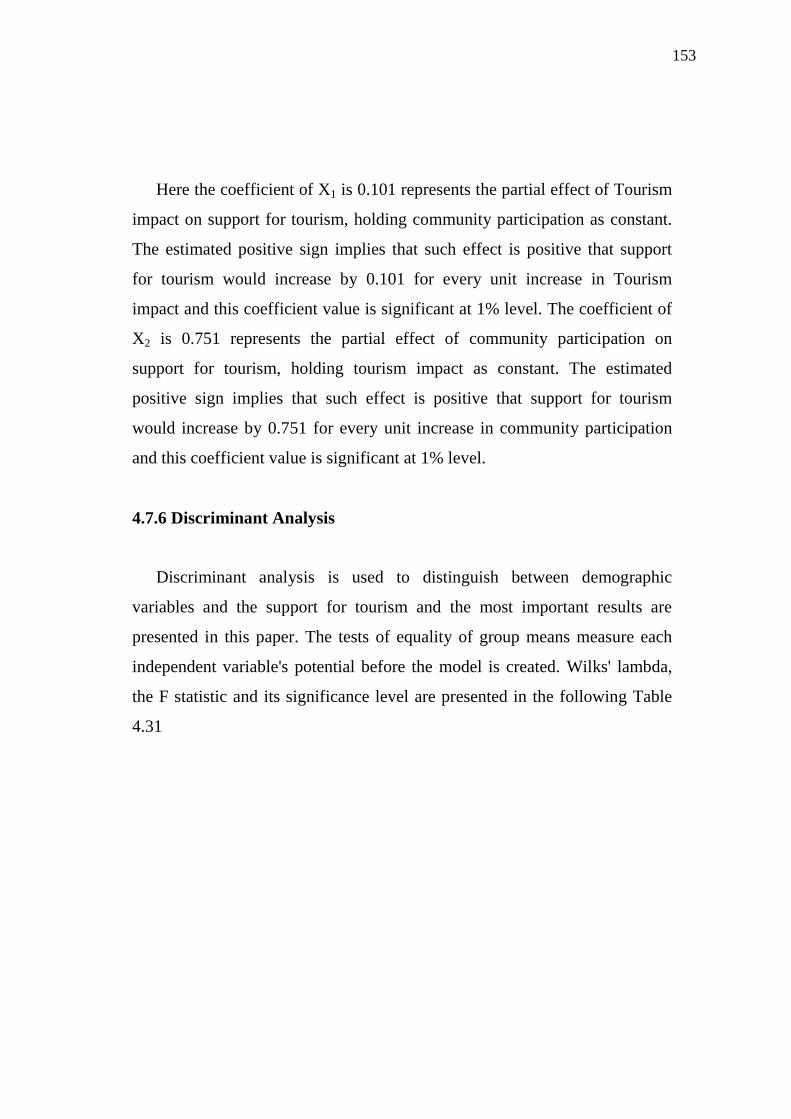
153
Here the coefficient of X1 is 0.101 represents the partial effect of Tourism
impact on support for tourism, holding community participation as constant.
The estimated positive sign implies that such effect is positive that support
for tourism would increase by 0.101 for every unit increase in Tourism
impact and this coefficient value is significant at 1% level. The coefficient of
X2 is 0.751 represents the partial effect of community participation on
support for tourism, holding tourism impact as constant. The estimated
positive sign implies that such effect is positive that support for tourism
would increase by 0.751 for every unit increase in community participation
and this coefficient value is significant at 1% level.
4.7.6 Discriminant Analysis
Discriminant analysis is used to distinguish between demographic
variables and the support for tourism and the most important results are
presented in this paper. The tests of equality of group means measure each
independent variable's potential before the model is created. Wilks' lambda,
the F statistic and its significance level are presented in the following Table
4.31

154
Table 4.31
F TESTS OF EQUALITY OF GROUP MEANS
Wilks'
Lambda F value P value
Gender 0.985 3.023 0.084
Age Group 0.998 0.309 0.579
Education 0.981 3.739 0.055
Occupation 0.980 3.987 0.047
Monthly Income 0.972 5.785 0.017
Marital Status 0.985 3.078 0.081
Family size 1.000 0.092 0.762
Length of
residency0.918 17.571 0.000**
Nature of
Business0.996 0.746 0.389
Residence close 0.931 14.775 0.000**
The above test displays the results of a one-way ANOVA for the
independent variable using the grouping variable as the factor. According to
the results in the table, out of 10 variables, only 2 variables in discriminant
model is significant, since P value is less than 0.01. Wilks' lambda is another
measure of a variable's potential. Smaller values indicate the variable is better
at discriminating between groups. The table shows that the closeness of the
residence to the tourist spots decides the support for tourism, followed by
length of residency.
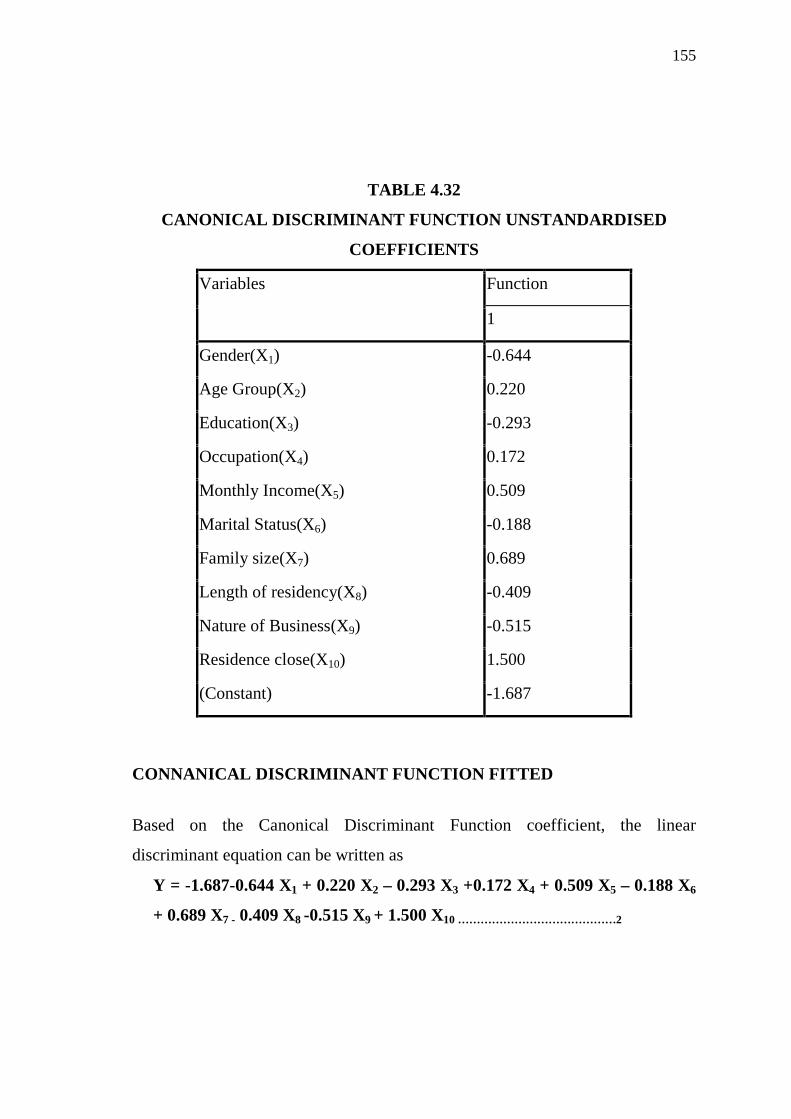
155
TABLE 4.32
CANONICAL DISCRIMINANT FUNCTION UNSTANDARDISED
COEFFICIENTS
Variables Function
1
Gender(X1) -0.644
Age Group(X2) 0.220
Education(X3) -0.293
Occupation(X4) 0.172
Monthly Income(X5) 0.509
Marital Status(X6) -0.188
Family size(X7) 0.689
Length of residency(X8) -0.409
Nature of Business(X9) -0.515
Residence close(X10) 1.500
(Constant) -1.687
CONNANICAL DISCRIMINANT FUNCTION FITTED
Based on the Canonical Discriminant Function coefficient, the linear
discriminant equation can be written as
Y = -1.687-0.644 X1 + 0.220 X2 – 0.293 X3 +0.172 X4 + 0.509 X5 – 0.188 X6
+ 0.689 X7 - 0.409 X8 -0.515 X9 + 1.500 X10 ……………………………………2
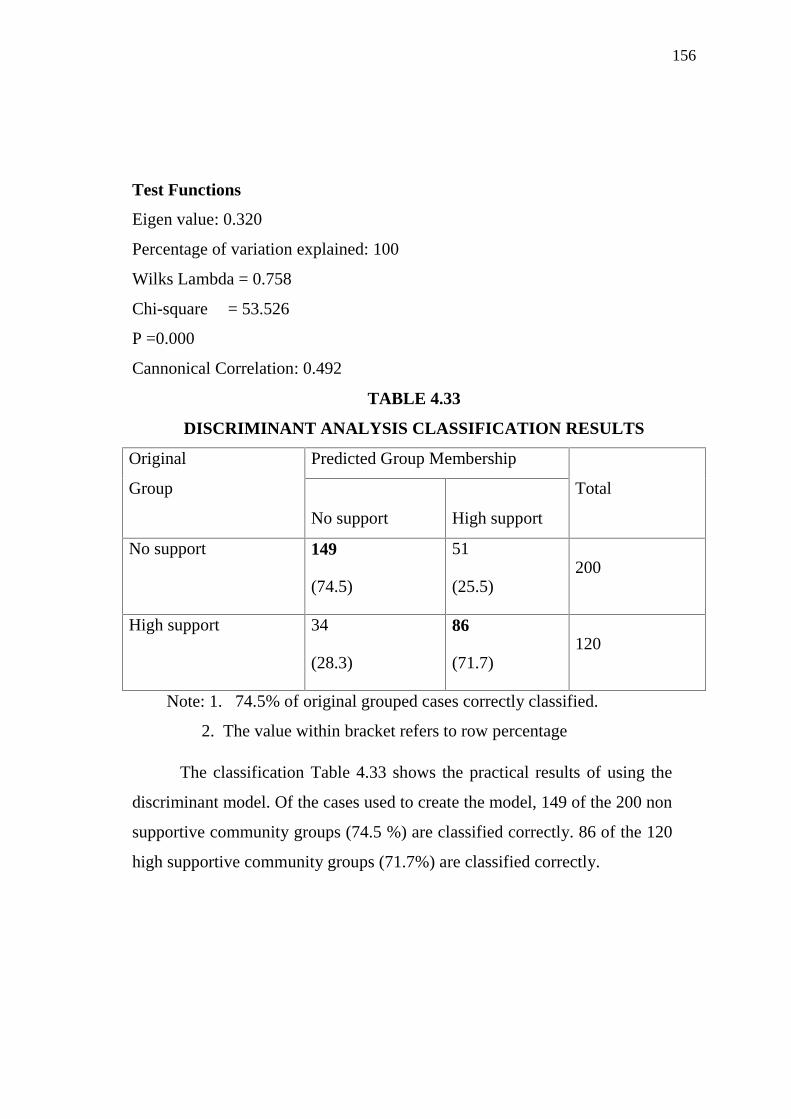
156
Test Functions
Eigen value: 0.320
Percentage of variation explained: 100
Wilks Lambda = 0.758
Chi-square = 53.526
P =0.000
Cannonical Correlation: 0.492
TABLE 4.33
DISCRIMINANT ANALYSIS CLASSIFICATION RESULTS
Original
Group
Predicted Group Membership
Total
No support High support
No support 149
(74.5)
51
(25.5)200
High support 34
(28.3)
86
(71.7)120
Note: 1. 74.5% of original grouped cases correctly classified.
2. The value within bracket refers to row percentage
The classification Table 4.33 shows the practical results of using the
discriminant model. Of the cases used to create the model, 149 of the 200 non
supportive community groups (74.5 %) are classified correctly. 86 of the 120
high supportive community groups (71.7%) are classified correctly.
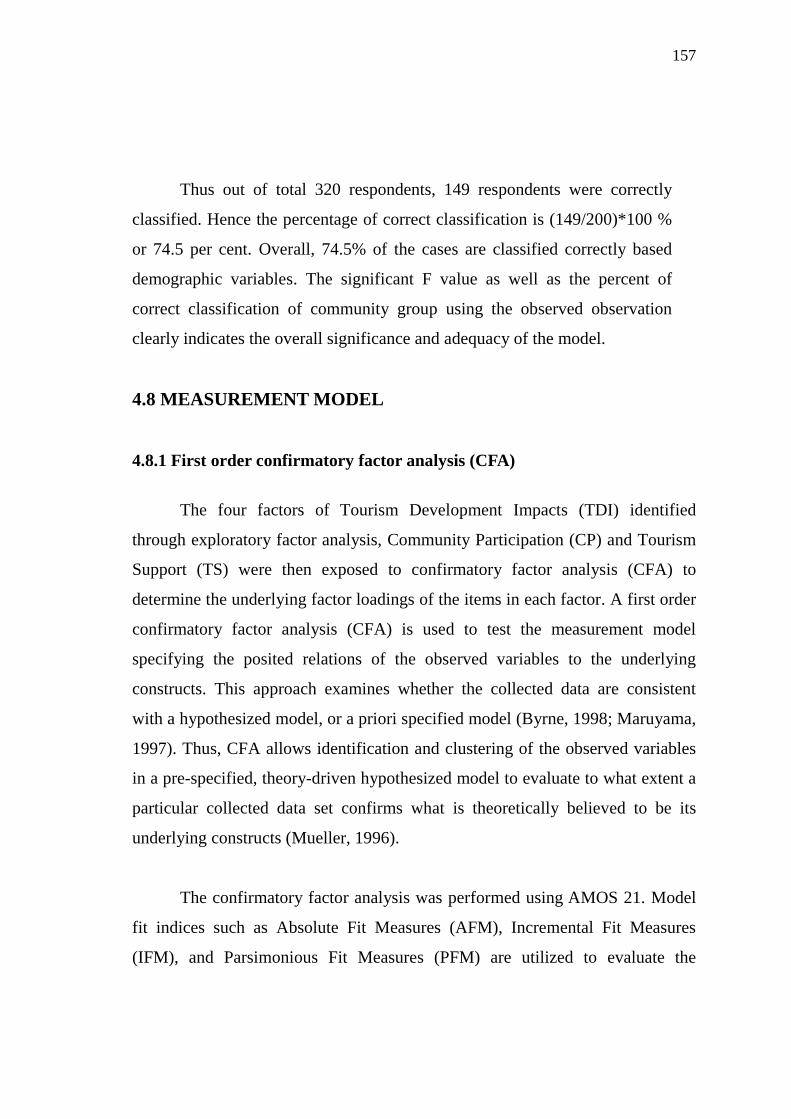
157
Thus out of total 320 respondents, 149 respondents were correctly
classified. Hence the percentage of correct classification is (149/200)*100 %
or 74.5 per cent. Overall, 74.5% of the cases are classified correctly based
demographic variables. The significant F value as well as the percent of
correct classification of community group using the observed observation
clearly indicates the overall significance and adequacy of the model.
4.8 MEASUREMENT MODEL
4.8.1 First order confirmatory factor analysis (CFA)
The four factors of Tourism Development Impacts (TDI) identified
through exploratory factor analysis, Community Participation (CP) and Tourism
Support (TS) were then exposed to confirmatory factor analysis (CFA) to
determine the underlying factor loadings of the items in each factor. A first order
confirmatory factor analysis (CFA) is used to test the measurement model
specifying the posited relations of the observed variables to the underlying
constructs. This approach examines whether the collected data are consistent
with a hypothesized model, or a priori specified model (Byrne, 1998; Maruyama,
1997). Thus, CFA allows identification and clustering of the observed variables
in a pre-specified, theory-driven hypothesized model to evaluate to what extent a
particular collected data set confirms what is theoretically believed to be its
underlying constructs (Mueller, 1996).
The confirmatory factor analysis was performed using AMOS 21. Model
fit indices such as Absolute Fit Measures (AFM), Incremental Fit Measures
(IFM), and Parsimonious Fit Measures (PFM) are utilized to evaluate the

158
proposed model. Maximum likelihood (ML) method of parameter estimation was
utilized because the collected usable sample was quite large (N=320). The ML
estimation method has been used in structural equation modeling because this
estimation method has been found to be acceptable even if the normal
distributions of the observed variables are violated (Chou & Bentler, 1995). The
results are presented in Table 4.34.
The first order standardized CFA – model 1 was done with four-factors of
tourism development impacts, community participation and tourism support
illustrated in Figure 4.1 Model 1 featured some high correlations between error
terms, as indicated by the modification indices. Consequently, the model
presented misfit and needed modification. Therefore, initial model-1 was
modified based on Squared multiple indices (SMC) and modification indices
(M.I). Model -2 was arrived after excluding the variable Environmental impact,
Economic impact items EC2, EC4, EC6, EC10, Socio cultural impact items
SC11, SC12, SC14, SC16, SC18, SC20, Community Participation items CP1,
CP4 and Tourism Support items TS1 with each of these decisions based on the
strength of association of that item with other items. The deletion of the items
produced an adequate better fitting model as demonstrated in Figure 4.2 and
Table 4.34.
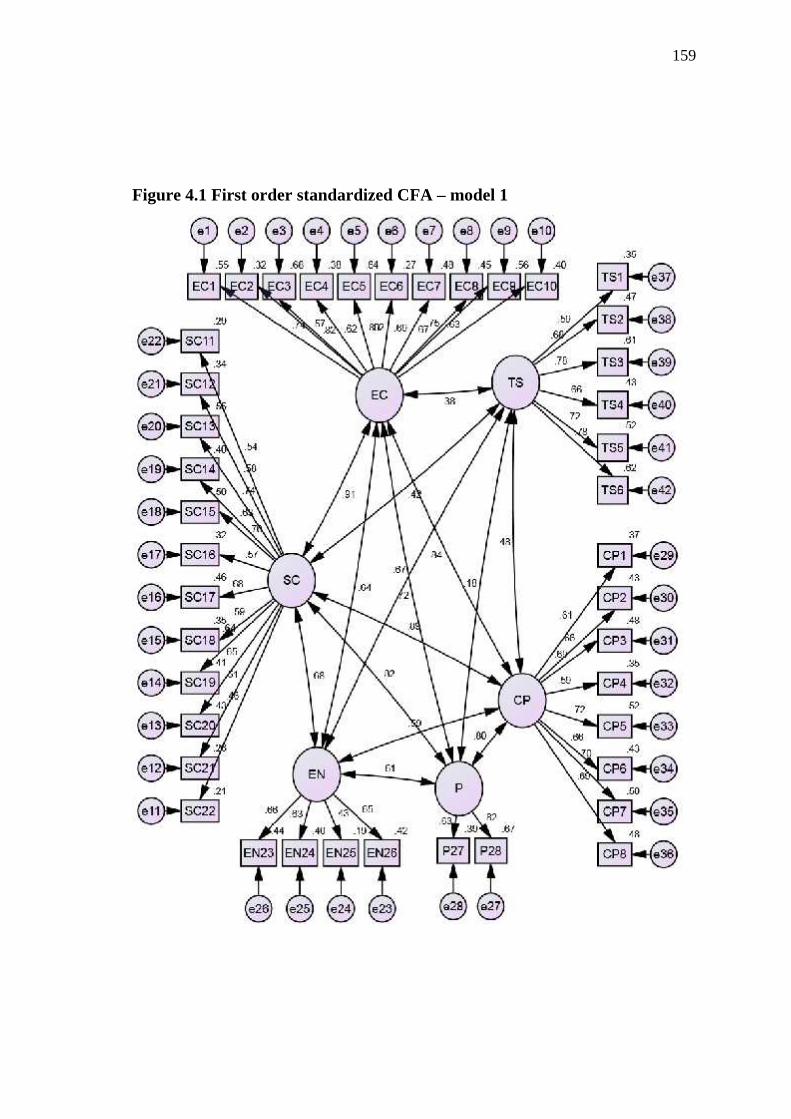
159
Figure 4.1 First order standardized CFA – model 1
160
The results of the initial estimation of the CFA (model -1) of the tourism
development impacts construct, community participation and Tourism support
constructs were not acceptable since there was a Chi-square value of 3540.973
with 804 degrees of freedom (p < .001) and a Root Mean Square Error of
Approximation (RMSEA) of 0.113. RMSEA explains the error of approximation
in the population; values should be less than .05 for a good fit. The other fit
indices also indicated a poor fit and suggested that the estimate parameters
should be modified.
Figure 4.3 illustrates the standardized revised model-2 based on three
variables of tourism development impacts, six items of community participation
and five items of tourism Support. The First order standardized CFA – model 1
solution was completely unacceptable (see Table 4.34). However, under these
conditions, the standardized CFA – model 2 exhibited significantly more
acceptable goodness-of-fit (see Table 4.34) than the model-1 as per the chi-
square difference test, as well as minimizing the set of out-of-range parameter
values.
As in Table 4.34, a range of estimates of goodness-of-fit for the revised
model (model-2) was highly acceptable. The initial step was to examine the
effect of dividing the chi-square value (CMIN) by the degrees of freedom (DF).
This operation results in a ratio (CMIN/DF) with an ideal value of 2.538 which is
in the 0-3 range and is significant at the level of .05 (p= .05). In the initial model
(model-1), this value exceeded the threshold value and it shows a poor fit.
RMSEA value is 0.08. Values less than 0.6 to 0.8 shows mediocre fit
(MacCallum, Browne and Sugawara (1996). From this measure, the model
shows an acceptable fit. The other fit indices also indicated a mediocre fit (see
table 4.34 for acceptance limit for model fit indices)
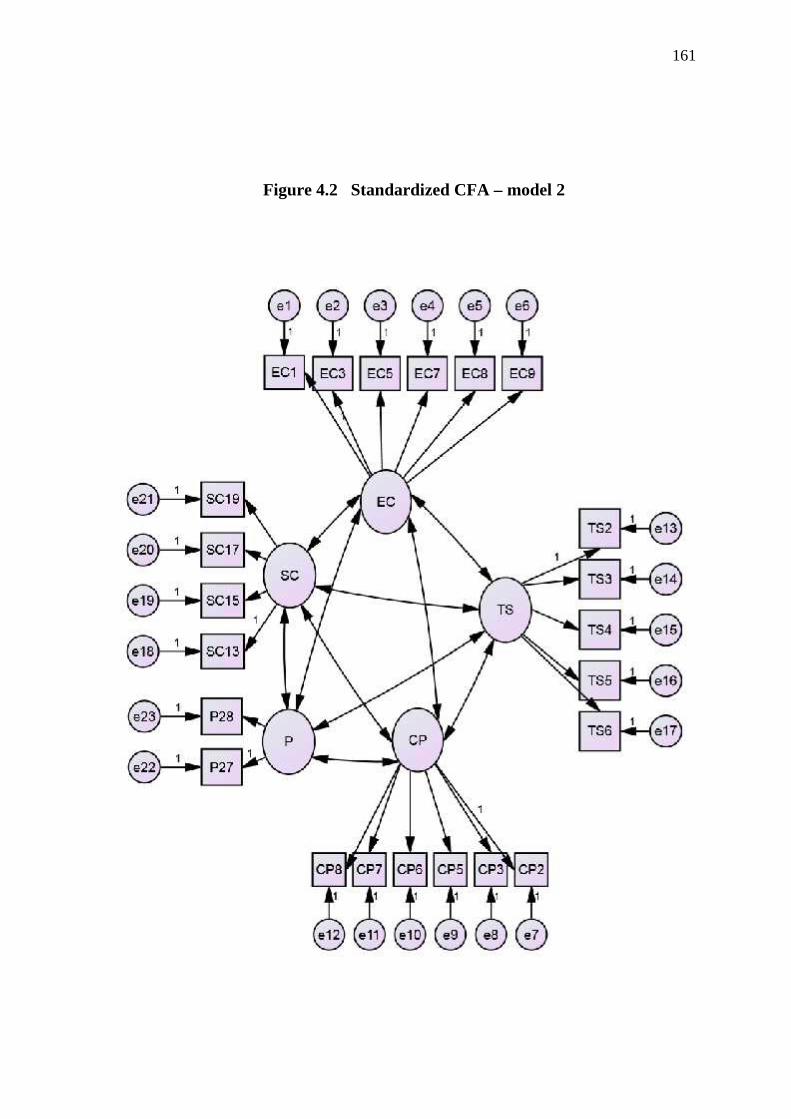
161
Figure 4.2 Standardized CFA – model 2
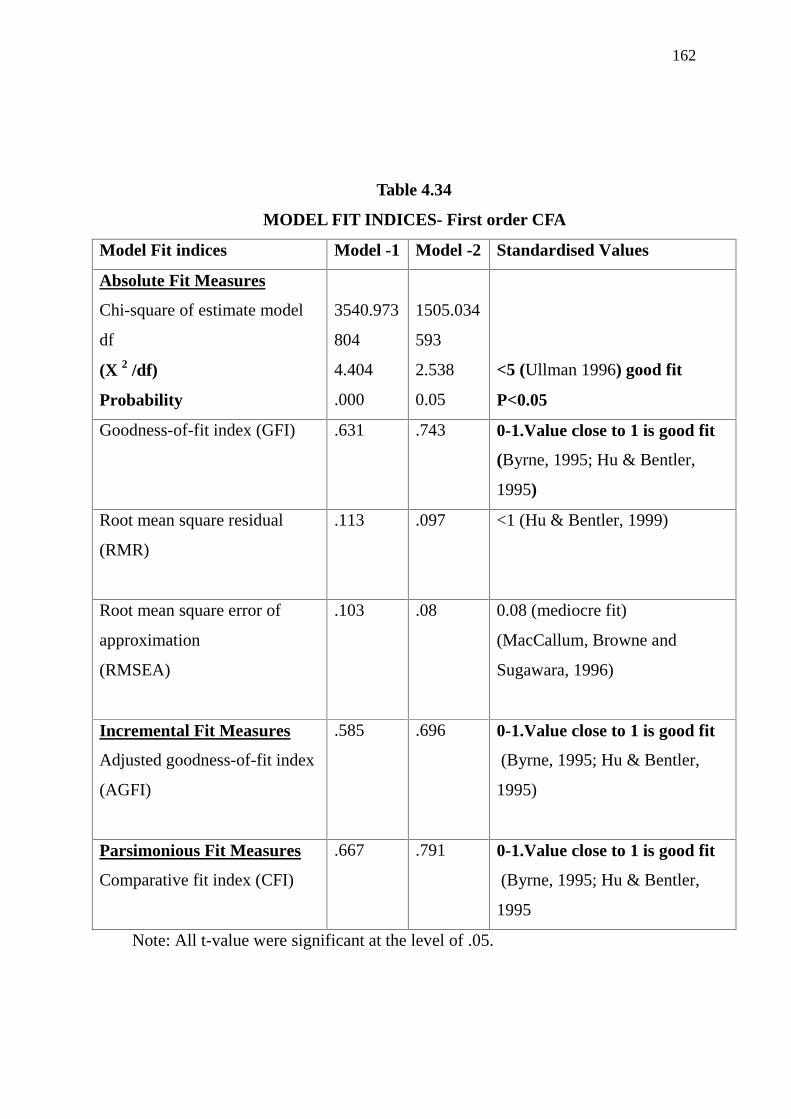
162
Table 4.34
MODEL FIT INDICES- First order CFA
Model Fit indices Model -1 Model -2 Standardised Values
Absolute Fit Measures
Chi-square of estimate model
df
(X 2 /df)
Probability
3540.973
804
4.404
.000
1505.034
593
2.538
0.05
<5 (Ullman 1996) good fit
P<0.05
Goodness-of-fit index (GFI) .631 .743 0-1.Value close to 1 is good fit
(Byrne, 1995; Hu & Bentler,
1995)
Root mean square residual
(RMR)
.113 .097 <1 (Hu & Bentler, 1999)
Root mean square error of
approximation
(RMSEA)
.103 .08 0.08 (mediocre fit)
(MacCallum, Browne and
Sugawara, 1996)
Incremental Fit Measures
Adjusted goodness-of-fit index
(AGFI)
.585 .696 0-1.Value close to 1 is good fit
(Byrne, 1995; Hu & Bentler,
1995)
Parsimonious Fit Measures
Comparative fit index (CFI)
.667 .791 0-1.Value close to 1 is good fit
(Byrne, 1995; Hu & Bentler,
1995
Note: All t-value were significant at the level of .05.

163
X2 = Chi-Square; df = degrees of freedom; GFI = goodness-of-fit index;
AGFI = adjusted goodness-of-fit; CFI = comparative fit index; RMR = Root
Mean Square; RMSEA = root mean square error of approximation.
Table 4.35
I ORDER - STANDARDIZED REGRESSION WEIGHT FACTOR
LOADINGS
ItemA
Direction Item B βEstimate S.E. C.R. P
EC1 <--- EC .754 061 15.379 ***EC3 <--- EC .827 .065 15.387 ***EC5 <--- EC .817 .061 15.279 ***EC7 <--- EC .705 .061 12.900 ***EC8 <--- EC .671 .058 12.122 ***EC9 <--- EC .752 .061 13.838 ***SC13 <--- SC .710 .089 12.488 ***SC15 <--- SC .672 .066 15.331 ***SC17 <--- SC .659 .087 11.488 ***SC19 <--- SC .642 .085 11.187 ***P28 <--- P .841 .091 12.085 ***P27 <--- P .639 .067 10.800 ***CP8 <--- CP .693 .097 11.057 ***CP7 <--- CP .724 .093 12.086 ***CP6 <--- CP .652 .099 11.003 ***CP5 <--- CP .723 .096 12.228 ***CP3 <--- CP .680 .086 11.454 ***CP2 <--- CP .653 .102 10.850 ***TS6 <--- TS .774 .071 13.789 ***TS5 <--- TS .720 .071 13.289 ***TS4 <--- TS .661 .071 12.046 ***TS3 <--- TS .791 .073 14.241 ***TS2 <--- TS .741 .071 12.983 ***
164
The examination of estimates of model fit was supplemented by checking
the significance of standardised regression weights. As shown in Table 4.35,
latent variable 1 Economic impacts (EC)) was significantly associated with 6 of
the 10 items, latent variable 2 socio-cultural impacts (SC) was significantly
associated with 4 items and latent variable 4 political impacts (P) was
significantly associated with 2 items. The latent variable 3 environmental
impacts (EN) were not significant. It is clear from the above that these factor
loadings were large relative to their standard errors.
An examination of the standardised residuals showed that most of the
items approximate between -1 and 1.9, with none of the residuals approximating
values of 2 or 3. As none of the standardised residuals exhibited extreme values,
this examination also suggested that the model fits the data fairly well.
Additionally, the highest squared multiple correlation (SMC) for Tourism
development impacts which assessed the extent to which the measurement model
was adequately represented by the observed measures was .707 (Item P28 ‘The
community should have authority to suggest control and restrictions of tourism
development in the country’), and the lowest squared multiple correlation was
.408 (Item P27 ‘Tourism brings political benefits to society’). Similarly the
highest squared multiple correlation for community participation variables was
.524 (Item CP7 ‘I am willing to invest my talent or time to make the community
an even better place for visitors’). The lowest SMC was .425 (Item CP6 ‘Active
Participation of the local community and youth’). The tourism support variable
shows .626 as the highest SMC (‘Development of supporting visitor services’).
The lowest SMC score was .437 (TS4 ‘Development of small independent
businesses’).
165
Further, it could be interpreted that approximately 70% of the variance of
Item P28 was explained by the tourism development impacts. Additionally, the
item indicated the highest standardized loading of .841 (Table 4.35), meaning
that the item was the highest relative indicator in measuring tourism
development impacts. However, attention should be given to Item P27 having the
lowest loading (.639), because this item could contribute to a poor fit in the
overall measurement model (Table 4.35).
Similarly 52% of the variance is explained by the item CP7 of community
participation construct. The item CP7 indicated the highest standardized loading
of .724, meaning that the item was the highest relative indicator in measuring the
strength of community participation. The community people are willing to invest
their talent or time to make the community a even better place for visitors. More
attention should be given to Item CP6 having the lowest loading .656, because
this item shows poor fit to the model (Table 4.35).
Approximately 63% of the variance is explained by the Item TS3 of
tourism support construct. The item TS3 indicated the highest standardized
loading of .791, meaning that the item was the highest relative indicator in
measuring the support for tourism development in the destination. The
stakeholders are strongly in support of developing supporting visitor services.
More attention should be given to Item TS4 having the lowest loading .661,
because this item shows poor fit to the model (Table 4.35).
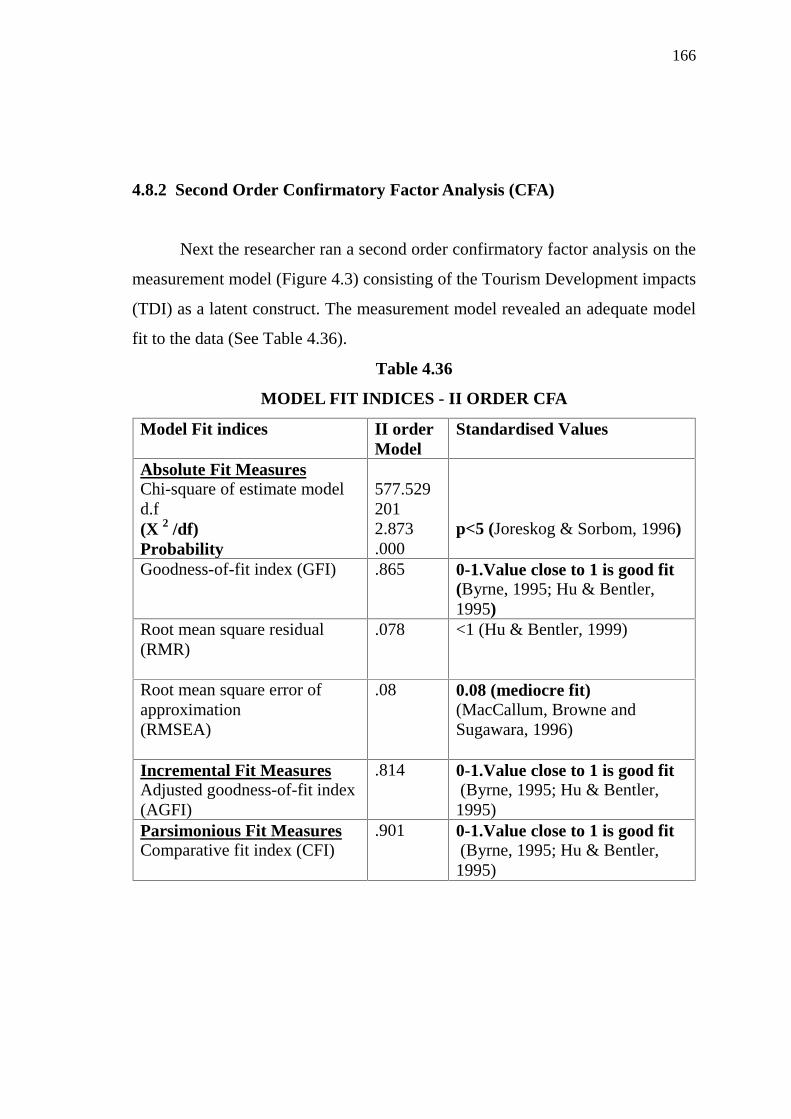
166
4.8.2 Second Order Confirmatory Factor Analysis (CFA)
Next the researcher ran a second order confirmatory factor analysis on the
measurement model (Figure 4.3) consisting of the Tourism Development impacts
(TDI) as a latent construct. The measurement model revealed an adequate model
fit to the data (See Table 4.36).
Table 4.36
MODEL FIT INDICES - II ORDER CFA
Model Fit indices II orderModel
Standardised Values
Absolute Fit MeasuresChi-square of estimate modeld.f(X 2 /df)Probability
577.5292012.873.000
p<5 (Joreskog & Sorbom, 1996)
Goodness-of-fit index (GFI) .865 0-1.Value close to 1 is good fit(Byrne, 1995; Hu & Bentler,1995)
Root mean square residual(RMR)
.078 <1 (Hu & Bentler, 1999)
Root mean square error ofapproximation(RMSEA)
.08 0.08 (mediocre fit)(MacCallum, Browne andSugawara, 1996)
Incremental Fit MeasuresAdjusted goodness-of-fit index(AGFI)
.814 0-1.Value close to 1 is good fit(Byrne, 1995; Hu & Bentler,1995)
Parsimonious Fit MeasuresComparative fit index (CFI)
.901 0-1.Value close to 1 is good fit(Byrne, 1995; Hu & Bentler,1995)
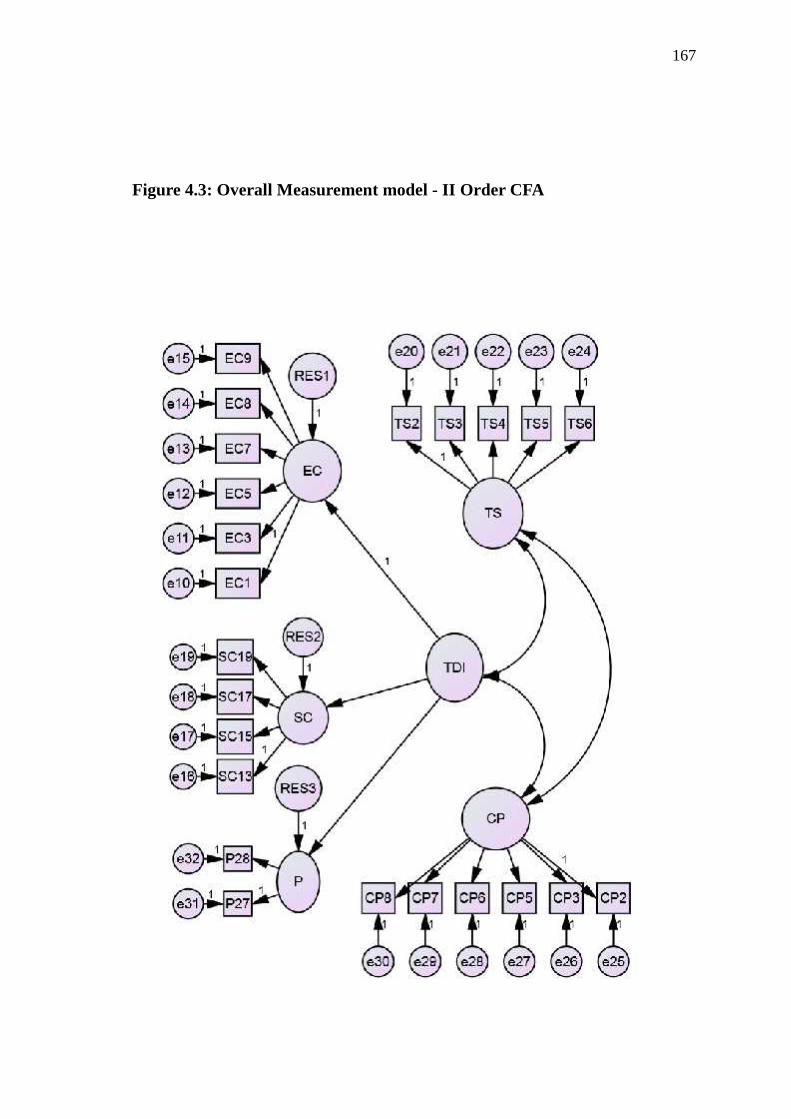
167
Figure 4.3: Overall Measurement model - II Order CFA

168
Table 4.37 II order CFA - Standardised Regression Weight Factor Loadings
Variables Direction Item B βEstimate
S.E. C.R. P
EC1 <--- EC .741 .061 13.563 ***EC3 <--- EC .818 .068 14.703 ***EC5 <--- EC .836 .064 15.308 ***EC7 <--- EC .687 .063 12.259 ***EC8 <--- EC .672 .060 11.835 ***EC9 <--- EC .746 .063 13.582 ***SC13 <--- SC .718 .091 11.465 ***SC15 <--- SC .676 .067 14.745 ***SC17 <--- SC .692 .087 11.904 ***SC19 <--- SC .698 .086 11.863 ***P28 <--- P .883 .082 11.765 ***P27 <--- P .631 .063 10.732 ***CP8 <--- CP .655 .097 11.760 ***CP7 <--- CP .742 .095 12.832 ***CP6 <--- CP .633 .096 11.750 ***CP5 <--- CP .745 .111 11.470 ***CP3 <--- CP .659 .097 10.354 ***CP2 <--- CP .653 .119 10.100 ***TS6 <--- TS .407 .283 4.098 ***TS5 <--- TS .741 .377 5.053 ***TS4 <--- TS .673 .348 4.979 ***TS3 <--- TS .793 .401 5.088 ***TS2 <--- TS .717 .345 5.023 ***
The examination of estimates of model fit was supplemented by checking
the significance of standardised regression weights. As shown in Table 4.37
latent variable 1 Economic impacts (EC)) was significantly associated with 6 of
the 10 items, latent variable 2 socio-cultural impacts (SC) was significantly
associated with 4 items and latent variable 4 political impacts (P) was
significantly associated with 2 items. The latent variable 3 environmental
169
impacts (EN) were not significant. It is clear from the above that these factor
loadings were large relative to their standard errors.
An examination of the standardised residuals showed that most of the
items approximate between -1 and 1.9, with none of the residuals approximating
values of 2 or 3. As none of the standardised residuals exhibited extreme values,
this examination also suggested that the model fits the data fairly well.
4.9 STRUCTURAL MODEL FOR TOURISM SUPPORT
The Structural model consists of three exogenous variables: Economic
impacts, socio-cultural impacts, and political impacts (Tourism development
impacts), and two endogenous variables community participation and Support
for tourism destination (Figure 4.5). The goodness-of-fit statistics for the
structural model produced reasonable results, as shown in Table 4.38 below. The
results of the structural equation modeling indicate an adequate model fit to the
data.
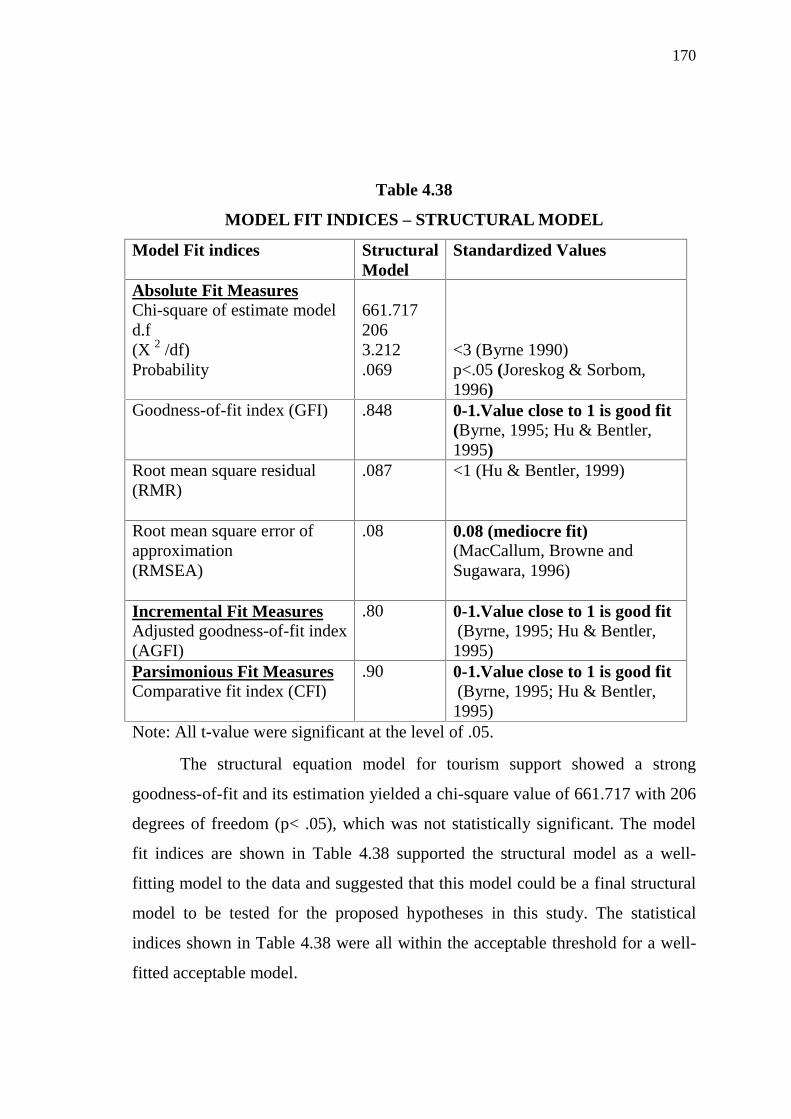
170
Table 4.38
MODEL FIT INDICES – STRUCTURAL MODEL
Model Fit indices StructuralModel
Standardized Values
Absolute Fit MeasuresChi-square of estimate modeld.f(X 2 /df)Probability
661.7172063.212.069
<3 (Byrne 1990)p<.05 (Joreskog & Sorbom,1996)
Goodness-of-fit index (GFI) .848 0-1.Value close to 1 is good fit(Byrne, 1995; Hu & Bentler,1995)
Root mean square residual(RMR)
.087 <1 (Hu & Bentler, 1999)
Root mean square error ofapproximation(RMSEA)
.08 0.08 (mediocre fit)(MacCallum, Browne andSugawara, 1996)
Incremental Fit MeasuresAdjusted goodness-of-fit index(AGFI)
.80 0-1.Value close to 1 is good fit(Byrne, 1995; Hu & Bentler,1995)
Parsimonious Fit MeasuresComparative fit index (CFI)
.90 0-1.Value close to 1 is good fit(Byrne, 1995; Hu & Bentler,1995)
Note: All t-value were significant at the level of .05.
The structural equation model for tourism support showed a strong
goodness-of-fit and its estimation yielded a chi-square value of 661.717 with 206
degrees of freedom (p< .05), which was not statistically significant. The model
fit indices are shown in Table 4.38 supported the structural model as a well-
fitting model to the data and suggested that this model could be a final structural
model to be tested for the proposed hypotheses in this study. The statistical
indices shown in Table 4.38 were all within the acceptable threshold for a well-
fitted acceptable model.
171
The structural model was examined by using measurement indices
representing the three types of fit indices: absolute fit indices, incremental fit
indices, and parsimonious fit indices. The results are shown in Table 4.38 above.
The absolute fit indices measure how well an a priori model reproduces the
collected sample data, in other words, how closely the model compares to a
perfect fit (Bollen, 1989; Hu & Bentler, 1995). These indices include chi-square
of the estimated model, goodness-of-fit (GFI), root mean square residual (RMR),
and root mean square error of approximation (RMSEA). The chi- square value of
661.717 with 206 degrees of freedom was not statistically significant at p=.069,
therefore suggesting that the structural model with three constructs was
appropriate and should be accepted. The goodness-of-fit (GFI) index that was
used to compare the structural model with no model at all yielded a value of
0.848.This index takes a value from zero to 1.00, with the value closest to 1.00
being indicative of good fit (Byrne, 1995; Hu & Bentler, 1995). The result of
GFI for this study exceeded the acceptable level of model fit. Next, the value of
root mean square residual (RMR) was .087. This value indicates the average
value across all standardised residuals ranging from zero to 1.00. In order to have
a well fitting model, this value has to be less than .05. Accordingly, the RMR
value in this study was acceptable with mediocre fitting hypothesized model.
Lastly, the root mean square error of approximation (RMSEA) represents an
index to quantify model misfit, suggesting that a value of less than .05 indicates a
good fit (Hu & Bentler, 1995), 0.8 indicates a mediocre fit (MacCallum, Browne
and Sugawara, 1996). The value of RMSEA for this hypothesized measurement
was .08, which is within the acceptable level indicates an adequate degree of
goodness-of-fit. In summary, the examinations of the absolute fit statistics
indices suggested that the hypothesized model represented a mediocre fitting
model to the data.

172
The second estimated goodness-of-fit statistics, the incremental-fit-
indices, were examined. These were used to evaluate the proportionate
improvement in fit by comparing a target model with a more restricted, nested
base line model (Hu & Bentler, 1995). The fit indices Average goodness-of-fit
indices (AGFI) value was 0.80. This index takes a value from zero to 1.00, with
the value closest to 1.00 being indicative of good fit (Byrne, 1995; Hu & Bentler,
1995). The result of AGFI for this study is close to 1.00 and it is within the
acceptable level of model fit.
Finally, the parsimony fit indices provide information about a comparison
between models of differing complexity, by evaluating the fit of the model
versus the number of estimated coefficients needed to achieve the level of fit.
This measure includes indices such as the comparative fit index (CFI). The
values of the CFI range from zero to 1.00, the value closest to 1.00 being
indicative of good fit (Byrne, 1995; Hu & Bentler, 1995). The values of CFI is
0.90, suggesting that this values are sufficient to support a well fitting model.

173
Figure 4.4 – Structural model
174
Note:Economic Impact (EC)EC1-Tourism increases job opportunities for the local peopleEC3-Wider promotion of handicraft items made in the villageEC5-Local labour, technology and resources being optimally utilizedEC7-Tourism creates more jobs for outsiders than for local peopleEC8-Host community getting trained on different types of hospitalitymanagement, cuisine preparation, tourist handlingEC9-Collaboration with different business institutions for market tie-ups.Socio-Cultural Impact (SC)SC13-Mobilization of women artisans in the active participation in the tourismprogrammeSC15-Effective skill building of the women communitySC17-Documentation of the crafts, arts and folk loreSC19-Tourism encourages a variety of cultural activities by the local populationPolitical impact (P)P27-Tourism brings political benefits to societyP28-The community should have authority to suggest control and restrictions oftourism development in the country.Community ParticipationCP2-I would be willing to attend community meetings to discuss an importanttourism issueCP3-The government usually consults us about tourism planningCP5-Public involvement in planning and development of tourismCP6-Active Participation of the local community and youthCP7- willing to invest talent or time to make the community an even better placefor visitorsCP2-I would be affected by whatever happens (positive or negative) in thecommunityTourism Support (TS)TS2- Development of cultural or historic-based attractions.TS3- Development of supporting visitor services.TS4- Development of small independent businesses.TS5- Development of cultural and folk events.TS6- Development of infrastructure for tourists.
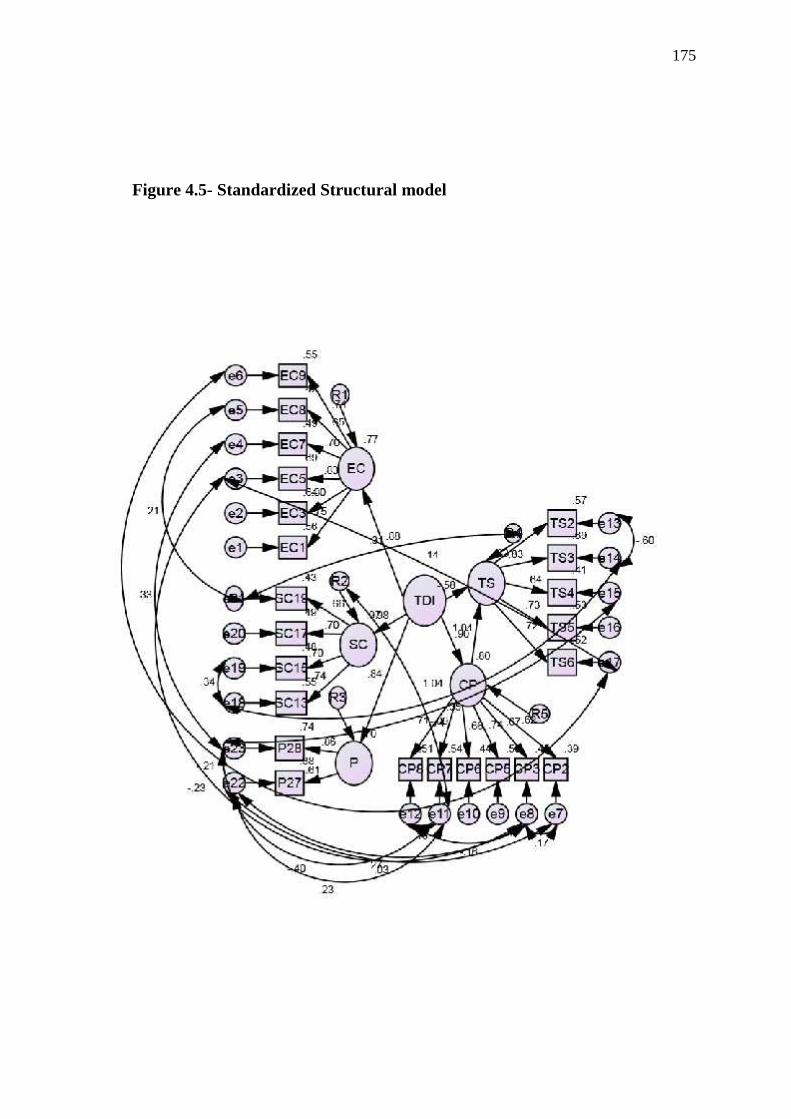
175
Figure 4.5- Standardized Structural model
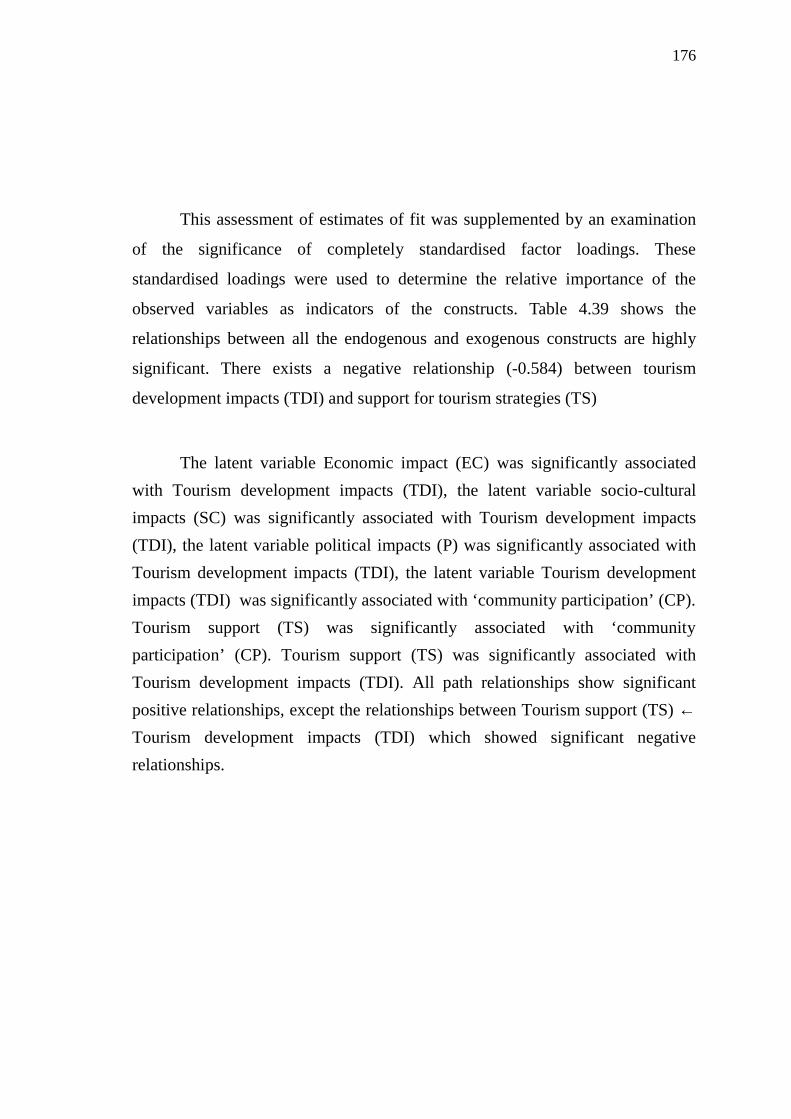
176
This assessment of estimates of fit was supplemented by an examination
of the significance of completely standardised factor loadings. These
standardised loadings were used to determine the relative importance of the
observed variables as indicators of the constructs. Table 4.39 shows the
relationships between all the endogenous and exogenous constructs are highly
significant. There exists a negative relationship (-0.584) between tourism
development impacts (TDI) and support for tourism strategies (TS)
The latent variable Economic impact (EC) was significantly associated
with Tourism development impacts (TDI), the latent variable socio-cultural
impacts (SC) was significantly associated with Tourism development impacts
(TDI), the latent variable political impacts (P) was significantly associated with
Tourism development impacts (TDI), the latent variable Tourism development
impacts (TDI) was significantly associated with ‘community participation’ (CP).Tourism support (TS) was significantly associated with ‘communityparticipation’ (CP). Tourism support (TS) was significantly associated with
Tourism development impacts (TDI). All path relationships show significant
positive relationships, except the relationships between Tourism support (TS) ←Tourism development impacts (TDI) which showed significant negative
relationships.
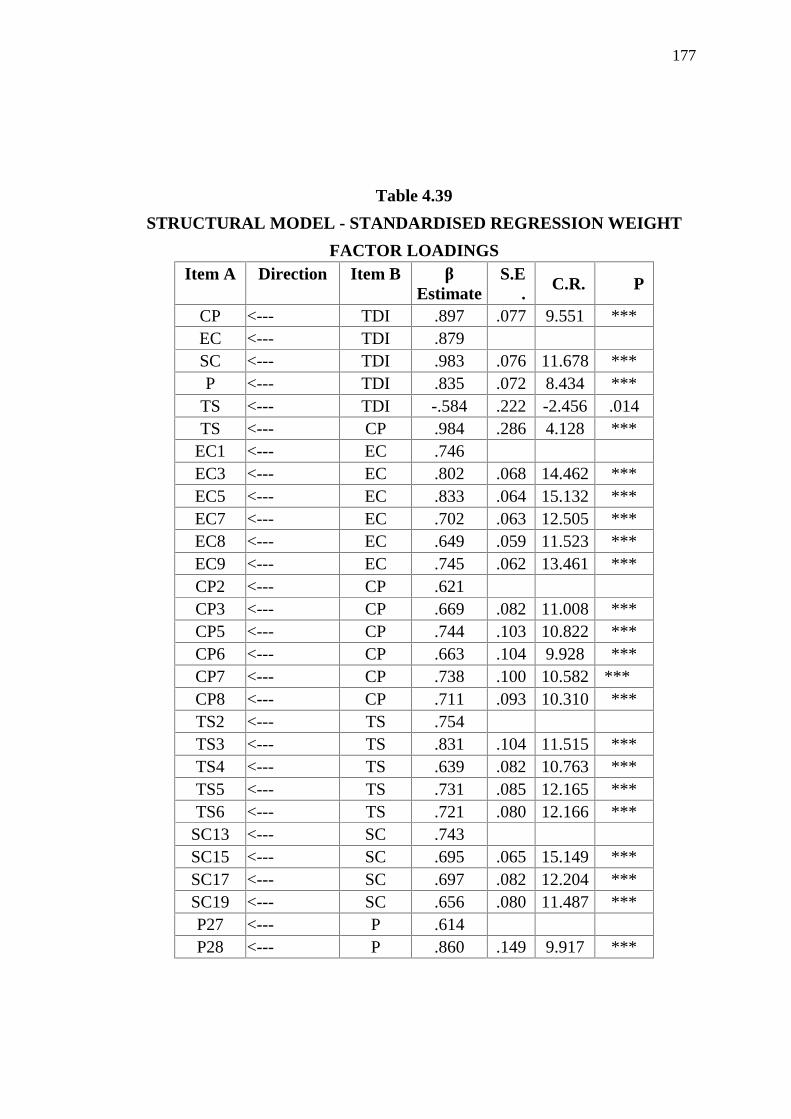
177
Table 4.39
STRUCTURAL MODEL - STANDARDISED REGRESSION WEIGHT
FACTOR LOADINGSItem A Direction Item B β
EstimateS.E
. C.R. P
CP <--- TDI .897 .077 9.551 ***EC <--- TDI .879SC <--- TDI .983 .076 11.678 ***P <--- TDI .835 .072 8.434 ***
TS <--- TDI -.584 .222 -2.456 .014TS <--- CP .984 .286 4.128 ***
EC1 <--- EC .746EC3 <--- EC .802 .068 14.462 ***EC5 <--- EC .833 .064 15.132 ***EC7 <--- EC .702 .063 12.505 ***EC8 <--- EC .649 .059 11.523 ***EC9 <--- EC .745 .062 13.461 ***CP2 <--- CP .621CP3 <--- CP .669 .082 11.008 ***CP5 <--- CP .744 .103 10.822 ***CP6 <--- CP .663 .104 9.928 ***CP7 <--- CP .738 .100 10.582 ***CP8 <--- CP .711 .093 10.310 ***TS2 <--- TS .754TS3 <--- TS .831 .104 11.515 ***TS4 <--- TS .639 .082 10.763 ***TS5 <--- TS .731 .085 12.165 ***TS6 <--- TS .721 .080 12.166 ***
SC13 <--- SC .743SC15 <--- SC .695 .065 15.149 ***SC17 <--- SC .697 .082 12.204 ***SC19 <--- SC .656 .080 11.487 ***P27 <--- P .614P28 <--- P .860 .149 9.917 ***

178
4.10 OUTCOMES OF HYPOTHESES TESTING
The results of structural equation analysis by AMOS were used to test the
proposed hypotheses in this study. The relationships between constructs were
examined based on t-value or critical ratio (c.r.) values associated with path
coefficients between constructs. If an estimated c.r. is greater than a certain
critical value (p<.05, c.r. = 1.96) (Mueller, 1996), the null hypothesis that the
associated estimated parameter is equal to 0 was rejected; otherwise, the
hypothesis was supported. The summary of the hypotheses testing is presented in
Table 4.40.
Table 4.40
SUMMARY OF HYPOTHESES TESTING
Hypothesis Relationship
estimate
BetaEstimate
c.r value Results
CP <--- TDI 0.897 9.218 Supported
EC <--- TDI 0.884 8.709 Supported
SC <--- TDI 0.975 11.152 Supported
P <--- TDI 0.825 8.503 Supported
TS <--- TDI -0.520 -2.257 Not Supported
TS <--- CP 0.994 4.065 Supported
In this proposed model, a total of 6 hypotheses were proposed and tested
by using structural equation modeling. From the outcome of EFA, CFA
structural equation modeling the hypotheses were all tested and the results
reported in Chapter 5. The final model has been tested and found to be a good fit
the data and the possible model for this study.
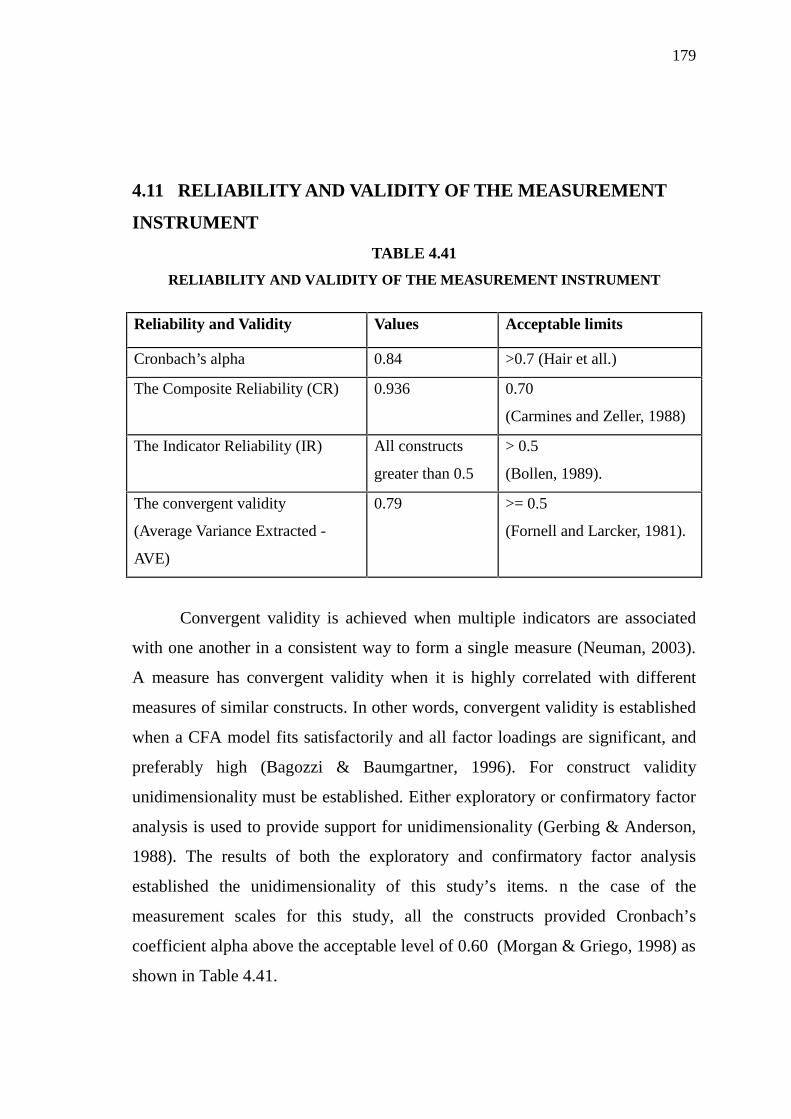
179
4.11 RELIABILITY AND VALIDITY OF THE MEASUREMENT
INSTRUMENT
TABLE 4.41
RELIABILITY AND VALIDITY OF THE MEASUREMENT INSTRUMENT
Convergent validity is achieved when multiple indicators are associated
with one another in a consistent way to form a single measure (Neuman, 2003).
A measure has convergent validity when it is highly correlated with different
measures of similar constructs. In other words, convergent validity is established
when a CFA model fits satisfactorily and all factor loadings are significant, and
preferably high (Bagozzi & Baumgartner, 1996). For construct validity
unidimensionality must be established. Either exploratory or confirmatory factor
analysis is used to provide support for unidimensionality (Gerbing & Anderson,
1988). The results of both the exploratory and confirmatory factor analysis
established the unidimensionality of this study’s items. n the case of the
measurement scales for this study, all the constructs provided Cronbach’s
coefficient alpha above the acceptable level of 0.60 (Morgan & Griego, 1998) as
shown in Table 4.41.
Reliability and Validity Values Acceptable limits
Cronbach’s alpha 0.84 >0.7 (Hair et all.)
The Composite Reliability (CR) 0.936 0.70
(Carmines and Zeller, 1988)
The Indicator Reliability (IR) All constructs
greater than 0.5
> 0.5
(Bollen, 1989).
The convergent validity
(Average Variance Extracted -
AVE)
0.79 >= 0.5
(Fornell and Larcker, 1981).
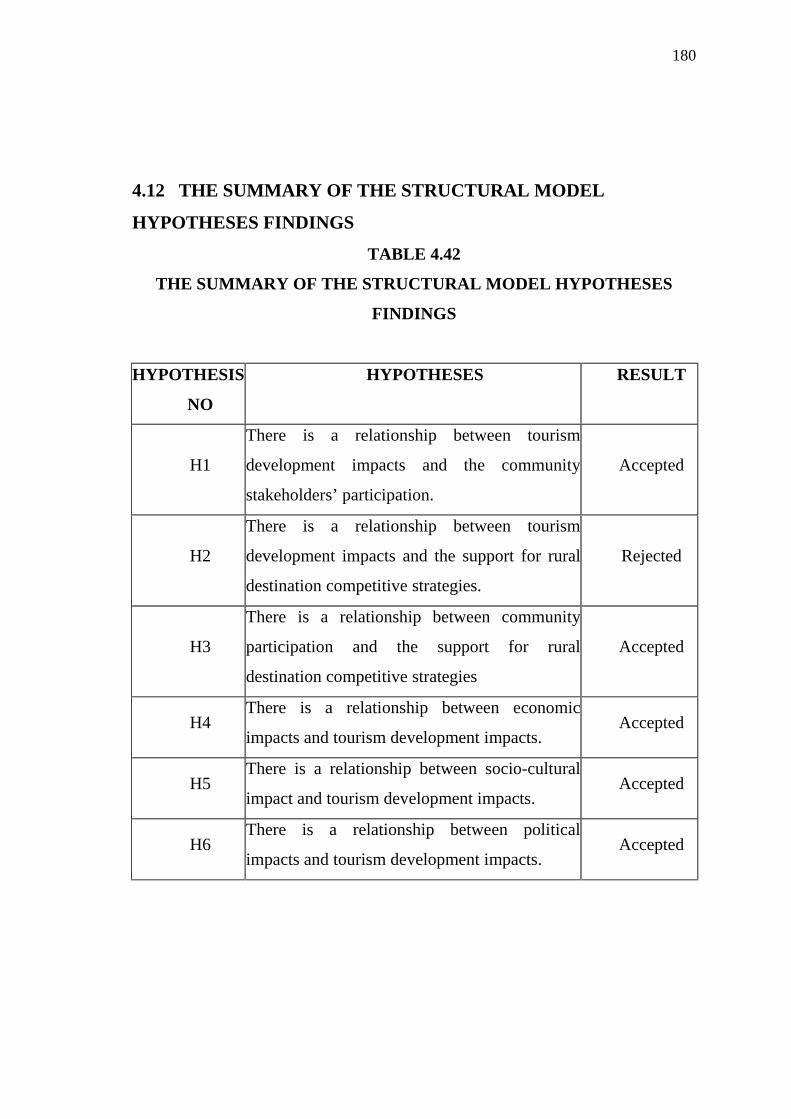
180
4.12 THE SUMMARY OF THE STRUCTURAL MODEL
HYPOTHESES FINDINGS
TABLE 4.42
THE SUMMARY OF THE STRUCTURAL MODEL HYPOTHESES
FINDINGS
HYPOTHESIS
NO
HYPOTHESES RESULT
H1
There is a relationship between tourism
development impacts and the community
stakeholders’ participation.
Accepted
H2
There is a relationship between tourism
development impacts and the support for rural
destination competitive strategies.
Rejected
H3
There is a relationship between community
participation and the support for rural
destination competitive strategies
Accepted
H4There is a relationship between economic
impacts and tourism development impacts.Accepted
H5There is a relationship between socio-cultural
impact and tourism development impacts.Accepted
H6There is a relationship between political
impacts and tourism development impacts.Accepted
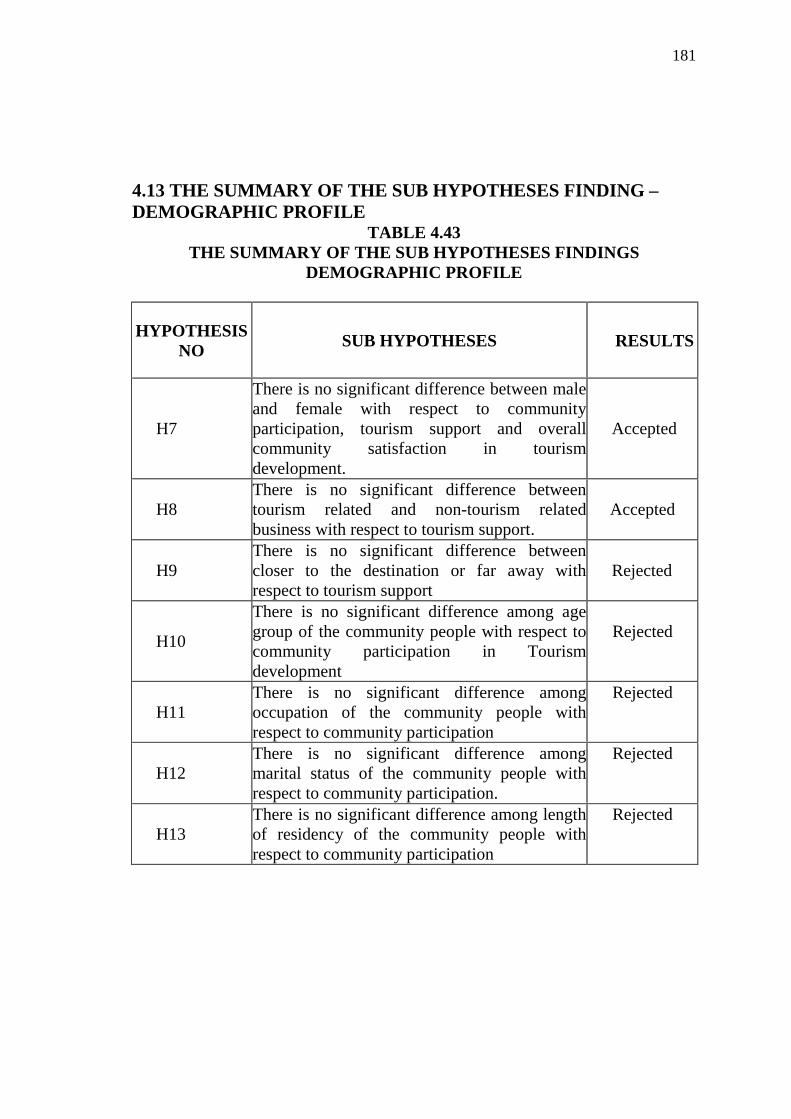
181
4.13 THE SUMMARY OF THE SUB HYPOTHESES FINDING –DEMOGRAPHIC PROFILE
TABLE 4.43THE SUMMARY OF THE SUB HYPOTHESES FINDINGS
DEMOGRAPHIC PROFILE
HYPOTHESISNO SUB HYPOTHESES RESULTS
H7
There is no significant difference between maleand female with respect to communityparticipation, tourism support and overallcommunity satisfaction in tourismdevelopment.
Accepted
H8There is no significant difference betweentourism related and non-tourism relatedbusiness with respect to tourism support.
Accepted
H9There is no significant difference betweencloser to the destination or far away withrespect to tourism support
Rejected
H10
There is no significant difference among agegroup of the community people with respect tocommunity participation in Tourismdevelopment
Rejected
H11There is no significant difference amongoccupation of the community people withrespect to community participation
Rejected
H12There is no significant difference amongmarital status of the community people withrespect to community participation.
Rejected
H13There is no significant difference among lengthof residency of the community people withrespect to community participation
Rejected
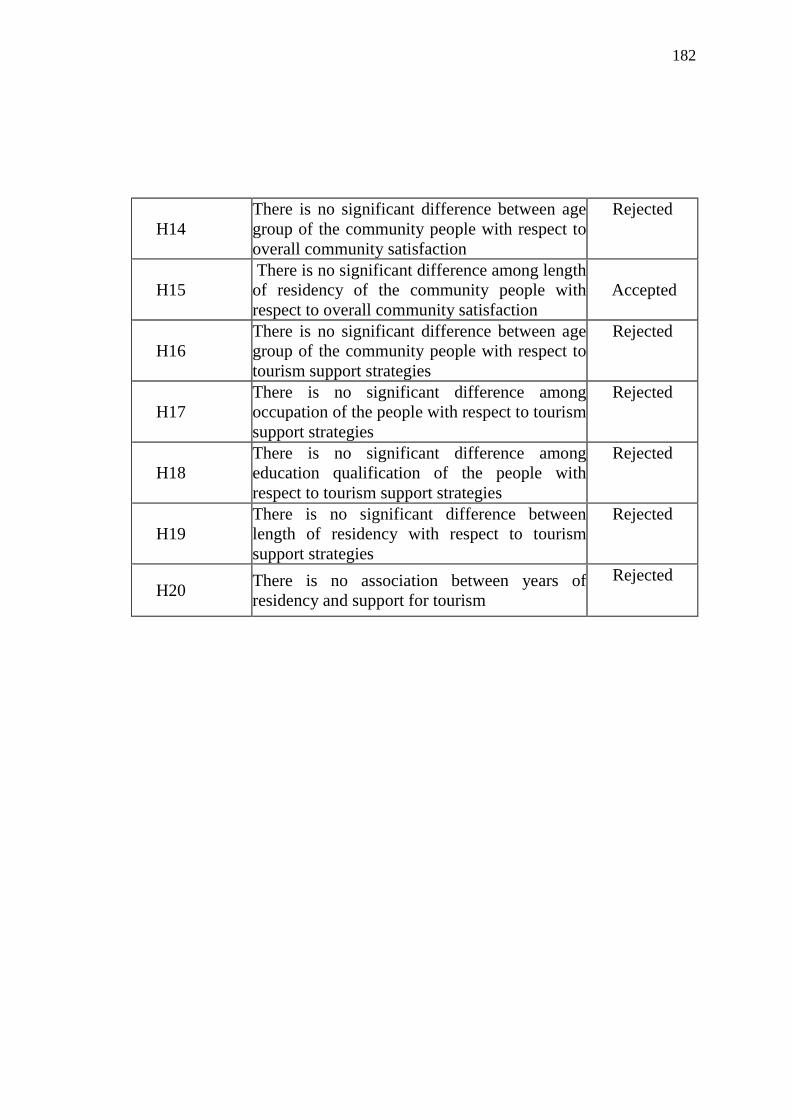
182
H14There is no significant difference between agegroup of the community people with respect tooverall community satisfaction
Rejected
H15There is no significant difference among lengthof residency of the community people withrespect to overall community satisfaction
Accepted
H16There is no significant difference between agegroup of the community people with respect totourism support strategies
Rejected
H17There is no significant difference amongoccupation of the people with respect to tourismsupport strategies
Rejected
H18There is no significant difference amongeducation qualification of the people withrespect to tourism support strategies
Rejected
H19There is no significant difference betweenlength of residency with respect to tourismsupport strategies
Rejected
H20There is no association between years ofresidency and support for tourism
Rejected

183
4.14 DATA ANALYSIS OF FOCUS GROUP INTERVIEW
4.14.1 Stakeholders Views on the Community Participation Implementation
Stakeholder interviews identified three problems in the community
participation processes in Karaikudi. The first relates to government control in
the decision-making processes. Excessive control by the government limited the
public involvement in the decision making process.
One of the government officers (Respondent 6) explained: ...if the public
is not satisfied with the plan they can make an enquiry to the State Planning
Committee. That was the highest level of participation in any development plan
in this country...even though, the state planning committee considered the
enquiry, the committee was still free to make a decision which they held to be
relevant. Fortunately, the residents understood how the decisions were made.
One of the community leaders (Respondent 12) stated his regrets: The
decision was made at the top level of administration without any involvement
from the local level. Even when the government officials went to the local level,
the approach used was not effective because we were not able to be actively
involved. Second, the weaknesses of the existing participation approach were
another major concern for most of the interviewees.
A community leader (Respondent 13) explained his views on that
situation: ― the priorities given in the participation process was just to inform
the residents but not to look at their response...actually, some of the residents
had objections but the problem was that they didn‘t have proper means for
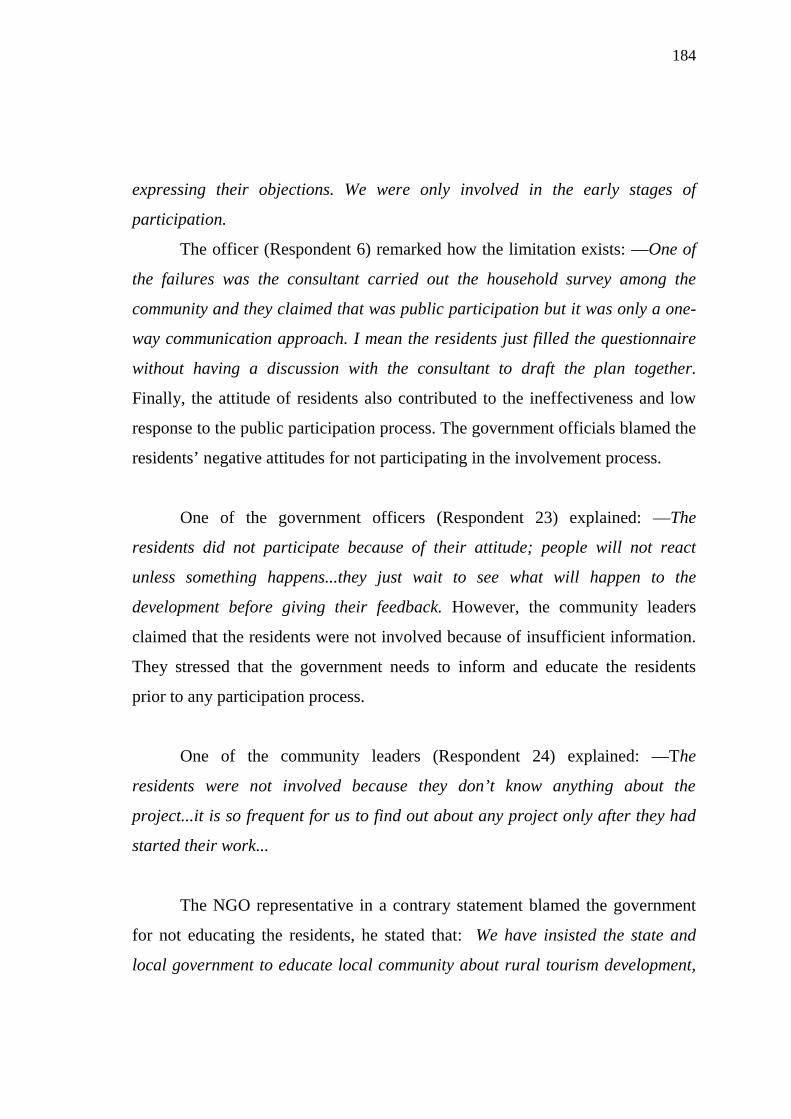
184
expressing their objections. We were only involved in the early stages of
participation.
The officer (Respondent 6) remarked how the limitation exists: ―One of
the failures was the consultant carried out the household survey among the
community and they claimed that was public participation but it was only a one-
way communication approach. I mean the residents just filled the questionnaire
without having a discussion with the consultant to draft the plan together.
Finally, the attitude of residents also contributed to the ineffectiveness and low
response to the public participation process. The government officials blamed the
residents’ negative attitudes for not participating in the involvement process.
One of the government officers (Respondent 23) explained: ―The
residents did not participate because of their attitude; people will not react
unless something happens...they just wait to see what will happen to the
development before giving their feedback. However, the community leaders
claimed that the residents were not involved because of insufficient information.
They stressed that the government needs to inform and educate the residents
prior to any participation process.
One of the community leaders (Respondent 24) explained: ―The
residents were not involved because they don’t know anything about the
project...it is so frequent for us to find out about any project only after they had
started their work...
The NGO representative in a contrary statement blamed the government
for not educating the residents, he stated that: We have insisted the state and
local government to educate local community about rural tourism development,

185
the benefits to get involve and the consequences from the development. We
suggest them to organise more seminar for local community.
4.14.2 COMPARING THE RESIDENTS AND STAKEHOLDERS VIEWS
In a comparison of the findings, the quantitative and qualitative results show that
the three main problems of the participation process are as follows:
1. Government control in the decision making process. This issue was
influenced by the administration system and bureaucracy constraints. The
legislation limitation was also a major issue since many of the important
regulations and procedures were designed to maintain government control.
2. The implementation weaknesses resulted in the simplicity in the existing
participation approach. The level of knowledge among the government officials
also contributed to these problems.
3. Residents’ attitudes. Some of the residents had a negative attitude towards
the government program and the participation process. However, the significant
findings were that the limited information of the participation processes and the
level of education caused those problems. Since the limitation of information
decreased the number of participants, a low level of education resulted in the
failure to increase the quality of comments or suggestions.
Despite of the problem, the majority of respondents supported a greater
involvement for future public participation processes. Survey results show that
most of the respondents want to have more information (84%) and take part in
the consultation process (83%). Although the current practice in Karaikudi does
not include the participants in the decision-making process, the respondents want
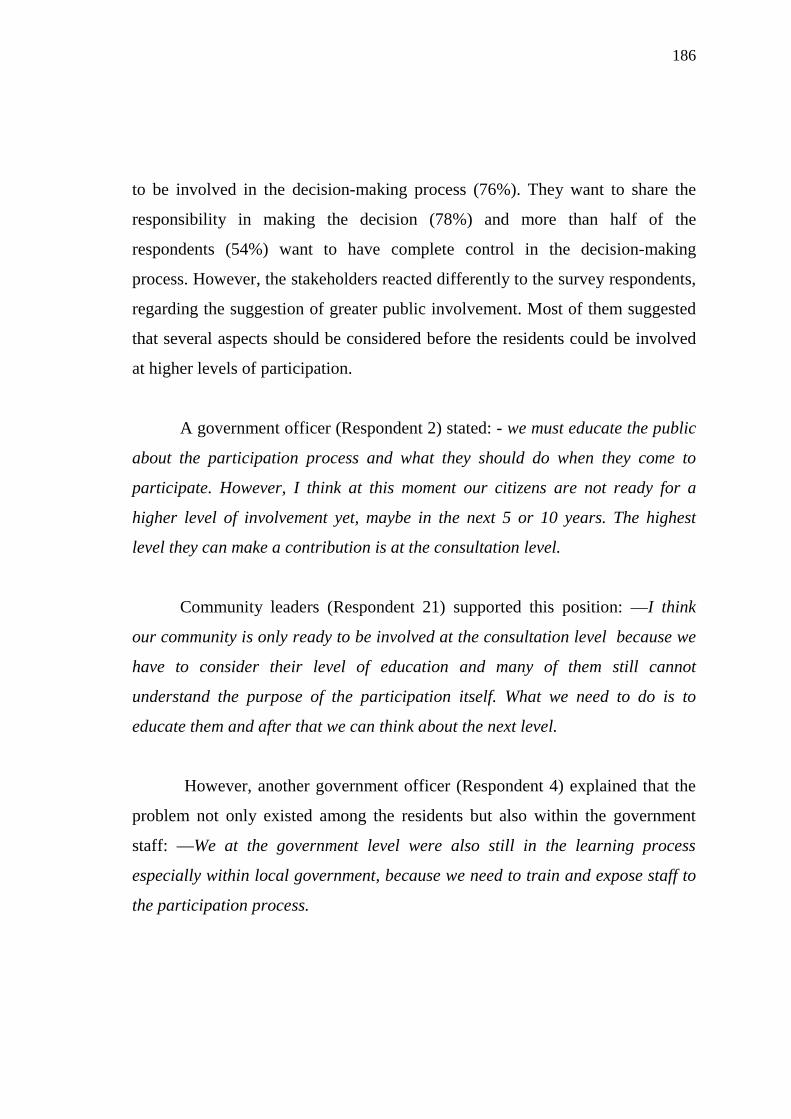
186
to be involved in the decision-making process (76%). They want to share the
responsibility in making the decision (78%) and more than half of the
respondents (54%) want to have complete control in the decision-making
process. However, the stakeholders reacted differently to the survey respondents,
regarding the suggestion of greater public involvement. Most of them suggested
that several aspects should be considered before the residents could be involved
at higher levels of participation.
A government officer (Respondent 2) stated: - we must educate the public
about the participation process and what they should do when they come to
participate. However, I think at this moment our citizens are not ready for a
higher level of involvement yet, maybe in the next 5 or 10 years. The highest
level they can make a contribution is at the consultation level.
Community leaders (Respondent 21) supported this position: ―I think
our community is only ready to be involved at the consultation level because we
have to consider their level of education and many of them still cannot
understand the purpose of the participation itself. What we need to do is to
educate them and after that we can think about the next level.
However, another government officer (Respondent 4) explained that the
problem not only existed among the residents but also within the government
staff: ―We at the government level were also still in the learning process
especially within local government, because we need to train and expose staff to
the participation process.
187
CHAPTER V
CONCLUSION AND DISCUSSION
5.1 INTRODUCTION
This research study was conducted to theoretically develop and
empirically test a structural equation model of support for the tourism destination
from the tourism stakeholders’ perspective. The proposed hypotheses that
attempted to identify the structural relationships between the three constructs in
the model were examined through a series of analyses in AMOS. This chapter
provides the findings and conclusions of the study in relation to its secondary
objectives, hypotheses and research problem. The sub hypotheses identified in
the report are tested by applying student’s t-test, one way ANOVA, chi-square,
correlation tests, and regression tests by applying SPSS version 16.
The important principle of this study was that the support of tourism
stakeholders for tourism planning and development is a key element for the
successful operation, management, and long-term sustainability of tourism
destinations. Tourism stakeholders’ attitude, knowledge and experiences in
tourism management and industry, professional involvement and participation in
tourism planning and development, and their long-term community observation
and interactions have played an important role in a tourism destination
management. Therefore, their perceptions, attitudes, and behaviors regarding
tourism management and the tourism industry were major sources of testing the
proposed structural model and hypotheses.
188
5.2 DISCUSSION OF THE RESEARCH FINDINGS
5.2.1 General Findings and Discussion
This study overviewed a theoretical background and empirical studies that
exist in the literature in an attempt to cover studies related to the research
problem. The objective of the study was to develop a theoretical model about
stakeholders’ support for tourism destination and to empirically test
interrelationship between the various constructs that are likely to affect
community participation in tourism development and their support of destination
competitive strategies (endogenous constructs). The exogenous construct
(tourism development impact) includes Economic impacts, Socio-cultural
impact, Environmental impact and political impact. The structural model of
support for rural tourism destination also addressed the influence of tourism
development impacts and community participation on stakeholders’ support of
tourism destination.
Based on convenience sampling method, with the total usable sample
size 320 the respondents were surveyed from very diverse tourism stakeholder
segments, including government authorities; tourism related and not related
tourism businesses, tourism agencies, residents, tourists, tourism faculty and
students. The results also showed that the survey questionnaires were collected
from a wide range of geographically distributed areas covering the entire places
of Karaikudi.
Based on the theoretical review and empirical research, all measurement
scales for each construct of the proposed model were developed and utilized to
investigate the relationships between the constructs. An assessment of reliability
189
and validity of the measurement scales revealed that the measurement scale for
each construct was reliable and valid in terms of the internal consistency and
accuracy of what they intended to measure. The newly developed measurement
scale for community participation, which was composed of 8 items, generated a
Cronbach’s coefficient’s alpha of 0.89. This indicates that this measurement
scale was reliable in assessing stakeholders’ wish for involvement in community
decision- making processes about tourism planning and development.
Structural equation modeling was used to analyze the fit of the proposed
theoretical model. First, exploratory factor analysis (EFA) was conducted to
tourism development impact (TDI) construct to condense the measurement
scales. Secondly, confirmatory factor analysis (CFA) was conducted to refine the
predicted relationships of the observed indicators to the constructs. The multi-
dimensionality of each construct was confirmed and the reliability for each
construct was calculated. The reliability scores were: economic impact (.91),
socio-cultural impact (.84) environmental impact (.89), political impact (.86),
community participation (.89), and Stakeholders’ tourism support (.84). All these
reliabilities exceeded the recommended level 0.7 (Hair et al. (1989).
5.2.2 DEMOGRAPHIC CHARACTERISTICS OF THE RESPONDENTS
The respondents comprised male (55.6 %) and female (44.4 %), due to
socio-cultural constraints; females were less willing to participate in the survey.
Age groups have been recoded after merging small segments; the results showed
that 41.9 % of respondents were aged between 25 and 44 years, followed by age
ranges of 15-24 years (27.2%), then 44-65 years (25.6%), and 65+years
(5.3%).The results indicated that the majority of respondents (41.9%) were
middle-aged (between 25 and 44 years old).
190
Education levels of tourism stakeholders showed that 37.8% of
respondents had secondary level school education, 30.6% had higher
qualification, 30% elementary education while 1.6% are uneducated. This
implies that the majority of respondents (37.8%) had secondary level school
education.
In terms of respondents’ employment, it was found that 41.6% of the
respondents were engaged in self-employment, the government employs 6.2% of
respondents and 15.0% are employed by private sector organisations. The
students constitute 14.4 %, house-wives 7.2%, and the retired people were 4.7%.
The self help groups were 4.4% and the unemployed people were 6.6%.
From the monthly income level of the people, 40.9% have income
between Rs 5001 and Rs 10,000, followed by 24.7% less than Rs 5000. Then
20.6% of the people have Rs10,001 and Rs 15,000 and only 13.1% were above
Rs 15,000.From a marital status perspective, 61.6% of respondents were married,
and 30.3% were single. The widows and divorced respondents would constitute
only 8.1% of total respondents. 58.1% of the respondents had their family
members 4-6. Family members not more than 3 accounted for 31.6%. Only
10.3% of the respondents had their family members above seven.
In terms of respondents’ average length of residency in their place, thenominal values revealed that 32.8% of respondents were residents of the same
place and living there for more than 20 years, followed by 6-10 years (21.2%).
17.2% of the respondents were living between 11-15 years and nearly 14% of the
respondents were between 0-5 years and 16-20 years. These results revealed how
closely the people are attached to their communities and are not frequent movers.
191
In terms of residence close to the tourist spots, 51.2% of the respondents
were living far away and 48.8% were living very close to the tourist spots. Of the
total respondents, 72.2 % considered themselves as working with non-tourism
related organisations; however, the remaining percentage was related directly or
indirectly to the tourism industry.
5.2.3 DIMENSIONS OF TOURISM DEVELOPMENT IMPACTS OF
RURAL TOURISM.
The Kaiser-Meyer-Olkin (KMO) value which is a measure of sampling
adequacy is found to be 0.846, which indicates that the sample was large enough
to perform Exploratory Factor analysis. That is, a 10 to 1 ratio of the sample size
(N=320) is commonly found acceptable (Hair et al., 1998). The results of the
Bartlett’s Test of Sphericity are also significant, which indicates that the factor
analysis processes are correct and suitable for testing multidimensionality.
The 30 items were exposed to factor analysis to identify the underlying
factors, and latent root criterion (eigenvalue) value of above 1.0 (Pett et al.,
2003) and a factor loading of 0.40 were used as a benchmark for including items
in a factor. EFA was performed on the sample using the 30 variables related to
the Tourism Development Impacts. From EFA, four factors Economic impact
(EC), Socio Cultural impacts (SC) Environmental impacts (EN) Political impacts
(P) were extracted accounting for 63.8 percent of the total variance explained. 28
items loaded properly (Factor loadings>0.4). Two items, namely “Increase in
awareness on the importance of the site” and “Improved Solid waste
management facilities like the garbage disposal system” were removed because
they did not load good (Factor loading less than 0.4)on any of the factors. The
192
Factor loadings are presented in the Table 4.6. Confirmatory factor analysis
(CFA) loadings also suggest that all the items taken for scale construction qualify
to develop the scale. The four factors are labeled as below.
Factor 1, labeled ‘Economic Impact (EC)’, accounted for 17.796 percent
of variances with 10 items. This factor shows the issues related to job
opportunities, income generation, and promotion of handicrafts. The item having
the highest loading was ‘Increases job opportunities’ followed by ‘Increase in
income generation, and promotion of handicraft items’ and ‘common platform to
sell’.
Factor 2, ‘Socio-Cultural Impact (SC)’ accounted for 14.858 percent of
variances with 12 items. The item having the highest loading was ‘Tourismcauses changes to the traditional culture’ followed by ‘cultural exchange between
tourists and residents’, then ‘tourism has created Mobilization of women
artisans’.
Factor 3, ‘Environmental impact (EN)’, explained 10.432 percent of
variances with 4 items. The highest loading item in this component is
‘Improvement in natural beauty’ followed by Improvement in hygiene
conditions’ and ‘destroys the natural environment’.
Factor 4, ‘Political Impact (P)’ accounted for 20.714 percent of variances
with 2 items. The item having the highest loading was ‘Tourism brings political
benefits to society’ followed by ‘authority to control and restrictions’.
193
5.2.4 IMPACT OF DEMOGRAPHIC CHARACTERISTICS ON
COMMUNITY PARTICIPATION
To analyze the impact of the demographic characteristics on the community
participation in tourism development, the researcher has applied student’s t test
ANOVA and arrived with the following findings.
a) Impact of Gender on Community Participation in Tourism Development
It was observed that there is no significant difference between male
and female with respect to community participation in the development of
tourism. Both male and female actively participate in tourism development.
b) Impact of age group on Community Participation in Tourism
Development
It was concluded that there is significant difference between age group
of the community people with respect to community participation in Tourism
development. The people with the age between 46-65 years show higher
participation in tourism development than people with the age groups 15-24
years and 25-44 years. The older people who are above 65 years show lower
participation in the tourism development.

194
c) Impact of occupation on Community Participation in Tourism
Development
It was found that the government employee and retired people showed
less participation in tourism development. People working in private sector
and unemployed were participating more in the tourism development.
d) Impact of marital status on Community participation in Tourism
Development
It was concluded that there is significant difference between marital
status of the people with respect community participation. The divorced
people showed more participation in tourism development than the other
group of people who are staying alone and married ones. The separated group
of people showed less participation in tourism development.
e) Impact of marital status on Community Participation in Tourism
Development
The people who live more than 20 years are more participative in the
tourism development followed by 16-20 years of residents. The people who
are new to the place or whose length of residence is less than 10 years
showed less participation in tourism development.
5.2.5 IMPACT OF DEMOGRAPHIC CHARACTERISTICS ON
OVERALL COMMUNITY SATISFACTION
a) Impact of gender on overall community satisfaction
The researcher has identified that there is no significant difference
between male and female with respect to overall community satisfaction.
195
Overall, both male and female are dissatisfied with the tourism development
in the area. They fell that even though they are the primary gainers from
tourism, they are also the ones who suffer most from its effects.
b) Impact of age on overall community satisfaction
It is concluded that there is significant difference between age group of
the community people with respect to overall community satisfaction. The
older people who are above 65 years were less satisfied when compared to all
other age groups of people. Their lives not dependent on rural tourism, but
the respondents thought rural tourism would be a good way for preserving
rural life.
c) Impact of length of residency on overall community satisfaction
It is found that there is no significant difference among length of
residency of the people with respect to community satisfaction. The people
are less satisfied with the tourism development in the area irrespective of the
period of residence.
5.2.6 IMPACT OF DEMOGRAPHIC CHARACTERISTICS ON
TOURISM SUPPORT
a) Impact of gender on Tourism support
There is no significant difference between male and female with
respect to tourism support. Both male and female stakeholders support
tourism strategies in their destination.
196
b) Impact of age on Tourism support
The researcher has found that there is significant difference between
age group of the community people with respect to tourism support strategies.
The people with the age group between 15-24 years and above 65 years show
less support for tourism. The people with the age group between 25-44 years
show high support for the tourism Support strategies. The people with the age
group between 45-65 years neither support nor oppose the tourism strategies.
The younger generation people and elderly people are less supportive for
tourism than the middle aged people.
d) Impact of occupation on Stakeholders’ Tourism Support
It is observed that there is significant difference among the occupation
of the people with respect to tourism support strategies. The self help groups,
housewives and unemployed people showed more support to tourism
strategies. Retired people and the students are less supportive for the tourism
support strategies. People employed in government and private sectors and
retired people shows medium support for the tourism in the area.
d) Impact of education on stakeholders’ Tourism Support
It is found that the people who have the elementary education were
more supportive for the tourism development in their area than the people
with higher qualification. The uneducated people show less support for
tourism development.
e) Impact of Nature of Business on stakeholders’ Tourism Support
The researcher has identified that there is no significant difference
between tourism related or non tourism related business with respect to
197
tourism support. They stands neutral i.e., they neither support nor oppose
tourism in their area.
f) Impact of length of residency on stakeholders’ Tourism Support
It is concluded that there is significant difference among length of
residency of the people with respect to tourism Support strategies. The people
who live more than 20 years are more supportive for the tourism development in
their area. The people who are new to the place or whose length of residence is
between 0-5 years show less support for tourism development.
g) Impact of closer to the destination or far away on Tourism Support
It was found that there is significant difference between closeness to
the destination and faraway from the destination with respect to tourism
support. The people who are very close show more support than the people
who are far away from the destination. This result was quite contradictory
with the findings of Harrill (2004). In his research he found that residents
who live close to the core of tourism activity have more negative attitudes
towards tourism development. Harrill and Potts (2003) investigated the
relationships between neighborhood, economic dependency, and tourism,
finding that those neighborhoods close to the tourism core had the most
negative attitudes towards tourism while neighborhoods further away
perceived tourism more positively.
198
5.3 FINDINGS OF STRUCTURAL EQUATION MODELING
A structural equation modeling was used to test the hypotheses proposed
in this study in an attempt to identify the structural relationships between
dependent and independent constructs. Five of the six proposed relationships
within the three major hypotheses were strongly supported, based on the
outcome of the final structural model. Those hypotheses that were supported
generated a significant level of critical ratio (t-value) and standardised coefficient
scores. The following discussion presents the findings for each hypothesis.
1) Influence of tourism development impacts on community participation.
The hypothesis H1 proposed that tourism development impacts (economic,
social-cultural, environmental and political,) influence stakeholders’
participation in community decision-making processes. The outcome of SEM
analysis strongly supported the hypothesis. . The findings related to H1 indicated
that when community members feel that they are negatively affected by tourism
developments in their region, they are more likely to call for a greater
participation in planning and decision-making processes. The person
encountering negative socio-cultural impacts is increasing due to rising inbound
and domestic tourist numbers in karaikudi.
(2)Influence of tourism development impacts on tourism support The
‘tourism development impacts’ constructs (H2) held significant negative
relationships with the construct of ‘tourism support’. This finding was consistent
with the previous studies results which concentrated only on the environmental
and political benefits to tourism development (e.g. Davis et al., 1988; Lankford
& Howard, 1994). However, the findings also contradicted those studies which
199
demonstrated that if tourism stakeholders perceived economic benefits and
socio-cultural from tourism activities, they were more likely to support further
tourism development (e.g. Jurowski, et al., 1997; Ko & Stewart, 2002; Perdue et
al., 1987; Yoon 2002; Yoon et al., 1999, 2001). Hence, it is likely to expect
stakeholders to support tourism that maximize the economic benefits and social
to them. It was evident from the empirical data that the younger generation
people and elderly people are less supportive for tourism than the middle aged
people.
(3) Influence of community participation on tourism support It was
hypothesized in H3 that tourism stakeholders who have a desire and interest in
participating in tourism planning and benefits are more likely to support tourism
development. The results of the SEM analysis supported the hypothesis. In
addition, the results showed a significantly strong positive relationship between
the constructs ‘community participation’ and ‘stakeholders’ support for
destination competitive strategies’.
(4) Influence of ECI,SCI,PI on tourism development impacts The findings
confirmed the existence of a significant relationship (H4,H5,H6) between
‘economic impacts’, ‘socio-cultural impacts’ and ‘political impacts’ and as a
factor of TDI construct (e.g. Goudy, 1977; Jurowski et al., 1997; More & Graefe,
1994;Um & Crompton, 1987), Meanwhile, the study’s findings did not show any
relationship between the ‘environmental impacts’ construct as a construct of
‘tourism development impacts.’ After excluding the environmental impact items
during the CFA exercises, due to their loadings on more than one factor, three
development impact indicators emerged: socio-cultural, economic, and political.
These indicators provided an acceptable goodness-of-fit to the model. This
200
shows the importance that stakeholders place on socio-cultural matters. In fact,
tourism officials at both the Ministry of Tourism and private businesses stressed
the importance of culture and stakeholder’s involvement in decision making for
promoting karaikudi as a tourist destination.
5.4 CONTRIBUTIONS AND IMPLICATIONS OF THE RESEARCH
FINDINGS
This research suggests several theoretical contributions, new insights to
methodological approaches and practical implications.
5.4.1 Theoretical contribution
The various gaps in the tourism literature that specifically dealt with the
topics of the relationship between stakeholders’ attitudes and support for tourism
development, stakeholders’ participation, and destination competitiveness. Thisresearch attempted to close those gaps. The study advances the tourism literature
by introducing conceptual framework (model) explaining the relationship
between tourism development impacts, community participation and support for
tourism destination competitiveness from the stakeholders perspective. This
conceptual model will contribute new knowledge to the area of rural tourism
research. This study supported the majority of the hypothesized relationships.
5.4.2 Utilization of SEM for key constructs relationship testing.
This research used the structural equation modeling (SEM) method and
AMOS software in data analysis. There is little tourism literature using this
method in rural tourism research. Thus, this study contributes by expanding the
use of SEM in analyzing empirical data in the rural tourism discipline in the
rigorous testing of relationships between key constructs. This study is one of few
201
recent studies that have attempted to explain the relationships between different
perceived tourism development impacts, community participation and support
for destination tourism planning, development and competitive strategies.
5.4.3 Development of measures and scales.
A number of scale items were developed to test the community
participation construct empirically. Scale development for this construct was one
of the primary purposes for this research. Therefore, this study contributed
methodologically to the tourism literature and stakeholders’ theory by
developing a scale, which could be used in consequent research to substantiate
the arguments proposed in this study. Therefore, researchers can replicate this
scale in different settings or destinations for validation.
5.4.4 Managerial implications
Findings provide some guidance to tourism planners, developers, and
policy decision-makers to better evaluate and understand which tourism
resources and attractions key stakeholders preferred to see developed (e.g.
development of nature-based tourism, development of small independent
businesses, and development of cultural or historic-based attractions). These
results are likely to help tourism stakeholders and marketers to collect
information and plan appropriate competitive strategies based on the tourism
attractions they prefer to develop before the implementation stage. For the local
communities, stakeholders’, rural local official entities, public and privateservice providers, the anticipated outcomes should offer an insight into the
potential for rural area sustainability to help to provide a good rural experience
and offer a good level of service quality.

202
For the tourists, if they perceived the experience to be beyond their
expectations, then they will be satisfied and trust in the local rural tourism
population, entities, and facilities. They will be more inclined to return to the
place or will try to find a similar rural tourism experience. Thus, the overall
image will be positively encoded in their minds.
5.5 SUGGESTIONS AND RECOMMENDATIONS
5.5.1 General suggestions
The rural communities have the potential resources, ability to attract and the
opportunity to exploit the growing tourism industry. Tourism enhances the
quality of life for local residents.
1. New restaurants and cottages can enhance recreation and entertainment
opportunities for the local residents.
2. Rural tourism development can give rise to several new economic
activities, more demands, competition for services and some times more
crime. With the arrival of rural tourism, regions will not be the same place
as in the past.
3. To develop the rural tourism, a goal has to be set for the entire
community.
4. Ministry of tourism should allocate funds for promoting rural tourism.
5. The government should encourage every state to involve the local people
in the rural areas to participate in tourism related projects, which may
preferably be formulated by the tourism department officials in
consultation with local people and NGOs. These projects could be in the
nature of providing glimpse of the village ambience to the tourists with
local cuisine with local art and culture.
6. The people should be dress in local costumes.

203
7. Moderate, but clean, accommodations for tourists should be constructed
by the villagers in traditional design and architecture.
8. A democratic movement should be formed which helps people at all
levels to participate in tourism development.
9. The need for education and proper understanding for both tourists and
local people is necessary for tourism development .The villagers not only
have to educate themselves but they have to understand Hindi to interact
with the Indian customer and English to communicate with the foreign
customers.
10. The guide should be intelligent to handle different type of tourist, good
communication skill and good rapport building attitude
5.5.2 Suggestion from findings
Since rural tourism destinations involve multi-faceted components of
natural/cultural tourism resources and a multiplicity of man-made tourism
businesses, a systematic analysis and understanding of stakeholders’ attitude and
perceptions for tourism support destination competitiveness is required.
1. Increasing the education level of residents to understand their right and
need for greater participation in the decision-making process.
2. The tourism destination management organizations may need to play an
important role as facilitators between local government and agencies for
tourism planning and development.
3. The development of the leadership of destination management
organizations for local government and agencies, to make an extensive
use of team work in all initiatives.
204
4. Additionally, the establishment of effective linkages between local
government and agencies was recommended in order to improve
destination competitiveness in the long run.
5. The findings have many arguments that have been presented to support
and oppose rural tourism development. The pros and cons need to be
carefully considered by local villagers while considering rural tourism as
an economic diversification strategy. Argument in support of tourism
includes new jobs opportunities and additional income begins injected
into the local economy. It will attract outsiders who bring dollars to spend.
6. The government needs to focus on occupation training, handicraft
promotion to increase the villagers' quality of life by creating a healthy
environment.
7. From the findings destination competitive strategies supported by tourism
stakeholders may be associated with community participation. So a closer
examination of the community attitudes has to be carried out.
8. The success of rural tourism totally depends on the quality of service
provided to the tourist. To develop the manpower government has to take
initiative to open various short training courses for imparting knowledge
and skill, so that they can discharge their duties effectively.
9. Certain marketing programs and activities to overcome seasonality in
tourists’ visits should be considered. The development of strong linkages
with tourism wholesalers and retailers could be suggested. they should
ensure a stable work market for handicrafts and services developed
10. This study also found that the respondents (tourism stakeholders)
supported the development of advanced technology and information
systems. Thus, it is recommended to focus on information technology

205
5.5.3 Recommendations
Rural tourism can help in creating sustainable development in some of our
villages in rural areas. Governments should recognize importance of rural
tourism at priority and help in creating healthy competitive business
environment. Government should try to generate data for decision-making bodies
investing for developing the human resources, create adequate facilities and
suitable infrastructure like accommodation, roads, airport facilities, rail facilities,
local transport, communication links and other essential amenities become
essential for development of rural tourism.
Some of the essential services required for rural tourism are
• Confidence building in safety and security.
• Sustainable growth plan for of rural tourism
• New technology investment.
• Business must balance economics with people, culture and environment.
• Development of local heritage and lifestyles.
• Improve traditional folk and festivals.
• Promote traditional handicraft products.
• Make the tourist to participate in local farming activities.
• Demonstrate the local folk dances and traditional rural practices to the tourists.
• Improve quality, value of rural tourism.
206
5.6 LIMITATIONS AND DIRECTIONS FOR FUTURE RESEARCH
Limitations of this study were found and it was addressed to encourage
more sound research in the future. The major limitations derived from this study
are: 1) research scope and boundaries of the research, 2) selected observed
indicators and constructs, 3) lack of residents’ and tourists’ opinions, 4) limited
analysis of performance of destination competitive strategies 5) longitudinal
characteristics,
This study investigated the structural relationships of tourism destination
competitiveness from tourism stakeholders’ perspectives. The surveyed data
were only collected in the state of Tamilnadu. The scope of this study is limited
to Karaikudi (first identified spot) and results may not be regionally generalized.
This geographically limited survey may produce different results and
conclusions in terms of the magnitude and directions of relationships among the
constructs studied in this research. These findings cannot be generalized to all
rural spots in India, since tourism stakeholders differ with respect to perceptions
toward sustainable tourism development and destination competitive strategies.
Tourism stakeholders in other rural destinations may have different perceptions,
attitudes and behaviours in regard to tourism planning and development
approaches and strategies. Other rural tourism destinations and research scopes
should be explored to see if similar findings and results could be addressed.
Thus, it is suggested that data be collected from other competitive destinations to
Karaikudi to compare the obtained results.
207
This study has been limited in its selection of observed indicators,
variables, and constructs. Even though vast literature review has been explored
there may exist further insights of destination competitiveness. Specific variables
and constructs that address international competitive strategies are limited. The
variables and constructs that are related to tourism information systems or
management information systems were abbreviated. In current tourism markets,
any tourism destination may need to pay more attention to advanced
technologies and techniques so that quality products and services are delivered
effectively and efficiently. Therefore, future studies may address destination
competitiveness that includes information technology and techniques such as
tourism information systems.
Another limitation to this study is related to the respondents. Generally, in
the tourism literature, tourism stakeholders may include residents, tourists, and
tourism experts such as people who are involved in organizations, associations,
destination management and attractions such as the respondents for this study.
The findings of this study are limited by the nature of the sample. The NGO’s
and international business people can also be included in the sample. Each
measurement scale for the constructs can be refined and validated. This study
might reflect ongoing transformations that could influence the relationships
between the constructs for future research. Moreover, a longitudinal analysis of
the structural model of tourism destination competitiveness may reveal what
competitive strategies do a better job in increasing destination competitiveness
and performance. This study also is limited in terms of longitudinal
characteristics. The data were collected for a three-month period (September to
November 2010).Consequently, the above-mentioned limitations should be
considered as essential and critical suggestions for future research. Future studies
208
should take into account these limitations to produce more complete research
results.
Rural women in rural tourism are a most recent research interest in the
tourism literature than that of research about women and tourism in general.
Therefore the association between economic, socio cultural, political and gender
issues can also be included for further research.
Future research should test the model on several rural areas in India. This
comparison between various rural areas should enable one to detect common
features, as well as specificities, and refine the model, thus providing a broader
insight for both researchers and managers.
5.7 CONCLUDING COMMENTS
It is a fact that, there is a limited number of empirical studies on support
for rural tourism destination, this study developed and empirically tested a
structural equation model of tourism destination competitiveness and its relevant
constructs from the perspectives of tourism stakeholders. As a result the research
findings, it is hoped that this study has made valuable contributions to the
insights about support for rural tourism destination. From the results of the
comprehensive data analyses and procedures, this study may conclude that in
successful tourism development and management for destination
competitiveness, a more thorough understanding of tourism stakeholders’
attitudes and behaviors toward tourism should be made. As key players in
tourism destination competitiveness, support for destination competitive
strategies should be understood so that more competitive destination
209
environments and positions can be achieved. Finally, even though the results and
findings of this study are somewhat exploratory in nature, it is expected that the
information produced and the implications of the study may be of help to tourism
planners, policy-makers, and marketers to build more competitive tourism
destination environments and positions in the state of Tamilnadu.
Rural tourism in India has great future, since it not only provides natural
elements of beauty but also the indigenous local traditions, customs and foods.
Direct experience with local people can be a unique selling proposition to attract
tourists. Every state in India has some unique handicraft, traditions and foods.
The Rural tourism should not go for a mass marketing. Rural tourism should
develop different strategy for different segment to make it successful.

210
APPENDIX -1
RESEARCH ON RURAL TOURISM
Part- A- Demographic Profile
1. Gender: Male Female
2. Age Group: 15-24 Years 25-44 Years 44-65 years > 65 years
3. Educational Qualification: Elementary Secondary Higher qualification
4. Occupation: Self-employed Employed in government
Self help group Employed in private sector
Retired Housewife Student Unemployed
5. Monthly income of your family:
< Rs. 5000 Rs.5001 to Rs.10000 Rs.10001 to Rs.15000
Rs. 15001to Rs.25000 > Rs. 25001
6. Martial status: Single Married Separated / Divorced
Widowed
7. Size of the family: 1-3 4-6 7-9 10&above
8. Length of Residency:
0-5 years 6-10 years 11-15 years 16-20 years >20 years
9. Nature of business: Tourism related Non-tourism related
10. How close your residence from the tourist spot: Very close
Far away

211
Part B- LOCAL COMMUNITY AND EXPERTS ATTITUTE
5. Strongly Agree 4. Agree 3. Neither agree nor Disagree 2.Disagree 1. Strongly Disagree
Se.No Part- I Tourism Development ImpactsEconomic Impact
1. Tourism increases job opportunities for thelocal people
1 2 3 4 5
2. Increase in income generation for local people,artisans and small businesses
1 2 3 4 5
3. Wider promotion of handicraft items made inthe village
1 2 3 4 5
4. Development of common platform for craftspersons to display and sell their local arts andcrafts
1 2 3 4 5
5. Local labour, technology and resources beingoptimally utilized
1 2 3 4 5
6. Tourism has created high investment,development, and infrastructure
1 2 3 4 5
7. Tourism creates more jobs for outsiders thanfor local people.
1 2 3 4 5
8. Host community getting trained on differenttypes of hospitality management, cuisinepreparation, tourist handling
1 2 3 4 5
9. Collaboration with different businessinstitutions for market tie-ups.
1 2 3 4 5
10. Products are sold in the national andinternational markets
1 2 3 4 5
Socio-Cultural Impact11. Tourism causes changes to the traditional
culture of the community1 2 3 4 5
12. Tourism has encouraged a variety of culturalexchange between tourists and residents
1 2 3 4 5
13. Mobilization of women artisans in the activeparticipation in the tourism programme
1 2 3 4 5
14. Formation of activity based groups and selfhelp groups, benefiting women community
1 2 3 4 5
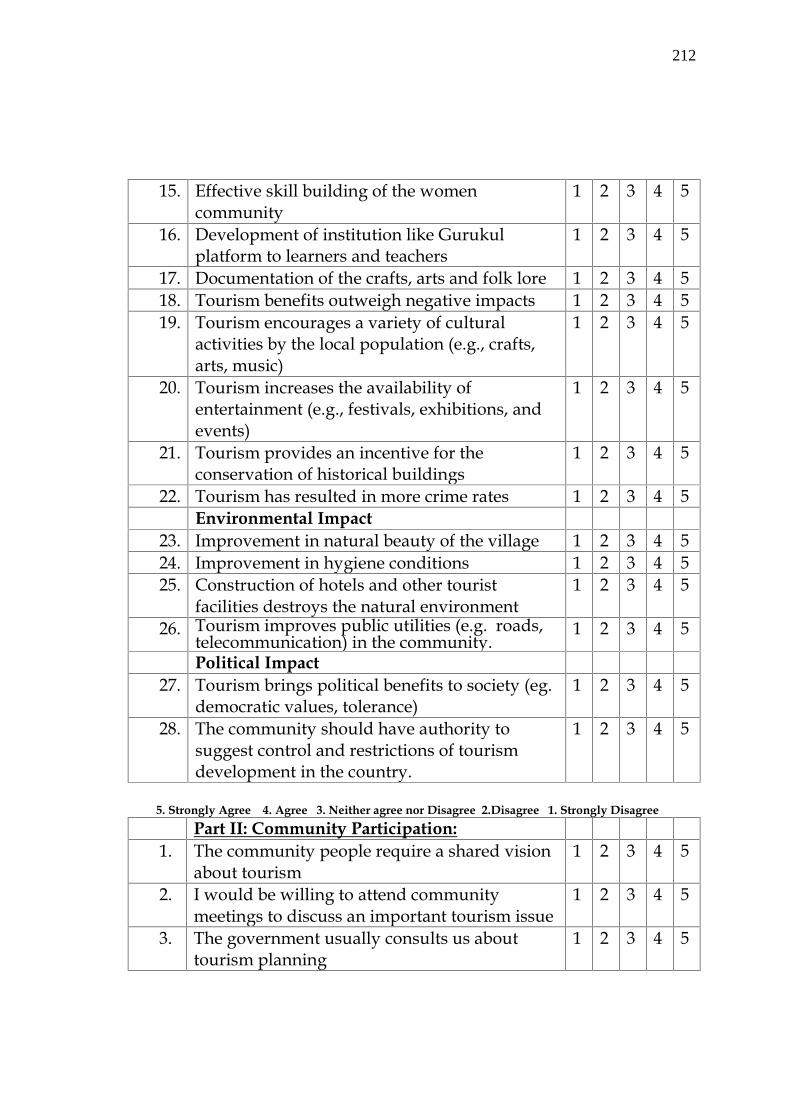
212
15. Effective skill building of the womencommunity
1 2 3 4 5
16. Development of institution like Gurukulplatform to learners and teachers
1 2 3 4 5
17. Documentation of the crafts, arts and folk lore 1 2 3 4 518. Tourism benefits outweigh negative impacts 1 2 3 4 519. Tourism encourages a variety of cultural
activities by the local population (e.g., crafts,arts, music)
1 2 3 4 5
20. Tourism increases the availability ofentertainment (e.g., festivals, exhibitions, andevents)
1 2 3 4 5
21. Tourism provides an incentive for theconservation of historical buildings
1 2 3 4 5
22. Tourism has resulted in more crime rates 1 2 3 4 5Environmental Impact
23. Improvement in natural beauty of the village 1 2 3 4 524. Improvement in hygiene conditions 1 2 3 4 525. Construction of hotels and other tourist
facilities destroys the natural environment1 2 3 4 5
26. Tourism improves public utilities (e.g. roads,telecommunication) in the community.
1 2 3 4 5
Political Impact27. Tourism brings political benefits to society (eg.
democratic values, tolerance)1 2 3 4 5
28. The community should have authority tosuggest control and restrictions of tourismdevelopment in the country.
1 2 3 4 5
5. Strongly Agree 4. Agree 3. Neither agree nor Disagree 2.Disagree 1. Strongly DisagreePart II: Community Participation:
1. The community people require a shared visionabout tourism
1 2 3 4 5
2. I would be willing to attend communitymeetings to discuss an important tourism issue
1 2 3 4 5
3. The government usually consults us abouttourism planning
1 2 3 4 5

213
4. The public lack power to participate andinfluence the decision making process
1 2 3 4 5
5. Public involvement in planning anddevelopment of tourism will lead to preservinglocal culture, traditions, and life style
1 2 3 4 5
6. Active Participation of the local community andyouth
1 2 3 4 5
7. I am willing to invest my talent or time to makethe community an even better place for visitors
1 2 3 4 5
8. I would be affected by whatever happens(positive or negative) in the community
1 2 3 4 5
5. Strongly Support 4. Support 3. Neutral 2.Oppose 1. Strongly OpposePart IV: Support for Tourism:
1. Development of heritage-based tourism 1 2 3 4 52. Development of cultural or historic-based
attractions (e.g. museums, folk villages, localhistoric sites, traditional markets).
1 2 3 4 5
3. Development of supporting visitor services(hotels, restaurants, entertainment, banks etc).
1 2 3 4 5
4. Development of small independent businesses(e.g. gift shops, guide services, campinggrounds).
1 2 3 4 5
5. Development of cultural and folk events (e.g.concerts, art and crafts, dances, festivals).
1 2 3 4 5
6. Development of infrastructure (roads,transportation, and access facilities) fortourists.
1 2 3 4 5
Part III: Overall Community Satisfaction:
1. What is the overall satisfaction rating about tourism development?
1. Highly Satisfied 2. Satisfied 3. Neutral 4. Dissatisfied 5. Highly Dissatisfied
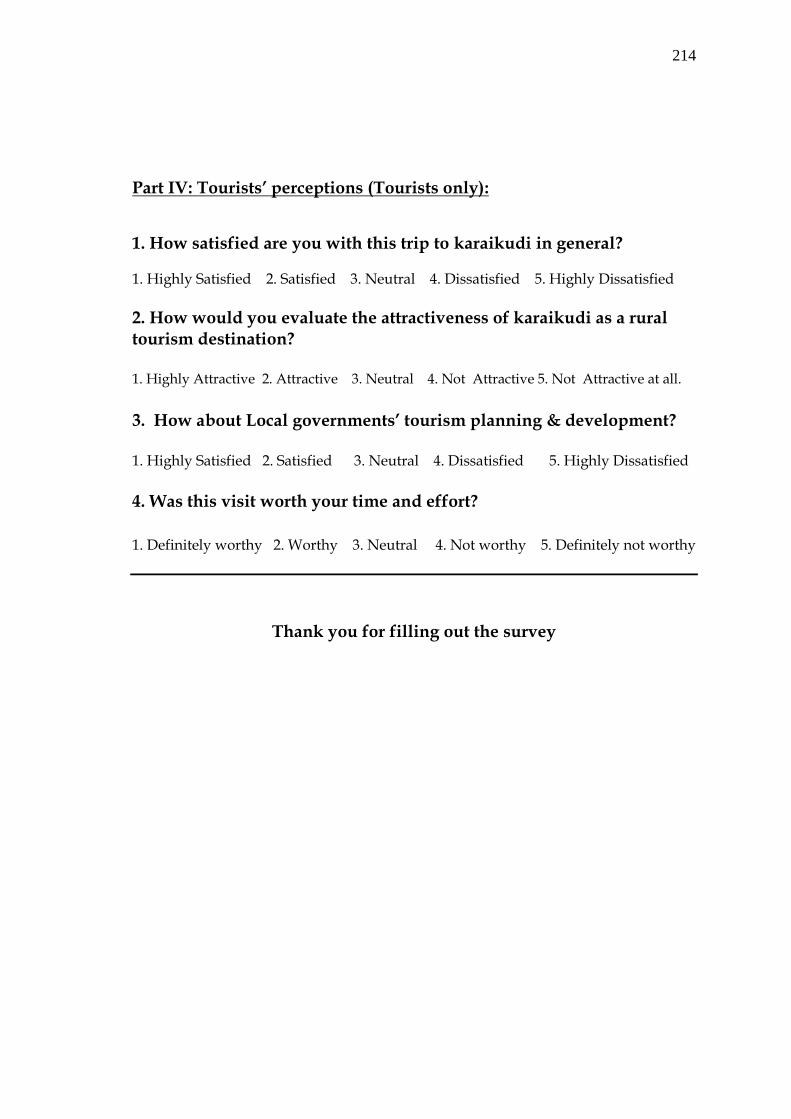
214
Part IV: Tourists’ perceptions (Tourists only):
1. How satisfied are you with this trip to karaikudi in general?
1. Highly Satisfied 2. Satisfied 3. Neutral 4. Dissatisfied 5. Highly Dissatisfied
2. How would you evaluate the attractiveness of karaikudi as a ruraltourism destination?
1. Highly Attractive 2. Attractive 3. Neutral 4. Not Attractive 5. Not Attractive at all.
3. How about Local governments’ tourism planning & development?
1. Highly Satisfied 2. Satisfied 3. Neutral 4. Dissatisfied 5. Highly Dissatisfied
4. Was this visit worth your time and effort?
1. Definitely worthy 2. Worthy 3. Neutral 4. Not worthy 5. Definitely not worthy
Thank you for filling out the survey

215
Appendix- 2
LIST OF RURAL TOURISM SITES IN INDIA
States Sl.No.
Name of the Villages Unique selling proposition
1. Andhra Pradesh 1. Pochampalli, Nalgonda Cotton & Silk Sarees
2. Konaseema Village, East Godavari Eco-tourism (Coastal Development)
3. Puttaparthi, .Anantapur Culture (Spiritual life)
4. Chinchinada, East Godavari Eco-tourism (Coast development)
5. Srikalahasti, Chittoor Kalamkari work
6. Village Etikoppaka, Vishakhapatanam Wood Craft
7. Village Dharmavaram, Anantapur Handlooms & Craft
8. Village Kuchipudi, Krishna Culture & Dance form
9. Village Nirmal, Adilabad Paintings
2.Arunachal Pradesh 10. Village Rengo, East Siang. Culture and Bamboo Cane handicraft
11. Ligu village, Upper Subansiri Culture
12. Village Ego-Nikte. West Siang Culture
13. Village Nampong, Changlang Culture
3. Assam 14. Durgapur, Golaghat Bamboo Craft and Cuisine
15. Dehing-Patakai Kshetra, Tinsukia Culture and Eco- tourism
16. Sualkuchi in Distt. Kamrup Patta and Moga Silk weaving
17. Village Asharikandi, Distt. Dhubri Terracota Craft
4. Bihar 18. Nepura Village, Distt. Nalanda Tusser Silk weaving
5. Chhattisgarh 19. Village Chitrakote, Distt. Bastar Chitrakote Water falls
20. Village Chitrakote, Distt. Bastar Chitrakote Water falls
21. Nagarnar, Distt. Bastar Bell Metal/ Terracota
22. Kondagaon, Distt. Bastar Bell Metal/Terracota
23. Mana-Tuta, Distt. Raipur Adventure Tourism
24. Village Chilpi, Distt.Kabirdham Silk weaving and Baiga tribe cuilture
25. Village Odh, Distt. Raipur Terracotta
6. Delhi 26. Kotla Mubarakpur Historical
27. Nangli, Razapur, Delhi Historical
7. Gujarat 28. Heritage village at Tera Heritage
29. Village Hodka, Distt. Kachchh Mirror work/ Embroidery
30. Navagaon and Malegaon villages, Dang Culture & Eco-tourism
31. Nageshwar, Distt. Jamnagar Mirror Work and Heritage
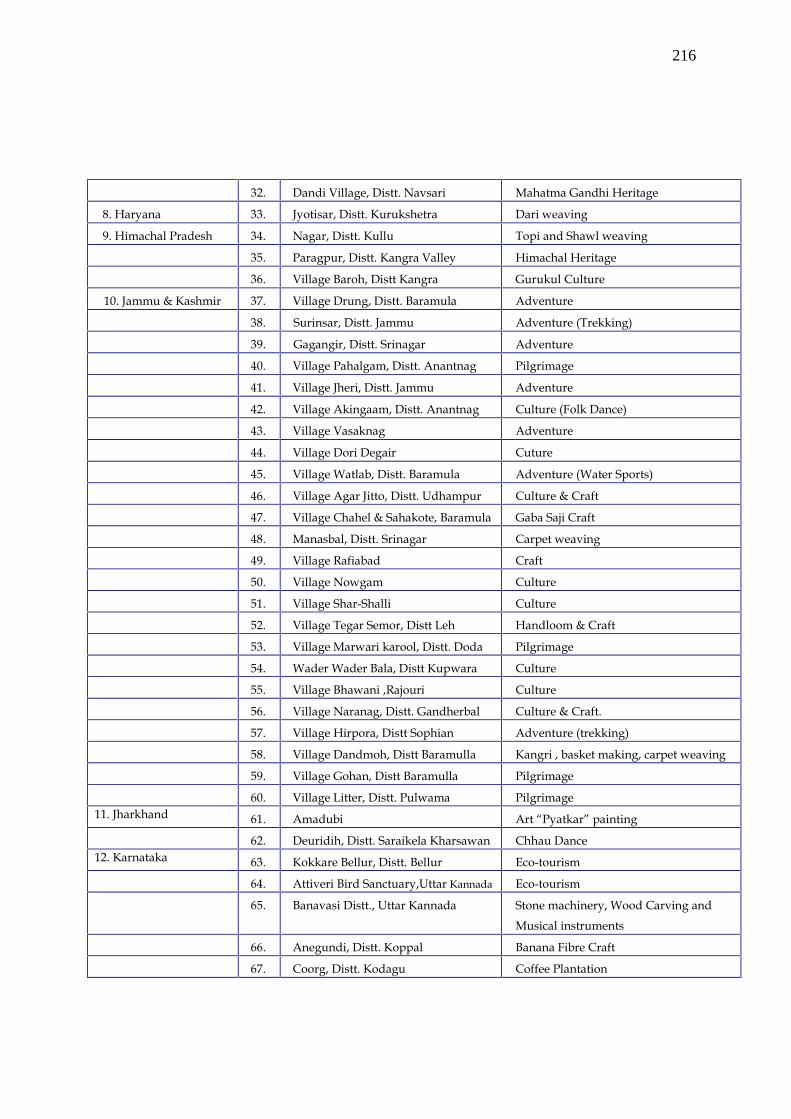
216
32. Dandi Village, Distt. Navsari Mahatma Gandhi Heritage
8. Haryana 33. Jyotisar, Distt. Kurukshetra Dari weaving
9. Himachal Pradesh 34. Nagar, Distt. Kullu Topi and Shawl weaving
35. Paragpur, Distt. Kangra Valley Himachal Heritage
36. Village Baroh, Distt Kangra Gurukul Culture
10. Jammu & Kashmir 37. Village Drung, Distt. Baramula Adventure
38. Surinsar, Distt. Jammu Adventure (Trekking)
39. Gagangir, Distt. Srinagar Adventure
40. Village Pahalgam, Distt. Anantnag Pilgrimage
41. Village Jheri, Distt. Jammu Adventure
42. Village Akingaam, Distt. Anantnag Culture (Folk Dance)
43. Village Vasaknag Adventure
44. Village Dori Degair Cuture
45. Village Watlab, Distt. Baramula Adventure (Water Sports)
46. Village Agar Jitto, Distt. Udhampur Culture & Craft
47. Village Chahel & Sahakote, Baramula Gaba Saji Craft
48. Manasbal, Distt. Srinagar Carpet weaving
49. Village Rafiabad Craft
50. Village Nowgam Culture
51. Village Shar-Shalli Culture
52. Village Tegar Semor, Distt Leh Handloom & Craft
53. Village Marwari karool, Distt. Doda Pilgrimage
54. Wader Wader Bala, Distt Kupwara Culture
55. Village Bhawani ,Rajouri Culture
56. Village Naranag, Distt. Gandherbal Culture & Craft.
57. Village Hirpora, Distt Sophian Adventure (trekking)
58. Village Dandmoh, Distt Baramulla Kangri , basket making, carpet weaving
59. Village Gohan, Distt Baramulla Pilgrimage
60. Village Litter, Distt. Pulwama Pilgrimage11. Jharkhand 61. Amadubi Art “Pyatkar” painting
62. Deuridih, Distt. Saraikela Kharsawan Chhau Dance12. Karnataka 63. Kokkare Bellur, Distt. Bellur Eco-tourism
64. Attiveri Bird Sanctuary,Uttar Kannada Eco-tourism
65. Banavasi Distt., Uttar Kannada Stone machinery, Wood Carving and
Musical instruments
66. Anegundi, Distt. Koppal Banana Fibre Craft
67. Coorg, Distt. Kodagu Coffee Plantation
217
13. Kerala 68. Kumbalangi, Distt. Ernakulam Ethnic Cuisinetraditional boat carpentry
69. Arnamula, Distt. Pathanamthitta Mural Paining
70. Balrampur in Thiruvananthapuram Weaving of traditional sarees
71. Villege Kalady, Distt. Ernakulam Spices Village
72. Village Anakkara, Distt. Idukki Spice Village
73. Village Clappana Fishing
14.Madhya Pradesh 74. Chaugan, Distt. Mandla Lantana Craft
75. Pranpur, Distt. Ashoknagar Chanderi Sarees
76. Orchha, Distt. Tikamgarh Historical and Adventure
77. Amla, Distt. Ujjain Historical
78. Village Devpur, Distt. Vidisha Spiritual heritage
79. Seondha, Distt. Datia Craft on stone and wood
80. Budhni, Distt. Sehore Historical, Spiritual, Craft on Woodwork
15. Maharashtra 81. Sulibhanjan-Khultabad , Aurangabad Sufi tradition and Culture
82. Morachi Chincholi Farming
16. Manipur 83. Khongion, Distt. Thoubal Manipur Dance
84. Village Noney, Distt. Tamenglong Manipur Dance
85. Andro, Distt. East Imphal Bamboo Craft
86. Village Liyai, Distt Senapati Ethnic culture
17. Meghalaya 87. Village lalong, Distt. Jaintia Hills Adventure
88. Village Sasatgre, West Garo Hills Bamboo Craft
89. Village Mawlynnong, East Khasi Hills Eco-tourism
18. Nagaland 90. Mopunchupket, Distt. Mokokchung Shawl weaving
91. Avachekha, Distt. Zunheboto Tribal Culture
92. Changtongia, Distt. Mokokchung Tribal Culture
93. Leshumi, Distt. Phek Tribal Culture & Adventure
94. Thetsumi, Distt. Phek Tribal Culture
95. Kuki Dulong, Distt. Dimapur Tribal Culture
96. Longsa, Distt. Mokokchung Tribal Culture
97. Mitikhru, Distt. Phek Art &, Handloom
98. Chungli Yimti DisttTuensang Historical & Tribal Culture99. Zunheboto Village Craft /Handloom/ Culture100 Shena Old, Village Zunheboto Adventure (trekking and bird-watching)101 Longidang, Wokha Wood craft and carving
19. Orissa 102 Raghurajpur, Distt. Puri Stone Craft and Pattachitra
103 Pipli in Puri Distt. Applique work

218
104 Khiching, Distt. Mayurbhanj Folk Music, Stone Craving
105 Barpali, Distt. Bargarh Sambalpuri sarees
106 Hirapur, Distt. Khurda Historical
107 Padmanavpur, Distt. Ganjam Puppet Dance, Tiger Dance
108 Deuljhari, Distt. Angul, Spiritual
109 Gurukul of Konark Natya Mandap Stone Craft and Gurukul20. Puduchery 110 Village Alankuppam Craft21. Punjab 111 Boothgarh, Distt. Hoshiarpur Glass Work
112 Rajasansi, Distt. Amritsar Carpet weaving
113 Chamkaur, Sahib, Distt. Ropar Spiritual
114 Jainti Majri, Distt. Mohali Woodcraft
115 Village Chhat Phulkari Embroidery
22. Rajasthan 116 Neemrana, Distt. Alwar Historical
117 Samode Village, Distt. Jaipur Lac Work, Pepper painting, Gems stone
painting
118 Haldighati, Distt. Rajsamand, Historical
23. Sikkim 119 Lachen in North Distt. Rugs and Carpet
120 Chumbung, Distt. West Sikkim Eco-tourism (Home stay)
121 Tingchim, Distt. West sikkim Trekking, Bird watching
122 Maniram Bhanjgyang Culture
123 Village Rong Culture
124 Village Jaubari, Distt. South Sikkim Adventure & Eco- tourism
125 Village Tumin, Distt.East Culture
126 Village Srijunga Martam, Distt. West Culture
127 Village Darap, Distt West Sikkim Eco Tourism
128 Village Pastenga Gaucharan, East Sikkim Culture and Ethnic Lifestyle
129 Village Pendam Gadi Budang, East Sikkim Culture
24. Tamil Nadu 130 Kazhugumalai, Distt Thoothukudi Spiritual and Pottery making
131 Theerthamalai, Distt. Dharmapuri Historical
132 Karaikudi, Chettinadu, Distt.Sivaganga
Palm leave baskets, Jewelry,cuisine
133 Devipattinam Navbhashnam in
Ramnathpuram
Stone Carving
134 Thirukurungudi, Distt. Tirunelveli Historical
135 Thiruppudaimaurthur, Tirunelveli Historical
136 Village Kombai., Distt. Theni Spice
137 Thadiyankudissai, Distt. Dindigul, Spice Village
219
138 Village Vedanamalli, Distt.
Kancheepuram
Eco-tourism
25. Tripura 139 Kamlasagar, Distt. West Tripura Historical
140 Jampui Hills, Distt. North Tripura Eco-tourism
141 Durgabari, Distt. West Tripura Tea Gardens
142 Devipur, Distt. West Tripura Farming
143 Malayanagar, Distt. West Tripura Tribal Culture, Eco- tourism
144 Village Banabithi, Dist West Tripura Eco-tourism and tea gardens
145 Village Harijula, Dist South Tripura Eco-tourism
146 Village Kalapania, Distt Sonamara Religious
147 Village Sarsima, Distt Belonia Eco-tourism
148 Village Bagbari, Distt. Sadar Eco - Tourism
26. Uttarakhand 149 Jageshwar, Distt. Almora Spiritual
150 Agora Village (Dodital). Uttar Kashi Eco-tourism
151 Mottad& its satellite station, Uttarakashi Eco-tourism
152 Chekhoni Bora, Distt. Champawat. Adventure
153 Koti, Indroli, Patyur, Distt. Dehradun Eco-tourism
154 Mana, Distt. Chamoli Trekking Adventure
155 Village Sari, Distt. Rudraprayag Eco-tourism
156 Village Adi Kailash, Distt. Nainital Adventure
157 Padmapuri,Distt. Nainital Adventure
158 Nanakmatta, Distt. U.S.Nagar Spiritual
159 Tryuginarayan, Distt. Rudraprayag Spiritual and Adventure
27. Uttar Pradesh 160 Bhitar Gram, Distt. Rae Bareli. Historical Culture
161 Mukhrai, Distt. Mathura Folk Dance
162 Bhaguwala, Distt. Saharanpur Ban Grass Craft
163 Village Barara, Distt. Agra Handicraft
28. West Bengal 164 Ballabhpur Danga, Distt. Birbhum Folk Dance
165 Sonada Village, Distt. Darjeeling Heritage
166 Mukutmonipur, Distt. Bankura Sari weaving
167 Village Antpur, Distt. Hoogly Sari weaving
168 Village Kamarpukur, Distt. Hoogly Spiritual & Craft
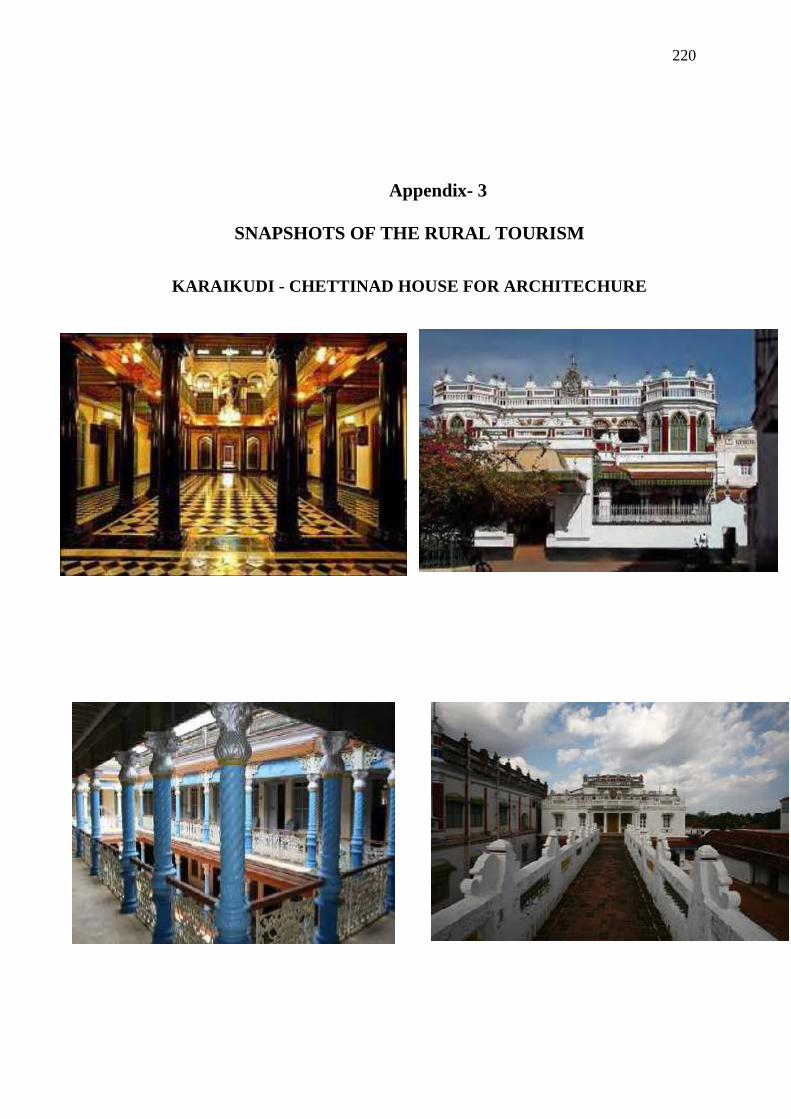
220
Appendix- 3
SNAPSHOTS OF THE RURAL TOURISM
KARAIKUDI - CHETTINAD HOUSE FOR ARCHITECHURE

221
ARTISAN WOODEN WORK IN CHETTINAD
HERITAGE PLACES PALM LEAF PRODUCT

222
KARAIKUDI CUISINE
WOOD CARVING MARRIAGE FUNCTIONS
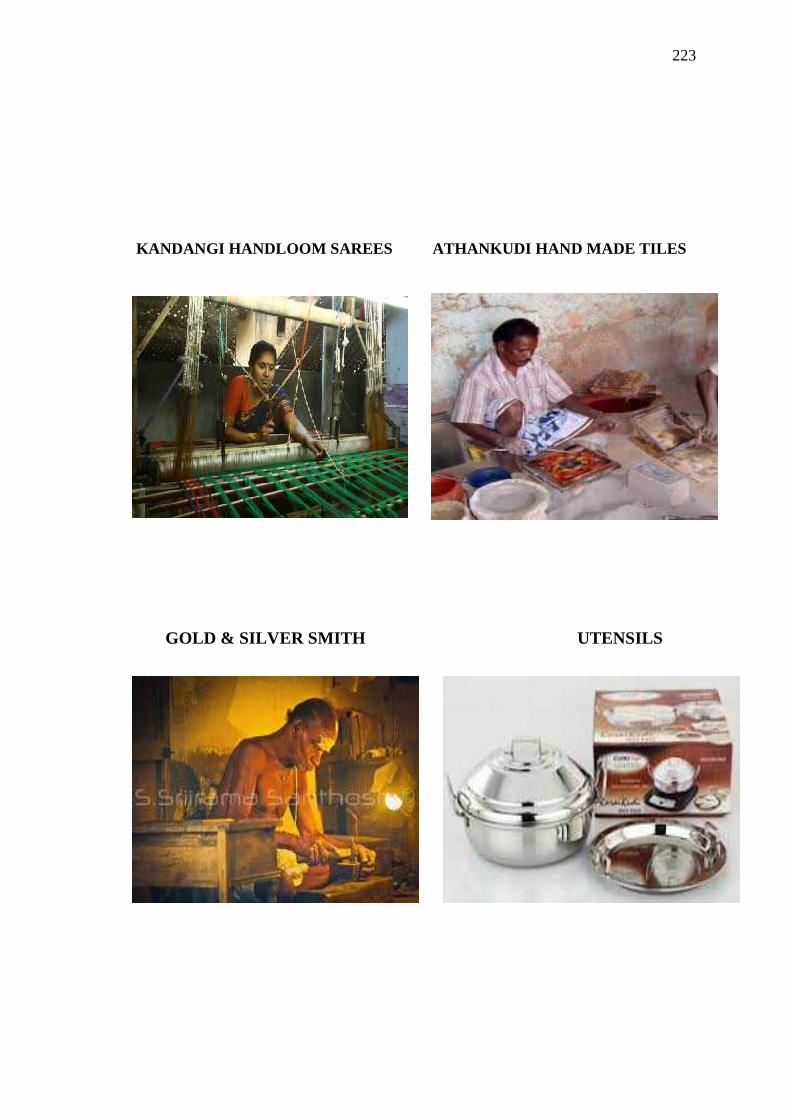
223
KANDANGI HANDLOOM SAREES ATHANKUDI HAND MADE TILES
GOLD & SILVER SMITH UTENSILS
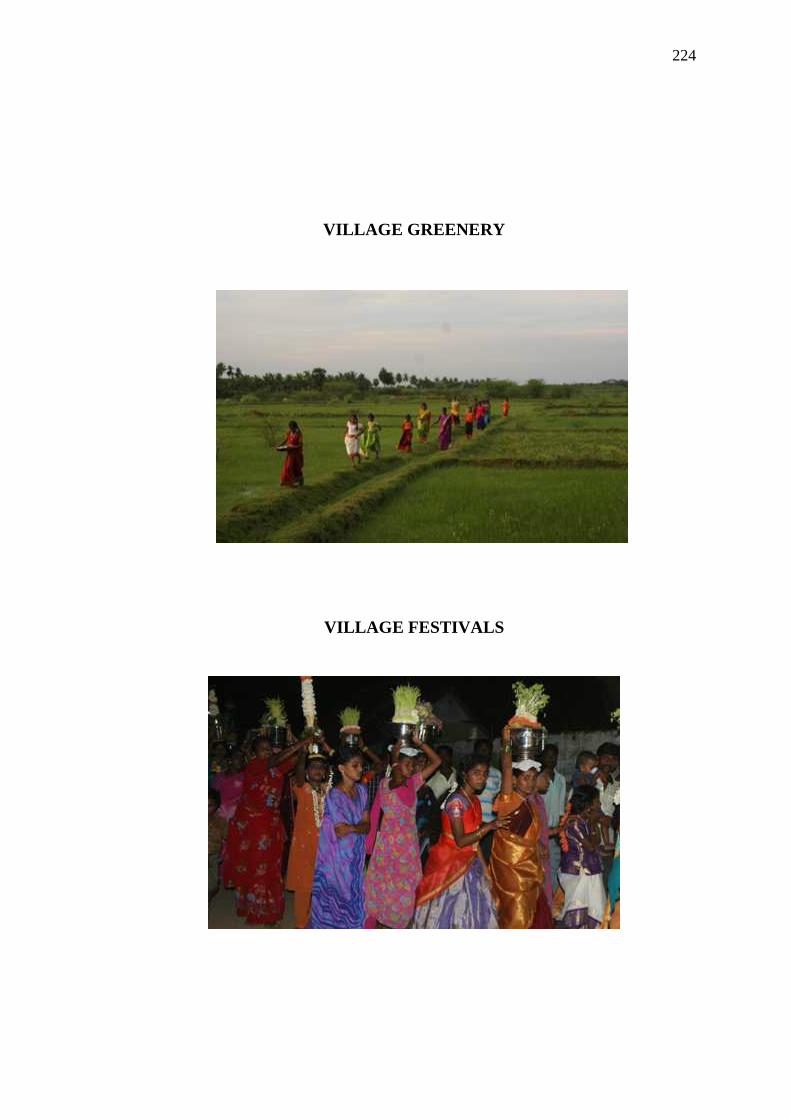
224
VILLAGE GREENERY
VILLAGE FESTIVALS
225
REFERENCES
1. Aas, C., Ladkin, A., & Fletcher, J. (2005), “Stakeholder collaboration andheritage management”, Annals of Tourism Research, 32(1), 28-48.
2. Ahn, B., Lee, B. & Shafer, C.S. (2002), “Operationalising Sustainabilityin Regional Tourism Planning: An Application of the Limits ofAcceptable Change Framework”, Tourism Management, 23: 1-15.
3. Akis, S., Peristianis, N., & Warner, J. (1996), “Residents' attitudes totourism development: The case of Cyprus”, Tourism Management, 17(7),481-494.
4. Allen, L., Long, R., Perdue, R.R. and Kieselbach, S. (1988) “The impactof tourism development on residents’ perceptions of community life”,Journal of Travel Research 27, 16–21.
5. Ap, J. (1992), “Residents’ perceptions on tourism impacts”, Annals ofTourism Research, 19 (4), 665-690.
6. Ap, J. (1990), “Residents’ perceptions research on the social impacts oftourism”, Annals of Tourism Research, 17(4), 610-616.
7. Aref, F., & Marof, R. (2008), “Barriers to Community Participationtoward Tourism Development in Shiraz, Iran. Pakistan”, Journal ofSocial Sciences, 5(9), 936-940.
8. Arnstein & Sherry. R. (1969), “A ladder of Citizen Participation”, Journalof American Institute of Planners, 35, 216-24.
9. Beeton, S. (2006), Community development through tourism. In:Landlink Press, Australia.
10. Blau, P. M. (1968). Interaction: Social Exchange. InternationalEncyclopedia of the Social Science, 7, 452-458. In J. H. Turner (1991).The structure of sociological theory (5th Edition). Chicago: The DorseyPress.
226
11. Bontron, J., & Lasnier, N. (1997), eTourism: A Potential Source of RuralEmployment. In R.D. a. B. Bollman, J.M (Ed.), Rural Employment: AnInternational Perspective (pp. 27-446.). Wallingford: CAB International.
12. Bramwell & B. Lane (eds.), Rural tourism and sustainable ruraldevelopment (pp. 22-40). Clevedon: Channel View Publications.
13. Bramwell, B., & Sharman, A. (1999), “Collaboration in local tourismpolicy-making”, Annals of Tourism Research, 26(2), 392-415
14. Bridges, J. A. (2004), “Corporate issues campaigns: Six theoreticalapproaches”, Communication Theory, 14(1), 51-77.
15. Brown, F. & Hall, D. (2000), Introduction: The paradox of peripherality.In F. Brown & D. Hall (eds.), Tourism in peripheral areas (pp. 1-6).Clevedon: Channel View Publications.
16. Brunt & Courtney, (1999), “Host perceptions of socio cultural impacts”,Annals of Tourism Research, 26(3), 493-515.
17. Buhalis, D. (2000), “Marketing the competitive destination of the future”,Tourism Management, 21, 97-116.
18. Burns, P. M. (2004), “Tourism planning: A third way?”, Annals ofTourism Research, 31(1), 24-43.
19. Butler, R. W. (1999), Tourism – An Evolutionary perspective. In J. G.Nelson, R. W.
20. Butler& G. Wall (Eds.), Tourism and sustainable development:Monitoring, planning, managing, decision making: A civic approach(pp.33-61). Waterloo, Canada: University of Waterloo, Department ofGeography.
21. Butler, R.W., Hall, C.M. Jenkins, J. (eds) (1998), Tourism and Recreationin Rural Areas’, John Wiley & Sons, Toronto.
22. Carroll, A. B. (1991), “The pyramid of corporate social responsibility:Toward the moral management of organizational stakeholders”, BusinessHorizons, 34, 39-48.
227
23. Cawley, M. & Gillmor, D.A. (2007), “Integrated Rural Tourism:Concepts & Practice”, Annals of Tourism Research, Vol. 35, No. 2, pp.316-337.
24. Center, A. H., & Jackson, P. (1995), Public relations practices:Managerial case studies and problems (5th ed.). Englewood Cliffs, NJ:Prentice Hall.
25. Chadwick-Jones, J. K. (1976), Social exchange theory: Its structure andinfluence in social psychology. London, New York, and San Francisco:Academy Press.
26. Chen, J. S. (2000), “An investigation of urban residents' loyalty totourism”, Journal of Hospitality and Tourism Research, 24(1), 21-35.
27. Cheong, S., & Miller, M. (2000), “Power and Tourism. A FoucauldianObservation”, Annals of Tourism Research, 27, 371-390.
28. Choi, H.-S. C., & Sirakaya, E. (2005), “Measuring residents’ attitudetoward sustainable tourism: Development of sustainable tourism attitudescale”, Journal of Travel Research, 43(May), 380-394.
29. Clarkson, M. B. E. (1995). A stakeholder framework for analyzing andevaluating corporate social performance. Academy of ManagementReview, 20(1), 92-117.
30. Cook, K. (1982), “Guidelines for Socially Appropriate TourismDevelopment in British Columbia”, Journal of Travel Research, 21, 22-28.
31. Crouch, G. I. & Ritchie, J. R. B. (1999), “Tourism, competitiveness, andsocietal prosperity”, Journal of Business Research, 44, 137-152.
32. Davis, D. R., Allan, J., & Cosenza, R. M. (1988, “Segmenting localresidents by their attitudes, interests, and opinions toward tourists”,Journal of Travel Research, 27(2), 2-8.
33. Day, G. (2006), Community and everyday life (The New Sociology).Routledge Press: Oxford, UK
228
34. Din, K. H. (1993), Dialogue with the hosts: an educational strategytowards sustainable tourism. In Hitchcock, M., King, V. T. & Parnwell,M. J. G. (Eds.) Tourism in South-East Asia. London, Routledge.
35. Din, K. H. (1997), Indigenization of Tourism Development: SomeConstraints and Possibilities. In Oppermann, M. (Ed.) Pacific RimTourism. Wallingford.
36. Dinham, A. (2005), “Empowered or Over-empowered? The RealExperience of Local Participation in UK’s New Deals for Communities”,Community Development Journal, 40, 301-312.
37. Dredge, D. (2006), “Policy Networks and the Local Organizations ofTourism”, Tourism Management, 27, 269-280.
38. Dogan, H. Z. (1989), “Forms of adjustment: Sociocultural impacts oftourism”, Annals of Tourism Research, 16(2), 216-236.
39. Donaldson, T., & Preston, L. E. (1995), “The stakeholder theory of thecorporation: Concepts, evidence, and implications”, Academy ofManagement Review, 20(1), 65-91.
40. Dowling, R. K. (1993), “Tourism planning, people and the environment inWestern Australia”, Journal of Travel Research, 3(4), 52-58.
41. Duk-Byeong Park, Yoo-Shik Yoon (2001), “Tourism development”,International Journal of Tourism Research, Volume 13, Issue 5,September 2011, Pages 401-415.
42. Engel, D., & Herbage, L. (1993), “Tourism development: An economicstimulus in the heart of America”, Business America, 114(24), 69-75.
43. Farace, R. V., Monge, P. R., & Russell, H. M. (1977), Communicatingand organizing. Reading, MA: Addison-Wesley.
44. Fakeye, P., & Crompton, J, (1991), “mage differences betweenprospective, first-time, and repeat visitors to the Lower Rio GrandeValley”, Journal of Travel Research, 30(2), 10-16.
229
45. Fleischer, A. & Falsenstein, D. (2000), “Support for Rural Tourism- Doesit Make a difference”, Annals of Tourism Research, Vol. 27, Issue. 4, pp.1007-1024.
46. Formica, S. (2000), Destination attractiveness as a function of supply anddemand interaction. Doctoral dissertation, Virginia Polytechnic Instituteand State University, Blacksburg.
47. Frederick, Martha, (1992), Tourism as a Rural Economic DevelopmentTool: An Exploration of the Literature’, Bibliographies and Literature ofAgriculture, Number 122. U.S. Department of Agriculture, EconomicResearch Service, August.
48. Friedman, Douglas. (1984), The State and Underdevelopment in SpanishAmerica: The Political Roots of Dependency in Peru and Argentina.Boulder, CO; London: Westview.
49. Fyall, A, & Garrod, B. (2004). From competition to collaboration in thetourism industry, Annals of Tourism Research, Vol. 29, Issue 4, pp 102-109.
50. Garcia-Ramon, M. D. et al. (1995), “Farm tourism, gender and theenvironment in Spain”, Annals of Tourism Research, (22) 2, p. 267-282
51. Garcia Henche, B., (2003), Marketing del turismo rural. Madrid, Spain,Piramide.
52. Gannon, A. (1994), Rural tourism as a factor in rural communityeconomic development for economies in transition. In B. Bramwell & B.Bernard (eds.) Rural tourism and sustainable rural development (pp. 51-60). Clevedon: Channel View Publications.
53. Getz, D. (1994), “Residents' attitudes toward tourism: A longitudinalstudy in Spey Valley, Scotland”, Tourism Management, 15(4), 247-258.
54. Goodrich, J. (1978), “The relationship between preferences for andperceptions of vacation destinations: Application of a choice model”,Journal of Travel Research, 17(2), 8-13.
230
55. Glicken, J. (2000), “Getting stakeholder participation ‘right’: A discussionof participatory processes and possible pitfalls”, Environmental Science &Policy, 3, 305-310.
56. Greffe, X. (1994), Is rural tourism a lever for economic and socialdevelopment? In B.
57. Garcia-Ramon, M. D. et al. (1995), “Farm tourism, gender and theenvironment in Spain”, Annals of Tourism Research, (22) 2, p. 267-282.
58. Gunn, C. A. (1994), Tourism planning: Basics, concepts, cases (3rd ed.).New York: Taylor and Francis.
59. Gunn, C. A. (1988). Tourism planning. New York: Taylor & Francis.
60. Hall D., Brown F., (1998), Tourism in peripheral areas. Channel View,Clevedon
61. Hall D (2004), “Rural tourism development in southeastern Europe:transition and the search for sustainability”, International Journal ofTourism Research, 6-16.
62. Hall, C. M. (1992), “Tourism in Antarctica: Activities, impacts, andmanagement”, Journal of Travel Research, 30(4), 2-9
63. Hall, C. M. (2000), Tourism planning: Policies, processes andrelationships. Harlow:Prentice-Hall.
64. Hardy, A.L. & Beeton, R.J.S. (2001), “Sustainable tourism ormaintainable tourism: Managing resources for more than averageoutcomes”, Journal of Sustainable Tourism, 9(3), 168-192.
65. Harrill, R. (2004) Residents’ attitudes toward tourism development: Aliterature review with implications for tourism planning. Journal ofPlanning Literature 18 (3), 251–266.
66. Harrill, R. and Potts, T.D. (2003), “Tourism planning in historic districts:Attitudes toward tourism development in Charleston”, Journal of theAmerican Planning Association 69 (3), 233–44.
231
67. Hassan, S. S. (2000), “Determinants of market competitiveness in anenvironmentally sustainable tourism industry”, Journal of TravelResearch, 38 (February), 239-245.
68. Haywood, K.M. (1988), “Responsible and Responsive Tourism Planningin the community”, Tourism Management, 9, 105-118.
69. Heath, E. (2003), “Towards a model to enhance destinationcompetitiveness: A Southern African perspective”, Journal of Hospitalityand Tourism Management, 10(2), 124-141.
70. Houee, P, (1989), Les politiques de development rural, Paris, FranceINRA, Economica.
71. Hilgartner, S., & Bosk, L. C. (2003), “The rise and fall of social problems:A public arenas model”, American Journal of Sociology, 94, 53-78.
72. Hill, C. W. L. (2001), International business: Competing in the globalmarketplace (3rd ed.).Boston, Mass: Irwin/McGraw.
73. Hillery, G. (1995), “Definitions of community: areas of agreement”, RuralSociology, 20, 111-132.
74. Homans, G. C. (1991), Exchange behaviorism. In J. H. Turner (5thEdition). The structure of sociological theory (pp. 303-327). Chicago: TheDorsey Press.
75. Hummelbrunner, R. and E. Migelbauer (1994), “Tourism promotion andpotential in peripheral areas: the Austrian case”, Journal of SustainableTourism, (2) 1/2, p. 41-45.
76. Inkeep, E. (1991), Tourism planning: An integrated and sustainabledevelopment approach. New York: Van Nostrand Reinhold.
77. Ioannides, D. (2001). Sustainable development and the shifting attitudesof tourism stakeholders: Toward a dynamic framework. In S. F. McCool& R. N. Moisey (Eds.), Tourism, recreation and sustainability: Linkingculture and the environment (pp.55-76). New York: CABI Publishing.
232
78. Jafari, J. et al. (1990), “A socio cultural study of tourism as a factor ofchange”, Annals of Tourism Research, (17), p. 469-473
79. Jamal, T. B. & Getz, D. (2000),“Community roundtables for tourism-related conflicts: The dialectics of consensus and process structures”,Journal of Sustainable Tourism, 7 (3/4), 290-313.
80. Jones, A. (1987), “Green tourism”, Tourism Management, (26), 354-356.
81. Jones, T. M. (1995), “Instrumental stakeholder theory: A synthesis ofethics and economics”, The Academy of Management Review, 20(2),404-438.
82. Joppe, M. (1996), “Sustainable community tourism developmentrevisited”, Tourism Management, (17) 7, p. 475-479.
83. Jurowski, C., Uysal, M., & Williams, D. R. (1997), “A theoreticalanalysis of host community resident reactions to tourism”, Journal ofTravel Research, 36(2), 3-11.
84. Jurowski, C. and Gursoy, D. (2003), “Distance effects on residents’attitudes toward tourism”, Annals of Tourism Research 31 (2), 296–312.
85. Kadt, E. (1979), “Social planning for tourism in the developingcountries”, Annals of Tourism Research, 6(1), 36-48.
86. Krippendorf, J. (1987), The holidaymakers: Understanding the impact ofleisure and travel (V. Andrassy, Trans.). Sydney: Butterworth-HeinemannLtd.
87. Lane, B. (1994), What is rural tourism? In B. Bramwell & B. Lane (eds.),Rural tourism and sustainable rural development (pp. 7-21). Clevedon:Channel View Publications.
88. Lankford, S. V. (1994), “Attitudes and perceptions toward tourism andrural regional development”, Journal of Travel Research, 31(3), 35-43.

233
89. Leiper, N. (1979), “The framework of tourism: Towards a definition oftourism, tourist, and the tourist industry”, Annals of Tourism Research, 6(4), 390-407.
90. Leiper, N. (1990), “Tourist attraction system”, Annals of TourismResearch, 17, 367-384.
91. Levi-Strauss, C. (1969), The elementary structure of kinship. Boston:Boston Press.
92. Leiper, N. (1979), “The framework of tourism: Towards a definition oftourism, tourist, and the tourist industry”, Annals of Tourism Research, 6(4), 390-407.
93. Lindberg, K., & Johnson, R. L. (1997), “Modeling resident’s attitudetoward tourism”, Annals of Tourism Research, 24(2), 402-424
94. Liu, A. (2006), “Tourism in rural areas: Kedah, Malaysia”, TourismManagement, 27, 878-889.
95. Long, P. T., Perdue, R. R., & Allen, L. (1990), “Rural resident tourismperceptions and attitudes by community level of tourism”, Journal ofTravel Research, 28(3), 3-9.
96. Liu, J. C., Sheldon, P., & Var, T. (1987), “Resident perceptions of theenvironmental impact of tourism”, Annals of Tourism Research, 14,17-37.
97. Lindberg, K., & Johnson, R. L. (1997), “Modeling residents’ attitudetoward tourism”, Annals of Tourism Research, 24(2), 402-424.
98. Liu, J. C, (1988), “Touristic attractiveness of Hawaii by county”,Occasional paper, Tourism Research Publications No 10, University ofHawaii at Manoa.
99. Lundberg, D. E. (1990), The tourist business (6th ed.). New York: VanNostrand Reinhold.
100. MacDonald, R. & Jolliffe, L. (2003), “Cultural rural tourism: Evidencefrom Canada”, Annals of Tourism Research, 30(2), 307-322.
234
101. Mac Nulty, P., (2002), Conclusions. Proceedings from WTO Seminaron Rural Tourism in Europe: Experiences and perspectives, Belgrade,Yugoslavia, June, 2002.
102. Mardrigal, R. (1993), “A tale of tourism in two cities”, Annals ofTourism Research, 20, 336-353.
103. Mary Cawley, Desmond A. Gillmor (2008), “Integrated rural tourism.Concepts and Practice”, Annals of Tourism Research Volume 35, Issue 2,pp. 316-337.
104. McCool, S. F., & Martin, S. R. (1994), “Community attachment andattitudes toward tourism development”, Journal of Travel Research, 22(3),29-34.
105. McIntosh, R., & Goeldner, C. (1986), Tourism: Principles, Practices andPhilosophies, 5th edition, Wiley, New York.
106. McIntosh, R. W., & Goeldner, C. R. (1990), Tourism principles,practices, philosophies. New York, NY: Wiley.
107. Mihalik, B. (1992), “Tourism impacts related to EC 92: A look ahead”,Journal of Travel Research, 31 (2), 27-34.
108. Milman, A., & Pizam, A. (1988), “Social impacts of tourism on centralFlorida”, Annals of Tourism Research, 15(2), 191-204.
109. Milman, A., & Pizam, A. (1995), “The role or awareness and familiaritywith a destination”, Journal of Travel Research, 33(3), 21-31.
110. Mill, R. C., & Morrison, A. M. (1985), The tourism system: Anintroductory. Engelwood Cliffs, N.J.: Prentice Hall.
111. Mohd Saad, A. (1998), Public participation and community design intourism development: Case studies and implications for a model oftourism development in Langkawi, Malaysia. Master thesis, Iowa StateUniversity, USA.
112. Multimedia Technology, ICMT 2011; Hangzhou; 26 July 2011 through28 July 2011; Category number CFP1153K-ART; Code 86512.
235
113. Murphy, P. E. (1983), “Perceptions and attitudes of decision-makinggroups in tourism centers”, Journal of Travel Research, 21(3), 8-12.
114. Murphy, P. E. (1985), Tourism: A community approach. New York:Routledge.
115. Nasi, J., Nasi, S., Phillips, N., & Zyglidopoulos, S. (1997), „Theevolution of corporate social responsiveness: An exploratory study ofFinnish and Canadian forestry companies” , Business & Society, 36, 296-321.
116. Negrusa, A. L., Cosma, S. A., & Bota, M, (2007), “Romanian ruraltourism development a case study: rural tourism in Maramures”International Journal of Business Research, July.25-38
117. Oppermann, M. (1996), “Rural tourism in southern Germany”, Annalsof Tourism Research. 23(1), 86-102
118. Opperman, M. (1997), Rural tourism in southern Germany: Farm andrural tourism operators’, In S. Page & D. Getz (Eds.), ‘The business ofrural tourism (pp. 108-118). London: International Thomson BusinessPress.
119. Pearce, D. (1995), Tourism Today: A geographical analysis, the secondedition, London: Longman Scientific & Technical.
120. Perales, R.M.Y. (2002), “Rural Tourism in Spain”, Annals of TourismResearch, Vol. 29, No. 4, 1101-1110.
121. Perdue, R. R., Long. P. T., & Allen, L. (1987), “Rural resident tourismperceptions and attitudes”, Annals of Tourism Research, 14, 420-429.
122. Perdue, R. R., Long, P. T., & Allen, L. (1990), “Resident support fortourism development”, Annals of Tourism Research, 17, 586-599
123. Piali Haldar (2007), “Rural Tourism – Challenges and Opportunities”International Marketing Conference on Marketing & Society, 8-10 April,2007, IIMK 129
236
124. Pike, S. (2004), Destination marketing organisations, Advances inTourism Research, Elsevier.
125. Pizam, A. (1978), “Tourism’s impacts: The social costs of thedestination community as perceived by its residents”, Journal of TravelResearch 16 (4), 8–12.
126. Post, J. E., Preston, L. E., & Sachs, S. (2002), Redefining thecorporation: Stakeholder management and organizational wealth.Stanford, CA: Stanford University Press.
127. Reed, M.G. (1997), “Power relations and community-based tourismplanning”, Annals of Tourism Research, 3 (24), p. 566-591
128. Reichel, A., Lowengart, O., & Milman, A. (2000), “Rural tourism inIsrael: service quality and orientation”, Tourism Management, 21, 451-459.
129. Roy A.Cook, laura J.Yale, Joseph J. Marqua. Tourism, The Business ofTravel. Pearson education, Inc. 2007, Third edition.
130. Ribeiro, M. & Marques, C. (2002), “Rural tourism and the developmentof less favoured areas-between rhetoric and practice”, InternationalJournal of Tourism Research, 4, 211-220.
131. Ritchie, J. R. B. (1993), “Crafting a destination vision: Putting theconcept of resident- responsive tourism into practice”, TourismManagement, 14(5), 379-389.
132. Ritchie, J. B. B., & Crouch, G. I. (2000), “The competitivenessdestination: A sustainability perspective”, Tourism Management, 21, 1-7.
133. Sarjit S Gill.(2009). Rural Tourism Development through RuralCooperatives. Nature and Science, 7(10), pp.68-72
134. Riege, A. M., & Perry, C. (2000), “National marketing strategies ininternational travel and tourism”, European Journal of Marketing,34(11/12), 1290-1304.
135. Ryan, C. (2002), “Equity, management, power sharing and sustainability– issues of the ‘new tourism”, Tourism Management, 23(1), 17-26.

237
136. Scheyvens, R. (2002), Tourism for development: Empoweringcommunities. Harlow, England. Reading, Mass.: Prentice Hall.
137. Saarinen J, kask T (2008), “Transforming tourism spaces in changingsocio-political contexts: the case of parnu, Estonia, as a touristdestination”, Tourism Geogr. 10(4).
138. Sautter, E. T., & Leisen, B. (1999), Managing stakeholders a TourismPlanning Model”, Annals of Tourism Research, 26(2), 312-328.
139. Saxena, G., Clark, G., Oliver, T. & Ilberry, B. (2007), “ConceptualizingIntegrated Rural Tourism”, Tourism Geographies, Vol. 9, I. 4, pp. 347-370.
140. Sharpley, R. & Roberts, L. (2004), “Rural tourism- 10 years on”,International Journal of Tourism Research, 6, 119-124.
141. Sharpley, R. (2000), “Rural Tourism and the Challenge of TourismDiversification: The Case of Cyprus”, Tourism Management, 23, 233-244.
142. Singh, S., Timothy, D. J., & Dowling, R. K. (Eds.). (2003), Tourism indestination communities. Cambridge, USA: CABI publishing.
143. Sirakaya, E., Jamal, T., & Choi, H. S. (2001), Developing tourismindicators for destination sustainability. In D. B. Weaver (Ed.), Theencyclopedia of ecotourism, 411–432, New York, NY: CABInternational.
144. Snepenger, D. J., & Johnson, J. D. (1991), “Political self-identificationand the perception of economics, social and environmental impacts oftourism”, Annals of Tourism Research, 18,511-514.
145. Tatoglu, E., Erdal, F., Ozgur, H., & Azakli, S. (2000). Residentperception of the impacts of tourism in a Turkish resort town. Available:http://www.opf.slu.cz/vvr/akce/turecko/pdf/Tatoglu.pdf(January 25,2009).
146. Taylor & Francis.Getz, D., & Timur, S. (2004), “Stakeholderinvolvement in sustainable tourism: Balancing the voices”, TourismManagement 7,45-56.
238
147. Telfer, D.J. & Sharpley, R. (2008), Tourism and development in thedeveloping world. London: Routledge.
148. W. F. Theobald (Ed.), Global tourism (3rd ed., pp.230-247). London:Elsevier Inc.
149. Theodori, G. (2005), “Community and community development inresource-based areas: Operational definitions rooted in an interactionalperspective”, Society and Natural Resources 18, 661–669.
150. Timothy, D. J. (1999), “Participatory planning: A view of tourism inIndonesia”, Annals of Tourism Research, 26 (3), 371-391.
151. Turner, J. H. (1986), The structure of sociological theory (3rd Edition).Chicago: The Dorsey Press.
152. Twining-Ward, L. & Butler, R. (2002), “Implementing STD on a SmallIsland: Development and Use of Sustainable Tourism DevelopmentIndicators in Samoa”, Journal of Sustainable Tourism, 10(5): 363-387.
153. Tyrrell, T. and Spaulding, P. (1984), “A survey of attitudes towardtourism growth in Rhode Island”, Hospitality Education and ResearchJournal 8 (2), 22–33.
154. Van der Ploeg, J.D., Renting, H., Brunori, G., Knickel, K., Mannion, J.,Marsden, T., de Roest, K., Sevilla-Guzmán, E. & Ventura, F. (2000),„Rural Development: From Practices & Policies towards Theory”,Sociological Ruralis, Vol. 40, I, 4, pp. 391-408.
155. Vargane Csoban Katalin, December (2010), The Rural developmentaspects of sustainable tourism as seen through the example of the northgreat plains region of Hungary, Vargane Csoban Katalin, December 2010.
156. Wood, R. E. (1980), “International tourism and cultural change inSoutheast Asia”, Economic Development and Research, 21,253-265.
157. Woodside, A., & Lysonki, S. (1989), “A general model of travelerdestination choice”, Journal of Travel Research, 27, 8-14.
239
158. Wilkinson, K. P. (1991), Community in Rural America. Middleton:Social Ecology Press.
159. Wilson, S. Fesenmaier, D. Fesenmaier, J. & Van Es, J. (2001), Factorsfor Success in Rural Tourism Development”, Journal of Travel Research,Vol. 40(2), 132-138.
160. Witt, S. F., & Moutinho, L. (1994), Tourism Marketing andManagement Handbook (2nd ed.). New York: Prentice Hall.
161. Yeing, T., & Zhou. Y (2007), “Community, Governments and ExternalCapitals in China’s Rural Cultural Tourism: A comparative study of twoAdjacent Villages”, Tourism Management, 28, 96-107.
162. Yuksel, F., Bramwell, B., & Yuksel, A. (1999), “Stakeholder interviewsand tourism planning at Pamukkale, Turkey”, Tourism Management,20(3), 351-360.
163. Yoon, Y., Gursoy, D., & Chen, J. (2000), “Validating a tourismdevelopment theory with structural equation modeling”, TourismManagement, 22(4), 363-372.
164. Yooshik Yoon et al.(2001), “Validating a tourism development theorywith structural equation modeling”, Tourism Management 22, 363 -372.
Websites:
www.tourism.gov.in
www.incredibleindia.org
www.tamiltourism.org

240
LIST OF PUBLICATIONS
PUBLICATIONS IN NATIONAL AND INTERNATIONAL JOURNALS
1. Yavana Rani.S and M.Jeyakumaran “Community participation in decisionmaking of Rural Tourism”, Prabandhan: Indian Journal ofManagement, Listed in EBSCO Database, Vol 3, No 3, March2010,.ISSN: 0975-2854, pp 32-36.
2. Yavana Rani.S and M.Jeyakumaran “An Empirical Study on StakeholdersSupport for Rural Tourism-A Case of Karaikudi, Tamilnadu, India”, AsiaPacific Journal of Research in Business Management, Listed inPROQUEST, Volume 2, Issue 7 (July, 2011), ISSN 2229-4104.
3. Yavana Rani.S and M.Jeyakumaran “An Empirical Study on ResidentsAttitude and Support for Rural Tourism Development-A case ofKaraikudi, Tamilnadu, India” Indian Streams Research Journal ImpactFactor: 0.2105, ISSN No: 2230-7850Vol II Issue XI Dec 2012.
4. Yavana Rani.S and M.Jeyakumaran “A Structural Model of Stakeholders’Attitude For Rural Tourism Development” accepted for publication inAPJIHT, Malaysian Journal.
PAPER PRESENTED IN INTERNATIONAL CONFERENCE
1. Yavana Rani.S and M.Jeyakumaran “A Structural Model OfStakeholders’ Attitude For Rural Tourism Development”, 4th Asia EuroConference 2012 in Tourism, Hospitality and Gastronomy’ TAYLOR’SUNIVERSITY, MALAYSIA, Nov 28-Dec-1, 2012.
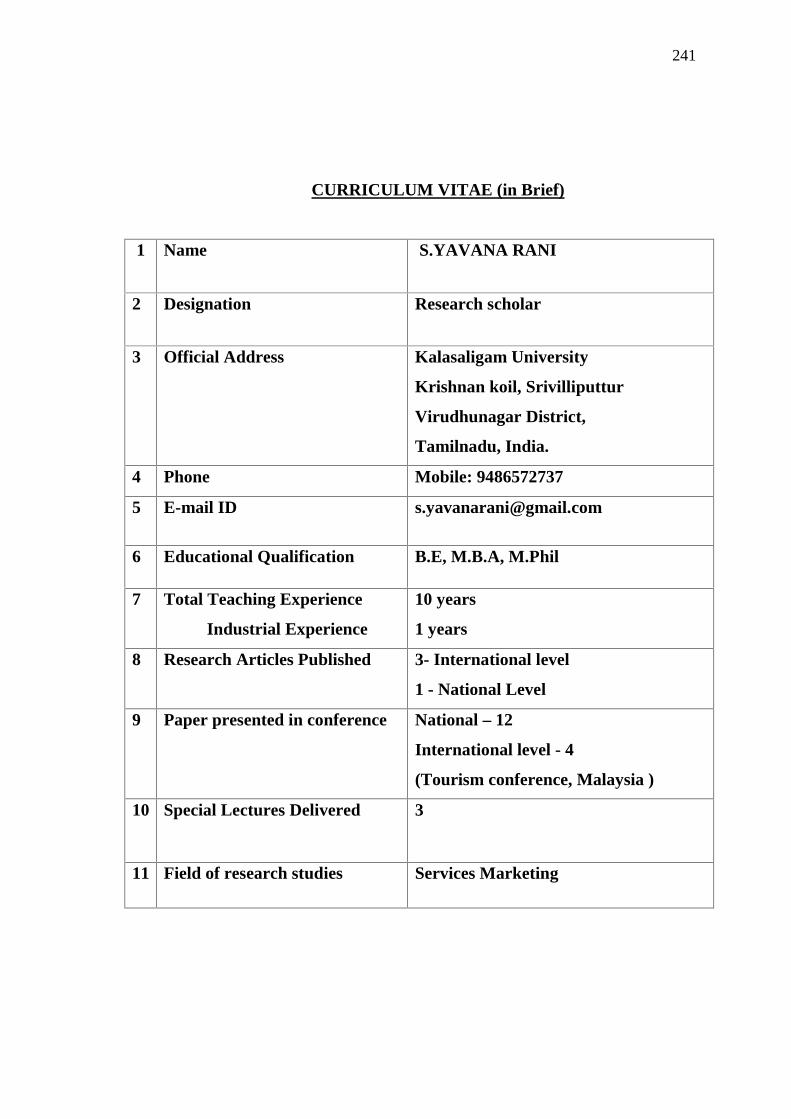
241
CURRICULUM VITAE (in Brief)
1 Name S.YAVANA RANI
2 Designation Research scholar
3 Official Address Kalasaligam University
Krishnan koil, Srivilliputtur
Virudhunagar District,
Tamilnadu, India.
4 Phone Mobile: 9486572737
5 E-mail ID [email protected]
6 Educational Qualification B.E, M.B.A, M.Phil
7 Total Teaching Experience
Industrial Experience
10 years
1 years
8 Research Articles Published 3- International level
1 - National Level
9 Paper presented in conference National – 12
International level - 4
(Tourism conference, Malaysia )
10 Special Lectures Delivered 3
11 Field of research studies Services Marketing