Embed Size (px)
Citation preview
Stakeholders’ Education | Corporate Governance Research | Corporate Governance Score | Proxy Advisory
STAKEHOLDERS EMPOWERMENT SERVICES
1 | P A G E
SECTOR: STEEL REPORTING DATE: 5TH DECEMBER, 2017
STEEL AUTHORITY OF INDIA LTD. www.sail.co.in
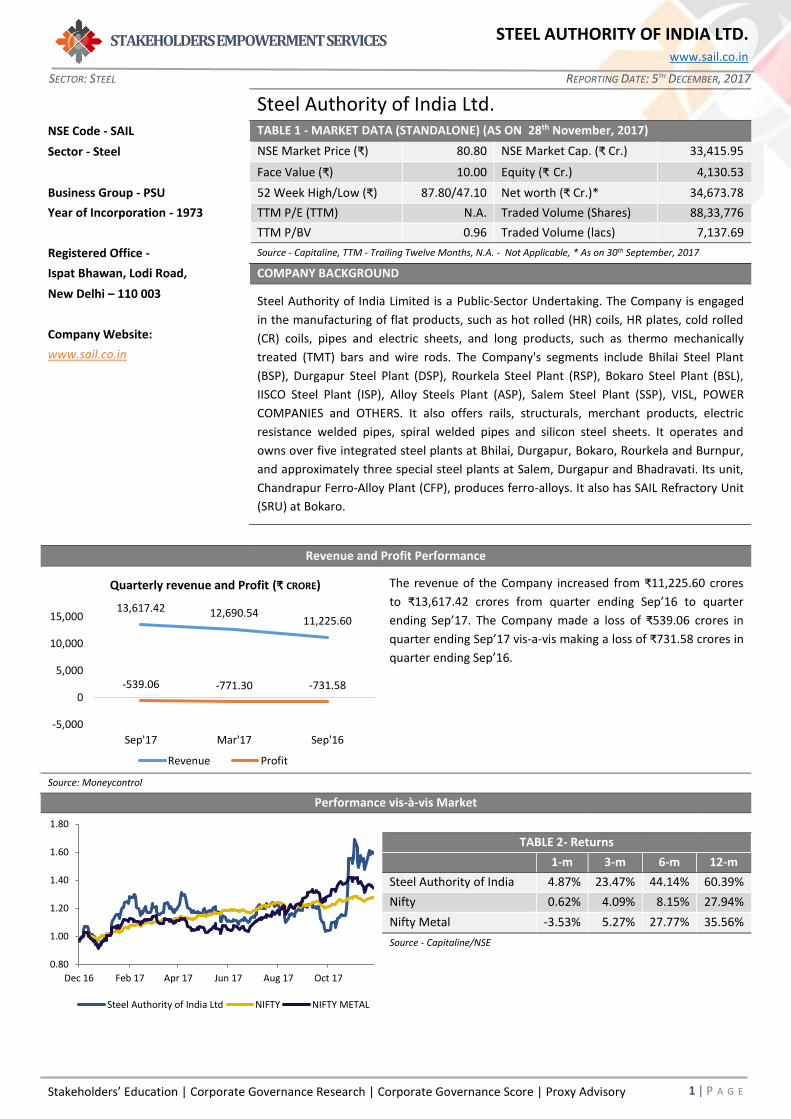
Steel Authority of India Ltd. NSE Code - SAIL TABLE 1 - MARKET DATA (STANDALONE) (AS ON 28th November, 2017)
Sector - Steel NSE Market Price (₹) 80.80 NSE Market Cap. (₹ Cr.) 33,415.95
Face Value (₹) 10.00 Equity (₹ Cr.) 4,130.53
Business Group - PSU 52 Week High/Low (₹) 87.80/47.10 Net worth (₹ Cr.)* 34,673.78
Year of Incorporation - 1973 TTM P/E (TTM) N.A. Traded Volume (Shares) 88,33,776
TTM P/BV 0.96 Traded Volume (lacs) 7,137.69
Registered Office - Source - Capitaline, TTM - Trailing Twelve Months, N.A. - Not Applicable, * As on 30th September, 2017
Ispat Bhawan, Lodi Road, COMPANY BACKGROUND
New Delhi – 110 003 Steel Authority of India Limited is a Public-Sector Undertaking. The Company is engaged
in the manufacturing of flat products, such as hot rolled (HR) coils, HR plates, cold rolled
(CR) coils, pipes and electric sheets, and long products, such as thermo mechanically
treated (TMT) bars and wire rods. The Company's segments include Bhilai Steel Plant
(BSP), Durgapur Steel Plant (DSP), Rourkela Steel Plant (RSP), Bokaro Steel Plant (BSL),
IISCO Steel Plant (ISP), Alloy Steels Plant (ASP), Salem Steel Plant (SSP), VISL, POWER
COMPANIES and OTHERS. It also offers rails, structurals, merchant products, electric
resistance welded pipes, spiral welded pipes and silicon steel sheets. It operates and
owns over five integrated steel plants at Bhilai, Durgapur, Bokaro, Rourkela and Burnpur,
and approximately three special steel plants at Salem, Durgapur and Bhadravati. Its unit,
Chandrapur Ferro-Alloy Plant (CFP), produces ferro-alloys. It also has SAIL Refractory Unit
(SRU) at Bokaro.
Company Website:
www.sail.co.in
Revenue and Profit Performance
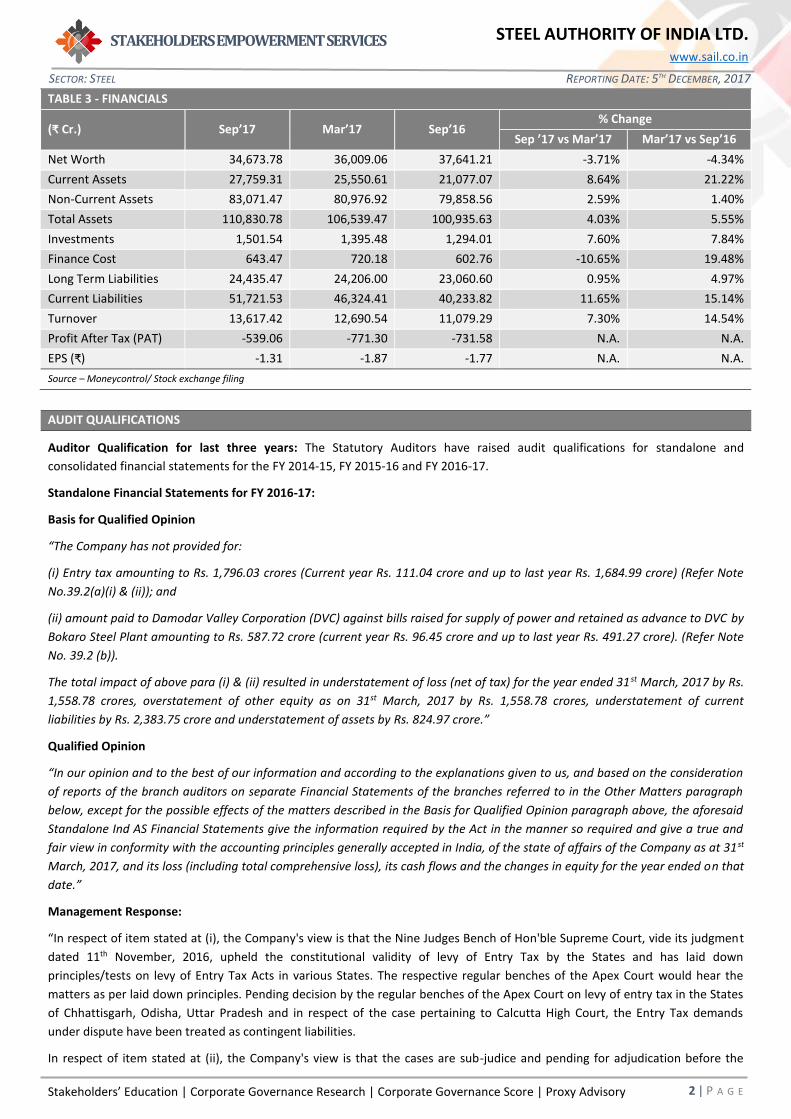
The revenue of the Company increased from ₹11,225.60 crores
to ₹13,617.42 crores from quarter ending Sep’16 to quarter
ending Sep’17. The Company made a loss of ₹539.06 crores in
quarter ending Sep’17 vis-a-vis making a loss of ₹731.58 crores in
quarter ending Sep’16.
Source: Moneycontrol
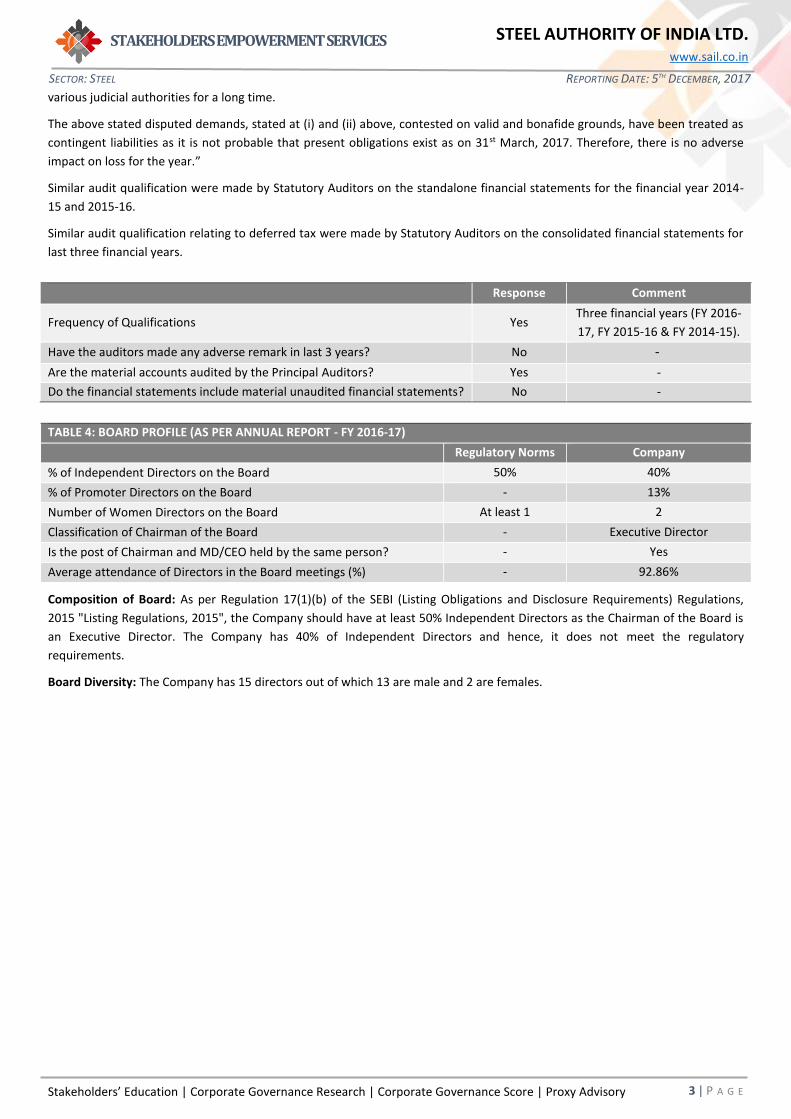
Performance vis-à-vis Market
TABLE 2- Returns
1-m 3-m 6-m 12-m
Steel Authority of India 4.87% 23.47% 44.14% 60.39%
Nifty 0.62% 4.09% 8.15% 27.94%
Nifty Metal -3.53% 5.27% 27.77% 35.56%
Source - Capitaline/NSE
0.80
1.00
1.20
1.40
1.60
1.80
Dec 16 Feb 17 Apr 17 Jun 17 Aug 17 Oct 17
Steel Authority of India Ltd NIFTY NIFTY METAL
13,617.42 12,690.5411,225.60
-539.06 -771.30 -731.58
-5,000
0
5,000
10,000
15,000
Sep'17 Mar'17 Sep'16
Quarterly revenue and Profit (₹ CRORE)
Revenue Profit
Stakeholders’ Education | Corporate Governance Research | Corporate Governance Score | Proxy Advisory
STAKEHOLDERS EMPOWERMENT SERVICES
2 | P A G E
SECTOR: STEEL REPORTING DATE: 5TH DECEMBER, 2017
STEEL AUTHORITY OF INDIA LTD. www.sail.co.in
TABLE 3 - FINANCIALS
(₹ Cr.) Sep’17 Mar’17 Sep’16 % Change
Sep ’17 vs Mar’17 Mar’17 vs Sep’16
Net Worth 34,673.78 36,009.06 37,641.21 -3.71% -4.34%
Current Assets 27,759.31 25,550.61 21,077.07 8.64% 21.22%
Non-Current Assets 83,071.47 80,976.92 79,858.56 2.59% 1.40%
Total Assets 110,830.78 106,539.47 100,935.63 4.03% 5.55%
Investments 1,501.54 1,395.48 1,294.01 7.60% 7.84%
Finance Cost 643.47 720.18 602.76 -10.65% 19.48%
Long Term Liabilities 24,435.47 24,206.00 23,060.60 0.95% 4.97%
Current Liabilities 51,721.53 46,324.41 40,233.82 11.65% 15.14%
Turnover 13,617.42 12,690.54 11,079.29 7.30% 14.54%
Profit After Tax (PAT) -539.06 -771.30 -731.58 N.A. N.A.
EPS (₹) -1.31 -1.87 -1.77 N.A. N.A.
Source – Moneycontrol/ Stock exchange filing
AUDIT QUALIFICATIONS
Auditor Qualification for last three years: The Statutory Auditors have raised audit qualifications for standalone and
consolidated financial statements for the FY 2014-15, FY 2015-16 and FY 2016-17.
Standalone Financial Statements for FY 2016-17:
Basis for Qualified Opinion
“The Company has not provided for:
(i) Entry tax amounting to Rs. 1,796.03 crores (Current year Rs. 111.04 crore and up to last year Rs. 1,684.99 crore) (Refer Note
No.39.2(a)(i) & (ii)); and
(ii) amount paid to Damodar Valley Corporation (DVC) against bills raised for supply of power and retained as advance to DVC by
Bokaro Steel Plant amounting to Rs. 587.72 crore (current year Rs. 96.45 crore and up to last year Rs. 491.27 crore). (Refer Note
No. 39.2 (b)).
The total impact of above para (i) & (ii) resulted in understatement of loss (net of tax) for the year ended 31st March, 2017 by Rs.
1,558.78 crores, overstatement of other equity as on 31st March, 2017 by Rs. 1,558.78 crores, understatement of current
liabilities by Rs. 2,383.75 crore and understatement of assets by Rs. 824.97 crore.”
Qualified Opinion
“In our opinion and to the best of our information and according to the explanations given to us, and based on the consideration
of reports of the branch auditors on separate Financial Statements of the branches referred to in the Other Matters paragraph
below, except for the possible effects of the matters described in the Basis for Qualified Opinion paragraph above, the aforesaid
Standalone Ind AS Financial Statements give the information required by the Act in the manner so required and give a true and
fair view in conformity with the accounting principles generally accepted in India, of the state of affairs of the Company as at 31st
March, 2017, and its loss (including total comprehensive loss), its cash flows and the changes in equity for the year ended on that
date.”
Management Response:
“In respect of item stated at (i), the Company's view is that the Nine Judges Bench of Hon'ble Supreme Court, vide its judgment
dated 11th November, 2016, upheld the constitutional validity of levy of Entry Tax by the States and has laid down
principles/tests on levy of Entry Tax Acts in various States. The respective regular benches of the Apex Court would hear the
matters as per laid down principles. Pending decision by the regular benches of the Apex Court on levy of entry tax in the States
of Chhattisgarh, Odisha, Uttar Pradesh and in respect of the case pertaining to Calcutta High Court, the Entry Tax demands
under dispute have been treated as contingent liabilities.
In respect of item stated at (ii), the Company's view is that the cases are sub-judice and pending for adjudication before the
Stakeholders’ Education | Corporate Governance Research | Corporate Governance Score | Proxy Advisory
STAKEHOLDERS EMPOWERMENT SERVICES
3 | P A G E
SECTOR: STEEL REPORTING DATE: 5TH DECEMBER, 2017
STEEL AUTHORITY OF INDIA LTD. www.sail.co.in
various judicial authorities for a long time.
The above stated disputed demands, stated at (i) and (ii) above, contested on valid and bonafide grounds, have been treated as
contingent liabilities as it is not probable that present obligations exist as on 31st March, 2017. Therefore, there is no adverse
impact on loss for the year.”
Similar audit qualification were made by Statutory Auditors on the standalone financial statements for the financial year 2014-
15 and 2015-16.
Similar audit qualification relating to deferred tax were made by Statutory Auditors on the consolidated financial statements for
last three financial years.
Response Comment
Frequency of Qualifications Yes Three financial years (FY 2016-
17, FY 2015-16 & FY 2014-15).
Have the auditors made any adverse remark in last 3 years? No -
Are the material accounts audited by the Principal Auditors? Yes -
Do the financial statements include material unaudited financial statements? No -
TABLE 4: BOARD PROFILE (AS PER ANNUAL REPORT - FY 2016-17)
Regulatory Norms Company
% of Independent Directors on the Board 50% 40%
% of Promoter Directors on the Board - 13%
Number of Women Directors on the Board At least 1 2
Classification of Chairman of the Board - Executive Director
Is the post of Chairman and MD/CEO held by the same person? - Yes
Average attendance of Directors in the Board meetings (%) - 92.86%
Composition of Board: As per Regulation 17(1)(b) of the SEBI (Listing Obligations and Disclosure Requirements) Regulations,
2015 "Listing Regulations, 2015", the Company should have at least 50% Independent Directors as the Chairman of the Board is
an Executive Director. The Company has 40% of Independent Directors and hence, it does not meet the regulatory
requirements.
Board Diversity: The Company has 15 directors out of which 13 are male and 2 are females.
Stakeholders’ Education | Corporate Governance Research | Corporate Governance Score | Proxy Advisory
STAKEHOLDERS EMPOWERMENT SERVICES
4 | P A G E
SECTOR: STEEL REPORTING DATE: 5TH DECEMBER, 2017
STEEL AUTHORITY OF INDIA LTD. www.sail.co.in
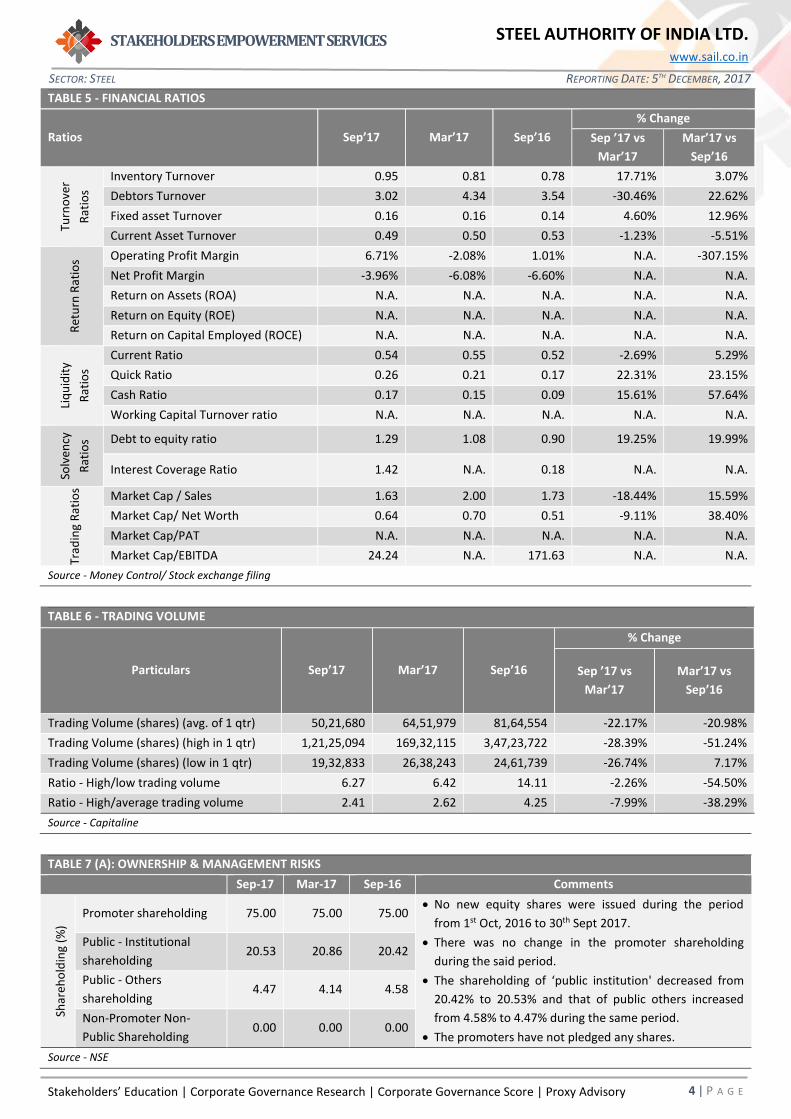
TABLE 5 - FINANCIAL RATIOS
Ratios Sep’17 Mar’17 Sep’16
% Change
Sep ’17 vs
Mar’17
Mar’17 vs
Sep’16
Turn
ove
r
Rat
ios
Inventory Turnover 0.95 0.81 0.78 17.71% 3.07%
Debtors Turnover 3.02 4.34 3.54 -30.46% 22.62%
Fixed asset Turnover 0.16 0.16 0.14 4.60% 12.96%
Current Asset Turnover 0.49 0.50 0.53 -1.23% -5.51%
Ret
urn
Rat
ios Operating Profit Margin 6.71% -2.08% 1.01% N.A. -307.15%
Net Profit Margin -3.96% -6.08% -6.60% N.A. N.A.
Return on Assets (ROA) N.A. N.A. N.A. N.A. N.A.
Return on Equity (ROE) N.A. N.A. N.A. N.A. N.A.
Return on Capital Employed (ROCE) N.A. N.A. N.A. N.A. N.A.
Liq
uid
ity
Rat
ios
Current Ratio 0.54 0.55 0.52 -2.69% 5.29%
Quick Ratio 0.26 0.21 0.17 22.31% 23.15%
Cash Ratio 0.17 0.15 0.09 15.61% 57.64%
Working Capital Turnover ratio N.A. N.A. N.A. N.A. N.A.
Solv
ency
Rat
ios Debt to equity ratio 1.29 1.08 0.90 19.25% 19.99%
Interest Coverage Ratio 1.42 N.A. 0.18 N.A. N.A.
Trad
ing
Rat
ios
Market Cap / Sales 1.63 2.00 1.73 -18.44% 15.59%
Market Cap/ Net Worth 0.64 0.70 0.51 -9.11% 38.40%
Market Cap/PAT N.A. N.A. N.A. N.A. N.A.
Market Cap/EBITDA 24.24 N.A. 171.63 N.A. N.A.
Source - Money Control/ Stock exchange filing
TABLE 6 - TRADING VOLUME
Particulars Sep’17 Mar’17 Sep’16
% Change
Sep ’17 vs
Mar’17
Mar’17 vs
Sep’16
Trading Volume (shares) (avg. of 1 qtr) 50,21,680 64,51,979 81,64,554 -22.17% -20.98%
Trading Volume (shares) (high in 1 qtr) 1,21,25,094 169,32,115 3,47,23,722 -28.39% -51.24%
Trading Volume (shares) (low in 1 qtr) 19,32,833 26,38,243 24,61,739 -26.74% 7.17%
Ratio - High/low trading volume 6.27 6.42 14.11 -2.26% -54.50%
Ratio - High/average trading volume 2.41 2.62 4.25 -7.99% -38.29%
Source - Capitaline
TABLE 7 (A): OWNERSHIP & MANAGEMENT RISKS
Sep-17 Mar-17 Sep-16 Comments
Shar
eho
ldin
g (%
)
Promoter shareholding 75.00 75.00 75.00 • No new equity shares were issued during the period
from 1st Oct, 2016 to 30th Sept 2017.
• There was no change in the promoter shareholding
during the said period.
• The shareholding of ‘public institution' decreased from
20.42% to 20.53% and that of public others increased
from 4.58% to 4.47% during the same period.
• The promoters have not pledged any shares.
Public - Institutional
shareholding 20.53 20.86 20.42
Public - Others
shareholding 4.47 4.14 4.58
Non-Promoter Non-
Public Shareholding 0.00 0.00 0.00
Source - NSE
Stakeholders’ Education | Corporate Governance Research | Corporate Governance Score | Proxy Advisory
STAKEHOLDERS EMPOWERMENT SERVICES
5 | P A G E
SECTOR: STEEL REPORTING DATE: 5TH DECEMBER, 2017
STEEL AUTHORITY OF INDIA LTD. www.sail.co.in
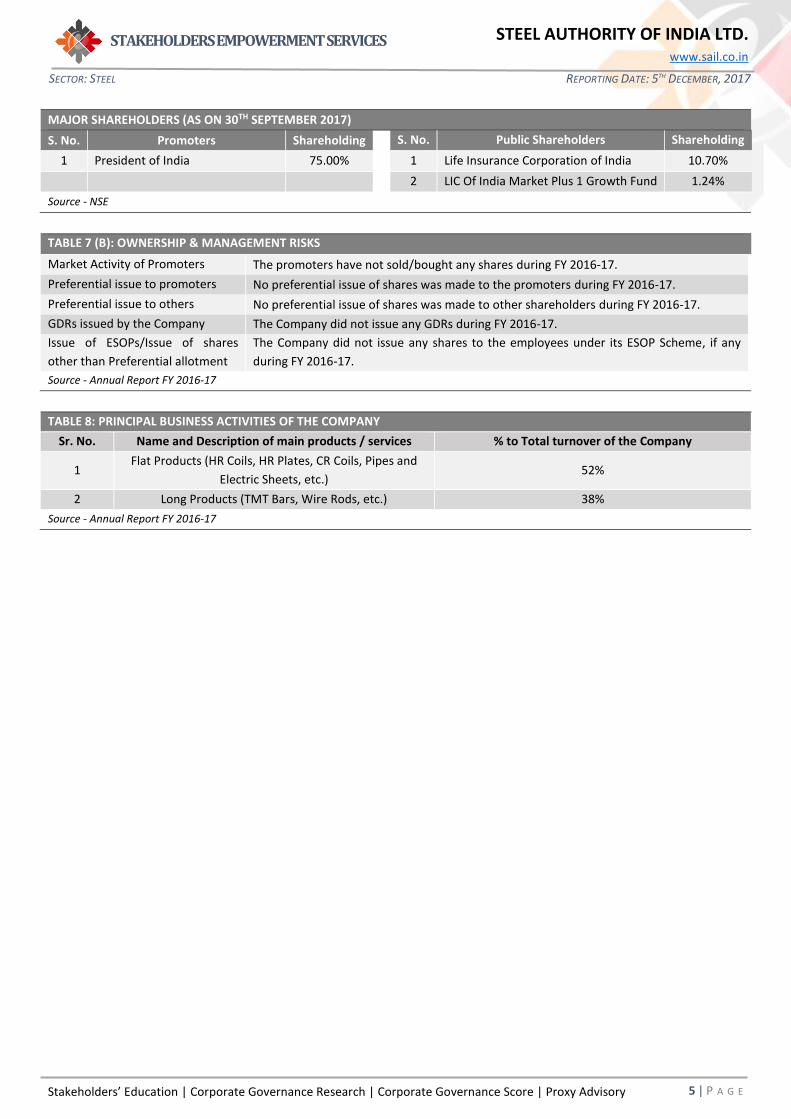
MAJOR SHAREHOLDERS (AS ON 30TH SEPTEMBER 2017)
S. No. Promoters Shareholding S. No. Public Shareholders Shareholding
1 President of India 75.00% 1 Life Insurance Corporation of India 10.70%
2 LIC Of India Market Plus 1 Growth Fund 1.24%
Source - NSE
TABLE 7 (B): OWNERSHIP & MANAGEMENT RISKS
Market Activity of Promoters The promoters have not sold/bought any shares during FY 2016-17.
Preferential issue to promoters No preferential issue of shares was made to the promoters during FY 2016-17.
Preferential issue to others No preferential issue of shares was made to other shareholders during FY 2016-17.
GDRs issued by the Company The Company did not issue any GDRs during FY 2016-17.
Issue of ESOPs/Issue of shares
other than Preferential allotment
The Company did not issue any shares to the employees under its ESOP Scheme, if any
during FY 2016-17.
Source - Annual Report FY 2016-17
TABLE 8: PRINCIPAL BUSINESS ACTIVITIES OF THE COMPANY
Sr. No. Name and Description of main products / services % to Total turnover of the Company
1 Flat Products (HR Coils, HR Plates, CR Coils, Pipes and
Electric Sheets, etc.) 52%
2 Long Products (TMT Bars, Wire Rods, etc.) 38%
Source - Annual Report FY 2016-17
Stakeholders’ Education | Corporate Governance Research | Corporate Governance Score | Proxy Advisory
STAKEHOLDERS EMPOWERMENT SERVICES
6 | P A G E
SECTOR: STEEL REPORTING DATE: 5TH DECEMBER, 2017
STEEL AUTHORITY OF INDIA LTD. www.sail.co.in
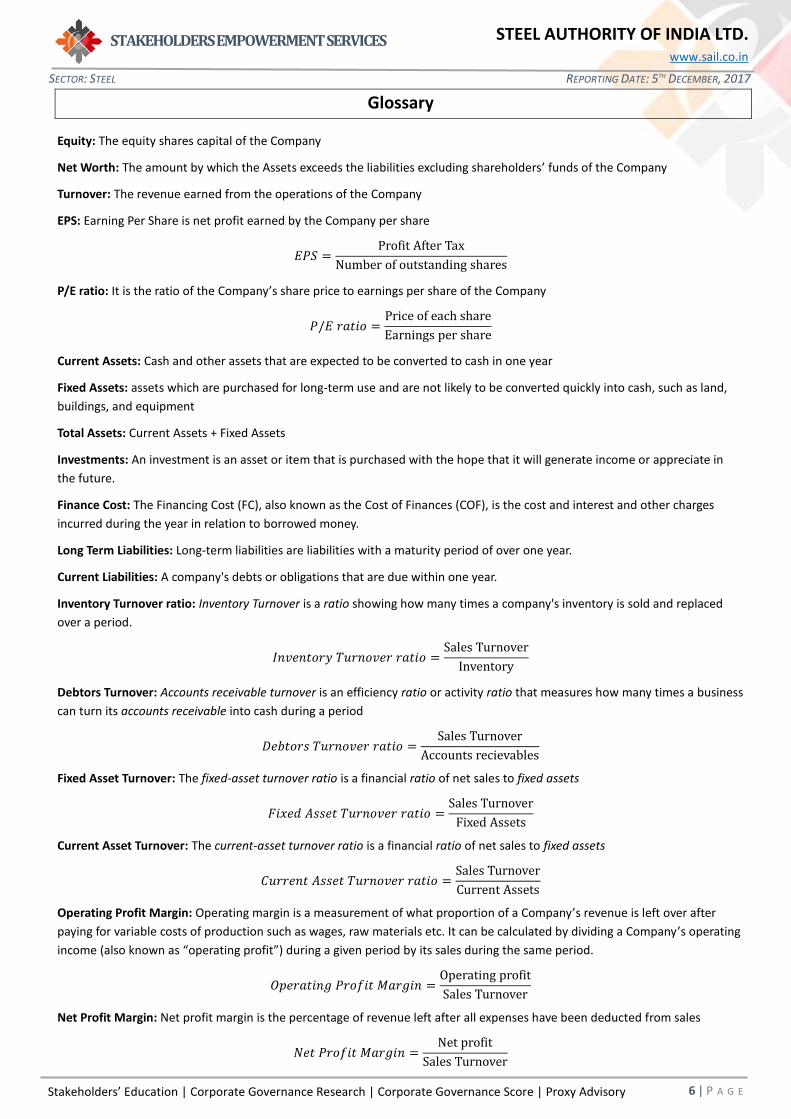
Glossary
Equity: The equity shares capital of the Company
Net Worth: The amount by which the Assets exceeds the liabilities excluding shareholders’ funds of the Company
Turnover: The revenue earned from the operations of the Company
EPS: Earning Per Share is net profit earned by the Company per share
𝐸𝑃𝑆 =Profit After Tax
Number of outstanding shares
P/E ratio: It is the ratio of the Company’s share price to earnings per share of the Company
𝑃/𝐸 𝑟𝑎𝑡𝑖𝑜 =Price of each share
Earnings per share
Current Assets: Cash and other assets that are expected to be converted to cash in one year
Fixed Assets: assets which are purchased for long-term use and are not likely to be converted quickly into cash, such as land,
buildings, and equipment
Total Assets: Current Assets + Fixed Assets
Investments: An investment is an asset or item that is purchased with the hope that it will generate income or appreciate in
the future.
Finance Cost: The Financing Cost (FC), also known as the Cost of Finances (COF), is the cost and interest and other charges
incurred during the year in relation to borrowed money.
Long Term Liabilities: Long-term liabilities are liabilities with a maturity period of over one year.
Current Liabilities: A company's debts or obligations that are due within one year.
Inventory Turnover ratio: Inventory Turnover is a ratio showing how many times a company's inventory is sold and replaced
over a period.
𝐼𝑛𝑣𝑒𝑛𝑡𝑜𝑟𝑦 𝑇𝑢𝑟𝑛𝑜𝑣𝑒𝑟 𝑟𝑎𝑡𝑖𝑜 =Sales Turnover
Inventory
Debtors Turnover: Accounts receivable turnover is an efficiency ratio or activity ratio that measures how many times a business
can turn its accounts receivable into cash during a period
𝐷𝑒𝑏𝑡𝑜𝑟𝑠 𝑇𝑢𝑟𝑛𝑜𝑣𝑒𝑟 𝑟𝑎𝑡𝑖𝑜 =Sales Turnover
Accounts recievables
Fixed Asset Turnover: The fixed-asset turnover ratio is a financial ratio of net sales to fixed assets
𝐹𝑖𝑥𝑒𝑑 𝐴𝑠𝑠𝑒𝑡 𝑇𝑢𝑟𝑛𝑜𝑣𝑒𝑟 𝑟𝑎𝑡𝑖𝑜 =Sales Turnover
Fixed Assets
Current Asset Turnover: The current-asset turnover ratio is a financial ratio of net sales to fixed assets
𝐶𝑢𝑟𝑟𝑒𝑛𝑡 𝐴𝑠𝑠𝑒𝑡 𝑇𝑢𝑟𝑛𝑜𝑣𝑒𝑟 𝑟𝑎𝑡𝑖𝑜 =Sales Turnover
Current Assets
Operating Profit Margin: Operating margin is a measurement of what proportion of a Company’s revenue is left over after
paying for variable costs of production such as wages, raw materials etc. It can be calculated by dividing a Company’s operating
income (also known as “operating profit”) during a given period by its sales during the same period.
𝑂𝑝𝑒𝑟𝑎𝑡𝑖𝑛𝑔 𝑃𝑟𝑜𝑓𝑖𝑡 𝑀𝑎𝑟𝑔𝑖𝑛 =Operating profit
Sales Turnover
Net Profit Margin: Net profit margin is the percentage of revenue left after all expenses have been deducted from sales
𝑁𝑒𝑡 𝑃𝑟𝑜𝑓𝑖𝑡 𝑀𝑎𝑟𝑔𝑖𝑛 =Net profit
Sales Turnover
Stakeholders’ Education | Corporate Governance Research | Corporate Governance Score | Proxy Advisory
STAKEHOLDERS EMPOWERMENT SERVICES
7 | P A G E
SECTOR: STEEL REPORTING DATE: 5TH DECEMBER, 2017
STEEL AUTHORITY OF INDIA LTD. www.sail.co.in
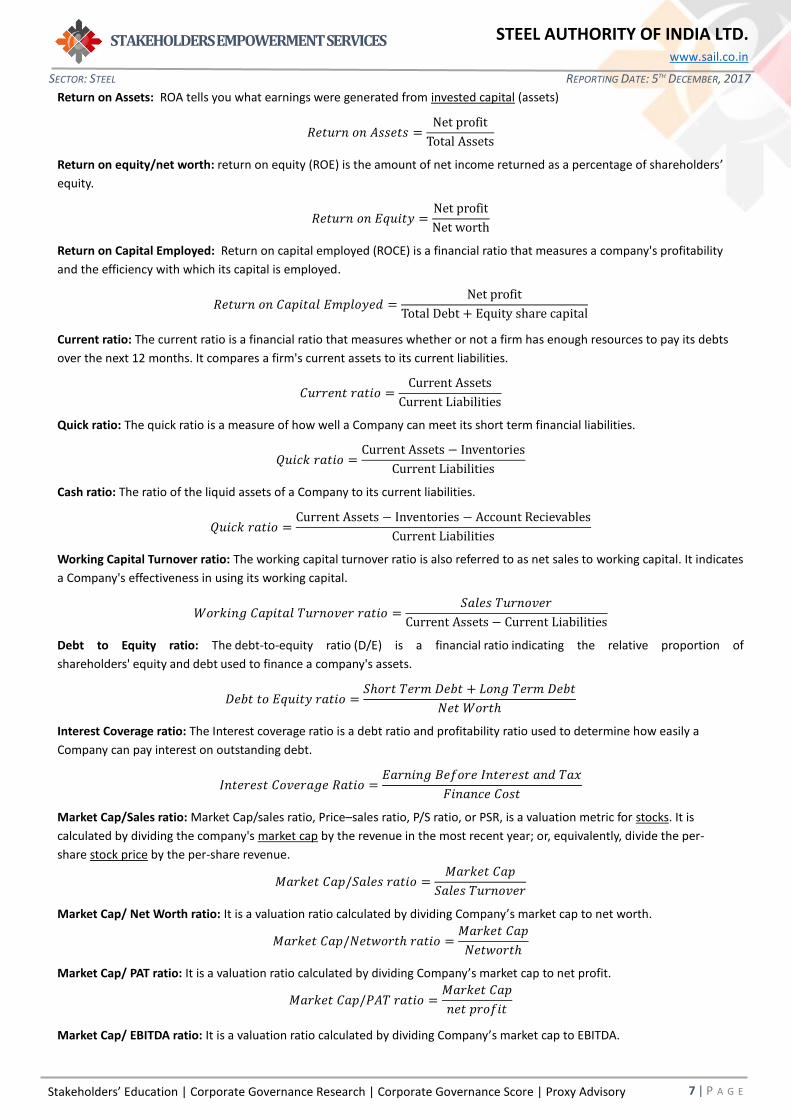
Return on Assets: ROA tells you what earnings were generated from invested capital (assets)
𝑅𝑒𝑡𝑢𝑟𝑛 𝑜𝑛 𝐴𝑠𝑠𝑒𝑡𝑠 =Net profit
Total Assets
Return on equity/net worth: return on equity (ROE) is the amount of net income returned as a percentage of shareholders’
equity.
𝑅𝑒𝑡𝑢𝑟𝑛 𝑜𝑛 𝐸𝑞𝑢𝑖𝑡𝑦 =Net profit
Net worth
Return on Capital Employed: Return on capital employed (ROCE) is a financial ratio that measures a company's profitability
and the efficiency with which its capital is employed.
𝑅𝑒𝑡𝑢𝑟𝑛 𝑜𝑛 𝐶𝑎𝑝𝑖𝑡𝑎𝑙 𝐸𝑚𝑝𝑙𝑜𝑦𝑒𝑑 =Net profit
Total Debt + Equity share capital
Current ratio: The current ratio is a financial ratio that measures whether or not a firm has enough resources to pay its debts
over the next 12 months. It compares a firm's current assets to its current liabilities.
𝐶𝑢𝑟𝑟𝑒𝑛𝑡 𝑟𝑎𝑡𝑖𝑜 =Current Assets
Current Liabilities
Quick ratio: The quick ratio is a measure of how well a Company can meet its short term financial liabilities.
𝑄𝑢𝑖𝑐𝑘 𝑟𝑎𝑡𝑖𝑜 =Current Assets − Inventories
Current Liabilities
Cash ratio: The ratio of the liquid assets of a Company to its current liabilities.
𝑄𝑢𝑖𝑐𝑘 𝑟𝑎𝑡𝑖𝑜 =Current Assets − Inventories − Account Recievables
Current Liabilities
Working Capital Turnover ratio: The working capital turnover ratio is also referred to as net sales to working capital. It indicates
a Company's effectiveness in using its working capital.
𝑊𝑜𝑟𝑘𝑖𝑛𝑔 𝐶𝑎𝑝𝑖𝑡𝑎𝑙 𝑇𝑢𝑟𝑛𝑜𝑣𝑒𝑟 𝑟𝑎𝑡𝑖𝑜 =𝑆𝑎𝑙𝑒𝑠 𝑇𝑢𝑟𝑛𝑜𝑣𝑒𝑟
Current Assets − Current Liabilities
Debt to Equity ratio: The debt-to-equity ratio (D/E) is a financial ratio indicating the relative proportion of
shareholders' equity and debt used to finance a company's assets.
𝐷𝑒𝑏𝑡 𝑡𝑜 𝐸𝑞𝑢𝑖𝑡𝑦 𝑟𝑎𝑡𝑖𝑜 =𝑆ℎ𝑜𝑟𝑡 𝑇𝑒𝑟𝑚 𝐷𝑒𝑏𝑡 + 𝐿𝑜𝑛𝑔 𝑇𝑒𝑟𝑚 𝐷𝑒𝑏𝑡
𝑁𝑒𝑡 𝑊𝑜𝑟𝑡ℎ
Interest Coverage ratio: The Interest coverage ratio is a debt ratio and profitability ratio used to determine how easily a
Company can pay interest on outstanding debt.
𝐼𝑛𝑡𝑒𝑟𝑒𝑠𝑡 𝐶𝑜𝑣𝑒𝑟𝑎𝑔𝑒 𝑅𝑎𝑡𝑖𝑜 =𝐸𝑎𝑟𝑛𝑖𝑛𝑔 𝐵𝑒𝑓𝑜𝑟𝑒 𝐼𝑛𝑡𝑒𝑟𝑒𝑠𝑡 𝑎𝑛𝑑 𝑇𝑎𝑥
𝐹𝑖𝑛𝑎𝑛𝑐𝑒 𝐶𝑜𝑠𝑡
Market Cap/Sales ratio: Market Cap/sales ratio, Price–sales ratio, P/S ratio, or PSR, is a valuation metric for stocks. It is
calculated by dividing the company's market cap by the revenue in the most recent year; or, equivalently, divide the per-
share stock price by the per-share revenue.
𝑀𝑎𝑟𝑘𝑒𝑡 𝐶𝑎𝑝/𝑆𝑎𝑙𝑒𝑠 𝑟𝑎𝑡𝑖𝑜 =𝑀𝑎𝑟𝑘𝑒𝑡 𝐶𝑎𝑝
𝑆𝑎𝑙𝑒𝑠 𝑇𝑢𝑟𝑛𝑜𝑣𝑒𝑟
Market Cap/ Net Worth ratio: It is a valuation ratio calculated by dividing Company’s market cap to net worth.
𝑀𝑎𝑟𝑘𝑒𝑡 𝐶𝑎𝑝/𝑁𝑒𝑡𝑤𝑜𝑟𝑡ℎ 𝑟𝑎𝑡𝑖𝑜 =𝑀𝑎𝑟𝑘𝑒𝑡 𝐶𝑎𝑝
𝑁𝑒𝑡𝑤𝑜𝑟𝑡ℎ
Market Cap/ PAT ratio: It is a valuation ratio calculated by dividing Company’s market cap to net profit.
𝑀𝑎𝑟𝑘𝑒𝑡 𝐶𝑎𝑝/𝑃𝐴𝑇 𝑟𝑎𝑡𝑖𝑜 =𝑀𝑎𝑟𝑘𝑒𝑡 𝐶𝑎𝑝
𝑛𝑒𝑡 𝑝𝑟𝑜𝑓𝑖𝑡
Market Cap/ EBITDA ratio: It is a valuation ratio calculated by dividing Company’s market cap to EBITDA.

Stakeholders’ Education | Corporate Governance Research | Corporate Governance Score | Proxy Advisory
STAKEHOLDERS EMPOWERMENT SERVICES
8 | P A G E
SECTOR: STEEL REPORTING DATE: 5TH DECEMBER, 2017
STEEL AUTHORITY OF INDIA LTD. www.sail.co.in
𝑀𝑎𝑟𝑘𝑒𝑡 𝐶𝑎𝑝/𝐸𝐵𝐼𝑇𝐷𝐴 𝑟𝑎𝑡𝑖𝑜 =𝑀𝑎𝑟𝑘𝑒𝑡 𝐶𝑎𝑝
𝐸𝐵𝐼𝑇𝐷𝐴
Trading Volume (shares) (avg. of 1 year): Average number of shares/day traded in 1 year
Trading volume (shares) (high in 1 year): Highest number of shares/day traded in 1 year
Trading volume (shares) (minimum in 1 year): Lowest number of shares traded on any one day in 1 year
Stakeholders’ Education | Corporate Governance Research | Corporate Governance Score | Proxy Advisory
STAKEHOLDERS EMPOWERMENT SERVICES
9 | P A G E
SECTOR: STEEL REPORTING DATE: 5TH DECEMBER, 2017
STEEL AUTHORITY OF INDIA LTD. www.sail.co.in
DISCLAIMER
Sources Company Information
Only publicly available data has been used while making the factsheet. Our data sources include: BSE, NSE, SEBI, Capitaline, Moneycontrol, Businessweek, Reuters, Annual Reports, IPO Documents and Company Website.
Analyst Certification
The analysts involved in development of this factsheet certify that no part of any of the research analyst’s compensation was, is, or will be directly or indirectly related to the contents of this factsheet.
Disclaimer
While SES has made every effort and has exercised due skill, care and diligence in compiling this factsheet based on publicly available information, it neither guarantees its accuracy, completeness or usefulness, nor assumes any liability whatsoever for any consequence from its use. This factsheet does not have any approval, express or implied, from any authority, nor is it required to have such approval. The users are strongly advised to exercise due diligence while using this factsheet. This factsheet in no manner constitutes an offer, solicitation or advice to buy or sell securities, nor solicits votes or proxies on behalf of any party. SES, which is a not-for-profit Initiative or its staff, has no financial interest in the companies covered in this factsheet except what is disclosed on its website. The factsheet is released in India and SES has ensured that it is in accordance with Indian laws. Person resident outside India shall ensure that laws in their country are not violated while using this factsheet; SES shall not be responsible for any such violation. All disputes subject to jurisdiction of High Court of Bombay, Mumbai.
SEBI Reg. No. INH000000016
This factsheet or any portion hereof may not be reprinted, sold, reproduced or redistributed without the written consent of Stakeholders Empowerment Services
Contact Information
Stakeholders Empowerment Services
A 202, Muktangan, Upper Govind Nagar,
Malad East, Mumbai – 400 097
Tel +91 22 4022 0322
www.sesgovernance.com
Research Analyst: Mukesh Solanki