Embed Size (px)
Citation preview
KEITH M. MOOREOffice of International Research,
Education, and Development
Virginia Tech | Blacksburg, Virginia
5 February 2013
Stakeholders, social network analysis and participatory innovation for conservation agriculture

TODAY, WE’LL TALK ABOUT…
from technology transfer to adaptive management
building communicative competence
conservation agriculture and mind-set change
some social network analysis findings
discussion

“Transforming conventional agriculture is not just a question of training farmers, but of social learning in complex interwoven networks of interdependent actors. In most instances, we are not dealing with ‘virgin country’ but with situations in which highly interwoven actor networks have already evolved around the needs of conventional farming.”
Röling and Jiggins, 1998

Reflecting on Networks and Technical Change
How should we think about technical change in agriculture?
What is the role of learning in the process of innovation?• Is learning a matter of information transfer resulting in
adoption of innovations?
• Or, is learning a matter of developing capacities for on-going adaptation?
Whose capacities should be developed?
Where, in fact, does innovation occur?

Technology Transfer in the First Green Revolution
Technology Transfer operates well under conditions where:
Ecological and market conditions are stable and relatively homogeneous
Technological change is a matter of component replacement
Shared knowledge systems extend from conception to execution
Linking investments with outputs allows for quantitative priority setting

Building Communicative Competence - I
• U.S. Land Grant Universities - A model of institutional innovation.
• Well integrated socially with its clientele in the late 19th century.
• Graduates were sons and daughters of the farming community in each state.
• Research and education wasresponsive to local needs.
• Technology was focused onexpressed farm problems.
• Extension was not developed until the early 20th century.

The Transition to Complex Adaptive Systems
All of science has shifted.
A series of differentiated revolutions for Africa
Learner-focused scholarship
• Farmer problem solving
• Innovation systems

Social Learning for Adaptive Management
Learning by doingLocal stakeholders innovate
management techniques
adapted to local conditions
Negotiation
Resistance
Accommodation

Principles for enhancing innovative performance
Assess the extent of institutional interactions and power relations
Evaluate knowledge flows between nodes
Identify bottlenecks and opportunities for interactive learning
Assess institutional policy and practices
Suggest appropriate remedial action

Knowledge Networks/Systems
• People and technologies are interconnected in ways that reproduce some types of knowledge and behavioral practices and not others
• Knowledge networks rationalize socio-material relationships in the agro-ecology
• There is often competition between knowledge network segments

Narratives, stories, and discourses
• Stories describe how the nodes are tied to each other
• A social network is a network of • meanings,
• discursive frameworks, and
• cultural idioms.

green bean producers in Mali
contract with exporters; who contract with importers; who make routine deliveries to wholesalers and retailers for sale to consumers

Green Bean Production and Marketing Chain with Monitoring System
The Environment: Source of Inputs and Contamination
Market / Consumers
Producers Producers Producers IER
OHVN
Exporting Companies
Broker
DGRCToxicologyLaboratory
IPMCRSP
coordination
collaboration
Introduction ofnew technologies
and
Facilitation
verificationMonitoring
European UnionInspections
Monitoring
PhytosanitaryControls
Laboratory
verification
Village ProductionCommittee
Con
tract
s
Village ProductionCommittee

A Complex Adaptive System
Research
Regulators
Wholesalers
Processors
Production Ecology
ProducerOrganizationsCredit system
Input suppliers Transporters
Retailers
Input producers
GovernmentCivil Society
Local Markets Extension
Producers
Consumers
Export Markets

Commune of Madiama
CARE/Djenné
Region of MoptiCercle of Djenné
Village Head
Village Head
Villagers
Villagers
Villagers
Sub-Prefect-Sofara
Prefect-Djenné
Other AssociationsParents, Health, etc.
Djenné Mayor’sAssociation
Other NGOs
Forestry ServiceLivestock Service
Rural Development Service
Herders’Association of Nérékoro
CRRA/Mopti Station Village Head
Mayor
Commune Council
Rice Office
NRMAC
Village Head
Women’s Associations
Village Associations
Villagers
The State
Civil SocietySyn Rice Growers’
Association
Local Ag and NRM Governance


Building Communicative Competence – II
• Universities in the global North and South need to be thinking about:
• New ways of relating to their multiple clienteles.
• Innovation systems for research and development.
• Value chains on which resources can be built.
• Who and how to train new facilitators of innovation.
• Social network analysis provides two new ways to view these relationships.
• Conventional research to understand production networks and their stakeholders.
• As a participatory research tool building innovation networks.

Using social networks to studyco-innovation processes
• Networks in the development context:
• Adoption studies (Conley and Udry 2001)
• Natural resource management (Crona and Bodin 2006 & 2009)
• Use networks to explore relationships and idea development
• Professional structures (Wolf 2006; Rycroft and Kash 1999)
• Measurement/evaluation (Biggs and Matsaert 2004)
• Network structure (Spielman et al. 2011)
• Attitudes and beliefs of network members (Knock and Yang 2008)

MT. ELGONBUNGOMA | KAPCHORWA | TORORO | KITALE

THE COMMUNITIES
KAPCHORWA |
TORORO |
BUNGOMA |
TRANS NZOIA |
Kapchorwa

Conservation Agriculture Production Systems – a complex, multi-purpose technology
Three Principles based in adaptive knowledge:
Minimize soil disturbance
Maintain a permanent soil cover
Rotate and mix crops
Goals:
Improve food security through stabilizing yields
Reduce erosion
Improve fertility
Sequester carbon/reduce greenhouse gas emissions

OUR RESEARCH PROBLEM Purpose | How to engage with local mind sets in ways that are
transformative and yield positive outcomes
Change agent perspectives |
Agricultural change agents are trained in conventional production practices and memorized scientific “facts”
Farmer agro-ecological knowledge |
agro-ecological knowledge and its application in production informs farming discourse in local social networks
Conservation agriculture requires adaptation |
CA doesn’t fit well with that memorized knowledge and challenges conventional farming wisdom

Research Process
Focus Groups in 2010 Meet with community members and describe project
Identify and list key contacts/actors for agricultural production
Household Survey conducted in 2010 Targeted farm households were asked about their key contacts for
agricultural information/resources (N = 400; 100 per community)
Snowball survey of non-farm agents conducted in spring 2011 with Community agents
Agricultural service providers
Follow-up stakeholder workshop in winter 2012 Community agents
Agricultural service sector providers
Representative farmers (women and men)

Dependent variables in the analysis
Built from 20 Likert-scale items in questionnaire• Measuring conventional, risk-averse, and conservation
agriculture knowledge and beliefs
• Variance ranges from: agree strongly (code=5) to disagree strongly (code=1)
Factor analysis (principle components) identified two predominant dimensions of variation• Modern capital intensive farming
• Mixed crop-livestock farming
Two single indicators of conservation agriculture• The importance of maintaining permanent crop cover
• Tillage causes soil degradation

Independent variables
Contextual characteristics• Local agro-ecosystems (by research site)
• Network connectivity (type and frequency of contacts)
Individual characteristics• Resource endowments
(tractor, animal traction, area farmed, wealth, off-farm income,
credit)
• Personal characteristics (Age, gender, education, female household head, health,
% energy from staples)

Mean scores for Kenyan and Ugandan farmers and non-farm agents level of agreement on basic farming perspectives
6.85 7.02
7.57
7.056.83
4.44 4.54
3.96
4.604.38
0
1
2
3
4
5
6
7
8
Small Farmers (137) Large Farmers (207) Service sector/community agents (74)
Farmers withoutextension contact (189)
Farmers with extensioncontact (155)
conventional modern farming mixed crop-livestock farming

STATEMENT: One should maintain a permanent crop cover.
27.724.2
73.0
24.327.1
40.9
34.3
10.8
38.634.8
31.4
41.5
16.5
37.0 38.1
0.0
10.0
20.0
30.0
40.0
50.0
60.0
70.0
80.0
Small Farmers (137) Large Farmers (207) Service sector/community agents
(74)
Farmers withoutextension contact
(189)
Farmers withextension contact
(155)
Agree Uncertain/neutral Disagree

STATEMENT: Tillage causes land degradation.
48.2
40.1
62.2
39.2
48.4
27.7
33.3
2.7
34.4
27.124.1
26.6
35.1
26.524.5
0
10
20
30
40
50
60
70
Small Farmers (29) Large Farmers (46) Service sector/ (19)community agents
Farmers withoutextension contact
Farmers withextension contact
Agree Uncertain/neutral Disagree

INDEPENDENT VARIABLESVARIABLE GROUPS ALL BEST MODEL
Beta sig Beta sig Beta sig
Agro-ecological Zone
Tororo .166 .01 .450 .02 .221 .00
Kapchorwa -.126 .06 .234 .08
Bungoma -.034 .60 .216 .04 .102 .06
Adj. R2 .053 .00
Resource endowments
Tractor -.039 .54 .254 .00 .237 .00
Animal traction -.087 .12 -.048 .41
Area farmed .007 .91 -.017 .76
Wealth index .016 .80 .084 .25
Importance of off-farm income -.081 .14 -.063 .26
Access to credit .153 .01 .089 .16
Adj. R2 .014 .09
Personal Characteristics
Age-respondent .040 .49 .043 .57
Gender-respondent .024 .69 .058 .31
Education-respondent -.007 .90 -.017 .78
Female household head -.015 .81 -.090 .17
Poor health -.117 .04 -.105 .05
% energy from staples .088 .11 .065 .21
Adj. R2 .002 .36
Network connectivity
Extension contact .224 .04 .289 .01 .300 .01
Frequency extension contact -.271 .02 -.378 .00 -.390 .00
NGO Contact -.013 .91 -.007 .95
Frequency NGO contact .164 .15 .156 .17 .185 .00
Vendor contact -.100 .22 -.131 .13
Frequency vendor contact .032 ,77 .099 .37
Average contact frequency -.018 .75 .079 .58
Total network contact frequency -.255 .02 -.250 .02 -.270 .00
Adj. R2 .087 .00
Adjusted R2 .145 .00 .150 .00
Regression Table 6.1:
Modern capital intensive farming

Regression Table 6.2:
Mixed crop-livestock farming
INDEPENDENT VARIABLESVARIABLE GROUPS ALL BEST MODEL
Beta sig Beta sig Beta sig
Agro-ecological Zone
Tororo -.348 .00 -.052 .89
Kapchorwa -.014 .25 .063 .64 .153 .02
Bungoma -.299 .00 -.285 .01 -.197 .00
Adj. R2 .107 .00
Resource endowments
Tractor .161 .01 -.109 .25
Animal traction -.007 .90 .029 .63
Area farmed -.015 .80 -.004 .94
Wealth index .008 .90 -.064 .31
Importance of off-farm income -.001 .99 -.011 .84
Access to credit -.013 .83 .138 .03 .126 .04
Adj. R2 .008 .19
Personal Characteristics
Age-respondent .029 .62 .001 .99
Gender-respondent -.018 .77 -.071 .21
Education-respondent .053 .36 .024 .69
Female household head .038 .54 .074 .21
Poor health .012 .83 .017 .75
% energy from staples .021 .71 .011 .84
Adj. R2 -.013 .94
Network connectivity
Extension contact -.145 .18 -.237 .04 -.140 .01
Frequency extension contact .012 .91 .124 .30
NGO Contact -.217 .05 -.208 .07 -.116 .05
Frequency NGO contact .142 .22 .108 .35
Vendor contact .145 .08 .093 .28
Frequency vendor contact -.303 .01 -.254 .02 -.201 .02
Average contact frequency .196 .00 .279 .05 .229 .00
Total network contact frequency .242 .02 .244 .03 .273 .00
Adj. R2 .078 .00
Adjusted R2 .133 .00 .149 .00

Regression Table 7.1:
One should maintain a permanent crop cover
INDEPENDENT VARIABLESVARIABLE GROUPS ALL BEST MODEL
Beta sig Beta sig Beta sig
Agro-ecological ZoneTororo -.200 .00 -.224 .24Kapchorwa -.245 .00 -.194 .15Bungoma -.351 .00 -.399 .00 -.236 .00
Adj. R2 .076 .00Resource endowmentsTractor .098 .12 -.100 .29Animal traction -.108 .05 -.014 .81Area farmed -.058 .32 -.106 .06Wealth index .076 .22 .054 .39Importance of off-farm income -.089 .10 -.075 .18Access to credit .083 .15 .131 .04 .139 .01
Adj. R2 .040 .00Personal CharacteristicsAge-respondent .193 .00 .142 .02 .182 .00Gender-respondent .159 .01 .112 .05 .100 .05Education-respondent .006 .92 -.034 .57Female household head -.031 .60 -.026 .66Poor health -.118 .03 -.086 .11% energy from staples .080 .03 .061 .24
Adj. R2 .048 .00Network connectivityExtension contact -.019 .86 -.044 .70Frequency extension contact .060 .61 .104 .39NGO Contact -.458 .00 -.386 .00 -.420 .00Frequency NGO contact .360 .00 .290 .01 .343 .00Vendor contact .167 .05 .156 .07 .132 .01Frequency vendor contact -.188 .09 -.081 .46Average contact frequency .018 .77 -.029 .84Total network contact frequency .100 .35 .080 .46
Adj. R2 .050 .00Farming PerspectivesModern capital intensive .138 .01 .107 .06 .105 .04Mixed farming system -.014 .77 -.051 .36
Adj. R2 .015 .02Adjusted R2 .157 .00 .153 .00

Regression Table 7.2:
Tillage Causes Land
Degradation
INDEPENDENT VARIABLESVARIABLE GROUPS ALL BEST MODEL
Beta sig Beta sig Beta sig
Agro-ecological ZoneTororo -.073 .27 -.049 .80Kapchorwa -.173 .02 .205 .14 .268 .00Bungoma -.089 .17 -.007 .95
Adj. R2 .045 .00Resource endowmentsTractor .051 .41 048 .62Animal traction .065 .24 .052 .39Area farmed -.074 .21 -.059 .32Wealth index .161 .01 .149 .02 .143 .01Importance of off-farm income -.023 .68 -.008 .89Access to credit -.191 .00 -.115 .08
Adj. R2 .037 .00Personal CharacteristicsAge-respondent .012 .83 -.004 .94Gender-respondent -.142 .02 -.148 .01 -.149 .01Education-respondent .060 .28 .036 .56Female household head .075 .22 .116 .06 .109 .05Poor health .007 .90 -.001 .99% energy from staples .163 .00 .130 .02 .132 .01
Adj. R2 .033 .01Network connectivityExtension contact .085 .46 .028 .81Frequency extension contact -.004 .97 .109 .38 .106 .04NGO contact -.101 .38 -.199 .08Frequency NGO contact .131 .28 .183 .12Vendor contact .113 .19 .101 .25Frequency vendor contact -.151 .19 -.137 .23Average contact frequency .058 .35 -.012 .94
Total network contact frequency -.029 .79 -.034 .76Adj. R2 -.003 .53
Farming PerspectivesModern capital intensive -.003 .95 .135 .02 .130 .01Mixed farming system .053 .28 .010 .86
Adj. R2 -.002 .56Adjusted R2 .104 .00 .118 .00

Conclusions from conventional analysisSense-Making |
there are real differences between the agricultural production knowledge of non-farm agents and farmers
Contextual knowledge and mutual understanding |
these differences are driven by farmers’ lived experience of the agro-ecology and the networks that support living in that environment in contrast to memorized science
Receptivity to change |
new ideas may find receptivity on the basis of personal characteristics and resource endowments, but sustained only through grounding concepts in local knowledge
Mind-Set change |
Mind-set change requires negotiating new understandings among network members in the process of making adaptations to production practices
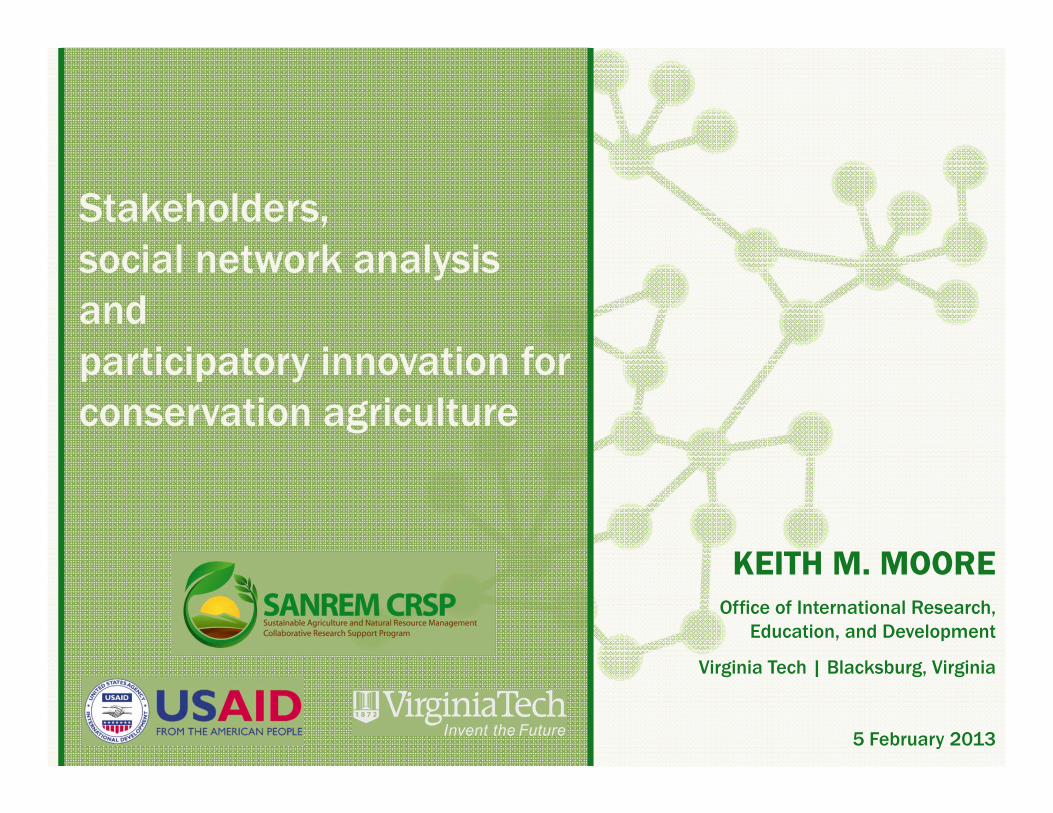
Kapchorwa Agricultural Support Network

Bringing the network together
Farmers are often more receptive to CA than believed by the service sector Crop rotation in Tororo
Belief that tillage causes land degradation in Kapchorwa
Relating farmer knowledge and practice Bungoma: practice is
knowledge
Trans Nzoia: evolutionary relationship
In Kapchorwa, Uganda farmers recognize the damage from plowing, but it continues to be the dominant practice.

Most frequently reported resource contacts in Tororo, Uganda

AgentDegree
CentralityRank Agent
Betweenness Centrality
NAADS Coordinator
20 1Local AgrovetStockist
28.25
Chief 20 2Women's Group Leader
16.93
Counselors 19 3 Chief 14.19
Local Agrovet*Women’s Group Leader*
18 4NAADS Coordinator
14.15
* Tied for fourth.
Central Actors in Kapchorwa/KwosirAgricultural Production Network

Revealing differences in perceived and reported network contacts
Extension not in the top 25% in Uganda for resources Conflicts with resource distribution mandate
Agrovets as the primary contact Various reactions
Priority setting
Increasing contacts for Tororo farmers
Farmer group leaders desire to expand their reach

0
20
40
60
80
Agree Uncertain Disagree
Small Farmers
Large Farmers
Local Agents
Kapchorwa: Tillage causes land degradation

Misunderstanding the perceptions of others

This participatory research process
Built trust between social and agronomic researchers
Increased legitimacy of participatory research
Farmers and service providers recognized personal role in generating the network
Maintaining interest beyond direct participants
Engaged local advisory committees
The network workshops brought together many members of the local advisory committees for the first time since the start of the project.

Managing Project Expectations Linear expectation not just from the side of development
agents, but farmers too! Expect a finished product
Changing how we talk about networks for CA A learning process as the networks evolve
A different dynamic within project management
Evidence that a network approach can make valuable contributions
Technology development
Spontaneous adoption

Key Contributions of SNA to the project
Evidence that a network approach can make valuable contributions
Technology development
Spontaneous adoption
Mutual learning:
1. Revealing differences between perceived and reported network contacts
2. Ill-informed perspectives about the beliefs of others
3. Problems regarding actual agricultural technologies
Developing partnerships for network field research in 2011

Thank you! Questions?