Embed Size (px)
Citation preview

İSTANBUL TECHNICAL UNIVERSITY INFORMATICS INSTITUTE
M. Sc. THESIS
Uğur EJDER
Department of Informatics Computational Science and Engineering Programme
AUGUST 2011
MULTIVARIATE GARCH MODELS


Thesis Advisor : Prof.Dr. BURÇ ÜLENGİN
İSTANBUL TECHNICAL UNIVERSITY INFORMATICS INSTITUTE
M. Sc. THESIS
Uğur EJDER (702081011)
Department of Informatics
Computational Science and Engineering Programme
AUGUST 2011
MULTIVARIATE GARCH MODELS


Tez Danışmanı : Prof.Dr. Burç ÜLENGİN
AĞUSTOS 2011
Bilişim Anabilim Dalı
Hesaplamalı Bilim ve Mühendislik Programı
YÜKSEK LİSANS TEZİ
Uğur EJDER (702081011)
ÇOK DEĞİŞKENLİ GARCH MODELLERİ
İSTANBUL TEKNİK ÜNİVERSİTESİ BİLİŞİM ENSTİTÜSÜ


Uğur Ejder, a M.Sc. student of ITU Informatics Institute student ID 702081011, successfully defended the thesis entitled “MULTIVARIATE GARCH MODELS”, which he prepared after fulfilling the requirements specified in the associated legislations, before the jury whose signatures are below.
Thesis Advisor : Prof. Dr. Burç ÜLENGİN .......................... İstanbul Technical University
Jury Members : Prof. Dr. M.Serdar ÇELEBİ ............................. İstanbul Technical University
Jury Members : Assoc.Prof. Dr. Oktay TAŞ .............................. İstanbul Technical University
Date of Submission : 02 June 2011 Date of Defense : 08 August 2011


FOREWORD
I would like to thank Prof.Dr. Burç Ülengin for his guidance and advice In every single step of my research during my M.Sc study. It is his patience , care and energy which makes my studies a complete. I also have to express my greatest grantitude and apologize to my family, Prof.Dr. M.Serdar Çelebi, Prof .Dr.Metin Demiralp, Dr. Lale Tükenmez Ergene, Dr. F.Aylin Konuklar Ayhan Tokuri, Pervin Nasırlıel my friend Volkan Demir for their great help.
.
August 2011
Uğur Ejder
Mathematical Engineer


TABLE OF CONTENTS
Page
FOREWORD ........................................................................................................ vii TABLE OF CONTENTS .....................................iHata! Yer işareti tanımlanmamış. ABBREVIATIONS....................................................................................................xi LIST OF TABLES ............................................................................................... xiii LIST OF FIGURES .............................................................................................. xv SUMMARY ..................................................................................................... xviiiii ÖZET ................................................................ Hata! Yer işareti tanımlanmamış.xix 1. INTRODUCTION .............................................................................................. 1 2. LITERATURE SURVEY ................................................................................... 3
2.1 Value at Risk - Garch ................................................................................................. 3 2.2 Computational Approach .......................................................................................... 15
3. VALUE AT RISK MODELS AND GARCH ................................................... 25 3.1 VAR ........................................................................................................................ 25
3.1.1 Historical simulation ......................................................................................... 25 3.1.2 Variance-Covariance approach ......................................................................... 27 3.1.3 Monte Carlo simulation..................................................................................... 28
3.2 GARCH ................................................................................................................... 30 3.2.1 Arch models ..................................................................................................... 30 3.2.2 Garch models ................................................................................................... 33 3.2.3 QGarch models ................................................................................................. 34
3.3.4 EGarch models ................................................................................................. 34 3. 3 VAR Risk with GARCH ......................................................................................... 34
4. EMPRICAL APPROACH ............................................................................... 37 4.1 Obtaining of Data and Data Analysis ........................................................................ 37 4.2 Garch Estimation ..................................................................................................... 57 4.3 VAR Computational and Computational Problem..................................................... 65 4.3.1 Historical simulation method .......................................................................... 65 4.3.2 Variance-Covariance method .......................................................................... 68 4.3.3 Monte Carlo simulation method ..................................................................... 70 4.3.4 Computational problem ................................................................................. 73 4.4 Comparision ............................................................................................................ 76
5. CONCLUSION ................................................................................................. 79 REFERENCES ................................................................................................ 81 APPENDICES ................................................................................................. 83 RESUME ........................................................................................................ 181


ABBREVIATIONS
GARCH : Generalized Autoregressive Conditional Heteroskedacity ARCH : Autoregressive Conditional Heteroskedacity VAR : Value at Risk SEC : Security Exchange Comission UNCR : Uniform Net Capital Rule PDF : Probability Density Function SD : Standart Deviation VC : Variance – Covariance SQL : Structured Query Language MCS : Monte Carlo Simualation LM : Lagrange Multiplier IMKB : Istanbul Menkul Kıymetler Borsası.

LIST OF TABLES
Page
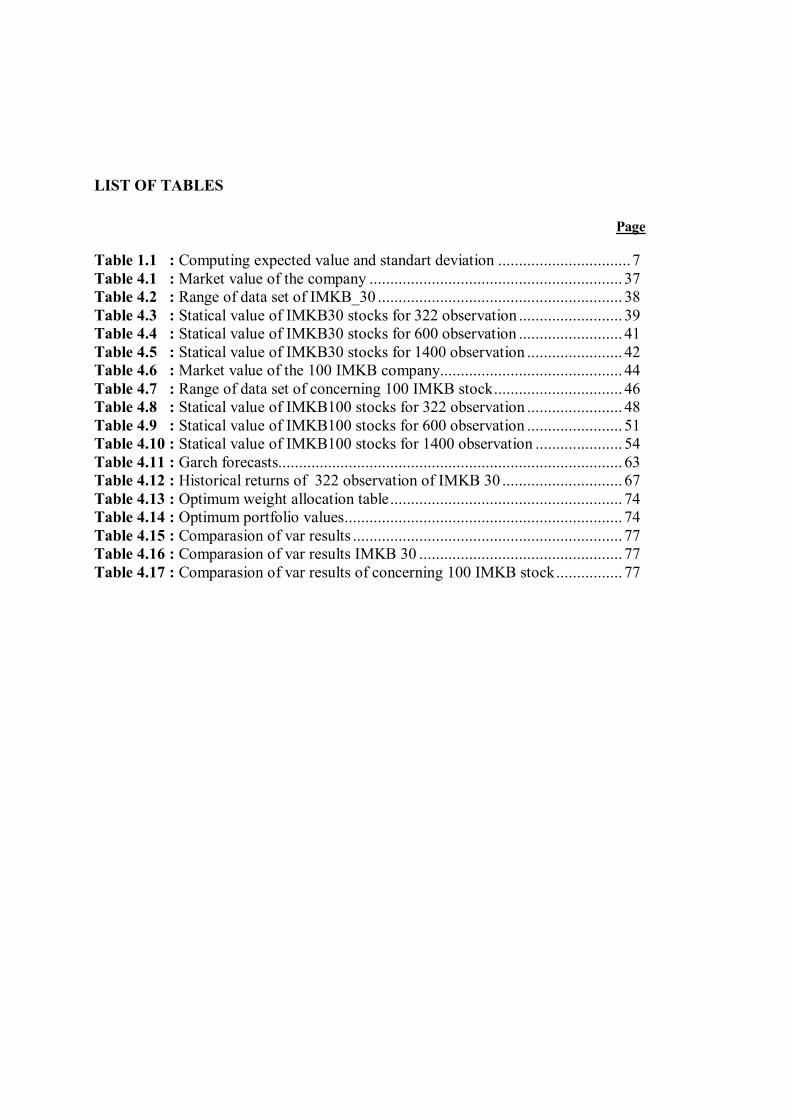
Table 1.1 : Computing expected value and standart deviation ................................ 7 Table 4.1 : Market value of the company ............................................................. 37 Table 4.2 : Range of data set of IMKB_30 ........................................................... 38 Table 4.3 : Statical value of IMKB30 stocks for 322 observation ......................... 39 Table 4.4 : Statical value of IMKB30 stocks for 600 observation ......................... 41 Table 4.5 : Statical value of IMKB30 stocks for 1400 observation ....................... 42 Table 4.6 : Market value of the 100 IMKB company............................................ 44 Table 4.7 : Range of data set of concerning 100 IMKB stock ............................... 46 Table 4.8 : Statical value of IMKB100 stocks for 322 observation ....................... 48 Table 4.9 : Statical value of IMKB100 stocks for 600 observation ....................... 51 Table 4.10 : Statical value of IMKB100 stocks for 1400 observation ..................... 54 Table 4.11 : Garch forecasts................................................................................... 63 Table 4.12 : Historical returns of 322 observation of IMKB 30 ............................. 67 Table 4.13 : Optimum weight allocation table ........................................................ 74 Table 4.14 : Optimum portfolio values ................................................................... 74 Table 4.15 : Comparasion of var results ................................................................. 77 Table 4.16 : Comparasion of var results IMKB 30 ................................................. 77 Table 4.17 : Comparasion of var results of concerning 100 IMKB stock ................ 77


LIST OF FIGURES
Page
Figure 1.1 : Stock market price .............................................................................. 6 Figure 1.2 : Sum of two dice .................................................................................. 6 Figure 1.3 : Standart deviation values .................................................................. 11 Figure 2.1 : Expected risk and value .................................................................... 17 Figure 2.2 : Connection SQL database with Mathematica .................................... 19 Figure 2.3 : Composing of variace matrix ............................................................ 19 Figure 2.4 : Variance matrix ................................................................................ 20 Figure 2.5 : Correlation matrix. ............................................................................ 20 Figure 3.1 : Historical data of dollar per Barrel .................................................... 26 Figure 3.2 : Confidence level graph ..................................................................... 27 Figure 3.3 : Monte-Carlo histogram. .................................................................... 29 Figure 4.1 : Correlation matrix of portfolios stocks. ............................................. 63 Figure 4.2 : Portfolio weight vector. .................................................................... 63 Figure 4.3 : Garch variance matrix. ...................................................................... 64 Figure 4.4 : Mathematica code of var. .................................................................. 64 Figure 4.5 : Historical simulation normal distribution. ......................................... 66 Figure 4.6 : Graph of portfolio’s historical returns. .............................................. 66 Figure 4.7 : Calculation of var with Variance-Covariance method. ...................... 68 Figure 4.8 : Variance matrix of stocks. ................................................................ 69 Figure 4.9 : Weight vector of portfolioCorrelation matrix. ................................... 69 Figure 4.10 : Correlation matrix. ............................................................................ 70 Figure 4.11 : Sample Mathematica code of VCV method. ...................................... 70 Figure 4.12 : Graph of Monte Carlo simulation returns. .............................................. 72 Figure 4.13 : Graph of Monte Carlo simulation returns for IMKB 30 for 322,600,1400 ............ 77 Figure 4.14 : Graph of Monte Carlo simulation returns for 100IMKB for 322,600,1400 ............. 78

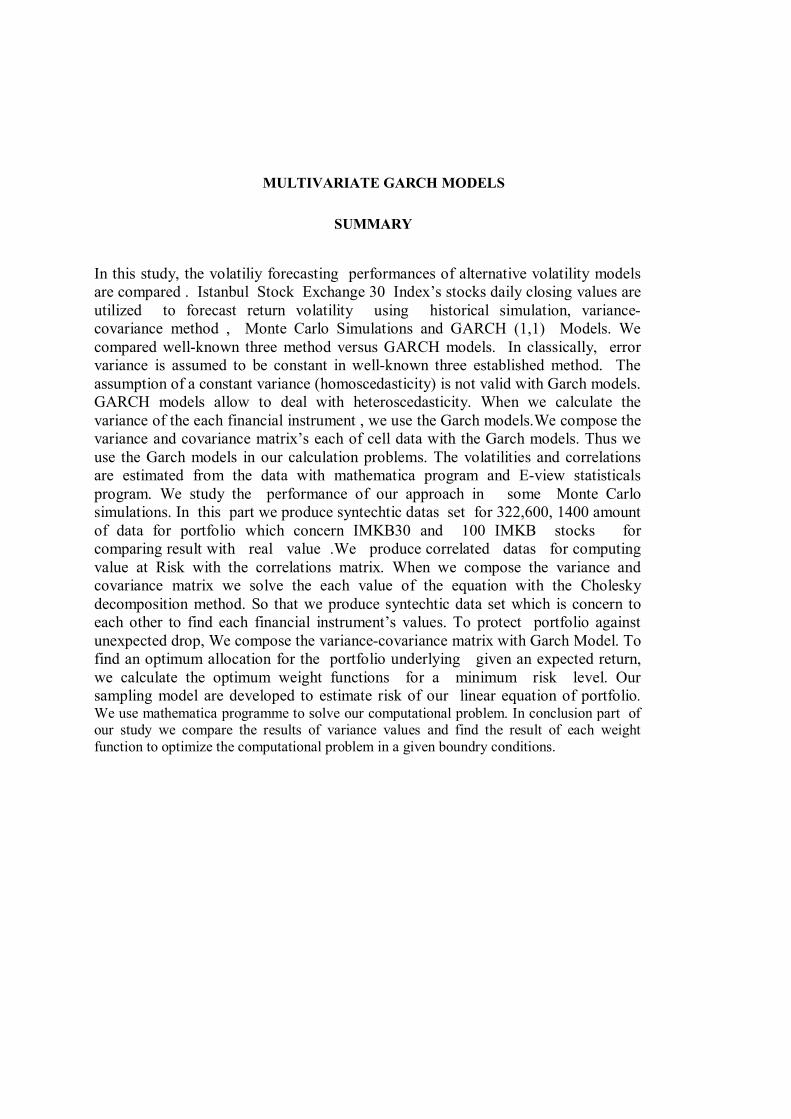
MULTIVARIATE GARCH MODELS
SUMMARY
In this study, the volatiliy forecasting performances of alternative volatility models are compared . Istanbul Stock Exchange 30 Index’s stocks daily closing values are utilized to forecast return volatility using historical simulation, variance- covariance method , Monte Carlo Simulations and GARCH (1,1) Models. We compared well-known three method versus GARCH models. In classically, error variance is assumed to be constant in well-known three established method. The assumption of a constant variance (homoscedasticity) is not valid with Garch models. GARCH models allow to deal with heteroscedasticity. When we calculate the variance of the each financial instrument , we use the Garch models.We compose the variance and covariance matrix’s each of cell data with the Garch models. Thus we use the Garch models in our calculation problems. The volatilities and correlations are estimated from the data with mathematica program and E-view statisticals program. We study the performance of our approach in some Monte Carlo simulations. In this part we produce syntechtic datas set for 322,600, 1400 amount of data for portfolio which concern IMKB30 and 100 IMKB stocks for comparing result with real value .We produce correlated datas for computing value at Risk with the correlations matrix. When we compose the variance and covariance matrix we solve the each value of the equation with the Cholesky decomposition method. So that we produce syntechtic data set which is concern to each other to find each financial instrument’s values. To protect portfolio against unexpected drop, We compose the variance-covariance matrix with Garch Model. To find an optimum allocation for the portfolio underlying given an expected return, we calculate the optimum weight functions for a minimum risk level. Our sampling model are developed to estimate risk of our linear equation of portfolio. We use mathematica programme to solve our computational problem. In conclusion part of our study we compare the results of variance values and find the result of each weight function to optimize the computational problem in a given boundry conditions.


ÇOK DEĞİŞKENLİ GARCH MODELLERİ
ÖZET
Bu çalışmada ,Risk hesaplamada kullanılan alternatif metodlar karşılaştırılmış ve IMKB 30 hisselerini içeren bir portföy belirli bir risk düzeyinde maximum getir sağlamasın için portföy oluşturan hisse senetlerinin hangi oranda dağıtılması gerektiğinin hesaplaması yapılmıştır. Öncelikle Riske maruz değer ve Garch modelleri ilgili literatür taraması yapılarak geçmiş dönemler olmuş olan kriz süreçleri ile ilgili bilgiler verilmiş dünya çapındaki büyük firmaların riske maruz değeri hesaplamamaları sonucunda olarak firmaların kayıplarının önemi vurgulanmıştır.Bu kayıplar sonucunda riske maruz değerin hesaplanması gerekliliği ihtiyacı ve riske maruz değerin nasıl ortaya çıktığından bahsedilmiştir.Riske maruz değerin hesaplanmasına geçilmeden önce çalışmalarda sıkça kullanacağımız istatiksel terimlerden bahsedilip riske maruz değerin hesaplanmasında kullanılacak terimlerle ilgili açıklamalar yapılmıştır.Burada standart sapma ve varyans terimleri ile riske maruz değer arasındaki ilişkiden söz edilip hesaplamalara bu değerleri nasıl katacağımızı anlatacağız.Riske maruz değeri hesaplarken güven seviyesi,finansal enstrümanın güncel değeri,zaman dairesi gibi kavramların nasıl kullanıldığından bahsedilmiştir.Riske maruz değeri hesaplamda kullanacağımız yöntemlerle karşılaştıracağımız GARCH ile ilgili bilgiler verilmiştir.Açılımı genelleştirilmiş otoregresif koşullu değişen varyans modelidir.Klasik yöntemlerde hata terimim sabit kabul edilirken Garch modellerinde hata teriminin koşullu varyansının geçmiş dönemlere ait hata terimleri karelerine bağlı olması yanında koşullu varyansın kendi geçmiş değerlerine de bağlı olacak şekilde oluşturulmuştur.GARCH(p,q) olarak ifade edilmiştir.Burada p hata terimlerinin karelerinin gecikme uzunluğu, q ise koşullu varyansındır.Garch modelleri ile ilgili açıklamalardan sonra hesaplamalı yaklaşım problemimiz ile ilgili modellemeye geliştirmeleri yapılmıştır.Hesaplamalı yaklaşım problemimizde IMKB 30 hisselerini içeren bir portföy oluşturularak verilen bir sabit getiri düzeyinde riski minimize edecek ağırlıkları olan hisse senetlerinden oluşan porföydeki hisse senetlerinin ağırlıkları hesaplanmıştır.Burada sabit bir getiri ve risk değeri olarak CxxT şeklinde gösterimler ve varsayımlar yapılmıştır. Bu çalışamada IMKB 30 hisse senetlerini içeren bir 30 X 30 ‘luk matris üzerinde çalışılmış olup 30(30+1)/2 işlemsayısı kadar hücrede bulunan covarianceler hesaplanmıştır.Matris simetrik olup pozitif definittir.Bu kısıtlar altında problemimizi çözerek hisselere ait ağırlık fonsiyonlarının değerleri hesaplanmıştır.Matrisin herbir hücresindeki değer hesaplanırken veriler veritabanında tutulmuş olup hesaplama işlemlerinde matematica programlama dili kullanılmıştır.Burada hesaplamalı problemde amaç belirli bir risk seviyesinde maksimum getiriyi elde edeceğimiz ağırlık fonsiyonlarını hesaplamaktır.Bu değer probleminde 2 adet kısıtımız bulunmaktadır.1.si ağırlık fonsiyonlarının toplamının 1’e eşit olması diğer kısıtımız ise belirli bir getiri düzeydir.Biz bu kısıtlara lagrange çarğanları demekteyiz.Problemimizin çözümü sırasında iteratif bir method olan Gauss Siedel metodu ile bulunmuştur.Burada bir referans başlangıç noktası alınarak iteratif olarak ilerleken her iterasyon sonunda

bizim istediğimiz bir oran olan epsilon değeri adım aralıklarını kontrol etmekteyiz.Adım aralıkları istenilen düzeye geldiğinde ise iterasyondan çıkılmaktadır. Istanbul Menkul Kıymetler Borsası 30 bileşik endeksi ve 100 adet Istanbul Menkul Kıymetler Borsası senetlerinin günlük kapanış değerleriyle Tarihsel simulasyon,Varyans-covaryans methodu, Monte Carlo ve Garch (1,1) methodlarıyla volatilite tahmin edilmiştir.Methodlar birbirleri ile karşılaştırılmış değişik koşullardaki durumları incellenmiştir.Senetlerin günlük kapanış değerleri internet ortamından tek tek exceller halinde indirilip günlük işlenebilecek şekillere dönüştürülmüştür.Ham data işlendikten sonra datalar MS SQL veritabanı ortamında tutulup bu datalarla ilgili hesaplamalar matematica programlama ile yapılmıştır.Öncelikle Riske maruz değeri hesaplarken Tarihsel simulasyon ile karşılaştırmalar yapılmıştır.Tarihsel method ile geçmişteki datalar ile gelecekti riske maruz değer tahmin edilmeye çalışılmıştır.Finansal enstrümanların günlük getirileri IMKB 30 hisseleri için 322 iş günü 100 Adet IMKB hisse senetleri için ise 159 iş günü için riske maruz değerler hesaplanmıştır.Çalışmalarımızda %95 güven aralığında çalışmalar yapılmıştır.Klasik yöntemlerde hatanın varyansı sabit kabul ediliyordu. Garch modelleri ile bu varsayım geçerliliğini yitirmiştir.Garch modelleri varyansın değişken olduğu durumuna izin vermiştir. Dataların volatilite ve covaryans tahminlerinde mathematica ve Eview istatistik programları kullanılmıştır.Burada IMKB 30 hisselerini içeren hisse topluluğu için 30 X 30’luk varyans-covaryans matrisi ile 100 adet IMKB hisselerini içeren hisse senetleri içinde 100 X 100’lük varyans kovaryans matrisi ile çalışılmıştır.Burada varyans kovaryans matrisi oluşturulurken öncelikle hisse senetlerinin varyanslarını içeren matris oluşturulmuştur.Varyans matrisi oluşturulurken hisse senetlerinin varyansları hesaplanmıştır.Kovaryans matrisin herbir hücresi için hisse senetleri arasındaki kovaryanslar hesaplanmıştır.Risk tahmini yaklaşımımız olan Monte Carlo Simulasyonunun performansı üzerinde çalışmalar yapılmıştır . Burada IMKB30 ve 100 adet IMKB borsası senetlerini içeren portföyler üzerinde sentetik data üretilerek data setlerinin 322,600,1400 adet data için sonuca yaklaşımları incelenmiştir. Risk hesaplamasını yaparken ilişkili veriler üretilmiştir. Burada en kritik durum birbiri ile ilişkili datalar üretmek olmuştur.Monte carlo simülasyonunda da Tarihsel simülasyonda olduğu gibi işlemler yapılmıştır.Buradaki fark Tarihsel simülasyonda gerçek datalar kullanılırken Monte carlo simülasyonunda sentetik datalar kullanılmıştır.Birbiri ile ilişkili senetler için birbiri ile ilişkili datalar üretilmiştir.Son methodurumuz olan ile Portföyü piyasadaki ani düşüşlerden korumak için varyans-kovaryans matrisinin oluşumunda Garch metodlarından faydalanılımştır.Garch modelleri ile varyansın değişken olduğu kabul edilmiştir.Hisse senetlerin varyanları garch modelleri ile hesaplanmıştır.Hesaplamalar yapılırken E-view istatistik program ile varyanslar hesaplanmıştır.Garch modelleri ile IMKB30 hisseleri ile 100 adet IMKB içeren hisse senetleri ile hesaplamalar yapılmıştır.Garch modelleri kullanılarak varyans kovaryans matrisleri oluşturulmuştur.Garch modelleri ile hisse senetlerinin varyansları hesaplanmıştır.Varyanslar ile matrisler oluşturulmuştur.Kovaryanslar ile varyans matrislerini kullanarak varyans kovaryans matrisleri oluşturulmuştur.Varyans kovaryans matris ile riske maruz değer garch modelleri vasıtasıyla hesaplanmıştır.Son olarak IMKB 30 hisse senetlerini içeren bir portföy için verilen belirli bir getiri düzende minimum risk değeri için ağırlık fonksiyonları hesaplanmıştır . Örnek modelle portfoyün riski tahmin edilmiştir.Burada portföyün riski WWp '2 şekilden tanılanıp portföyün riski bu şekilde gösterilmiştir.Problemimizde riskin minimize edilişi ise

N
x
N
jijji xxMin
1 1. şekilde gösterilip önceden tanımlanan varyans değerinin
türevinin alınıp sıfıra eşitlenmesi ile bu gösterim elde edilmiştir.Problemimizde iki adet kısıt bulunmaktadır.Bunlar sırası ile getiri değeri ve potföyde bulunan hisse senetlerinin geitirilerinin toplamının ağırlık fonksiyonlarının toplamının birime eşit olmasıdır. Problemimiz aşağıdaki kısıtlar atında maksimum getiriyi sağlayacak şekilde çözülmüştür.
)1(2),,...,,(30
1
30
1
30
1
30
1
j
ix j
ijjix
ii xxxxykbnkarclkakbankf
Problemimizi çözdükten sonra karşılaştırmalar kısmında dört adet risk ölçüm modelinin karşılaştırmları yapılmış ve her modelin hangi durumlar da avantajlı veya dezavantaj getirdiğinin hesabı yapılmıştır.Bu karşılaştırmalardan şu şekilde sonuçlar çıkarılmıştır.Tarihsel simülasyonda örnek modelin büyüklüğü bütün finansal enstürmanların aynı sayıda data içerme zorunluluğunun olması data toplamanını zorun ve zahmetli bir iş olması tarihsel simülasyonun dezavantajları olurken herhangi bir data dağılımı ile ilgili bir varsayım gerektirmemesi Tarihsel simülasyonun avantajlarında sayılmaktadır.Diğer bir metodumuz olan Monte carlo simülasyonunda data vektörleri arasından korele birbirine bağımlı olma zorunluluğu bir dezavantaj olmakla birlikte burada oluşan bu denklem takımını çözme gibi bir problemlede karşılaşılmıştır.Fakat örnek data modelini istediğimiz kadar büyütme ve az hata çıkması durumları monte carlo simulasyonun avantajları arasında sayılmaktadır.Varyans kovaryans metodumuzda dataların normal dağıldığı varsayımı kabülü olması dezavantaj olmakla birlikte,hesaplanması kolay olması ve daha az tarihsel dataya ihtiyaç duyulması daha duyarlı ve doğru olması varyans kovaryans metodunun avantajlı yönleri olmuştur.Son olarak IMKB 30 hisselerinin oluşturduğu portföy ile iki kısıt altında hesaplamalı problem çözülmüş ve ağırlıklar hesaplanmıştır.


1
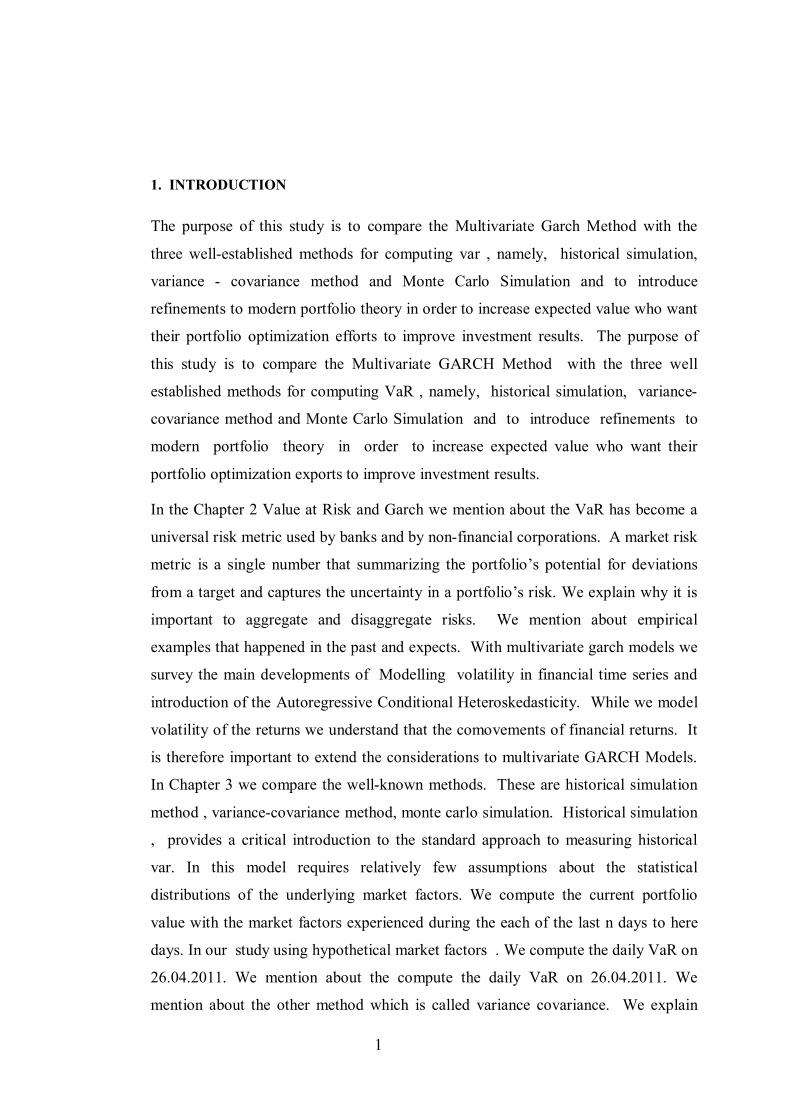
1. INTRODUCTION
The purpose of this study is to compare the Multivariate Garch Method with the
three well-established methods for computing var , namely, historical simulation,
variance - covariance method and Monte Carlo Simulation and to introduce
refinements to modern portfolio theory in order to increase expected value who want
their portfolio optimization efforts to improve investment results. The purpose of
this study is to compare the Multivariate GARCH Method with the three well
established methods for computing VaR , namely, historical simulation, variance-
covariance method and Monte Carlo Simulation and to introduce refinements to
modern portfolio theory in order to increase expected value who want their
portfolio optimization exports to improve investment results.
In the Chapter 2 Value at Risk and Garch we mention about the VaR has become a
universal risk metric used by banks and by non-financial corporations. A market risk
metric is a single number that summarizing the portfolio’s potential for deviations
from a target and captures the uncertainty in a portfolio’s risk. We explain why it is
important to aggregate and disaggregate risks. We mention about empirical
examples that happened in the past and expects. With multivariate garch models we
survey the main developments of Modelling volatility in financial time series and
introduction of the Autoregressive Conditional Heteroskedasticity. While we model
volatility of the returns we understand that the comovements of financial returns. It
is therefore important to extend the considerations to multivariate GARCH Models.
In Chapter 3 we compare the well-known methods. These are historical simulation
method , variance-covariance method, monte carlo simulation. Historical simulation
, provides a critical introduction to the standard approach to measuring historical
var. In this model requires relatively few assumptions about the statistical
distributions of the underlying market factors. We compute the current portfolio
value with the market factors experienced during the each of the last n days to here
days. In our study using hypothetical market factors . We compute the daily VaR on
26.04.2011. We mention about the compute the daily VaR on 26.04.2011. We
mention about the other method which is called variance covariance. We explain

2
how to improve the precision of var with this method. The important concept of this
method is we have to have the same amount of data set for the each of the assets.
You can imagine that a long position in Akbank stock and a short position in Arcelik
Stocks is less risky than one leg only, because of a high probability that profits of
one position will be mainly off-set by losses of another. After we compose the same
conditions we illustrate variance and correlations between asset returns. Our last
method is Monte carlo simulation method. Monte carlo methods are typically used
to then estimate the var because the aggregation is a non-linear mapping of the
assumed joint distribution of the underlying asset returns. Portfolio based
approaches, on the other hand, only consider the aggregated portfolio loss and use
Monte-Carlo methods to estimate the portfolio VaR. First we focus on building
construction of the data. We generate 1000 sample data for the each the stock of
IMKB30.We compare value at risk values for IMKB 30 stocks by using
322,600,1400 sample data for evaulating results.And then we apply same conditions
for 100 IMKB stocks by using 322,600,1400 sample data for evaulating results .The
most important point of in this approach, returns which we randomly generate,
correlated to each other. At the end of the chapter we argue that multivariate Garch
Models. First we mention about the arch model which is the autoregressive part of
the garch model. The other part of the equation is conditional heteroskedasticity.
In the Chapter 4 how do we obtain data set and which operations we apply on the
data set for computing VaR. How do we store this data set and give information
about our portfolio’s stock datas characteristic properties. We explain the reason
why we obtain different results when the same historical data are used in the three
fundamental types of var model, historical and monte carlo models variance
covariance model. In the Conclusion part we compare the result of the four method
which are Historical simulation, Variance Covariance, Monte carlo and Garch
method. Solving our computational problem with the Gauss-Seidel method used to
solve a linear system of equations. It can be applied to any matrix with non-zero
elements on the diagonals

3
2. LITERATURE SURVEY
2. 1 Value at Risk - Garch
Risk Managment has become a popular revolution in the last few years. It was started
by value at visk. After the financial disasters was occured a new method of measure
the financial risk was developed. Now var methodology has spread for the many area
to change way of approaching the risk. Now var is used to control and manage the
risk activities. It is used not only the financials area but also it is used on operational
area. We can use var in many areas. Var is used for information reporting,
controlling risk, managing risk , Financial institutions, Regulations, Non-financial
corporation, Asset managers. Also var has directed implication for the recent years.
One explanation is that the crisis was made by poor risk management of financial
institutions By focusing on potencially dangerous scenarios Var analysis would
direct institutions to consider taking measures to reduce risk levels by asking
themselves to report their var. Many banking and derivatives disasters could have
been avoided if reporting system had been more clear. Because of this markets
accumulate their values for bringing attention to potential problems. Var asking
What could happen under changes in market values. The other advantages of var
probably lies for critically thinking about risk. Now I want to mention about a short
history of var explication. Var was not used prior to the mid 1990s, the origin of the
measure lie further back in time. Vars were developed in the terms of portfolio
theory by Harry Markowitz and others economist, designing optimal portfolios for
equity zero coupon bond. On this purpose, the focus on market risks and the effects
of the common action in these risks are central to how var is computed. The
calculating of var measures came from the crises that beset financial service firms
over time. Because of the crisis , regulatory capital requirements for banks were
enacted in the aftermath of the great depression. When the securities exchange act
established the securities Exchange Commission and required banks to keep their
borrowings below 2000 % of their equity capital. After then banks design risk
measures to ensure that they met these amount of capital requirement. Increasing the
derivative market risks and floating exchange rates in the early 1970s, SEC's

4
Uniform Net Capital Rule regulated and expanded capital requirements. UNCR
categorized the financial assets that banks held into twelve classes. Bank reported on
their capital calculation in quarterly statements that were titled Financial and
Operating Combined Uniform Single reports. The first regulatory measures Value at
Risk , were started in 1980. SEC defined the capital requirements of financial firms
with 95 % confidence over a thirty day interval. Historical returns were used to
compute these VAR. Because of the portfolios of investment and commercial banks
were becoming more volatile and larger , the other problem has been occured about
more sophisticated and time risk control measures. In 1986 Ken Garbade at
Banker's Trust showed sophisticated measures of Value at Risk for the firm's fixed
income portfolios, depend on the covariance in yields on bonds of different
maturities. In the early 1990s, many financial firms had developed simple measures
of Value at Risk. After the numerous catastrophe losses associated with the use of
derivatives and leverage between 1993 and 1995 Nick Leeson created unauthorized
trading in Nikkei futures and options. Young trader in Singapore, firms were ready
for more comprehensive risk measures. In 1995, J. P. Morgan allowed software
makers to develop software to measure risk for providing them to access to asset
classes's datas on variances and covariances This facility is called risk metrics. At
first J. P. Morgan was established RiskMetrics for a daily report measuring and
explaining the risks of his firm. Then in 1992 J. P. Morgan launched the RiskMetrics
methodology to the market place for free to all market participants. Lately non-
financial firms has begun to use value at risk. Now we talk about the measuring of
the VaR. Value at Risk(VaR) is the answer of what is the most loss on the
investment. And Value at Risk also measure the potencial loss in value of investment
instrument or any kind of defined object over the specific time period over the
confidence interval. For Example if your asset's Var is $ 10 million at a specific time
period, 90 % confidence level, means there is a only 10% chance of loosing more
than $ 10 million over a given specific time period. In my thesis we developed VaR
for the portfolio. The market risk of a portfolio depends on possible loss of
movements of financial instruments such as equites, shares. Market risk important
for regulator assessing debt and to control the risk for the risk manager. The standard
method for measuring market risk has confidence interval and forecast time horizons.
This concepts are obvious reasons of the calculating of VAR. When we want to
calculate the VAR, we need a probability distribution of changes in portfolio value.
5
We ask the question of how the portfolio function is approximated and how the state
variables are modeled. We first review method for measuring var, then when we
want to answer simple question about distribution of portfolio value. To measure
risk we have to define the variable of interest which could be portfolio value, earning
capital or any kind of cash flow. Financial risk is occured by the affects of this
financial factors. Risk needs to be defined carefully, that is on statistical foundation
of portfolio which consist of many kind of financial instruments. Then we focus on
how to use concept of probability distribution functions to compute the probability of
a loss. After that probability of loss is discussed in terms of quantiles and loss size
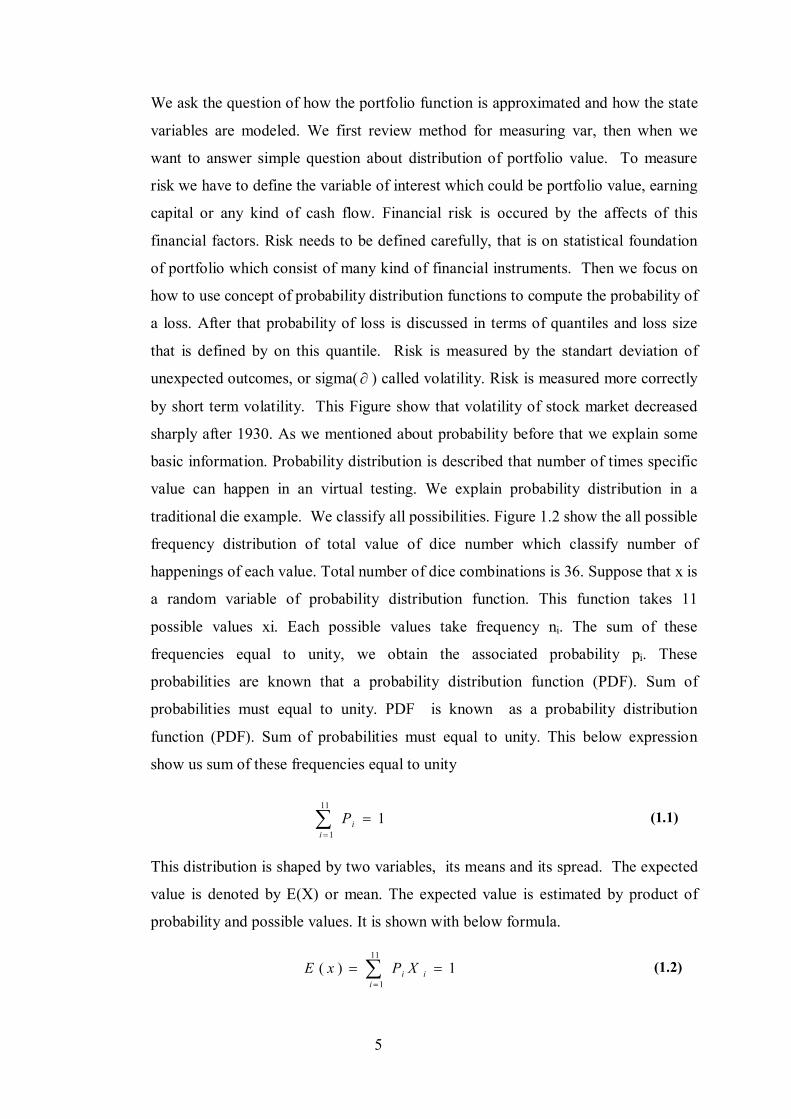
that is defined by on this quantile. Risk is measured by the standart deviation of
unexpected outcomes, or sigma( ) called volatility. Risk is measured more correctly
by short term volatility. This Figure show that volatility of stock market decreased
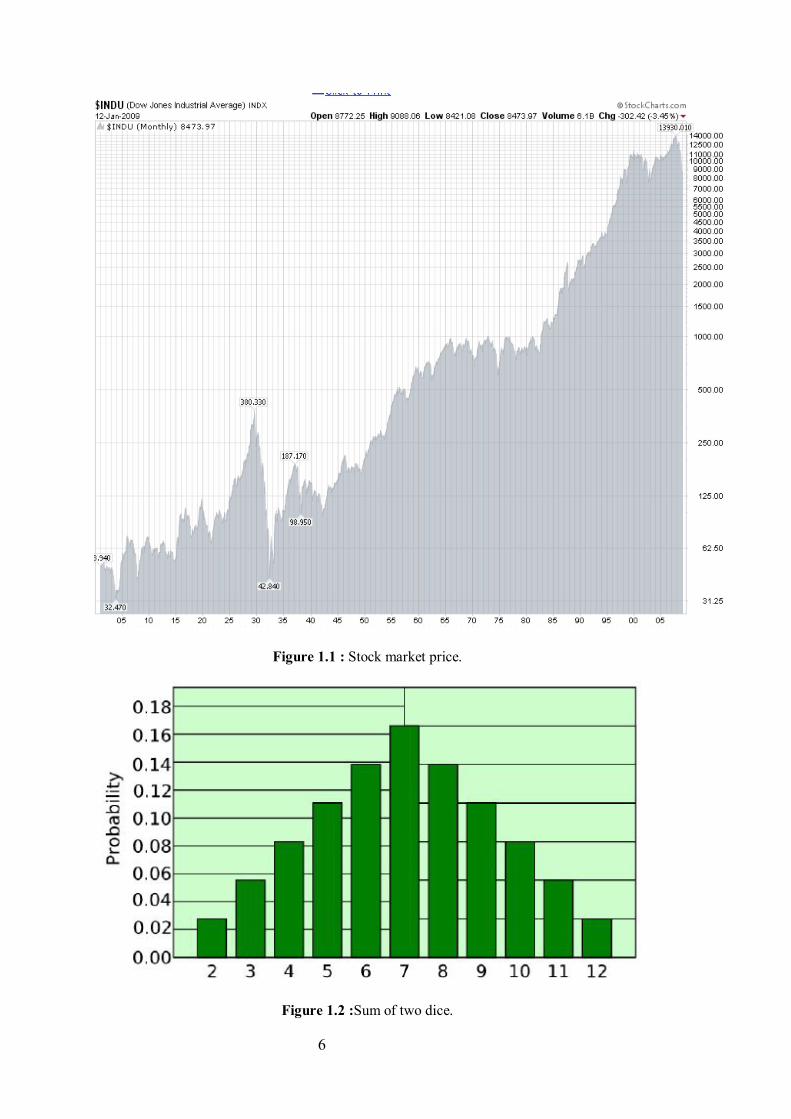
sharply after 1930. As we mentioned about probability before that we explain some
basic information. Probability distribution is described that number of times specific
value can happen in an virtual testing. We explain probability distribution in a
traditional die example. We classify all possibilities. Figure 1.2 show the all possible
frequency distribution of total value of dice number which classify number of
happenings of each value. Total number of dice combinations is 36. Suppose that x is
a random variable of probability distribution function. This function takes 11
possible values xi. Each possible values take frequency ni. The sum of these
frequencies equal to unity, we obtain the associated probability pi. These
probabilities are known that a probability distribution function (PDF). Sum of
probabilities must equal to unity. PDF is known as a probability distribution
function (PDF). Sum of probabilities must equal to unity. This below expression
show us sum of these frequencies equal to unity
111
1
i
iP (1.1)
This distribution is shaped by two variables, its means and its spread. The expected
value is denoted by E(X) or mean. The expected value is estimated by product of
probability and possible values. It is shown with below formula.
1)(11
1
ii
i XPxE (1.2)
6
Figure 1.1 : Stock market price.
Figure 1.2 :Sum of two dice.

7
The mode is defined as the most frequently observed value. Dispersion is the spread
of the data about the measurement. The most commonly used measures include the
range, variance standard deviation. The Range is the difference between the highest
and the lowest values of the variable. The variance is defined as the mean of the
square of deviations around the mean. The standard deviation is defined as the root
mean square of deviation around the mean.
211
1
)]([)( xExpxV ii
i
(1.3)
In this example sum of Expected value is 252/36.
Table 1.1 : Computing expected value and standart deviation.
Values(xi) 2 3 4 5 6 7 8 9 10 11 12 Total
Frequency of
occurence(ni) 1 2 3 4 5 6 5 4 3 2 1 36
Pr obability of
occurence (pi)
361
362
363
364
365
366
365
364
363
362
361
1
Computing E(X)=
pixi
362
366
3612
3620
3630
3642
3640
3636
3630
3622
3612
36252
Computing
V(X)=pi[xi-E(X)]²
3625
3632
3627
3616
365
361
365
3616
3627
3632
3625
36210
In our example outcome of x 1 = 2 probability is 1/36 (2 - 7) 2 = 25/36The sum of
V(X) = 210/36. The variance is a measure of how scatter a data set is. Standard
deviation Which is simply the square root of the variance.
)()( xvxSD (1.4)

8
Computing Expected Value and Standart Deviation
The Standart Deviation is written as
In our explanation standart deviation is 36/210 2. 415
The Standart Deviation show us a typical range of values around the mean. In our
example Data set is involved a discrete set of data is called discrete probability
distribution function. But in many outcomes returns on investment, set of outcomes
is constant. In that situation we compose the function again. In the below
representation f(x) is shown as a cumulative distribution function. f(x) takes all
possible values from to
1)( dxxf (1.5)
If we integrate cumulative distribution function in defined intervals.
F(x) =
dttf )( (1.6)
We redefined the expected value and variance function by extended (1.2) and (1.3)
equations.
E(x)=
dxxxf )( (1.7)
dxxfxExxV i )()]([)( 2
(1.8)
If we define new random number for example Y = a + bx a and b are the constants.
We insert new random number in equation (1.7) and (1.8)
E(a+bx) =
dxxfbxa )()(
= a
dxxf )( +b
dxxxf )(
= a+bE(x) (1.9)
by Equation (1.5) .
V(a+bx) = dxxfbxaEbxa i )()]([ 2

9
= dxxfxbEabxa i )()]([ 2
= dxxfxExb i )()]([ 22
= 2b V(x)
Volatility of Y is (a + bx) = b (x). We can define the equation turn to linear
combination of random variables. For example we suppose that Y = 21 xx and we
redefine equation (1.7).
)(],[ 12212
xfdxxxf
We use equation (1.9) and extension equation (1.7)
21212
211
21 )()()( dxdxxxfxxxxE
212
2121
212
2111
),(),( dxdxxxfxdxdxxxfx
212
211
2122
211
1 ]),([]),([ dxdxxxfxdxdxxxfx
22
2211
11 )()( dxxfxdxxfx
= )( 21 xxE
In this representation we understand that expectation is a linear operator. We apply
the same transaction to the variance operator.
)( 21 xxV 2
21212
21211
),()]([ dxdxxxfxxExx
2
212122112
222
111
),()]}()][([2)]([)]({[ dxdxxxfxExxExxExxEx
2
222
221
112
11 )()]([)()]([ dxxfxExdxxfxEx
dxdxxxfxExxEx 12122111 2
),()]()][([2
= )( 1xV + )( 2xV +2cov( 1x 2x )
10
In this representation we understand that variance operator is a non linear operator.
We called this 2cov( 1X 2X ) term cross-product term. This term is produced from
the dependence of two related terms. If this terms are independent, we can write in
this form.
)()(),( 2121 xfxfxxf
2
222
221
112
11 )()]([)()]([ dxxfxExdxxfxEx
21212211
1 2
),()]()][([2 dxdxxxfxExxEx
this integral simplify to below form.
= dxdxxxfxfxfxExxEx 1212122111 2
),()]()()][()][([
= 2
22221
1111 )()]([)()]([ dxxfxExdxxfxEx
= 0
if two variables are independent of each other the variance is represented by
= )( 1xV + )( 2xV
The Normal distribution also known Gaussian distribution, plays important role in
statistics because normal distribution which appears in a variety of statistical
applications. This theorem tells us that sums of random variables are approximately
normally distributed if the number of observations is large. The normal distribution
has two parameters, the mean, or average, and the standard deviation . The
normal distribution is represented with N( , 2 ). First sembol represent loaction
and the second one represented dispersion.
The distribution function represent with below expression
]))(2/1([
2
22
21)()(
xexxf (1.10)

11
This function is also the main part of the Black-Scholes option pricing model. If
normal distribution with mean zero, unique variance, it is called standart normal
distribution. And function shaped with this expression.
]))(2/1([
2
22
21)()(
xexxf (1.11)
In Figure 1.3 there are some standart deviation values which represents us the
graphics
.
Figure 1.3 : Standart deviation values.
First sembol represent location and the second one represented dispersion. The
normal distribution is explained with two parameters, mean and standart deviation.
We also mention about two parameters more skewness and kurtosis. Skewness is a
measure of the asymmetric properties of distribution function If random numbers are
continuous, It is defined
33 })()]([{ dxxfxEx
(1.12)
If random numbers are not continuous, It is defined

12
3
3
1
)1(
][
N
xx i
N
i (1.13)
The skewness for a normal distribution is zero, and any symmetric random numbers
have a skewness near zero. A negative skew indicates that the tail on the left side
and positive skew indicates that the tail on the right side. The kurtosis describe the
distribution of observed data around the mean. In normal distribution Kurtosis of
normal distribution is 3. If random numbers are continuous, It is defined
44 })()]([{ dxxfxEx
(1.14)
If random numbers are not continuous , It is defined
4
4
1
)1(
][
N
xx i
N
i (1.15)
When we calculate the Value at Risk, we use the term of quantile for measuring the
risk. Quantile functions are used in statistical applications. In statistical
applications, users want to know percentage of a given distribution. Quantiles are
also known percentiles the value which represent a given probability c.
q
qFdxxfqXprobc )(1)()( (1.16)
VaR calculates the worst expected loss over a given time horizon at a given
confidence level under normal conditions. Users want to find the percentage of
standart deviation for a given confidence level. For example our target may be
found VAR at the 95 percent confidence level.
Measuring Returns
Measuring of Value at Risk , outcomes are taken as the rate of return on financial
instruments. For instance instruments are stock and the measurement horizan is 1
day. Returns are measured from the end of the previous day denoted by t-1, and to
the end of current day denoted by t. The discrete rate of return is defined as capital
gain plus coupon D divided by initial price. Rate of return is calculated by below
expression.

13
1
1
t
tttt P
PDPr (1. 17)
tr : Expected Value
tp : Ending value of Financial Instrument
tD : Coupon
1tp : Begining value of Financial Instrument
Another alternative way of defining rate of return is geometric rate which is defined
in terms of logarithm of price ratio. The discrete rate of return plus coupon D divided
by initial price.
1
t
ttt P
DPInr (1.18)
tr : Expected Value
tp : Ending value of Financial Instrument
tD : Coupon
1tp : Begining value of Financial Instrument Time Aggregation
Calculating the Value at Risk requires parameters. Time horizon is the one of this
parameters that define calculating of Value At Risk. The Value at Risk depends on
the time horizon in which the loss is expected to occur. Definition of a period which
to calculate random numbers. random numbers follow a random walk. The time
period is changed in terms of hours days, weeks or months. etc. In this assumption
that no changes are made to the financial instruments during the forecast horizon.
Normally shortest forecast horizon is one day. Using higher frequency data is
generally more efficient. The Expected Value and Variance increase linearly with
time. But volatility increase with the square root of time. annual

14
annual
VAR Calculating
Value at Risk (VaR) has become the standard measure of market risk. And it's most
important advantages is summarizes the risk in a single value. When we compute the
VaR, we follow below steps.
- Current value of financial instrument
- Measure the variability of the risk factors
- Defining the time Horizon
- Defining the confidence level
- Report the VaR
tWMeanVaR 0)( (1.19)
0w : Initial Value of Instrument
: Confidence Level
t : Time Horizon
: Standart Deviation Garch In the ARCH models the conditional variances follow autoregressive processes. The
variance of returns follows a predictable process. This models assume the variance
of the current error term to be a function of the previous time period’s error terms.
The variance is related to the squares of the previous error terms. The main centre of
attention, modelling volatility of the returns has been understanding the
comovements of financial returns. Now we explain the model of ARCH Model. We
suppose that t denote the error terms of the series.
15
t are consisted of a stochastic piece tz and time-dependent standard deviation
t
t = tz t where tz is a Gaussian distribution random variable at 0 with standard deviation equal to 1.
q
iitiqtqtt
1
20
21
210
2 ..... (1.20)
we accept below principles for this equation.
0 >0, i >0, i >0
q
iitiqtqtt yyyy
10110 ..... (1.21)
The volatilities is estimated by Auto Regressive conditional Heteroskedastic
(ARCH) Model. Bollerslev (1986) suggested the generalized ARCH (GARCH)
models. The ARCH model assumes that the variance of returns follows a predictable
return. Model assign weight funtions to the variances. The GARCH(p, q) model has
two parameter p is the order of the GARCH terms 2 and q is the order of the
ARCH terms 2
p
ipti
q
iitiptqtqtqtt
11
2011
21
210
2 ..........
(1.22)
We estimate the 0 i i by using maximum likelihood method from return data.
Assume that the returns are 2 t that are normally distributed and the mean of the
returns are zero.
0 >0, i >0, i >0
2. 2 Computational Approach
In this part we mention about portfolio theory and we develop a optimal portfolio for
our computational problem. We calculate an optimum weight for each stock
(comprising the Istanbul Stock Exchange 30 Index) in our portfolio with the
objective that minimizes Value at Risk(VaR) for a given return level. Our Model
includes x weighted function vector, C Variance - Covariance Matrix and 30 stocks.
In our model expected value and variance(volatility) of portfolio , , and CxxT
16
For computing Variance-Covariance Matrix we have to calculate 30(30+1)/2 number
of transaction. Let me explain the portfolio history and what do we do for
developing optimal portfolio. A portfolio is a collection of assets. The purpose of
construction portfolios using a variety of asset is to reduce risk ratios by
diversification. For Portfolio Theory, Risk is defined by volatility. Portfolio Theory
accept more risk (volatility) for higher return , and accept lower returns for a less
volatile investment. The main purpose of portfolio theory is to assign your
investment between financial instruments to maximize portfolio expected return for a
given risk level or to provide the minimum risk for a given risk level of return. In
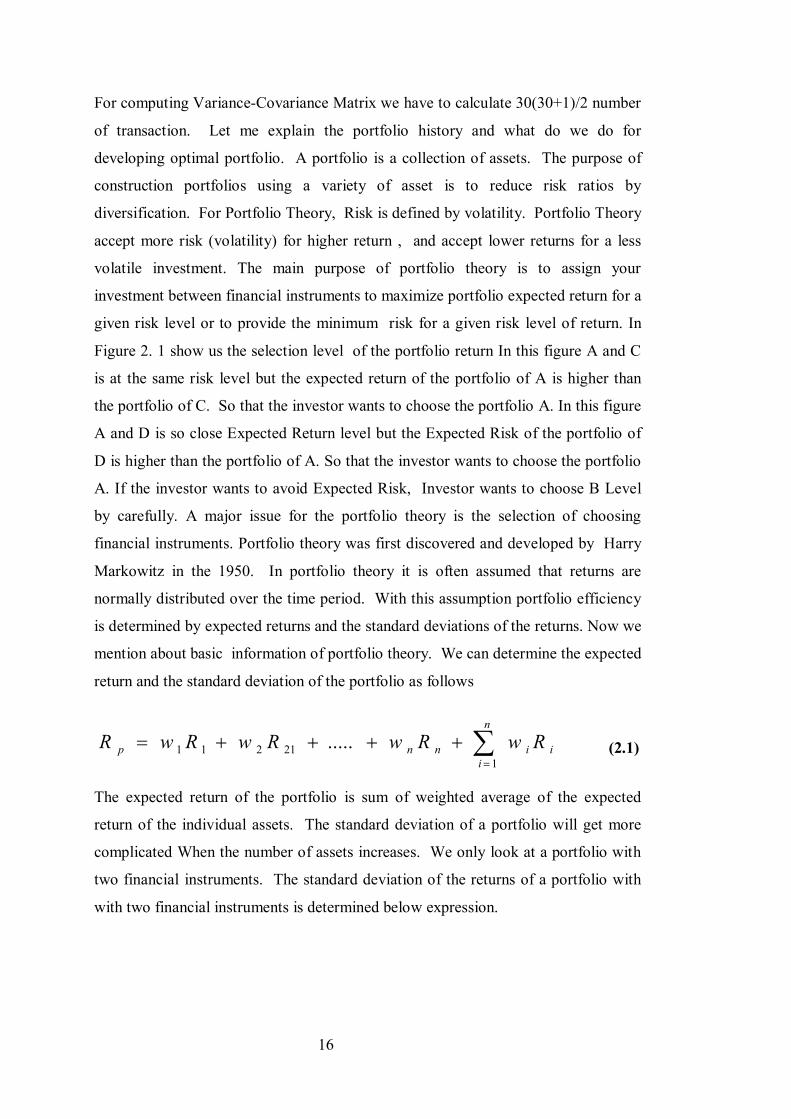
Figure 2. 1 show us the selection level of the portfolio return In this figure A and C
is at the same risk level but the expected return of the portfolio of A is higher than
the portfolio of C. So that the investor wants to choose the portfolio A. In this figure
A and D is so close Expected Return level but the Expected Risk of the portfolio of
D is higher than the portfolio of A. So that the investor wants to choose the portfolio
A. If the investor wants to avoid Expected Risk, Investor wants to choose B Level
by carefully. A major issue for the portfolio theory is the selection of choosing
financial instruments. Portfolio theory was first discovered and developed by Harry
Markowitz in the 1950. In portfolio theory it is often assumed that returns are
normally distributed over the time period. With this assumption portfolio efficiency
is determined by expected returns and the standard deviations of the returns. Now we
mention about basic information of portfolio theory. We can determine the expected
return and the standard deviation of the portfolio as follows
i
n
iinnp RwRwRwRwR
1
21211 ..... (2.1)
The expected return of the portfolio is sum of weighted average of the expected
return of the individual assets. The standard deviation of a portfolio will get more
complicated When the number of assets increases. We only look at a portfolio with
two financial instruments. The standard deviation of the returns of a portfolio with
with two financial instruments is determined below expression.
17
Figure 2. 1 : Expected risk and value.
212211 2 wwRwRwp (2.2)
Sum of the weight functions must be unity. w1 + w2 = 1
It is possible to reduce the risk level of a portfolio by including more financial
instrument in the portfolio. That means the risk of the portfolio is reduced by
diversification. What is the factor that drives the effectiveness of the diversification
of a particular portfolio? The risk formula of a portfolio as defined above, the
effectiveness of the diversification of the portfolio depends on the correlation
coefficient (p) of the two assets in the portfolio. The correlation coefficient show us
relationship between two assets, and it changes between -1 and 1. The absolute
value of the correlation coefficient indicates us the strength of the relationship. The
closer the number is to 1 the stronger the relationship, while the closer the number is
to 0 the weaker the relationship. The signs of the correlation coefficient indicates us
the direction of the relationship. A positive sign means a positive relationship
between the two assets. A negative sign means a negative relationship between the
two assets. We summarize our discussions of the correlation coefficient as follows
* p =1 means that there is an exact positive relationship between the two securities,
i. e. the two move in the same direction.

18
* p = 0 means that there is no relationship between the two variables, i. e. the
relationship is random.
* p = -1 means that there is an exact negative relationship between the two securities,
We compute the correlation value. The formula for the correlation is
])(][)())((
2222 yyxxyxxy
Where
N = Number of observartion
xy =Sum of the product of x and y value
x =Sum of the x
y =Sum of the y
2x =Sum of the square of x
2y =Sum of the square of y
yxyxyx
yYxXEyxyxcorr
))((),cov(),(,
(2.3)
Now show the Vector and Matrix notation of the porttfolio's instruments.
Expected Return Vector = R =
rn
r1
Weight Vector = W =
pn
p1
Expected value E(R) =WT x P (2. 4)
In our study the variance-covariance matrix each of the columns denoted financial
instrument. The variance-covariance matrix computes the covariance between

19
financial instrument. The diagonal elements are the variances of the each of
financial instrument. The Variance-Covariance matrix is symmetric matrix. Our
main purpose of computational problem is to optimize the Variance-Covariance
Istanbul Stock Exchange 30 Index and compute value of the weight functions for a
given return level for computing minimum risk. Now we focus on the computing
Variance-Covariance matrix methods. When we calculate the Variance-Covariance
matrix we use mathematica programing language. We store Istanbul Stock Exchange
30 Index's share datas in SQL Database. We develop method for accessing database
system with mathematica program. In Figure 2.2 explain the summarize of
transaction which we follow for accessing database system.
Figure 2.2 : Connection SQL database with Mathematica.
We compose the Variance-Covariance of Istanbul Stock Exchange 30 Index's share.
We define the expected return level then compute the unknown weight function of
each stock. Now we mention about some method of composing variance covariance
matrix. One of the composing Variance-Covariance matrix is firstly each column of
the matris which is defined value of the each stock's value minus mean of the stock's
value. This matrics is called A matrix. After we calculate the A matrix we product of
transpoze of A vector and divided the result number of observation. Variance-
Covariance (V C) =NVV T
.The other method for computing Variance-Covariance
(VC) matrix is explained below expression. Figure 2. 4 is sample representation of
the variance matrix.
Figure 2.3 : Composing of variance matrix.

20
Figure 2.4 is sample representation of the variance matrix.
Figure 2.4 : Variance matrix.
At first we have to compute variance matrix(V). It concerns standart deviation of the
portfolio’s stocks. On the diagonal elements are the variance of the rii elements.
Correlation matrix is also included correlation between the each of two stocks. In
figure 2. 4 show us correlation between the each of two stocks. On the diagonal
elements are the correlation of the rii elements and it must be unique. In our
computational problem we have considerably 30 variables(stocks). We estimate the
relationships among all of our stock In this study , we have 435 unique correlations
to estimate. We could do the computations 435 times to obtain the correlations. Or
we develop computer program to automatically compute all 435. We developed
program with Wolfram Mathematica. Computing of Variance-Covariance (VC) in
this way We denote portfolio which contains N variable wiht symbol of
Variance of the portfolio is shown below expression. =VCV Models of
portfolio as a weighted combination of stocks. So that we have to define weight
function. Models of portfolio as a weighted combination of stocks. So that we have
to define weight function.
Figure 2.5 : Correlation matrix.

21
Weight Vector = W =
pn
p1
In our study we denoted variance of the portfolio below expression.
WWp '2
In our Computational Problem our main purpose for a given risk level we maximize
the expected value. Our main function of this model is WW '
N
x
N
jijji
N
iii xxxMax
1 112.
In this mathematical expression. N is the number of assets, ij is covariance
between i and j. xi is the stock variable. In our computational problem production
portfolio selection we have two main boundry conditions. One of them is expected
return level.
N
iii Rx
1
The other one is sum of the weight function is equal the unique.

22
N
iix
11
When we gather together all conditions. And xi stock variables are positive numbers.
N
x
N
jijji
N
iii xxxMax
1 112.
N
iix
11
N
iii Rx
1
10 ix i=1, 2…, N
In our preferred model, we solve a set of linear equations using the Multivariate
GARCH model, which is the most precise of the four methods discussed in this
model. We compare the Multivariate garch method with the three well-established
methods for computing VaR, namely, historical simulation, Variance-Covariance
method and Monte Carlo Simulation. After we compute VAR with Multivariate
GARCH model. We have a finite number of assets in which we can invest. We wish
to consider fixed linear combinations of these assets with optimal asset allocations.
Our problem is maximize the expected return which is defined as f(x)
xxxxf ')(
Take the derivative of this quadratic equation, set it equal to 0, and solve for x xxxf 2)('
In our quadratic equation we have 30 variables and we have constraint for sum of our
variables is equal to 1. That means Our solution will involve maximizing a quadratic
objective function of the portfolio weight variables subject to the assets constraint
which says that the sum of the weights must equal 1. We use a standard technique
called a Lagrange Multiplier to deal with the assets constraint. Now we illustrate the
technique. Our function has 31 variables. Now this is set of 31 linear equation in 31
unknown which we can solve using linear algebra. Define vectors and matrices as
follows. We solve the linear equation with the Gauss Siedel method.

23
Now we mention about Gauss Siedel method. After we develop equation model we
select the initial point to start the iteration. After we define the initial point we select
convergence point to stop the iteration.
Ax=b
1,1
31,130,13,1121 .....a
xaxaxaxabx ypbnkasybnkarclk
akbank
1.Equation
…………………………………………………
30,30
29,302,301,3030 .....a
xaxaxabx asybnkakbnk
ykbnk
30.Equation
31,31
31 .................a
xxxbx ykbnkasybnkakbnk
31. Equation
Converge condition
snewi
oldi
newi
ia xxx
100||

24

25
3. VALUE AT RISK MODELS AND GARCH
3. 1 Var
3. 1. 1 Historical simulation
The key assumption in historical simulation is representing what happened over a
specific historical time. Historical simulation involves the set of financial instrument
return changes over a historical time. For example, daily changes over the last two
years. Historical simulations are the simplest way of estimating the Value at Risk for
many portfolios. This method uses historical data for predicting future Value at risk.
The market variables that affect the value of the asset. a time series of returns on the
portfolio. Historical data is changed in each period. Historical data changes are
stored in simulation scenarios. A simulation scenario is created for every risk
condition . Historical Data for which risk is determined on this risk condition are
changed in this scenario. The portfolio uses the simulation scenarios. Value at risk is
determined on the result of profits and losses. We can use many financial instruments
for computing Value at Risk. Examples of such variables are interest rates,
exchange rates, equity prices. When we use a historical simulation we begin with
time series data on financial instrument's historical data. In this method, we do not
use the data to estimate variances and covariances, the changes in the portfolio over
time, this historical information is used to compute the Value at Risk. We are going
back in time such as last 250 days. And we apply the current weight functions to a
time series which is occured of historical datas. We show the return value of the
historical data below expression.
ki
N
ikikp RWR ,
1,,
k=1, 2, …. . , t
Each of the weight function keeps at their current value. This returns do not represent
an actual portfolio. We reconstructs the history of a hypothetical portfolio using
current position. This Figure 3.1 is the example of the daily historical data from 1992

26
to 1998 of Brent Crude Oil. The profits and losses are assumed that expected value
of zero, distributed with normal distribution. The variance is determined using a
statistical estimation. At the end of the transaction Value at Risk is determined by
multiplying the variance by the confidence level in a given time horizon. In our
model we use Istanbul Stock Exchange 30 Index's stocks and Istanbul Stock
Exchange 100 stocks to compute the VaR. Now We describe historical simulation
with following five steps.
Figure 3.1 : Historical data of dollar per barrel.
1. The first step is to determine the market factors and obtain the mark-to-market
value of the financial instruments.
2. The next step is to obtain the historical datas of the financial instruments which we
add to portfolio, included last N periods.
3. In this step we calculate the daily profit and losses of the each of financial
instrument recent last N periods.
4. The next step is to order the mark-to-market profits and losses from highest to
lowest prices.
5. The end of the ordering we select a given confidence level for computing Value at
Risk.
VaR is also computed by entire distrubution of hypothetical returns. This method is
easy to implement. We collect daily historical mark-to-market datas. We can reuse
same data for estiamting VaR. The main advantage of historical simulation is that it

27
makes no assumptions about risk factor changes being from a particular distribution.
Another important advantage of historical simulation is that does not involve the
estimation of any statistical parameters. Disadvantages of historical simulation
requires all risk factors to be available over a reasonably long historical period in
order to give a good representation. if it doesn't collect all datas. it will not represent
good estimation.
3. 1. 2 Variance-Covariance approach
The variance-covariance method is the analytical method for estimating VaR. This
approach assumes a normal distribution of portfolio returns, which requires
estimating the expected return and standard deviation of portfolio. As the number of
financial intruments in a portfolio increases, these calculations can become more
complex and slow. This assumption has little effect on the outcome for short-term.
Figure 3.2 : Confidence level graph.
VaR calculations but is suitable for longer-term measures of VaR. The advantage of
this method is its simplicity. The disadvantage is that the assumption of normal
return distribution. In this method we use variance -covariance matrix for computing
VaR. Variance and covariance are often displayed together in a variance-covariance
matrix. The variances appear along the diagonal and covariances appear in the off-
diagonal elements, as shown below.

28
Where
VC = is a n x n variance-covariance matrix.
iir = is the variance of i:th stock of the portfolio.
ijp = is the covariance for elements from the i:th and j:th
stock of the portfolio.
N = is the number of stock of the portfolio.
3. 1. 3 Monte Carlo simulation
Monte Carlo simulation method is similar to historical method. Monte Carlo
simulation techniques are the most flexible and powerful method. Monte Carlo
simulations can be extended to apply over longer holding periods. It is possible for
Monte Carlo Simulation to estimate credit risk. However, these techniques are the
most expensive computationally. Main difference between historical simulation and
Monte Carlo Simulation that the historical simulation model uses the real observed
returns from the mark-to-market value of financial instruments over the last N
periods to generate N hypothetical portfolio profits or losses, whereas in the Monte
Carlo simulation produce pseudo numbers of hypothetical changes in the market.
These new values are used to construct thousands of hypothetical profits and losses
on the current portfolio, and the subsequent distribution of possible portfolio profit
or loss. Finally, the VaR is determined from this distribution at a given confidence
level. On this time after we compute the VaR similar ways of computing VaR with
Historical simulation. Now We describe Monte Carlo simulation with following five
steps.

29
1. The first step is scenario generation. We use the volatility and correlation
estimates for the underlying assets in our portfolio, we produce a large number of
pseude number according to make up financial instruments returns.
2. The next step is to obtain the pseude numbers of the financial instruments which
we add to portfolio, included last N periods.
3. In this step we calculate the daily profit and losses of the each of financial
instrument recent last N periods.
4. The next step is to order the mark-to-market profits and losses from highest to
lowest prices.
5. The end of the ordering we select a given confidence level for computing
Value at Risk. In Figure 3. 3 show us the life cycle of computing VaR with Monte
Carlo simulation. Monte Carlo Simulation is the most powerful method for
computing Value at Risk. Monte Carlo Method can compute for wide range of risk
which include non-linear return price, volatility risk and it can include model risk. It
is flexible for extreme senario and fat tails. Risk factors models can be fitted using
different distributional specifications, including non-normal distributions with Monte
Carlo simulation
Figure 3.3: Monte Carlo histogram.
30
3. 2 GARCH
3. 2. 1 Arch models For the financial institutions, today's global and highly volatile market's risk has
become a very important factor. Because for the risk managers seeking to hold
efficient portfolio is the main purpose, is correlation between the financial
instruments to be included in the portfolio. Until recently, correlation and variance
assumed that to be constant over time. However all of emprical studies that
attempted to verify this finding, have failed to accept of this assumption. In fact,
most experienced practitioners would accept that correlations increase in periods of
high volatility and characteristic of correlation is affected by volatility. The financial
instruments allocation decision entails, an assessment of the risks and returns of the
various assets in the opportunity set. Chosing of an optimal portfolio requires a
predict of the covariance matrix of the returns. Similarly, the calculation of the
standard deviation of today's portfolio requires a covariance matrix of all financial
insturments in the portfolio. These functions require estimation and forecasting of
very large covariance matrices. Over the past 20 years, a considerable literature has
been developed and the dynamics of the covariance of financial instruments have
been explored although the primary focus has been on univariate volatilities and not
on correlations (covariances). In fact, in the multivariate arch/garch literature one of
the most relevant problems is represented by the high number of parameters. Recent
developments in financial econometrics suggest the use of non-linear time series
structures to model the risk and expected return. Bera and Higgins (1993, p. 315)
remarked that a major contribution of the ARCH literature is the finding that
apparent changes in the volatility of economic time series may be predictable and
result from a specific type of non-linear dependence rather than exogenous structural
changes in variables. The assumption base on constant volatility over specific period
is statistically inefficient and inconsistent concept to use volatility on this acceptance
when the series moves through time. In this case of financial returns, large returns
are followed by more large returns, and small returns by more small returns. This
suggests that returns are serially correlated to each other. Homoskedasticity is to be
defined as the expected value of all error terms, when squared, is the same at any
given point. But ARCH and GARCH models focus on the reverse assumption of this
description. The returns in which the variances of the error terms are not equal, in

31
which the error terms may reasonably be expected to be larger for some points or
ranges of the data than for others. This assumption is called heteroskedasticity. So
that this assumption, arch and garch models treat heteroskedasticity as variance to be
modeled. Model of prediction is computed for the variance of each error term. In
generally prediction use in financial application. Now we explain two basic
econometric models, the linear regression model and the autoregressive model, to
illustrate the meaning of homoskedasticity or heteroskedasticity in each case. Linear
regression represents a proportionality relationship between two variables.
y = + x+ (3.1)
When we predict variable y is times the expectation of the variable x plus a
constant . The relation between between y and x is not exact. There is a differences
between y and x. amount of . In standard regression theory, the error is
assumed to have a zero mean and a constant standard deviation . We illustrate the
standard deviation is the square root of the variance.
2 =E( 2 )
That means that measure of the error is positive. This homoskedastic assumption
accept that size of error constant and does not depend on the size of the variable x.
But heteroskedastic the assumption accept that size of the error term is not constant
In many cases, homoskedasticity is model reasonable assumption for the wide range
of variable. Now we assume that X(t) the value of an economic time series at time t.
We know that economic time series are considered to be realizations of stochastic
processes. That means each point of an economic time series is a random variable. In
particular, we can consider the distribution f(t) of each variable X(t) at each moment.
We mention about arch/garch behavior, focusing on the error process. We assume
that the conditional mean of the errors is zero. We write the error expression as
t = tz t
where t is the conditional standard deviation and the tz terms are a sequence of
independent, zero-mean, unit-variance, normally distributed variables. In financial
and economic models. We estimate the future values with present and past value of
variables. We express the autoregressive model:

32
1101 ..... tntqtt xxx (3.2)
t is conditional term of the equation.
The other autoregressive model is random walk price model expression is
tttt pp 1 (3. 3)
In terms of returns, the random walk model is simply
ttt pr (3.4)
In two equation (3.3) and (3.4). We have introduced two different types of
heteroskedasticity. In equation (3.3), Errors depend on the value of the independent
variables. The average error is larger when the independent variable is larger. In
equation (3.4), however, error terms are conditionally heteroskedastic because they
vary with time and do not necessarily depend on the value of the process variables.
Every model is characterized by a different specification of heteroskedasticity. So
that arch / garch behavior of the error term depends on chosen of model. The other
important concept of capture the time dependency of the variance is to use short
given time horizon. One of the sugestion is deviation or variance could be calculated
every day using the most recent month (22 business days) of data. This sugestion
assumes that the variance of tomorrow’s return model is an equally weighted average
of the squared residuals of the last 22 days. In the ARCH model proposed by Engle
(1982). Arch model forecasts the variance with below expression.
q
iitith
1
20 (3.5)
In this model weight functions must be estimated. Arch model allows that compute
the best weight function value for forecasting variance. We compute the coeffiencts
i with the past throught datas. We can form the errors with this expression. Where
z(t) are the independent variables, standard normal variables and We must be sure
that in equation (3.5)
33
t = tt zh (3.6)
Where z(t) are the independent variables, standard normal variables and We must bu
sure that in equation (3.5) and variance is non negative.
q
ii
11
3. 2. 2 Garch models
A generalization of ARCH model is the GARCH parameterization introduced by
Bollerslev (1986). And model shape in this form.
p
ipti
q
iitiptqtqtqtt
11
2011
21
210
2 .......... (3.7)
where we esitmate by using maximum likelihood method from return data. Assume that the returns are t
2 that are normally distributed, and the mean of the returns are zero.
0 >0, i >0, i >0
For our computatinol problem we denoted the vector and the matrix representation of
the Garch Models. We suppose that a stochastic vector process {rt} with dimension
N x 1 and Ert = 0. Ft-1 denote the information set generated by the observed series
frtg up to and including time t - 1. We assume that rt is conditionally heteroskedastic
vector.
ttt Hr 2/1
given the information set Ft-1, where the N x N matrix Ht = [hij,t] is the conditional
covariance matrix of rt and t is an iid vector error process such that E t ' t = I.
There is no linear dependence structure in {rt}. Rt is a vector of log-returns of N
assets. What remains to be specified is the matrix process Ht. Various parametric
formulations will be reviewed in the following subsections. We modelled conditional
covariance matrix Ht.
p
iti
q
ijtjtit HvechrrvechAHvech
11
1
'0 )()()( (3. 8)
34
Where conditions for Ht to be positive definite for all t 0 . is an N(N + 1)/2 x 1
vector, and Aj and Bj are N(N + 1)/2 x N(N + 1)/2 parameter matrices.
3. 2. 3 Qgarch models
Most of the time distribution of returns can be skewed. For example, for some stock
market indices, retums are skewed to the left. This means that there are more
negative returns than positive outcome observations. On this situation Garch model
is not enough to estimate the volatility. For this reason a new modification is made
for Garch models to compute for the skewed distribution. The Quadratic GARCH
model (QGARCH) proposed by Engle and Ng (1993). And Quadratic GARCH
(QGARCH) developed by Sentana (1995) is used to model symmetric effects of
positive and negative shocks. In this model we formed the expression as follow:
t = tz t
where zt independent identically distribution.
1122
112
102
ttttt (3.9)
3. 2. 3 Egarch models
One of the advantages of Garch Models capture the thick tail returns and volatility
clustering. But it is not well-established to capture the leverage effect. In equation
(3.6) conditional variance is a function only of the magnitudes of the lagged residuals
but not their signs. For this reason (1991) Nelson developed EGARCH(Exponential
General AutoRegressive Conditional Heteroskedastic) models both for size and sign
of the lagged residual. It is shown as:
p
iti
q
iikit InzgwIn
11
2
1
2 )()()( (3.10)
3. 3 Var Risk with Garch
Multivariate GARCH models can also be used to estimate VaR. To estimate VaR
using GARCH, obtain return of stocks for the portfolio and then fit the model to
these returns. In this part we evaluate the performance of GARCH models for
computing Valueat-Risk (VaR) of our diversified portfolios which include in the

35
Istanbul Stock Exchange 30 Index's stocks, using a number of distributional
assumptions and sample sizes. We compute the return value of each stocks. The
choice of return of stock's size is important for computing VaR, whereas the
specification of the conditional mean is in different distributions are able to produce
better VaR forecasts. With model we first obtain the returns of the each of Istanbul
Stock Exchange 30 Index's stocks. Obtaining of return is shown follow expression.
)/( 1 ttt SSIny
denote the return from time t - 1 to t We assume that the time series of interest
ttt yEy )( 1
E is the conditional mean operator.
The conditional mean return is autoregressive process, AR(q)
q
iit yccyE
10)(
t can be expressed as an ARCH process in the following form.
t = tz t
where z(t) is independently and identically distributed random variables with mean
zero and unit variance. t is the conditional variance. As we mention before that
Engle (1982) introduced the ARCH(q) model q.
q
iitit
1
20
2 (3.11)
As we remember that the conditional variance to be positive and the parameters of
equation (3.10) must satisfy 0 >0, i >0, I=1, 2, …. , q And again we remember
that Bollerslev (1986) proposed the generalized ARCH or GARCH(p; q), model.

36
p
iti
q
iitit
1
21
1
20
2 (3.12)
where must satisfy 0 >0, i >0, i=1, 2, …. , q and i >0 I=1, 2, …, q
For computing VaR wiht Garch Model we obtain the return of each stocks. The
Variance-Covariance matrix is modeled by returning of Garch Model results. After
we modeled the Variance-Covariance matrix, we denoted below expression we apply
same steps of computing of the variance-covariance method.
W is weighting function vector of each stock. In our study we denoted variance of
the portfolio below expression
wwp '2
After we compute the variance we apply classical steps to compute VaR.
twMeanVaR 0)( (3.13)
0w : Initial Value of Instrument
: Confidence Level
t : Time Horizon

37
4. EMPRICAL APPROACH
4. 1 Obtaining of Data and Data Analysis
In this part, We mention about the our data set. The Istanbul Stock Exchange Index
consists of National market , Second National market, New Economical Market,
Funds Market, Watch List Market. National Market is the biggest market in this
market. We classify National Market in three part IMKB100 Index, IMKB50 Index,
IMKB30 Index. In our study we focus on the Istanbul Stock Exchange 30 Index’s
stock. In Table 4.1 show us the market value of each stock. We study with this
Table 4.1 : Market value of the company. Stock Code Stock Name Value of Stock AKBNK Akbank 31.040.000.915 TL ARCLK Arçelik 5.378.794.905 TL ASYAB Asya Bank 2.339.999.914 TL BIMAS Bim Birleşik Mağazalar 7.893.600.000 TL DOHOL Doğan Holding 2.768.499.988 TL DYHOL Doğan Yayın Holding 1.480.000.019 TL ECILC Eczacıbaşı İlaç 1.293.770.882 TL ENKAI Enka İnşaat 13.507.999.706 TL EREGL Ereğli Demir Çelik 6.944.000.244 TL GARAN Garanti Bankası 30.828.000.640 TL ISCTR İş Bankası 23.399.843.141 TL KRDMD Kardemir D 54.1272.585 TL KCHOL Koç Holding 18.741.486.952 TL KOZAA Kozaa Anadolu Metal 956.617.166 TL PETKM Petkim 2.700.000.047 TL SAHOL Sabancı Holding 14.894.920.389 TL SKBNK Şeker Bank 1.200.000.017 TL SISE Şişe Cam 4.678.960.174 TL HALKB Halk Bankası 15.625.000.000 TL TAVHL TAVHavalimanları 2.695.545.047 TL TKFEN TekfenHolding 2.190.400.028 TL TEBNK Türk.EkonomiBankası 4.761.482.589 TL TOASO Tofaş Otomobil Fabrikası. 3.839.999.914 TL TCELL Turkcell 20.151.999.664 TL TUPRS Tüpraş 11.218.771.008 TL THYAO TürkHavaYolları 4.429.999.828 TL TTKOM TürkTelekom 27.720.000.267 TL VAKBN VakıflarBankası 9.750.000.238 TL VESTL Vestel 845.349.113 TL YKBNK YapıveKrediBank. 18.692.315.829 TL
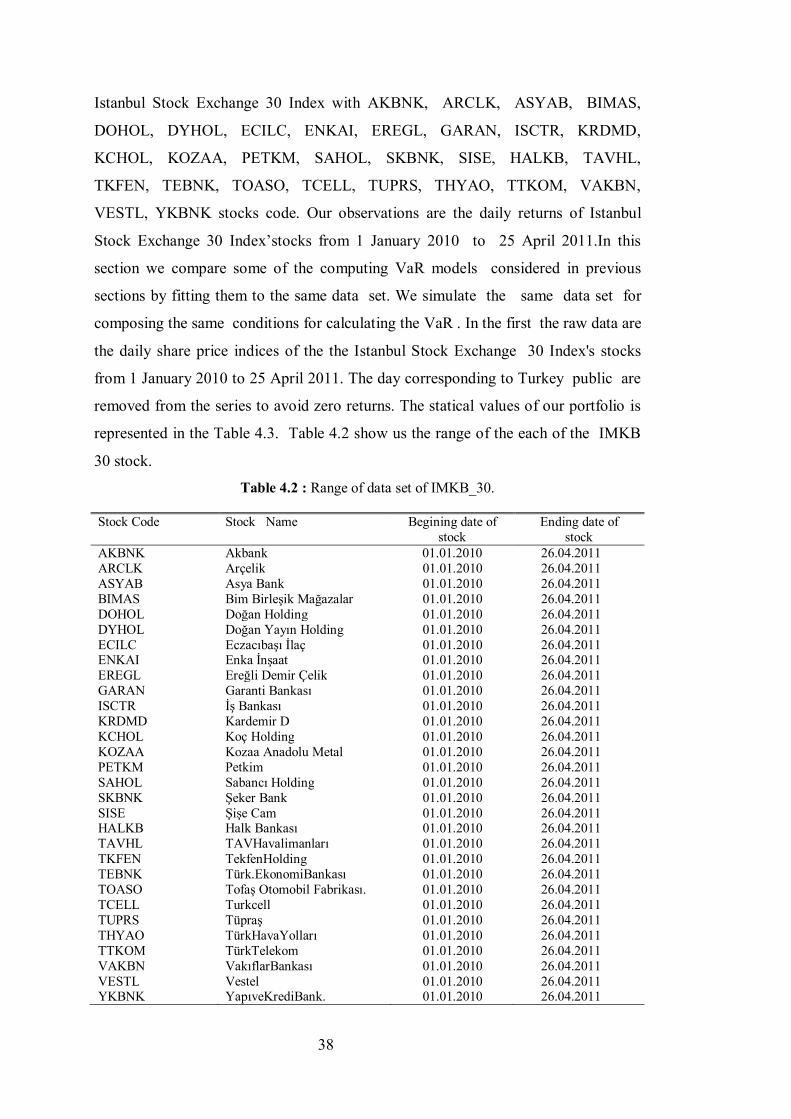
38
Istanbul Stock Exchange 30 Index with AKBNK, ARCLK, ASYAB, BIMAS,
DOHOL, DYHOL, ECILC, ENKAI, EREGL, GARAN, ISCTR, KRDMD,
KCHOL, KOZAA, PETKM, SAHOL, SKBNK, SISE, HALKB, TAVHL,
TKFEN, TEBNK, TOASO, TCELL, TUPRS, THYAO, TTKOM, VAKBN,
VESTL, YKBNK stocks code. Our observations are the daily returns of Istanbul
Stock Exchange 30 Index’stocks from 1 January 2010 to 25 April 2011.In this
section we compare some of the computing VaR models considered in previous
sections by fitting them to the same data set. We simulate the same data set for
composing the same conditions for calculating the VaR . In the first the raw data are
the daily share price indices of the the Istanbul Stock Exchange 30 Index's stocks
from 1 January 2010 to 25 April 2011. The day corresponding to Turkey public are
removed from the series to avoid zero returns. The statical values of our portfolio is
represented in the Table 4.3. Table 4.2 show us the range of the each of the IMKB
30 stock.
Table 4.2 : Range of data set of IMKB_30.
Stock Code Stock Name Begining date of stock
Ending date of stock
AKBNK Akbank 01.01.2010 26.04.2011 ARCLK Arçelik 01.01.2010 26.04.2011 ASYAB Asya Bank 01.01.2010 26.04.2011 BIMAS Bim Birleşik Mağazalar 01.01.2010 26.04.2011 DOHOL Doğan Holding 01.01.2010 26.04.2011 DYHOL Doğan Yayın Holding 01.01.2010 26.04.2011 ECILC Eczacıbaşı İlaç 01.01.2010 26.04.2011 ENKAI Enka İnşaat 01.01.2010 26.04.2011 EREGL Ereğli Demir Çelik 01.01.2010 26.04.2011 GARAN Garanti Bankası 01.01.2010 26.04.2011 ISCTR İş Bankası 01.01.2010 26.04.2011 KRDMD Kardemir D 01.01.2010 26.04.2011 KCHOL Koç Holding 01.01.2010 26.04.2011 KOZAA Kozaa Anadolu Metal 01.01.2010 26.04.2011 PETKM Petkim 01.01.2010 26.04.2011 SAHOL Sabancı Holding 01.01.2010 26.04.2011 SKBNK Şeker Bank 01.01.2010 26.04.2011 SISE Şişe Cam 01.01.2010 26.04.2011 HALKB Halk Bankası 01.01.2010 26.04.2011 TAVHL TAVHavalimanları 01.01.2010 26.04.2011 TKFEN TekfenHolding 01.01.2010 26.04.2011 TEBNK Türk.EkonomiBankası 01.01.2010 26.04.2011 TOASO Tofaş Otomobil Fabrikası. 01.01.2010 26.04.2011 TCELL Turkcell 01.01.2010 26.04.2011 TUPRS Tüpraş 01.01.2010 26.04.2011 THYAO TürkHavaYolları 01.01.2010 26.04.2011 TTKOM TürkTelekom 01.01.2010 26.04.2011 VAKBN VakıflarBankası 01.01.2010 26.04.2011 VESTL Vestel 01.01.2010 26.04.2011 YKBNK YapıveKrediBank. 01.01.2010 26.04.2011

39
All the data are collected on the same dates across the stock exchanges and there
are 322 observations for each series are used to calculate theVaRs. Data are
retrieved from the Finance data bank in www. hsbc. com. tr web site. And After we
collected all the datas from www. hsbc. com. tr web site.
Table 4.3 : Statical value of IMKB30 stocks for 322 observation.
Stock Code Count Mean Std Skewness Kurtosis Jargue-Bera Probability AKBNK 322 -8. 99E-05 0. 025573 -3. 212610 36. 89327 15966. 33 0. 000
ARCLK 322 0. 001397 0. 023063 0. 020981 7. 328381 251. 3833 0. 000 ASYAB 322 -0. 000171 0. 022400 -0. 167915 4. 744587 42. 34790 0. 000
BIMAS 322 0. 001153 0. 018279 0. 017222 4. 434271 27. 61579 0. 000 DOHOL 322 0. 000748 0. 021282 1. 057628 8. 941870 533. 7167 0. 000 DYHOL 322 0. 001374 0. 031333 1. 692021 12. 42066 1344. 358 0. 000 ECILC 322 0. 000223 0. 027475 0. 715861 18. 72354 3344. 502 0. 000 ENKAI 322 4. 43E-06 0. 028229 0. 678956 35. 96222 14602. 06 0. 000 EREGL 322 -0. 000615 0. 026418 -5. 311612 52. 23987 34043. 68 0. 000
GARAN 322 0. 000906 0. 022829 0. 029698 3. 397503 2. 167283 0. 000 ISCTR 322 0. 000902 0. 020934 0. 144117 4. 352587 25. 66032 0. 000 KRDMD 322 0. 001331 0. 023476 0. 656007 5. 708285 121. 5038 0. 000 KCHOL 322 0. 001974 0. 021025 0. 486574 5. 687251 109. 5918 0. 000 KOZAA 322 0. 000503 0. 020976 -0. 239699 4. 628636 38. 67057 0. 000
PETKM 322 0. 001593 0. 018877 1. 103197 9. 916655 707. 1695 0. 000 SAHOL 322 0. 001180 0. 020536 0. 525089 5. 616115 106. 6213 0. 000 SKBNK 322 0. 000264 0. 019976 -0. 487506 4. 755801 54. 11592 0. 000
SISE 322 0. 002390 0. 020160 0. 187403 4. 244442 22. 66229 0. 000 HALKB 322 0. 000605 0. 023959 0. 641931 6. 053466 147. 2071 0. 000 TAVHL 322 0. 001716 0. 021559 -0. 257307 4. 662014 40. 61385 0. 000
TKFEN 322 0. 001062 0. 022021 -0. 207263 3. 874464 12. 56498 0. 000
TEBNK 322 -0. 000484 0. 026157 1. 033070 10. 61020 834. 3025 0. 000 TOASO 322 0. 002174 0. 023690 -0. 098426 4. 951088 51. 59373 0. 000
TCELL 322 -0. 000729 0. 018345 -0. 992201 6. 459598 213. 4145 0. 000
TUPRS 322 0. 001760 0. 021422 -0. 021013 4. 223851 20. 11935 0. 000
THYAO 322 -0. 000433 0. 025047 -0. 191530 10. 19664 696. 8401 0. 000
TTKOM 322 0. 001808 0. 017383 -0. 508617 4. 515221 44. 68637 0. 000
VAKBN 322 0. 001134 0. 032514 1. 854672 17. 51020 3009. 427 0. 000 VESTL 322 0. 000286 0. 020802 0. 377352 7. 386384 265. 7834 0. 000 YKBNK 322 0. 001515 0. 021698 -0. 050829 4. 113361 16. 76958 0. 002

40
We compare datas with other datasource. Datas are corrected by hedefonline
website.We download java matrix program and compare datas with this application.
Appendix A parts presents the time plot of the series, which fluctuate on a daily
and longer term basis. Data are for the sample period between January 1, 2010
and April 26, 2011, amounting to 322 trading days. We show the daily return end
of day The Istanbul Stock Exchange 30 Index's. Stock Value in Part of Appendix C.
After we arrange data set we check the data set for our VaR computation case, We
examine the mean , variance , skewness, and kurtosis of the returns. The mean,
variance, skewness, and excess kurtosis of the returns are shown in the Table 4.3.
In Appendix Part we illustrate the each of stocks histograms. The third moment of
the normal distribution function is skewness. When referring to the shape of
frequency or probability distributions, skewness refers to asymmetry of the
distribution. The skewness value can be positive or negative, or even undefined . A
distribution with an asymmetric tail extending out to the right is referred to as
positively skewed or skewed to the right, while a distribution with an asymmetric
tail extending out to the left is referred to as negatively skewed or skewed to the
left. Skewness can range from minus infinity to positive infinity. While a
distribution with a symmetric means, skewness of the distribution equals to zero. In
our portfolio when we look at the Table 4.3 AKBNK, ASYAB, EREGL, KOZAA,
SKBNK, TAVHL, TCELL, TOASO, TUPRS , TKFEN, THYAO, TTKOM,
YKBNK stocks have negative skewed , skewed to the left and ARCLK, BIMAS,
DOHOL DYHOL, ECILC , ENKAI , GARAN ISCTR, KRDMD , KCHOL,
PETKM, SAHOL, SISE, HALKB , TEBNK, VAKBN, VESTL stocks have
positive skewed , skewed to the right. When we look at the Table 4.3, EREGL has
the lowest skewness, and VAKBN has the higgest skewness. BIMAS is the so close
the value of the zero. That means BIMAS is so close to normal distribution. The
fourth moment of the normal distribution function is kurtosis. The kurtosis describe
the distribution of observed data around the mean. In normally Kurtosis of normal
distribution is 3. When we look at the Table 4.3, we recognize that EREGL has the
maximum value of kurtosis mean that if EREGL has a maximum risk. The other
parameter which control the normal distribution function is Jargue-Bera coefficient
(JB). When Jargue-Bera coefficient (JB) is bigger then three and probability
coefficient is smaller than %1 that means Each of the stock series is appropriate
for normal distribution. When we investigate the Table 4.3. We recognize that none
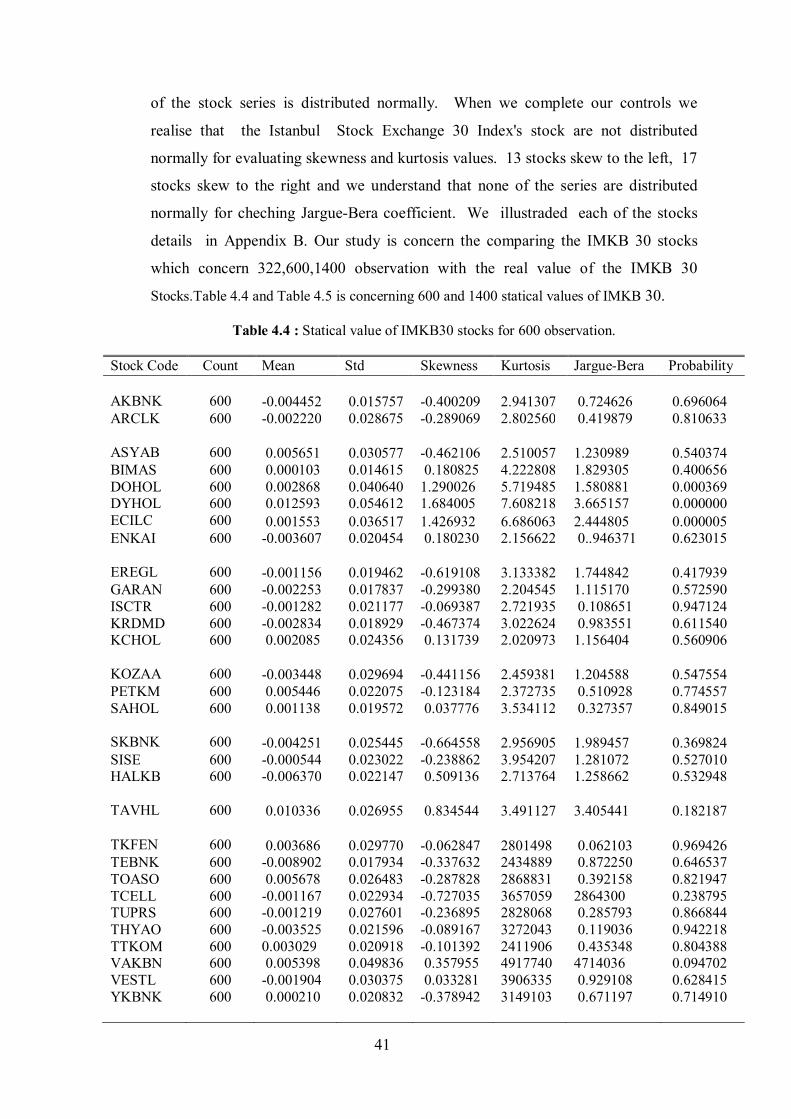
41
of the stock series is distributed normally. When we complete our controls we
realise that the Istanbul Stock Exchange 30 Index's stock are not distributed
normally for evaluating skewness and kurtosis values. 13 stocks skew to the left, 17
stocks skew to the right and we understand that none of the series are distributed
normally for cheching Jargue-Bera coefficient. We illustraded each of the stocks
details in Appendix B. Our study is concern the comparing the IMKB 30 stocks
which concern 322,600,1400 observation with the real value of the IMKB 30
Stocks.Table 4.4 and Table 4.5 is concerning 600 and 1400 statical values of IMKB 30.
Table 4.4 : Statical value of IMKB30 stocks for 600 observation.
Stock Code Count Mean Std Skewness Kurtosis Jargue-Bera Probability AKBNK
600 -0.004452 0.015757 -0.400209 2.941307 0.724626 0.696064
ARCLK 600 -0.002220 0.028675 -0.289069 2.802560 0.419879 0.810633 ASYAB
600 0.005651 0.030577 -0.462106 2.510057 1.230989 0.540374
BIMAS 600 0.000103 0.014615 0.180825 4.222808 1.829305 0.400656 DOHOL 600 0.002868 0.040640 1.290026 5.719485 1.580881 0.000369 DYHOL 600 0.012593 0.054612 1.684005 7.608218 3.665157 0.000000 ECILC 600 0.001553 0.036517 1.426932 6.686063 2.444805 0.000005 ENKAI 600 -0.003607 0.020454 0.180230 2.156622 0..946371 0.623015 EREGL
600
-0.001156 0.019462 -0.619108 3.133382 1.744842 0.417939
GARAN 600 -0.002253 0.017837 -0.299380 2.204545 1.115170 0.572590 ISCTR 600 -0.001282 0.021177 -0.069387 2.721935 0.108651 0.947124 KRDMD 600 -0.002834 0.018929 -0.467374 3.022624 0.983551 0.611540 KCHOL 600 0.002085 0.024356 0.131739 2.020973 1.156404 0.560906 KOZAA
600 -0.003448 0.029694 -0.441156 2.459381 1.204588 0.547554
PETKM 600 0.005446 0.022075 -0.123184 2.372735 0.510928 0.774557 SAHOL 600 0.001138 0.019572 0.037776 3.534112 0.327357 0.849015 SKBNK
600 -0.004251 0.025445 -0.664558 2.956905 1.989457 0.369824
SISE 600 -0.000544 0.023022 -0.238862 3.954207 1.281072 0.527010 HALKB 600 -0.006370 0.022147 0.509136 2.713764 1.258662 0.532948 TAVHL
600 0.010336 0.026955 0.834544 3.491127 3.405441 0.182187
TKFEN
600 0.003686 0.029770 -0.062847 2801498 0.062103 0.969426
TEBNK 600 -0.008902 0.017934 -0.337632 2434889 0.872250 0.646537 TOASO 600 0.005678 0.026483 -0.287828 2868831 0.392158 0.821947 TCELL 600 -0.001167 0.022934 -0.727035 3657059 2864300 0.238795 TUPRS 600 -0.001219 0.027601 -0.236895 2828068 0.285793 0.866844 THYAO 600 -0.003525 0.021596 -0.089167 3272043 0.119036 0.942218 TTKOM 600 0.003029 0.020918 -0.101392 2411906 0.435348 0.804388 VAKBN 600 0.005398 0.049836 0.357955 4917740 4714036 0.094702 VESTL 600 -0.001904 0.030375 0.033281 3906335 0.929108 0.628415 YKBNK 600 0.000210 0.020832 -0.378942 3149103 0.671197 0.714910

42
Table 4.5 : Statical value of IMKB30 stocks for 1400 observation.
Stock Code Count Mean Std Skewness Kurtosis Jargue-Bera Probability AKBNK
1400 -0.000918 0.036052 -3779531 3041770 3269183 0.000000
ARCLK 1400 0.001825 0.031924 0.186076 5618252 2826637 0.000001 ASYAB
1400 0.000254 0.027357 -0.519298 3878609 7479654 0.023758
BIMAS 1400 0.001044 0.021570 0.201478 4482919 9544087 0.008463 DOHOL 1400 0.001500 0.027431 1350040 8364169 1457616 0.000000 DYHOL 1400 0.001307 0.037232 1779692 1208822 3850289 0.000000 ECILC 1400 -0.000781 0.034520 0.997777 6109976 5518567 0.000000 ENKAI 1400 -0.002014 0.044353 0.736635 1974747 1142370 0.000000 EREGL
1400 -0.003391 0.032119 -5048079 4028900 6031791 0.000000
GARAN 1400 0.001145 0.027137 0.131654 3420422 0.994595 0.608172 ISCTR 1400 -0.000761 0.029845 1351080 6815618 8835329 0.000000 KRDMD 1400 0.001750 0.024191 0.270527 4139702 6432956 0.040096 KCHOL 1400 0.002440 0.026985 0.853976 5515884 3737238 0.000000 KOZAA
1400 -0.001672 0.028479 -0.159768 3527002 1535167 0.464133
PETKM 1400 7.28E-05 0.028646 0.886293 6110279 5179758 0.000000 SAHOL 1400 0.003443 0.026828 1183989 6799051 8099544 0.000000 SKBNK
1400 0.001314 0.024294 0.264547 4020376 5339482 0.069270
SISE 1400 -4.35E-05 0.021915 0.584275 4732091 1764450 0.000147 HALKB 1400 -0.001781 0.023078 -0.714444 3813902 1092931 0.004234 TAVHL
1400 0.002034 0.028604 -0.250673 3906893 4339953 0.114180
TKFEN
1400 -0.003135 0.021262 -0.905706 4437257 2161048 0.000020
TEBNK 1400 -0.002052 0.032563 0.198654 4643892 1156012 0.003089 TOASO
1400 -0.002175 0.031390 0.110707 1021064 2103378 0.000000
TCELL
1400 0.000164 0.027574 0.043239 2983403 0.031339 0.984453
TUPRS
1400 0.002120 0.026667 -0.702265 4429244 1622908 0.000299
THYAO
1400 0.000517 0.020177 -1027010 5444827 4120956 0.000000
TTKOM
1400 0.000211 0.024485 -0.175336 3681187 2372405 0.305379
VAKBN 1400 0.003983 0.052511 1350110 8228785 1399685 0.000000 VESTL 1400 -0.001223 0.028698 0.527426 5793408 3603485 0.000000 YKBNK
1400 0.002708 0.024886 0.253892 3539719 2219450 0.329650
In Table 4.6 show us the market value of each stock. We study with this concerning
100 Istanbul Stock Exchange with ACIBD ,ADANA ,ADBGR ,ADNAC ,ADEL
,SASA,AFMAS,AFYON,AKENR,AKYO,AKALT,AKBNK,AKCNS,AKFEN,ATE

43
KS,AKMGY,AKSA,AKSEN,AKGRT,AKSUE,TUPRS,ALCAR,ALGYO,ALARK,
ALBRK,ALCTL,ALKA,ALKIM,ARFYO,ALNTF,ALYAG,ALTIN,AYCES,ANAC
M,AEFES,ANHYT,ASUZU,ANSGR,ANELE,ANELT,THYAO,ARCLK,ARENA,
ARMDA,ARSAN,ASELS,ASLAN,ASYAB,ATAYO,AGYO,ATSYO,ATLAS,AVI
VA,AVRSY,AYEN,AYGAZ,BAGFS,BAKAB,BANVT,BSKYO,BTCIM,BSOKE,
DYHOL,BERDN,BJKAS,BIMAS,BRKO,BRMEN,BISAS,BOLUC,BROVA,BRSA
N,BRYAT,BFREN,BOSSA,PETKM,BOYNR,BRISA,BSHEV,BUMYO,BURCE,B
URVA,BUCIM,CARFA,CARFB,CEYLN,TTKOM,CCOLA,CRDFA,CBSBO,PRT
AS,CLEBI,CELHA,CEMAS,CEMTS,CMBTN,CMENT,CIMSA,DARDL,DGATE
stocks code. Our observations are the daily returns of concerning 100 Istanbul Stock
Exchange from 01. November .2010 to 25 April 2011 .All the data are collected
on the same dates across the stock exchanges and there are 158 observations for
each series are used to calculate theVaRs. Data are retrieved from the Finance data
bank in www. hsbc. com. tr web site. And After we collected all the datas from
www. hsbc. com. tr web site, We compare datas with other datasource. Datas are
corrected by hedefonline website. We download java matrix program and compare
datas with this application. Data are for the sample period between Nov 1, 2010
and April 26, 2011, amounting to 158 trading days. All the data are collected on
the same dates across the stock exchanges and there are 158 observations for
each series are used to compare theVaRs. Data are retrieved from the Finance data
bank in www. hsbc. com. tr web site. And After we collected all the datas from
www. hsbc. com. tr web site, We compare datas with other datasource. Datas are
corrected by hedefonline website. We download java matrix program and compare
datas with this application. Data are for the sample period between November 1,
2010 and April 26, 2011, amounting to 158 trading days.In Table 4.7 shows us the
range of the data set which concern 100 IMKB Stocks. Some of the stocks are in the
both IMKB 30 stocks and 100 IMKB stocks list.We use this same stocks in same list
of tables.We use for this same share stocks in same range area.We use 322 trail day
for IMKB 30 stocks and we use 158 trading days for 100 IMKB stocks.One of the
most important thing that we use the same share stocks in the two portfolio we spend
less time for gathering data.We use same data range in IMKB 30 and 100 IMKB
stocks for calculating value at risk and computing computational problem.
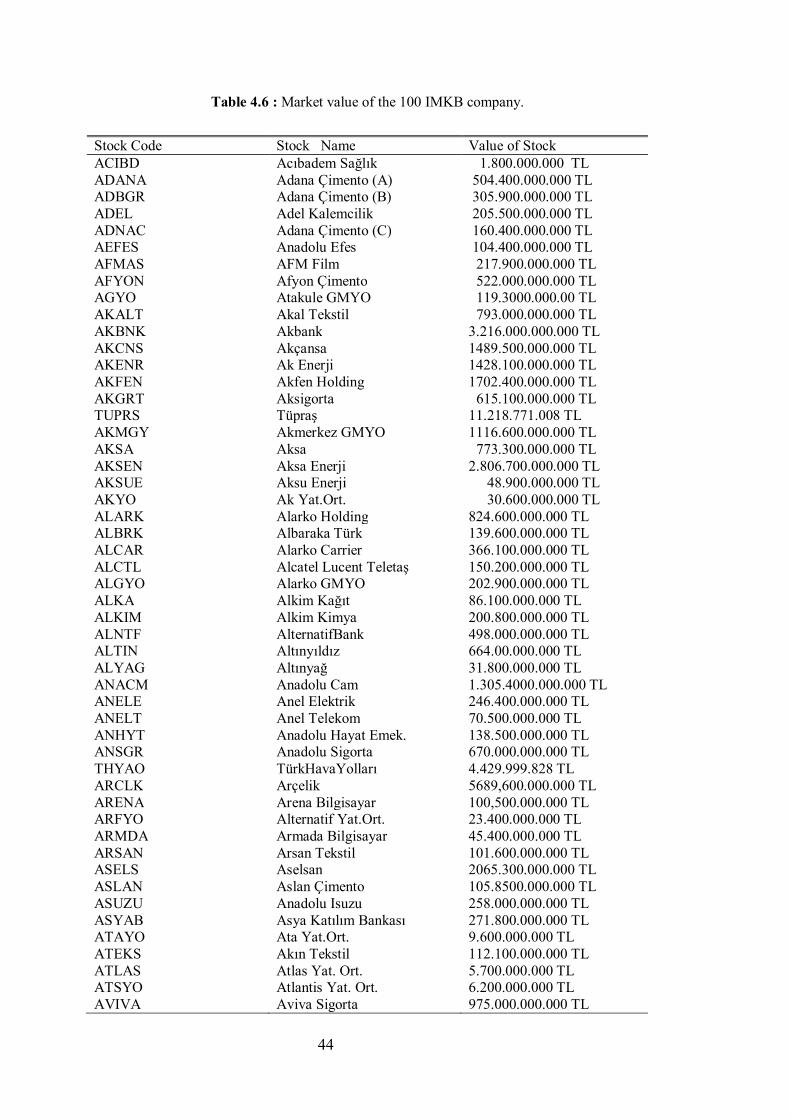
44
Table 4.6 : Market value of the 100 IMKB company.
Stock Code Stock Name Value of Stock ACIBD Acıbadem Sağlık 1.800.000.000 TL ADANA Adana Çimento (A) 504.400.000.000 TL ADBGR Adana Çimento (B) 305.900.000.000 TL ADEL Adel Kalemcilik 205.500.000.000 TL ADNAC Adana Çimento (C) 160.400.000.000 TL AEFES Anadolu Efes 104.400.000.000 TL AFMAS AFM Film 217.900.000.000 TL AFYON Afyon Çimento 522.000.000.000 TL AGYO Atakule GMYO 119.3000.000.00 TL AKALT Akal Tekstil 793.000.000.000 TL AKBNK Akbank 3.216.000.000.000 TL AKCNS Akçansa 1489.500.000.000 TL AKENR Ak Enerji 1428.100.000.000 TL AKFEN Akfen Holding 1702.400.000.000 TL AKGRT Aksigorta 615.100.000.000 TL TUPRS Tüpraş 11.218.771.008 TL AKMGY Akmerkez GMYO 1116.600.000.000 TL AKSA Aksa 773.300.000.000 TL AKSEN Aksa Enerji 2.806.700.000.000 TL AKSUE Aksu Enerji 48.900.000.000 TL AKYO Ak Yat.Ort. 30.600.000.000 TL ALARK Alarko Holding 824.600.000.000 TL ALBRK Albaraka Türk 139.600.000.000 TL ALCAR Alarko Carrier 366.100.000.000 TL ALCTL Alcatel Lucent Teletaş 150.200.000.000 TL ALGYO Alarko GMYO 202.900.000.000 TL ALKA Alkim Kağıt 86.100.000.000 TL ALKIM Alkim Kimya 200.800.000.000 TL ALNTF AlternatifBank 498.000.000.000 TL ALTIN Altınyıldız 664.00.000.000 TL ALYAG Altınyağ 31.800.000.000 TL ANACM Anadolu Cam 1.305.4000.000.000 TL ANELE Anel Elektrik 246.400.000.000 TL ANELT Anel Telekom 70.500.000.000 TL ANHYT Anadolu Hayat Emek. 138.500.000.000 TL ANSGR Anadolu Sigorta 670.000.000.000 TL THYAO TürkHavaYolları 4.429.999.828 TL ARCLK Arçelik 5689,600.000.000 TL ARENA Arena Bilgisayar 100,500.000.000 TL ARFYO Alternatif Yat.Ort. 23.400.000.000 TL ARMDA Armada Bilgisayar 45.400.000.000 TL ARSAN Arsan Tekstil 101.600.000.000 TL ASELS Aselsan 2065.300.000.000 TL ASLAN Aslan Çimento 105.8500.000.000 TL ASUZU Anadolu Isuzu 258.000.000.000 TL ASYAB Asya Katılım Bankası 271.800.000.000 TL ATAYO Ata Yat.Ort. 9.600.000.000 TL ATEKS Akın Tekstil 112.100.000.000 TL ATLAS Atlas Yat. Ort. 5.700.000.000 TL ATSYO Atlantis Yat. Ort. 6.200.000.000 TL AVIVA Aviva Sigorta 975.000.000.000 TL
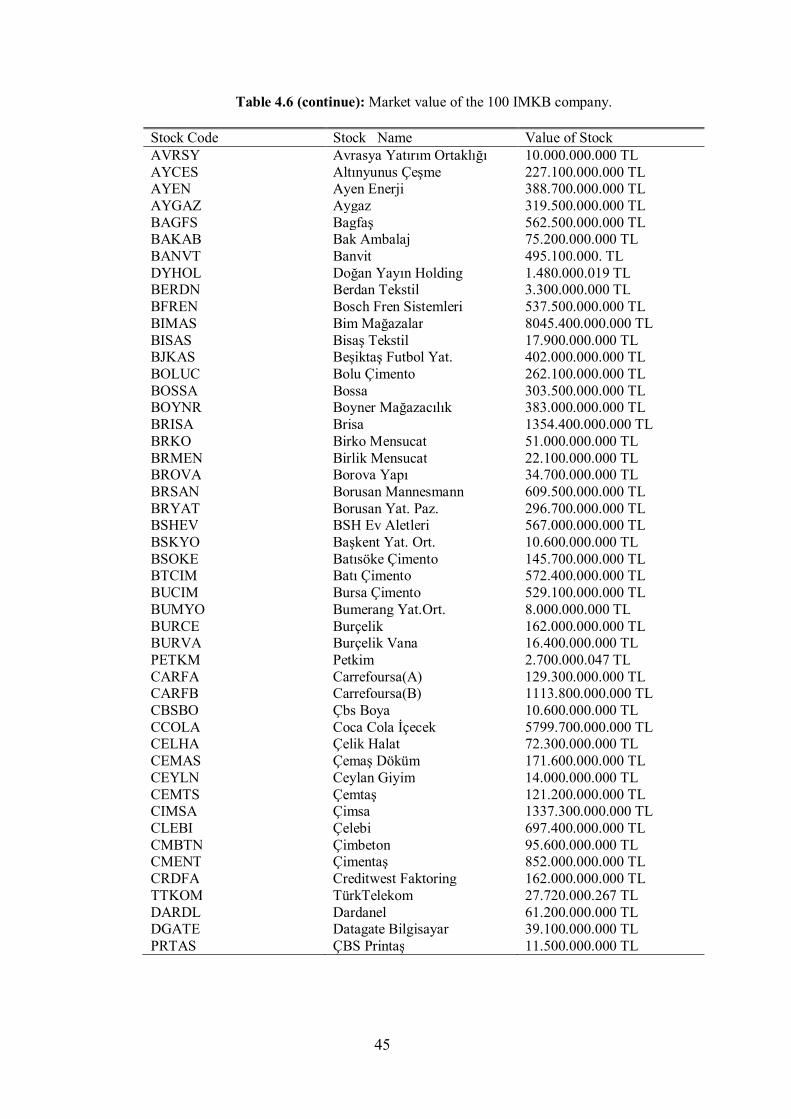
45
Table 4.6 (continue): Market value of the 100 IMKB company. Stock Code Stock Name Value of Stock AVRSY Avrasya Yatırım Ortaklığı 10.000.000.000 TL AYCES Altınyunus Çeşme 227.100.000.000 TL AYEN Ayen Enerji 388.700.000.000 TL AYGAZ Aygaz 319.500.000.000 TL BAGFS Bagfaş 562.500.000.000 TL BAKAB Bak Ambalaj 75.200.000.000 TL BANVT Banvit 495.100.000. TL DYHOL Doğan Yayın Holding 1.480.000.019 TL BERDN Berdan Tekstil 3.300.000.000 TL BFREN Bosch Fren Sistemleri 537.500.000.000 TL BIMAS Bim Mağazalar 8045.400.000.000 TL BISAS Bisaş Tekstil 17.900.000.000 TL BJKAS Beşiktaş Futbol Yat. 402.000.000.000 TL BOLUC Bolu Çimento 262.100.000.000 TL BOSSA Bossa 303.500.000.000 TL BOYNR Boyner Mağazacılık 383.000.000.000 TL BRISA Brisa 1354.400.000.000 TL BRKO Birko Mensucat 51.000.000.000 TL BRMEN Birlik Mensucat 22.100.000.000 TL BROVA Borova Yapı 34.700.000.000 TL BRSAN Borusan Mannesmann 609.500.000.000 TL BRYAT Borusan Yat. Paz. 296.700.000.000 TL BSHEV BSH Ev Aletleri 567.000.000.000 TL BSKYO Başkent Yat. Ort. 10.600.000.000 TL BSOKE Batısöke Çimento 145.700.000.000 TL BTCIM Batı Çimento 572.400.000.000 TL BUCIM Bursa Çimento 529.100.000.000 TL BUMYO Bumerang Yat.Ort. 8.000.000.000 TL BURCE Burçelik 162.000.000.000 TL BURVA Burçelik Vana 16.400.000.000 TL PETKM Petkim 2.700.000.047 TL CARFA Carrefoursa(A) 129.300.000.000 TL CARFB Carrefoursa(B) 1113.800.000.000 TL CBSBO Çbs Boya 10.600.000.000 TL CCOLA Coca Cola İçecek 5799.700.000.000 TL CELHA Çelik Halat 72.300.000.000 TL CEMAS Çemaş Döküm 171.600.000.000 TL CEYLN Ceylan Giyim 14.000.000.000 TL CEMTS Çemtaş 121.200.000.000 TL CIMSA Çimsa 1337.300.000.000 TL CLEBI Çelebi 697.400.000.000 TL CMBTN Çimbeton 95.600.000.000 TL CMENT Çimentaş 852.000.000.000 TL CRDFA Creditwest Faktoring 162.000.000.000 TL TTKOM TürkTelekom 27.720.000.267 TL DARDL Dardanel 61.200.000.000 TL DGATE Datagate Bilgisayar 39.100.000.000 TL PRTAS ÇBS Printaş 11.500.000.000 TL
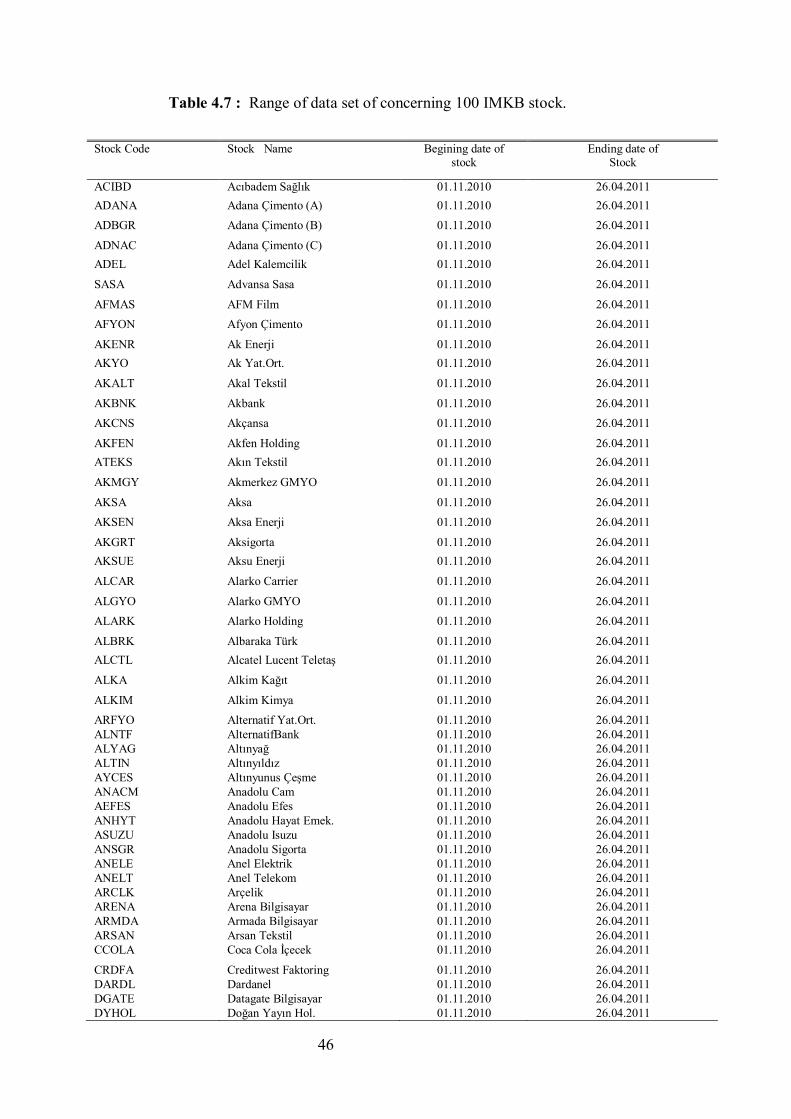
46
Table 4.7 : Range of data set of concerning 100 IMKB stock.
Stock Code Stock Name Begining date of stock
Ending date of Stock
ACIBD Acıbadem Sağlık 01.11.2010 26.04.2011 ADANA Adana Çimento (A) 01.11.2010 26.04.2011 ADBGR Adana Çimento (B) 01.11.2010 26.04.2011
ADNAC Adana Çimento (C) 01.11.2010 26.04.2011 ADEL Adel Kalemcilik 01.11.2010 26.04.2011
SASA Advansa Sasa 01.11.2010 26.04.2011
AFMAS AFM Film 01.11.2010 26.04.2011 AFYON Afyon Çimento 01.11.2010 26.04.2011
AKENR Ak Enerji 01.11.2010 26.04.2011 AKYO Ak Yat.Ort. 01.11.2010 26.04.2011
AKALT Akal Tekstil 01.11.2010 26.04.2011
AKBNK Akbank 01.11.2010 26.04.2011 AKCNS Akçansa 01.11.2010 26.04.2011
AKFEN Akfen Holding 01.11.2010 26.04.2011 ATEKS Akın Tekstil 01.11.2010 26.04.2011
AKMGY Akmerkez GMYO 01.11.2010 26.04.2011
AKSA Aksa 01.11.2010 26.04.2011 AKSEN Aksa Enerji 01.11.2010 26.04.2011
AKGRT Aksigorta 01.11.2010 26.04.2011 AKSUE Aksu Enerji 01.11.2010 26.04.2011
ALCAR Alarko Carrier 01.11.2010 26.04.2011
ALGYO Alarko GMYO 01.11.2010 26.04.2011 ALARK Alarko Holding 01.11.2010 26.04.2011
ALBRK Albaraka Türk 01.11.2010 26.04.2011 ALCTL Alcatel Lucent Teletaş 01.11.2010 26.04.2011
ALKA Alkim Kağıt 01.11.2010 26.04.2011
ALKIM Alkim Kimya 01.11.2010 26.04.2011 ARFYO Alternatif Yat.Ort. 01.11.2010 26.04.2011 ALNTF AlternatifBank 01.11.2010 26.04.2011 ALYAG Altınyağ 01.11.2010 26.04.2011 ALTIN Altınyıldız 01.11.2010 26.04.2011 AYCES Altınyunus Çeşme 01.11.2010 26.04.2011 ANACM Anadolu Cam 01.11.2010 26.04.2011 AEFES Anadolu Efes 01.11.2010 26.04.2011 ANHYT Anadolu Hayat Emek. 01.11.2010 26.04.2011 ASUZU Anadolu Isuzu 01.11.2010 26.04.2011 ANSGR Anadolu Sigorta 01.11.2010 26.04.2011 ANELE Anel Elektrik 01.11.2010 26.04.2011 ANELT Anel Telekom 01.11.2010 26.04.2011 ARCLK Arçelik 01.11.2010 26.04.2011 ARENA Arena Bilgisayar 01.11.2010 26.04.2011 ARMDA Armada Bilgisayar 01.11.2010 26.04.2011 ARSAN Arsan Tekstil 01.11.2010 26.04.2011 CCOLA Coca Cola İçecek 01.11.2010 26.04.2011
CRDFA Creditwest Faktoring 01.11.2010 26.04.2011 DARDL Dardanel 01.11.2010 26.04.2011 DGATE Datagate Bilgisayar 01.11.2010 26.04.2011 DYHOL Doğan Yayın Hol. 01.11.2010 26.04.2011

47
Table 4.7 (continue): Range of data set of concerning 100 IMKB stock.
Stock Code Stock Name Begining date of stock
Ending date of Stock
ASELS Aselsan 01.11.2010 26.04.2011
ASLAN Aslan Çimento 01.11.2010 26.04.2011
ASYAB Asya Katılım Bankası 01.11.2010 26.04.2011
ATAYO Ata Yat.Ort. 01.11.2010 26.04.2011 AGYO Atakule GMYO 01.11.2010 26.04.2011
ATSYO Atlantis Yat. Ort. 01.11.2010 26.04.2011
ATLAS Atlas Yat. Ort. 01.11.2010 26.04.2011
AVIVA Aviva Sigorta 01.11.2010 26.04.2011
AVRSY Avrasya Yatırım Ortaklığı 01.11.2010 26.04.2011 AYEN Ayen Enerji 01.11.2010 26.04.2011
AYGAZ Aygaz 01.11.2010 26.04.2011
BAGFS Bagfaş 01.11.2010 26.04.2011
BAKAB Bak Ambalaj 01.11.2010 26.04.2011 BANVT Banvit 01.11.2010 26.04.2011 BSKYO Başkent Yat. Ort. 01.11.2010 26.04.2011 BTCIM Batı Çimento 01.11.2010 26.04.2011 BSOKE Batısöke Çimento 01.11.2010 26.04.2011 BERDN Berdan Tekstil 01.11.2010 26.04.2011 BJKAS Beşiktaş Futbol Yat. 01.11.2010 26.04.2011 BIMAS Bim Mağazalar 01.11.2010 26.04.2011 BRKO Birko Mensucat 01.11.2010 26.04.2011 BRMEN Birlik Mensucat 01.11.2010 26.04.2011 BISAS Bisaş Tekstil 01.11.2010 26.04.2011 BOLUC Bolu Çimento 01.11.2010 26.04.2011 BROVA Borova Yapı 01.11.2010 26.04.2011 BRSAN Borusan Mannesmann 01.11.2010 26.04.2011 BRYAT Borusan Yat. Paz. 01.11.2010 26.04.2011 BFREN Bosch Fren Sistemleri 01.11.2010 26.04.2011 BOSSA Bossa 01.11.2010 26.04.2011 BOYNR Boyner Mağazacılık 01.11.2010 26.04.2011 BRISA Brisa 01.11.2010 26.04.2011 BSHEV BSH Ev Aletleri 01.11.2010 26.04.2011 BUMYO Bumerang Yat.Ort. 01.11.2010 26.04.2011 BURCE Burçelik 01.11.2010 26.04.2011 BURVA Burçelik Vana 01.11.2010 26.04.2011 BUCIM Bursa Çimento 01.11.2010 26.04.2011 CARFA Carrefoursa(A) 01.11.2010 26.04.2011 CARFB Carrefoursa(B) 01.11.2010 26.04.2011 CBSBO Çbs Boya 01.11.2010 26.04.2011 PRTAS ÇBS Printaş 01.11.2010 26.04.2011 CLEBI Çelebi 01.11.2010 26.04.2011 CELHA Çelik Halat 01.11.2010 26.04.2011 CEMAS Çemaş Döküm 01.11.2010 26.04.2011 CEMTS Çemtaş 01.11.2010 26.04.2011 CCOLA Coca Cola İçecek 01.11.2010 26.04.2011
CRDFA Creditwest Faktoring 01.11.2010 26.04.2011
DARDL Dardanel 01.11.2010 26.04.2011
DGATE Datagate Bilgisayar 01.11.2010 26.04.2011
DYHOL Doğan Yayın Hol. 01.11.2010 26.04.2011 PETKM Petkim 01.11.2010 26.04.2011
TUPRS Tüpraş 01.11.2010 26.04.2011
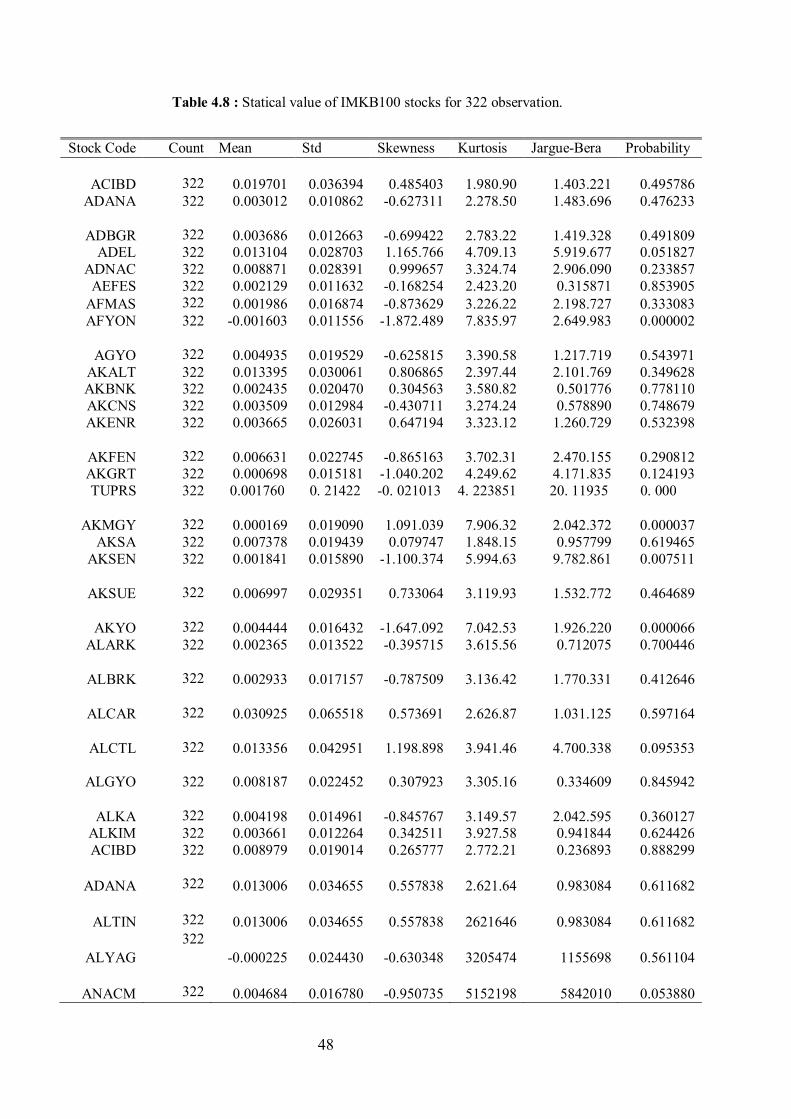
48
Table 4.8 : Statical value of IMKB100 stocks for 322 observation.
Stock Code Count Mean Std Skewness Kurtosis Jargue-Bera Probability
ACIBD
322 0.019701 0.036394 0.485403 1.980.90 1.403.221 0.495786 ADANA 322 0.003012 0.010862 -0.627311 2.278.50 1.483.696 0.476233
ADBGR
322 0.003686 0.012663 -0.699422 2.783.22 1.419.328 0.491809 ADEL 322 0.013104 0.028703 1.165.766 4.709.13 5.919.677 0.051827
ADNAC 322 0.008871 0.028391 0.999657 3.324.74 2.906.090 0.233857 AEFES 322 0.002129 0.011632 -0.168254 2.423.20 0.315871 0.853905
AFMAS 322 0.001986 0.016874 -0.873629 3.226.22 2.198.727 0.333083 AFYON 322 -0.001603 0.011556 -1.872.489 7.835.97 2.649.983 0.000002
AGYO
322 0.004935 0.019529 -0.625815 3.390.58 1.217.719 0.543971 AKALT 322 0.013395 0.030061 0.806865 2.397.44 2.101.769 0.349628 AKBNK 322 0.002435 0.020470 0.304563 3.580.82 0.501776 0.778110 AKCNS 322 0.003509 0.012984 -0.430711 3.274.24 0.578890 0.748679 AKENR 322 0.003665 0.026031 0.647194 3.323.12 1.260.729 0.532398
AKFEN
322 0.006631 0.022745 -0.865163 3.702.31 2.470.155 0.290812 AKGRT 322 0.000698 0.015181 -1.040.202 4.249.62 4.171.835 0.124193 TUPRS 322 0.001760 0. 21422 -0. 021013 4. 223851 20. 11935 0. 000
AKMGY
322 0.000169 0.019090 1.091.039 7.906.32 2.042.372 0.000037 AKSA 322 0.007378 0.019439 0.079747 1.848.15 0.957799 0.619465
AKSEN 322 0.001841 0.015890 -1.100.374 5.994.63 9.782.861 0.007511
AKSUE
322 0.006997 0.029351 0.733064 3.119.93 1.532.772 0.464689
AKYO
322 0.004444 0.016432 -1.647.092 7.042.53 1.926.220 0.000066 ALARK 322 0.002365 0.013522 -0.395715 3.615.56 0.712075 0.700446
ALBRK
322 0.002933 0.017157 -0.787509 3.136.42 1.770.331 0.412646
ALCAR
322 0.030925 0.065518 0.573691 2.626.87 1.031.125 0.597164
ALCTL
322 0.013356 0.042951 1.198.898 3.941.46 4.700.338 0.095353
ALGYO
322 0.008187 0.022452 0.307923 3.305.16 0.334609 0.845942
ALKA
322 0.004198 0.014961 -0.845767 3.149.57 2.042.595 0.360127 ALKIM 322 0.003661 0.012264 0.342511 3.927.58 0.941844 0.624426 ACIBD 322 0.008979 0.019014 0.265777 2.772.21 0.236893 0.888299
ADANA
322 0.013006 0.034655 0.557838 2.621.64 0.983084 0.611682
ALTIN
322 0.013006 0.034655 0.557838 2621646 0.983084 0.611682
ALYAG 322
-0.000225 0.024430 -0.630348 3205474 1155698 0.561104
ANACM
322 0.004684 0.016780 -0.950735 5152198 5842010 0.053880

49
Table 4.8 (continue): Statical value of IMKB100 stocks for 322 observation.
Stock Code Count Mean Std Skewness Kurtosis Jargue-Bera Probability ANELE 322 -0.001842 0.021389 -0.933783 3495736 2644601 0.266521 ANELT 322 0.002305 0.019431 -0.662084 3056502 1244266 0.536798 ANHYT 322 0.004069 0.015278 0.195000 2016405 0.793021 0.672663 ANSGR 322 0.006110 0.013757 0.121130 2156865 0.545109 0.761432 THYAO 322 -0. 000433 0. 025047 -0. 191530 10. 19664 696. 8401 0. 000
ARCLK 322 0.008548 0.015872 0.135366 2040276 0.704342 0.703160
ARENA 322 0.010720 0.022658 0.052786 2108742 0.570553 0.751806 ARFYO 322 0.001870 0.018417 -1490491 4497043 7881900 0.019430 ARMDA 322 0.015347 0.038047 0.990410 3428526 2909325 0.233479 ARSAN 322 0.006975 0.026752 0.907071 2615874 2435721 0.295863
ASELS 322 0.001936 0.018816 -0.044535 3880174 0.554369 0.757915
ASLAN 322 -0.004391 0.056254 2372937 9486529 4575718 0.000000 ASUZU 322 0.009582 0.040547 1186016 3834743 4479025 0.106510
ASYAB 322 -0.001745 0.018906 -0.249574 3430756 0.307912 0.857310
ATAYO 322 0.001745 0.024145 1740635 6898272 1934867 0.000063 ATEKS 322 0.009407 0.028874 0.399026 3461652 0.602090 0.740044
ATLAS 322 0.004818 0.040349 0.650049 4502380 2796078 0.247081
ATSYO 322 0.002539 0.021976 -0.642993 5257361 4780854 0.091591
AVIVA 322 0.005314 0.014505 -0.228741 2521324 0.310548 0.856180
AVRSY 322 0.005348 0.034370 1333651 4978086 7811019 0.020131
AYCES 322 0.004297 0.023279 2183948 7417268 2733513 0.000001
AYEN 322 0.000265 0.013333 -0.134029 2342698 0.356930 0.836553
AYGAZ 322 0.004189 0.016137 -0.631709 2986203 1130794 0.568135
BAGFS 322 0.002062 0.017630 -1439249 5894683 1180433 0.002734
BAKAB 322 0.004319 0.022099 -0.555435 3720292 1241605 0.537513 BANVT 322 0.001463 0.017227 -0.643652 3236785 1213531 0.545111 DYHOL 322 0. 001374 0. 031333 1. 692021 12. 42066 1344. 358 0. 000
BIMAS 322 -0.000733 0.014036 -0.446984 4077450 1388388 0.499477
BISAS 322 -0.003274 0.018924 -0.533197 4279252 1964691 0.374432 BJKAS 322 -6.53E-05 0.022256 1768750 6343805 1678391 0.000227 BOLUC 322 0.004821 0.016705 1247949 4521773 6052921 0.048487 BOSSA 322 0.010524 0.031566 0.802000 2849953 1838360 0.398846 BOYNR 322 0.003389 0.020128 0.757753 2769203 1664603 0.435047 BERDN 322 0.004749 0.043594 0.420172 4364735 1819482 0.402628 BFREN 322 0.004444 0.019483 -1090325 4745103 5525439 0.063120 BIMAS 322 -0.000733 0.014036 -0.446984 4077450 1388388 0.499477 BISAS 322 -0.003274 0.018924 -0.533197 4279252 1964691 0.374432

50
Table 4.8 (continue): Statical value of IMKB100 stocks for 322 observation.
Stock Code Count Mean Std Skewness Kurtosis Jargue-Bera Probability BOSSA 322 0.010524 0.031566 0.802000 2849953 1838360 0.398846 BOYNR 322 0.003389 0.020128 0.757753 2769203 1664603 0.435047 BRISA 322 0.000728 0.012821 -1196728 5411152 8175785 0.016775 BRKO 322 0.008677 0.033082 1920745 6072023 1713768 0.000190 BRMEN 322 0.005103 0.024084 -0.158549 2455608 0.281147 0.868860 BROVA 322 0.003724 0.026676 -0.854288 4182416 3058116 0.216740 BRSAN 322 0.014276 0.053089 1851567 7466320 2384337 0.000007 BSHEV 322 0.000268 0.010267 -0.414374 2900515 0.493510 0.781332 BSKYO 322 0.003814 0.021493 2633181 1052575 5976317 0.000000 BRYAT 322 0.007044 0.039962 0.811349 6173253 8997730 0.011122 BTCIM 322 0.002898 0.011379 0.773514 3125770 1706457 0.426037 BUCIM 322 0.003199 0.019451 -0.628403 3279717 1174278 0.555916 BSOKE 322 0.005765 0.012945 -0.033240 2159501 0.503525 0.777429 BUMYO 322 -0.00342 0.030101 0.07341 4882793 2526247 0.282769 BURCE 322 0.018184 0.063414 -0.53356 3187561 0.831515 0.65984 BURVA 322 0.003543 0.036052 1853532 7275649 2268331 0.000012 PETKM 322 0. 001593 0. 018877 1. 103197 9. 916655 707. 1695 0. 000 CARFA 322 -0.00167 0.01828 -0.5957 3266574 1055777 0.589849 CARFB 322 -0.00023 0.022982 -0.42256 2490676 0.689665 0.708339 CBSBO 322 0.008766 0.062854 0.452856 1967548 1336108 0.512705 CCOLA 322 0.007945 0.02108 0.108064 2189446 0.498461 0.7794 CELHA 322 0.00014 0.017143 -1788379 7102576 2098390 0.000028 BERDN 322 -0.01697 0.059628 0.720644 3743227 1862704 0.394021 BFREN 322 0.008096 0.021187 -0.37299 2613398 0.500052 0.77878 CEYLN 322 0.035756 0.048557 -0.87484 3622441 2442910 0.294801 CIMSA 322 -0.00204 0.024324 -1751402 6900215 1946593 0.000059 CLEBI 322 0.007344 0.016907 0.794222 3337778 1868052 0.392969 CIMSA 322 -0.00204 0.024324 -1751402 6900215 1946593 0.000059 CLEBI 322 0.007344 0.016907 0.794222 3337778 1868052 0.392969 CMBTN 322 -0.00074 0.035378 -0.94776 3471748 2702692 0.258892 CMENT 322 0.001528 0.011733 0.219204 2142985 0.656396 0.72022 CRDFA 322 0.010902 0.021227 0.731001 4571422 3263163 0.19562 TTKOM 322 0. 01808 0. 17383 -0.50862 4. 15221 44. 8637 0. 000 DARDL 322 0.006027 0.029795 1406049 4979278 8376347 0.015174 DGATE 322 0.004552 0.019211 0.342925 2866091 0.345896 0.841181 PRTAS 322 0.011055 0.077053 -0.17779 1997637 0.801244 0.669903 BJKAS 322 -6.53E-05 0.022256 1768750 6343805 1678391 0.000227 BOLUC 322 0.004821 0.016705 1247949 4521773 6052921 0.048487

51
Table 4.9 : Statical value of IMKB100 stocks for 600 observation.
Stock Code Count Mean Std Skewness Kurtosis Jargue-Bera Probability
ACIBD 600 0.024183 0.041595 0.029783 1573734 0.594354 0.742913
ADANA 600 0.005214 0.009931 -1021478 3181527 1226931 0.541471
ADBGR 600 0.005674 0.007809 -0.742665 2466530 0.726483 0.695419
ADEL 600 0.009634 0.013254 0.879385 2239477 1070903 0.585405 ADNAC 600 0.011729 0.023374 1181777 3277776 1651869 0.437826 AEFES 600 0.005434 0.015261 -0.545465 2072115 0.598237 0.741472 AFMAS 600 0.007623 0.009704 0.416177 1350706 0.995454 0.607911 AFYON 600 0.000426 0.008064 0.380674 1732209 0.637858 0.726927
AGYO 600 0.004379 0.012935 0.311543 1397762 0.861992 0.649861
AKALT 600 0.001866 0.008867 -0.542145 2115789 0.570942 0.751660 AKBNK 600 0.012056 0.026422 -0.283271 2398475 0.199151 0.905222 AKCNS 600 -0.001873 0.013982 -0.664258 2597282 0.562081 0.754998 AKENR 600 0.009816 0.035478 0.437748 1913657 0.567768 0.752854
AKFEN 600 0.008774 0.019225 0.059679 1751095 0.459086 0.794897
AKGRT 600 0.000791 0.013219 -0.253506 1739682 0.538260 0.764044 TUPRS 600 -0.001219 0.027601 -0.236895 2828068 0.285793 0.866844
AKMGY 600 -0.000877 0.002325 0.461305 2107492 0.480602 0.786391
AKSA 600 0.009547 0.019577 0.083377 2081360 0.254247 0.880625 AKSEN 600 0.004261 0.013418 1313027 3710618 2158666 0.339822
AKSUE 600 0.004957 0.016807 0.357838 1568264 0.747267 0.688229
AKYO 600 0.001809 0.004750 -0.451303 2091223 0.478501 0.787218
ALARK 600 0.000447 0.010162 0.274946 2232300 0.260092 0.878055
ALBRK 600 0.001287 0.017759 0.156693 1432263 0.745503 0.688836
ALCAR 600 0.007214 0.020233 1093209 3387312 1438044 0.487228
ALCTL 600 0.001513 0.019038 0.460236 2544115 0.307737 0.857385
ALGYO 600 0.006771 0.010178 -0.004577 2042669 0.267332 0.874882
ALKA 600 0.001910 0.010980 -1125364 2961507 1477951 0.477603
ALKIM 600 0.000769 0.007344 -0.843450 2791078 0.842707 0.656158

52
Table 4.9 (continue): Statical value of IMKB100 stocks for 600 observation.
Stock Code Count Mean Std Skewness Kurtosis Jargue-Bera Probability
ALTIN 600 0.015553 0.028320 0.756198 2958788 0.667636 0.716184
ALYAG 600 -0.007343 0.022318 -0.697403 1939978 0.895162 0.639172
ANACM 600 0.006877 0.011708 0.458018 3149415 0.251255 0.881943
ANELE 600 -0.006096 0.020181 -1195819 3647764 1790696 0.408466 ANELT 600 3.86E-05 0.009392 0.029126 2380622 0.112882 0.945122 ANHYT 600 0.000669 0.016721 0.520284 2866640 0.320999 0.851718 ANSGR 600 0.010417 0.016350 -0.264534 1953535 0.401042 0.818304 THYAO 600 -0.003525 0.021596 -0.089167 3272043 0.119036 0.942218
ARCLK 600 0.011064 0.014005 0.499078 1856915 0.671696 0.714732
ARENA 600 0.014281 0.022855 -0.205536 1619976 0.604755 0.739059 ARFYO 600 0.005563 0.010961 0.197355 1733817 0.513046 0.773737 ARMDA 600 0.021080 0.038302 1856212 4750364 4913376 0.085718 ARSAN 600 0.006129 0.027206 1292464 3369645 1988728 0.369959
ASELS 600 0.006354 0.015340 0.465943 1791957 0.678936 0.712149
ASLAN 600 -0.008973 0.021800 0.259577 1736207 0.544452 0.761682 ASUZU 600 -0.007190 0.019310 -0.157310 1783396 0.460574 0.794306
ASYAB 600 -0.005460 0.017255 0.878422 2435071 0.993313 0.608562
ATAYO 600 0.005224 0.033040 1738842 4605513 4279323 0.117695 ATEKS 600 0.013713 0.013058 0.308936 1455560 0.807060 0.667958
ATLAS 600 0.012976 0.056326 0.314847 2812759 0.125876 0.939002
ATSYO 600 0.001457 0.009029 -0.268857 1490740 0.748709 0.687733
AVIVA 600 0.003646 0.013739 0.072629 2247369 0.171370 0.917883
AVRSY 600 0.012877 0.052791 0.621456 2052579 0.712378 0.700340
AYCES 600 0.008687 0.032169 1777549 4511673 4352798 0.113449
AYEN 600 0.000507 0.012478 -1025554 3417753 1277955 0.527832
AYGAZ 600 -0.000697 0.019742 -0.416378 2419875 0.300425 0.860525
BAGFS 600 0.006250 0.012917 -0.118427 1669611 0.532593 0.766212
BAKAB 600 0.002219 0.008729 -0.711528 1828942 0.990636 0.609377 BANVT 600 0.002740 0.015759 -0.011352 1347756 0.796374 0.671536 DYHOL 600 0.012593 0.054612 1.684.005 7.608.218 3.665.157 0.000000
CEYLN 600 0.038213 0.044526 0.401951 1413862 0.922276 0.630566
CIMSA 600 -0.011034 0.031640 -1606267 4161222 3403403 0.182373
CLEBI 600 0.007250 0.014940 0.936935 2766360 1040076 0.594498
CMBTN 600 0.019641 0.018015 0.252663 3001196 0.074478 0.963446 CMENT 600 0.008224 0.009864 -0.158407 1655887 0.556212 0.757217

53
Table 4.9 (continue): Statical value of IMKB100 stocks for 600 observation.
Stock Code Count Mean Std Skewness Kurtosis Jargue-Bera Probability
BERDN 600 0.011459 0.069339 -0.014700 1933982 0.331700 0.847173
BFREN 600 0.006093 0.017523 0.422499 2076859 0.456812 0.795801
BIMAS 600 -0.002506 0.020063 -0.310842 2471196 0.194287 0.907426
BISAS 600 -0.003541 0.016523 0.959930 2369728 1190907 0.551313 BJKAS 600 0.000421 0.031845 1632748 4190003 3523210 0.171769 BOLUC 600 3.29E-05 0.008975 -0.294919 1786996 0.530626 0.766966 BOSSA 600 0.026463 0.043574 -0.270692 1679337 0.594197 0.742971 BOYNR 600 0.002704 0.020959 1027032 2997942 1230596 0.540480
BRISA 600 0.000810 0.006503 -0.349471 3300537 0.168829 0.919050
BRKO 600 0.012011 0.044709 1621517 4277098 3543240 0.170057 BRMEN 600 0.011889 0.016566 0.058695 1797154 0.426014 0.808151 BROVA 600 0.007030 0.017837 0.236530 1551788 0.676989 0.712843 BRSAN 600 0.008041 0.029028 0.877319 3110953 0.901561 0.637131
BRYAT 600 0.003637 0.011742 0.696397 1745003 1025178 0.598943
BSHEV 600 0.001096 0.009403 -0.138623 1949675 0.344180 0.841903 BSKYO 600 0.001299 0.006157 -0.116457 2374401 0.129974 0.937080
BSOKE 600
0.004217 0.006549 -0.198056 1853376 0.429232 0.806851 BTCIM 600 -0.000343 0.008240 -0.584057 1834750 0.794004 0.672333 BUCIM 600 0.004189 0.008516 -0.456703 1854462 0.626082 0.731220
BUMYO 600 -0.002869 0.020087 -0.974432 3349377 1143373 0.564573
BURCE 600 0.022146 0.046991 -1897555 4849099 5198092 0.074344
BURVA 600 -0.005789 0.016845 -1144815 2830902 1537374 0.463621 PETKM 600 0.005446 0.022075 -0.123184 2.372.735 0.510928 0.774557
CARFA 600 0.001840 0.007986 1207807 3378764 1743774 0.418162
CARFB 600 0.003403 0.024642 -0.123372 1418243 0.747494 0.688151
CBSBO 600 0.019967 0.084513 0.063563 1237570 0.910677 0.634233
CCOLA 600 -0.005677 0.017881 0.689621 3015698 0.554912 0.757709
CELHA 600 -0.000631 0.007292 0.051046 1570499 0.599053 0.741169 CRDFA 600 0.007064 0.008416 0.907629 3237428 0.977532 0.613383 TTKOM 600 0.003029 0.020918 -0.101392 2411906 0.435348 0.804388 DARDL 600 0.013447 0.037099 1511397 3802230 2852751 0.240178
DGATE 600 0.004069 0.020548 0.887055 3118373 0.922097 0.630622
PRTAS 600 0.014343 0.095815 -0.278920 1511721 0.736796 0.691842

54
Table 4.10 : Statical value of IMKB100 stocks for 1400 observation.
Stock Code Count Mean Std Skewness Kurtosis Jargue-Bera Probability
ACIBD 1400 0.019701 0.036394 0.485403 1.980.90 1.403.221 0.495786
ADANA 1400 0.003012 0.010862 -0.627311 2.278.50 1.483.696 0.476233
ADBGR 1400 0.003686 0.012663 -0.699422 2.783.22 1.419.328 0.491809
ADEL 1400 0.013104 0.028703 1.165.766 4.709.13 5.919.677 0.051827 ADNAC 1400 0.008871 0.028391 0.999657 3.324.74 2.906.090 0.233857 AEFES 1400 0.002129 0.011632 -0.168254 2.423.20 0.315871 0.853905 AFMAS 1400 0.001986 0.016874 -0.873629 3.226.22 2.198.727 0.333083 AFYON 1400 -0.001603 0.011556 -1.872.489 7.835.97 2.649.983 0.000002
AGYO 1400 0.004935 0.019529 -0.625815 3.390.58 1.217.719 0.543971
AKALT 1400 0.013395 0.030061 0.806865 2.397.44 2.101.769 0.349628 AKBNK 1400 0.002435 0.020470 0.304563 3.580.82 0.501776 0.778110 AKCNS 1400 0.003509 0.012984 -0.430711 3.274.24 0.578890 0.748679 AKENR 1400 0.003665 0.026031 0.647194 3.323.12 1.260.729 0.532398
AKFEN 1400 0.006631 0.022745 -0.865163 3.702.31 2.470.155 0.290812
AKGRT 1400 0.000698 0.015181 -1.040.202 4.249.62 4.171.835 0.124193 TUPRS 1400 0.002120 0.026667 -0.702265 4429244 1622908 0.000299
AKMGY 1400 0.000169 0.019090 1.091.039 7.906.32 2.042.372 0.000037
AKSA 1400 0.007378 0.019439 0.079747 1.848.15 0.957799 0.619465 AKSEN 1400 0.001841 0.015890 -1.100.374 5.994.63 9.782.861 0.007511
AKSUE 1400 0.006997 0.029351 0.733064 3.119.93 1.532.772 0.464689
AKYO 1400 0.004444 0.016432 -1.647.092 7.042.53 1.926.220 0.000066
ALARK 1400 0.002365 0.013522 -0.395715 3.615.56 0.712075 0.700446
ALBRK 1400 0.002933 0.017157 -0.787509 3.136.42 1.770.331 0.412646
ALCAR 1400 0.030925 0.065518 0.573691 2.626.87 1.031.125 0.597164
ALCTL 1400 0.013356 0.042951 1.198.898 3.941.46 4.700.338 0.095353
ALGYO 1400 0.008187 0.022452 0.307923 3.305.16 0.334609 0.845942
ALKA 1400 0.004198 0.014961 -0.845767 3.149.57 2.042.595 0.360127
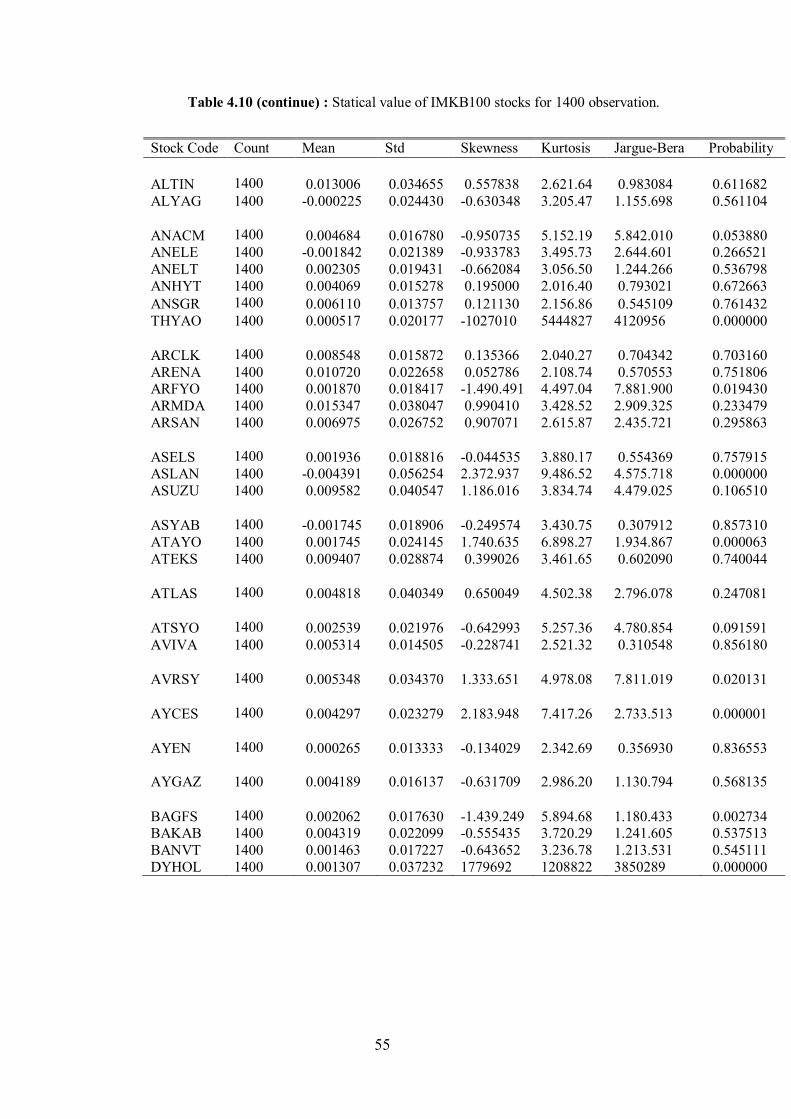
55
Table 4.10 (continue) : Statical value of IMKB100 stocks for 1400 observation.
Stock Code Count Mean Std Skewness Kurtosis Jargue-Bera Probability
ALTIN 1400 0.013006 0.034655 0.557838 2.621.64 0.983084 0.611682
ALYAG 1400 -0.000225 0.024430 -0.630348 3.205.47 1.155.698 0.561104
ANACM 1400 0.004684 0.016780 -0.950735 5.152.19 5.842.010 0.053880
ANELE 1400 -0.001842 0.021389 -0.933783 3.495.73 2.644.601 0.266521 ANELT 1400 0.002305 0.019431 -0.662084 3.056.50 1.244.266 0.536798 ANHYT 1400 0.004069 0.015278 0.195000 2.016.40 0.793021 0.672663 ANSGR 1400 0.006110 0.013757 0.121130 2.156.86 0.545109 0.761432 THYAO 1400 0.000517 0.020177 -1027010 5444827 4120956 0.000000
ARCLK 1400 0.008548 0.015872 0.135366 2.040.27 0.704342 0.703160
ARENA 1400 0.010720 0.022658 0.052786 2.108.74 0.570553 0.751806 ARFYO 1400 0.001870 0.018417 -1.490.491 4.497.04 7.881.900 0.019430 ARMDA 1400 0.015347 0.038047 0.990410 3.428.52 2.909.325 0.233479 ARSAN 1400 0.006975 0.026752 0.907071 2.615.87 2.435.721 0.295863
ASELS 1400 0.001936 0.018816 -0.044535 3.880.17 0.554369 0.757915
ASLAN 1400 -0.004391 0.056254 2.372.937 9.486.52 4.575.718 0.000000 ASUZU 1400 0.009582 0.040547 1.186.016 3.834.74 4.479.025 0.106510
ASYAB 1400 -0.001745 0.018906 -0.249574 3.430.75 0.307912 0.857310
ATAYO 1400 0.001745 0.024145 1.740.635 6.898.27 1.934.867 0.000063 ATEKS 1400 0.009407 0.028874 0.399026 3.461.65 0.602090 0.740044
ATLAS 1400 0.004818 0.040349 0.650049 4.502.38 2.796.078 0.247081
ATSYO 1400 0.002539 0.021976 -0.642993 5.257.36 4.780.854 0.091591
AVIVA 1400 0.005314 0.014505 -0.228741 2.521.32 0.310548 0.856180
AVRSY 1400 0.005348 0.034370 1.333.651 4.978.08 7.811.019 0.020131
AYCES 1400 0.004297 0.023279 2.183.948 7.417.26 2.733.513 0.000001
AYEN 1400 0.000265 0.013333 -0.134029 2.342.69 0.356930 0.836553
AYGAZ 1400 0.004189 0.016137 -0.631709 2.986.20 1.130.794 0.568135
BAGFS 1400 0.002062 0.017630 -1.439.249 5.894.68 1.180.433 0.002734
BAKAB 1400 0.004319 0.022099 -0.555435 3.720.29 1.241.605 0.537513 BANVT 1400 0.001463 0.017227 -0.643652 3.236.78 1.213.531 0.545111 DYHOL 1400 0.001307 0.037232 1779692 1208822 3850289 0.000000
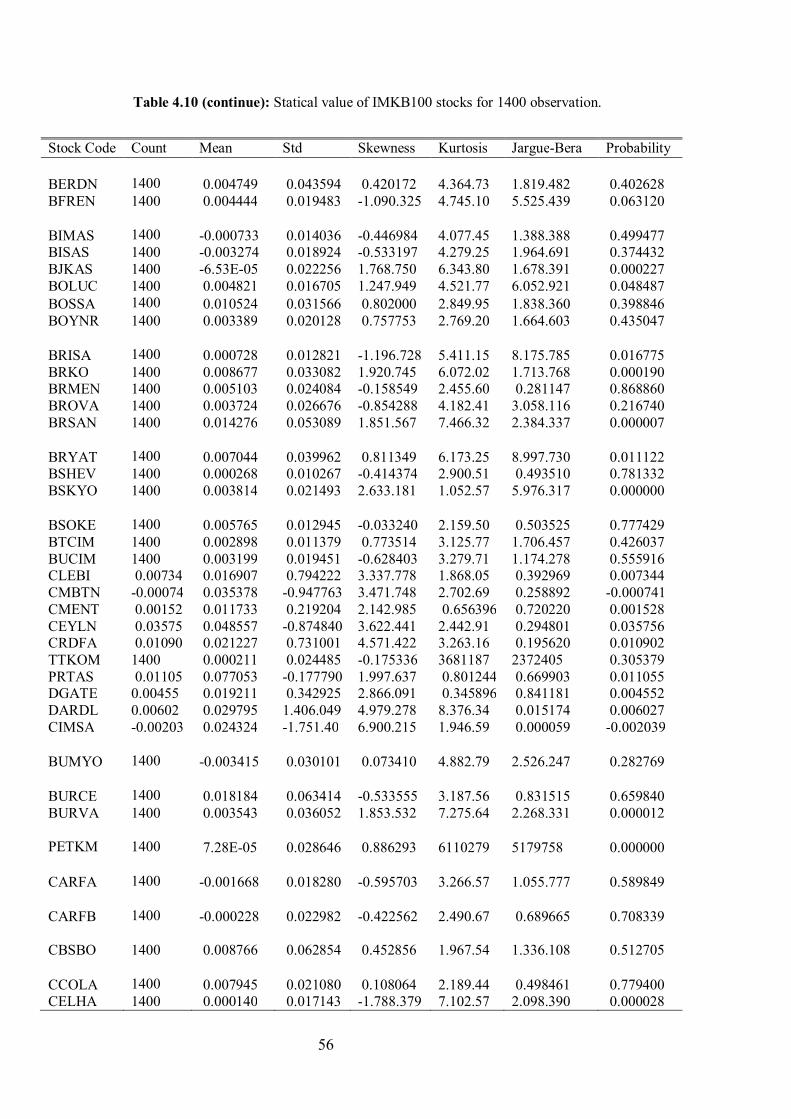
56
Table 4.10 (continue): Statical value of IMKB100 stocks for 1400 observation.
Stock Code Count Mean Std Skewness Kurtosis Jargue-Bera Probability
BERDN 1400 0.004749 0.043594 0.420172 4.364.73 1.819.482 0.402628
BFREN 1400 0.004444 0.019483 -1.090.325 4.745.10 5.525.439 0.063120
BIMAS 1400 -0.000733 0.014036 -0.446984 4.077.45 1.388.388 0.499477
BISAS 1400 -0.003274 0.018924 -0.533197 4.279.25 1.964.691 0.374432 BJKAS 1400 -6.53E-05 0.022256 1.768.750 6.343.80 1.678.391 0.000227 BOLUC 1400 0.004821 0.016705 1.247.949 4.521.77 6.052.921 0.048487 BOSSA 1400 0.010524 0.031566 0.802000 2.849.95 1.838.360 0.398846 BOYNR 1400 0.003389 0.020128 0.757753 2.769.20 1.664.603 0.435047
BRISA 1400 0.000728 0.012821 -1.196.728 5.411.15 8.175.785 0.016775
BRKO 1400 0.008677 0.033082 1.920.745 6.072.02 1.713.768 0.000190 BRMEN 1400 0.005103 0.024084 -0.158549 2.455.60 0.281147 0.868860 BROVA 1400 0.003724 0.026676 -0.854288 4.182.41 3.058.116 0.216740 BRSAN 1400 0.014276 0.053089 1.851.567 7.466.32 2.384.337 0.000007
BRYAT 1400 0.007044 0.039962 0.811349 6.173.25 8.997.730 0.011122
BSHEV 1400 0.000268 0.010267 -0.414374 2.900.51 0.493510 0.781332 BSKYO 1400 0.003814 0.021493 2.633.181 1.052.57 5.976.317 0.000000
BSOKE 1400 0.005765 0.012945 -0.033240 2.159.50 0.503525 0.777429
BTCIM 1400 0.002898 0.011379 0.773514 3.125.77 1.706.457 0.426037 BUCIM 1400 0.003199 0.019451 -0.628403 3.279.71 1.174.278 0.555916 CLEBI 0.00734 0.016907 0.794222 3.337.778 1.868.05 0.392969 0.007344 CMBTN -0.00074 0.035378 -0.947763 3.471.748 2.702.69 0.258892 -0.000741 CMENT 0.00152 0.011733 0.219204 2.142.985 0.656396 0.720220 0.001528 CEYLN 0.03575 0.048557 -0.874840 3.622.441 2.442.91 0.294801 0.035756 CRDFA 0.01090 0.021227 0.731001 4.571.422 3.263.16 0.195620 0.010902 TTKOM 1400 0.000211 0.024485 -0.175336 3681187 2372405 0.305379 PRTAS 0.01105 0.077053 -0.177790 1.997.637 0.801244 0.669903 0.011055 DGATE 0.00455 0.019211 0.342925 2.866.091 0.345896 0.841181 0.004552 DARDL 0.00602 0.029795 1.406.049 4.979.278 8.376.34 0.015174 0.006027 CIMSA -0.00203 0.024324 -1.751.40 6.900.215 1.946.59 0.000059 -0.002039
BUMYO 1400 -0.003415 0.030101 0.073410 4.882.79 2.526.247 0.282769
BURCE 1400 0.018184 0.063414 -0.533555 3.187.56 0.831515 0.659840
BURVA 1400 0.003543 0.036052 1.853.532 7.275.64 2.268.331 0.000012 PETKM
1400 7.28E-05 0.028646 0.886293 6110279 5179758 0.000000
CARFA 1400 -0.001668 0.018280 -0.595703 3.266.57 1.055.777 0.589849
CARFB 1400 -0.000228 0.022982 -0.422562 2.490.67 0.689665 0.708339
CBSBO 1400 0.008766 0.062854 0.452856 1.967.54 1.336.108 0.512705
CCOLA 1400 0.007945 0.021080 0.108064 2.189.44 0.498461 0.779400
CELHA 1400 0.000140 0.017143 -1.788.379 7.102.57 2.098.390 0.000028

57
4. 2 Garch Estimation
In this part of our study we use the GARCH Method to estimate the 5 %
confidence level value at risk of a portfolio on April 26, 2011. Our portfolio
consists of The Istanbul Stock Exchange 30 Index's stock. These are AKBANK,
ARCELIK, ASYA BANK, BIM MARKETS DOGAN HOLING, DYHOL ,
ECILC, ENKAI, EREGL, GARAN, ISCTR , KRDMD , KCHOL , KOZAA ,
PETKM, SAHOL, SKBNK, SISE, HALKB, TAVHL, TKFEN, TEBNK,
TOASO, TCELL, TUPRS, THYAO, TTKOM , VAKBN, VESTL. Let us to show
you vech representations of our portfolio.
q
itji
p
iitjiitij
11
2,
1
2,
2, i=1, ……. , n
tjtijitij ,,,, i, j=1, ……. , n i j
where must satisfy 0 >0, i >0, i=1, 2, …. , p and i >0 I=1, 2, …, q
The main important of our model is the assumption of constant correlation among the
variables. We control the variance covariance matrix with correlation matrix. Now
we compute the VaR with below expression.
Variance matrix represent a diagonal matrix with the given elements. On the
diagonal elements of the variance matrix are computed with Garch method. We
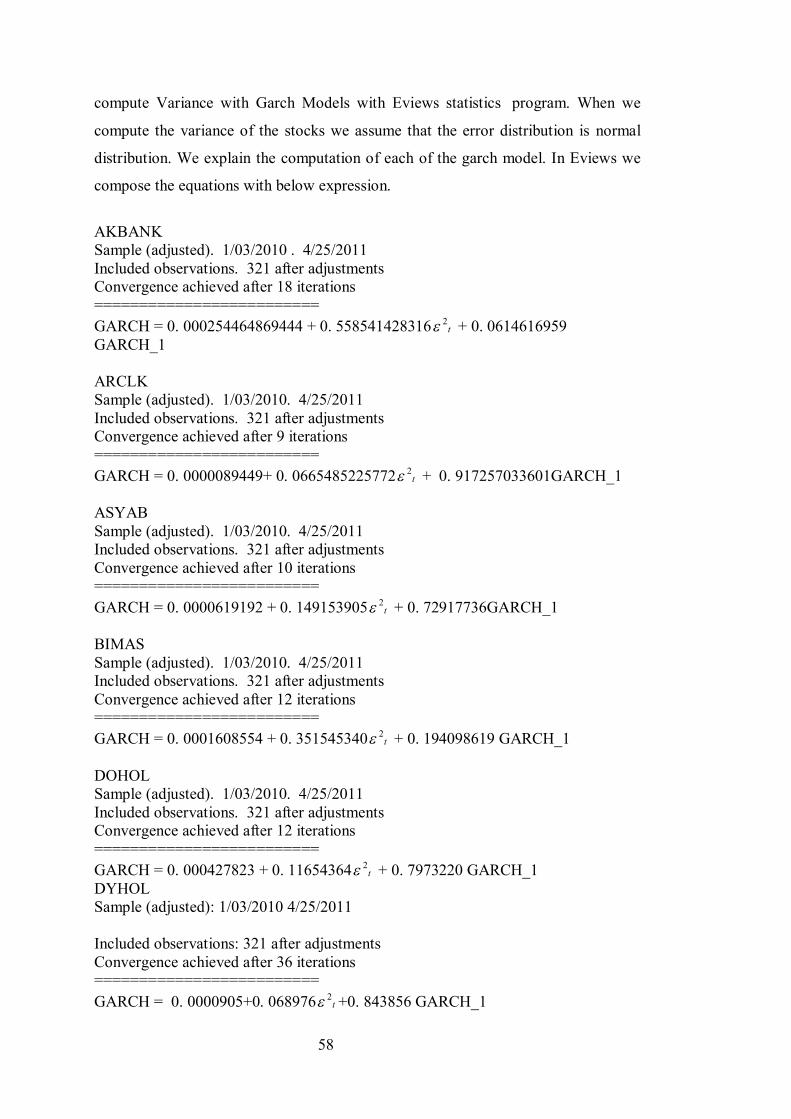
58
compute Variance with Garch Models with Eviews statistics program. When we
compute the variance of the stocks we assume that the error distribution is normal
distribution. We explain the computation of each of the garch model. In Eviews we
compose the equations with below expression.
AKBANK Sample (adjusted). 1/03/2010 . 4/25/2011 Included observations. 321 after adjustments Convergence achieved after 18 iterations ========================= GARCH = 0. 000254464869444 + 0. 558541428316 t
2 + 0. 0614616959 GARCH_1 ARCLK Sample (adjusted). 1/03/2010. 4/25/2011 Included observations. 321 after adjustments Convergence achieved after 9 iterations ========================= GARCH = 0. 0000089449+ 0. 0665485225772 t
2 + 0. 917257033601GARCH_1 ASYAB Sample (adjusted). 1/03/2010. 4/25/2011 Included observations. 321 after adjustments Convergence achieved after 10 iterations ========================= GARCH = 0. 0000619192 + 0. 149153905 t
2 + 0. 72917736GARCH_1 BIMAS Sample (adjusted). 1/03/2010. 4/25/2011 Included observations. 321 after adjustments Convergence achieved after 12 iterations ========================= GARCH = 0. 0001608554 + 0. 351545340 t
2 + 0. 194098619 GARCH_1 DOHOL Sample (adjusted). 1/03/2010. 4/25/2011 Included observations. 321 after adjustments Convergence achieved after 12 iterations ========================= GARCH = 0. 000427823 + 0. 11654364 t
2 + 0. 7973220 GARCH_1 DYHOL Sample (adjusted): 1/03/2010 4/25/2011 Included observations: 321 after adjustments Convergence achieved after 36 iterations ========================= GARCH = 0. 0000905+0. 068976 t
2 +0. 843856 GARCH_1

59
ECILC Sample (adjusted). 1/03/2010. 4/25/2011 Included observations. 321 after adjustments Convergence achieved after 79 iterations ========================= GARCH = 0. 000243 + 0. 300329 t
2 + 0. 406215 GARCH_1 ENKAI Sample (adjusted). 1/03/2010. 4/25/2011 Included observations. 321 after adjustments Convergence achieved after 22 iterations ========================= GARCH = 0. 00000909 + 0. 135856 t
2 + 0. 886649 GARCH_1 EREGLI Sample (adjusted). 1/03/2010. 4/25/2011 Included observations. 321 after adjustments Convergence achieved after 22 iterations ========================= GARCH = 0. 00000909 + 0. 135856 t
2 + 0. 886649 GARCH_1 GARANTI Sample (adjusted). 1/03/2010. 4/25/2011 Included observations. 321 after adjustments Convergence achieved after 16 iterations ========================= GARCH = 0. 0000521 + 0. 067372 t
2 + 0. 834064 GARCH_1 HALKB Sample (adjusted). 1/03/2010. 4/25/2011 Included observations. 321 after adjustments Convergence achieved after 23 iterations ========================= GARCH = 0. 000464 + 0. 235292 t
2 + 0. 020255 GARCH_1 ISCTR Sample (adjusted). 1/03/2010. 4/25/2011 Included observations. 321 after adjustments Convergence achieved after 17 iterations ========================= GARCH = 0. 0000694 + 0. 058047 t
2 + 0. 783998 GARCH_1 KCHOL Sample (adjusted). 1/03/2010. 4/25/2011 Included observations. 321 after adjustments Convergence achieved after 17 iterations ========================= GARCH = 0. 0000526 + 0. 144555 t
2 + 0. 739088 GARCH_1
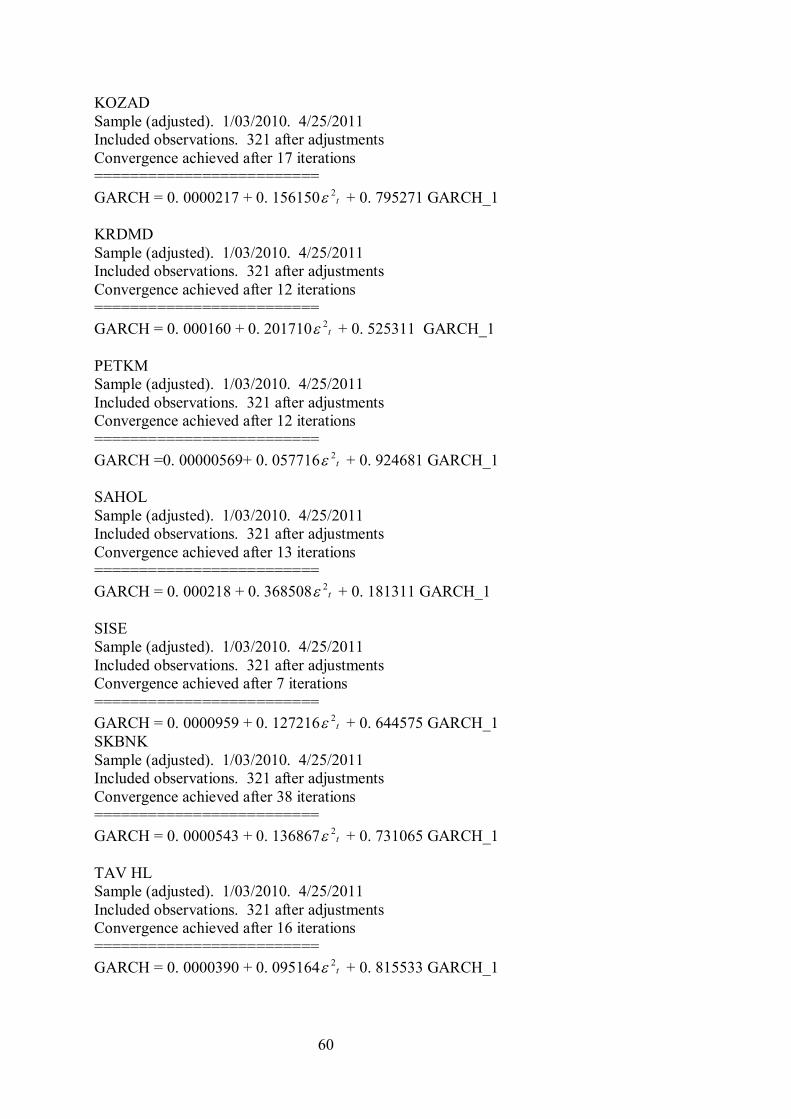
60
KOZAD Sample (adjusted). 1/03/2010. 4/25/2011 Included observations. 321 after adjustments Convergence achieved after 17 iterations ========================= GARCH = 0. 0000217 + 0. 156150 t
2 + 0. 795271 GARCH_1 KRDMD Sample (adjusted). 1/03/2010. 4/25/2011 Included observations. 321 after adjustments Convergence achieved after 12 iterations ========================= GARCH = 0. 000160 + 0. 201710 t
2 + 0. 525311 GARCH_1 PETKM Sample (adjusted). 1/03/2010. 4/25/2011 Included observations. 321 after adjustments Convergence achieved after 12 iterations ========================= GARCH =0. 00000569+ 0. 057716 t
2 + 0. 924681 GARCH_1 SAHOL Sample (adjusted). 1/03/2010. 4/25/2011 Included observations. 321 after adjustments Convergence achieved after 13 iterations ========================= GARCH = 0. 000218 + 0. 368508 t
2 + 0. 181311 GARCH_1 SISE Sample (adjusted). 1/03/2010. 4/25/2011 Included observations. 321 after adjustments Convergence achieved after 7 iterations ========================= GARCH = 0. 0000959 + 0. 127216 t
2 + 0. 644575 GARCH_1 SKBNK Sample (adjusted). 1/03/2010. 4/25/2011 Included observations. 321 after adjustments Convergence achieved after 38 iterations ========================= GARCH = 0. 0000543 + 0. 136867 t
2 + 0. 731065 GARCH_1 TAV HL Sample (adjusted). 1/03/2010. 4/25/2011 Included observations. 321 after adjustments Convergence achieved after 16 iterations ========================= GARCH = 0. 0000390 + 0. 095164 t
2 + 0. 815533 GARCH_1
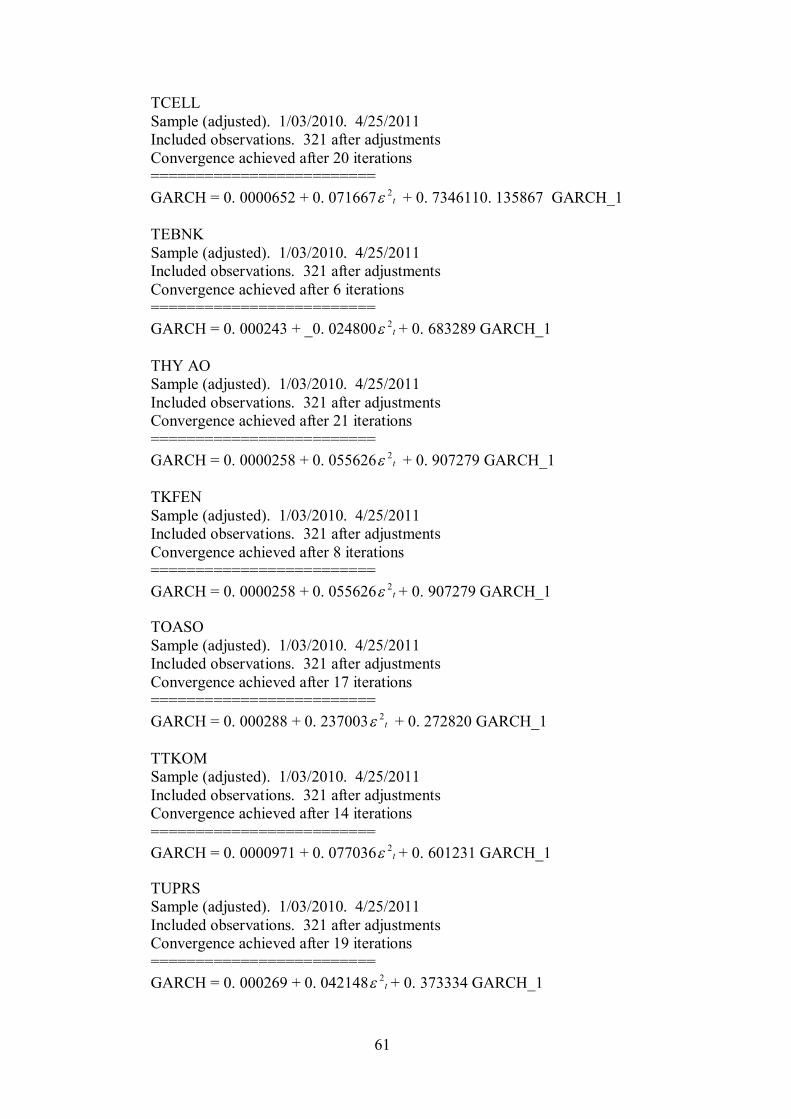
61
TCELL Sample (adjusted). 1/03/2010. 4/25/2011 Included observations. 321 after adjustments Convergence achieved after 20 iterations ========================= GARCH = 0. 0000652 + 0. 071667 t
2 + 0. 7346110. 135867 GARCH_1 TEBNK Sample (adjusted). 1/03/2010. 4/25/2011 Included observations. 321 after adjustments Convergence achieved after 6 iterations ========================= GARCH = 0. 000243 + _0. 024800 t
2 + 0. 683289 GARCH_1 THY AO Sample (adjusted). 1/03/2010. 4/25/2011 Included observations. 321 after adjustments Convergence achieved after 21 iterations ========================= GARCH = 0. 0000258 + 0. 055626 t
2 + 0. 907279 GARCH_1 TKFEN Sample (adjusted). 1/03/2010. 4/25/2011 Included observations. 321 after adjustments Convergence achieved after 8 iterations ========================= GARCH = 0. 0000258 + 0. 055626 t
2 + 0. 907279 GARCH_1 TOASO Sample (adjusted). 1/03/2010. 4/25/2011 Included observations. 321 after adjustments Convergence achieved after 17 iterations ========================= GARCH = 0. 000288 + 0. 237003 t
2 + 0. 272820 GARCH_1 TTKOM Sample (adjusted). 1/03/2010. 4/25/2011 Included observations. 321 after adjustments Convergence achieved after 14 iterations ========================= GARCH = 0. 0000971 + 0. 077036 t
2 + 0. 601231 GARCH_1 TUPRS Sample (adjusted). 1/03/2010. 4/25/2011 Included observations. 321 after adjustments Convergence achieved after 19 iterations ========================= GARCH = 0. 000269 + 0. 042148 t
2 + 0. 373334 GARCH_1
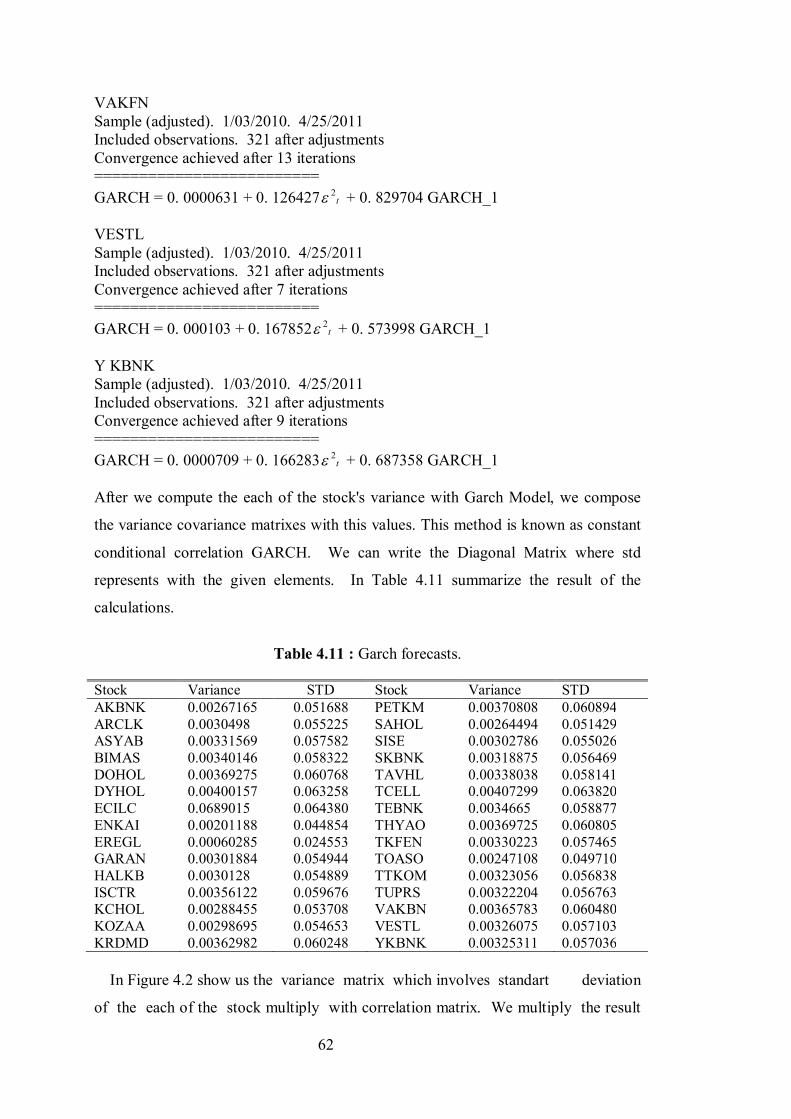
62
VAKFN Sample (adjusted). 1/03/2010. 4/25/2011 Included observations. 321 after adjustments Convergence achieved after 13 iterations ========================= GARCH = 0. 0000631 + 0. 126427 t
2 + 0. 829704 GARCH_1 VESTL Sample (adjusted). 1/03/2010. 4/25/2011 Included observations. 321 after adjustments Convergence achieved after 7 iterations ========================= GARCH = 0. 000103 + 0. 167852 t
2 + 0. 573998 GARCH_1 Y KBNK Sample (adjusted). 1/03/2010. 4/25/2011 Included observations. 321 after adjustments Convergence achieved after 9 iterations ========================= GARCH = 0. 0000709 + 0. 166283 t
2 + 0. 687358 GARCH_1
After we compute the each of the stock's variance with Garch Model, we compose
the variance covariance matrixes with this values. This method is known as constant
conditional correlation GARCH. We can write the Diagonal Matrix where std
represents with the given elements. In Table 4.11 summarize the result of the
calculations.
Table 4.11 : Garch forecasts. Stock Variance STD Stock Variance STD AKBNK 0.00267165 0.051688 PETKM 0.00370808 0.060894 ARCLK 0.0030498 0.055225 SAHOL 0.00264494 0.051429 ASYAB 0.00331569 0.057582 SISE 0.00302786 0.055026 BIMAS 0.00340146 0.058322 SKBNK 0.00318875 0.056469 DOHOL 0.00369275 0.060768 TAVHL 0.00338038 0.058141 DYHOL 0.00400157 0.063258 TCELL 0.00407299 0.063820 ECILC 0.0689015 0.064380 TEBNK 0.0034665 0.058877 ENKAI 0.00201188 0.044854 THYAO 0.00369725 0.060805 EREGL 0.00060285 0.024553 TKFEN 0.00330223 0.057465 GARAN 0.00301884 0.054944 TOASO 0.00247108 0.049710 HALKB 0.0030128 0.054889 TTKOM 0.00323056 0.056838 ISCTR 0.00356122 0.059676 TUPRS 0.00322204 0.056763 KCHOL 0.00288455 0.053708 VAKBN 0.00365783 0.060480 KOZAA 0.00298695 0.054653 VESTL 0.00326075 0.057103 KRDMD 0.00362982 0.060248 YKBNK 0.00325311 0.057036
In Figure 4.2 show us the variance matrix which involves standart deviation
of the each of the stock multiply with correlation matrix. We multiply the result
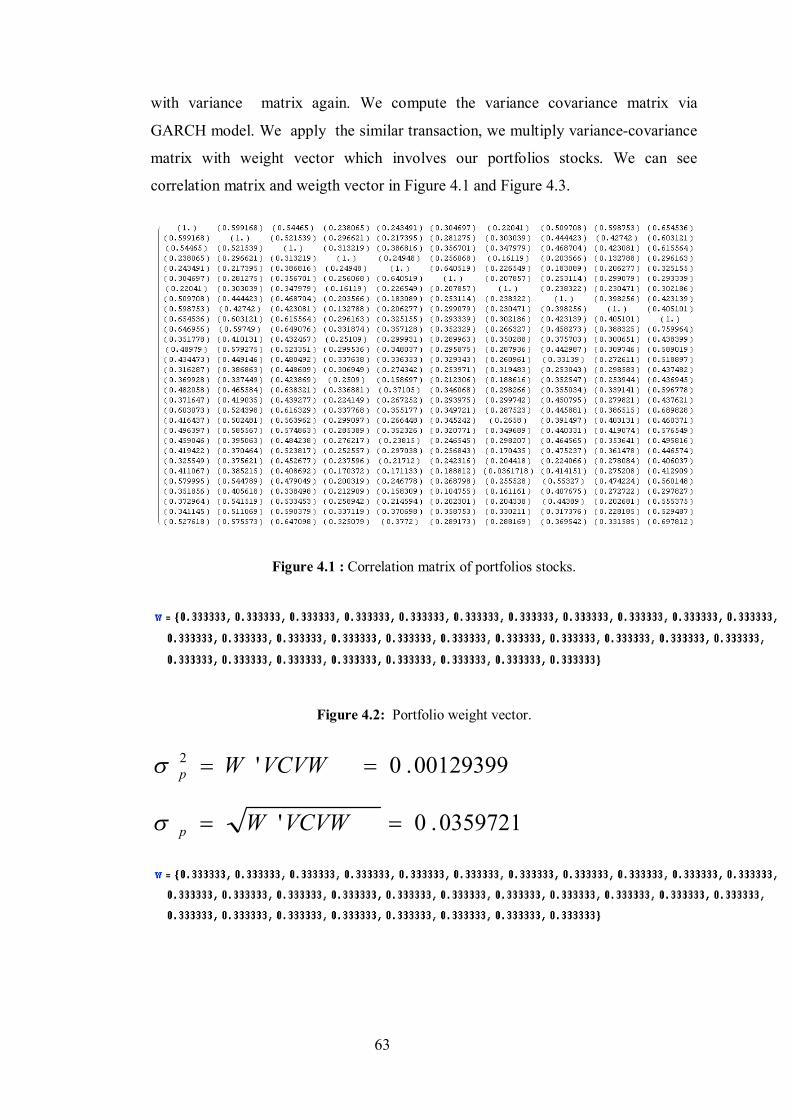
63
with variance matrix again. We compute the variance covariance matrix via
GARCH model. We apply the similar transaction, we multiply variance-covariance
matrix with weight vector which involves our portfolios stocks. We can see
correlation matrix and weigth vector in Figure 4.1 and Figure 4.3.
Figure 4.1 : Correlation matrix of portfolios stocks.
Figure 4.2: Portfolio weight vector.
00129399.0'2 VCVWWp
0359721.0' VCVWWp

64
Figure 4.3: Garch variance matrix.
Figure 4.4: Mathematica code of var.
This code is show us how to solve this problem with the mathematica code.Below expression
at first we calculate the variance – covariance matrix with two matrixes which are variance
matrix and covariance matrix.After that we multiply with this variance covariance matrix
with the weight function of the financial instrument for computing the standart deviation of
the our matrix model.
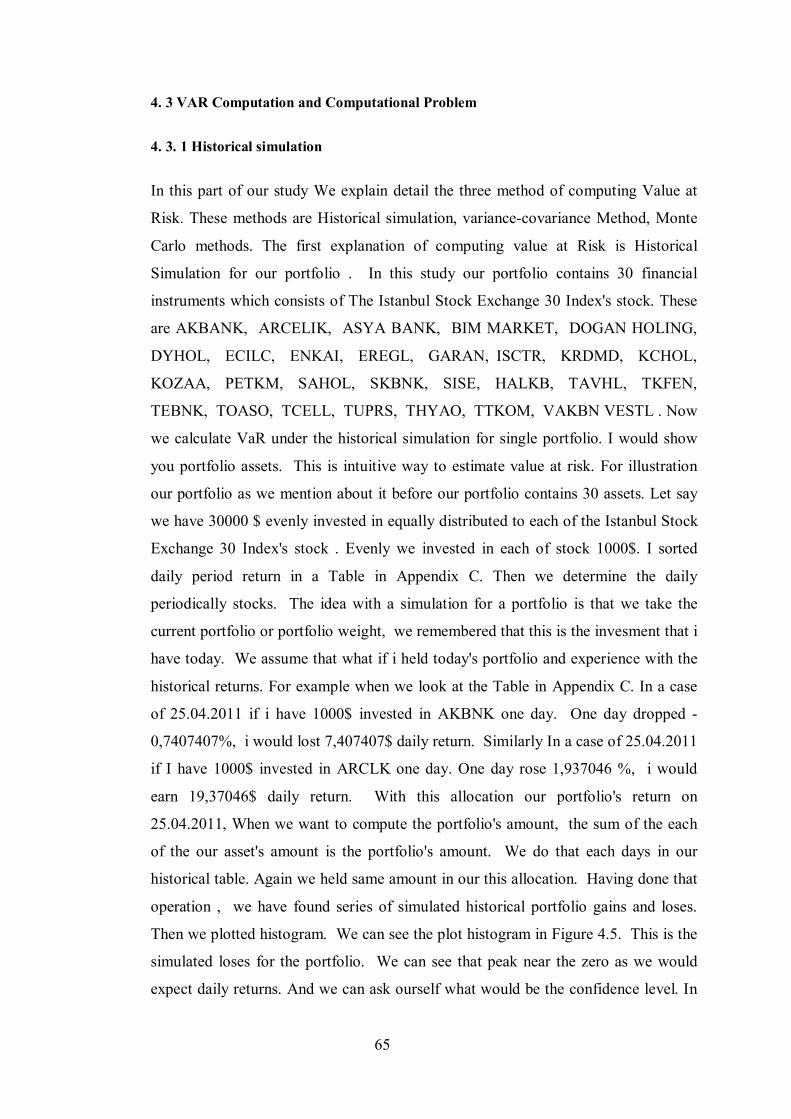
65
4. 3 VAR Computation and Computational Problem
4. 3. 1 Historical simulation
In this part of our study We explain detail the three method of computing Value at
Risk. These methods are Historical simulation, variance-covariance Method, Monte
Carlo methods. The first explanation of computing value at Risk is Historical
Simulation for our portfolio . In this study our portfolio contains 30 financial
instruments which consists of The Istanbul Stock Exchange 30 Index's stock. These
are AKBANK, ARCELIK, ASYA BANK, BIM MARKET, DOGAN HOLING,
DYHOL, ECILC, ENKAI, EREGL, GARAN, ISCTR, KRDMD, KCHOL,
KOZAA, PETKM, SAHOL, SKBNK, SISE, HALKB, TAVHL, TKFEN,
TEBNK, TOASO, TCELL, TUPRS, THYAO, TTKOM, VAKBN VESTL . Now
we calculate VaR under the historical simulation for single portfolio. I would show
you portfolio assets. This is intuitive way to estimate value at risk. For illustration
our portfolio as we mention about it before our portfolio contains 30 assets. Let say
we have 30000 $ evenly invested in equally distributed to each of the Istanbul Stock
Exchange 30 Index's stock . Evenly we invested in each of stock 1000$. I sorted
daily period return in a Table in Appendix C. Then we determine the daily
periodically stocks. The idea with a simulation for a portfolio is that we take the
current portfolio or portfolio weight, we remembered that this is the invesment that i
have today. We assume that what if i held today's portfolio and experience with the
historical returns. For example when we look at the Table in Appendix C. In a case
of 25.04.2011 if i have 1000$ invested in AKBNK one day. One day dropped -
0,7407407%, i would lost 7,407407$ daily return. Similarly In a case of 25.04.2011
if I have 1000$ invested in ARCLK one day. One day rose 1,937046 %, i would
earn 19,37046$ daily return. With this allocation our portfolio's return on
25.04.2011, When we want to compute the portfolio's amount, the sum of the each
of the our asset's amount is the portfolio's amount. We do that each days in our
historical table. Again we held same amount in our this allocation. Having done that
operation , we have found series of simulated historical portfolio gains and loses.
Then we plotted histogram. We can see the plot histogram in Figure 4.5. This is the
simulated loses for the portfolio. We can see that peak near the zero as we would
expect daily returns. And we can ask ourself what would be the confidence level. In
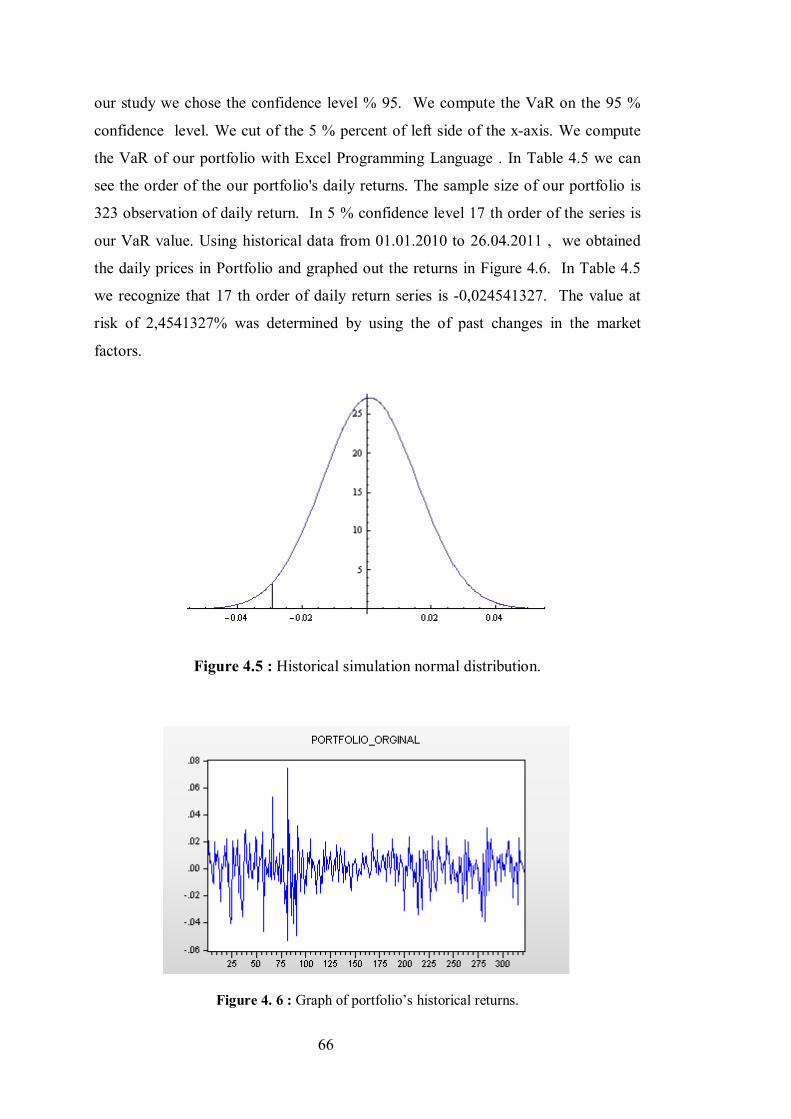
66
our study we chose the confidence level % 95. We compute the VaR on the 95 %
confidence level. We cut of the 5 % percent of left side of the x-axis. We compute
the VaR of our portfolio with Excel Programming Language . In Table 4.5 we can
see the order of the our portfolio's daily returns. The sample size of our portfolio is
323 observation of daily return. In 5 % confidence level 17 th order of the series is
our VaR value. Using historical data from 01.01.2010 to 26.04.2011 , we obtained
the daily prices in Portfolio and graphed out the returns in Figure 4.6. In Table 4.5
we recognize that 17 th order of daily return series is -0,024541327. The value at
risk of 2,4541327% was determined by using the of past changes in the market
factors.
Figure 4.5 : Historical simulation normal distribution.
Figure 4. 6 : Graph of portfolio’s historical returns.
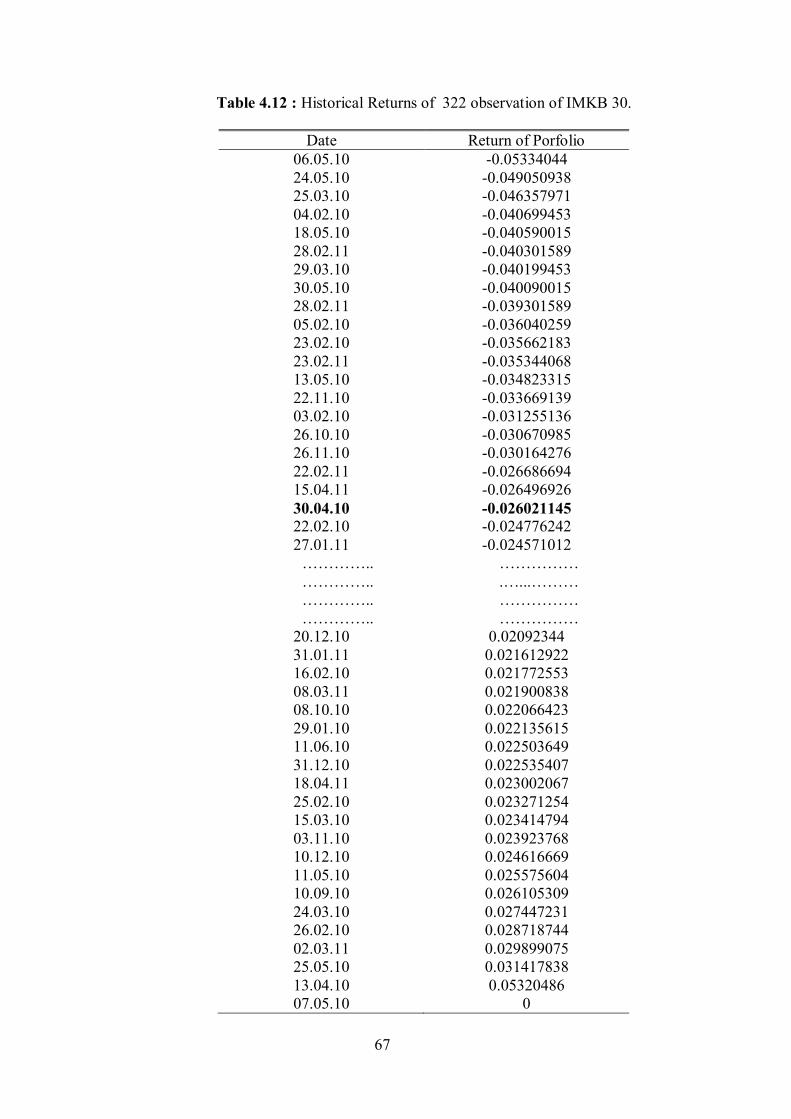
67
Table 4.12 : Historical Returns of 322 observation of IMKB 30.
Date Return of Porfolio 06.05.10 -0.05334044 24.05.10 -0.049050938 25.03.10 -0.046357971 04.02.10 -0.040699453 18.05.10 -0.040590015 28.02.11 -0.040301589 29.03.10 -0.040199453 30.05.10 -0.040090015 28.02.11 -0.039301589 05.02.10 -0.036040259 23.02.10 -0.035662183 23.02.11 -0.035344068 13.05.10 -0.034823315 22.11.10 -0.033669139 03.02.10 -0.031255136 26.10.10 -0.030670985 26.11.10 -0.030164276 22.02.11 -0.026686694 15.04.11 -0.026496926 30.04.10 -0.026021145 22.02.10 -0.024776242 27.01.11 -0.024571012
………….. …………… ………….. .…...……… ………….. …………… ………….. ……………
20.12.10 0.02092344 31.01.11 0.021612922 16.02.10 0.021772553 08.03.11 0.021900838 08.10.10 0.022066423 29.01.10 0.022135615 11.06.10 0.022503649 31.12.10 0.022535407 18.04.11 0.023002067 25.02.10 0.023271254 15.03.10 0.023414794 03.11.10 0.023923768 10.12.10 0.024616669 11.05.10 0.025575604 10.09.10 0.026105309 24.03.10 0.027447231 26.02.10 0.028718744 02.03.11 0.029899075 25.05.10 0.031417838 13.04.10 0.05320486 07.05.10 0
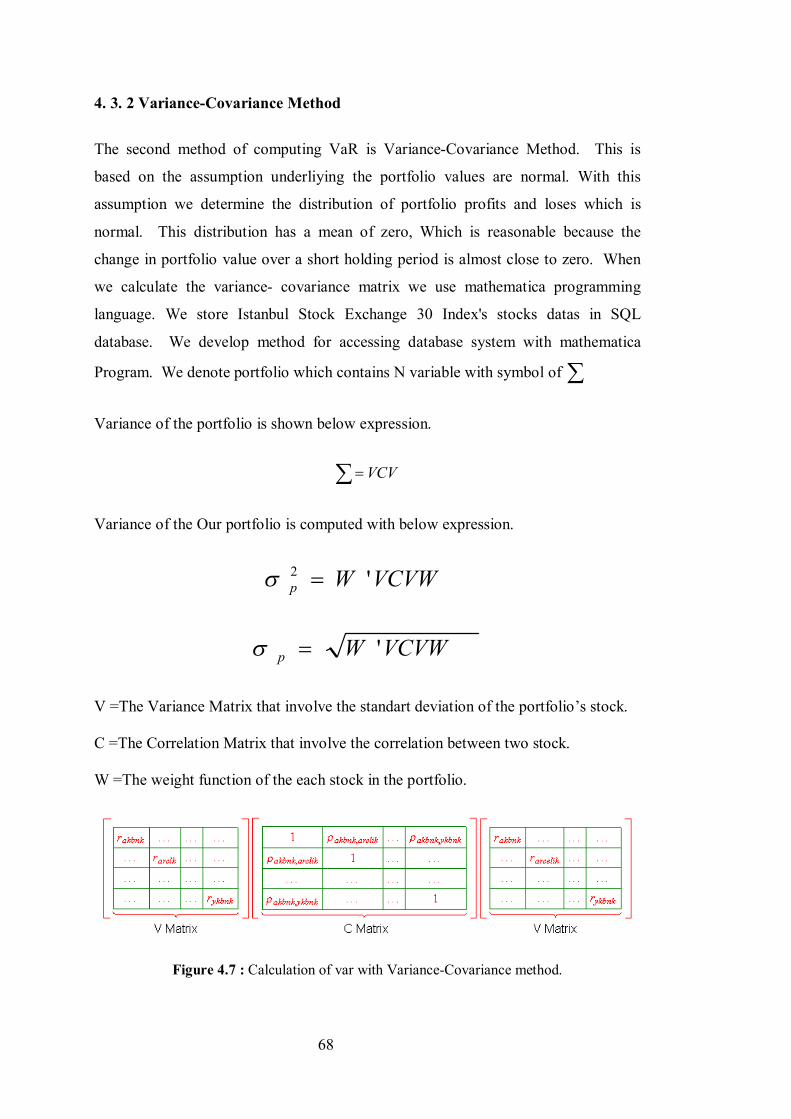
68
4. 3. 2 Variance-Covariance Method
The second method of computing VaR is Variance-Covariance Method. This is
based on the assumption underliying the portfolio values are normal. With this
assumption we determine the distribution of portfolio profits and loses which is
normal. This distribution has a mean of zero, Which is reasonable because the
change in portfolio value over a short holding period is almost close to zero. When
we calculate the variance- covariance matrix we use mathematica programming
language. We store Istanbul Stock Exchange 30 Index's stocks datas in SQL
database. We develop method for accessing database system with mathematica
Program. We denote portfolio which contains N variable with symbol of
Variance of the portfolio is shown below expression.
VCV
Variance of the Our portfolio is computed with below expression.
VCVWWp '2
VCVWWp '
V =The Variance Matrix that involve the standart deviation of the portfolio’s stock. C =The Correlation Matrix that involve the correlation between two stock. W =The weight function of the each stock in the portfolio.
Figure 4.7 : Calculation of var with Variance-Covariance method.

69
We develop Mathematica Programming Codes. Syntax of Mathematica Code and
result of the Variance Matrix are in Appendix D part. Figure 4.4 show us the result of
the Mathematica Program.
Figure 4.8 : Variance matrix of stocks.
At this time we develop Mathematica Programming Codes for Correlation Matrix.
and result of the Correlation Matrix are in Appendix E part. Figure 4.11 show us the
result of the Mathematica Program. In our study Istanbul Stock Exchange 30 Index's
stocks are distributed equally. And our weight function vector's elements have only
unigue values. It is shown in Figure 4.10.
Figure 4.9: Weight vector of portfolio.
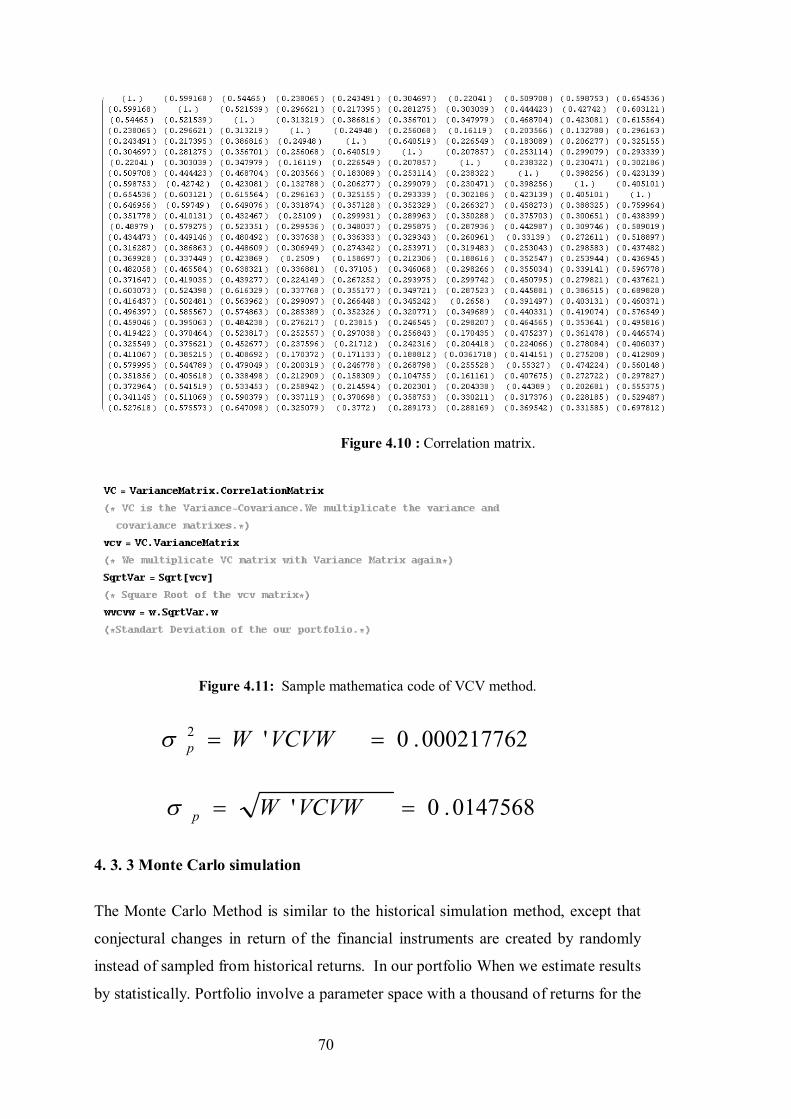
70
Figure 4.10 : Correlation matrix.
Figure 4.11: Sample mathematica code of VCV method.
000217762.0'2 VCVWWp
0147568.0' VCVWWp
4. 3. 3 Monte Carlo simulation
The Monte Carlo Method is similar to the historical simulation method, except that
conjectural changes in return of the financial instruments are created by randomly
instead of sampled from historical returns. In our portfolio When we estimate results
by statistically. Portfolio involve a parameter space with a thousand of returns for the

71
each stock. In the portfolio we evaluate Istanbul Stock Exchange 30 Index’s stocks
and 100 Stocks of IMKB . We have the 30 and 100 stock price returns were
dependent. Stock returns exhibit correlation. Stock returns often exhibit a high
degree of correlation. We therefore need to be able to simulate correlated random
returns. In our study we generate randomly vectors which compose the portfolio.
Portfolio = ( akbankx , arclkx , . . . . . . . . . . , ykbnkx ) where
Suppose now that X = ( 1x , . . . . . . . . . , 30x ) is a random vector.
the covariance matrix of X
1. It is symmetric so that T =
2. The diagonal elements satisfy ii , 0
3. It is positive semi-definite so that X T X 0 for all X R T
Now we generate random X = ( 1x , . . . . . . . . . , 30x ) where
X MN(0, ) and we suppose that Zi MN(0, ) and IID for i = 1, …. . n then Zi is the linear combination of normal random variables
),0(.... 211 nnZcZc
Where 2
1 .... ncc We supppose that C is (n x n) matrix and Z = ( 1Z +………. + 30Z ) T then C T Z MN(0, C T C) we have to solve C C T C =
requires us to compute the Cholesky Decomposition of . Our simulation modeling
We compute the Cholesky Decomposition of a symmetric positive definite matrix in
Mathematica using the Cholesky Decomposition Method. When we generate the
randow X vectors we develop mathematica codes. In the below expression we show
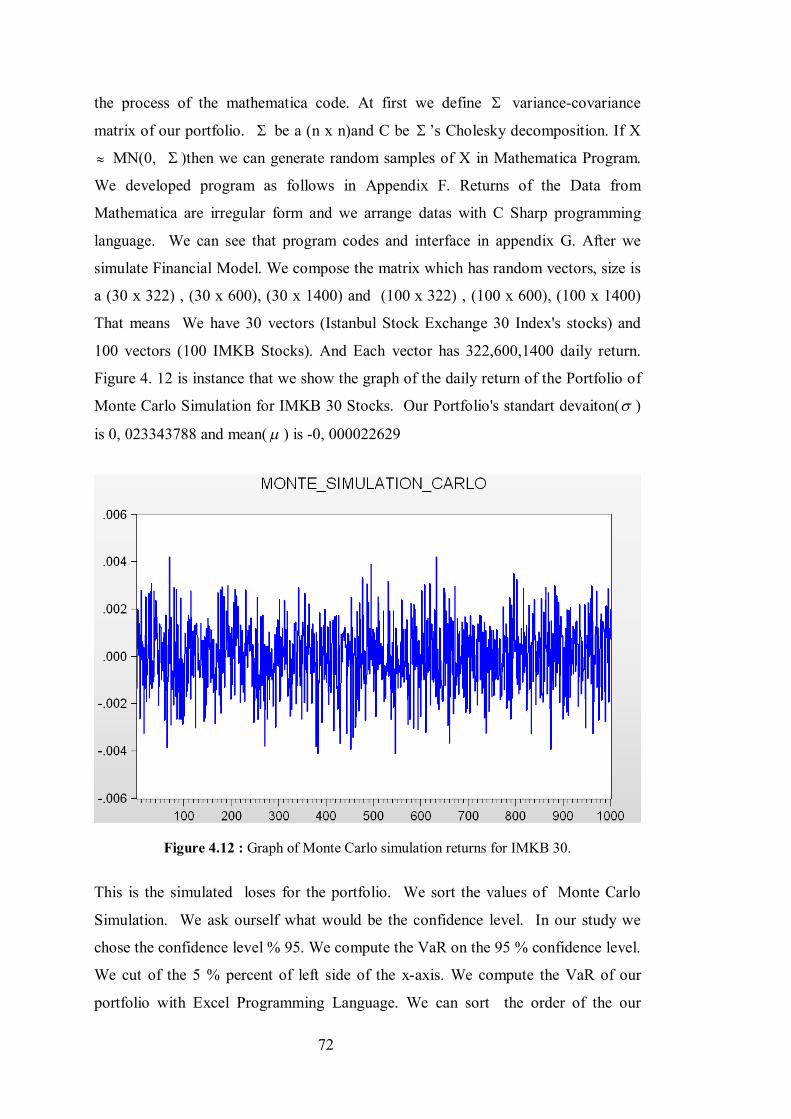
72
the process of the mathematica code. At first we define variance-covariance
matrix of our portfolio. be a (n x n)and C be ’s Cholesky decomposition. If X
MN(0, )then we can generate random samples of X in Mathematica Program.
We developed program as follows in Appendix F. Returns of the Data from
Mathematica are irregular form and we arrange datas with C Sharp programming
language. We can see that program codes and interface in appendix G. After we
simulate Financial Model. We compose the matrix which has random vectors, size is
a (30 x 322) , (30 x 600), (30 x 1400) and (100 x 322) , (100 x 600), (100 x 1400)
That means We have 30 vectors (Istanbul Stock Exchange 30 Index's stocks) and
100 vectors (100 IMKB Stocks). And Each vector has 322,600,1400 daily return.
Figure 4. 12 is instance that we show the graph of the daily return of the Portfolio of
Monte Carlo Simulation for IMKB 30 Stocks. Our Portfolio's standart devaiton( )
is 0, 023343788 and mean( ) is -0, 000022629
Figure 4.12 : Graph of Monte Carlo simulation returns for IMKB 30.
This is the simulated loses for the portfolio. We sort the values of Monte Carlo
Simulation. We ask ourself what would be the confidence level. In our study we
chose the confidence level % 95. We compute the VaR on the 95 % confidence level.
We cut of the 5 % percent of left side of the x-axis. We compute the VaR of our
portfolio with Excel Programming Language. We can sort the order of the our

73
portfolio's daily returns. The sample size of our portfolio is 1000 observation of daily
return. In 5 % confidence level 50th order of the simulation is our VaR value. VaR is
-0.023343788.
4. 3. 4 Computational problem
As we mention about before given a set of 30 instruments AKBANK, ARCELIK ,
ASYA BANK , BIM MARKETS, DOGAN HOLING, DYHOL, ECILC, ENKAI,
EREGL, GARAN, ISCTR, KRDMD, KCHOL, KOZAA, PETKM, SAHOL,
SKBNK, SISE, HALKB, TAVHL, TKFEN, TEBNK, TOASO, TCELL,
TUPRS, THYAO, TTKOM, VAKBN, VESTL with with possibly uncertain
returns. Our target is to select a portfolio of the instruments so as to maximize utility
or minimize the risk. We remember our portfolio model. In our study we denoted
variance of the portfolio below expression.
WWp '2
In our Computational Problem our main purpose for a given expected level we minimize the
risk or for given risk level maximize the expected return. Our main function of this model is
W’W
N
x
N
jijji xxMin
1 1.
In our computational problem production portfolio selection we have two main
boundry conditions. One of them is expected return level
N
iii Rx
1
The other one is sum of the weight function is equal the unique.
N
iix
11
When we gather together all conditions. And xi stock variables are positive numbers.
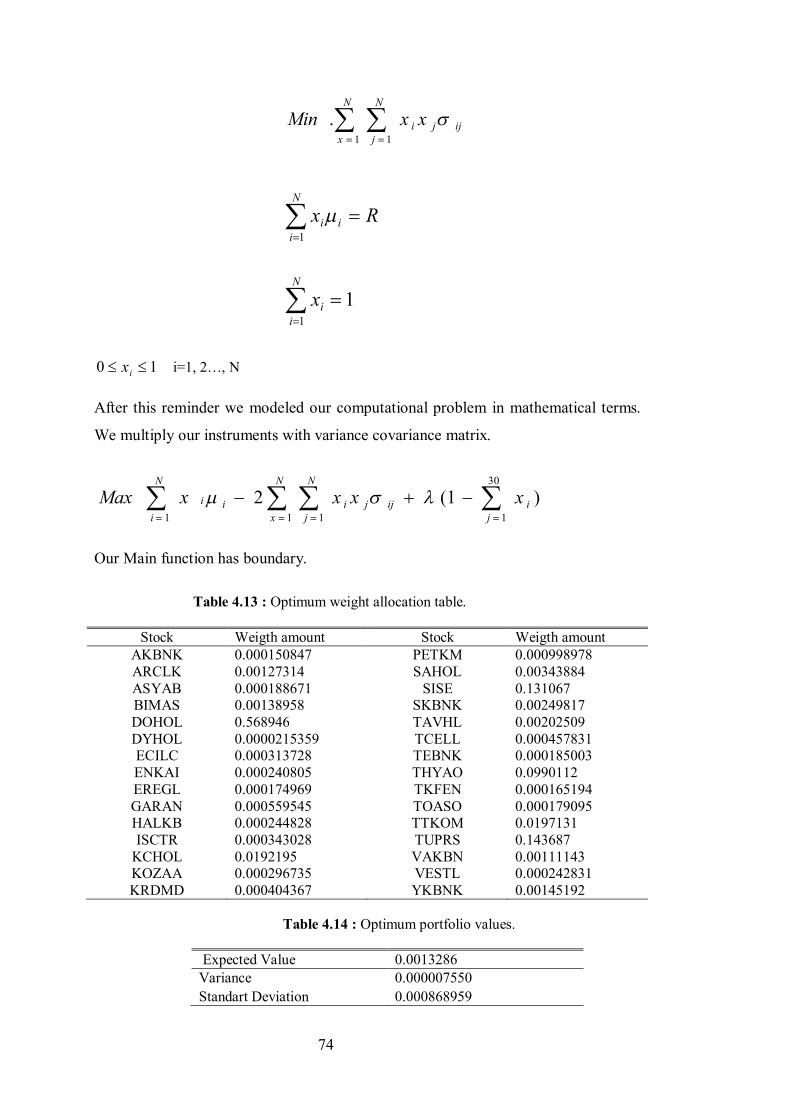
74
N
x
N
jijji xxMin
1 1.
N
iii Rx
1
N
iix
11
10 ix i=1, 2…, N
After this reminder we modeled our computational problem in mathematical terms.
We multiply our instruments with variance covariance matrix.
)1(230
11 11
j
i
N
x
N
jijji
N
iii xxxxMax
Our Main function has boundary.
Table 4.13 : Optimum weight allocation table.
Stock Weigth amount Stock Weigth amount AKBNK 0.000150847 PETKM 0.000998978 ARCLK 0.00127314 SAHOL 0.00343884 ASYAB 0.000188671 SISE 0.131067 BIMAS 0.00138958 SKBNK 0.00249817 DOHOL 0.568946 TAVHL 0.00202509 DYHOL 0.0000215359 TCELL 0.000457831 ECILC 0.000313728 TEBNK 0.000185003 ENKAI 0.000240805 THYAO 0.0990112 EREGL 0.000174969 TKFEN 0.000165194 GARAN 0.000559545 TOASO 0.000179095 HALKB 0.000244828 TTKOM 0.0197131 ISCTR 0.000343028 TUPRS 0.143687
KCHOL 0.0192195 VAKBN 0.00111143 KOZAA 0.000296735 VESTL 0.000242831 KRDMD 0.000404367 YKBNK 0.00145192
Table 4.14 : Optimum portfolio values.
Expected Value 0.0013286 Variance 0.000007550 Standart Deviation 0.000868959

75
)1(2),,...,,(30
1
30
1
30
1
30
1
j
ix j
ijjix
ii xxxxykbnkarclkakbankf
This above diagram shows us how to model computational problem under the two
boundry.We use these boundries which are called Lagrange multiplier for cmputing
computational problem.We have 32 equations and 2 boundry. We derivative each of
the equation equalize them to the zero for calculating optimum points for the equa-
tion system.

76
4. 4 Comparision
In this section we illustrate and compare the performance of the four risk
measurement models. Every model has advantages and disadvantages for measuring
value at risk. First method of computing value at risk is Historical method. The
historical VaR model assumes that all possible future variations have been
experienced in the past. The main limitations of historical VaR stem from the
constraints imposed by the sample size. The number of data points used to construct
the historical distribution must be equal to number of observations on each financial
instrument's returns. Our Sample size contains of total 322 observations. We select
our sample size number as large as possible. Gathering such data can be a difficult
and time consuming task. We spend some much time when we collect the data set.
On the other hand, one great advantage of historical VaR is that it makes few
distributional assumptions. There is no assumption of the return distribution. The
other method of computing VaR is Monte Carlo simulation. Monte Carlo VaR model
uses the same assumptions as Historical Simulation that the risk factor returns are
independent identically distributed. But these independent identically distributed
vectors transformed to correlated multivariate normal vectors with cholesky
decomposition. With this conversion one for each simulated vector of correlated risk
factor returns. To reduce the sampling error we generate a very large number of
simulations. In our example we generate 1000 simulation for our each financial
instrument. We spent some much time when we modelled monte carlo simulation.
And it is needed high performance computer programming when we modelled it. The
other method for measuring the VaR is Variance-Covariance Method. The variance-
covariance method is based on the assumption that the underlying market factors
have a normal distribution. With this assumption it is possible that determine the
VaR. When we compare the VaR for one day later. Historical and Monte Carlo is so
closed to on 30. 04. 2011 value. Garch Models compute the high VaR. Reason of the
high volaility is for the Garch models large returns are followed by more large
returns. When we compute the VaR, last 11 iteration of returns of asset's value is too
high. After this season returns of asset's become normal market values.

77
Table 4.15 : Comparasion of var results.
Model Standart Deviation Variance Historical Simulation 0.024541327 0.00060228 Variance Covariance 0.0147568 0.00021776
Monte Carlo simulation 0.023343788 0.000544932 Garch(1.1) 0.0359721 0.00129399
Real Value(30.04.2011) 0.023673567 0.000560438
Table 4.16 : Comparasion of var results IMKB 30.
Model Standart Deviation Variance Monte Carlo simulation 322 0.0201 0.0000040401 Monte Carlo simulation 600 0.01949968 0.0000038024 Monte Carlo simulation 1400 0.0198583 0.0000039435 Real Value (30.04.2011) 0.023673567 0.000560438
Table 4.17 : Comparasion of var results of concerning 100 IMKB stock.
Model Standart Deviation Variance Monte Carlo simulation 322 -0.001531272 0.0000023448 Monte Carlo simulation 600 -0.001511556 0.0000022848 Monte Carlo simulation 1400 -0.001679334 0.0000028202 Real Value(30.04.2011) -0.001506800 0.0000022704
Figure 4.13 : Graph of Monte Carlo simulation returns for IMKB 30 for 322,600,1400.

78
Figure 4.14 : Graph of Monte Carlo simulation returns for 100IMKB for 322,600,1400.

79
5. CONCLUSION
Financial crisis has a disastrous effect on the global economy, These crises can and
will be avoided, but only when financial risk managers acquire the knowledge ,
skills and framework they really need to operate effectively in their profession
Proprietary trading by banks increases liquidity, but it may also increase volatility.
Traditionally, banks are short volatility because investors want to be long volatility.
It is an excellent diversification instrument. One of the main target of risk
management is to protect an institution against unacceptable losses. Value at risk has
become as a risk assessment tool at banks and other financial service firms in
recently years. And the concept and use of value at risk is recent. Value at risk was
first used by major financial firms in the late 1980's to measure the risks of
portfolios. Its usage in these firms has been driven by the failure of the risk tracking
systems used until the early 1990s to detect dangerous risk taking on the part of
traders and it offered a key benefit a measure of capital at risk under extreme
conditions in trading portfolios that could be updated on a regular basis. In this
paper, we studied the problem of detecting multiple change points in individual
parameters of a GARCH model and we present the performance of the VaR
estimation engine and demonstrate in three areas: 1) Historical Simulation 2)
Variance-Covariance and 3) Monte Carlo Simulation. At the end of the estimation
we have shown how a quantitative theory for portfolio management can be
developed using the expected return to model risk. We apply value at risk model on
the portfolio which contains Istanbul Stock Exchange 30 Index's stocks. We compare
the result of the VaR. Results are so close to each other and Real Value of the VaR.
The Monte Carlo Method has a great performance to quantify risk. But it takes so
much time that is why we can't choose this model. Garch techniques has a greater
risk value than Real and variance Covariance risk value. The Reason of this situation
Garch Methods focus on the last n iteration and last n returns effect the results more
the historical returns. Large returns are followed by more large returns. The returns
of the stock data considered in this study are normally distributed during Monte
Carlo, Historical, Garch Methods. Last stage of our study we calculate the

80
optimum allocation of our portfolio's stock. Our expected value is 0.0013286 and
standart deviation is 0.000868959 on optimum allocation level. In this level in Table
4.7 show us distribution level of each stock. Our main target is to compute the
minimum risk underlying a given expected return level. Our main funtion has a one
boundary. Volatilites of the assets are computed by Garch Methods. Expected value
is 0.0013286 and standart deviation is 0.000868959.On the Other hand we compare
the approximation of VaR with different data size.We computing VaR with Monte
Carlo simulation in different data size. We produce syntechtic datas set for
322,600, 1400 amount of data for portfolio which concern IMKB30 and 100 IMKB
stocks for comparing result with real value.In table 4.16 and Table 4.17 results of
VaR is shown.when we decrease sample of the data size we notice that result of
syntechtic data close to real value.
81
REFERENCES
Alexender, Carol Alexander, C. (2008) Market Risk Analysis, Volume IV: Value at Risk Models. Angelidis, Timotheos Alexandros Benos and Stavros Degiannakis 2007 The Use of GARCH Models in VaR Estimation Bengtsson, Mattias and Viktor Olsbo, 2003: Value at Risk Using Stochastic Volatility Models. Billioa, Monica Massimiliano Caporinb, and Michele Gobbo 2006
Flexible Dynamic Conditional Correlation multivariate GARCH models for asset allocation.
Bohdalová, Maria 2007 A comparison of Value-at-Risk methods for measurement of the financial risk Burns, Patrick 2000 The Quality of Value at Risk via Univariate GARCH CHUL GYU PARK and DONG WAN SHIN, 2004 An Algorithm for generating correlated Random variables in a class of infinitely divisible distributions Dixon, Matthew Jike Chong, Kurt Keutzer , Jike Chong 2009: Acceleration of
Market Value-at-Risk Estimation Guochun Li, Bogdan 2004 Value at Risk Models for a Nonlinear Hedged Portfolio Haugh,Martin 2004: The Monte Carlo Framework, Examples from Finance and Generating Correlated Random Variables Monte Carlo Simulation Irina N. Khindanova And Svetlozar T. Rachev Santa Barbara 2001 VALUE AT RISK RECENT ADVANCES JI-CHUN LIU, 2009: Stationarity of a family of GARCH processes . School of Mathematical Science, Xiamen University, Xiamen, 361005, PR China Jorion - Mcgraw-Hill, 1997: Value At Risk The New Benchmark For Managing Financial Risk Korkmaz ,Turhan, Pekkaya , Mehmet 2008 Excel Uygulamalı Finans Matematiği ÖZBEY ,Fela 2005 Çok Değişkenli GARCH Modelleri ve bir uygulama Türkiye’de Belirsizliğin enflasyon ve çıktıdaki büyüme üzerine etkisi Norstad, John 2002: - An Introduction to Portfolio Theory Paul J. Atzberger Portfolio Optimization Unconstrained Portfolios Pedro Galeano and Ruey S. Tsay 2009 Shifts in Individual Parameters of a GARCH Model ROBERT F. ENGLE, SERGIO M. FOCARDI, FRANK J. FABOZZI,
Michael Armellino 2007 ARCH/GARCH Models in Applied. Perrelli , Roberto 2001 - Introduction to ARCH & GARCH models Terasvirta, Timo T. G. Andersen, R. A. Davis, J. -P. Kreiss and T. Mikosch
82
2007 Multivariate GARCH models To appear in T. G. Andersen, R. A. Davis, J. -P. Kreiss andT. Mikosch, 2009 Multivariate GARCH models. Ulucan,Aydın 2000: Kuadratik Programlama Modelinin Portföy Optimizasyonu. Url-1 http://en. wikipedia. org/wiki/File:Dice_Distribution_(bar). svg 02. 26. 2011 Url-2 http://www. stattucino. com/berrie/normal. html 17. 03. 2011 Url-3 http://www. investopedia. com/articles/04/092904. asp 02. 04. 2011 Url-4 http://en. wikipedia. org/wiki/Autoregressive_conditional_heteroskedasticity

83
APPENDICES
APPENDIX A. 5 : Composing Correlation Matrix with Mathematica Codes APPENDIX A. 6 : Composing Monte Carlo Simulation With Mathematica APPENDIX A. 7 : Developing C# codes and interface for arranging form of data
range
APPENDIX A. 1 : Plot Graph of the Portfolio's stock return series. APPENDIX A. 2 : Histogram and Statics of Portfolio's Stock APPENDIX A. 3 : Daily Return End of Day Portfolio's Stock Value and
Daily Return End of 100 Stocks of IMKB APPENDIX A. 4 : Composing Variance Matrix with Mathematica Codes

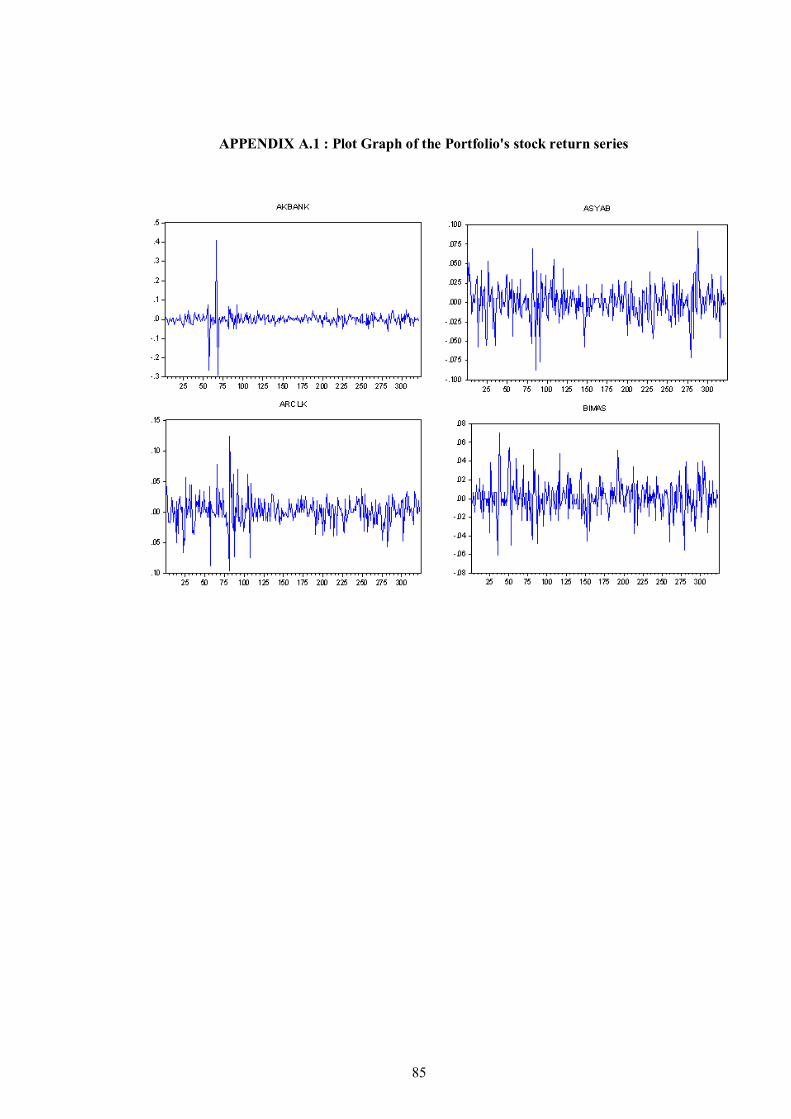
85
APPENDIX A.1 : Plot Graph of the Portfolio's stock return series
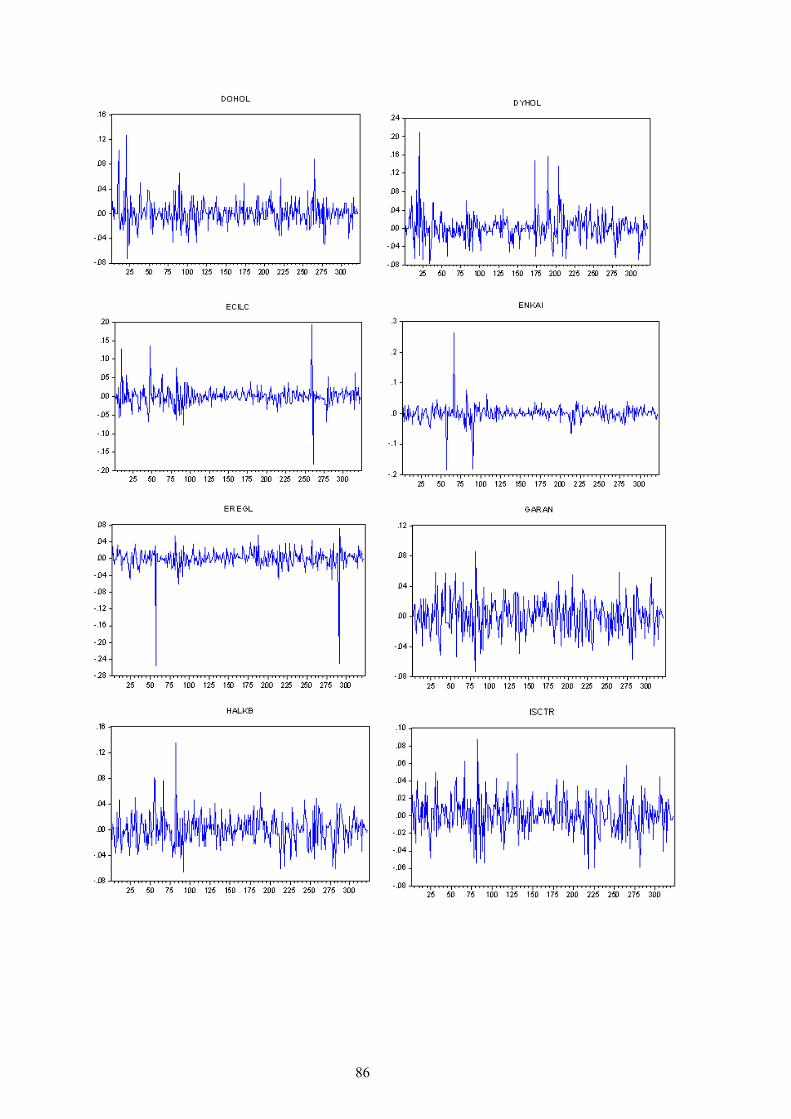
86

87

88
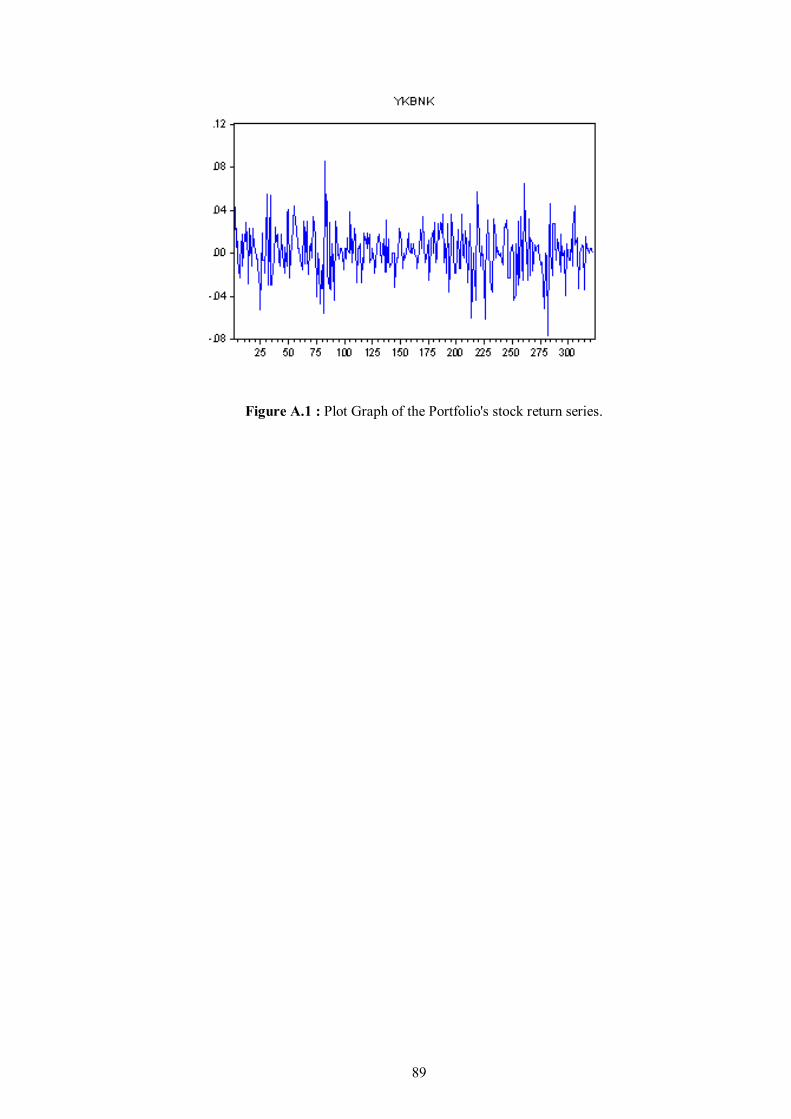
89
Figure A.1 : Plot Graph of the Portfolio's stock return series.

90
APPENDIX A.2 : Histogram and Statics of Portfolio's Stock
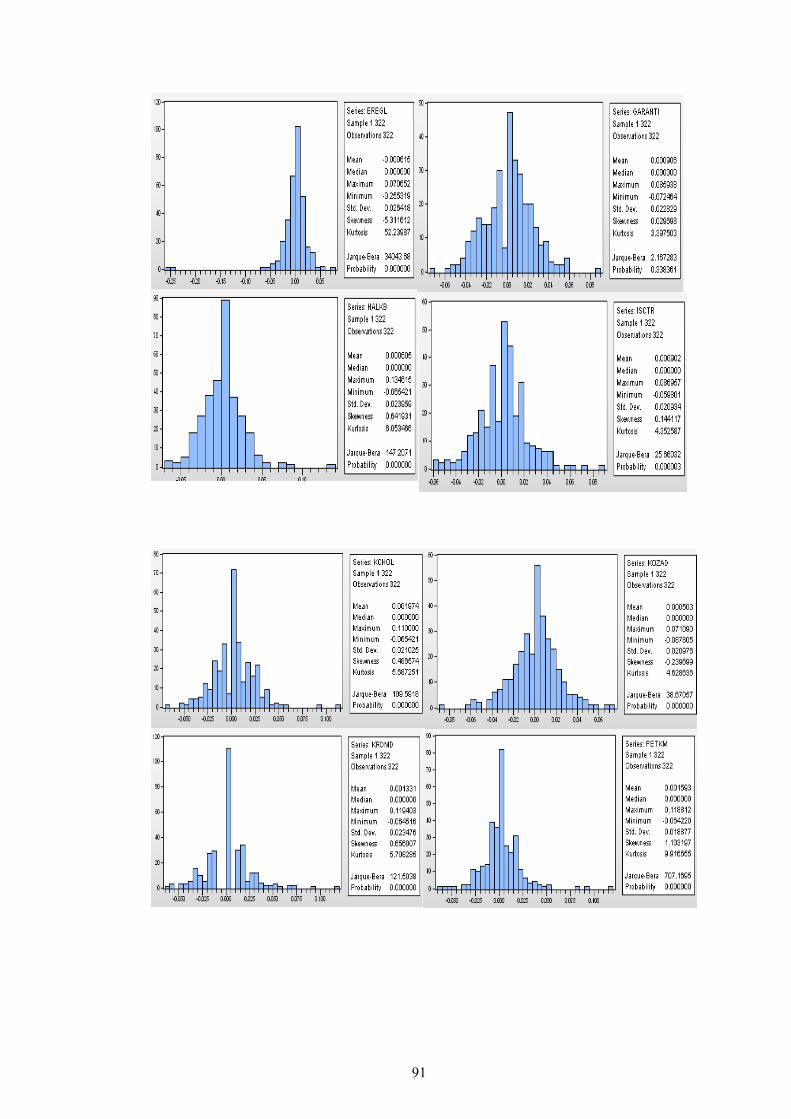
91
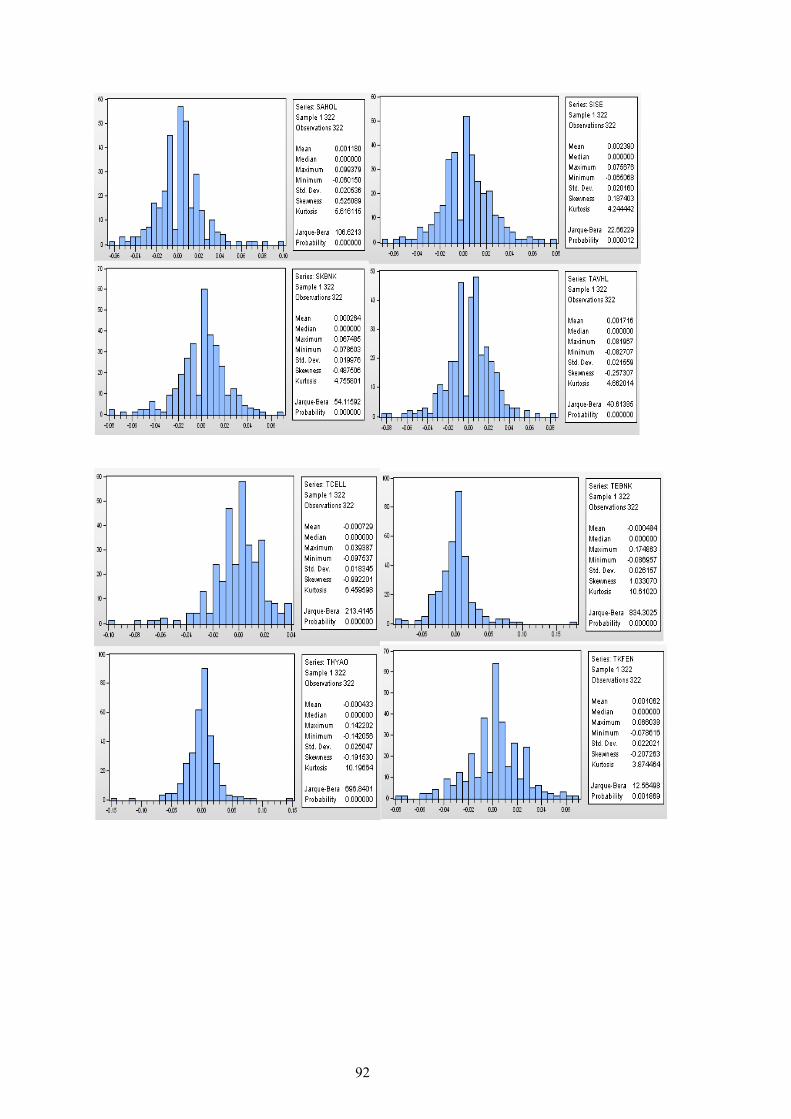
92

93
Figure A.2 : Histogram and Statics of Portfolio's Stock
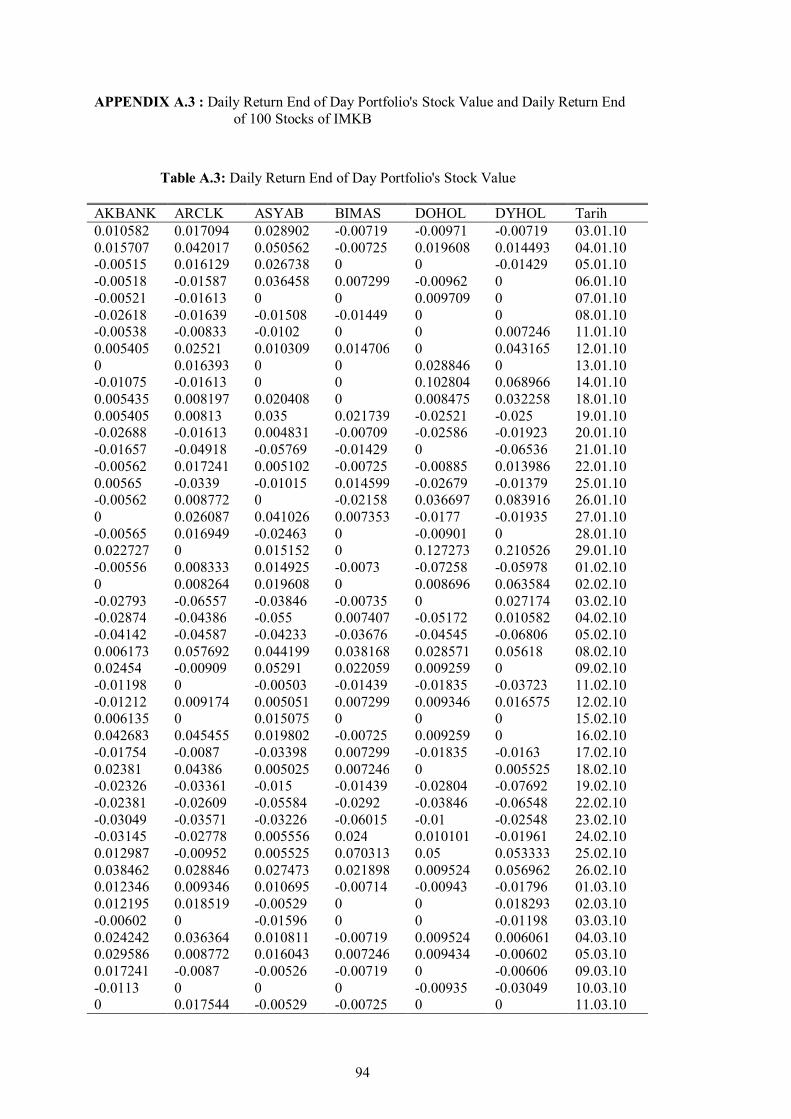
94
APPENDIX A.3 : Daily Return End of Day Portfolio's Stock Value and Daily Return End of 100 Stocks of IMKB
Table A.3: Daily Return End of Day Portfolio's Stock Value AKBANK ARCLK ASYAB BIMAS DOHOL DYHOL Tarih 0.010582 0.017094 0.028902 -0.00719 -0.00971 -0.00719 03.01.10 0.015707 0.042017 0.050562 -0.00725 0.019608 0.014493 04.01.10 -0.00515 0.016129 0.026738 0 0 -0.01429 05.01.10 -0.00518 -0.01587 0.036458 0.007299 -0.00962 0 06.01.10 -0.00521 -0.01613 0 0 0.009709 0 07.01.10 -0.02618 -0.01639 -0.01508 -0.01449 0 0 08.01.10 -0.00538 -0.00833 -0.0102 0 0 0.007246 11.01.10 0.005405 0.02521 0.010309 0.014706 0 0.043165 12.01.10 0 0.016393 0 0 0.028846 0 13.01.10 -0.01075 -0.01613 0 0 0.102804 0.068966 14.01.10 0.005435 0.008197 0.020408 0 0.008475 0.032258 18.01.10 0.005405 0.00813 0.035 0.021739 -0.02521 -0.025 19.01.10 -0.02688 -0.01613 0.004831 -0.00709 -0.02586 -0.01923 20.01.10 -0.01657 -0.04918 -0.05769 -0.01429 0 -0.06536 21.01.10 -0.00562 0.017241 0.005102 -0.00725 -0.00885 0.013986 22.01.10 0.00565 -0.0339 -0.01015 0.014599 -0.02679 -0.01379 25.01.10 -0.00562 0.008772 0 -0.02158 0.036697 0.083916 26.01.10 0 0.026087 0.041026 0.007353 -0.0177 -0.01935 27.01.10 -0.00565 0.016949 -0.02463 0 -0.00901 0 28.01.10 0.022727 0 0.015152 0 0.127273 0.210526 29.01.10 -0.00556 0.008333 0.014925 -0.0073 -0.07258 -0.05978 01.02.10 0 0.008264 0.019608 0 0.008696 0.063584 02.02.10 -0.02793 -0.06557 -0.03846 -0.00735 0 0.027174 03.02.10 -0.02874 -0.04386 -0.055 0.007407 -0.05172 0.010582 04.02.10 -0.04142 -0.04587 -0.04233 -0.03676 -0.04545 -0.06806 05.02.10 0.006173 0.057692 0.044199 0.038168 0.028571 0.05618 08.02.10 0.02454 -0.00909 0.05291 0.022059 0.009259 0 09.02.10 -0.01198 0 -0.00503 -0.01439 -0.01835 -0.03723 11.02.10 -0.01212 0.009174 0.005051 0.007299 0.009346 0.016575 12.02.10 0.006135 0 0.015075 0 0 0 15.02.10 0.042683 0.045455 0.019802 -0.00725 0.009259 0 16.02.10 -0.01754 -0.0087 -0.03398 0.007299 -0.01835 -0.0163 17.02.10 0.02381 0.04386 0.005025 0.007246 0 0.005525 18.02.10 -0.02326 -0.03361 -0.015 -0.01439 -0.02804 -0.07692 19.02.10 -0.02381 -0.02609 -0.05584 -0.0292 -0.03846 -0.06548 22.02.10 -0.03049 -0.03571 -0.03226 -0.06015 -0.01 -0.02548 23.02.10 -0.03145 -0.02778 0.005556 0.024 0.010101 -0.01961 24.02.10 0.012987 -0.00952 0.005525 0.070313 0.05 0.053333 25.02.10 0.038462 0.028846 0.027473 0.021898 0.009524 0.056962 26.02.10 0.012346 0.009346 0.010695 -0.00714 -0.00943 -0.01796 01.03.10 0.012195 0.018519 -0.00529 0 0 0.018293 02.03.10 -0.00602 0 -0.01596 0 0 -0.01198 03.03.10 0.024242 0.036364 0.010811 -0.00719 0.009524 0.006061 04.03.10 0.029586 0.008772 0.016043 0.007246 0.009434 -0.00602 05.03.10 0.017241 -0.0087 -0.00526 -0.00719 0 -0.00606 09.03.10 -0.0113 0 0 0 -0.00935 -0.03049 10.03.10 0 0.017544 -0.00529 -0.00725 0 0 11.03.10
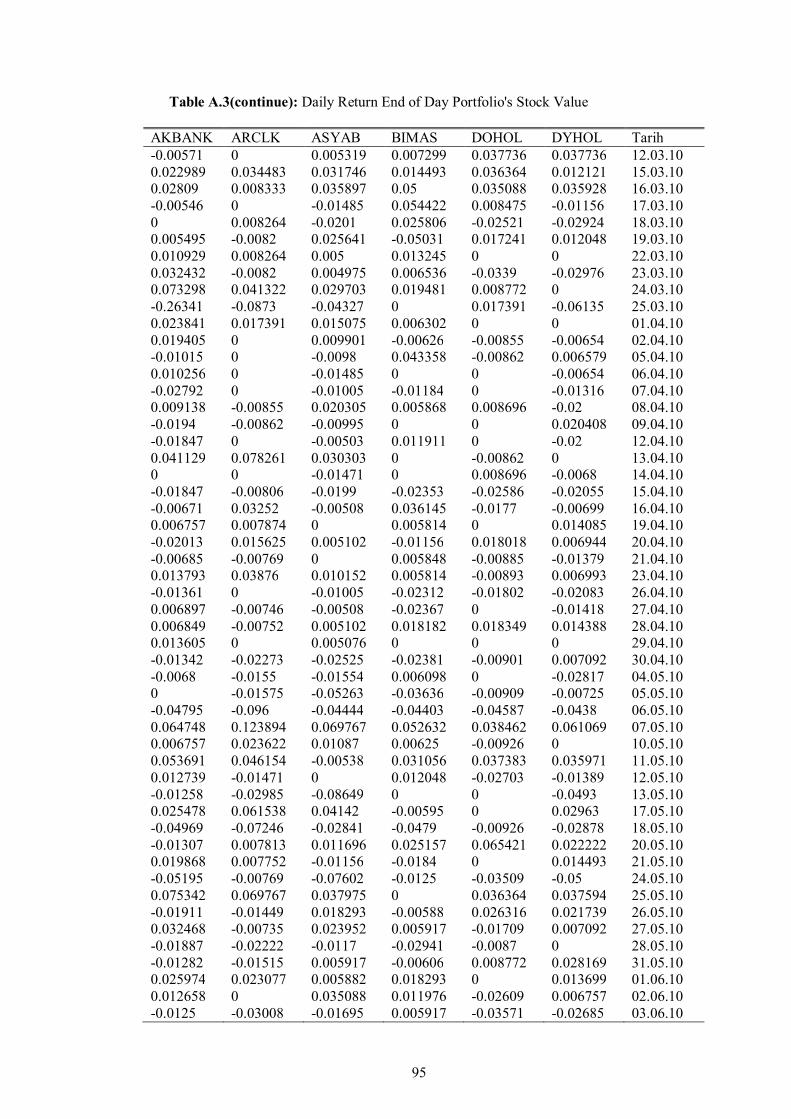
95
Table A.3(continue): Daily Return End of Day Portfolio's Stock Value AKBANK ARCLK ASYAB BIMAS DOHOL DYHOL Tarih -0.00571 0 0.005319 0.007299 0.037736 0.037736 12.03.10 0.022989 0.034483 0.031746 0.014493 0.036364 0.012121 15.03.10 0.02809 0.008333 0.035897 0.05 0.035088 0.035928 16.03.10 -0.00546 0 -0.01485 0.054422 0.008475 -0.01156 17.03.10 0 0.008264 -0.0201 0.025806 -0.02521 -0.02924 18.03.10 0.005495 -0.0082 0.025641 -0.05031 0.017241 0.012048 19.03.10 0.010929 0.008264 0.005 0.013245 0 0 22.03.10 0.032432 -0.0082 0.004975 0.006536 -0.0339 -0.02976 23.03.10 0.073298 0.041322 0.029703 0.019481 0.008772 0 24.03.10 -0.26341 -0.0873 -0.04327 0 0.017391 -0.06135 25.03.10 0.023841 0.017391 0.015075 0.006302 0 0 01.04.10 0.019405 0 0.009901 -0.00626 -0.00855 -0.00654 02.04.10 -0.01015 0 -0.0098 0.043358 -0.00862 0.006579 05.04.10 0.010256 0 -0.01485 0 0 -0.00654 06.04.10 -0.02792 0 -0.01005 -0.01184 0 -0.01316 07.04.10 0.009138 -0.00855 0.020305 0.005868 0.008696 -0.02 08.04.10 -0.0194 -0.00862 -0.00995 0 0 0.020408 09.04.10 -0.01847 0 -0.00503 0.011911 0 -0.02 12.04.10 0.041129 0.078261 0.030303 0 -0.00862 0 13.04.10 0 0 -0.01471 0 0.008696 -0.0068 14.04.10 -0.01847 -0.00806 -0.0199 -0.02353 -0.02586 -0.02055 15.04.10 -0.00671 0.03252 -0.00508 0.036145 -0.0177 -0.00699 16.04.10 0.006757 0.007874 0 0.005814 0 0.014085 19.04.10 -0.02013 0.015625 0.005102 -0.01156 0.018018 0.006944 20.04.10 -0.00685 -0.00769 0 0.005848 -0.00885 -0.01379 21.04.10 0.013793 0.03876 0.010152 0.005814 -0.00893 0.006993 23.04.10 -0.01361 0 -0.01005 -0.02312 -0.01802 -0.02083 26.04.10 0.006897 -0.00746 -0.00508 -0.02367 0 -0.01418 27.04.10 0.006849 -0.00752 0.005102 0.018182 0.018349 0.014388 28.04.10 0.013605 0 0.005076 0 0 0 29.04.10 -0.01342 -0.02273 -0.02525 -0.02381 -0.00901 0.007092 30.04.10 -0.0068 -0.0155 -0.01554 0.006098 0 -0.02817 04.05.10 0 -0.01575 -0.05263 -0.03636 -0.00909 -0.00725 05.05.10 -0.04795 -0.096 -0.04444 -0.04403 -0.04587 -0.0438 06.05.10 0.064748 0.123894 0.069767 0.052632 0.038462 0.061069 07.05.10 0.006757 0.023622 0.01087 0.00625 -0.00926 0 10.05.10 0.053691 0.046154 -0.00538 0.031056 0.037383 0.035971 11.05.10 0.012739 -0.01471 0 0.012048 -0.02703 -0.01389 12.05.10 -0.01258 -0.02985 -0.08649 0 0 -0.0493 13.05.10 0.025478 0.061538 0.04142 -0.00595 0 0.02963 17.05.10 -0.04969 -0.07246 -0.02841 -0.0479 -0.00926 -0.02878 18.05.10 -0.01307 0.007813 0.011696 0.025157 0.065421 0.022222 20.05.10 0.019868 0.007752 -0.01156 -0.0184 0 0.014493 21.05.10 -0.05195 -0.00769 -0.07602 -0.0125 -0.03509 -0.05 24.05.10 0.075342 0.069767 0.037975 0 0.036364 0.037594 25.05.10 -0.01911 -0.01449 0.018293 -0.00588 0.026316 0.021739 26.05.10 0.032468 -0.00735 0.023952 0.005917 -0.01709 0.007092 27.05.10 -0.01887 -0.02222 -0.0117 -0.02941 -0.0087 0 28.05.10 -0.01282 -0.01515 0.005917 -0.00606 0.008772 0.028169 31.05.10 0.025974 0.023077 0.005882 0.018293 0 0.013699 01.06.10 0.012658 0 0.035088 0.011976 -0.02609 0.006757 02.06.10 -0.0125 -0.03008 -0.01695 0.005917 -0.03571 -0.02685 03.06.10
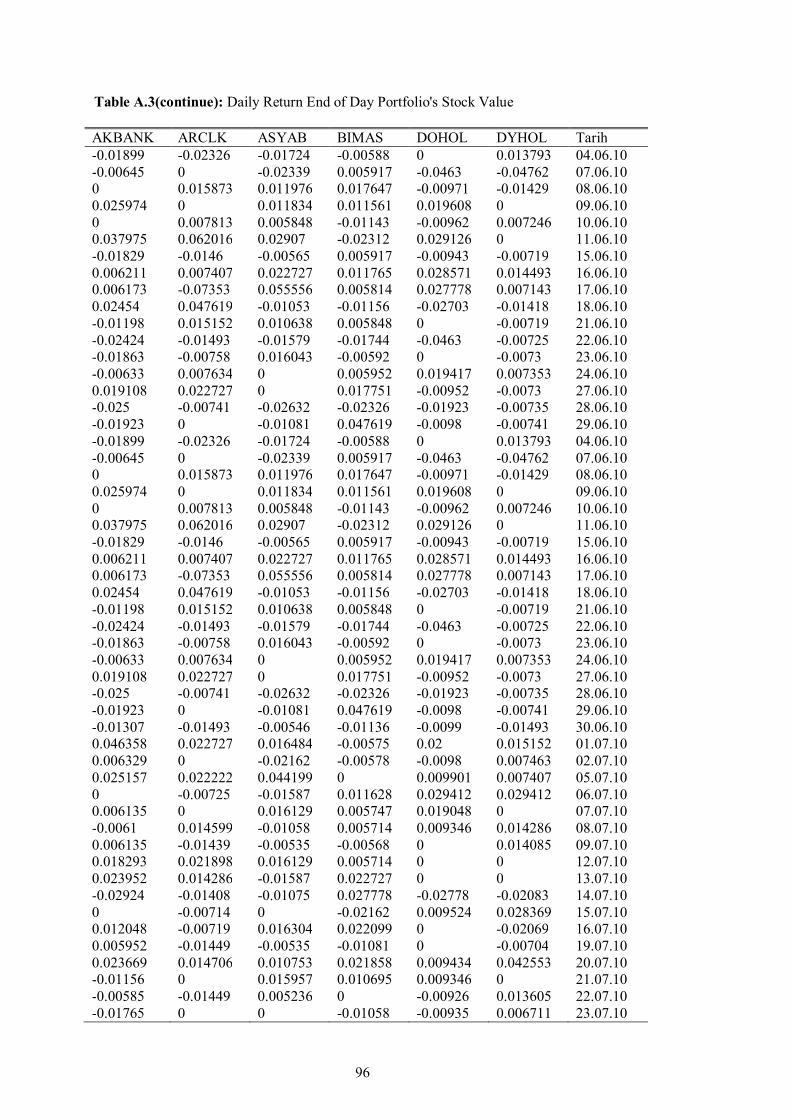
96
Table A.3(continue): Daily Return End of Day Portfolio's Stock Value AKBANK ARCLK ASYAB BIMAS DOHOL DYHOL Tarih -0.01899 -0.02326 -0.01724 -0.00588 0 0.013793 04.06.10 -0.00645 0 -0.02339 0.005917 -0.0463 -0.04762 07.06.10 0 0.015873 0.011976 0.017647 -0.00971 -0.01429 08.06.10 0.025974 0 0.011834 0.011561 0.019608 0 09.06.10 0 0.007813 0.005848 -0.01143 -0.00962 0.007246 10.06.10 0.037975 0.062016 0.02907 -0.02312 0.029126 0 11.06.10 -0.01829 -0.0146 -0.00565 0.005917 -0.00943 -0.00719 15.06.10 0.006211 0.007407 0.022727 0.011765 0.028571 0.014493 16.06.10 0.006173 -0.07353 0.055556 0.005814 0.027778 0.007143 17.06.10 0.02454 0.047619 -0.01053 -0.01156 -0.02703 -0.01418 18.06.10 -0.01198 0.015152 0.010638 0.005848 0 -0.00719 21.06.10 -0.02424 -0.01493 -0.01579 -0.01744 -0.0463 -0.00725 22.06.10 -0.01863 -0.00758 0.016043 -0.00592 0 -0.0073 23.06.10 -0.00633 0.007634 0 0.005952 0.019417 0.007353 24.06.10 0.019108 0.022727 0 0.017751 -0.00952 -0.0073 27.06.10 -0.025 -0.00741 -0.02632 -0.02326 -0.01923 -0.00735 28.06.10 -0.01923 0 -0.01081 0.047619 -0.0098 -0.00741 29.06.10 -0.01899 -0.02326 -0.01724 -0.00588 0 0.013793 04.06.10 -0.00645 0 -0.02339 0.005917 -0.0463 -0.04762 07.06.10 0 0.015873 0.011976 0.017647 -0.00971 -0.01429 08.06.10 0.025974 0 0.011834 0.011561 0.019608 0 09.06.10 0 0.007813 0.005848 -0.01143 -0.00962 0.007246 10.06.10 0.037975 0.062016 0.02907 -0.02312 0.029126 0 11.06.10 -0.01829 -0.0146 -0.00565 0.005917 -0.00943 -0.00719 15.06.10 0.006211 0.007407 0.022727 0.011765 0.028571 0.014493 16.06.10 0.006173 -0.07353 0.055556 0.005814 0.027778 0.007143 17.06.10 0.02454 0.047619 -0.01053 -0.01156 -0.02703 -0.01418 18.06.10 -0.01198 0.015152 0.010638 0.005848 0 -0.00719 21.06.10 -0.02424 -0.01493 -0.01579 -0.01744 -0.0463 -0.00725 22.06.10 -0.01863 -0.00758 0.016043 -0.00592 0 -0.0073 23.06.10 -0.00633 0.007634 0 0.005952 0.019417 0.007353 24.06.10 0.019108 0.022727 0 0.017751 -0.00952 -0.0073 27.06.10 -0.025 -0.00741 -0.02632 -0.02326 -0.01923 -0.00735 28.06.10 -0.01923 0 -0.01081 0.047619 -0.0098 -0.00741 29.06.10 -0.01307 -0.01493 -0.00546 -0.01136 -0.0099 -0.01493 30.06.10 0.046358 0.022727 0.016484 -0.00575 0.02 0.015152 01.07.10 0.006329 0 -0.02162 -0.00578 -0.0098 0.007463 02.07.10 0.025157 0.022222 0.044199 0 0.009901 0.007407 05.07.10 0 -0.00725 -0.01587 0.011628 0.029412 0.029412 06.07.10 0.006135 0 0.016129 0.005747 0.019048 0 07.07.10 -0.0061 0.014599 -0.01058 0.005714 0.009346 0.014286 08.07.10 0.006135 -0.01439 -0.00535 -0.00568 0 0.014085 09.07.10 0.018293 0.021898 0.016129 0.005714 0 0 12.07.10 0.023952 0.014286 -0.01587 0.022727 0 0 13.07.10 -0.02924 -0.01408 -0.01075 0.027778 -0.02778 -0.02083 14.07.10 0 -0.00714 0 -0.02162 0.009524 0.028369 15.07.10 0.012048 -0.00719 0.016304 0.022099 0 -0.02069 16.07.10 0.005952 -0.01449 -0.00535 -0.01081 0 -0.00704 19.07.10 0.023669 0.014706 0.010753 0.021858 0.009434 0.042553 20.07.10 -0.01156 0 0.015957 0.010695 0.009346 0 21.07.10 -0.00585 -0.01449 0.005236 0 -0.00926 0.013605 22.07.10 -0.01765 0 0 -0.01058 -0.00935 0.006711 23.07.10
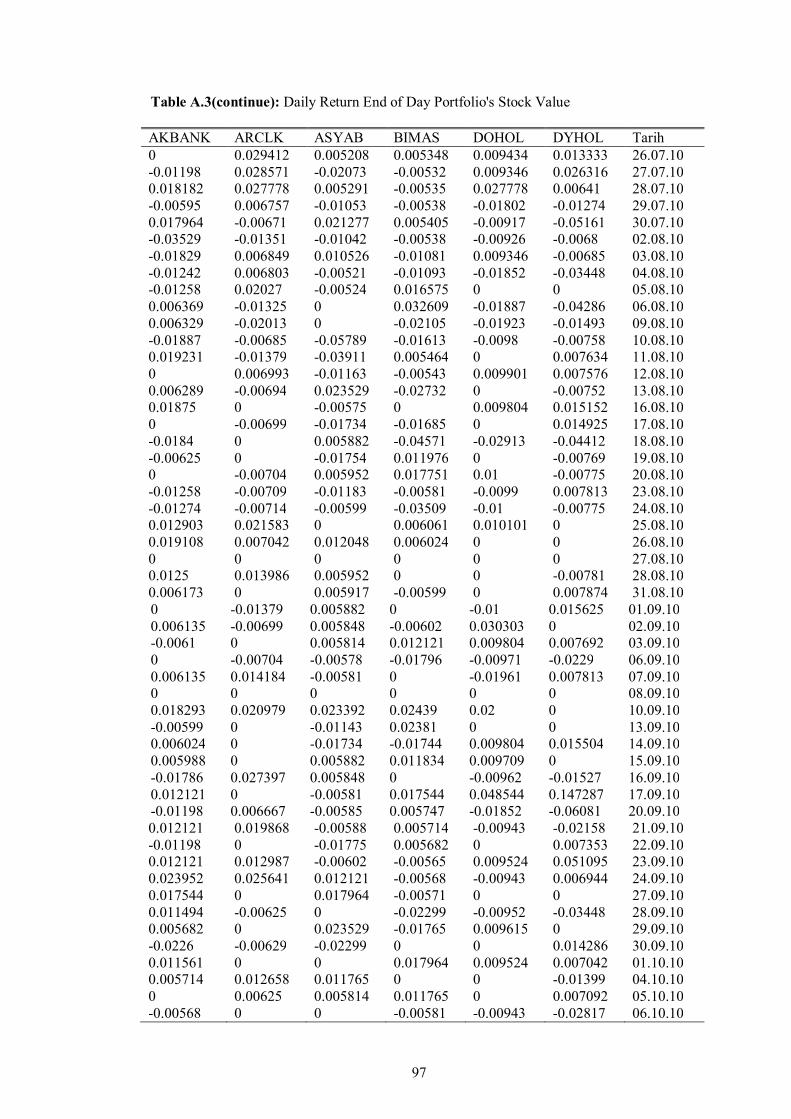
97
Table A.3(continue): Daily Return End of Day Portfolio's Stock Value AKBANK ARCLK ASYAB BIMAS DOHOL DYHOL Tarih 0 0.029412 0.005208 0.005348 0.009434 0.013333 26.07.10 -0.01198 0.028571 -0.02073 -0.00532 0.009346 0.026316 27.07.10 0.018182 0.027778 0.005291 -0.00535 0.027778 0.00641 28.07.10 -0.00595 0.006757 -0.01053 -0.00538 -0.01802 -0.01274 29.07.10 0.017964 -0.00671 0.021277 0.005405 -0.00917 -0.05161 30.07.10 -0.03529 -0.01351 -0.01042 -0.00538 -0.00926 -0.0068 02.08.10 -0.01829 0.006849 0.010526 -0.01081 0.009346 -0.00685 03.08.10 -0.01242 0.006803 -0.00521 -0.01093 -0.01852 -0.03448 04.08.10 -0.01258 0.02027 -0.00524 0.016575 0 0 05.08.10 0.006369 -0.01325 0 0.032609 -0.01887 -0.04286 06.08.10 0.006329 -0.02013 0 -0.02105 -0.01923 -0.01493 09.08.10 -0.01887 -0.00685 -0.05789 -0.01613 -0.0098 -0.00758 10.08.10 0.019231 -0.01379 -0.03911 0.005464 0 0.007634 11.08.10 0 0.006993 -0.01163 -0.00543 0.009901 0.007576 12.08.10 0.006289 -0.00694 0.023529 -0.02732 0 -0.00752 13.08.10 0.01875 0 -0.00575 0 0.009804 0.015152 16.08.10 0 -0.00699 -0.01734 -0.01685 0 0.014925 17.08.10 -0.0184 0 0.005882 -0.04571 -0.02913 -0.04412 18.08.10 -0.00625 0 -0.01754 0.011976 0 -0.00769 19.08.10 0 -0.00704 0.005952 0.017751 0.01 -0.00775 20.08.10 -0.01258 -0.00709 -0.01183 -0.00581 -0.0099 0.007813 23.08.10 -0.01274 -0.00714 -0.00599 -0.03509 -0.01 -0.00775 24.08.10 0.012903 0.021583 0 0.006061 0.010101 0 25.08.10 0.019108 0.007042 0.012048 0.006024 0 0 26.08.10 0 0 0 0 0 0 27.08.10 0.0125 0.013986 0.005952 0 0 -0.00781 28.08.10 0.006173 0 0.005917 -0.00599 0 0.007874 31.08.10 0 -0.01379 0.005882 0 -0.01 0.015625 01.09.10 0.006135 -0.00699 0.005848 -0.00602 0.030303 0 02.09.10 -0.0061 0 0.005814 0.012121 0.009804 0.007692 03.09.10 0 -0.00704 -0.00578 -0.01796 -0.00971 -0.0229 06.09.10 0.006135 0.014184 -0.00581 0 -0.01961 0.007813 07.09.10 0 0 0 0 0 0 08.09.10 0.018293 0.020979 0.023392 0.02439 0.02 0 10.09.10 -0.00599 0 -0.01143 0.02381 0 0 13.09.10 0.006024 0 -0.01734 -0.01744 0.009804 0.015504 14.09.10 0.005988 0 0.005882 0.011834 0.009709 0 15.09.10 -0.01786 0.027397 0.005848 0 -0.00962 -0.01527 16.09.10 0.012121 0 -0.00581 0.017544 0.048544 0.147287 17.09.10 -0.01198 0.006667 -0.00585 0.005747 -0.01852 -0.06081 20.09.10 0.012121 0.019868 -0.00588 0.005714 -0.00943 -0.02158 21.09.10 -0.01198 0 -0.01775 0.005682 0 0.007353 22.09.10 0.012121 0.012987 -0.00602 -0.00565 0.009524 0.051095 23.09.10 0.023952 0.025641 0.012121 -0.00568 -0.00943 0.006944 24.09.10 0.017544 0 0.017964 -0.00571 0 0 27.09.10 0.011494 -0.00625 0 -0.02299 -0.00952 -0.03448 28.09.10 0.005682 0 0.023529 -0.01765 0.009615 0 29.09.10 -0.0226 -0.00629 -0.02299 0 0 0.014286 30.09.10 0.011561 0 0 0.017964 0.009524 0.007042 01.10.10 0.005714 0.012658 0.011765 0 0 -0.01399 04.10.10 0 0.00625 0.005814 0.011765 0 0.007092 05.10.10 -0.00568 0 0 -0.00581 -0.00943 -0.02817 06.10.10
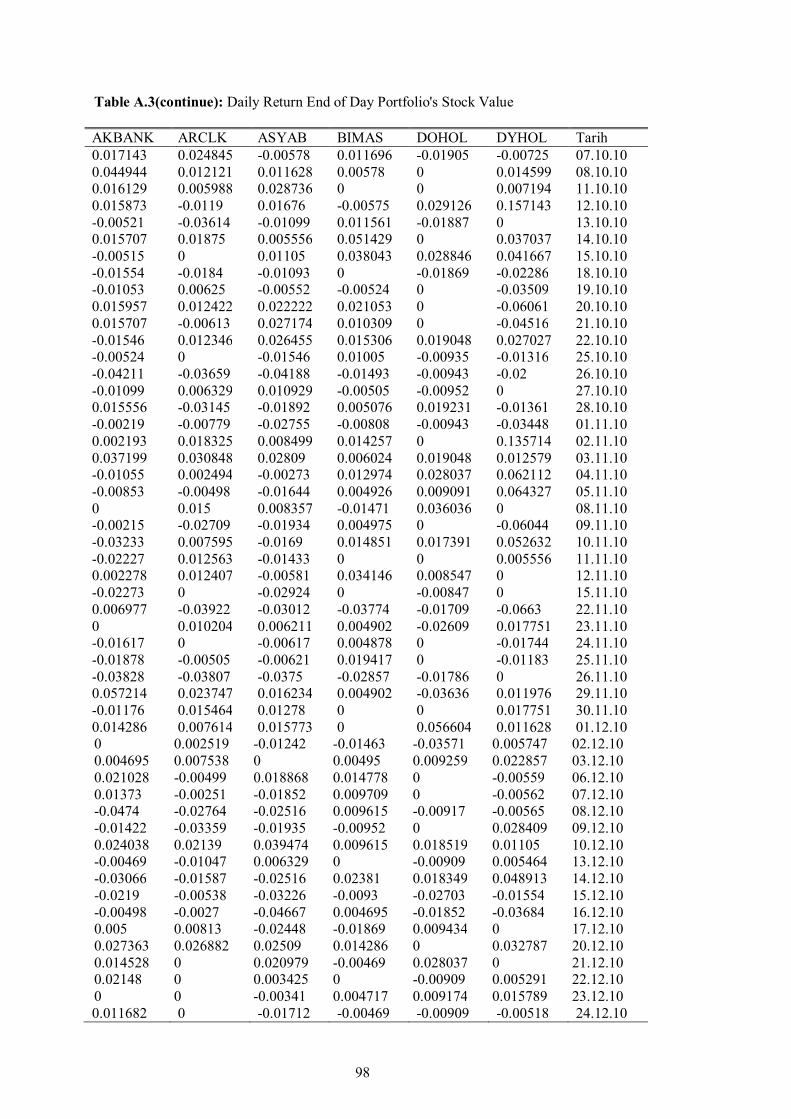
98
Table A.3(continue): Daily Return End of Day Portfolio's Stock Value AKBANK ARCLK ASYAB BIMAS DOHOL DYHOL Tarih 0.017143 0.024845 -0.00578 0.011696 -0.01905 -0.00725 07.10.10 0.044944 0.012121 0.011628 0.00578 0 0.014599 08.10.10 0.016129 0.005988 0.028736 0 0 0.007194 11.10.10 0.015873 -0.0119 0.01676 -0.00575 0.029126 0.157143 12.10.10 -0.00521 -0.03614 -0.01099 0.011561 -0.01887 0 13.10.10 0.015707 0.01875 0.005556 0.051429 0 0.037037 14.10.10 -0.00515 0 0.01105 0.038043 0.028846 0.041667 15.10.10 -0.01554 -0.0184 -0.01093 0 -0.01869 -0.02286 18.10.10 -0.01053 0.00625 -0.00552 -0.00524 0 -0.03509 19.10.10 0.015957 0.012422 0.022222 0.021053 0 -0.06061 20.10.10 0.015707 -0.00613 0.027174 0.010309 0 -0.04516 21.10.10 -0.01546 0.012346 0.026455 0.015306 0.019048 0.027027 22.10.10 -0.00524 0 -0.01546 0.01005 -0.00935 -0.01316 25.10.10 -0.04211 -0.03659 -0.04188 -0.01493 -0.00943 -0.02 26.10.10 -0.01099 0.006329 0.010929 -0.00505 -0.00952 0 27.10.10 0.015556 -0.03145 -0.01892 0.005076 0.019231 -0.01361 28.10.10 -0.00219 -0.00779 -0.02755 -0.00808 -0.00943 -0.03448 01.11.10 0.002193 0.018325 0.008499 0.014257 0 0.135714 02.11.10 0.037199 0.030848 0.02809 0.006024 0.019048 0.012579 03.11.10 -0.01055 0.002494 -0.00273 0.012974 0.028037 0.062112 04.11.10 -0.00853 -0.00498 -0.01644 0.004926 0.009091 0.064327 05.11.10 0 0.015 0.008357 -0.01471 0.036036 0 08.11.10 -0.00215 -0.02709 -0.01934 0.004975 0 -0.06044 09.11.10 -0.03233 0.007595 -0.0169 0.014851 0.017391 0.052632 10.11.10 -0.02227 0.012563 -0.01433 0 0 0.005556 11.11.10 0.002278 0.012407 -0.00581 0.034146 0.008547 0 12.11.10 -0.02273 0 -0.02924 0 -0.00847 0 15.11.10 0.006977 -0.03922 -0.03012 -0.03774 -0.01709 -0.0663 22.11.10 0 0.010204 0.006211 0.004902 -0.02609 0.017751 23.11.10 -0.01617 0 -0.00617 0.004878 0 -0.01744 24.11.10 -0.01878 -0.00505 -0.00621 0.019417 0 -0.01183 25.11.10 -0.03828 -0.03807 -0.0375 -0.02857 -0.01786 0 26.11.10 0.057214 0.023747 0.016234 0.004902 -0.03636 0.011976 29.11.10 -0.01176 0.015464 0.01278 0 0 0.017751 30.11.10 0.014286 0.007614 0.015773 0 0.056604 0.011628 01.12.10 0 0.002519 -0.01242 -0.01463 -0.03571 0.005747 02.12.10 0.004695 0.007538 0 0.00495 0.009259 0.022857 03.12.10 0.021028 -0.00499 0.018868 0.014778 0 -0.00559 06.12.10 0.01373 -0.00251 -0.01852 0.009709 0 -0.00562 07.12.10 -0.0474 -0.02764 -0.02516 0.009615 -0.00917 -0.00565 08.12.10 -0.01422 -0.03359 -0.01935 -0.00952 0 0.028409 09.12.10 0.024038 0.02139 0.039474 0.009615 0.018519 0.01105 10.12.10 -0.00469 -0.01047 0.006329 0 -0.00909 0.005464 13.12.10 -0.03066 -0.01587 -0.02516 0.02381 0.018349 0.048913 14.12.10 -0.0219 -0.00538 -0.03226 -0.0093 -0.02703 -0.01554 15.12.10 -0.00498 -0.0027 -0.04667 0.004695 -0.01852 -0.03684 16.12.10 0.005 0.00813 -0.02448 -0.01869 0.009434 0 17.12.10 0.027363 0.026882 0.02509 0.014286 0 0.032787 20.12.10 0.014528 0 0.020979 -0.00469 0.028037 0 21.12.10 0.02148 0 0.003425 0 -0.00909 0.005291 22.12.10 0 0 -0.00341 0.004717 0.009174 0.015789 23.12.10 0.011682 0 -0.01712 -0.00469 -0.00909 -0.00518 24.12.10

99
Table A.3(continue): Daily Return End of Day Portfolio's Stock Value AKBANK ARCLK ASYAB BIMAS DOHOL DYHOL Tarih 0.006928 0.005236 0.006969 0.009434 0.009174 0.020833 27.12.10 0.004587 0.002604 0.00346 0 0.027273 0.045918 28.12.10 0.006849 0.01039 -0.00345 0.004673 -0.0177 -0.0439 29.12.10 -0.02721 0.002571 -0.0173 -0.02326 0.009009 0 30.12.10 0.011655 0.025641 0.03169 0.02381 0 0.005102 31.12.10 0.006912 0.0125 -0.00341 0.004651 0.008929 0.010152 03.01.11 -0.01373 0.022222 0.017123 0.013889 0.026549 0.020101 04.01.11 0.00232 0.021739 0.026936 0 0.017241 0.054187 05.01.11 -0.01389 -0.00236 0.006557 0.004566 -0.01695 -0.02336 06.01.11 -0.02113 -0.01422 -0.01303 -0.00455 -0.00862 -0.00957 07.01.11 0.009592 0.038462 0.009901 -0.02283 -0.0087 -0.01932 10.01.11 0.026128 0.013889 -0.0098 0.004673 0 0.004926 12.01.11 -0.02083 0.013699 -0.0099 -0.01395 0 0.004902 13.01.11 -0.01418 -0.03153 -0.02333 -0.01887 0 0.014634 14.01.11 -0.01199 0.030233 -0.02048 0.009615 -0.01754 0 17.01.11 -0.01214 -0.00677 -0.01742 0.009524 -0.00893 -0.01923 18.01.11 -0.0344 -0.01136 -0.03191 0.004717 -0.02703 -0.03431 19.01.11 0.025445 0.006897 0.025641 0.00939 0.037037 0.040609 20.01.11 -0.04715 -0.03196 -0.00357 0.004651 0.017857 0.014634 21.01.11 0.020833 0.002358 0.021505 -0.00463 -0.00877 0 25.01.11 -0.02296 0 -0.01053 -0.0093 -0.02655 -0.02885 26.01.11 -0.0235 -0.00471 -0.02837 -0.04695 -0.01818 -0.03465 27.01.11 0.005348 -0.01418 0.021898 0.016749 0.018519 0.015385 28.01.11 0.034574 0.016787 0.025 0.017442 0.018182 0.045455 31.01.11 0.023136 -0.00943 -0.00697 0.009524 0.026786 -0.01449 01.02.11 -0.0402 -0.02619 -0.02456 -0.02358 -0.01739 -0.02941 02.02.11 0.036649 -0.00244 0.028777 -0.02899 0.088496 0.040404 03.02.11 -0.00505 -0.01961 -0.01748 0.006965 0.02439 0.024272 04.02.11 0.007614 0.02 0.007117 -0.01186 -0.01587 -0.00948 07.02.11 0.002519 -0.01716 0.017668 0.015 -0.00806 -0.00478 08.02.11 -0.01256 -0.01995 -0.01736 -0.01478 0.02439 -0.01442 09.02.11 -0.00254 0.012723 0 0 0.015873 0.009756 10.02.11 -0.0102 -0.00251 -0.00353 0.005 -0.02344 0 11.02.11 0.010309 0.015113 0 0.0199 0.016 0.004831 14.02.11 0.005102 0.004963 0.007092 0.029268 -0.01575 0.009615 15.02.11 0.032995 -0.01235 -0.00352 -0.01422 0 -0.00476 16.02.11 -0.01229 -0.045 0.010601 0.014423 0.016 0.047847 17.02.11 -0.00498 -0.02094 -0.02448 -0.00474 -0.04724 -0.0137 18.02.11 -0.0075 -0.01604 -0.01075 -0.02857 0.024793 -0.00926 21.02.11 -0.02267 -0.02717 -0.02899 -0.02451 -0.03226 -0.0514 22.02.11 -0.0232 0.005587 -0.0709 -0.05528 -0.05 -0.06404 23.02.11 0.002639 0.016667 0.012048 0.029787 0.008772 0.010526 24.02.11 -0.01579 0.013661 0.02381 0.039256 0.026087 0 25.02.11 -0.06417 -0.0566 -0.04651 0.013917 -0.00847 -0.04167 28.02.11 -0.02 -0.02286 0.036585 -0.01569 0 -0.01087 01.03.11 0.026239 0.026316 0.039216 0.015936 0.008547 0.021978 02.03.11 0.008523 -0.00855 -0.00377 0.004902 0 0.005376 03.03.11 -0.01972 -0.02299 -0.01515 -0.00488 -0.01695 -0.02674 04.03.11 0.020115 -0.01176 0.007692 0.009804 0 0.016484 07.03.11 0.04507 0.029762 0.091603 -0.02427 0 0.021622 08.03.11 0.043127 0.020231 0.006993 -0.00498 0.017241 0.005263 09.03.11 0.01292 0.002833 0.027778 -0.01 0.008475 0.020942 10.03.11
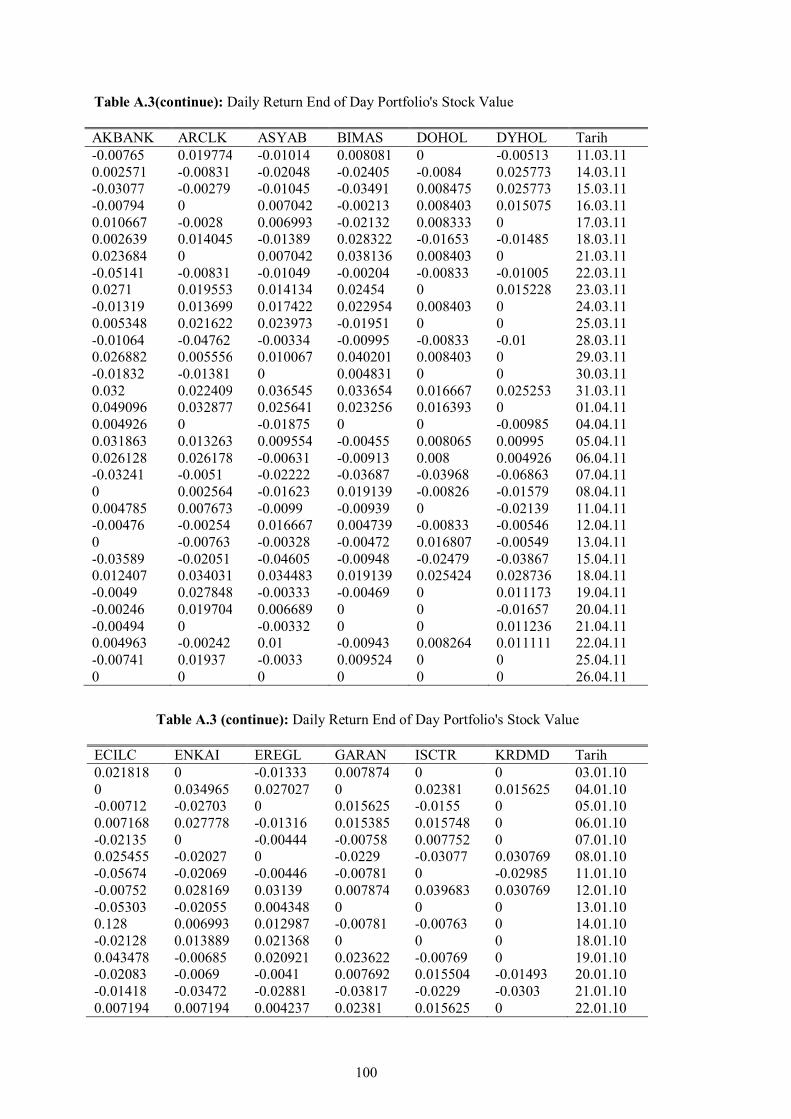
100
Table A.3(continue): Daily Return End of Day Portfolio's Stock Value AKBANK ARCLK ASYAB BIMAS DOHOL DYHOL Tarih -0.00765 0.019774 -0.01014 0.008081 0 -0.00513 11.03.11 0.002571 -0.00831 -0.02048 -0.02405 -0.0084 0.025773 14.03.11 -0.03077 -0.00279 -0.01045 -0.03491 0.008475 0.025773 15.03.11 -0.00794 0 0.007042 -0.00213 0.008403 0.015075 16.03.11 0.010667 -0.0028 0.006993 -0.02132 0.008333 0 17.03.11 0.002639 0.014045 -0.01389 0.028322 -0.01653 -0.01485 18.03.11 0.023684 0 0.007042 0.038136 0.008403 0 21.03.11 -0.05141 -0.00831 -0.01049 -0.00204 -0.00833 -0.01005 22.03.11 0.0271 0.019553 0.014134 0.02454 0 0.015228 23.03.11 -0.01319 0.013699 0.017422 0.022954 0.008403 0 24.03.11 0.005348 0.021622 0.023973 -0.01951 0 0 25.03.11 -0.01064 -0.04762 -0.00334 -0.00995 -0.00833 -0.01 28.03.11 0.026882 0.005556 0.010067 0.040201 0.008403 0 29.03.11 -0.01832 -0.01381 0 0.004831 0 0 30.03.11 0.032 0.022409 0.036545 0.033654 0.016667 0.025253 31.03.11 0.049096 0.032877 0.025641 0.023256 0.016393 0 01.04.11 0.004926 0 -0.01875 0 0 -0.00985 04.04.11 0.031863 0.013263 0.009554 -0.00455 0.008065 0.00995 05.04.11 0.026128 0.026178 -0.00631 -0.00913 0.008 0.004926 06.04.11 -0.03241 -0.0051 -0.02222 -0.03687 -0.03968 -0.06863 07.04.11 0 0.002564 -0.01623 0.019139 -0.00826 -0.01579 08.04.11 0.004785 0.007673 -0.0099 -0.00939 0 -0.02139 11.04.11 -0.00476 -0.00254 0.016667 0.004739 -0.00833 -0.00546 12.04.11 0 -0.00763 -0.00328 -0.00472 0.016807 -0.00549 13.04.11 -0.03589 -0.02051 -0.04605 -0.00948 -0.02479 -0.03867 15.04.11 0.012407 0.034031 0.034483 0.019139 0.025424 0.028736 18.04.11 -0.0049 0.027848 -0.00333 -0.00469 0 0.011173 19.04.11 -0.00246 0.019704 0.006689 0 0 -0.01657 20.04.11 -0.00494 0 -0.00332 0 0 0.011236 21.04.11 0.004963 -0.00242 0.01 -0.00943 0.008264 0.011111 22.04.11 -0.00741 0.01937 -0.0033 0.009524 0 0 25.04.11 0 0 0 0 0 0 26.04.11
Table A.3 (continue): Daily Return End of Day Portfolio's Stock Value ECILC ENKAI EREGL GARAN ISCTR KRDMD Tarih 0.021818 0 -0.01333 0.007874 0 0 03.01.10 0 0.034965 0.027027 0 0.02381 0.015625 04.01.10 -0.00712 -0.02703 0 0.015625 -0.0155 0 05.01.10 0.007168 0.027778 -0.01316 0.015385 0.015748 0 06.01.10 -0.02135 0 -0.00444 -0.00758 0.007752 0 07.01.10 0.025455 -0.02027 0 -0.0229 -0.03077 0.030769 08.01.10 -0.05674 -0.02069 -0.00446 -0.00781 0 -0.02985 11.01.10 -0.00752 0.028169 0.03139 0.007874 0.039683 0.030769 12.01.10 -0.05303 -0.02055 0.004348 0 0 0 13.01.10 0.128 0.006993 0.012987 -0.00781 -0.00763 0 14.01.10 -0.02128 0.013889 0.021368 0 0 0 18.01.10 0.043478 -0.00685 0.020921 0.023622 -0.00769 0 19.01.10 -0.02083 -0.0069 -0.0041 0.007692 0.015504 -0.01493 20.01.10 -0.01418 -0.03472 -0.02881 -0.03817 -0.0229 -0.0303 21.01.10 0.007194 0.007194 0.004237 0.02381 0.015625 0 22.01.10

101
Table A.3 (continue): Daily Return End of Day Portfolio's Stock Value ECILC ENKAI EREGL GARAN ISCTR KRDMD Tarih -0.01429 -0.00714 -0.00422 -0.00775 0.007692 -0.01563 25.01.10 0.057971 0 -0.00424 -0.01563 -0.01527 0.015873 26.01.10 -0.0137 0 0.008511 0.02381 0.03876 0 27.01.10 0.020833 0.014388 0.008439 -0.0155 -0.00746 0.015625 28.01.10 -0.01361 0.028369 0.016736 0.015748 0.022556 0 29.01.10 -0.0069 -0.02069 -0.01235 0.007752 -0.01471 0 01.02.10 -0.00694 -0.00704 -0.0125 -0.00769 -0.00746 0 02.02.10 -0.04895 -0.03546 -0.04219 -0.02326 -0.03008 -0.03077 03.02.10 0.014706 -0.03676 -0.04846 -0.03175 -0.03101 -0.04762 04.02.10 0 -0.01527 -0.02315 -0.03279 -0.048 -0.03333 05.02.10 0 0.015504 0.014218 0.016949 0.008403 0 08.02.10 0.021739 -0.01527 0.014019 -0.00833 0.008333 0.017241 09.02.10 0.007092 0 -0.02304 0 0.008264 0.016949 11.02.10 0 0.007752 0.004717 0.008403 -0.01639 0.016667 12.02.10 0.007042 0.015385 0.014085 0 0.016667 0 15.02.10 0 0.015152 0.032407 0.058333 0.04918 0.016393 16.02.10 -0.04196 -0.01493 0 -0.02362 -0.02344 -0.04839 17.02.10 -0.0292 -0.00758 0 0.040323 0.04 0.033898 18.02.10 -0.03759 -0.01527 -0.02691 -0.02326 -0.01538 -0.01639 19.02.10 0.015625 -0.03101 -0.01843 -0.03175 0 -0.01667 22.02.10 0.007692 -0.048 -0.03286 -0.04098 -0.01389 -0.0339 23.02.10 -0.00763 0 0.004854 -0.05128 -0.00939 -0.01754 24.02.10 0.030769 0.016807 0.019324 0.027027 0.014218 0.035714 25.02.10 0 0.033058 0.018957 0.035088 0.014019 0.017241 26.02.10 0.022388 0.008 -0.00465 0 0.004608 0.016949 01.03.10 -0.0219 -0.01587 -0.00467 0.016949 0.009174 0 02.03.10 0 0.016129 -0.00939 0.008333 -0.00909 0 03.03.10 -0.02985 0.02381 0.014218 0.057851 0.013761 0.016667 04.03.10 -0.03077 0 0.018692 -0.00781 0.00905 -0.01639 05.03.10 -0.06746 0.046512 -0.01376 -0.00787 -0.01345 0 09.03.10 -0.02553 0 -0.00465 -0.00794 -0.00455 0 10.03.10 0.135371 0 0.009346 -0.008 -0.00913 0 11.03.10 0.015385 -0.01481 -0.00463 -0.01613 -0.01843 0 12.03.10 -0.00758 0.022556 0.018605 0.040984 0.028169 0 15.03.10 0.007634 0.007353 0.018265 0.031496 0.022831 0.016667 16.03.10 -0.02273 -0.0219 -0.01794 -0.0229 -0.01339 -0.01639 17.03.10 0.031008 0 0.004566 0.015625 -0.00905 -0.03333 18.03.10 0.007519 0.007463 0.018182 0.023077 0 0.034483 19.03.10 -0.00746 0 0.008929 0.022556 0.009132 0.016667 22.03.10 0 0.014815 0.00885 0.036765 0.031674 -0.01639 23.03.10 0 0.029197 0.030702 0.056738 0.04386 0.066667 24.03.10 0 -0.18582 -0.25532 -0.05369 -0.0105 0 25.03.10 0.015038 0.006969 0.008571 0.007092 0.004246 0.015625 01.04.10 0.022222 -0.00692 0.011331 0.021127 0.016913 0 02.04.10 -0.02899 0.020906 -0.0084 -0.0069 0.006237 -0.03077 05.04.10 -0.01493 -0.00683 -0.00847 0.0125 0.012397 0.015873 06.04.10 0.037879 -0.00687 -0.00855 0.027435 -0.01429 0 07.04.10 0.058394 0.00692 0.005747 0.018692 0.012422 0.015625 08.04.10 -0.04138 0.013746 0.002857 -0.00786 0.02045 -0.01538 09.04.10 0.007194 -0.00678 -0.00285 -0.03303 -0.01002 0 12.04.10 -0.02143 0.262799 0 0.045082 0.062753 0.046875 13.04.10 -0.0073 -0.00676 -0.0042 -0.02614 0 0.119403 14.04.10
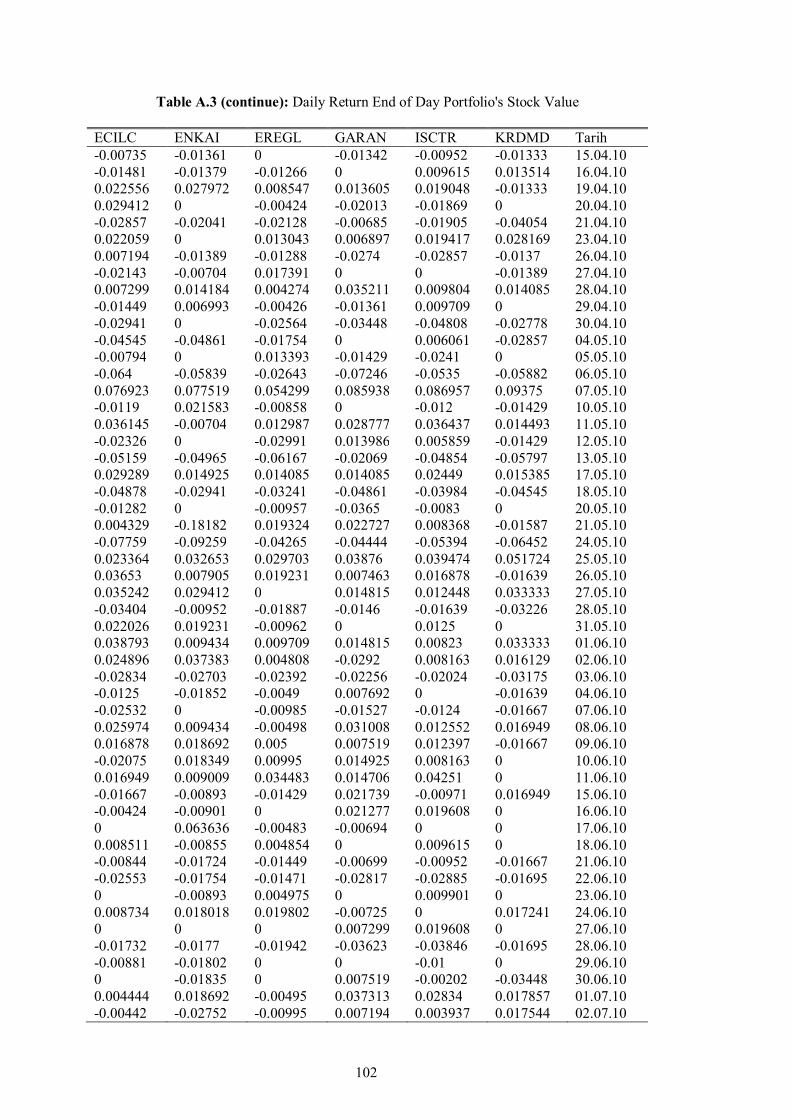
102
Table A.3 (continue): Daily Return End of Day Portfolio's Stock Value ECILC ENKAI EREGL GARAN ISCTR KRDMD Tarih -0.00735 -0.01361 0 -0.01342 -0.00952 -0.01333 15.04.10 -0.01481 -0.01379 -0.01266 0 0.009615 0.013514 16.04.10 0.022556 0.027972 0.008547 0.013605 0.019048 -0.01333 19.04.10 0.029412 0 -0.00424 -0.02013 -0.01869 0 20.04.10 -0.02857 -0.02041 -0.02128 -0.00685 -0.01905 -0.04054 21.04.10 0.022059 0 0.013043 0.006897 0.019417 0.028169 23.04.10 0.007194 -0.01389 -0.01288 -0.0274 -0.02857 -0.0137 26.04.10 -0.02143 -0.00704 0.017391 0 0 -0.01389 27.04.10 0.007299 0.014184 0.004274 0.035211 0.009804 0.014085 28.04.10 -0.01449 0.006993 -0.00426 -0.01361 0.009709 0 29.04.10 -0.02941 0 -0.02564 -0.03448 -0.04808 -0.02778 30.04.10 -0.04545 -0.04861 -0.01754 0 0.006061 -0.02857 04.05.10 -0.00794 0 0.013393 -0.01429 -0.0241 0 05.05.10 -0.064 -0.05839 -0.02643 -0.07246 -0.0535 -0.05882 06.05.10 0.076923 0.077519 0.054299 0.085938 0.086957 0.09375 07.05.10 -0.0119 0.021583 -0.00858 0 -0.012 -0.01429 10.05.10 0.036145 -0.00704 0.012987 0.028777 0.036437 0.014493 11.05.10 -0.02326 0 -0.02991 0.013986 0.005859 -0.01429 12.05.10 -0.05159 -0.04965 -0.06167 -0.02069 -0.04854 -0.05797 13.05.10 0.029289 0.014925 0.014085 0.014085 0.02449 0.015385 17.05.10 -0.04878 -0.02941 -0.03241 -0.04861 -0.03984 -0.04545 18.05.10 -0.01282 0 -0.00957 -0.0365 -0.0083 0 20.05.10 0.004329 -0.18182 0.019324 0.022727 0.008368 -0.01587 21.05.10 -0.07759 -0.09259 -0.04265 -0.04444 -0.05394 -0.06452 24.05.10 0.023364 0.032653 0.029703 0.03876 0.039474 0.051724 25.05.10 0.03653 0.007905 0.019231 0.007463 0.016878 -0.01639 26.05.10 0.035242 0.029412 0 0.014815 0.012448 0.033333 27.05.10 -0.03404 -0.00952 -0.01887 -0.0146 -0.01639 -0.03226 28.05.10 0.022026 0.019231 -0.00962 0 0.0125 0 31.05.10 0.038793 0.009434 0.009709 0.014815 0.00823 0.033333 01.06.10 0.024896 0.037383 0.004808 -0.0292 0.008163 0.016129 02.06.10 -0.02834 -0.02703 -0.02392 -0.02256 -0.02024 -0.03175 03.06.10 -0.0125 -0.01852 -0.0049 0.007692 0 -0.01639 04.06.10 -0.02532 0 -0.00985 -0.01527 -0.0124 -0.01667 07.06.10 0.025974 0.009434 -0.00498 0.031008 0.012552 0.016949 08.06.10 0.016878 0.018692 0.005 0.007519 0.012397 -0.01667 09.06.10 -0.02075 0.018349 0.00995 0.014925 0.008163 0 10.06.10 0.016949 0.009009 0.034483 0.014706 0.04251 0 11.06.10 -0.01667 -0.00893 -0.01429 0.021739 -0.00971 0.016949 15.06.10 -0.00424 -0.00901 0 0.021277 0.019608 0 16.06.10 0 0.063636 -0.00483 -0.00694 0 0 17.06.10 0.008511 -0.00855 0.004854 0 0.009615 0 18.06.10 -0.00844 -0.01724 -0.01449 -0.00699 -0.00952 -0.01667 21.06.10 -0.02553 -0.01754 -0.01471 -0.02817 -0.02885 -0.01695 22.06.10 0 -0.00893 0.004975 0 0.009901 0 23.06.10 0.008734 0.018018 0.019802 -0.00725 0 0.017241 24.06.10 0 0 0 0.007299 0.019608 0 27.06.10 -0.01732 -0.0177 -0.01942 -0.03623 -0.03846 -0.01695 28.06.10 -0.00881 -0.01802 0 0 -0.01 0 29.06.10 0 -0.01835 0 0.007519 -0.00202 -0.03448 30.06.10 0.004444 0.018692 -0.00495 0.037313 0.02834 0.017857 01.07.10 -0.00442 -0.02752 -0.00995 0.007194 0.003937 0.017544 02.07.10

103
Table A.3 (continue): Daily Return End of Day Portfolio's Stock Value ECILC ENKAI EREGL GARAN ISCTR KRDMD Tarih 0.013333 0.028302 0.025126 0.035714 0.039216 0.017241 05.07.10 -0.00877 0 -0.0098 0 -0.00943 -0.01695 06.07.10 -0.00442 0.018349 0 0.013793 0 0 07.07.10 -0.01333 -0.01802 0 -0.01361 0 0.017241 08.07.10 0.013514 0.018349 0.014851 0.02069 0.009524 0.067797 09.07.10 0.017778 0 0.004878 0.013514 0.028302 -0.03175 12.07.10 0.026201 -0.00901 -0.00971 -0.00667 0.018349 -0.01639 13.07.10 -0.02979 -0.01818 -0.0098 -0.01342 -0.00901 0 14.07.10 -0.00877 -0.00926 -0.00495 0 0.009091 -0.01667 15.07.10 0.00885 0 0 0 0.009009 -0.01695 16.07.10 -0.00877 0.009346 0.004975 0.006803 0 0 19.07.10 0.013274 -0.00926 0.024752 0.027027 0.071429 0.017241 20.07.10 0 0.028037 0.009662 0.032895 -0.00833 0.016949 21.07.10 -0.00873 0 -0.00957 -0.03185 -0.03361 -0.03333 22.07.10 0.022026 0.018182 0 0.013158 0 0 23.07.10 -0.00431 0.008929 0.014493 0.032468 0.017391 0.017241 26.07.10 0 -0.00885 -0.00476 0.025157 -0.01709 0.050847 27.07.10 0 0 0.004785 0.006135 0 -0.03226 28.07.10 0 -0.00893 0 -0.04878 -0.01739 0 29.07.10 0.008658 0.018018 0.009524 0.00641 0.017699 0.016667 30.07.10 -0.01288 0 0.004717 -0.01911 -0.02609 0 02.08.10 0.008696 0 -0.00939 -0.01948 0 -0.01639 03.08.10 -0.00431 0 0.009479 -0.01325 -0.00893 0 04.08.10 0 -0.0177 0.014085 0.026846 0 -0.01667 05.08.10 0.025974 0 0 -0.00654 0.009009 0.033898 06.08.10 -0.00422 -0.00901 -0.00463 -0.02632 -0.02679 -0.01639 09.08.10 -0.01271 -0.00909 -0.02326 -0.03378 -0.00917 0 10.08.10 -0.00858 0 0.004762 0 0.018519 0 11.08.10 0.012987 0 0.023697 0 -0.01818 0 12.08.10 -0.00855 0.018349 0 0.013986 0.018519 0.016667 13.08.10 0 0 0.009259 0.02069 0.027273 0 16.08.10 0.00431 0 -0.01376 0 -0.00885 0.032787 17.08.10 0.012876 -0.00901 0.004651 -0.00676 -0.00893 0 18.08.10 0.012712 0.009091 0.013889 -0.01361 0 0 19.08.10 -0.00418 0 0.009132 0.006897 -0.00901 -0.01587 20.08.10 -0.0042 -0.00901 -0.00905 0 0 0 23.08.10 -0.00422 -0.00909 -0.01826 -0.02055 -0.00909 0 24.08.10 0.004237 0 0.023256 0.027972 0.009174 -0.01613 25.08.10 0.012658 0 0 -0.0068 0 0.016393 26.08.10 0 0 0 0 0 0 27.08.10 0.008333 0.018349 0.004545 0.013699 0.018182 0 28.08.10 0.020661 0.009009 0.013575 0.027027 0 0.032258 31.08.10 0 -0.00893 0.004464 0 0.008929 0 01.09.10 -0.0081 0 0 0 0 0.015625 02.09.10 -0.00816 0.009009 0.004444 0.019737 -0.00885 -0.01538 03.09.10 -0.01235 -0.01786 0 -0.0129 0 0 06.09.10 -0.00417 0.009091 0 0 0.008929 -0.01563 07.09.10 0 0 0 0 0 0 08.09.10 0.025105 0.036036 0.030973 0.026144 0.026549 0.047619 10.09.10 0.004082 0 0.017167 0.006369 -0.00862 0 13.09.10 0.012195 0.026087 0.016878 0.031646 0.017391 0 14.09.10 0.012048 0 0.004149 0.01227 0.008547 0.030303 15.09.10

104
Table A.3 (continue): Daily Return End of Day Portfolio's Stock Value ECILC ENKAI EREGL GARAN ISCTR KRDMD Tarih -0.00794 0.008475 -0.0124 0.030303 0 -0.04412 16.09.10 -0.012 0.016807 0.008368 -0.00588 0.008475 0.015385 17.09.10 -0.01215 -0.00826 -0.0083 0.005917 -0.0084 0 20.09.10 0.004098 0 0.004184 0.017647 0 -0.0303 21.09.10 0.016327 0.033333 0 -0.01156 -0.01695 0.015625 22.09.10 0.012048 -0.00806 0.016667 -0.0117 0.008621 0 23.09.10 0 0 0.036885 0 0.017094 0.030769 24.09.10 0.039683 0 0.007905 0.017751 0.042017 -0.01493 27.09.10 0 0.01626 0.009804 -0.00581 0 0 28.09.10 0.007634 0.008 0 -0.01754 -0.00806 0 29.09.10 -0.02273 -0.01587 0.029126 -0.03571 -0.00813 0 30.09.10 0.007752 0.008065 0.028302 0 0.016393 0 01.10.10 0.007692 0.008 0.009174 0.018519 0.016129 0.015152 04.10.10 0 0 -0.01818 0.030303 0.015873 0.014925 05.10.10 0 -0.02381 0.027778 -0.01176 -0.01563 0 06.10.10 0 0.00813 -0.01802 0.017857 0 0 07.10.10 0.030534 0.016129 0.055046 0.046784 0.039683 0.073529 08.10.10 -0.01481 0 0.008696 0.011173 0.015267 -0.0274 11.10.10 0.015038 0 0 0 0.015038 0 12.10.10 -0.01481 0 -0.02586 -0.03867 -0.01481 -0.02817 13.10.10 -0.00752 0.007937 0 0 0.030075 0.014493 14.10.10 0.030303 0 -0.00885 0.005747 0.007299 0.028571 15.10.10 -0.00735 -0.00787 -0.01786 0.017143 -0.02174 -0.01389 18.10.10 0 -0.00794 -0.00909 -0.02809 -0.01481 0 19.10.10 0 0.008 0.018349 0.034682 0.007519 0.042254 20.10.10 0.007407 0.007937 -0.00901 0.022346 -0.00746 0 21.10.10 0.007353 0.015748 0 -0.00546 0 0 22.10.10 0.007299 0.031008 -0.01818 -0.01099 0.007519 0 25.10.10 -0.03623 -0.03008 -0.01852 -0.02778 -0.02985 -0.02703 26.10.10 -0.00752 0.015504 0.018868 0.005714 -0.00769 0.013889 27.10.10 -0.00379 0.016794 -0.0037 0.013636 0.007752 -0.0137 28.10.10 -0.01141 -0.00601 -0.00743 -0.02691 -0.00615 0.013889 01.11.10 0.007692 0.006042 0.007491 -0.00922 -0.0031 0.013699 02.11.10 0.026718 -0.003 0.022305 0.054651 0.034161 0.027027 03.11.10 -0.00743 0 -0.01455 0.001103 0 0 04.11.10 0.003745 0.003012 0.01476 0.024229 -0.003 0 05.11.10 0.003731 0.006006 0.007273 0.008602 0.006024 0.013158 08.11.10 -0.0223 0 -0.00361 -0.03412 -0.02096 -0.01299 09.11.10 0.003802 -0.00299 -0.00362 -0.02428 -0.01223 -0.02632 10.11.10 -0.01136 -0.02096 -0.01455 -0.00905 -0.00929 -0.04054 11.11.10 0.003831 0.003058 0.01845 0.011416 0 0 12.11.10 -0.01527 -0.06402 -0.03623 -0.04063 -0.04375 0 15.11.10 -0.04264 -0.06515 -0.04887 -0.00235 -0.01961 -0.02817 22.11.10 0.008097 0.010453 0.031621 0.018868 0.03 0.014493 23.11.10 0.004016 0.010345 0 -0.00463 0 0 24.11.10 -0.012 -0.03754 -0.01533 -0.02791 -0.02589 0 25.11.10 -0.02834 -0.03546 -0.03113 -0.03828 -0.0598 -0.02857 26.11.10 0.008333 0 0.014056 0.037313 0.028269 0 29.11.10 0.008264 0.040441 0.009901 0.028777 0.003436 0 30.11.10 0.012295 0.007067 -0.00784 0.02331 0.013699 0.014706 01.12.10 -0.00405 0.035088 0.01581 -0.02733 0.02027 -0.01449 02.12.10 0.028455 0.016949 0.035019 0.021077 0.009934 0.029412 03.12.10
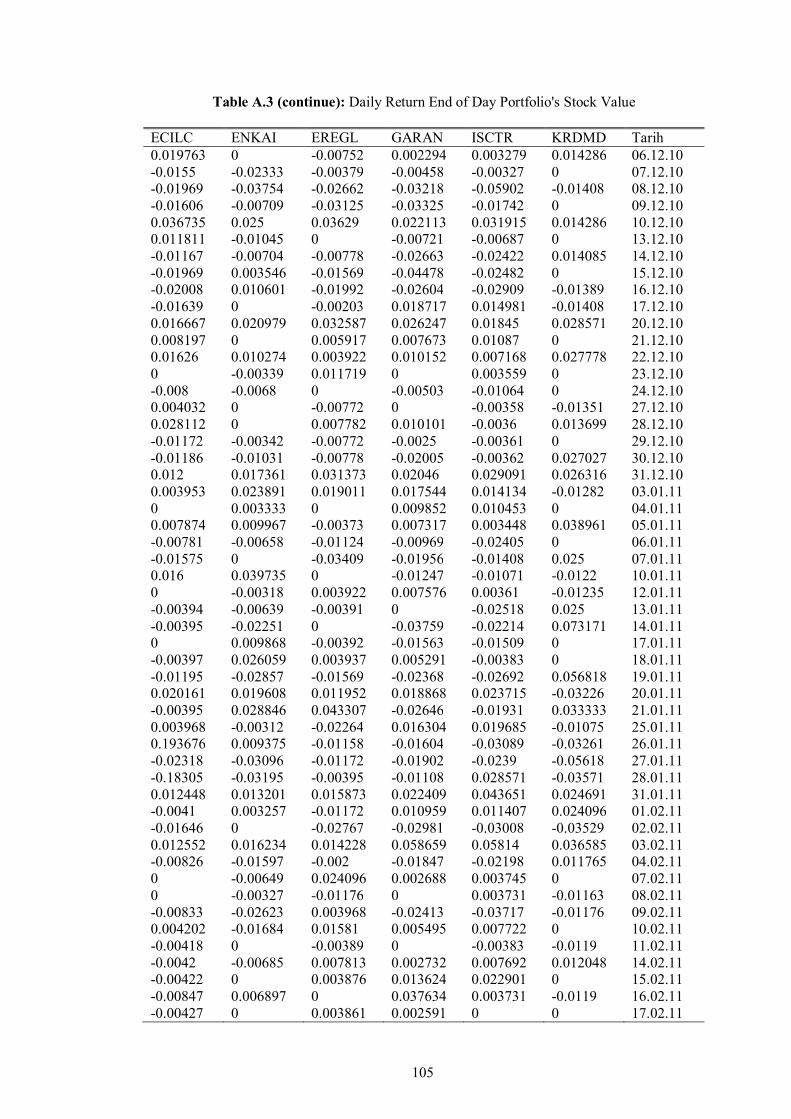
105
Table A.3 (continue): Daily Return End of Day Portfolio's Stock Value ECILC ENKAI EREGL GARAN ISCTR KRDMD Tarih 0.019763 0 -0.00752 0.002294 0.003279 0.014286 06.12.10 -0.0155 -0.02333 -0.00379 -0.00458 -0.00327 0 07.12.10 -0.01969 -0.03754 -0.02662 -0.03218 -0.05902 -0.01408 08.12.10 -0.01606 -0.00709 -0.03125 -0.03325 -0.01742 0 09.12.10 0.036735 0.025 0.03629 0.022113 0.031915 0.014286 10.12.10 0.011811 -0.01045 0 -0.00721 -0.00687 0 13.12.10 -0.01167 -0.00704 -0.00778 -0.02663 -0.02422 0.014085 14.12.10 -0.01969 0.003546 -0.01569 -0.04478 -0.02482 0 15.12.10 -0.02008 0.010601 -0.01992 -0.02604 -0.02909 -0.01389 16.12.10 -0.01639 0 -0.00203 0.018717 0.014981 -0.01408 17.12.10 0.016667 0.020979 0.032587 0.026247 0.01845 0.028571 20.12.10 0.008197 0 0.005917 0.007673 0.01087 0 21.12.10 0.01626 0.010274 0.003922 0.010152 0.007168 0.027778 22.12.10 0 -0.00339 0.011719 0 0.003559 0 23.12.10 -0.008 -0.0068 0 -0.00503 -0.01064 0 24.12.10 0.004032 0 -0.00772 0 -0.00358 -0.01351 27.12.10 0.028112 0 0.007782 0.010101 -0.0036 0.013699 28.12.10 -0.01172 -0.00342 -0.00772 -0.0025 -0.00361 0 29.12.10 -0.01186 -0.01031 -0.00778 -0.02005 -0.00362 0.027027 30.12.10 0.012 0.017361 0.031373 0.02046 0.029091 0.026316 31.12.10 0.003953 0.023891 0.019011 0.017544 0.014134 -0.01282 03.01.11 0 0.003333 0 0.009852 0.010453 0 04.01.11 0.007874 0.009967 -0.00373 0.007317 0.003448 0.038961 05.01.11 -0.00781 -0.00658 -0.01124 -0.00969 -0.02405 0 06.01.11 -0.01575 0 -0.03409 -0.01956 -0.01408 0.025 07.01.11 0.016 0.039735 0 -0.01247 -0.01071 -0.0122 10.01.11 0 -0.00318 0.003922 0.007576 0.00361 -0.01235 12.01.11 -0.00394 -0.00639 -0.00391 0 -0.02518 0.025 13.01.11 -0.00395 -0.02251 0 -0.03759 -0.02214 0.073171 14.01.11 0 0.009868 -0.00392 -0.01563 -0.01509 0 17.01.11 -0.00397 0.026059 0.003937 0.005291 -0.00383 0 18.01.11 -0.01195 -0.02857 -0.01569 -0.02368 -0.02692 0.056818 19.01.11 0.020161 0.019608 0.011952 0.018868 0.023715 -0.03226 20.01.11 -0.00395 0.028846 0.043307 -0.02646 -0.01931 0.033333 21.01.11 0.003968 -0.00312 -0.02264 0.016304 0.019685 -0.01075 25.01.11 0.193676 0.009375 -0.01158 -0.01604 -0.03089 -0.03261 26.01.11 -0.02318 -0.03096 -0.01172 -0.01902 -0.0239 -0.05618 27.01.11 -0.18305 -0.03195 -0.00395 -0.01108 0.028571 -0.03571 28.01.11 0.012448 0.013201 0.015873 0.022409 0.043651 0.024691 31.01.11 -0.0041 0.003257 -0.01172 0.010959 0.011407 0.024096 01.02.11 -0.01646 0 -0.02767 -0.02981 -0.03008 -0.03529 02.02.11 0.012552 0.016234 0.014228 0.058659 0.05814 0.036585 03.02.11 -0.00826 -0.01597 -0.002 -0.01847 -0.02198 0.011765 04.02.11 0 -0.00649 0.024096 0.002688 0.003745 0 07.02.11 0 -0.00327 -0.01176 0 0.003731 -0.01163 08.02.11 -0.00833 -0.02623 0.003968 -0.02413 -0.03717 -0.01176 09.02.11 0.004202 -0.01684 0.01581 0.005495 0.007722 0 10.02.11 -0.00418 0 -0.00389 0 -0.00383 -0.0119 11.02.11 -0.0042 -0.00685 0.007813 0.002732 0.007692 0.012048 14.02.11 -0.00422 0 0.003876 0.013624 0.022901 0 15.02.11 -0.00847 0.006897 0 0.037634 0.003731 -0.0119 16.02.11 -0.00427 0 0.003861 0.002591 0 0 17.02.11
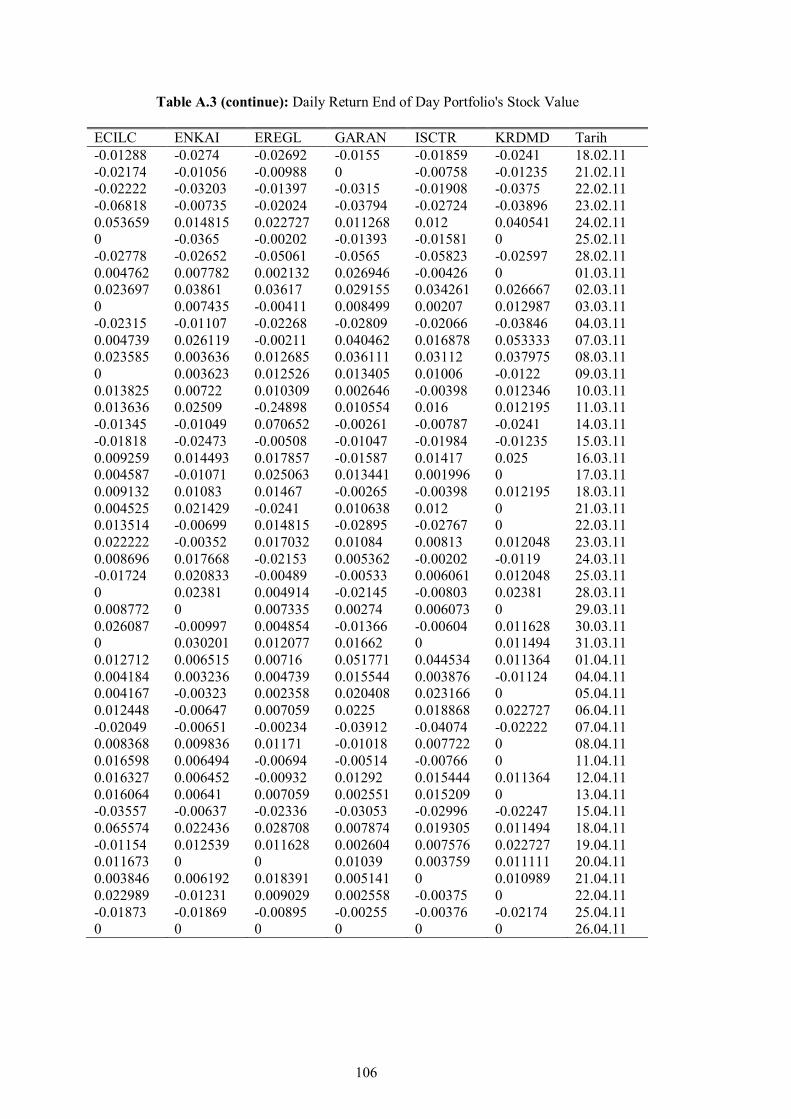
106
Table A.3 (continue): Daily Return End of Day Portfolio's Stock Value ECILC ENKAI EREGL GARAN ISCTR KRDMD Tarih -0.01288 -0.0274 -0.02692 -0.0155 -0.01859 -0.0241 18.02.11 -0.02174 -0.01056 -0.00988 0 -0.00758 -0.01235 21.02.11 -0.02222 -0.03203 -0.01397 -0.0315 -0.01908 -0.0375 22.02.11 -0.06818 -0.00735 -0.02024 -0.03794 -0.02724 -0.03896 23.02.11 0.053659 0.014815 0.022727 0.011268 0.012 0.040541 24.02.11 0 -0.0365 -0.00202 -0.01393 -0.01581 0 25.02.11 -0.02778 -0.02652 -0.05061 -0.0565 -0.05823 -0.02597 28.02.11 0.004762 0.007782 0.002132 0.026946 -0.00426 0 01.03.11 0.023697 0.03861 0.03617 0.029155 0.034261 0.026667 02.03.11 0 0.007435 -0.00411 0.008499 0.00207 0.012987 03.03.11 -0.02315 -0.01107 -0.02268 -0.02809 -0.02066 -0.03846 04.03.11 0.004739 0.026119 -0.00211 0.040462 0.016878 0.053333 07.03.11 0.023585 0.003636 0.012685 0.036111 0.03112 0.037975 08.03.11 0 0.003623 0.012526 0.013405 0.01006 -0.0122 09.03.11 0.013825 0.00722 0.010309 0.002646 -0.00398 0.012346 10.03.11 0.013636 0.02509 -0.24898 0.010554 0.016 0.012195 11.03.11 -0.01345 -0.01049 0.070652 -0.00261 -0.00787 -0.0241 14.03.11 -0.01818 -0.02473 -0.00508 -0.01047 -0.01984 -0.01235 15.03.11 0.009259 0.014493 0.017857 -0.01587 0.01417 0.025 16.03.11 0.004587 -0.01071 0.025063 0.013441 0.001996 0 17.03.11 0.009132 0.01083 0.01467 -0.00265 -0.00398 0.012195 18.03.11 0.004525 0.021429 -0.0241 0.010638 0.012 0 21.03.11 0.013514 -0.00699 0.014815 -0.02895 -0.02767 0 22.03.11 0.022222 -0.00352 0.017032 0.01084 0.00813 0.012048 23.03.11 0.008696 0.017668 -0.02153 0.005362 -0.00202 -0.0119 24.03.11 -0.01724 0.020833 -0.00489 -0.00533 0.006061 0.012048 25.03.11 0 0.02381 0.004914 -0.02145 -0.00803 0.02381 28.03.11 0.008772 0 0.007335 0.00274 0.006073 0 29.03.11 0.026087 -0.00997 0.004854 -0.01366 -0.00604 0.011628 30.03.11 0 0.030201 0.012077 0.01662 0 0.011494 31.03.11 0.012712 0.006515 0.00716 0.051771 0.044534 0.011364 01.04.11 0.004184 0.003236 0.004739 0.015544 0.003876 -0.01124 04.04.11 0.004167 -0.00323 0.002358 0.020408 0.023166 0 05.04.11 0.012448 -0.00647 0.007059 0.0225 0.018868 0.022727 06.04.11 -0.02049 -0.00651 -0.00234 -0.03912 -0.04074 -0.02222 07.04.11 0.008368 0.009836 0.01171 -0.01018 0.007722 0 08.04.11 0.016598 0.006494 -0.00694 -0.00514 -0.00766 0 11.04.11 0.016327 0.006452 -0.00932 0.01292 0.015444 0.011364 12.04.11 0.016064 0.00641 0.007059 0.002551 0.015209 0 13.04.11 -0.03557 -0.00637 -0.02336 -0.03053 -0.02996 -0.02247 15.04.11 0.065574 0.022436 0.028708 0.007874 0.019305 0.011494 18.04.11 -0.01154 0.012539 0.011628 0.002604 0.007576 0.022727 19.04.11 0.011673 0 0 0.01039 0.003759 0.011111 20.04.11 0.003846 0.006192 0.018391 0.005141 0 0.010989 21.04.11 0.022989 -0.01231 0.009029 0.002558 -0.00375 0 22.04.11 -0.01873 -0.01869 -0.00895 -0.00255 -0.00376 -0.02174 25.04.11 0 0 0 0 0 0 26.04.11
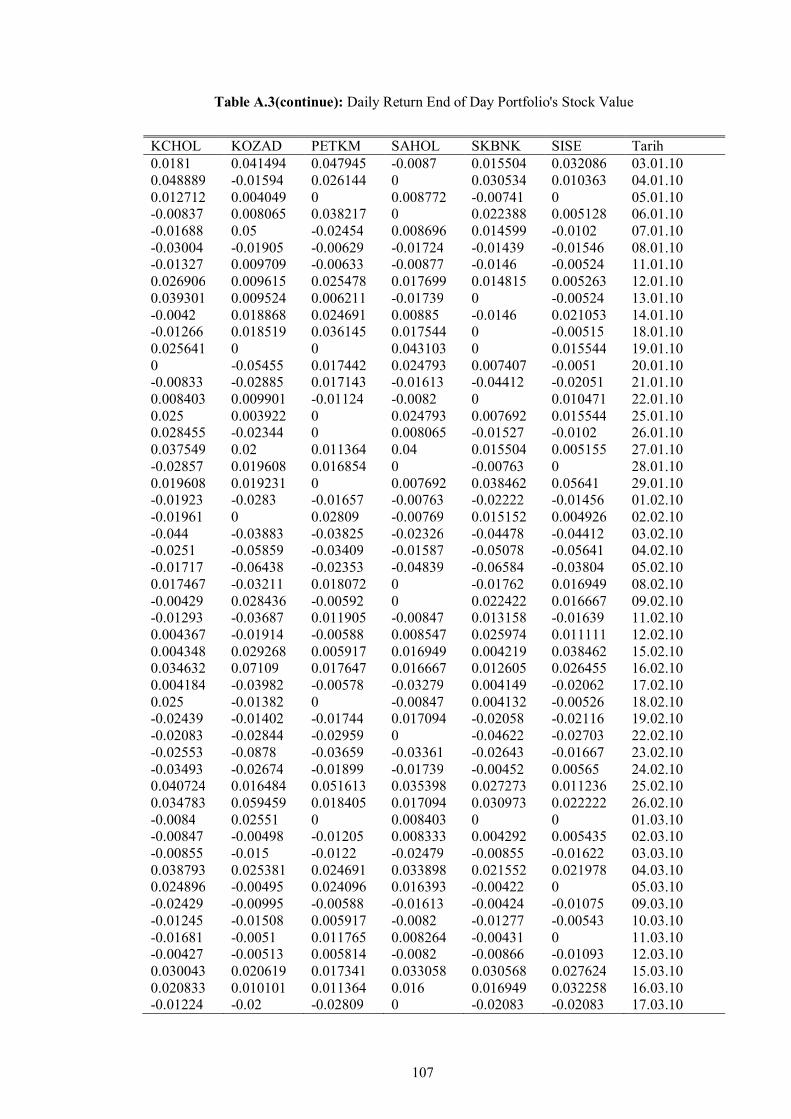
107
Table A.3(continue): Daily Return End of Day Portfolio's Stock Value
KCHOL KOZAD PETKM SAHOL SKBNK SISE Tarih 0.0181 0.041494 0.047945 -0.0087 0.015504 0.032086 03.01.10 0.048889 -0.01594 0.026144 0 0.030534 0.010363 04.01.10 0.012712 0.004049 0 0.008772 -0.00741 0 05.01.10 -0.00837 0.008065 0.038217 0 0.022388 0.005128 06.01.10 -0.01688 0.05 -0.02454 0.008696 0.014599 -0.0102 07.01.10 -0.03004 -0.01905 -0.00629 -0.01724 -0.01439 -0.01546 08.01.10 -0.01327 0.009709 -0.00633 -0.00877 -0.0146 -0.00524 11.01.10 0.026906 0.009615 0.025478 0.017699 0.014815 0.005263 12.01.10 0.039301 0.009524 0.006211 -0.01739 0 -0.00524 13.01.10 -0.0042 0.018868 0.024691 0.00885 -0.0146 0.021053 14.01.10 -0.01266 0.018519 0.036145 0.017544 0 -0.00515 18.01.10 0.025641 0 0 0.043103 0 0.015544 19.01.10 0 -0.05455 0.017442 0.024793 0.007407 -0.0051 20.01.10 -0.00833 -0.02885 0.017143 -0.01613 -0.04412 -0.02051 21.01.10 0.008403 0.009901 -0.01124 -0.0082 0 0.010471 22.01.10 0.025 0.003922 0 0.024793 0.007692 0.015544 25.01.10 0.028455 -0.02344 0 0.008065 -0.01527 -0.0102 26.01.10 0.037549 0.02 0.011364 0.04 0.015504 0.005155 27.01.10 -0.02857 0.019608 0.016854 0 -0.00763 0 28.01.10 0.019608 0.019231 0 0.007692 0.038462 0.05641 29.01.10 -0.01923 -0.0283 -0.01657 -0.00763 -0.02222 -0.01456 01.02.10 -0.01961 0 0.02809 -0.00769 0.015152 0.004926 02.02.10 -0.044 -0.03883 -0.03825 -0.02326 -0.04478 -0.04412 03.02.10 -0.0251 -0.05859 -0.03409 -0.01587 -0.05078 -0.05641 04.02.10 -0.01717 -0.06438 -0.02353 -0.04839 -0.06584 -0.03804 05.02.10 0.017467 -0.03211 0.018072 0 -0.01762 0.016949 08.02.10 -0.00429 0.028436 -0.00592 0 0.022422 0.016667 09.02.10 -0.01293 -0.03687 0.011905 -0.00847 0.013158 -0.01639 11.02.10 0.004367 -0.01914 -0.00588 0.008547 0.025974 0.011111 12.02.10 0.004348 0.029268 0.005917 0.016949 0.004219 0.038462 15.02.10 0.034632 0.07109 0.017647 0.016667 0.012605 0.026455 16.02.10 0.004184 -0.03982 -0.00578 -0.03279 0.004149 -0.02062 17.02.10 0.025 -0.01382 0 -0.00847 0.004132 -0.00526 18.02.10 -0.02439 -0.01402 -0.01744 0.017094 -0.02058 -0.02116 19.02.10 -0.02083 -0.02844 -0.02959 0 -0.04622 -0.02703 22.02.10 -0.02553 -0.0878 -0.03659 -0.03361 -0.02643 -0.01667 23.02.10 -0.03493 -0.02674 -0.01899 -0.01739 -0.00452 0.00565 24.02.10 0.040724 0.016484 0.051613 0.035398 0.027273 0.011236 25.02.10 0.034783 0.059459 0.018405 0.017094 0.030973 0.022222 26.02.10 -0.0084 0.02551 0 0.008403 0 0 01.03.10 -0.00847 -0.00498 -0.01205 0.008333 0.004292 0.005435 02.03.10 -0.00855 -0.015 -0.0122 -0.02479 -0.00855 -0.01622 03.03.10 0.038793 0.025381 0.024691 0.033898 0.021552 0.021978 04.03.10 0.024896 -0.00495 0.024096 0.016393 -0.00422 0 05.03.10 -0.02429 -0.00995 -0.00588 -0.01613 -0.00424 -0.01075 09.03.10 -0.01245 -0.01508 0.005917 -0.0082 -0.01277 -0.00543 10.03.10 -0.01681 -0.0051 0.011765 0.008264 -0.00431 0 11.03.10 -0.00427 -0.00513 0.005814 -0.0082 -0.00866 -0.01093 12.03.10 0.030043 0.020619 0.017341 0.033058 0.030568 0.027624 15.03.10 0.020833 0.010101 0.011364 0.016 0.016949 0.032258 16.03.10 -0.01224 -0.02 -0.02809 0 -0.02083 -0.02083 17.03.10
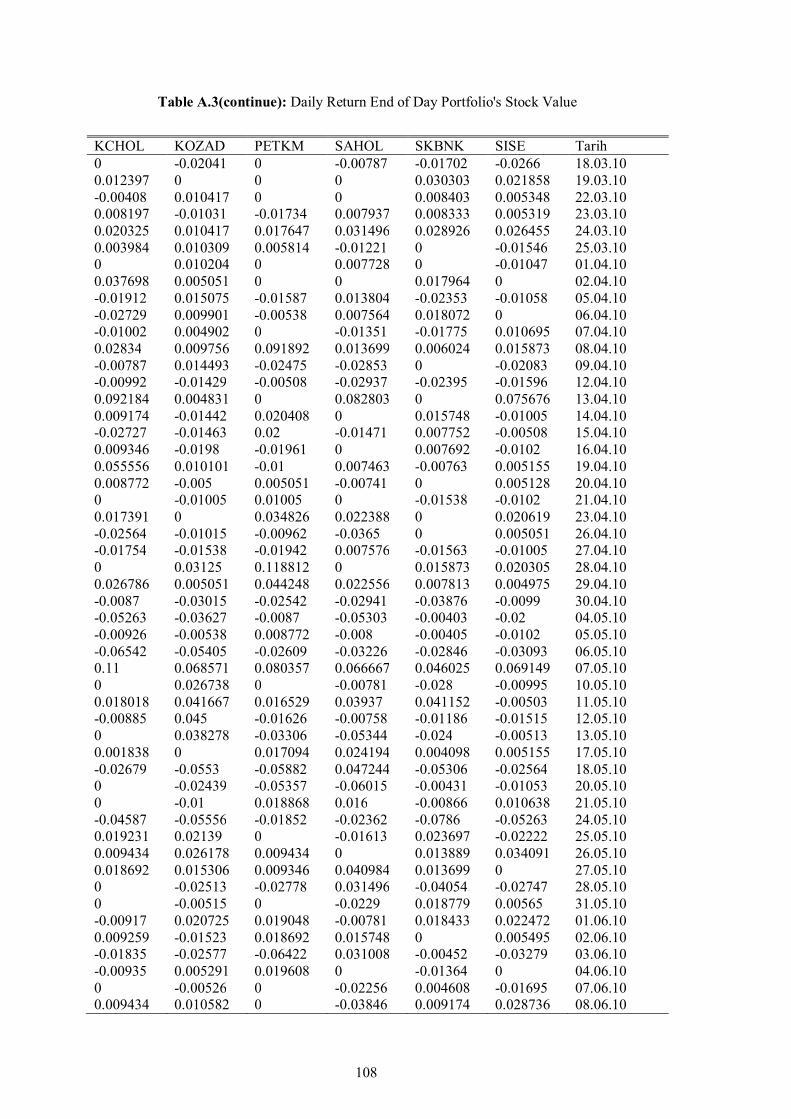
108
Table A.3(continue): Daily Return End of Day Portfolio's Stock Value
KCHOL KOZAD PETKM SAHOL SKBNK SISE Tarih 0 -0.02041 0 -0.00787 -0.01702 -0.0266 18.03.10 0.012397 0 0 0 0.030303 0.021858 19.03.10 -0.00408 0.010417 0 0 0.008403 0.005348 22.03.10 0.008197 -0.01031 -0.01734 0.007937 0.008333 0.005319 23.03.10 0.020325 0.010417 0.017647 0.031496 0.028926 0.026455 24.03.10 0.003984 0.010309 0.005814 -0.01221 0 -0.01546 25.03.10 0 0.010204 0 0.007728 0 -0.01047 01.04.10 0.037698 0.005051 0 0 0.017964 0 02.04.10 -0.01912 0.015075 -0.01587 0.013804 -0.02353 -0.01058 05.04.10 -0.02729 0.009901 -0.00538 0.007564 0.018072 0 06.04.10 -0.01002 0.004902 0 -0.01351 -0.01775 0.010695 07.04.10 0.02834 0.009756 0.091892 0.013699 0.006024 0.015873 08.04.10 -0.00787 0.014493 -0.02475 -0.02853 0 -0.02083 09.04.10 -0.00992 -0.01429 -0.00508 -0.02937 -0.02395 -0.01596 12.04.10 0.092184 0.004831 0 0.082803 0 0.075676 13.04.10 0.009174 -0.01442 0.020408 0 0.015748 -0.01005 14.04.10 -0.02727 -0.01463 0.02 -0.01471 0.007752 -0.00508 15.04.10 0.009346 -0.0198 -0.01961 0 0.007692 -0.0102 16.04.10 0.055556 0.010101 -0.01 0.007463 -0.00763 0.005155 19.04.10 0.008772 -0.005 0.005051 -0.00741 0 0.005128 20.04.10 0 -0.01005 0.01005 0 -0.01538 -0.0102 21.04.10 0.017391 0 0.034826 0.022388 0 0.020619 23.04.10 -0.02564 -0.01015 -0.00962 -0.0365 0 0.005051 26.04.10 -0.01754 -0.01538 -0.01942 0.007576 -0.01563 -0.01005 27.04.10 0 0.03125 0.118812 0 0.015873 0.020305 28.04.10 0.026786 0.005051 0.044248 0.022556 0.007813 0.004975 29.04.10 -0.0087 -0.03015 -0.02542 -0.02941 -0.03876 -0.0099 30.04.10 -0.05263 -0.03627 -0.0087 -0.05303 -0.00403 -0.02 04.05.10 -0.00926 -0.00538 0.008772 -0.008 -0.00405 -0.0102 05.05.10 -0.06542 -0.05405 -0.02609 -0.03226 -0.02846 -0.03093 06.05.10 0.11 0.068571 0.080357 0.066667 0.046025 0.069149 07.05.10 0 0.026738 0 -0.00781 -0.028 -0.00995 10.05.10 0.018018 0.041667 0.016529 0.03937 0.041152 -0.00503 11.05.10 -0.00885 0.045 -0.01626 -0.00758 -0.01186 -0.01515 12.05.10 0 0.038278 -0.03306 -0.05344 -0.024 -0.00513 13.05.10 0.001838 0 0.017094 0.024194 0.004098 0.005155 17.05.10 -0.02679 -0.0553 -0.05882 0.047244 -0.05306 -0.02564 18.05.10 0 -0.02439 -0.05357 -0.06015 -0.00431 -0.01053 20.05.10 0 -0.01 0.018868 0.016 -0.00866 0.010638 21.05.10 -0.04587 -0.05556 -0.01852 -0.02362 -0.0786 -0.05263 24.05.10 0.019231 0.02139 0 -0.01613 0.023697 -0.02222 25.05.10 0.009434 0.026178 0.009434 0 0.013889 0.034091 26.05.10 0.018692 0.015306 0.009346 0.040984 0.013699 0 27.05.10 0 -0.02513 -0.02778 0.031496 -0.04054 -0.02747 28.05.10 0 -0.00515 0 -0.0229 0.018779 0.00565 31.05.10 -0.00917 0.020725 0.019048 -0.00781 0.018433 0.022472 01.06.10 0.009259 -0.01523 0.018692 0.015748 0 0.005495 02.06.10 -0.01835 -0.02577 -0.06422 0.031008 -0.00452 -0.03279 03.06.10 -0.00935 0.005291 0.019608 0 -0.01364 0 04.06.10 0 -0.00526 0 -0.02256 0.004608 -0.01695 07.06.10 0.009434 0.010582 0 -0.03846 0.009174 0.028736 08.06.10

109
Table A.3(continue): Daily Return End of Day Portfolio's Stock Value
KCHOL KOZAD PETKM SAHOL SKBNK SISE Tarih 0.018692 0.005236 -0.00962 0 0 0.005587 09.06.10 0.027523 0.010417 0 0.008 -0.01364 -0.00556 10.06.10 0.026786 0.015464 0 0.007937 0.023041 -0.00559 11.06.10 -0.01739 -0.0203 -0.00971 0.023622 -0.01351 0 15.06.10 0.035398 0.005181 0.009804 0.007692 0 0 16.06.10 -0.02564 -0.00515 0 0.015267 0.018265 -0.01124 17.06.10 0 0 0 0.030075 -0.00448 0.005682 18.06.10 -0.00877 -0.00518 0 0 0.022523 -0.00565 21.06.10 -0.02655 -0.00521 -0.00971 0 0 -0.02273 22.06.10 0 -0.01047 0 -0.0146 0.008811 0.011628 23.06.10 -0.00909 0.010582 0 -0.00741 0.026315 0.028736 24.06.10 0.009174 0.015707 -0.0098 -0.02239 0.026316 -0.00559 27.06.10 -0.01818 -0.02062 0.009901 0.015267 -0.01923 -0.01124 28.06.10 0 -0.00526 0.039216 -0.00752 -0.02614 -0.01136 29.06.10 -0.00926 -0.01587 -0.00943 -0.0303 0.013423 0.011494 30.06.10 0.009346 0.010753 0 -0.00781 0.006623 0 01.07.10 0 -0.01064 -0.02804 0.007874 0.013158 0.011364 02.07.10 0.018519 -0.00538 -0.00962 0 0.019481 0.005618 05.07.10 0 0.005405 -0.01456 0.015625 0.006369 -0.00559 06.07.10 0 0 0.004926 0 0 0.022472 07.07.10 -0.00909 -0.00538 0 0.015385 0 0.005495 08.07.10 0 0.010811 -0.0049 -0.01515 0.006329 0.005464 09.07.10 0.027523 0 0.004926 0.038462 0.012579 0.01087 12.07.10 0 0 0 0.007407 -0.00621 -0.01075 13.07.10 -0.01786 -0.0107 0.02451 -0.00735 -0.0125 -0.00543 14.07.10 0 0 0.014354 -0.02963 0.006329 -0.01093 15.07.10 0 0.021622 0.023585 0.022901 -0.00629 0.016575 16.07.10 -0.00909 -0.00529 -0.00922 0.007463 -0.00633 -0.01087 19.07.10 0.027523 0.005319 0 0.007407 0.031847 0.027473 20.07.10 0 -0.00529 -0.00465 0.014706 0 0.010695 21.07.10 0 -0.00532 -0.00935 -0.00725 -0.02469 -0.00529 22.07.10 0 0.005348 0.009434 0.021898 0.006329 -0.00532 23.07.10 0.026786 0.005319 0.009346 0.014286 0.031447 0.02139 26.07.10 0.017391 0.015873 0 0 0.018293 -0.01571 27.07.10 0.017094 -0.01563 0 -0.01408 -0.00599 0 28.07.10 0 0 0.013889 -0.00714 -0.01807 0.005319 29.07.10 0.016807 0.010582 0.018265 0.007194 0.018405 0.010582 30.07.10 -0.01653 0.005236 -0.00448 0.007143 -0.01205 -0.01047 02.08.10 0.008403 0.005208 -0.00901 0.007092 0 0 03.08.10 0.008333 0.005181 0.004545 0 -0.0122 0.026455 04.08.10 -0.00826 0.010309 0.00905 -0.02113 0 0.005155 05.08.10 0 0.005102 0.004484 -0.02158 0.012346 0.005128 06.08.10 -0.025 -0.01015 -0.00893 0.014706 -0.0122 -0.0102 09.08.10 -0.01709 -0.01538 -0.02252 0 -0.01852 -0.02577 10.08.10 0 0.005208 0 -0.00725 0 0.015873 11.08.10 0 0 0.032258 0 0 0.010417 12.08.10 0 -0.00518 0 0.007299 0 0.010309 13.08.10 0.026087 0.020833 0.004464 0 0.006289 0.005102 16.08.10 -0.01695 -0.0102 -0.00444 -0.00725 -0.00625 0.035533 17.08.10 0.025862 -0.00515 -0.00893 -0.0073 -0.01258 -0.01471 18.08.10 -0.0084 0.005181 -0.01802 -0.02206 -0.01274 0.004975 19.08.10
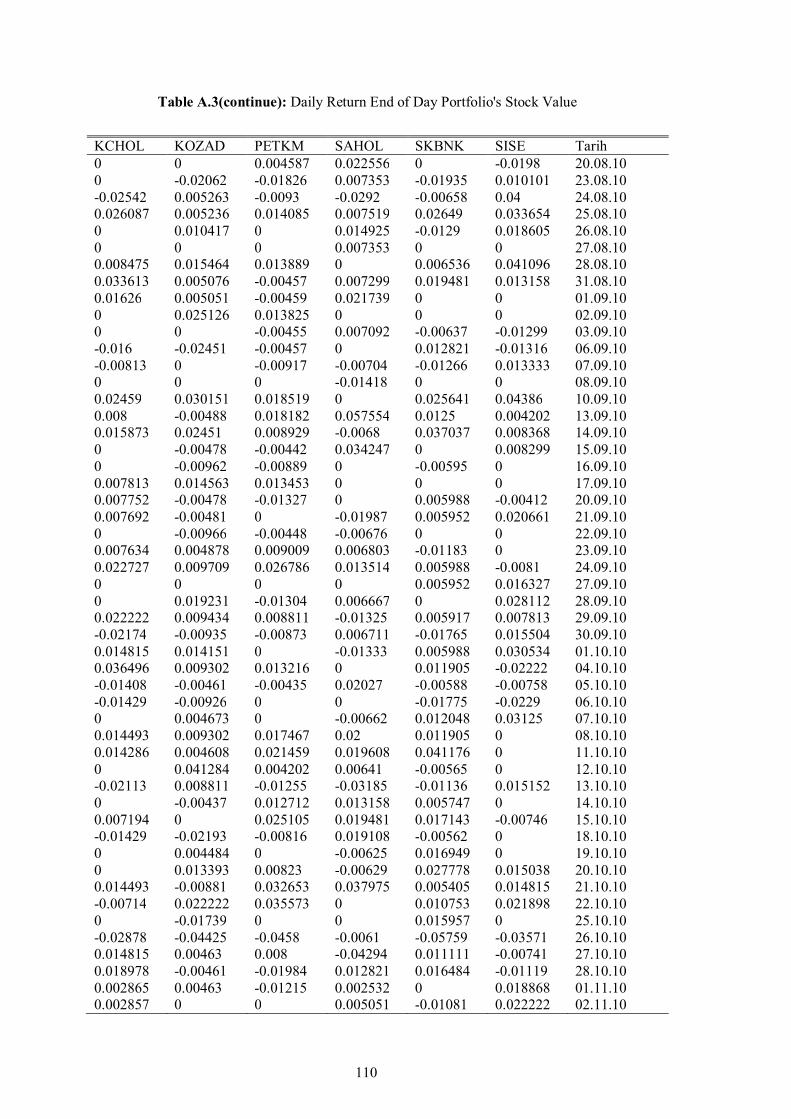
110
Table A.3(continue): Daily Return End of Day Portfolio's Stock Value
KCHOL KOZAD PETKM SAHOL SKBNK SISE Tarih 0 0 0.004587 0.022556 0 -0.0198 20.08.10 0 -0.02062 -0.01826 0.007353 -0.01935 0.010101 23.08.10 -0.02542 0.005263 -0.0093 -0.0292 -0.00658 0.04 24.08.10 0.026087 0.005236 0.014085 0.007519 0.02649 0.033654 25.08.10 0 0.010417 0 0.014925 -0.0129 0.018605 26.08.10 0 0 0 0.007353 0 0 27.08.10 0.008475 0.015464 0.013889 0 0.006536 0.041096 28.08.10 0.033613 0.005076 -0.00457 0.007299 0.019481 0.013158 31.08.10 0.01626 0.005051 -0.00459 0.021739 0 0 01.09.10 0 0.025126 0.013825 0 0 0 02.09.10 0 0 -0.00455 0.007092 -0.00637 -0.01299 03.09.10 -0.016 -0.02451 -0.00457 0 0.012821 -0.01316 06.09.10 -0.00813 0 -0.00917 -0.00704 -0.01266 0.013333 07.09.10 0 0 0 -0.01418 0 0 08.09.10 0.02459 0.030151 0.018519 0 0.025641 0.04386 10.09.10 0.008 -0.00488 0.018182 0.057554 0.0125 0.004202 13.09.10 0.015873 0.02451 0.008929 -0.0068 0.037037 0.008368 14.09.10 0 -0.00478 -0.00442 0.034247 0 0.008299 15.09.10 0 -0.00962 -0.00889 0 -0.00595 0 16.09.10 0.007813 0.014563 0.013453 0 0 0 17.09.10 0.007752 -0.00478 -0.01327 0 0.005988 -0.00412 20.09.10 0.007692 -0.00481 0 -0.01987 0.005952 0.020661 21.09.10 0 -0.00966 -0.00448 -0.00676 0 0 22.09.10 0.007634 0.004878 0.009009 0.006803 -0.01183 0 23.09.10 0.022727 0.009709 0.026786 0.013514 0.005988 -0.0081 24.09.10 0 0 0 0 0.005952 0.016327 27.09.10 0 0.019231 -0.01304 0.006667 0 0.028112 28.09.10 0.022222 0.009434 0.008811 -0.01325 0.005917 0.007813 29.09.10 -0.02174 -0.00935 -0.00873 0.006711 -0.01765 0.015504 30.09.10 0.014815 0.014151 0 -0.01333 0.005988 0.030534 01.10.10 0.036496 0.009302 0.013216 0 0.011905 -0.02222 04.10.10 -0.01408 -0.00461 -0.00435 0.02027 -0.00588 -0.00758 05.10.10 -0.01429 -0.00926 0 0 -0.01775 -0.0229 06.10.10 0 0.004673 0 -0.00662 0.012048 0.03125 07.10.10 0.014493 0.009302 0.017467 0.02 0.011905 0 08.10.10 0.014286 0.004608 0.021459 0.019608 0.041176 0 11.10.10 0 0.041284 0.004202 0.00641 -0.00565 0 12.10.10 -0.02113 0.008811 -0.01255 -0.03185 -0.01136 0.015152 13.10.10 0 -0.00437 0.012712 0.013158 0.005747 0 14.10.10 0.007194 0 0.025105 0.019481 0.017143 -0.00746 15.10.10 -0.01429 -0.02193 -0.00816 0.019108 -0.00562 0 18.10.10 0 0.004484 0 -0.00625 0.016949 0 19.10.10 0 0.013393 0.00823 -0.00629 0.027778 0.015038 20.10.10 0.014493 -0.00881 0.032653 0.037975 0.005405 0.014815 21.10.10 -0.00714 0.022222 0.035573 0 0.010753 0.021898 22.10.10 0 -0.01739 0 0 0.015957 0 25.10.10 -0.02878 -0.04425 -0.0458 -0.0061 -0.05759 -0.03571 26.10.10 0.014815 0.00463 0.008 -0.04294 0.011111 -0.00741 27.10.10 0.018978 -0.00461 -0.01984 0.012821 0.016484 -0.01119 28.10.10 0.002865 0.00463 -0.01215 0.002532 0 0.018868 01.11.10 0.002857 0 0 0.005051 -0.01081 0.022222 02.11.10
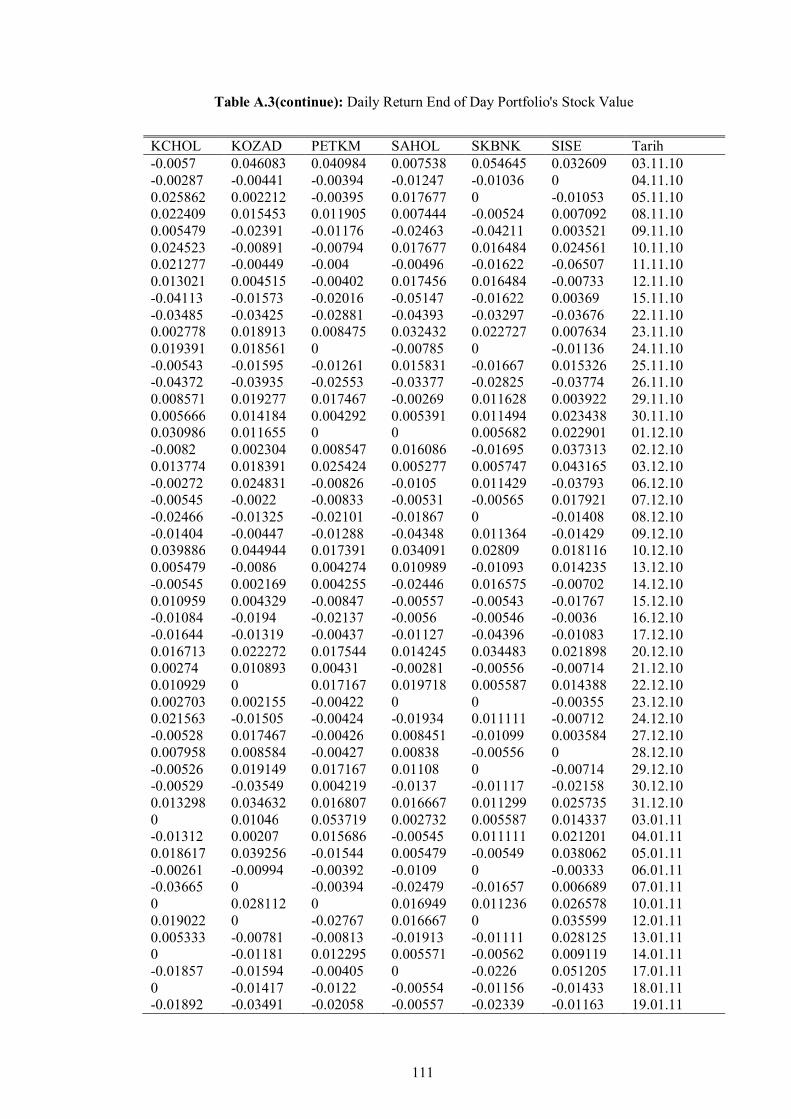
111
Table A.3(continue): Daily Return End of Day Portfolio's Stock Value
KCHOL KOZAD PETKM SAHOL SKBNK SISE Tarih -0.0057 0.046083 0.040984 0.007538 0.054645 0.032609 03.11.10 -0.00287 -0.00441 -0.00394 -0.01247 -0.01036 0 04.11.10 0.025862 0.002212 -0.00395 0.017677 0 -0.01053 05.11.10 0.022409 0.015453 0.011905 0.007444 -0.00524 0.007092 08.11.10 0.005479 -0.02391 -0.01176 -0.02463 -0.04211 0.003521 09.11.10 0.024523 -0.00891 -0.00794 0.017677 0.016484 0.024561 10.11.10 0.021277 -0.00449 -0.004 -0.00496 -0.01622 -0.06507 11.11.10 0.013021 0.004515 -0.00402 0.017456 0.016484 -0.00733 12.11.10 -0.04113 -0.01573 -0.02016 -0.05147 -0.01622 0.00369 15.11.10 -0.03485 -0.03425 -0.02881 -0.04393 -0.03297 -0.03676 22.11.10 0.002778 0.018913 0.008475 0.032432 0.022727 0.007634 23.11.10 0.019391 0.018561 0 -0.00785 0 -0.01136 24.11.10 -0.00543 -0.01595 -0.01261 0.015831 -0.01667 0.015326 25.11.10 -0.04372 -0.03935 -0.02553 -0.03377 -0.02825 -0.03774 26.11.10 0.008571 0.019277 0.017467 -0.00269 0.011628 0.003922 29.11.10 0.005666 0.014184 0.004292 0.005391 0.011494 0.023438 30.11.10 0.030986 0.011655 0 0 0.005682 0.022901 01.12.10 -0.0082 0.002304 0.008547 0.016086 -0.01695 0.037313 02.12.10 0.013774 0.018391 0.025424 0.005277 0.005747 0.043165 03.12.10 -0.00272 0.024831 -0.00826 -0.0105 0.011429 -0.03793 06.12.10 -0.00545 -0.0022 -0.00833 -0.00531 -0.00565 0.017921 07.12.10 -0.02466 -0.01325 -0.02101 -0.01867 0 -0.01408 08.12.10 -0.01404 -0.00447 -0.01288 -0.04348 0.011364 -0.01429 09.12.10 0.039886 0.044944 0.017391 0.034091 0.02809 0.018116 10.12.10 0.005479 -0.0086 0.004274 0.010989 -0.01093 0.014235 13.12.10 -0.00545 0.002169 0.004255 -0.02446 0.016575 -0.00702 14.12.10 0.010959 0.004329 -0.00847 -0.00557 -0.00543 -0.01767 15.12.10 -0.01084 -0.0194 -0.02137 -0.0056 -0.00546 -0.0036 16.12.10 -0.01644 -0.01319 -0.00437 -0.01127 -0.04396 -0.01083 17.12.10 0.016713 0.022272 0.017544 0.014245 0.034483 0.021898 20.12.10 0.00274 0.010893 0.00431 -0.00281 -0.00556 -0.00714 21.12.10 0.010929 0 0.017167 0.019718 0.005587 0.014388 22.12.10 0.002703 0.002155 -0.00422 0 0 -0.00355 23.12.10 0.021563 -0.01505 -0.00424 -0.01934 0.011111 -0.00712 24.12.10 -0.00528 0.017467 -0.00426 0.008451 -0.01099 0.003584 27.12.10 0.007958 0.008584 -0.00427 0.00838 -0.00556 0 28.12.10 -0.00526 0.019149 0.017167 0.01108 0 -0.00714 29.12.10 -0.00529 -0.03549 0.004219 -0.0137 -0.01117 -0.02158 30.12.10 0.013298 0.034632 0.016807 0.016667 0.011299 0.025735 31.12.10 0 0.01046 0.053719 0.002732 0.005587 0.014337 03.01.11 -0.01312 0.00207 0.015686 -0.00545 0.011111 0.021201 04.01.11 0.018617 0.039256 -0.01544 0.005479 -0.00549 0.038062 05.01.11 -0.00261 -0.00994 -0.00392 -0.0109 0 -0.00333 06.01.11 -0.03665 0 -0.00394 -0.02479 -0.01657 0.006689 07.01.11 0 0.028112 0 0.016949 0.011236 0.026578 10.01.11 0.019022 0 -0.02767 0.016667 0 0.035599 12.01.11 0.005333 -0.00781 -0.00813 -0.01913 -0.01111 0.028125 13.01.11 0 -0.01181 0.012295 0.005571 -0.00562 0.009119 14.01.11 -0.01857 -0.01594 -0.00405 0 -0.0226 0.051205 17.01.11 0 -0.01417 -0.0122 -0.00554 -0.01156 -0.01433 18.01.11 -0.01892 -0.03491 -0.02058 -0.00557 -0.02339 -0.01163 19.01.11

112
Table A.3(continue): Daily Return End of Day Portfolio's Stock Value
KCHOL KOZAD PETKM SAHOL SKBNK SISE Tarih -0.00551 0.008511 0.016807 -0.0028 0.011976 -0.01471 20.01.11 -0.0277 -0.04008 0.012397 -0.00562 -0.02959 0.002985 21.01.11 0.019943 0.002198 0.004082 0.00565 0.006098 0.002976 25.01.11 -0.03352 -0.02851 -0.02439 -0.02528 -0.00606 0.008902 26.01.11 -0.03613 -0.03386 -0.02917 -0.0245 -0.02439 -0.03235 27.01.11 -0.01949 0.011682 -0.00858 0.007386 0.03125 0.006079 28.01.11 0.024465 0.013857 0.017316 0.017595 0.036364 0 31.01.11 0.053731 -0.00228 -0.00426 0 -0.01754 -0.00906 01.02.11 -0.01133 -0.02511 -0.00855 -0.01441 -0.02976 0 02.02.11 0.025788 0.01171 0 0.008772 0.02454 0.006098 03.02.11 0.01676 -0.00694 0.008621 -0.0087 -0.01198 0.015152 04.02.11 0.024725 0.016317 0.004274 -0.01462 0.006061 0.01791 07.02.11 0.008043 0.018349 0 0.017804 0 -0.00293 08.02.11 -0.05319 -0.01351 -0.01277 -0.01166 -0.00602 -0.02059 09.02.11 0.014045 0.002283 0.00431 0 -0.00606 -0.01802 10.02.11 0.00277 0 -0.00429 -0.00885 0 0 11.02.11 -0.01657 0.015945 -0.00862 0 0.006098 -0.0367 14.02.11 -0.00843 0.035874 0.017391 0.005952 0.006061 0.012698 15.02.11 0.002833 -0.00216 0.017094 0.023669 0 -0.0094 16.02.11 0.002825 -0.00651 -0.0042 0.00289 0.006024 -0.00633 17.02.11 -0.01127 0.00655 -0.00844 -0.01729 -0.01796 -0.02866 18.02.11 -0.01709 -0.01302 0 -0.01173 -0.0122 0.016393 21.02.11 -0.02319 -0.03077 -0.00426 -0.02967 -0.03704 -0.01613 22.02.11 -0.02077 -0.02721 -0.01282 -0.02141 -0.02564 -0.02623 23.02.11 -0.01212 0.016317 0 0 0.026316 -0.0202 24.02.11 0.027607 0 0 0.003125 0.00641 -0.04811 25.02.11 -0.03881 -0.04128 -0.00433 -0.02492 -0.07643 -0.05415 28.02.11 -0.04348 0.004785 -0.00435 0.003195 0.013793 0 01.03.11 0.022727 0.030952 0.004367 0.025478 0.040816 0.049618 02.03.11 0.025397 0 -0.00435 0.099379 0.045752 0.036364 03.03.11 -0.01548 0.046189 -0.00873 -0.0113 -0.00625 -0.01754 04.03.11 0.015723 0.011038 0.008811 -0.00857 0.025157 0.064286 07.03.11 0.037152 -0.00437 0.004367 0.002882 0.067485 0.010067 08.03.11 0.029851 -0.02632 0 0.034483 0 0.009967 09.03.11 0.026087 -0.00225 0 0.044444 -0.00575 0.019737 10.03.11 0.016949 0.009029 0.004348 0.010638 0 0.032258 11.03.11 0.005556 -0.02461 0 -0.02105 -0.0289 0.034375 14.03.11 -0.03591 0.025229 -0.00866 0 -0.02381 -0.03021 15.03.11 0.005731 0.006711 0.0131 0.005376 0.036585 -0.00623 16.03.11 0.008547 0.02 -0.00431 -0.00535 -0.02353 -0.01254 17.03.11 0.00565 0.013072 0.004329 0 -0.00602 0.022222 18.03.11 0.005618 0.021505 0.012931 0.002688 0.012121 0.059006 21.03.11 0.002793 -0.01053 -0.00426 -0.01072 -0.00599 -0.0088 22.03.11 0.002786 0.02766 0.008547 -0.01897 0.012048 0 23.03.11 0.002778 -0.02484 -0.00424 -0.00829 0 0 24.03.11 -0.01108 0 0 -0.00279 0.005952 -0.00296 25.03.11 -0.0084 0.002123 -0.00426 -0.01397 -0.00592 0.002967 28.03.11 0.00565 0.004237 0.008547 0.025496 0.005952 0.023669 29.03.11 0.008427 0.00211 -0.00424 -0.00829 0.023669 0.00578 30.03.11 0.036212 -0.00211 0.017021 0.038997 0.034682 0.011494 31.03.11 0.048387 0.021097 0.012552 0.072386 0.005587 -0.00568 01.04.11

113
Table A.3(continue): Daily Return End of Day Portfolio's Stock Value
KCHOL KOZAD PETKM SAHOL SKBNK SISE Tarih -0.01026 -0.00413 -0.00413 -0.015 0 -0.00286 04.04.11 0.020725 0.020747 0 0.01269 0.011111 0.008596 05.04.11 0.025381 0.002033 0.020747 0.022556 0.010989 -0.00568 06.04.11 -0.01733 -0.01217 -0.02846 -0.00245 -0.04348 0 07.04.11 0.007557 0.022587 0.004184 0.009828 0.011364 0.02 08.04.11 0.0225 0.004016 -0.00833 -0.0219 0 -0.0084 11.04.11 -0.01711 -0.004 0.004202 -0.01493 0.011236 0.008475 12.04.11 -0.01493 0.004016 0.012552 0.005051 0 0.014006 13.04.11 -0.0303 -0.032 -0.02479 -0.01508 -0.05 -0.00276 15.04.11 0.023438 0.033058 0.016949 0.017857 0.02924 0.033241 18.04.11 -0.01018 0.004 0.004167 0.007519 0 -0.00804 19.04.11 0.002571 0.039841 0.004149 0.012438 0.017045 0.002703 20.04.11 0 0.038314 0.012397 0 0 -0.0027 21.04.11 0 -0.02583 0.020408 0.004914 0 0 22.04.11 -0.00513 0 0.02 -0.03912 -0.00559 0.021622 25.04.11 0 0 0 0 0 0 26.04.11 Table A.3(continue): Daily Return End of Day Portfolio's Stock Value
HALKB TAVHL TKFEN TEBNK TOASO TCELL Tarih -0.02521 0.012658 0.004082 -0.00714 0.008475 0.018868 03.01.10 -0.00862 0.020833 0.056911 0.007194 0.029412 0.037037 04.01.10 0.008696 0.008163 0.028846 -0.01429 -0.00408 0.017857 05.01.10 0 -0.01215 -0.00935 0.021739 0.028689 0.017544 06.01.10 -0.01724 0.081967 0.018868 -0.02128 0.025896 -0.01724 07.01.10 -0.03509 0.013258 -0.00926 0 -0.00971 -0.01754 08.01.10 -0.01818 0 -0.02804 -0.01449 -0.02353 0.008929 11.01.10 0.027778 0.056075 0.048077 0.007353 0 0.017699 12.01.10 -0.01802 0 0.036697 -0.0073 0.034137 0.008696 13.01.10 -0.00917 -0.00885 0.00885 -0.02941 0.038835 -0.02586 14.01.10 0.046296 0.035714 0.026316 -0.00758 0 0.035398 18.01.10 -0.00885 0 -0.00855 0 0.009346 -0.00855 19.01.10 -0.03571 -0.00862 -0.00862 0.007634 0.018519 -0.00862 20.01.10 -0.02778 -0.02609 -0.03478 -0.02273 -0.00909 0 21.01.10 -0.00952 0.008929 0 -0.00775 0.009174 0 22.01.10 0 0.00885 0.009009 -0.01172 0 0 25.01.10 -0.00962 0.017544 0 0.003953 -0.00909 -0.01739 26.01.10 0 0.043103 0.017857 0 0.055046 -0.0354 27.01.10 0 0.024793 -0.00877 0 0 0.009174 28.01.10 0.019417 0.016129 0 0.015748 0 0.018182 29.01.10 -0.01905 0.007937 0.00885 -0.03101 -0.01739 -0.00893 01.02.10 0.009709 -0.02362 -0.00877 0 0.017699 0 02.02.10 -0.03846 -0.01613 -0.02655 -0.032 -0.02609 -0.03604 03.02.10 -0.04 -0.0082 -0.05455 -0.04959 -0.04464 -0.06542 04.02.10 -0.01563 -0.03306 -0.05769 -0.03478 -0.05607 0.01 05.02.10 0.021164 0.059829 0.061224 -0.03153 0.029703 0.019802 08.02.10 0.031088 0 0.028846 0.018605 0.048077 -0.00971 09.02.10 -0.01005 -0.01613 -0.02804 0.077626 -0.00917 -0.03922 11.02.10 0.005076 -0.02459 0.009615 0.097458 0.027778 0.010204 12.02.10 0 0 0.028571 -0.00386 -0.01802 0.010101 15.02.10

114
Table A.3(continue): Daily Return End of Day Portfolio's Stock Value
HALKB TAVHL TKFEN TEBNK TOASO TCELL Tarih 0.050505 0.02521 0.018519 -0.03101 0.009174 -0.005 16.02.10 -0.02885 -0.04098 -0.01818 0.008 0 -0.01005 17.02.10 0.029703 0.025641 0 0.043651 -0.00909 0.015228 18.02.10 -0.03846 -0.025 -0.00926 -0.04943 0.009174 -0.01 19.02.10 -0.03 -0.04274 -0.01869 0.012 -0.06364 -0.0101 22.02.10 -0.01546 -0.01786 -0.0381 -0.08696 -0.05631 -0.02551 23.02.10 0 0 -0.0198 0.004329 -0.02058 -0.02618 24.02.10 0.020942 0.009091 0.010101 0.038793 0.029412 -0.02688 25.02.10 0.025641 0.045045 0.05 0.012448 0.028571 0.022099 26.02.10 0.01 0.025862 0.028571 0 0.021825 0.010811 01.03.10 0.009901 -0.0084 -0.00926 -0.01639 -0.01942 0 02.03.10 -0.01961 -0.0339 -0.00935 0 0.019802 -0.02674 03.03.10 0.015 0.017544 0.066038 0.016667 0.009709 0.016484 04.03.10 0.004926 0 -0.0177 -0.01639 0.009615 0.021622 05.03.10 -0.02451 0 -0.00901 -0.0125 0 0 09.03.10 -0.00503 0.008621 -0.00909 -0.00422 -0.00952 -0.01058 10.03.10 -0.0303 0.025641 0 0.004237 0 -0.0107 11.03.10 0 0.016667 0 -0.00422 0.009615 0.016216 12.03.10 0.03125 0.032787 0.027523 0.012712 0.047619 0.015957 15.03.10 0.025253 0 0.044643 0.016736 0.009091 -0.00524 16.03.10 -0.02463 -0.03175 -0.02564 -0.02881 -0.02703 -0.02105 17.03.10 -0.00505 -0.0082 -0.00877 -0.01271 0 0.005376 18.03.10 0 0.041322 0.026549 0.008584 0.018519 -0.01604 19.03.10 0.005076 -0.00794 0.008621 0.017021 0.009091 0.005435 22.03.10 0.080808 0 0.025641 0.066946 0.018018 -0.02703 23.03.10 0.074766 0.008 0.008333 0.035294 0.017699 0.016667 24.03.10 -0.02261 -0.03175 -0.05124 -0.08333 -0.09043 -0.01858 25.03.10 0 0.008197 -0.00871 -0.00826 0.00956 0 01.04.10 0.016904 0.00813 0.026362 0.008333 0.00947 0.005568 02.04.10 -0.01662 0.016129 0 -0.00826 0.018762 -0.00554 05.04.10 0 -0.00794 0 -0.00833 0.016575 0.016704 06.04.10 -0.0089 -0.016 0 -0.01681 -0.00725 -0.00548 07.04.10 0.035009 0.00813 -0.01712 0.017094 0.007299 0 08.04.10 0.025152 -0.01613 -0.02613 -0.0084 0.025362 0 09.04.10 0.050505 0.02521 0.018519 -0.03101 0.009174 -0.005 16.02.10 -0.03299 0.032787 -0.01789 -0.0339 0.017668 -0.00551 12.04.10 0.076115 0.047619 0.010929 0.083333 0.067708 -0.01802 13.04.10 -0.01626 0.015152 -0.01802 -0.0081 0.01626 -0.01802 14.04.10 -0.01653 0.022388 0 -0.00408 -0.024 -0.00917 15.04.10 -0.0084 0.007299 -0.01835 0.016393 -0.01639 0.009259 16.04.10 0.016949 0.014493 0.028037 0.016129 0.016667 0.009174 19.04.10 0 0.007143 0 -0.00794 0.008197 -0.01818 20.04.10 0.008333 -0.00709 -0.00909 -0.02 -0.00813 -0.01852 21.04.10 0.008264 0.007143 0.018349 -0.00408 0 0 23.04.10 -0.01639 -0.00709 -0.03604 -0.0082 0 0.015789 26.04.10 -0.00833 0 -0.03738 -0.01653 0 0 27.04.10 0 0.014286 0.029126 0.033613 0.016393 0.005291 28.04.10 -0.0084 0.028169 0.009434 0.004065 0.016129 0.015789 29.04.10 -0.04237 -0.0274 -0.02804 0.004049 -0.02381 -0.01036 30.04.10 -0.02655 -0.05634 -0.02885 -0.0121 -0.03252 -0.00524 04.05.10 -0.01818 -0.00746 0 -0.02041 -0.01681 -0.03158 05.05.10

115
Table A.3(continue): Daily Return End of Day Portfolio's Stock Value
HALKB TAVHL TKFEN TEBNK TOASO TCELL Tarih -0.03704 -0.08271 -0.07327 -0.07917 -0.01709 -0.05978 06.05.10 0.134615 0.065574 0.059829 0.072398 0.043478 0.028902 07.05.10 -0.02542 0 0.032258 0 -0.01667 -0.00562 10.05.10 0.026087 -0.00769 0.035156 0.021097 0.008475 0.011299 11.05.10 -0.02542 -0.03101 -0.01887 -0.02066 -0.01681 0.011173 12.05.10 -0.02609 -0.08 -0.04615 -0.07173 -0.01709 -0.07735 13.05.10 0.017857 0.034783 0.020161 0.022727 0.008696 -0.00599 17.05.10 -0.04386 -0.05882 -0.04743 -0.03111 -0.06897 -0.06024 18.05.10 -0.0367 0.008929 -0.0083 -0.03211 -0.00926 0.019231 20.05.10 0.019048 0.00885 -0.00418 -0.00948 0.009346 0.031447 21.05.10 -0.06542 -0.05263 -0.03782 -0.08134 -0.05556 -0.01829 24.05.10 0.03 0.018519 0.017467 0.010417 0.009804 0.024845 25.05.10 0.009709 0.036364 0.021459 0.06701 0.048544 0.006061 26.05.10 0.009615 -0.02632 0 0.033816 0.009259 0.03012 27.05.10 -0.01905 -0.01802 -0.01681 -0.01869 -0.00917 -0.00585 28.05.10 0 -0.00917 0 0.028571 0.018519 -0.00588 31.05.10 0.029126 0.027778 0.025641 0.009259 0.018182 -0.00592 01.06.10 0.028302 0.009009 0 -0.00459 0.008929 0.011905 02.06.10 -0.01835 -0.00893 -0.025 0.013825 -0.0354 0.017647 03.06.10 -0.00935 -0.00901 0 -0.05 -0.00917 0.011561 04.06.10 -0.01887 0.009091 0.004274 -0.03828 -0.02778 -0.02857 07.06.10 0.009615 0.027027 0.021277 0.00995 0.019048 0.005882 08.06.10 0.019048 0.026316 0.004167 -0.00985 -0.00935 -0.00585 09.06.10 0 -0.00855 0.008299 -0.01493 0.009434 0.005882 10.06.10 0.046729 0.017241 0.028807 0.040404 0.028037 0 11.06.10 -0.00893 -0.02542 -0.02 -0.01942 -0.00909 -0.00585 15.06.10 0.009009 -0.0087 0 0 0.036697 -0.00588 16.06.10 0.017857 0.008772 -0.00408 0.019802 0.035398 -0.00592 17.06.10 -0.00877 -0.0087 0 -0.01942 0 0.005952 18.06.10 0.017699 -0.01754 0 -0.02475 -0.00855 -0.00592 21.06.10 -0.02609 -0.02679 -0.02459 -0.03046 -0.01724 -0.0119 22.06.10 0.017857 0.018349 0.012605 -0.01047 -0.00877 0.012048 23.06.10 0.026316 0 -0.00415 0.005291 0 0 24.06.10 0.034188 0.018018 0.008333 0.031579 -0.00885 0.005952 27.06.10 -0.01653 -0.02655 -0.02479 0 -0.02679 -0.00592 28.06.10 -0.0084 0.027273 -0.00424 -0.01531 -0.00917 -0.01786 29.06.10 -0.02542 -0.00885 -0.02128 -0.02073 -0.01852 -0.0303 30.06.10 0.017391 0.008929 0.008696 0.015873 0.009434 0.0125 01.07.10 -0.02564 0.00885 0 -0.01042 0.009346 0.012346 02.07.10 0.017544 0.026316 0.034483 0.026316 0.055556 0 05.07.10 0 -0.00855 -0.00417 -0.00513 0.008772 -0.0061 06.07.10 0.008621 -0.00862 0.004184 -0.00515 0.017391 0.018405 07.07.10 0.008547 0.008696 0.0125 -0.01554 0.008547 -0.01807 08.07.10 0 0.008621 0.00823 0.015789 0 0.01227 09.07.10 0.033898 0.034188 0.004082 0.025907 0.033898 0 12.07.10 -0.0082 0.008264 -0.00407 0.010101 -0.01639 -0.01212 13.07.10 0.008264 0 -0.02041 -0.025 0.008333 -0.00613 14.07.10 0.008197 -0.0082 -0.00417 -0.00513 -0.00826 -0.00617 15.07.10 0.00813 0.024793 0 0 -0.00833 0 16.07.10 -0.00806 0.016129 -0.00837 0 -0.03361 -0.00621 19.07.10 0.04065 0.039683 0.016878 0.010309 0.017391 -0.00625 20.07.10

116
Table A.3(continue): Daily Return End of Day Portfolio's Stock Value
HALKB TAVHL TKFEN TEBNK TOASO TCELL Tarih 0.015625 0.022901 0.008299 0.010204 0.025641 0.025157 21.07.10 -0.03077 -0.00746 0.004115 -0.0101 -0.025 0.006135 22.07.10 0.007937 0.007519 0.004098 0.020408 0 0.02439 23.07.10 0.007874 -0.01493 0.008163 0.075 0.008547 0.035714 26.07.10 0 -0.01515 0.016194 0.009302 0 0.011494 27.07.10 -0.01563 -0.00769 0.015936 0.009217 0 0.006135 28.07.10 -0.03175 -0.00775 -0.0098 -0.02283 -0.02542 0 29.07.10 0.032787 0.015625 0.019802 0.056075 0.043478 -0.01093 30.07.10 -0.00794 0 -0.00971 -0.01327 -0.01667 0 02.08.10 -0.016 -0.01538 0.009804 0.013453 0.016949 0 03.08.10 -0.01626 0 -0.00971 0.017699 -0.00833 0.016667 04.08.10 0 0.039063 0.058824 0.013043 0 0 05.08.10 0.016529 -0.01504 0.009259 0.004292 -0.0084 -0.01093 06.08.10 -0.01626 0.022901 -0.01835 -0.02991 -0.01695 0 09.08.10 -0.00826 0 -0.03738 -0.02643 -0.00862 -0.00552 10.08.10 0.008333 0.022388 0 0.022624 -0.0087 -0.01667 11.08.10 0.008264 0 0.019417 -0.00442 -0.01754 0.011299 12.08.10 -0.0082 0 0 -0.00444 0.017857 0.011173 13.08.10 0.033058 -0.0219 0.038095 -0.00446 0 -0.01105 16.08.10 0.016 -0.01493 -0.00917 0 0.008772 0 17.08.10 -0.02362 -0.01515 -0.00926 -0.00448 0.008696 0 18.08.10 -0.00806 0.007692 -0.00935 -0.00901 0.008621 0.01676 19.08.10 0 0.007634 0 0 0.025641 0.021978 20.08.10 -0.01626 0.007576 -0.01887 -0.00909 0.008333 -0.01075 23.08.10 0.008264 0.007519 0.019231 -0.02294 0 0 24.08.10 -0.0082 0.007463 0.018868 0.032864 0 0.005435 25.08.10 0 0.014815 0.027778 0.013636 0.008264 0.037838 26.08.10 0 0 0 0 0 0 27.08.10 0.024793 -0.0146 0.009009 0.004484 0.02459 0.005208 28.08.10 0.016129 0 -0.00893 0.013393 0.008 0.005181 31.08.10 0 0.02963 0.009009 -0.00441 0.015873 0.010309 01.09.10 0 0 0 0.013274 0.007813 0.015306 02.09.10 0.015873 -0.00719 -0.00893 -0.00437 0.023256 -0.01005 03.09.10 -0.01563 0.014493 -0.00901 -0.02193 -0.01515 0.005076 06.09.10 -0.00794 0 0 -0.00448 -0.00769 -0.00505 07.09.10 0 0 0 0 0 0 08.09.10 0.024 0.028571 0.018182 0.031532 0.054264 0.015228 10.09.10 -0.00781 -0.01389 -0.00893 0 0.014706 0.01 13.09.10 0.015748 0.014085 0.018018 0.004367 0 -0.0099 14.09.10 0 0.020833 0.017699 0 -0.01449 -0.01 15.09.10 -0.00775 0.006803 0 -0.01304 -0.02941 0.015152 16.09.10 0.023438 0.02027 0.017391 0.008811 0.022727 -0.00498 17.09.10 0.007634 0.019868 -0.00855 -0.00873 0.007407 0.005 20.09.10 0.022727 0.019481 0 0 0.007353 -0.00498 21.09.10 -0.00741 -0.01911 -0.00862 0.008811 -0.0146 0 22.09.10 -0.00746 0.019481 -0.0087 0.004367 0 -0.005 23.09.10 0.007519 -0.01274 0.008772 0.017391 0.014815 -0.01005 24.09.10 0.037313 -0.00645 0.008696 0.008547 0.021898 0 27.09.10 -0.02158 0.012987 -0.00862 -0.00847 0.028571 -0.02538 28.09.10 -0.01471 -0.00641 0.026087 0 0.041667 0.015625 29.09.10 -0.02239 -0.01935 -0.01695 -0.00855 -0.01333 0.015385 30.09.10

117
Table A.3(continue): Daily Return End of Day Portfolio's Stock Value
HALKB TAVHL TKFEN TEBNK TOASO TCELL Tarih 0.007634 0.032895 0.008621 0.012931 0.027027 0 01.10.10 0.030303 0.012739 0.034188 0.012766 0.032895 0.005051 04.10.10 0 -0.00629 0.024793 0.012605 0.019108 0.035176 05.10.10 0 -0.01266 0 -0.00415 0.03125 0.029126 06.10.10 0.007353 -0.00641 0.016129 0.008333 -0.00606 -0.01887 07.10.10 0.058394 0.012903 0.02381 0.016529 0.030488 -0.00962 08.10.10 0.013793 -0.01274 0 0.00813 0.017751 0.029126 11.10.10 0.034014 0.012903 -0.00775 0.016129 -0.02907 0.018868 12.10.10 0 0 -0.03906 0 -0.01796 0 13.10.10 0.013158 0.019108 0 0.031746 -0.01829 0.009259 14.10.10 0.012987 0 0.01626 0.015385 -0.01242 -0.00917 15.10.10 -0.01923 -0.00625 -0.024 -0.01515 0 -0.00926 18.10.10 0 -0.00629 0.016393 0 0.006289 -0.00935 19.10.10 0.013072 0.012658 0.008065 0.015385 0 0.018868 20.10.10 -0.0129 -0.00625 0 0.015152 0.00625 0.018519 21.10.10 -0.00654 0.006289 0.016 -0.05224 0.012422 -0.03636 22.10.10 -0.00658 -0.03125 0.023622 0.007874 -0.00613 0 25.10.10 -0.02649 -0.03871 -0.04615 -0.03906 -0.01235 -0.04717 26.10.10 -0.01361 0.006711 0.008065 0 -0.00625 0.029703 27.10.10 0.024138 -0.008 0.0048 0.004065 0.006289 -0.00962 28.10.10 0.023569 -0.00806 -0.00637 0.016194 0.0175 0.004854 01.11.10 -0.00658 0.01897 0.003205 -0.01594 -0.0172 0.004831 02.11.10 0.02649 0.021277 0.041534 0.02834 -0.03 0.033654 03.11.10 0.032258 -0.00781 -0.01227 -0.01575 -0.01031 0 04.11.10 -0.00625 0.020997 -0.00311 0.012 0.067708 0.004651 05.11.10 0.018868 0.007712 0.028037 -0.00395 0.026829 0.032407 08.11.10 -0.00926 0.007653 0.021212 -0.01587 -0.01663 -0.03139 09.11.10 -0.00623 -0.00253 0.008902 -0.01613 0 0.00463 10.11.10 -0.00627 -0.00508 -0.02941 -0.02459 -0.00725 0.009217 11.11.10 -0.01262 0.007653 0.012121 0 0 0.004566 12.11.10 -0.0607 -0.02532 -0.01796 -0.0042 -0.01703 -0.05909 15.11.10 0 -0.06234 -0.03354 -0.03797 -0.0396 -0.00966 22.11.10 0.027211 0.00554 0.009464 0.02193 -0.00773 0.029268 23.11.10 0 0.019284 -0.01563 0.04721 0.012987 0 24.11.10 -0.01656 -0.00811 -0.01905 -0.03689 -0.02308 -0.00474 25.11.10 -0.05724 -0.02452 -0.0356 -0.03404 -0.05774 -0.00952 26.11.10 0.010714 0.00838 0.010067 0.013216 0.097493 -0.01923 29.11.10 0 0.022161 0.009967 0.017391 0.043147 0.014706 30.11.10 0.007067 -0.00813 0.023026 0.008547 0.004866 -0.01932 01.12.10 -0.00351 0.002732 0.025723 -0.00847 0.026634 -0.00985 02.12.10 0.010563 0.002725 0.009404 0 -0.01651 0.0199 03.12.10 0 -0.00543 0.003106 -0.00427 -0.01679 0 06.12.10 -0.01742 0.010929 0.01548 -0.00858 -0.02683 -0.01951 07.12.10 -0.0461 0.002703 -0.03659 -0.00433 -0.03258 0.00995 08.12.10 -0.03717 -0.01348 -0.03165 0.004348 0.033679 -0.01478 09.12.10 0.034749 0.021858 0.01634 0.012987 0.002506 0.035 10.12.10 0.022388 0.029412 0 0.004274 0 0.004831 13.12.10 -0.01825 -0.01299 0.003215 -0.01277 -0.005 -0.02885 14.12.10 -0.00743 -0.00263 -0.00321 -0.02155 -0.01005 0 15.12.10 -0.0412 -0.01847 -0.01286 0 -0.01523 0 16.12.10 0 -0.00538 0.026059 -0.01762 0.002577 0.009901 17.12.10

118
Table A.3(continue): Daily Return End of Day Portfolio's Stock Value
HALKB TAVHL TKFEN TEBNK TOASO TCELL Tarih 0.015625 0 0.025397 0.004484 0.023136 0.019608 20.12.10 0.003846 0.018919 0 0 0.005025 0 21.12.10 0.003831 0.013263 0.003096 0.004464 0.01 0.024038 22.12.10 -0.00382 0.002618 0 0.008889 -0.00495 -0.00469 23.12.10 -0.00383 -0.01044 0.009259 -0.00881 -0.00498 0.014151 24.12.10 0.003846 -0.01055 0.003058 -0.00444 0.005 -0.01395 27.12.10 0.007663 -0.00267 0.006098 0 -0.00249 0.009434 28.12.10 -0.0038 0.010695 -0.00606 0.013393 0.009975 0.009346 29.12.10 0 -0.01058 -0.01524 -0.01762 -0.01728 -0.02315 30.12.10 0.045802 0.02139 0.03096 0.008969 0.027638 0.018957 31.12.10 0.018248 0.005236 0.03003 0.017778 0.036675 0.004651 03.01.11 0.017921 0 0.037901 0.004367 0.025943 0.013889 04.01.11 0.007042 0.010417 0.014045 0.008696 0.029885 -0.00913 05.01.11 -0.02797 -0.01031 0.00277 0 0.013393 0 06.01.11 -0.03597 -0.0026 0.027624 -0.02586 -0.00661 0 07.01.11 -0.01493 -0.01305 -0.01882 -0.0354 0.002217 0.004608 10.01.11 0 0.015873 0 0.009174 0.004425 0 12.01.11 -0.02652 -0.01042 0.010959 -0.01364 0.013216 -0.03211 13.01.11 -0.03502 -0.01842 0.00542 -0.00922 0.002174 0 14.01.11 -0.02419 -0.00268 0.013477 -0.01395 0 -0.01896 17.01.11 0.028926 0.026882 0.00266 -0.0283 -0.02386 -0.00483 18.01.11 -0.04418 0.005236 -0.02918 -0.03398 -0.02222 0.004854 19.01.11 0.037815 -0.01042 -0.00273 0.005025 -0.01818 -0.02899 20.01.11 -0.02024 -0.00789 0.005479 -0.03 0.064815 0.00995 21.01.11 0.049587 0.007958 0.008174 0.010309 0.006522 -0.00985 25.01.11 -0.01575 -0.01842 -0.01351 -0.01531 -0.06263 0.004975 26.01.11 -0.024 -0.02949 -0.03288 -0.05699 -0.01728 -0.01584 27.01.11 0.036885 0.044199 -0.05666 0 0.01524 -0.01207 28.01.11 0.031621 -0.02116 0.009009 0.043956 0.016166 0.01833 31.01.11 0.019157 -0.02162 0.035714 0.015789 0.009091 0.01 01.02.11 -0.03008 -0.02762 -0.02586 -0.03627 -0.0045 -0.00495 02.02.11 0.027132 0.005682 0.00885 0.032258 0.002262 -0.00498 03.02.11 -0.01132 0 -0.00292 -0.00521 0.015801 -0.004 04.02.11 -0.01145 0.031073 0.026393 0 -0.01111 0.004016 07.02.11 -0.01544 0.010959 -0.01714 0.04712 -0.01124 0.015 08.02.11 -0.03137 -0.02439 -0.02616 0.01 -0.01136 -0.00985 09.02.11 0.008097 -0.00278 0 -0.02475 -0.02069 0.006965 10.02.11 0.004016 0.005571 0.01194 -0.03553 -0.00235 -0.00198 11.02.11 0.004 0.00831 -0.0118 0.010526 -0.01412 0.009901 14.02.11 0.003984 0.016484 -0.01791 0.005208 0 -0.0049 15.02.11 0.003968 -0.00811 -0.03647 -0.01036 -0.01432 0.024631 16.02.11 0.01581 -0.00817 0.003155 0 -0.01211 0.014423 17.02.11 -0.00389 -0.02747 -0.07862 -0.04188 -0.01471 -0.01896 18.02.11 -0.00781 -0.0452 -0.01024 -0.00546 0.047264 -0.00966 21.02.11 -0.02362 -0.04142 -0.01379 -0.03297 -0.04988 -0.00976 22.02.11 -0.05645 -0.01852 -0.02098 -0.02841 -0.0725 -0.09754 23.02.11 -0.00855 0.003145 -0.01071 0.005848 0.02965 -0.01747 24.02.11 0 0.012539 -0.03249 -0.01163 0.010471 -0.00444 25.02.11 -0.06034 -0.03406 -0.03358 -0.04706 -0.04404 -0.02679 28.02.11 -0.01376 0.022436 0 -0.00617 0.01084 -0.01606 01.03.11 0.04186 0.034483 0.046332 0.031056 0.0563 0.016317 02.03.11

119
Table A.3(continue): Daily Return End of Day Portfolio's Stock Value
HALKB TAVHL TKFEN TEBNK TOASO TCELL Tarih 0.008929 0.00303 0.02583 -0.00602 0.058376 0.025229 03.03.11 -0.02212 -0.03323 -0.04676 -0.0303 -0.0048 -0.00447 04.03.11 0.027149 0.028125 0.018868 0.025 -0.01205 0.020225 07.03.11 0.039648 0.024316 0.014815 0.067073 -0.00976 0.004405 08.03.11 0.029661 0.032641 0.014599 -0.00571 -0.00246 -0.00439 09.03.11 0.020576 0.022989 0.003597 -0.00575 -0.00494 -0.01322 10.03.11 0.012097 -0.00843 0.014337 0.00578 0.034739 0.011161 11.03.11 0.003984 -0.01983 -0.02473 -0.01724 -0.01439 -0.00221 14.03.11 -0.03571 0.011561 -0.01449 -0.02339 0.004866 -0.00221 15.03.11 0.00823 0.011429 0.025735 0.02994 -0.00726 0.002217 16.03.11 0.004082 0.022599 0.017921 -0.00581 -0.00976 0.002212 17.03.11 -0.00813 -0.00552 -0.00704 -0.00585 0.009852 0.006623 18.03.11 0 0.008333 0.007092 0.005882 0.004878 0.037281 21.03.11 -0.02869 -0.02204 -0.01408 0.011696 -0.00485 -0.00423 22.03.11 0.021097 0.016901 0.017857 0.028902 0.004878 0.021231 23.03.11 0 -0.01385 -0.00702 0.02809 0.004854 -0.00624 24.03.11 -0.00826 0.022472 0.028269 -0.00546 0.021739 -0.00418 25.03.11 -0.025 0.002747 0.003436 0 0.014184 -0.02311 28.03.11 0.017094 0 0.017123 0.005495 0.004662 -0.00215 29.03.11 0.004202 0.008219 0.020202 0.174863 0.011601 -0.01509 30.03.11 0.025105 0.008152 0.042904 0 0.004587 0.039387 31.03.11 0.036735 0.016173 0 0.004651 0.015982 0.010526 01.04.11 -0.00394 -0.00531 -0.00949 0 -0.01348 -0.00208 04.04.11 0.01581 0.008 -0.00319 0 0.018223 -0.00835 05.04.11 0.019455 0.034392 0.003205 0 -0.05817 -0.00211 06.04.11 -0.01527 -0.02813 -0.01278 -0.00463 -0.00238 -0.02954 07.04.11 0.007752 -0.01579 -0.00971 0.004651 0.014286 -0.00652 08.04.11 0.003846 0 0.003268 0 0.004695 -0.01532 11.04.11 0.007663 0.005348 0 0 0.030374 -0.00222 12.04.11 0.015209 0.013298 0 0 0 -0.00223 13.04.11 -0.03371 -0.04724 -0.02606 -0.00463 -0.01134 -0.02902 15.04.11 0.015504 0.046832 0.036789 0.004651 0.002294 0.025287 18.04.11 0.003817 0 0.006452 0 0.004577 0.015695 19.04.11 0.007605 -0.00263 0.00641 0 -0.00683 0.013245 20.04.11 0 0.002639 0.012739 0 -0.00229 0 21.04.11 0 0.015789 0.012579 -0.00926 -0.0046 -0.02397 22.04.11 -0.00377 -0.01036 -0.00932 0.004673 0.002309 0 25.04.11 0 0 0 0 0 0 26.04.11

120
Table A.3(continue): Daily Return End of Day Portfolio's Stock Value TUPRS THYAO TTKOM VAKFN VESTL YKBNK Tarih
0.042017 0 0.004386 0.007519 0.053846 0 03.01.10 0.016129 0.008772 0.026201 0.052239 -0.0073 0.042683 04.01.10
0 -0.02609 0.042553 -0.00709 0.073529 0.005848 05.01.10 0 0 0.004082 0.007143 -0.02055 0.011628 06.01.10
-0.02381 -0.01786 0.036585 -0.00709 -0.01399 -0.00575 07.01.10 -0.01626 -0.00909 0.019608 -0.00714 0.028369 -0.02312 08.01.10 -0.00826 -0.00917 -0.03846 -0.01439 0 -0.00592 11.01.10
0.05 0.046296 0.01 0.014599 -0.02759 0.017857 12.01.10 0.031746 0.00885 0 0.007194 -0.00709 -0.0117 13.01.10 -0.03077 -0.01754 -0.01386 0 -0.00714 0.017751 14.01.10 0.039683 0.017857 0.028112 0.021429 0.007194 0.011628 18.01.10 -0.03817 -0.02632 0.005859 0 0.007143 0.028736 19.01.10 0.007937 0 0 0.006993 0 -0.00559 20.01.10
0 -0.01802 -0.01942 -0.03472 -0.04255 -0.02809 21.01.10 -0.00787 -0.00917 -0.0099 0 0.022222 0.023121 22.01.10 0.007937 0.018519 -0.004 0.014388 -0.01449 0.011299 25.01.10 -0.01575 0.009091 0.008032 -0.00709 -0.00735 -0.01117 26.01.10
0.016 0 0.015936 0.142857 0.014815 0.022599 27.01.10 -0.01575 -0.00901 0.019608 0.01875 -0.0073 0.005525 28.01.10
0 0.018182 0 -0.03067 0.014706 0.005495 29.01.10 -0.008 -0.00893 -0.00962 0.101266 -0.00725 -0.00546 01.02.10
-0.01613 0.009009 -0.01942 0.045977 0.014599 -0.00549 02.02.10 -0.05738 -0.02679 -0.02178 -0.04396 -0.02878 -0.02762 03.02.10 -0.06087 -0.05505 -0.03644 -0.12069 -0.07407 -0.02841 04.02.10 0.027778 -0.03883 -0.01261 -0.0719 -0.056 -0.05263 05.02.10 0.018018 0.030303 0.017021 0.06338 0.016949 0.018519 08.02.10
0.00885 0.009804 0.029289 -0.01325 0.016667 -0.00606 09.02.10 0 0 0.012195 0 0 -0.0061 11.02.10
0.008772 0.058252 -0.01205 0 0.02459 -0.0184 12.02.10 0.043478 -0.00917 0 0.073826 0.008 0.0125 15.02.10
0.025 0.018519 0.004065 0.00625 0.015873 0.055556 16.02.10 -0.01626 -0.00909 -0.01215 -0.01863 -0.01563 -0.02924 17.02.10 -0.00826 0.009174 0.004098 -0.01266 0 0.054217 18.02.10
0 -0.00909 0.010204 -0.01282 -0.03175 -0.02857 19.02.10 -0.01667 -0.01835 -0.0303 0.006494 -0.02869 -0.02941 22.02.10 -0.04237 -0.05607 -0.00417 -0.07742 -0.05485 -0.01212 23.02.10 -0.02655 -0.0396 0.016736 -0.02797 -0.00446 -0.00613 24.02.10 0.018182 0.010309 -0.00412 0.035971 0.022422 0.024691 25.02.10 0.035714 0.032653 0.024793 0.048611 0.039474 0.012048 26.02.10
0 0.037549 0 0 0.004219 0.017857 01.03.10 0.034483 0 0 -0.01325 0.012605 -0.00585 02.03.10 0.016667 0 -0.00806 -0.00671 -0.01245 -0.01176 03.03.10
0 0.028571 0.012195 0.02027 0.021008 0.017857 04.03.10 0 -0.00926 0.004016 0 0.012346 0 05.03.10
0.016393 0 -0.008 -0.00662 0 0 09.03.10 -0.00806 -0.00935 0 0 -0.00813 -0.01754 10.03.10 0.00813 0.018868 0 -0.01333 -0.0082 0.005952 11.03.10
0 -0.01852 0 -0.00676 -0.00413 -0.01183 12.03.10 0.016129 0 0.012097 0.027211 0.029046 0.035928 15.03.10
0.02381 0.018868 0.005976 0.013245 0.008065 0.040462 16.03.10 -0.00775 -0.02778 -0.01782 -0.01961 -0.028 -0.02222 17.03.10

121
Table A.3(continue): Daily Return End of Day Portfolio's Stock Value TUPRS THYAO TTKOM VAKFN VESTL YKBNK Tarih
-0.00781 0 0 -0.01333 -0.00823 0 18.03.10 0.007874 -0.00952 0 0.013514 0.020747 0.005682 19.03.10 0.007813 0 0 0.02 -0.00407 0.028249 22.03.10
0 0 0.004032 0.006536 0.008163 0.043956 23.03.10 0.015504 0.028846 0.014056 0.006494 0.036437 0.026316 24.03.10 -0.05893 -0.14206 -0.06535 0.059677 0.039063 0.025641 25.03.10
0 0.010893 0 0.004926 0.007519 0.005 01.04.10 -0.02109 0.008621 0 0.009804 0.029851 0.004975 02.04.10 -0.00795 -0.01923 0 -0.00971 -0.02174 -0.00495 05.04.10 0.015369 -0.00871 0.010593 -0.0098 -0.02222 -0.00995 06.04.10 -0.00757 -0.02857 0.027254 -0.01485 -0.02273 -0.01508 07.04.10
0 -0.01131 0.010204 0.030151 0.023256 0.030612 08.04.10 -0.00763 -0.01831 0.018182 -0.00976 -0.00758 0.019802 09.04.10 0.007685 0.016317 -0.01786 -0.0197 0 -0.00971 12.04.10 0.069297 0.142202 0.028283 0.243719 0.022901 0.029412 13.04.10
0 0.024096 -0.00877 -0.09091 -0.00746 0 14.04.10 0.023256 -0.0098 -0.0354 0.057778 -0.01504 -0.01905 15.04.10 -0.00758 -0.00198 0.027523 0.105042 -0.01527 0.004854 16.04.10 0.022901 -0.00794 0 -0.05894 0.023256 0.009662 19.04.10 -0.01493 -0.008 0.017857 0.014141 0 -0.00478 20.04.10 0.007576 -0.00403 0 -0.03187 -0.01515 0.033654 21.04.10 0.007519 0.008097 0 0 0.038462 0.027907 23.04.10 -0.00746 -0.01205 0.00823 -0.00412 -0.02963 0.013575 26.04.10 -0.01504 0.004065 0.018692 -0.02066 -0.01527 -0.04018 27.04.10 0.007634 -0.00405 0 0.004219 0 0 28.04.10 0.007576 0.004065 0.018349 -0.01261 -0.00775 -0.0093 29.04.10 -0.04511 -0.02429 -0.01802 -0.0766 -0.04688 -0.04695 30.04.10 -0.02362 -0.0166 0 0.02765 -0.03279 -0.0197 04.05.10 -0.02419 -0.0211 0 -0.04036 -0.01271 -0.01005 05.05.10 -0.02479 -0.06466 -0.00917 -0.13084 -0.07296 -0.05584 06.05.10 0.050847 0.073733 0.037037 0.123656 0.12037 0.086022 07.05.10 -0.00806 0.008584 -0.00893 -0.01435 -0.02479 0.024752 10.05.10 0.02439 0.025532 0.027027 0.058252 0.016949 0.048309 11.05.10
-0.00794 -0.0083 -0.02632 0.027523 -0.00417 -0.01843 12.05.10 -0.008 -0.06695 0 -0.02679 -0.04603 -0.03286 13.05.10
-0.00806 -0.01794 0.009009 -0.00459 0 0.029126 17.05.10 -0.04065 -0.0411 -0.05357 -0.04608 -0.03947 -0.03302 18.05.10 0.025424 -0.02857 0.018868 -0.00966 0.004566 0.009756 20.05.10 0.008264 0.02451 -0.07778 0 0.004545 -0.00966 21.05.10 -0.06557 -0.02871 -0.02008 -0.07317 -0.04525 -0.0439 24.05.10 0.035088 0.034483 0.020492 0.178947 0.033175 0.030612 25.05.10 -0.00847 0.028571 -0.00803 -0.00446 0.027523 0.019802 26.05.10 -0.01709 0.027778 0.012146 -0.01794 0.004464 0 27.05.10
0 -0.00901 -0.008 -0.04566 -0.03556 -0.00485 28.05.10 0 -0.00909 -0.02016 0.023923 0.013825 0.004878 31.05.10
0.026087 0.009174 0.00823 -0.00467 0.009091 0.004854 01.06.10 0.042373 -0.11364 -0.00408 0 0 0 02.06.10
0.01626 -0.04103 0.004098 -0.04225 -0.02252 -0.01449 03.06.10 -0.016 0.010695 0.004082 -0.0049 0 0.004902 04.06.10
-0.03252 0.021164 -0.0122 -0.00493 -0.00922 -0.00488 07.06.10 0.033613 0.010363 0.024691 0.044554 0.004651 0.014706 08.06.10

122
Table A.3(continue): Daily Return End of Day Portfolio's Stock Value TUPRS THYAO TTKOM VAKFN VESTL YKBNK Tarih
0.00813 0.005128 0.012048 -0.01422 0.00463 0.004831 09.06.10 0.024194 -0.0051 0.011905 0.019231 0.004608 0 10.06.10 -0.00787 0.082051 0.039216 0.014151 0.027523 0.038462 11.06.10 0.015873 -0.00948 0.009434 -0.00465 -0.00446 -0.00926 15.06.10 -0.00781 0.009569 -0.02804 0.004673 0 0.014019 16.06.10 -0.00787 0 0 -0.00465 0.004484 0 17.06.10 0.015873 -0.00948 0 -0.00467 -0.00893 0.023041 18.06.10 -0.01563 -0.02392 -0.00962 -0.01408 -0.01351 0.013514 21.06.10 -0.00794 -0.02941 0 -0.01429 -0.02283 -0.02667 22.06.10
0 0.005051 -0.00971 0 0.004673 0.004566 23.06.10 -0.008 -0.00503 0 0.019324 -0.00465 0.004545 24.06.10
-0.00806 0.005051 0.019608 -0.00474 0.004673 0.00905 27.06.10 -0.02439 -0.01508 -0.01923 -0.02857 -0.01395 -0.02691 28.06.10 -0.03333 0 -0.0098 -0.0049 -0.01887 -0.00461 29.06.10 0.008621 0.010204 -0.00198 -0.01478 -0.01442 -0.00926 30.06.10 0.034188 0.035354 0 0.02 0.009756 0.018692 01.07.10 -0.00826 0 -0.00794 0 -0.00966 0.009174 02.07.10 0.016667 0.014634 0.01 0.02451 0.068293 0.018182 05.07.10
0 -0.00962 0.019802 0 -0.03196 0.004464 06.07.10 0.008197 0.014563 0.019417 -0.00478 0.004717 0.017778 07.07.10 -0.00813 -0.00478 0.009524 -0.00962 0.004695 -0.00873 08.07.10
0 0.004808 0 -0.01456 0.009346 -0.00441 09.07.10 0.032787 0.009569 0 0.009852 -0.00463 0.004425 12.07.10 -0.00794 0.004739 -0.00943 -0.00976 0.013953 -0.00881 13.07.10
-0.008 0.014151 0 -0.01478 -0.00917 -0.01778 14.07.10 0.008065 0.009302 -0.01905 0 0.00463 -0.00905 15.07.10
0.016 0.009217 0.009709 0.02 0.004608 0.004566 16.07.10 0.015748 0.022831 0.019231 -0.01471 -0.00459 0.013636 19.07.10 0.007752 0.004464 0 0.004975 0.013825 0.017937 20.07.10 0.038462 -0.00444 -0.00943 0.014851 0.004545 0.004405 21.07.10 0.007407 -0.00446 -0.01905 -0.01463 -0.00452 -0.00877 22.07.10 0.007353 -0.00448 0.009709 0.009901 0.004545 0.004425 23.07.10 0.007299 0.022523 0.028846 0.019608 0 0.013216 26.07.10 -0.02174 -0.00441 0.028037 -0.00962 0.045249 -0.01739 27.07.10 0.007407 -0.0177 0.027273 0.014563 0.004329 0.030973 28.07.10 0.007353 -0.01802 0 -0.02871 -0.01724 -0.01717 29.07.10 0.036496 0.009174 0.017699 0.014778 0.013158 0.0131 30.07.10 -0.00704 0.004545 0 -0.00971 -0.00433 -0.00431 02.08.10 0.021277 -0.00452 0.034783 0 0.026087 -0.01299 03.08.10 -0.01389 0.018182 0.016807 -0.0049 -0.00847 -0.00877 04.08.10 0.007042 -0.00446 0.008264 0 0.004274 0 05.08.10 -0.00699 0.008969 -0.0082 0.009852 0.008511 0 06.08.10 -0.00704 -0.00444 -0.03306 -0.01463 -0.01688 -0.03097 09.08.10 -0.04255 -0.00893 0 -0.0099 -0.01717 -0.0137 10.08.10
0 0.018018 0.034188 0.005 0.017467 -0.00463 11.08.10 0.007407 0.004425 0 -0.00498 0.004292 -0.00465 12.08.10 0.007353 0.008811 0.016529 0.005 0.008547 0.023364 13.08.10 0.014599 0.004367 -0.01626 0.004975 0.008475 0.018265 16.08.10 0.021583 0.026087 -0.00826 -0.0099 -0.0042 0.008969 17.08.10
-0.0493 0.008475 0 0 -0.00422 -0.01333 18.08.10 -0.00741 0.004202 -0.00833 -0.01 -0.00847 0 19.08.10

123
Table A.3(continue): Daily Return End of Day Portfolio's Stock Value TUPRS THYAO TTKOM VAKFN VESTL YKBNK Tarih
-0.02239 -0.03766 0.008403 0.005051 -0.00855 -0.0045 20.08.10 0.007634 0.026087 0.008333 0.030151 -0.01724 0 23.08.10 0.015152 -0.00424 0.024793 -0.00488 -0.00877 0 24.08.10 0.014925 0.012766 0.024194 0.009804 0.013274 0.0181 25.08.10
0 -0.0042 -0.00787 -0.00971 0.004367 0.004444 26.08.10 0 0 0 0 0 0 27.08.10
0.007353 0.012658 0 0 -0.01739 0.00885 28.08.10 0.043796 0.020833 -0.02381 0.004902 0.017699 0 31.08.10 -0.01399 -0.00408 0 0 0.013043 0.008772 01.09.10 0.007092 0 -0.00813 -0.00488 -0.00858 0 02.09.10 -0.01408 0 0.008197 0 0 -0.00435 03.09.10 0.007143 -0.0041 -0.01626 0.029412 -0.00866 -0.0131 06.09.10 -0.01418 -0.00412 0.008264 -0.01905 -0.00437 -0.00442 07.09.10
0 0 0 0 0 0 08.09.10 0.05036 0.016529 0.02459 0.029126 0.026316 0.022222 10.09.10
-0.00685 0.03252 0.024 -0.00472 0.017094 0.004348 13.09.10 0 0.023622 0 -0.00948 -0.0084 0.034632 14.09.10 0 0 -0.00781 0.004785 0.004237 0.008368 15.09.10
0.006897 0 -0.00787 0 0 -0.0083 16.09.10 0.006849 0.019231 -0.00794 0.019048 0.021097 -0.00418 17.09.10
-0.0068 0 0 0 -0.00826 -0.0042 20.09.10 0.020548 0 0 -0.00467 -0.00833 0.012658 21.09.10 0.026846 -0.00943 0 -0.00469 -0.0042 -0.025 22.09.10 -0.01961 0 0 -0.00472 0.004219 0.004274 23.09.10 -0.02667 0.009524 0 0.004739 0.021008 0.012766 24.09.10 0.020548 0.04717 0.016 0.004717 -0.00823 0.021008 27.09.10 0.033557 0.027027 -0.01575 0 -0.00415 0 28.09.10 0.012987 0.035088 0.04 0 0.004167 0.028807 29.09.10 -0.00641 -0.01695 -0.03077 -0.02347 -0.0166 -0.008 30.09.10 -0.00645 0.017241 0.02381 0.009615 0.004219 -0.00403 01.10.10 -0.01299 0.050847 0 0.047619 0.008403 0.02834 04.10.10
0 -0.01613 0.023256 0.013636 0.004167 0.01378 05.10.10 -0.00658 -0.01639 0.007576 -0.01345 -0.0083 0.029126 06.10.10 0.019868 0 -0.00752 -0.01364 0.012552 0.018868 07.10.10 0.006494 0.016667 -0.00758 0.032258 0.020661 0.037037 08.10.10 0.006452 0.008197 0.022901 0 0 -0.00893 11.10.10
0 -0.02439 0 0.013393 0.016194 0.009009 12.10.10 -0.01923 -0.03333 -0.01493 0.017621 -0.00398 -0.01786 13.10.10 0.013072 0.008621 0.022727 0.008658 -0.004 0.027273 14.10.10 -0.01935 0 0.014815 0.008584 -0.00402 -0.00885 15.10.10 -0.00658 0 0 0.012766 -0.00403 -0.03571 18.10.10
0 0.017094 0.036496 -0.0042 0.008097 0.009259 19.10.10 -0.00662 0 0.014085 -0.00422 0.028112 0.036697 20.10.10
0 0.016807 -0.02083 -0.01271 -0.00781 0.00885 21.10.10 0.006667 0.008264 -0.00709 -0.00429 0.015748 0 22.10.10 0.013245 0.008197 0 0 -0.00775 -0.01754 25.10.10 -0.00654 -0.03252 -0.03571 -0.02586 -0.03906 -0.01786 26.10.10 0.013158 0 -0.00741 -0.00885 -0.00813 0 27.10.10
0 -0.0084 0.008955 0.017857 0 0.021818 28.10.10 -0.02078 -0.00678 -0.01479 -0.01535 -0.02049 -0.01423 01.11.10 -0.00531 0.010239 0 0.028953 0.008368 -0.01444 02.11.10
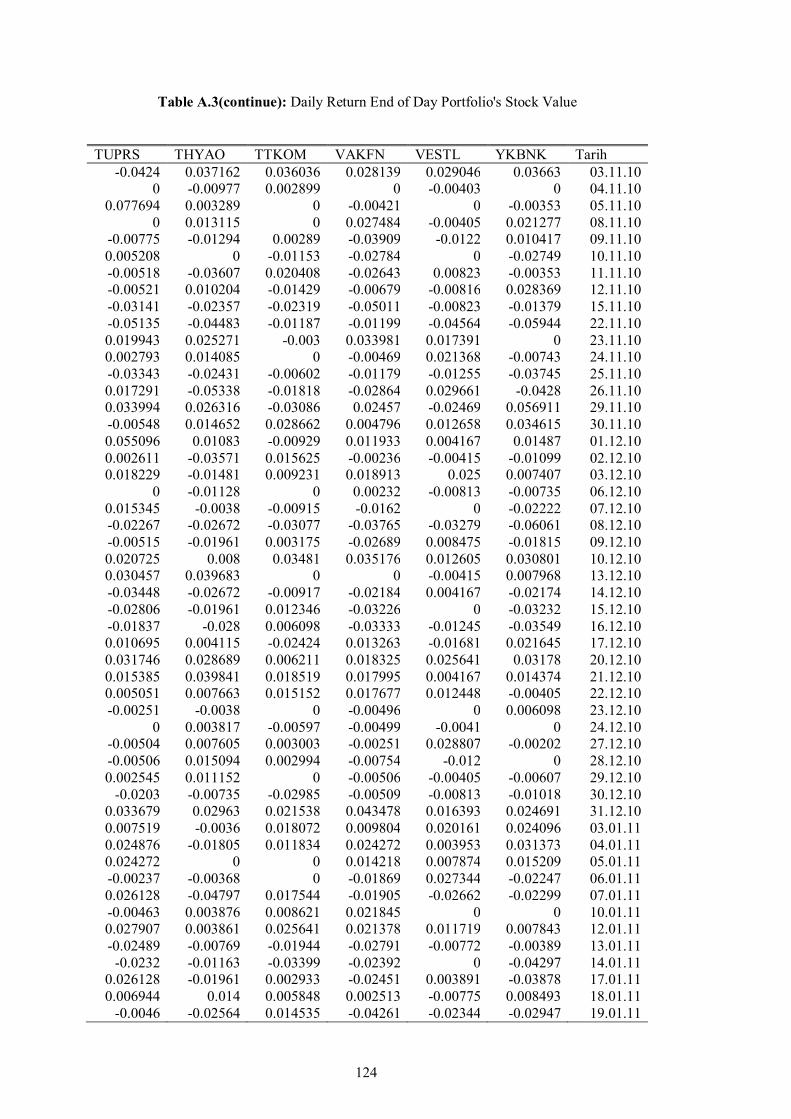
124
Table A.3(continue): Daily Return End of Day Portfolio's Stock Value TUPRS THYAO TTKOM VAKFN VESTL YKBNK Tarih
-0.0424 0.037162 0.036036 0.028139 0.029046 0.03663 03.11.10 0 -0.00977 0.002899 0 -0.00403 0 04.11.10
0.077694 0.003289 0 -0.00421 0 -0.00353 05.11.10 0 0.013115 0 0.027484 -0.00405 0.021277 08.11.10
-0.00775 -0.01294 0.00289 -0.03909 -0.0122 0.010417 09.11.10 0.005208 0 -0.01153 -0.02784 0 -0.02749 10.11.10 -0.00518 -0.03607 0.020408 -0.02643 0.00823 -0.00353 11.11.10 -0.00521 0.010204 -0.01429 -0.00679 -0.00816 0.028369 12.11.10 -0.03141 -0.02357 -0.02319 -0.05011 -0.00823 -0.01379 15.11.10 -0.05135 -0.04483 -0.01187 -0.01199 -0.04564 -0.05944 22.11.10 0.019943 0.025271 -0.003 0.033981 0.017391 0 23.11.10 0.002793 0.014085 0 -0.00469 0.021368 -0.00743 24.11.10 -0.03343 -0.02431 -0.00602 -0.01179 -0.01255 -0.03745 25.11.10 0.017291 -0.05338 -0.01818 -0.02864 0.029661 -0.0428 26.11.10 0.033994 0.026316 -0.03086 0.02457 -0.02469 0.056911 29.11.10 -0.00548 0.014652 0.028662 0.004796 0.012658 0.034615 30.11.10 0.055096 0.01083 -0.00929 0.011933 0.004167 0.01487 01.12.10 0.002611 -0.03571 0.015625 -0.00236 -0.00415 -0.01099 02.12.10 0.018229 -0.01481 0.009231 0.018913 0.025 0.007407 03.12.10
0 -0.01128 0 0.00232 -0.00813 -0.00735 06.12.10 0.015345 -0.0038 -0.00915 -0.0162 0 -0.02222 07.12.10 -0.02267 -0.02672 -0.03077 -0.03765 -0.03279 -0.06061 08.12.10 -0.00515 -0.01961 0.003175 -0.02689 0.008475 -0.01815 09.12.10 0.020725 0.008 0.03481 0.035176 0.012605 0.030801 10.12.10 0.030457 0.039683 0 0 -0.00415 0.007968 13.12.10 -0.03448 -0.02672 -0.00917 -0.02184 0.004167 -0.02174 14.12.10 -0.02806 -0.01961 0.012346 -0.03226 0 -0.03232 15.12.10 -0.01837 -0.028 0.006098 -0.03333 -0.01245 -0.03549 16.12.10 0.010695 0.004115 -0.02424 0.013263 -0.01681 0.021645 17.12.10 0.031746 0.028689 0.006211 0.018325 0.025641 0.03178 20.12.10 0.015385 0.039841 0.018519 0.017995 0.004167 0.014374 21.12.10 0.005051 0.007663 0.015152 0.017677 0.012448 -0.00405 22.12.10 -0.00251 -0.0038 0 -0.00496 0 0.006098 23.12.10
0 0.003817 -0.00597 -0.00499 -0.0041 0 24.12.10 -0.00504 0.007605 0.003003 -0.00251 0.028807 -0.00202 27.12.10 -0.00506 0.015094 0.002994 -0.00754 -0.012 0 28.12.10 0.002545 0.011152 0 -0.00506 -0.00405 -0.00607 29.12.10
-0.0203 -0.00735 -0.02985 -0.00509 -0.00813 -0.01018 30.12.10 0.033679 0.02963 0.021538 0.043478 0.016393 0.024691 31.12.10 0.007519 -0.0036 0.018072 0.009804 0.020161 0.024096 03.01.11 0.024876 -0.01805 0.011834 0.024272 0.003953 0.031373 04.01.11 0.024272 0 0 0.014218 0.007874 0.015209 05.01.11 -0.00237 -0.00368 0 -0.01869 0.027344 -0.02247 06.01.11 0.026128 -0.04797 0.017544 -0.01905 -0.02662 -0.02299 07.01.11 -0.00463 0.003876 0.008621 0.021845 0 0 10.01.11 0.027907 0.003861 0.025641 0.021378 0.011719 0.007843 12.01.11 -0.02489 -0.00769 -0.01944 -0.02791 -0.00772 -0.00389 13.01.11
-0.0232 -0.01163 -0.03399 -0.02392 0 -0.04297 14.01.11 0.026128 -0.01961 0.002933 -0.02451 0.003891 -0.03878 17.01.11 0.006944 0.014 0.005848 0.002513 -0.00775 0.008493 18.01.11
-0.0046 -0.02564 0.014535 -0.04261 -0.02344 -0.02947 19.01.11

125
Table A.3(continue): Daily Return End of Day Portfolio's Stock Value TUPRS THYAO TTKOM VAKFN VESTL YKBNK Tarih
-0.00924 0.008097 -0.0086 0.026178 0.008 0.030369 20.01.11 -0.01632 0.044177 -0.00867 -0.02296 -0.00397 -0.02316 21.01.11 0.007109 0.019231 0.002915 0.023499 0.007968 0.034483 25.01.11 -0.06918 -0.00377 -0.03488 -0.00765 -0.02372 -0.00833 26.01.11
-0.0048 -0.01894 0.03012 -0.00771 -0.03239 -0.02521 27.01.11 0.056642 0 -0.03801 0.023316 0.012552 0.064655 28.01.11 0.021635 0.019305 0.030395 0.037975 0.024793 0.017058 31.01.11 -0.00471 -0.01894 -0.00295 -0.01463 0.004032 0.006135 01.02.11 -0.02837 -0.02317 -0.00592 -0.0297 -0.02008 -0.02429 02.02.11 0.017032 0.011858 -0.0119 0.033163 0.004098 0.031447 03.02.11 -0.01435 0 0.006024 -0.00988 0.012245 -0.02033 04.02.11 0.01699 -0.00391 0.011976 0.004988 0.020161 0.014523 07.02.11
-0.00716 0.019608 0.026627 0 -0.01186 0.010225 08.02.11 -0.01683 -0.01154 -0.00865 -0.01737 0.008 -0.01619 09.02.11 -0.01467 0.023346 0.034884 0.010101 -0.01587 0.00823 10.02.11 -0.00993 -0.02281 0.019663 0 0 0.002041 11.02.11 -0.00501 -0.01556 0.008264 0.0075 -0.00403 0.00611 14.02.11 0.020151 0.003953 -0.00546 0.012407 0.012146 0.008097 15.02.11 -0.00494 -0.00394 -0.01923 0.007353 -0.008 0.002008 16.02.11 -0.00248 0 -0.01401 0.007299 0.012097 -0.01002 17.02.11 -0.00746 -0.03953 0.011364 -0.00483 -0.00398 -0.01012 18.02.11 0.010025 -0.03292 0.022472 -0.00485 -0.012 -0.00818 21.02.11 0.002481 -0.05532 -0.00549 -0.02927 -0.02834 -0.02887 22.02.11
0 -0.02477 -0.01657 -0.02764 -0.05417 -0.05096 23.02.11 -0.00743 0.064665 0 0.002584 0.022026 0 24.02.11 -0.00748 -0.0282 0 -0.00258 0.008621 -0.00224 25.02.11 -0.00503 -0.06027 0.005618 -0.06977 -0.03846 -0.07623 28.02.11 0.005051 -0.00238 -0.02514 -0.00278 -0.02222 0.007282 01.03.11 0.002513 0.061905 0 0.027855 0.031818 0.045783 02.03.11 -0.00501 -0.00673 -0.01719 0.01355 0 0.002304 03.03.11 -0.01008 -0.0158 -0.00292 -0.02406 -0.00441 -0.02069 04.03.11 0.007634 0.025229 0.008772 0.024658 0.017699 0.028169 07.03.11 0.015152 0.006711 -0.01739 0.032086 0.026087 0.027397 08.03.11
-0.0199 0 -0.0059 0.012953 -0.00847 0.013333 09.03.11 0.055838 0.02 0.020772 -0.00256 0 -0.00658 10.03.11
0.03125 0.017429 0.008721 0.015385 0.051282 0.013245 11.03.11 0.006993 -0.01285 -0.00576 -0.00505 -0.00813 0.008715 14.03.11 -0.03472 -0.03037 -0.01159 -0.00254 -0.02049 -0.01728 15.03.11
-0.0048 0.020134 0.017595 0.002545 0 0.017582 16.03.11 0.036145 0.006579 0.011527 0.002538 0.020921 -0.00216 17.03.11 0.039535 -0.00654 0.022792 0.007595 0.008197 -0.00216 18.03.11 -0.01119 0 0.019499 0.002513 0.02439 0.002169 21.03.11 -0.00226 -0.01096 -0.02459 -0.03258 0.039683 -0.03896 22.03.11 0.002268 -0.03548 0.033613 0.015544 -0.00763 0.009009 23.03.11 -0.01357 -0.02299 -0.00542 -0.01276 0.007692 0 24.03.11
0 0.004706 0.016349 -0.00775 -0.00382 -0.0067 25.03.11 -0.00229 -0.00703 0.010724 -0.01563 -0.01916 -0.00674 28.03.11 0.022989 0.021226 0.007958 0.015873 0.011719 0.013575 29.03.11 0.020225 -0.00693 0.021053 0.005208 0.023166 -0.01116 30.03.11 0.015419 0.013953 0.023196 0.020725 0.018868 0.022573 31.03.11 -0.02603 0.016055 0.017632 0.043147 0 0.04415 01.04.11
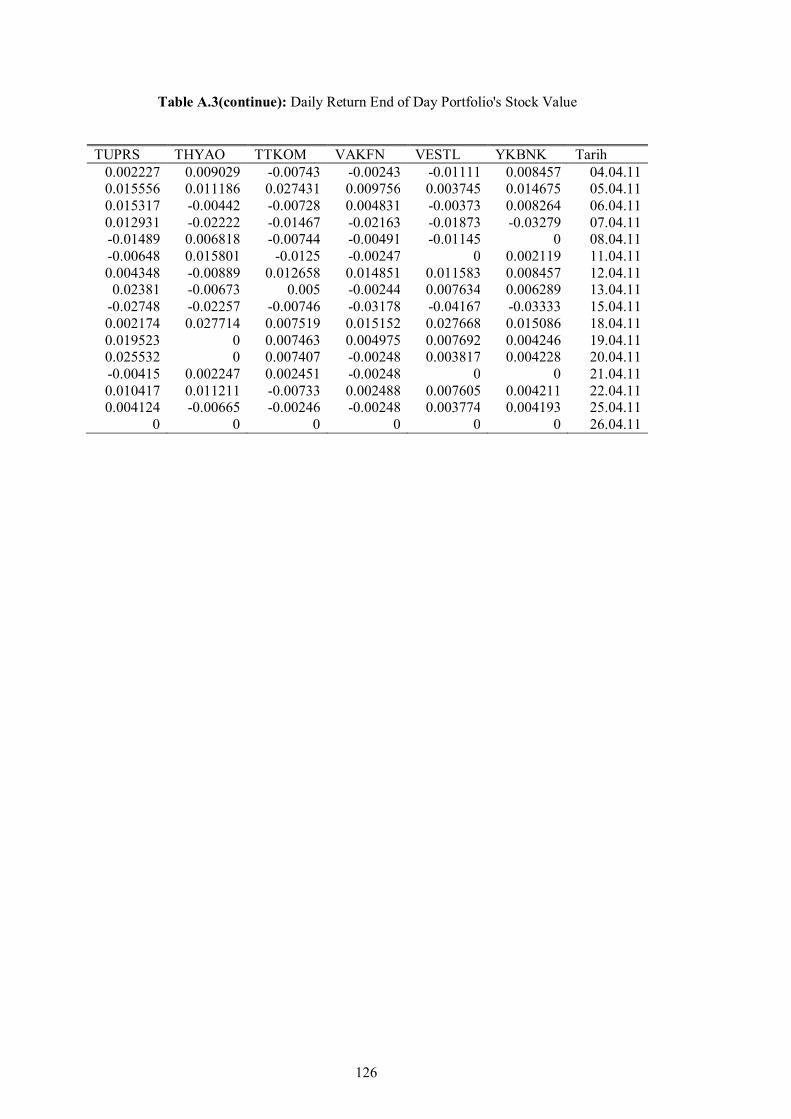
126
Table A.3(continue): Daily Return End of Day Portfolio's Stock Value TUPRS THYAO TTKOM VAKFN VESTL YKBNK Tarih
0.002227 0.009029 -0.00743 -0.00243 -0.01111 0.008457 04.04.11 0.015556 0.011186 0.027431 0.009756 0.003745 0.014675 05.04.11 0.015317 -0.00442 -0.00728 0.004831 -0.00373 0.008264 06.04.11 0.012931 -0.02222 -0.01467 -0.02163 -0.01873 -0.03279 07.04.11 -0.01489 0.006818 -0.00744 -0.00491 -0.01145 0 08.04.11 -0.00648 0.015801 -0.0125 -0.00247 0 0.002119 11.04.11 0.004348 -0.00889 0.012658 0.014851 0.011583 0.008457 12.04.11
0.02381 -0.00673 0.005 -0.00244 0.007634 0.006289 13.04.11 -0.02748 -0.02257 -0.00746 -0.03178 -0.04167 -0.03333 15.04.11 0.002174 0.027714 0.007519 0.015152 0.027668 0.015086 18.04.11 0.019523 0 0.007463 0.004975 0.007692 0.004246 19.04.11 0.025532 0 0.007407 -0.00248 0.003817 0.004228 20.04.11 -0.00415 0.002247 0.002451 -0.00248 0 0 21.04.11 0.010417 0.011211 -0.00733 0.002488 0.007605 0.004211 22.04.11 0.004124 -0.00665 -0.00246 -0.00248 0.003774 0.004193 25.04.11
0 0 0 0 0 0 26.04.11

127
Table A.3: Daily Return End of Day IMKB 100's Stock Value
ACIBD ADANA ADBGR ADNAC ADEL SASA Tarih -0,00797 0,01145 0,00310 0,00000 0,00748 0,00725 01.11.2010 0,00400 0,01158 0,01893 0,05556 0,03351 0,06154 02.11.2010 -0,00398 -0,04074 -0,03939 -0,06494 -0,06954 -0,06475 03.11.2010 -0,04198 -0,03571 -0,04899 -0,04938 -0,02570 0,00000 04.11.2010 -0,01132 -0,01408 -0,01420 -0,02410 -0,00926 -0,01418 05.11.2010 -0,00749 -0,02740 -0,00845 -0,01190 -0,00917 0,00714 08.11.2010 -0,00373 0,02098 0,00852 0,01205 -0,00457 0,02941 09.11.2010 -0,01471 -0,01718 -0,00283 0,01220 -0,00228 0,00741 10.11.2010 0,03030 -0,01356 -0,00282 -0,01205 0,01620 -0,04255 11.11.2010 -0,00377 0,08456 0,03812 0,01220 0,00000 0,11024 12.11.2010 -0,01119 -0,02158 -0,00292 0,00000 -0,03356 0,04098 15.11.2010 0,00752 0,01460 0,01183 0,00000 0,03712 0,03390 22.11.2010 -0,00375 -0,01083 0,00000 0,00000 -0,01373 0,00855 23.11.2010 -0,00743 0,00000 0,00297 0,01235 -0,00682 0,00862 24.11.2010 0,01509 0,01095 0,00298 0,01250 0,02564 0,00870 25.11.2010 0,00379 -0,01083 0,00000 0,00000 0,01179 0,01770 26.11.2010 -0,01124 -0,01071 0,00000 0,02564 0,02169 0,02727 29.11.2010 -0,01111 -0,01060 -0,01176 -0,03704 -0,02582 -0,04348 30.11.2010 0,00000 -0,00352 0,00890 -0,01220 0,00235 0,00000 01.12.2010 0,00372 -0,00351 0,00597 0,03797 0,01675 0,01770 02.12.2010 -0,02536 -0,00350 -0,00888 -0,01250 -0,00476 0,01802 03.12.2010 -0,01075 -0,01038 -0,03429 -0,03614 -0,04545 -0,05128 06.12.2010 0,03261 -0,00342 -0,00571 -0,01149 -0,01099 0,00000 07.12.2010 0,01845 0,00000 -0,00285 0,01163 0,00887 -0,02419 08.12.2010 -0,01455 0,00000 -0,00847 0,00000 -0,00221 0,01639 09.12.2010 0,02230 -0,01017 -0,00840 -0,01149 -0,01739 0,00826 10.12.2010 0,02281 0,00340 0,01133 0,01163 0,06729 0,00833 13.12.2010 -0,00383 -0,01356 -0,00567 -0,01149 -0,01157 -0,00806 14.12.2010 0,00000 0,02076 0,01437 0,00000 0,00465 0,04202 15.12.2010 0,00000 0,00000 0,00000 0,02353 -0,00232 0,08182 16.12.2010 -0,00382 0,01404 0,00870 0,01190 0,01651 -0,04348 17.12.2010 0,00769 0,00707 0,00000 -0,01176 -0,00469 -0,04167 20.12.2010 -0,01887 0,00355 0,00000 -0,01163 -0,00930 -0,01639 21.12.2010 -0,01119 -0,00704 -0,00289 0,00000 -0,00463 -0,00813 22.12.2010 0,05098 0,00353 0,00000 -0,01149 -0,00917 0,00000 23.12.2010 0,00791 -0,00352 0,00000 0,00000 0,04808 0,01653 24.12.2010 -0,00394 0,01068 0,00581 0,01163 0,01217 0,03419 27.12.2010 0,00395 0,00000 0,00880 0,02381 0,01985 0,04464 28.12.2010 -0,00784 0,00717 0,00000 0,00000 0,00750 0,00901 29.12.2010 0,02823 0,00360 0,00590 0,00000 0,00000 0,00000 30.12.2010 0,00000 0,00000 0,00000 0,00000 0,00000 0,00000 31.12.2010 -0,00800 -0,00714 0,00000 -0,02326 -0,00249 -0,02632 03.01.2011 0,00402 0,01449 0,00296 0,01176 -0,02433 0,00885 04.01.2011 -0,00797 -0,00361 -0,01170 0,01190 0,02494 0,05607 05.01.2011 -0,00397 0,00727 0,01183 0,03704 0,04427 0,03883 06.01.2011

128
Table A.3: Daily Return End of Day IMKB 100's Stock Value
ACIBD ADANA ADBGR ADNAC ADEL SASA Tarih 0,00800 0,00000 -0,00588 0,01250 0,01587 0,00980 07.01.2011 -0,00794 0,00733 0,00000 0,01266 -0,00264 -0,01923 10.01.2011 0,01613 0,00738 0,00592 0,02597 0,02156 0,00000 12.01.2011 -0,00402 -0,02166 0,00595 0,00000 -0,00802 0,01961 13.01.2011 -0,01190 0,00000 -0,00885 -0,02532 -0,01058 -0,03774 14.01.2011 -0,00787 -0,00717 0,00296 -0,01250 0,00800 0,00000 17.01.2011 -0,00392 0,00000 -0,00880 0,00000 -0,01055 -0,00935 18.01.2011 -0,00778 0,00722 0,00590 0,02564 0,00000 0,07000 19.01.2011 0,00784 -0,00717 0,01194 0,00000 0,00531 0,03093 20.01.2011 -0,01544 -0,00712 -0,00298 -0,01266 -0,01823 -0,01020 21.01.2011 0,00000 -0,00707 -0,01176 0,00000 -0,01031 0,03158 25.01.2011 0,00778 -0,00352 -0,01163 -0,01250 0,00000 0,10465 26.01.2011 0,00391 0,01068 0,01176 0,00000 0,00000 -0,01149 27.01.2011 0,00392 0,01812 0,01190 0,00000 0,01305 0,07407 28.01.2011 -0,01163 -0,01075 0,00299 0,00000 0,02681 -0,01220 31.01.2011 0,00781 0,00722 0,00904 -0,01235 0,01913 0,02500 01.02.2011 0,00787 0,01838 0,01220 0,02532 0,01385 0,00000 02.02.2011 0,00000 0,00000 0,00000 0,00000 0,00000 0,00000 03.02.2011 0,00794 0,00369 0,00613 0,02597 0,01404 0,03896 04.02.2011 0,00000 0,00000 0,00000 0,00000 0,00000 0,00000 07.02.2011 -0,01563 -0,01812 -0,01212 -0,04938 -0,02997 -0,02532 08.02.2011 -0,01916 -0,01429 -0,00901 -0,01220 -0,01609 -0,01250 09.02.2011 -0,00382 -0,00709 0,00000 0,02500 -0,00267 0,00000 10.02.2011 0,01946 0,01075 0,00604 0,01266 0,02186 0,01266 11.02.2011 -0,03383 0,00360 -0,00601 -0,04819 -0,05426 0,01282 14.02.2011 -0,01115 0,04511 0,01216 -0,02353 -0,03250 -0,03704 15.02.2011 -0,00738 0,03101 0,01231 0,03659 0,01266 0,01250 16.02.2011 0,02264 -0,01901 -0,01515 -0,02381 0,01023 0,00000 17.02.2011 -0,00376 0,00000 -0,00602 -0,02326 0,01823 -0,01235 18.02.2011 -0,01481 -0,02952 -0,04323 -0,07527 -0,00518 0,00000 21.02.2011 -0,00369 0,00743 0,03892 0,10714 -0,00771 0,00000 22.02.2011 0,00370 -0,00738 -0,01765 -0,01176 -0,01018 0,01250 23.02.2011 -0,00369 0,00000 -0,00293 -0,05556 -0,01008 -0,01235 24.02.2011 -0,00369 0,00000 -0,00293 -0,05556 -0,01008 -0,01235 25.02.2011 0,00370 -0,00738 -0,01765 -0,01176 -0,01018 0,01250 28.02.2011 -0,00369 0,00743 0,03892 0,10714 -0,00771 0,00000 01.03.2011 -0,01481 -0,02952 -0,04323 -0,07527 -0,00518 0,00000 02.03.2011 -0,00376 0,00000 -0,00602 -0,02326 0,01823 -0,01235 02.03.2011
0,02264 -0,01901 -0,01515 -0,02381 0,01023 0,00000 03.03.2011
0,01946 0,01075 0,00604 0,01266 0,02186 0,01266 04.03.2011
-0,00382 -0,00709 0,00000 0,02500 -0,00267 0,00000 07.03.2011
-0,01916 -0,01429 -0,00901 -0,01220 -0,01609 -0,01250 08.03.2011
-0,01563 -0,01812 -0,01212 -0,04938 -0,02997 -0,02532 09.03.2011
0,00000 0,00000 0,00000 0,00000 0,00000 0,00000 10.03.2011
0,00794 0,00369 0,00613 0,02597 0,01404 0,03896 11.03.2011

129
Table A.3: Daily Return End of Day IMKB 100's Stock Value
ACIBD ADANA ADBGR ADNAC ADEL SASA Tarih 0,00000 0,00000 0,00000 0,00000 0,00000 0,00000 14.03.2011 0,00787 0,01838 0,01220 0,02532 0,01385 0,00000 15.03.2011 0,00781 0,00722 0,00904 -0,01235 0,01913 0,02500 16.03.2011 -0,01163 -0,01075 0,00299 0,00000 0,02681 -0,01220 17.03.2011 0,00392 0,01812 0,01190 0,00000 0,01305 0,07407 18.03.2011 0,00391 0,01068 0,01176 0,00000 0,00000 -0,01149 21.03.2011 0,00778 -0,00352 -0,01163 -0,01250 0,00000 0,10465 22.03.2011 0,00000 -0,00707 -0,01176 0,00000 -0,01031 0,03158 23.03.2011 -0,01544 -0,00712 -0,00298 -0,01266 -0,01823 -0,01020 24.03.2011 -0,00778 0,00722 0,00590 0,02564 0,00000 0,07000 28.03.2011 -0,00392 0,00000 -0,00880 0,00000 -0,01055 -0,00935 29.03.2011 -0,00787 -0,00717 0,00296 -0,01250 0,00800 0,00000 30.03.2011 -0,01190 0,00000 -0,00885 -0,02532 -0,01058 -0,03774 31.03.2011 -0,00402 -0,02166 0,00595 0,00000 -0,00802 0,01961 04.04.2011 0,01613 0,00738 0,00592 0,02597 0,02156 0,00000 05.04.2011 -0,00794 0,00733 0,00000 0,01266 -0,00264 -0,01923 06.04.2011 0,00800 0,00000 -0,00588 0,01250 0,01587 0,00980 07.04.2011 -0,00397 0,00727 0,01183 0,03704 0,04427 0,03883 08.04.2011 -0,00797 -0,00361 -0,01170 0,01190 0,02494 0,05607 11.04.2011 0,00402 0,01449 0,00296 0,01176 -0,02433 0,00885 12.04.2011 -0,00800 -0,00714 0,00000 -0,02326 -0,00249 -0,02632 13.04.2011 0,00000 0,00000 0,00000 0,00000 0,00000 0,00000 14.04.2011 0,02823 0,00360 0,00590 0,00000 0,00000 0,00000 15.04.2011 -0,00784 0,00717 0,00000 0,00000 0,00750 0,00901 18.04.2011 0,00395 0,00000 0,00880 0,02381 0,01985 0,04464 19.04.2011 -0,00394 0,01068 0,00581 0,01163 0,01217 0,03419 20.04.2011 0,00791 -0,00352 0,00000 0,00000 0,04808 0,01653 21.04.2011 0,05098 0,00353 0,00000 -0,01149 -0,00917 0,00000 22.04.2011 -0,01119 -0,00704 -0,00289 0,00000 -0,00463 -0,00813 25.04.2011
Table A.3(continue): Daily Return End of Day IMKB 100's Stock Value
AFMAS AFYON AKENR AKYO AKALT AKBNK Tarih 0,03041 -0,01504 0,01786 -0,00610 0,00000 -0,00219 01.11.2010 0,04594 0,07838 -0,01060 0,00613 0,02963 0,00219 02.11.2010 -0,08117 -0,07731 -0,05980 -0,00610 -0,04930 0,03720 03.11.2010 -0,04050 -0,03140 -0,03834 -0,04094 -0,03401 -0,01055 04.11.2010 0,01262 -0,02358 -0,01262 0,00588 -0,02000 -0,00853 05.11.2010 -0,02761 -0,00469 -0,00938 -0,01734 -0,00662 0,00000 08.11.2010 -0,02102 -0,04270 0,03896 0,00581 0,00667 -0,00215 09.11.2010 -0,01770 0,07488 -0,01282 -0,01149 0,00671 -0,03233 10.11.2010 0,02108 0,00242 -0,03106 0,00578 -0,00667 -0,02227 11.11.2010 -0,04046 0,00000 0,00000 0,00000 -0,00662 0,00228 12.11.2010 -0,01983 -0,01667 -0,00617 -0,00575 -0,00658 -0,02273 15.11.2010 -0,00563 0,00719 0,01567 0,00000 0,00662 0,00698 22.11.2010 -0,01389 -0,01882 -0,00932 -0,01136 -0,00658 0,00000 23.11.2010

130
Table A.3(continue): Daily Return End of Day IMKB 100's Stock Value
AFMAS AFYON AKENR AKYO AKALT AKBNK Tarih -0,04509 -0,00235 0,00625 0,01734 0,00662 -0,01617 24.11.2010 0,02446 0,01914 0,00946 0,00000 0,02027 -0,01878 25.11.2010 0,04249 0,06633 -0,01246 -0,01705 -0,01333 -0,03828 26.11.2010 0,00000 0,01554 0,00943 0,00571 0,00000 0,05721 29.11.2010 -0,03815 -0,03741 -0,00625 -0,02778 -0,00662 -0,01176 30.11.2010 0,00000 -0,00496 -0,01235 0,01124 -0,00658 0,01429 01.12.2010 -0,02394 0,02806 0,04180 0,02299 0,02013 0,00000 02.12.2010 0,05618 -0,01754 -0,01893 -0,02793 -0,02614 0,00469 03.12.2010 0,01425 -0,06557 -0,03647 -0,01648 -0,01923 0,02103 06.12.2010 0,02755 0,00232 0,00000 -0,00535 -0,01887 0,01373 07.12.2010 0,03714 -0,00920 -0,02017 -0,02094 -0,00625 -0,04740 08.12.2010 -0,01685 0,02353 0,01166 0,01058 0,00000 -0,01422 09.12.2010 0,07879 -0,01620 -0,02557 -0,02073 0,01266 0,02404 10.12.2010 0,05769 -0,02703 -0,01401 -0,01026 -0,01250 -0,00469 13.12.2010 0,00332 -0,00659 -0,00551 -0,00508 0,03896 -0,03066 14.12.2010 -0,01311 -0,03397 -0,01359 0,00510 0,00654 -0,02190 15.12.2010 0,01329 0,04900 0,00546 0,00000 0,00000 -0,00498 16.12.2010 0,01347 0,13671 0,00274 0,00000 0,00658 0,00500 17.12.2010 -0,00669 0,00509 0,00000 0,00513 0,02013 0,02736 20.12.2010 -0,01967 -0,00758 -0,02145 -0,02010 0,00676 0,01453 21.12.2010 -0,01294 0,02591 -0,00533 0,00000 -0,01333 0,02148 22.12.2010 0,00000 0,00000 0,01351 0,00505 0,02041 0,00000 23.12.2010 0,02318 -0,03980 -0,00538 0,00508 0,00000 0,01168 24.12.2010 0,00667 -0,00248 0,01639 0,00510 -0,00676 0,00693 27.12.2010 -0,00332 0,04404 0,01385 0,00513 0,02069 0,00459 28.12.2010 0,00000 -0,01279 -0,00824 0,00000 0,00000 0,00685 29.12.2010 0,01007 0,04826 -0,00546 -0,01015 -0,01361 -0,02721 30.12.2010 0,00000 0,00000 0,00000 0,00000 0,00000 0,01166 31.12.2010 0,00337 -0,03618 0,00274 0,00510 0,02797 0,00691 03.01.2011 -0,01329 -0,03250 -0,00545 0,02083 0,00000 -0,01373 04.01.2011 -0,01311 0,10803 -0,00542 0,01053 0,00000 0,00232 05.01.2011 0,00993 0,00557 0,01096 -0,01042 0,01418 -0,01389 06.01.2011 0,02027 0,01700 0,00551 0,01053 0,00714 -0,02113 07.01.2011 0,00000 0,00000 -0,00275 0,00529 0,00719 0,00959 10.01.2011 0,00339 0,01437 0,02825 -0,01047 0,02206 0,02613 12.01.2011 -0,03909 -0,01136 -0,00282 0,00000 0,00000 -0,02083 13.01.2011 -0,00325 -0,00845 -0,01934 0,00000 -0,01449 -0,01418 14.01.2011 -0,01597 -0,03005 -0,01362 -0,01546 -0,01429 -0,01199 17.01.2011 0,00321 0,00549 -0,00272 -0,00513 -0,01408 -0,01214 18.01.2011 0,00645 0,02247 -0,00271 0,00515 0,00000 -0,03440 19.01.2011 0,00977 0,02006 0,01653 0,07182 -0,00699 0,02545 20.01.2011 0,00000 0,00000 -0,01090 -0,02162 -0,01379 -0,04715 21.01.2011 -0,04658 -0,02514 -0,01872 -0,02632 -0,00685 0,02083 25.01.2011 0,04207 0,00000 0,01630 -0,02062 0,00690 -0,02296 26.01.2011 0,02318 0,00562 0,00000 0,04865 0,01399 -0,02350 27.01.2011

131
Table A.3(continue): Daily Return End of Day IMKB 100's Stock Value
AFMAS AFYON AKENR AKYO AKALT AKBNK Tarih 0,01684 0,00850 0,00822 0,01093 0,00000 0,00535 28.01.2011 0,03846 0,00857 0,00275 -0,01613 0,00704 0,03457 31.01.2011 0,00351 -0,03581 0,00275 0,01087 0,01429 0,02314 01.02.2011 0,01064 0,08683 0,00833 0,02793 0,00000 -0,04020 02.02.2011 0,00000 0,00000 0,00000 0,00000 0,00000 0,03665 03.02.2011 0,00714 0,01212 0,00559 0,00000 0,01449 -0,00505 04.02.2011 0,00000 0,00000 0,00000 0,00000 0,00000 0,00761 07.02.2011 -0,01408 -0,02077 -0,00556 -0,02717 -0,02128 0,00252 08.02.2011 0,01068 -0,01749 -0,00277 0,01099 0,00000 -0,01256 09.02.2011 -0,01748 0,00882 -0,00824 0,01111 0,00000 -0,00254 10.02.2011 0,00704 -0,00585 0,00831 -0,01099 0,01439 -0,01020 11.02.2011 -0,06579 -0,03933 -0,05497 -0,02674 -0,04138 0,01031 14.02.2011 -0,02564 -0,01385 -0,00779 -0,01579 -0,02685 0,00510 15.02.2011 -0,00319 0,00000 0,00522 -0,00524 0,00000 0,03299 16.02.2011 0,00321 -0,00276 -0,00777 -0,01036 -0,01325 -0,01229 17.02.2011 0,00322 -0,00822 -0,01026 -0,00515 -0,01307 -0,00498 18.02.2011 -0,01270 -0,01351 -0,01515 0,00000 -0,00649 -0,00750 21.02.2011 -0,03670 -0,00270 -0,00252 0,00000 0,00654 -0,02267 22.02.2011 0,05145 -0,00536 0,00253 -0,01523 -0,03165 -0,02320 23.02.2011 -0,00321 -0,01583 0,00000 -0,01005 -0,03067 0,00264 24.02.2011 -0,00321 -0,01583 0,00000 -0,01005 -0,03067 -0,01579 25.02.2011 0,05145 -0,00536 0,00253 -0,01523 -0,03165 -0,06417 28.02.2011 -0,03670 -0,00270 -0,00252 0,00000 0,00654 -0,02000 01.03.2011 -0,01270 -0,01351 -0,01515 0,00000 -0,00649 0,02624 02.03.2011 0,00322 -0,00822 -0,01026 -0,00515 -0,01307 0,00852 02.03.2011 0,00321 -0,00276 -0,00777 -0,01036 -0,01325 -0,01972 03.03.2011 -0,00319 0,00000 0,00522 -0,00524 0,00000 0,02011 04.03.2011 -0,02564 -0,01385 -0,00779 -0,01579 -0,02685 0,04507 07.03.2011 -0,06579 -0,03933 -0,05497 -0,02674 -0,04138 0,04313 08.03.2011 0,00704 -0,00585 0,00831 -0,01099 0,01439 0,04313 09.03.2011 -0,01748 0,00882 -0,00824 0,01111 0,00000 0,01292 10.03.2011 0,01068 -0,01749 -0,00277 0,01099 0,00000 -0,00765 11.03.2011
-0,01408 -0,02077 -0,00556 -0,02717 -0,02128 0,00257 14.03.2011
0,00000 0,00000 0,00000 0,00000 0,00000 -0,03077 15.03.2011
0,00714 0,01212 0,00559 0,00000 0,01449 -0,00794 16.03.2011
0,00000 0,00000 0,00000 0,00000 0,00000 0,01067 17.03.2011
0,01064 0,08683 0,00833 0,02793 0,00000 0,00264 18.03.2011
0,00351 -0,03581 0,00275 0,01087 0,01429 0,02368 21.03.2011
0,03846 0,00857 0,00275 -0,01613 0,00704 -0,05141 22.03.2011
0,01684 0,00850 0,00822 0,01093 0,00000 0,02710 23.03.2011
0,02318 0,00562 0,00000 0,04865 0,01399 -0,01319 24.03.2011
0,04207 0,00000 0,01630 -0,02062 0,00690 0,00535 25.03.2011
-0,04658 -0,02514 -0,01872 -0,02632 -0,00685 -0,01064 28.03.2011
0,00000 0,00000 -0,01090 -0,02162 -0,01379 0,02688 29.03.2011
0,00977 0,02006 0,01653 0,07182 -0,00699 -0,01832 30.03.2011

132
Table A.3(continue): Daily Return End of Day IMKB 100's Stock Value
AFMAS AFYON AKENR AKYO AKALT AKBNK Tarih 0,00645 0,02247 -0,00271 0,00515 0,00000 0,03200 31.03.2011 0,00321 0,00549 -0,00272 -0,00513 -0,01408 0,04910 04.04.2011 -0,01597 -0,03005 -0,01362 -0,01546 -0,01429 0,00493 05.04.2011 -0,00325 -0,00845 -0,01934 0,00000 -0,01449 0,03186 06.04.2011 -0,03909 -0,01136 -0,00282 0,00000 0,00000 0,02613 07.04.2011 0,00339 0,01437 0,02825 -0,01047 0,02206 -0,03241 08.04.2011 0,00000 0,00000 -0,00275 0,00529 0,00719 0,00000 11.04.2011 0,02027 0,01700 0,00551 0,01053 0,00714 0,00478 12.04.2011 0,00993 0,00557 0,01096 -0,01042 0,01418 -0,00476 13.04.2011 -0,01311 0,10803 -0,00542 0,01053 0,00000 0,00000 14.04.2011 -0,01329 -0,03250 -0,00545 0,02083 0,00000 -0,03589 15.04.2011 0,00337 -0,03618 0,00274 0,00510 0,02797 0,01241 18.04.2011 0,00000 0,00000 0,00000 0,00000 0,00000 -0,00490 19.04.2011 0,01007 0,04826 -0,00546 -0,01015 -0,01361 -0,00246 20.04.2011 0,00000 -0,01279 -0,00824 0,00000 0,00000 -0,00494 21.04.2011 -0,00332 0,04404 0,01385 0,00513 0,02069 0,00496 22.04.2011 0,00667 -0,00248 0,01639 0,00510 -0,00676 -0,00741 25.04.2011
Table A.3(continue): Daily Return End of Day IMKB 100's Stock Value AKCNS AKFEN ATEKS AKMGY AKSA AKSEN Tarih -0,00292 -0,01914 0,00590 0,02239 -0,00811 0,01518 01.11.2010 0,03003 0,00000 0,01802 0,01515 0,00543 0,04063 02.11.2010 -0,02915 -0,04128 -0,05666 -0,01493 -0,04663 -0,04113 03.11.2010 -0,03380 -0,00909 -0,01671 -0,03943 -0,02525 -0,01911 04.11.2010 -0,01389 0,00457 -0,01644 0,00360 0,01020 -0,03285 05.11.2010 -0,00826 -0,04783 -0,02145 -0,01418 -0,04623 -0,01616 08.11.2010 0,00554 0,00877 0,01359 -0,00704 0,05656 -0,00202 09.11.2010 -0,00551 -0,01299 -0,04167 -0,01389 -0,01519 -0,00800 10.11.2010 -0,01892 0,01316 -0,02290 0,06273 0,02332 -0,00398 11.11.2010 0,00271 -0,01299 -0,02723 -0,01812 0,03485 -0,00397 12.11.2010 -0,01337 0,00000 0,01253 0,00364 -0,00533 -0,00787 15.11.2010 0,00000 0,00000 0,02308 -0,00722 0,00806 0,00000 22.11.2010 0,00000 -0,00858 0,02094 -0,03484 -0,01847 -0,01167 23.11.2010 -0,00532 -0,01271 0,00792 -0,00347 0,01882 0,00784 24.11.2010 0,00535 -0,02075 0,01882 -0,00690 0,01087 0,00394 25.11.2010 -0,01579 -0,02429 0,00000 -0,02027 0,00272 -0,00392 26.11.2010 0,00796 0,00407 0,01087 -0,02310 -0,00811 0,00000 29.11.2010 0,01344 0,00000 0,00546 -0,03195 -0,02116 -0,00778 30.11.2010 -0,00268 -0,00806 0,02235 -0,01572 -0,00787 -0,00772 01.12.2010 0,00539 -0,00402 0,02286 0,03583 0,00528 0,03600 02.12.2010 -0,00536 0,00403 0,00865 -0,01603 0,01609 -0,00398 03.12.2010 -0,03117 -0,01195 -0,02528 -0,04878 -0,04604 -0,00791 06.12.2010 0,00510 0,02439 0,01705 0,00300 0,00521 0,00000 07.12.2010 -0,00254 0,00408 0,00860 -0,00597 0,01319 -0,00395 08.12.2010 -0,00758 0,00410 -0,00852 0,01824 0,00531 0,00000 09.12.2010 -0,02941 -0,00813 -0,01676 -0,03801 -0,00789 -0,00784 10.12.2010

133
Table A.3(continue): Daily Return End of Day IMKB 100's Stock Value AKCNS AKFEN ATEKS AKMGY AKSA AKSEN Tarih -0,00244 -0,00405 0,00000 -0,05000 -0,02062 0,00394 13.12.2010 0,00730 -0,00403 -0,02710 -0,00920 0,00779 -0,01938 14.12.2010 -0,01439 0,01224 0,00272 -0,00306 0,00260 -0,01149 15.12.2010 0,04511 -0,00407 0,02507 0,00000 -0,00518 -0,00760 16.12.2010 0,00758 -0,00806 -0,01102 -0,00608 0,03485 0,00382 17.12.2010 -0,00252 0,00000 -0,02419 0,00000 -0,00533 -0,00758 20.12.2010 -0,00501 -0,00402 -0,01064 -0,00604 -0,01316 0,01149 21.12.2010 0,01786 -0,00400 -0,01053 0,00303 -0,03553 -0,00760 22.12.2010 0,01031 0,00806 0,01604 0,01852 -0,00253 0,01154 23.12.2010 -0,00513 0,00000 0,00268 -0,02115 -0,00253 -0,00383 24.12.2010 0,02094 0,00000 -0,00267 0,00915 -0,00252 0,00000 27.12.2010 0,01326 -0,00800 -0,06500 -0,00606 0,07008 0,03162 28.12.2010 -0,00265 0,00806 0,00000 0,01852 0,00542 0,00000 29.12.2010 0,00532 -0,00402 0,03093 -0,04142 -0,02381 0,00000 30.12.2010 0,00000 0,00000 0,00000 0,00000 0,00000 0,00000 31.12.2010 0,00267 0,00403 -0,03242 0,04644 0,01887 0,00397 03.01.2011 -0,00266 -0,00402 0,10468 -0,01824 0,00270 -0,00395 04.01.2011 -0,00265 0,00000 -0,03968 -0,00303 0,06628 -0,01172 05.01.2011 0,00266 0,00000 0,14894 -0,02367 -0,01700 0,00392 06.01.2011 0,00267 0,00000 -0,00303 -0,04789 0,09627 0,00000 07.01.2011 -0,00531 0,00810 -0,02941 0,03198 0,01577 -0,00391 10.01.2011 0,01344 0,01230 -0,00875 -0,07527 0,02589 0,01587 12.01.2011 -0,02105 -0,00813 0,03939 0,10059 0,03000 0,00800 13.01.2011 -0,00262 0,00820 0,02484 0,14576 0,00334 -0,01186 14.01.2011 -0,00781 -0,00813 0,11419 0,01375 -0,00993 -0,01938 17.01.2011 0,00261 -0,01205 -0,01027 0,08989 -0,00658 -0,01901 18.01.2011 0,02957 -0,00400 0,03915 -0,05986 0,00662 0,02335 19.01.2011 0,00541 0,02041 0,01079 0,02899 0,02373 0,01581 20.01.2011 -0,00538 -0,01210 -0,01767 -0,01075 -0,00338 -0,00784 21.01.2011 -0,00535 -0,01976 -0,00352 0,17227 -0,02951 -0,00778 25.01.2011 -0,00796 0,01200 0,00353 0,11215 0,00000 0,01984 26.01.2011 -0,00265 0,00000 -0,00702 0,01422 -0,01294 0,00599 27.01.2011 0,01887 0,00806 0,00707 0,00476 0,02318 0,00602 28.01.2011 0,01923 -0,00402 0,00712 -0,00474 0,01342 -0,00797 31.01.2011 -0,00274 0,00403 0,00357 0,00957 0,02759 -0,00397 01.02.2011 0,02528 0,00813 0,01818 -0,00286 0,02113 0,00599 02.02.2011 0,00000 0,00000 0,00000 0,00000 0,00000 0,00000 03.02.2011 0,01425 0,00820 -0,00362 0,09853 0,00353 0,01417 04.02.2011 0,00000 0,00000 0,00000 0,00000 0,00000 0,00000 07.02.2011 -0,02228 -0,02008 -0,00719 0,03247 -0,01736 -0,02372 08.02.2011 -0,01374 -0,00797 -0,01068 -0,01282 -0,02041 -0,01556 09.02.2011 0,01961 0,00000 0,00357 0,03769 0,01379 0,01381 10.02.2011 0,00281 -0,01953 0,00719 0,02268 0,01754 0,00996 11.02.2011 -0,04558 -0,00775 -0,01767 -0,03289 -0,02730 -0,01953 14.02.2011 -0,00533 -0,01149 0,00355 -0,01085 -0,01347 -0,03759 15.02.2011 0,00536 0,00385 -0,00353 -0,00647 -0,01329 -0,00746 16.02.2011 0,00000 0,00000 -0,02414 0,00651 -0,05047 0,00000 17.02.2011 0,00539 -0,00763 0,00694 -0,00216 -0,02160 0,01515 18.02.2011 -0,02368 -0,00758 -0,02041 -0,02119 0,00310 -0,01493 21.02.2011
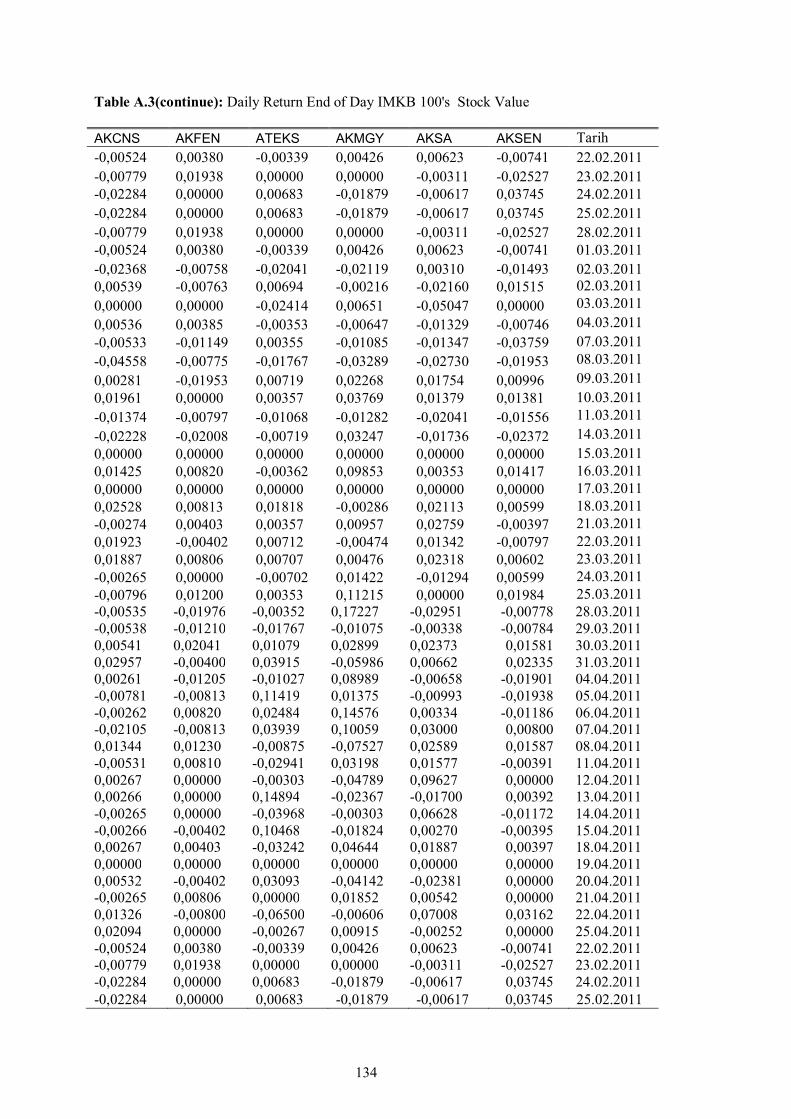
134
Table A.3(continue): Daily Return End of Day IMKB 100's Stock Value AKCNS AKFEN ATEKS AKMGY AKSA AKSEN Tarih -0,00524 0,00380 -0,00339 0,00426 0,00623 -0,00741 22.02.2011 -0,00779 0,01938 0,00000 0,00000 -0,00311 -0,02527 23.02.2011 -0,02284 0,00000 0,00683 -0,01879 -0,00617 0,03745 24.02.2011 -0,02284 0,00000 0,00683 -0,01879 -0,00617 0,03745 25.02.2011 -0,00779 0,01938 0,00000 0,00000 -0,00311 -0,02527 28.02.2011 -0,00524 0,00380 -0,00339 0,00426 0,00623 -0,00741 01.03.2011 -0,02368 -0,00758 -0,02041 -0,02119 0,00310 -0,01493 02.03.2011 0,00539 -0,00763 0,00694 -0,00216 -0,02160 0,01515 02.03.2011 0,00000 0,00000 -0,02414 0,00651 -0,05047 0,00000 03.03.2011 0,00536 0,00385 -0,00353 -0,00647 -0,01329 -0,00746 04.03.2011 -0,00533 -0,01149 0,00355 -0,01085 -0,01347 -0,03759 07.03.2011 -0,04558 -0,00775 -0,01767 -0,03289 -0,02730 -0,01953 08.03.2011 0,00281 -0,01953 0,00719 0,02268 0,01754 0,00996 09.03.2011 0,01961 0,00000 0,00357 0,03769 0,01379 0,01381 10.03.2011 -0,01374 -0,00797 -0,01068 -0,01282 -0,02041 -0,01556 11.03.2011 -0,02228 -0,02008 -0,00719 0,03247 -0,01736 -0,02372 14.03.2011 0,00000 0,00000 0,00000 0,00000 0,00000 0,00000 15.03.2011 0,01425 0,00820 -0,00362 0,09853 0,00353 0,01417 16.03.2011 0,00000 0,00000 0,00000 0,00000 0,00000 0,00000 17.03.2011 0,02528 0,00813 0,01818 -0,00286 0,02113 0,00599 18.03.2011 -0,00274 0,00403 0,00357 0,00957 0,02759 -0,00397 21.03.2011 0,01923 -0,00402 0,00712 -0,00474 0,01342 -0,00797 22.03.2011 0,01887 0,00806 0,00707 0,00476 0,02318 0,00602 23.03.2011 -0,00265 0,00000 -0,00702 0,01422 -0,01294 0,00599 24.03.2011 -0,00796 0,01200 0,00353 0,11215 0,00000 0,01984 25.03.2011 -0,00535 -0,01976 -0,00352 0,17227 -0,02951 -0,00778 28.03.2011 -0,00538 -0,01210 -0,01767 -0,01075 -0,00338 -0,00784 29.03.2011 0,00541 0,02041 0,01079 0,02899 0,02373 0,01581 30.03.2011 0,02957 -0,00400 0,03915 -0,05986 0,00662 0,02335 31.03.2011 0,00261 -0,01205 -0,01027 0,08989 -0,00658 -0,01901 04.04.2011 -0,00781 -0,00813 0,11419 0,01375 -0,00993 -0,01938 05.04.2011 -0,00262 0,00820 0,02484 0,14576 0,00334 -0,01186 06.04.2011 -0,02105 -0,00813 0,03939 0,10059 0,03000 0,00800 07.04.2011 0,01344 0,01230 -0,00875 -0,07527 0,02589 0,01587 08.04.2011 -0,00531 0,00810 -0,02941 0,03198 0,01577 -0,00391 11.04.2011 0,00267 0,00000 -0,00303 -0,04789 0,09627 0,00000 12.04.2011 0,00266 0,00000 0,14894 -0,02367 -0,01700 0,00392 13.04.2011 -0,00265 0,00000 -0,03968 -0,00303 0,06628 -0,01172 14.04.2011 -0,00266 -0,00402 0,10468 -0,01824 0,00270 -0,00395 15.04.2011 0,00267 0,00403 -0,03242 0,04644 0,01887 0,00397 18.04.2011 0,00000 0,00000 0,00000 0,00000 0,00000 0,00000 19.04.2011 0,00532 -0,00402 0,03093 -0,04142 -0,02381 0,00000 20.04.2011 -0,00265 0,00806 0,00000 0,01852 0,00542 0,00000 21.04.2011 0,01326 -0,00800 -0,06500 -0,00606 0,07008 0,03162 22.04.2011 0,02094 0,00000 -0,00267 0,00915 -0,00252 0,00000 25.04.2011 -0,00524 0,00380 -0,00339 0,00426 0,00623 -0,00741 22.02.2011 -0,00779 0,01938 0,00000 0,00000 -0,00311 -0,02527 23.02.2011 -0,02284 0,00000 0,00683 -0,01879 -0,00617 0,03745 24.02.2011 -0,02284 0,00000 0,00683 -0,01879 -0,00617 0,03745 25.02.2011

135
Table A.3(continue): Daily Return End of Day IMKB 100's Stock Value AKGRT AKSUE TUPRS ALCAR ALGYO ALARK Tarih -0,00521 -0,02170 -0,02078 0,05249 0,01187 0,00926 01.11.2010 0,02128 0,01603 -0,00531 0,03815 0,05313 0,01887 02.11.2010 -0,08738 -0,03668 -0,04240 -0,09158 -0,07781 -0,04505 03.11.2010 -0,03286 -0,00385 0,00000 -0,07126 -0,05707 -0,02632 04.11.2010 -0,04054 -0,01515 0,07769 -0,00911 -0,01075 -0,00292 05.11.2010 -0,04721 -0,00752 0,00000 -0,00903 0,05682 -0,01153 08.11.2010 -0,02101 -0,01115 -0,00775 0,00000 0,02624 0,00000 09.11.2010 -0,00418 0,00373 -0,00518 -0,00449 -0,00580 0,00000 10.11.2010 0,01271 0,00752 -0,00521 0,01367 0,00583 0,00580 11.11.2010 0,01288 -0,01481 -0,03141 -0,00679 -0,00867 -0,00576 12.11.2010 -0,02917 -0,00735 -0,05135 0,00227 -0,00575 -0,01140 15.11.2010 0,03448 0,00369 0,01994 0,00915 0,01163 0,01445 22.11.2010 0,00870 -0,00733 0,00279 0,00691 -0,00290 -0,01143 23.11.2010 0,00000 -0,00727 -0,03343 -0,01810 0,00291 0,00287 24.11.2010 -0,03361 0,00000 0,01729 0,02791 0,00880 0,00287 25.11.2010 0,07207 0,02996 0,03399 0,01896 -0,00292 -0,00571 26.11.2010 0,00909 0,01136 -0,00548 0,00716 0,00293 0,00865 29.11.2010 -0,03084 -0,00377 0,05510 -0,01643 -0,02571 -0,01977 30.11.2010 -0,02155 -0,00749 0,00261 0,00948 0,00287 0,00568 01.12.2010 0,04505 -0,00743 0,01823 0,03686 0,01749 0,00860 02.12.2010 0,01370 -0,02536 0,00000 0,00494 -0,02557 -0,01133 03.12.2010 -0,03097 0,02985 0,01535 -0,03341 -0,06133 -0,02755 06.12.2010 0,00901 0,02692 -0,00515 0,01923 0,05962 0,00546 07.12.2010 0,02304 -0,02256 0,02073 0,09474 0,00820 0,00549 08.12.2010 0,02358 0,00377 0,03046 0,00000 0,02235 0,01393 09.12.2010 -0,01852 -0,01487 -0,03448 -0,00783 -0,01377 -0,02446 10.12.2010 -0,02262 0,00000 -0,02806 -0,00777 -0,00548 -0,00271 13.12.2010 -0,01316 -0,01087 0,01070 -0,00270 0,05691 0,01374 14.12.2010 0,00000 0,06154 0,03175 -0,01070 0,01653 0,01111 15.12.2010 0,02242 0,00775 0,01539 0,00000 0,00833 0,00559 16.12.2010 0,03241 0,02789 0,00505 0,00000 0,00279 0,02286 17.12.2010 -0,00917 -0,00791 -0,00251 0,00538 -0,00829 -0,00285 20.12.2010 -0,08017 -0,00784 0 -0,00535 0,00836 -0,00567 21.12.2010 -0,00837 -0,01544 -0.00504 -0,00267 0,01127 -0,00282 22.12.2010 0,00844 0,01969 -0.00506 -0,01055 -0,02740 0,00855 23.12.2010 -0,00420 0,00395 0.002545 0,01882 0,06725 0,02632 24.12.2010 0,01709 0,01606 -0.0203 0,00541 0,01484 -0,00581 27.12.2010 0,02183 0,01220 0.033679 -0,00270 0,01506 0,03303 28.12.2010 -0,01717 -0,00606 0.007519 0,00000 0,00000 -0,00597 29.12.2010 -0,03320 0,00610 0.024876 0,00542 0,00302 0,00904 30.12.2010 0,00000 0,00000 0.024272 0,00000 0,00000 0,00000 31.12.2010 0,02119 -0,00405 -0.00237 -0,00270 0,00000 -0,00300 03.01.2011 0,00855 -0,01594 0.026128 0,00271 0,00303 -0,01187 04.01.2011 -0,00847 -0,01181 -0.00463 -0,00270 -0,00302 -0,02035 05.01.2011 0,02165 -0,00392 0.027907 -0,00538 -0,01194 -0,01714 06.01.2011

136
Table A.3(continue): Daily Return End of Day IMKB 100's Stock Value AKGRT AKSUE TUPRS ALCAR ALGYO ALARK Tarih 0,00873 0,04508 -0.02489 0,01639 0,02761 0,00000 07.01.2011 0,02691 -0,00611 -0.0232 0,01385 0,00929 -0,01685 10.01.2011 0,01364 0,02720 0.026128 0,02266 0,00311 0,02299 12.01.2011 0,00000 -0,00417 0.006944 -0,01944 0,00312 0,06748 13.01.2011 -0,01345 -0,01437 -0.0046 -0,02703 -0,00311 0,00929 14.01.2011 -0,00446 -0,00815 -0.00924 0,00271 -0,00923 0,00000 17.01.2011 -0,01322 -0,00203 -0.01632 -0,01072 0,00619 -0,01524 18.01.2011 -0,00439 0,00408 0.007109 0,02473 0,01572 0,02500 19.01.2011 0,01786 0,01031 -0.06918 0,03116 0,03247 0,01911 20.01.2011 0,02752 -0,01822 -0.0048 0,02023 -0,00324 -0,00633 21.01.2011 -0,02679 -0,00403 0.056642 -0,01983 -0,00323 -0,01250 25.01.2011 -0,03030 -0,00800 0.021635 0,00857 -0,00641 0,00000 26.01.2011 0,03125 0,00604 -0.00471 0,00865 0,02632 -0,00312 27.01.2011 0,02752 0,00811 -0.02837 0,00289 0,00330 -0,00311 28.01.2011 0,00461 -0,00805 0.017032 -0,00288 -0,00980 -0,00617 31.01.2011 -0,00459 0,00607 -0.01435 0,02059 0,00990 0,00935 01.02.2011 0,02830 0,00203 0.01699 0,00592 0,01338 0,01582 02.02.2011 0,00000 0,00000 -0.00716 0,00000 0,00000 0,00000 03.02.2011 0,03415 0,01232 -0.01683 0,00297 0,01356 -0,00629 04.02.2011 0,00000 0,00000 -0.01467 0,00000 0,00000 0,00000 07.02.2011 -0,02381 -0,01016 -0.00993 -0,01462 -0,02640 -0,00935 08.02.2011 -0,00943 0,00000 -0.00501 -0,01441 -0,01942 0,01262 09.02.2011 0,01923 0,02287 0.020151 0,01760 -0,00643 -0,00938 10.02.2011 -0,00478 -0,01837 -0.00494 0,00888 0,00323 0,00000 11.02.2011 -0,03241 -0,00810 -0.00248 -0,03977 -0,04025 -0,02736 14.02.2011 -0,02703 -0,01200 -0.00746 -0,00283 -0,01223 -0,02663 15.02.2011 0,00000 -0,00398 0.010025 0,00284 0,00000 0,00297 16.02.2011 -0,02632 -0,00791 0.002481 -0,01124 0,00000 -0,00882 17.02.2011 0,01786 -0,02317 0 0,02006 -0,00305 -0,00293 18.02.2011 -0,01322 0,00778 -0.00743 -0,01966 -0,00304 -0,00583 21.02.2011 0,01339 -0,01154 -0.00748 0,01136 0,00612 0,01180 22.02.2011 -0,01322 -0,00763 -0.00503 -0,00565 0,00307 0,00296 23.02.2011 -0,00439 0,00769 0.005051 -0,00282 -0,01212 -0,01458 24.02.2011 -0,00439 0,00769 0.002513 -0,00282 -0,01212 -0,01458 25.02.2011 -0,01322 -0,00763 -0.00501 -0,00565 0,00307 0,00296 28.02.2011 0,01339 -0,01154 -0.01008 0,01136 0,00612 0,01180 01.03.2011 -0,01322 0,00778 0.007634 -0,01966 -0,00304 -0,00583 02.03.2011 0,01786 -0,02317 0.015152 0,02006 -0,00305 -0,00293 02.03.2011 -0,02632 -0,00791 -0.0199 -0,01124 0,00000 -0,00882 03.03.2011 0,00000 -0,00398 0.055838 0,00284 0,00000 0,00297 04.03.2011 -0,02703 -0,01200 0.03125 -0,00283 -0,01223 -0,02663 07.03.2011 -0,03241 -0,00810 -0.03472 -0,03977 -0,04025 -0,02736 08.03.2011 -0,00478 -0,01837 -0.0048 0,00888 0,00323 0,00000 09.03.2011 0,01923 0,02287 0.036145 0,01760 -0,00643 -0,00938 10.03.2011 -0,00943 0,00000 -0.03472 -0,01441 -0,01942 0,01262 11.03.2011

137
Table A.3(continue): Daily Return End of Day IMKB 100's Stock Value AKGRT AKSUE TUPRS ALCAR ALGYO ALARK Tarih -0,02381 -0,01016 -0.0048 -0,01462 -0,02640 -0,00935 14.03.2011 0,00000 0,00000 0.036145 0,00000 0,00000 0,00000 15.03.2011 0,03415 0,01232 0.039535 0,00297 0,01356 -0,00629 16.03.2011 0,00000 0,00000 -0.01119 0,00000 0,00000 0,00000 17.03.2011 0,02830 0,00203 -0.00226 0,00592 0,01338 0,01582 18.03.2011 -0,00459 0,00607 0.002268 0,02059 0,00990 0,00935 21.03.2011 0,00461 -0,00805 -0.01357 -0,00288 -0,00980 -0,00617 22.03.2011 0,02752 0,00811 0 0,00289 0,00330 -0,00311 23.03.2011 0,03125 0,00604 -0.00229 0,00865 0,02632 -0,00312 24.03.2011 -0,03030 -0,00800 0.022989 0,00857 -0,00641 0,00000 25.03.2011 -0,02679 -0,00403 0.020225 -0,01983 -0,00323 -0,01250 28.03.2011 0,02752 -0,01822 0.015419 0,02023 -0,00324 -0,00633 29.03.2011 0,01786 0,01031 -0.02603 0,03116 0,03247 0,01911 30.03.2011 -0,00439 0,00408 0.002227 0,02473 0,01572 0,02500 31.03.2011 -0,01322 -0,00203 0.015556 -0,01072 0,00619 -0,01524 04.04.2011 -0,00446 -0,00815 0.015317 0,00271 -0,00923 0,00000 05.04.2011 -0,01345 -0,01437 0.012931 -0,02703 -0,00311 0,00929 06.04.2011 0,00000 -0,00417 -0.01489 -0,01944 0,00312 0,06748 07.04.2011 0,01364 0,02720 -0.00648 0,02266 0,00311 0,02299 08.04.2011 0,02691 -0,00611 0.004348 0,01385 0,00929 -0,01685 11.04.2011 0,00873 0,04508 0.02381 0,01639 0,02761 0,00000 12.04.2011 0,02165 -0,00392 -0.02748 -0,00538 -0,01194 -0,01714 13.04.2011 -0,00847 -0,01181 0.002174 -0,00270 -0,00302 -0,02035 14.04.2011 0,00855 -0,01594 0.019523 0,00271 0,00303 -0,01187 15.04.2011 0,02119 -0,00405 0.025532 -0,00270 0,00000 -0,00300 18.04.2011 0,00000 0,00000 -0.00415 0,00000 0,00000 0,00000 19.04.2011 -0,03320 0,00610 0.010417 0,00542 0,00302 0,00904 20.04.2011 -0,01717 -0,00606 0.004124 0,00000 0,00000 -0,00597 21.04.2011 0,02183 0,01220 -0.03472 -0,00270 0,01506 0,03303 22.04.2011 0,01709 0,01606 -0.03472 0,00541 0,01484 -0,00581 25.04.2011
Table A.3(continue): Daily Return End of Day IMKB 100's Stock Value ALBRK ALCTL ALKA ALKIM ARFYO ALNTF Tarih 0,07317 0,00993 0,00000 0,01575 -0,03000 0,00000 01.11.2010 0,03015 0,01342 0,02703 0,03252 0,07527 0,00709 02.11.2010 -0,05687 -0,04792 -0,04516 -0,05141 -0,07000 -0,01399 03.11.2010 -0,06637 0,00000 -0,03125 -0,03234 -0,01961 -0,02721 04.11.2010 -0,02165 -0,00949 -0,00621 -0,02899 -0,03774 -0,02000 05.11.2010 -0,02532 -0,01863 0,00000 0,04282 -0,00935 -0,01316 08.11.2010 -0,00837 0,00312 0,00000 0,01276 -0,00926 0,01333 09.11.2010 -0,00417 -0,00926 0,00625 0,02887 -0,00917 -0,00662 10.11.2010 -0,00415 0,02208 0,00000 0,00263 0,00926 0,00000 11.11.2010 0,00417 -0,00314 0,01266 0,00264 -0,00917 0,00667 12.11.2010 -0,02041 -0,04505 -0,01250 0,01609 0,00000 0,02041 15.11.2010 -0,00810 -0,04585 0,00000 0,00000 -0,00909 -0,00676 22.11.2010

138
Table A.3(continue): Daily Return End of Day IMKB 100's Stock Value ALBRK ALCTL ALKA ALKIM ARFYO ALNTF Tarih -0,01594 0,05758 0,00629 -0,00798 0,00000 -0,02632 23.11.2010 0,02449 0,01852 -0,01242 0,00804 0,00000 0,01333 24.11.2010 0,04255 -0,00613 0,00000 -0,00533 0,02804 -0,04459 25.11.2010 -0,00844 -0,00306 0,00625 0,01078 -0,00926 -0,01258 26.11.2010 -0,00420 0,04808 0,01266 0,00815 0,01887 0,01274 29.11.2010 -0,02058 -0,01577 -0,01863 -0,01075 0,00000 -0,00633 30.11.2010 0,01250 -0,00314 0,00000 0,00541 0,00000 -0,01250 01.12.2010 0,00840 0,01923 0,00000 0,01370 0,00952 0,01266 02.12.2010 -0,00833 -0,01266 0,00625 -0,01084 -0,01869 0,01935 03.12.2010 -0,02041 -0,05672 -0,03030 -0,03403 -0,03604 -0,01899 06.12.2010 -0,00402 0,03593 0,00000 0,00000 0,00000 0,00621 07.12.2010 -0,01969 -0,05114 -0,00599 -0,02284 0,00901 -0,04734 08.12.2010 0,01195 -0,01950 0,01212 0,00000 0,00000 0,04321 09.12.2010 -0,03462 0,03161 -0,01786 -0,00756 0,00000 -0,02410 10.12.2010 -0,01141 0,05775 0,00599 -0,00501 0,00000 -0,02353 13.12.2010 -0,00373 0,02484 0,00508 -0,00595 -0,00885 -0,01176 14.12.2010 0,00000 -0,00923 -0,00253 0,00000 0,00893 0,00592 15.12.2010 -0,00741 0,00619 0,02332 0,01205 0,00000 0,00000 16.12.2010 -0,01099 0,00623 0,00521 0,01220 0,00000 0,01807 17.12.2010 0,00000 -0,01231 0,00000 -0,00606 -0,00885 -0,01190 20.12.2010 -0,00727 -0,01216 -0,00260 -0,02367 -0,00877 -0,01176 21.12.2010 0,00365 0,00000 0,00000 -0,01744 0,00000 0,00000 22.12.2010 0,00000 0,00305 0,00522 0,02994 -0,00870 -0,01163 23.12.2010 0,01107 -0,00906 0,00789 0,01212 0,01770 0,02994 24.12.2010 -0,00368 0,00303 0,00529 0,00610 -0,01739 0,01212 27.12.2010 0,00741 0,01538 0,01070 0,01235 0,02679 0,00610 28.12.2010 0,01504 -0,00612 -0,00267 0,00000 -0,01754 0,00000 29.12.2010 -0,01115 0,01553 0,00000 -0,00613 0,00000 -0,02381 30.12.2010 0,00000 0,00000 0,00000 0,00000 0,00000 0,00000 31.12.2010 0,00373 -0,01227 0,00000 -0,01212 0,00000 0,01818 03.01.2011 0,01132 0,04823 -0,00266 0,02484 0,02703 0,00610 04.01.2011 -0,02214 -0,00955 -0,00265 0,00000 -0,00893 0,00613 05.01.2011 -0,00368 0,00965 0,03005 0,02548 0,00901 -0,00610 06.01.2011 0,00000 0,00000 0,00274 -0,00633 0,00909 0,01863 07.01.2011 -0,00366 0,02303 0,00551 0,01282 0,00917 0,00000 10.01.2011 0,02247 0,01333 0,02833 0,03311 0,01869 0,02548 12.01.2011 -0,00743 -0,01639 -0,00563 0,00000 0,00000 -0,01875 13.01.2011 -0,02182 -0,02244 -0,01389 -0,02581 0,00000 -0,00621 14.01.2011 -0,01434 -0,01266 -0,00277 0,01307 -0,03604 0,00625 17.01.2011 -0,03125 -0,00315 -0,00276 -0,01290 -0,00893 -0,00621 18.01.2011 0,01408 0,00635 -0,00275 -0,01274 0,00901 -0,00617 19.01.2011 0,01429 0,01286 0,01114 0,03974 0,00000 0,00000 20.01.2011 0,00000 0,02303 -0,01374 -0,00658 0,00909 0,01250 21.01.2011 -0,01754 -0,01935 -0,01355 -0,02564 -0,01786 -0,00621 25.01.2011 0,02518 0,00000 -0,00539 -0,00637 -0,00885 -0,01829 26.01.2011
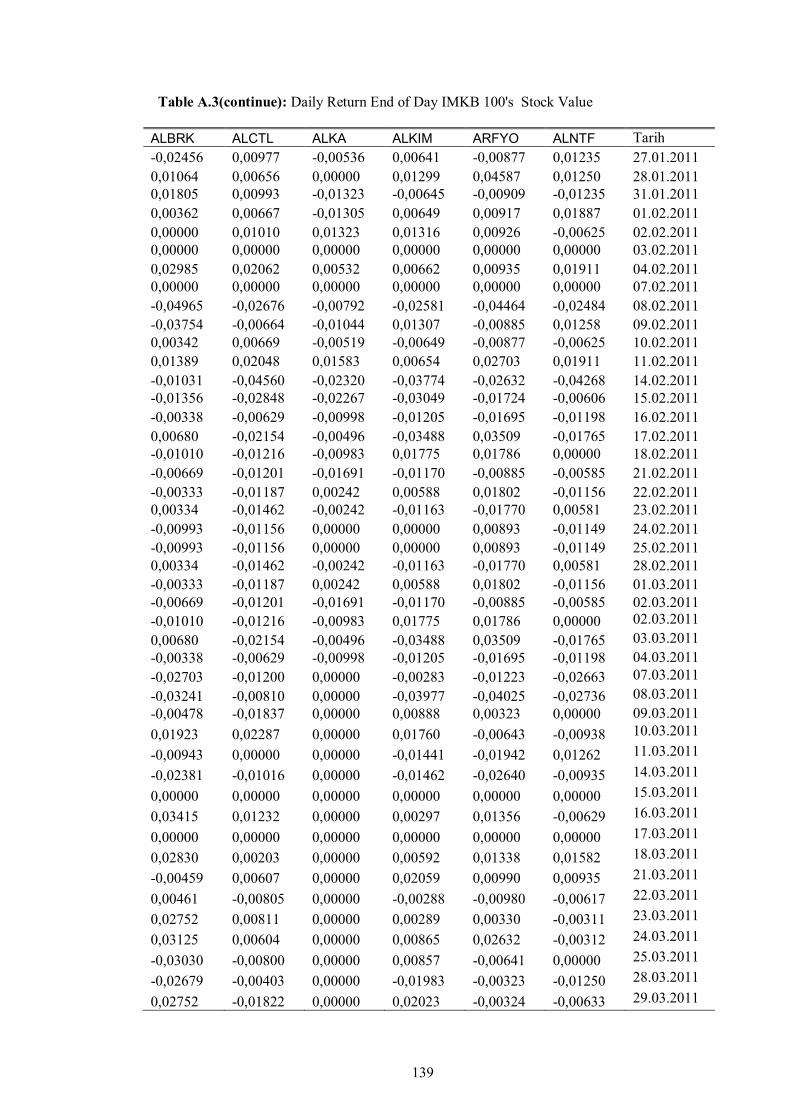
139
Table A.3(continue): Daily Return End of Day IMKB 100's Stock Value ALBRK ALCTL ALKA ALKIM ARFYO ALNTF Tarih -0,02456 0,00977 -0,00536 0,00641 -0,00877 0,01235 27.01.2011 0,01064 0,00656 0,00000 0,01299 0,04587 0,01250 28.01.2011 0,01805 0,00993 -0,01323 -0,00645 -0,00909 -0,01235 31.01.2011 0,00362 0,00667 -0,01305 0,00649 0,00917 0,01887 01.02.2011 0,00000 0,01010 0,01323 0,01316 0,00926 -0,00625 02.02.2011 0,00000 0,00000 0,00000 0,00000 0,00000 0,00000 03.02.2011 0,02985 0,02062 0,00532 0,00662 0,00935 0,01911 04.02.2011 0,00000 0,00000 0,00000 0,00000 0,00000 0,00000 07.02.2011 -0,04965 -0,02676 -0,00792 -0,02581 -0,04464 -0,02484 08.02.2011 -0,03754 -0,00664 -0,01044 0,01307 -0,00885 0,01258 09.02.2011 0,00342 0,00669 -0,00519 -0,00649 -0,00877 -0,00625 10.02.2011 0,01389 0,02048 0,01583 0,00654 0,02703 0,01911 11.02.2011 -0,01031 -0,04560 -0,02320 -0,03774 -0,02632 -0,04268 14.02.2011 -0,01356 -0,02848 -0,02267 -0,03049 -0,01724 -0,00606 15.02.2011 -0,00338 -0,00629 -0,00998 -0,01205 -0,01695 -0,01198 16.02.2011 0,00680 -0,02154 -0,00496 -0,03488 0,03509 -0,01765 17.02.2011 -0,01010 -0,01216 -0,00983 0,01775 0,01786 0,00000 18.02.2011 -0,00669 -0,01201 -0,01691 -0,01170 -0,00885 -0,00585 21.02.2011 -0,00333 -0,01187 0,00242 0,00588 0,01802 -0,01156 22.02.2011 0,00334 -0,01462 -0,00242 -0,01163 -0,01770 0,00581 23.02.2011 -0,00993 -0,01156 0,00000 0,00000 0,00893 -0,01149 24.02.2011 -0,00993 -0,01156 0,00000 0,00000 0,00893 -0,01149 25.02.2011 0,00334 -0,01462 -0,00242 -0,01163 -0,01770 0,00581 28.02.2011 -0,00333 -0,01187 0,00242 0,00588 0,01802 -0,01156 01.03.2011 -0,00669 -0,01201 -0,01691 -0,01170 -0,00885 -0,00585 02.03.2011 -0,01010 -0,01216 -0,00983 0,01775 0,01786 0,00000 02.03.2011 0,00680 -0,02154 -0,00496 -0,03488 0,03509 -0,01765 03.03.2011 -0,00338 -0,00629 -0,00998 -0,01205 -0,01695 -0,01198 04.03.2011 -0,02703 -0,01200 0,00000 -0,00283 -0,01223 -0,02663 07.03.2011 -0,03241 -0,00810 0,00000 -0,03977 -0,04025 -0,02736 08.03.2011 -0,00478 -0,01837 0,00000 0,00888 0,00323 0,00000 09.03.2011 0,01923 0,02287 0,00000 0,01760 -0,00643 -0,00938 10.03.2011
-0,00943 0,00000 0,00000 -0,01441 -0,01942 0,01262 11.03.2011
-0,02381 -0,01016 0,00000 -0,01462 -0,02640 -0,00935 14.03.2011
0,00000 0,00000 0,00000 0,00000 0,00000 0,00000 15.03.2011
0,03415 0,01232 0,00000 0,00297 0,01356 -0,00629 16.03.2011
0,00000 0,00000 0,00000 0,00000 0,00000 0,00000 17.03.2011
0,02830 0,00203 0,00000 0,00592 0,01338 0,01582 18.03.2011
-0,00459 0,00607 0,00000 0,02059 0,00990 0,00935 21.03.2011
0,00461 -0,00805 0,00000 -0,00288 -0,00980 -0,00617 22.03.2011
0,02752 0,00811 0,00000 0,00289 0,00330 -0,00311 23.03.2011
0,03125 0,00604 0,00000 0,00865 0,02632 -0,00312 24.03.2011
-0,03030 -0,00800 0,00000 0,00857 -0,00641 0,00000 25.03.2011
-0,02679 -0,00403 0,00000 -0,01983 -0,00323 -0,01250 28.03.2011
0,02752 -0,01822 0,00000 0,02023 -0,00324 -0,00633 29.03.2011

140
Table A.3(continue): Daily Return End of Day IMKB 100's Stock Value ALBRK ALCTL ALKA ALKIM ARFYO ALNTF Tarih 0,01786 0,01031 0,00000 0,03116 0,03247 0,01911 30.03.2011 -0,00439 0,00408 0,00000 0,02473 0,01572 0,02500 31.03.2011 -0,01322 -0,00203 0,00000 -0,01072 0,00619 -0,01524 04.04.2011 -0,00446 -0,00815 0,00000 0,00271 -0,00923 0,00000 05.04.2011 -0,01345 -0,01437 0,00000 -0,02703 -0,00311 0,00929 06.04.2011 0,00000 -0,00417 0,00000 -0,01944 0,00312 0,06748 07.04.2011 0,01364 0,02720 0,00000 0,02266 0,00311 0,02299 08.04.2011 0,02691 -0,00611 0,00000 0,01385 0,00929 -0,01685 11.04.2011 0,00873 0,04508 0,00000 0,01639 0,02761 0,00000 12.04.2011 0,02165 -0,00392 0,00000 -0,00538 -0,01194 -0,01714 13.04.2011 -0,00847 -0,01181 0,00000 -0,00270 -0,00302 -0,02035 14.04.2011 0,00855 -0,01594 0,00000 0,00271 0,00303 -0,01187 15.04.2011 0,02119 -0,00405 0,00000 -0,00270 0,00000 -0,00300 18.04.2011 0,00000 0,00000 0,00000 0,00000 0,00000 0,00000 19.04.2011 -0,03320 0,00610 0,00000 0,00542 0,00302 0,00904 20.04.2011 -0,01717 -0,00606 0,00000 0,00000 0,00000 -0,00597 21.04.2011 0,02183 0,01220 0,00000 -0,00270 0,01506 0,03303 22.04.2011 0,01709 0,01606 0,00000 0,00541 0,01484 -0,00581 25.04.2011
Table A.3(continue): Daily Return End of Day IMKB 100's Stock Value ALYAG ALTIN AYCES ANACM AEFES ANHYT Tarih 0,00943 0,00826 -0,00424 -0,01329 0,02370 -0,01532 01.11.2010 0,02913 0,14692 0,01288 0,03436 0,01442 -0,00218 02.11.2010 -0,05505 -0,08658 -0,03719 -0,01356 -0,02804 -0,04979 03.11.2010 -0,04386 -0,04545 0,00833 -0,03595 0,00000 -0,03984 04.11.2010 -0,00870 0,04310 -0,06977 -0,01923 -0,01835 -0,01953 05.11.2010 -0,00862 -0,02521 -0,01527 -0,00637 0,01869 -0,01158 08.11.2010 -0,00855 0,00000 -0,02602 -0,00317 0,00469 -0,00766 09.11.2010 -0,01681 -0,02058 -0,01825 -0,01563 0,00948 -0,00382 10.11.2010 -0,05556 -0,05078 0,00735 -0,01538 -0,00706 0,01158 11.11.2010 0,12500 -0,06227 0,05426 -0,00612 0,01918 -0,00385 12.11.2010 -0,01754 0,01111 -0,02642 0,04140 0,01460 -0,00763 15.11.2010 -0,01724 -0,01099 -0,00376 0,00965 0,02239 0,00383 22.11.2010 0,03571 -0,03191 0,00000 -0,01893 -0,01229 -0,01136 23.11.2010 0,00901 -0,00353 -0,02564 -0,00627 -0,00245 0,01538 24.11.2010 0,00000 0,00000 0,00368 0,00949 0,00246 0,01563 25.11.2010 0,00000 0,05597 -0,01805 0,00000 0,00743 0,00787 26.11.2010 0,02778 0,02290 0,01465 0,00317 0,01508 -0,01550 29.11.2010 -0,02703 0,06504 0,00738 -0,02477 -0,02689 -0,03008 30.11.2010 0,00000 0,04681 0,02264 0,00623 0,00491 0,00000 01.12.2010 0,02778 -0,02083 0,01533 0,00943 0,02519 0,01141 02.12.2010 -0,01818 0,02128 0,04819 -0,00935 -0,02457 0,00000 03.12.2010 -0,04348 -0,01261 -0,02734 -0,03313 -0,02864 -0,01866 06.12.2010 0,00855 0,00000 -0,07023 0,03040 0,00463 0,00741 07.12.2010 -0,00847 -0,02439 -0,00333 -0,00303 -0,04000 -0,02527 08.12.2010 0,00000 -0,03529 0,02041 -0,00302 -0,03017 -0,00360 09.12.2010
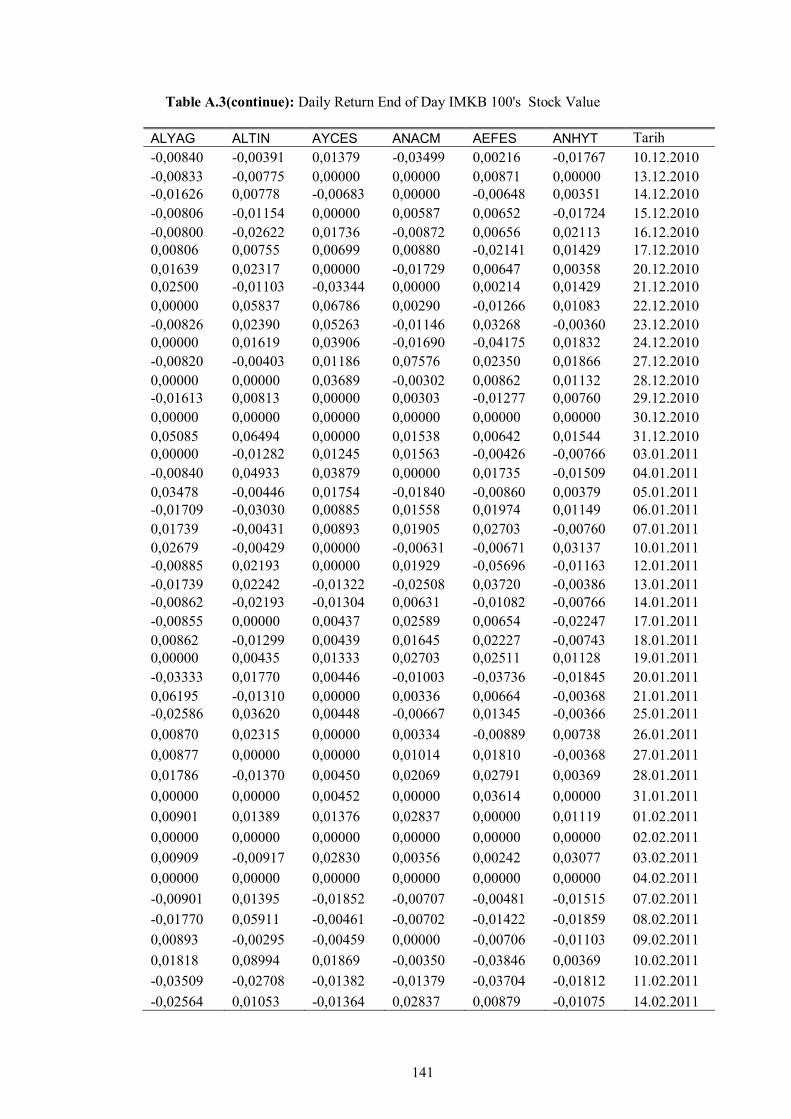
141
Table A.3(continue): Daily Return End of Day IMKB 100's Stock Value ALYAG ALTIN AYCES ANACM AEFES ANHYT Tarih -0,00840 -0,00391 0,01379 -0,03499 0,00216 -0,01767 10.12.2010 -0,00833 -0,00775 0,00000 0,00000 0,00871 0,00000 13.12.2010 -0,01626 0,00778 -0,00683 0,00000 -0,00648 0,00351 14.12.2010 -0,00806 -0,01154 0,00000 0,00587 0,00652 -0,01724 15.12.2010 -0,00800 -0,02622 0,01736 -0,00872 0,00656 0,02113 16.12.2010 0,00806 0,00755 0,00699 0,00880 -0,02141 0,01429 17.12.2010 0,01639 0,02317 0,00000 -0,01729 0,00647 0,00358 20.12.2010 0,02500 -0,01103 -0,03344 0,00000 0,00214 0,01429 21.12.2010 0,00000 0,05837 0,06786 0,00290 -0,01266 0,01083 22.12.2010 -0,00826 0,02390 0,05263 -0,01146 0,03268 -0,00360 23.12.2010 0,00000 0,01619 0,03906 -0,01690 -0,04175 0,01832 24.12.2010 -0,00820 -0,00403 0,01186 0,07576 0,02350 0,01866 27.12.2010 0,00000 0,00000 0,03689 -0,00302 0,00862 0,01132 28.12.2010 -0,01613 0,00813 0,00000 0,00303 -0,01277 0,00760 29.12.2010 0,00000 0,00000 0,00000 0,00000 0,00000 0,00000 30.12.2010 0,05085 0,06494 0,00000 0,01538 0,00642 0,01544 31.12.2010 0,00000 -0,01282 0,01245 0,01563 -0,00426 -0,00766 03.01.2011 -0,00840 0,04933 0,03879 0,00000 0,01735 -0,01509 04.01.2011 0,03478 -0,00446 0,01754 -0,01840 -0,00860 0,00379 05.01.2011 -0,01709 -0,03030 0,00885 0,01558 0,01974 0,01149 06.01.2011 0,01739 -0,00431 0,00893 0,01905 0,02703 -0,00760 07.01.2011 0,02679 -0,00429 0,00000 -0,00631 -0,00671 0,03137 10.01.2011 -0,00885 0,02193 0,00000 0,01929 -0,05696 -0,01163 12.01.2011 -0,01739 0,02242 -0,01322 -0,02508 0,03720 -0,00386 13.01.2011 -0,00862 -0,02193 -0,01304 0,00631 -0,01082 -0,00766 14.01.2011 -0,00855 0,00000 0,00437 0,02589 0,00654 -0,02247 17.01.2011 0,00862 -0,01299 0,00439 0,01645 0,02227 -0,00743 18.01.2011 0,00000 0,00435 0,01333 0,02703 0,02511 0,01128 19.01.2011 -0,03333 0,01770 0,00446 -0,01003 -0,03736 -0,01845 20.01.2011 0,06195 -0,01310 0,00000 0,00336 0,00664 -0,00368 21.01.2011 -0,02586 0,03620 0,00448 -0,00667 0,01345 -0,00366 25.01.2011 0,00870 0,02315 0,00000 0,00334 -0,00889 0,00738 26.01.2011 0,00877 0,00000 0,00000 0,01014 0,01810 -0,00368 27.01.2011 0,01786 -0,01370 0,00450 0,02069 0,02791 0,00369 28.01.2011 0,00000 0,00000 0,00452 0,00000 0,03614 0,00000 31.01.2011 0,00901 0,01389 0,01376 0,02837 0,00000 0,01119 01.02.2011 0,00000 0,00000 0,00000 0,00000 0,00000 0,00000 02.02.2011 0,00909 -0,00917 0,02830 0,00356 0,00242 0,03077 03.02.2011 0,00000 0,00000 0,00000 0,00000 0,00000 0,00000 04.02.2011 -0,00901 0,01395 -0,01852 -0,00707 -0,00481 -0,01515 07.02.2011 -0,01770 0,05911 -0,00461 -0,00702 -0,01422 -0,01859 08.02.2011 0,00893 -0,00295 -0,00459 0,00000 -0,00706 -0,01103 09.02.2011 0,01818 0,08994 0,01869 -0,00350 -0,03846 0,00369 10.02.2011 -0,03509 -0,02708 -0,01382 -0,01379 -0,03704 -0,01812 11.02.2011 -0,02564 0,01053 -0,01364 0,02837 0,00879 -0,01075 14.02.2011

142
Table A.3(continue): Daily Return End of Day IMKB 100's Stock Value ALYAG ALTIN AYCES ANACM AEFES ANHYT Tarih 0,00000 -0,02863 0,00000 -0,00353 0,00887 -0,01761 15.02.2011 -0,00847 0,02947 0,00457 -0,05667 -0,00442 0,00709 16.02.2011 -0,01667 -0,02464 0,00000 0,01010 0,00221 0,01805 17.02.2011 -0,00826 0,01247 -0,01351 -0,01000 0,01119 -0,01071 18.02.2011 0,00000 0,09318 0,00452 0,00334 0,00224 0,00358 21.02.2011 0,00000 0,00457 0,00455 -0,01320 -0,00889 -0,02448 22.02.2011 -0,00820 0,00229 0,00000 0,00664 -0,00222 -0,01038 23.02.2011 -0,00820 0,00229 0,00000 0,00664 -0,00222 -0,01038 24.02.2011 0,00000 0,00457 0,00455 -0,01320 -0,00889 -0,02448 25.02.2011 0,00000 0,09318 0,00452 0,00334 0,00224 0,00358 28.02.2011 -0,00826 0,01247 -0,01351 -0,01000 0,01119 -0,01071 01.03.2011 -0,01667 -0,02464 0,00000 0,01010 0,00221 0,01805 02.03.2011 -0,00847 0,02947 0,00457 -0,05667 -0,00442 0,00709 02.03.2011 0,00000 -0,02863 0,00000 -0,00353 0,00887 -0,01761 03.03.2011 -0,02564 0,01053 -0,01364 0,02837 0,00879 -0,01075 04.03.2011 0,00893 -0,00295 -0,00459 0,00000 -0,00706 -0,01103 07.03.2011 -0,01770 0,05911 -0,00461 -0,00702 -0,01422 -0,01859 08.03.2011 -0,00901 0,01395 -0,01852 -0,00707 -0,00481 -0,01515 09.03.2011 0,00000 0,00000 0,00000 0,00000 0,00000 0,00000 10.03.2011 0,00909 -0,00917 0,02830 0,00356 0,00242 0,03077 11.03.2011 0,00000 0,00000 0,00000 0,00000 0,00000 0,00000 14.03.2011 0,00901 0,01389 0,01376 0,02837 0,00000 0,01119 15.03.2011 0,00000 0,00000 0,00452 0,00000 0,03614 0,00000 16.03.2011 0,01786 -0,01370 0,00450 0,02069 0,02791 0,00369 17.03.2011 0,00877 0,00000 0,00000 0,01014 0,01810 -0,00368 18.03.2011 0,00870 0,02315 0,00000 0,00334 -0,00889 0,00738 21.03.2011 -0,02586 0,03620 0,00448 -0,00667 0,01345 -0,00366 22.03.2011 0,06195 -0,01310 0,00000 0,00336 0,00664 -0,00368 23.03.2011 -0,03333 0,01770 0,00446 -0,01003 -0,03736 -0,01845 24.03.2011 0,00000 0,00435 0,01333 0,02703 0,02511 0,01128 25.03.2011 0,00862 -0,01299 0,00439 0,01645 0,02227 -0,00743 28.03.2011 -0,00855 0,00000 0,00437 0,02589 0,00654 -0,02247 29.03.2011
-0,00862 -0,02193 -0,01304 0,00631 -0,01082 -0,00766 30.03.2011
-0,01739 0,02242 -0,01322 -0,02508 0,03720 -0,00386 31.03.2011
-0,00885 0,02193 0,00000 0,01929 -0,05696 -0,01163 04.04.2011
0,02679 -0,00429 0,00000 -0,00631 -0,00671 0,03137 05.04.2011
0,01739 -0,00431 0,00893 0,01905 0,02703 -0,00760 06.04.2011
-0,01709 -0,03030 0,00885 0,01558 0,01974 0,01149 07.04.2011
0,03478 -0,00446 0,01754 -0,01840 -0,00860 0,00379 08.04.2011
-0,00840 0,04933 0,03879 0,00000 0,01735 -0,01509 11.04.2011
0,00000 -0,01282 0,01245 0,01563 -0,00426 -0,00766 12.04.2011
0,05085 0,06494 0,00000 0,01538 0,00642 0,01544 13.04.2011
0,00000 0,00000 0,00000 0,00000 0,00000 0,00000 14.04.2011
-0,01613 0,00813 0,00000 0,00303 -0,01277 0,00760 15.04.2011
0,00000 0,00000 0,03689 -0,00302 0,00862 0,01132 18.04.2011
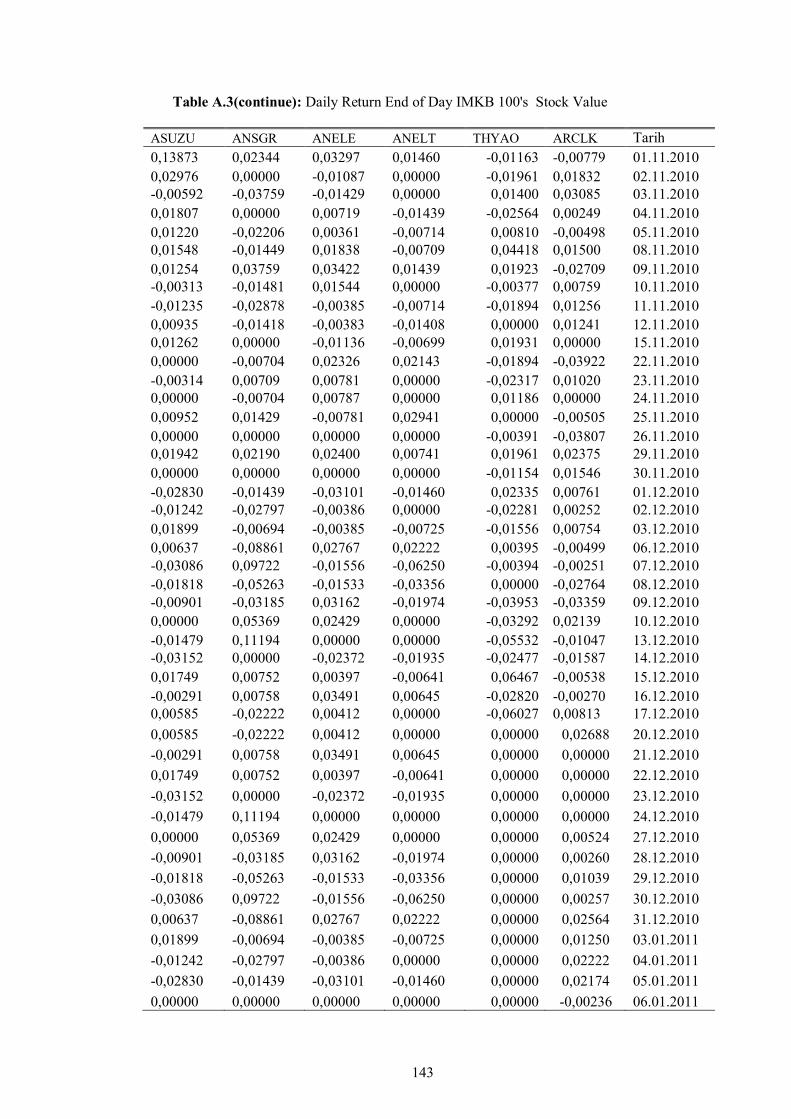
143
Table A.3(continue): Daily Return End of Day IMKB 100's Stock Value ASUZU ANSGR ANELE ANELT THYAO ARCLK Tarih 0,13873 0,02344 0,03297 0,01460 -0,01163 -0,00779 01.11.2010 0,02976 0,00000 -0,01087 0,00000 -0,01961 0,01832 02.11.2010 -0,00592 -0,03759 -0,01429 0,00000 0,01400 0,03085 03.11.2010 0,01807 0,00000 0,00719 -0,01439 -0,02564 0,00249 04.11.2010 0,01220 -0,02206 0,00361 -0,00714 0,00810 -0,00498 05.11.2010 0,01548 -0,01449 0,01838 -0,00709 0,04418 0,01500 08.11.2010 0,01254 0,03759 0,03422 0,01439 0,01923 -0,02709 09.11.2010 -0,00313 -0,01481 0,01544 0,00000 -0,00377 0,00759 10.11.2010 -0,01235 -0,02878 -0,00385 -0,00714 -0,01894 0,01256 11.11.2010 0,00935 -0,01418 -0,00383 -0,01408 0,00000 0,01241 12.11.2010 0,01262 0,00000 -0,01136 -0,00699 0,01931 0,00000 15.11.2010 0,00000 -0,00704 0,02326 0,02143 -0,01894 -0,03922 22.11.2010 -0,00314 0,00709 0,00781 0,00000 -0,02317 0,01020 23.11.2010 0,00000 -0,00704 0,00787 0,00000 0,01186 0,00000 24.11.2010 0,00952 0,01429 -0,00781 0,02941 0,00000 -0,00505 25.11.2010 0,00000 0,00000 0,00000 0,00000 -0,00391 -0,03807 26.11.2010 0,01942 0,02190 0,02400 0,00741 0,01961 0,02375 29.11.2010 0,00000 0,00000 0,00000 0,00000 -0,01154 0,01546 30.11.2010 -0,02830 -0,01439 -0,03101 -0,01460 0,02335 0,00761 01.12.2010 -0,01242 -0,02797 -0,00386 0,00000 -0,02281 0,00252 02.12.2010 0,01899 -0,00694 -0,00385 -0,00725 -0,01556 0,00754 03.12.2010 0,00637 -0,08861 0,02767 0,02222 0,00395 -0,00499 06.12.2010 -0,03086 0,09722 -0,01556 -0,06250 -0,00394 -0,00251 07.12.2010 -0,01818 -0,05263 -0,01533 -0,03356 0,00000 -0,02764 08.12.2010 -0,00901 -0,03185 0,03162 -0,01974 -0,03953 -0,03359 09.12.2010 0,00000 0,05369 0,02429 0,00000 -0,03292 0,02139 10.12.2010 -0,01479 0,11194 0,00000 0,00000 -0,05532 -0,01047 13.12.2010 -0,03152 0,00000 -0,02372 -0,01935 -0,02477 -0,01587 14.12.2010 0,01749 0,00752 0,00397 -0,00641 0,06467 -0,00538 15.12.2010 -0,00291 0,00758 0,03491 0,00645 -0,02820 -0,00270 16.12.2010 0,00585 -0,02222 0,00412 0,00000 -0,06027 0,00813 17.12.2010 0,00585 -0,02222 0,00412 0,00000 0,00000 0,02688 20.12.2010 -0,00291 0,00758 0,03491 0,00645 0,00000 0,00000 21.12.2010 0,01749 0,00752 0,00397 -0,00641 0,00000 0,00000 22.12.2010 -0,03152 0,00000 -0,02372 -0,01935 0,00000 0,00000 23.12.2010 -0,01479 0,11194 0,00000 0,00000 0,00000 0,00000 24.12.2010 0,00000 0,05369 0,02429 0,00000 0,00000 0,00524 27.12.2010 -0,00901 -0,03185 0,03162 -0,01974 0,00000 0,00260 28.12.2010 -0,01818 -0,05263 -0,01533 -0,03356 0,00000 0,01039 29.12.2010 -0,03086 0,09722 -0,01556 -0,06250 0,00000 0,00257 30.12.2010 0,00637 -0,08861 0,02767 0,02222 0,00000 0,02564 31.12.2010 0,01899 -0,00694 -0,00385 -0,00725 0,00000 0,01250 03.01.2011 -0,01242 -0,02797 -0,00386 0,00000 0,00000 0,02222 04.01.2011 -0,02830 -0,01439 -0,03101 -0,01460 0,00000 0,02174 05.01.2011 0,00000 0,00000 0,00000 0,00000 0,00000 -0,00236 06.01.2011
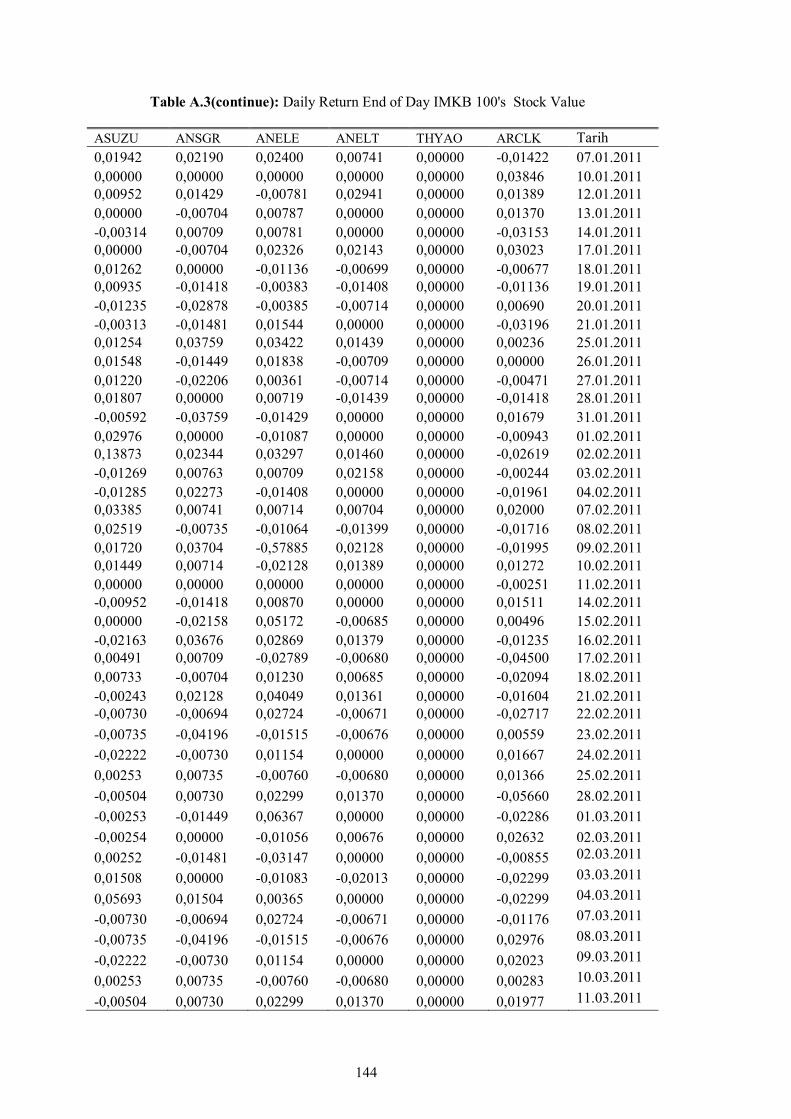
144
Table A.3(continue): Daily Return End of Day IMKB 100's Stock Value ASUZU ANSGR ANELE ANELT THYAO ARCLK Tarih 0,01942 0,02190 0,02400 0,00741 0,00000 -0,01422 07.01.2011 0,00000 0,00000 0,00000 0,00000 0,00000 0,03846 10.01.2011 0,00952 0,01429 -0,00781 0,02941 0,00000 0,01389 12.01.2011 0,00000 -0,00704 0,00787 0,00000 0,00000 0,01370 13.01.2011 -0,00314 0,00709 0,00781 0,00000 0,00000 -0,03153 14.01.2011 0,00000 -0,00704 0,02326 0,02143 0,00000 0,03023 17.01.2011 0,01262 0,00000 -0,01136 -0,00699 0,00000 -0,00677 18.01.2011 0,00935 -0,01418 -0,00383 -0,01408 0,00000 -0,01136 19.01.2011 -0,01235 -0,02878 -0,00385 -0,00714 0,00000 0,00690 20.01.2011 -0,00313 -0,01481 0,01544 0,00000 0,00000 -0,03196 21.01.2011 0,01254 0,03759 0,03422 0,01439 0,00000 0,00236 25.01.2011 0,01548 -0,01449 0,01838 -0,00709 0,00000 0,00000 26.01.2011 0,01220 -0,02206 0,00361 -0,00714 0,00000 -0,00471 27.01.2011 0,01807 0,00000 0,00719 -0,01439 0,00000 -0,01418 28.01.2011 -0,00592 -0,03759 -0,01429 0,00000 0,00000 0,01679 31.01.2011 0,02976 0,00000 -0,01087 0,00000 0,00000 -0,00943 01.02.2011 0,13873 0,02344 0,03297 0,01460 0,00000 -0,02619 02.02.2011 -0,01269 0,00763 0,00709 0,02158 0,00000 -0,00244 03.02.2011 -0,01285 0,02273 -0,01408 0,00000 0,00000 -0,01961 04.02.2011 0,03385 0,00741 0,00714 0,00704 0,00000 0,02000 07.02.2011 0,02519 -0,00735 -0,01064 -0,01399 0,00000 -0,01716 08.02.2011 0,01720 0,03704 -0,57885 0,02128 0,00000 -0,01995 09.02.2011 0,01449 0,00714 -0,02128 0,01389 0,00000 0,01272 10.02.2011 0,00000 0,00000 0,00000 0,00000 0,00000 -0,00251 11.02.2011 -0,00952 -0,01418 0,00870 0,00000 0,00000 0,01511 14.02.2011 0,00000 -0,02158 0,05172 -0,00685 0,00000 0,00496 15.02.2011 -0,02163 0,03676 0,02869 0,01379 0,00000 -0,01235 16.02.2011 0,00491 0,00709 -0,02789 -0,00680 0,00000 -0,04500 17.02.2011 0,00733 -0,00704 0,01230 0,00685 0,00000 -0,02094 18.02.2011 -0,00243 0,02128 0,04049 0,01361 0,00000 -0,01604 21.02.2011 -0,00730 -0,00694 0,02724 -0,00671 0,00000 -0,02717 22.02.2011 -0,00735 -0,04196 -0,01515 -0,00676 0,00000 0,00559 23.02.2011 -0,02222 -0,00730 0,01154 0,00000 0,00000 0,01667 24.02.2011 0,00253 0,00735 -0,00760 -0,00680 0,00000 0,01366 25.02.2011 -0,00504 0,00730 0,02299 0,01370 0,00000 -0,05660 28.02.2011 -0,00253 -0,01449 0,06367 0,00000 0,00000 -0,02286 01.03.2011 -0,00254 0,00000 -0,01056 0,00676 0,00000 0,02632 02.03.2011 0,00252 -0,01481 -0,03147 0,00000 0,00000 -0,00855 02.03.2011
0,01508 0,00000 -0,01083 -0,02013 0,00000 -0,02299 03.03.2011
0,05693 0,01504 0,00365 0,00000 0,00000 -0,02299 04.03.2011
-0,00730 -0,00694 0,02724 -0,00671 0,00000 -0,01176 07.03.2011
-0,00735 -0,04196 -0,01515 -0,00676 0,00000 0,02976 08.03.2011
-0,02222 -0,00730 0,01154 0,00000 0,00000 0,02023 09.03.2011
0,00253 0,00735 -0,00760 -0,00680 0,00000 0,00283 10.03.2011
-0,00504 0,00730 0,02299 0,01370 0,00000 0,01977 11.03.2011

145
Table A.3(continue): Daily Return End of Day IMKB 100's Stock Value ASUZU ANSGR ANELE ANELT THYAO ARCLK Tarih -0,00253 -0,01449 0,06367 0,00000 0,00000 -0,00831 14.03.2011 -0,00254 0,00000 -0,01056 0,00676 0,00000 -0,00279 15.03.2011 0,00252 -0,01481 -0,03147 0,00000 0,00000 0,00000 16.03.2011 0,01508 0,00000 -0,01083 -0,02013 0,00000 -0,00280 17.03.2011 0,05693 0,01504 0,00365 0,00000 0,00000 0,01404 18.03.2011 0,10304 -0,01481 -0,01455 0,00000 0,00000 0,00000 21.03.2011 -0,02123 0,00000 0,03321 0,01370 0,00000 -0,00831 22.03.2011 -0,04677 -0,03008 -0,02545 -0,04138 0,00000 0,01955 23.03.2011 0,03972 0,03101 -0,02985 -0,02158 0,00000 0,01370 24.03.2011 -0,00674 0,00752 0,00769 0,01471 0,00000 0,02162 25.03.2011 0,00226 0,02239 0,00000 0,00725 0,00000 -0,04762 28.03.2011 -0,00226 -0,00730 0,00000 -0,03597 0,00000 0,00556 29.03.2011 0,00905 0,00000 0,03053 0,02239 0,00000 -0,01381 30.03.2011 0,02018 0,01471 0,02222 0,00000 0,00000 0,02241 31.03.2011 0,03516 -0,00725 -0,01087 0,00730 0,00000 0,03288 04.04.2011 -0,01486 0,00000 0,00366 0,00000 0,00000 0,00000 05.04.2011 -0,03017 0,00000 -0,01460 -0,00725 0,00000 0,01326 06.04.2011 -0,01556 0,02190 0,02963 0,00000 0,00000 0,02618 07.04.2011 0,01354 -0,02143 -0,01079 -0,00730 0,00000 -0,00510 08.04.2011 -0,07127 0,00000 0,00000 0,00735 0,00000 0,00256 11.04.2011 0,00719 0,00000 -0,00727 0,00730 0,00000 0,00767 12.04.2011 -0,00238 0,00000 -0,03663 -0,00725 0,00000 -0,00254 13.04.2011 0,00000 0,00000 0,00000 0,00000 0,00000 -0,00763 14.04.2011 -0,01671 0,00730 0,00000 -0,00730 0,00000 -0,02051 15.04.2011 -0,00728 -0,00725 -0,09125 -0,00735 0,00000 0,03403 18.04.2011 -0,00489 -0,02920 -0,00837 -0,00741 0,00000 0,02785 19.04.2011 -0,02948 -0,03759 -0,02954 -0,03731 0,00000 0,01970 20.04.2011 -0,09367 -0,08594 0,01304 -0,10078 0,00000 0,00000 21.04.2011 0,03911 0,02564 -0,01288 0,03448 0,00000 -0,00242 22.04.2011 0,01613 0,00833 -0,04783 0,00833 0,00000 0,01937 25.04.2011
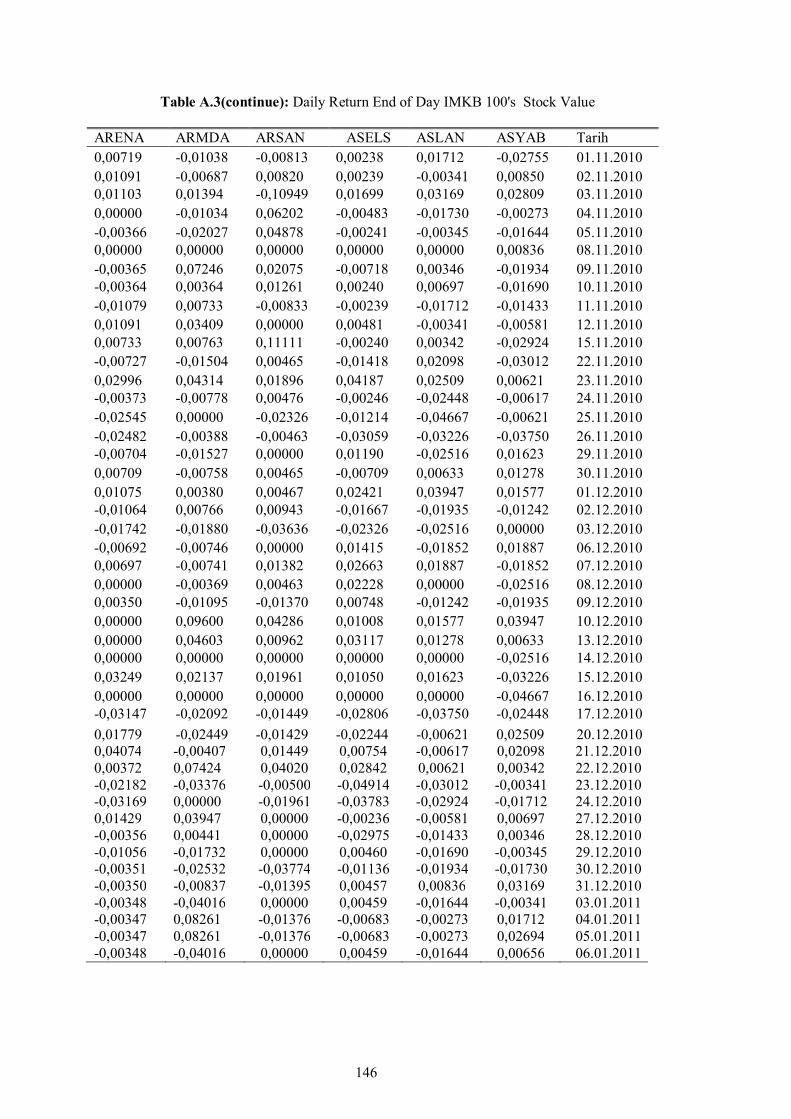
146
Table A.3(continue): Daily Return End of Day IMKB 100's Stock Value ARENA ARMDA ARSAN ASELS ASLAN ASYAB Tarih 0,00719 -0,01038 -0,00813 0,00238 0,01712 -0,02755 01.11.2010 0,01091 -0,00687 0,00820 0,00239 -0,00341 0,00850 02.11.2010 0,01103 0,01394 -0,10949 0,01699 0,03169 0,02809 03.11.2010 0,00000 -0,01034 0,06202 -0,00483 -0,01730 -0,00273 04.11.2010 -0,00366 -0,02027 0,04878 -0,00241 -0,00345 -0,01644 05.11.2010 0,00000 0,00000 0,00000 0,00000 0,00000 0,00836 08.11.2010 -0,00365 0,07246 0,02075 -0,00718 0,00346 -0,01934 09.11.2010 -0,00364 0,00364 0,01261 0,00240 0,00697 -0,01690 10.11.2010 -0,01079 0,00733 -0,00833 -0,00239 -0,01712 -0,01433 11.11.2010 0,01091 0,03409 0,00000 0,00481 -0,00341 -0,00581 12.11.2010 0,00733 0,00763 0,11111 -0,00240 0,00342 -0,02924 15.11.2010 -0,00727 -0,01504 0,00465 -0,01418 0,02098 -0,03012 22.11.2010 0,02996 0,04314 0,01896 0,04187 0,02509 0,00621 23.11.2010 -0,00373 -0,00778 0,00476 -0,00246 -0,02448 -0,00617 24.11.2010 -0,02545 0,00000 -0,02326 -0,01214 -0,04667 -0,00621 25.11.2010 -0,02482 -0,00388 -0,00463 -0,03059 -0,03226 -0,03750 26.11.2010 -0,00704 -0,01527 0,00000 0,01190 -0,02516 0,01623 29.11.2010 0,00709 -0,00758 0,00465 -0,00709 0,00633 0,01278 30.11.2010 0,01075 0,00380 0,00467 0,02421 0,03947 0,01577 01.12.2010 -0,01064 0,00766 0,00943 -0,01667 -0,01935 -0,01242 02.12.2010 -0,01742 -0,01880 -0,03636 -0,02326 -0,02516 0,00000 03.12.2010 -0,00692 -0,00746 0,00000 0,01415 -0,01852 0,01887 06.12.2010 0,00697 -0,00741 0,01382 0,02663 0,01887 -0,01852 07.12.2010 0,00000 -0,00369 0,00463 0,02228 0,00000 -0,02516 08.12.2010 0,00350 -0,01095 -0,01370 0,00748 -0,01242 -0,01935 09.12.2010 0,00000 0,09600 0,04286 0,01008 0,01577 0,03947 10.12.2010 0,00000 0,04603 0,00962 0,03117 0,01278 0,00633 13.12.2010 0,00000 0,00000 0,00000 0,00000 0,00000 -0,02516 14.12.2010 0,03249 0,02137 0,01961 0,01050 0,01623 -0,03226 15.12.2010 0,00000 0,00000 0,00000 0,00000 0,00000 -0,04667 16.12.2010 -0,03147 -0,02092 -0,01449 -0,02806 -0,03750 -0,02448 17.12.2010 0,01779 -0,02449 -0,01429 -0,02244 -0,00621 0,02509 20.12.2010 0,04074 -0,00407 0,01449 0,00754 -0,00617 0,02098 21.12.2010 0,00372 0,07424 0,04020 0,02842 0,00621 0,00342 22.12.2010 -0,02182 -0,03376 -0,00500 -0,04914 -0,03012 -0,00341 23.12.2010 -0,03169 0,00000 -0,01961 -0,03783 -0,02924 -0,01712 24.12.2010 0,01429 0,03947 0,00000 -0,00236 -0,00581 0,00697 27.12.2010 -0,00356 0,00441 0,00000 -0,02975 -0,01433 0,00346 28.12.2010 -0,01056 -0,01732 0,00000 0,00460 -0,01690 -0,00345 29.12.2010 -0,00351 -0,02532 -0,03774 -0,01136 -0,01934 -0,01730 30.12.2010 -0,00350 -0,00837 -0,01395 0,00457 0,00836 0,03169 31.12.2010 -0,00348 -0,04016 0,00000 0,00459 -0,01644 -0,00341 03.01.2011 -0,00347 0,08261 -0,01376 -0,00683 -0,00273 0,01712 04.01.2011 -0,00347 0,08261 -0,01376 -0,00683 -0,00273 0,02694 05.01.2011 -0,00348 -0,04016 0,00000 0,00459 -0,01644 0,00656 06.01.2011

147
Table A.3(continue): Daily Return End of Day IMKB 100's Stock Value ARENA ARMDA ARSAN ASELS ASLAN ASYAB Tarih -0,00350 -0,00837 -0,01395 0,00457 0,00836 -0,01303 07.01.2011 -0,00351 -0,02532 -0,03774 -0,01136 -0,01934 0,00990 10.01.2011 -0,01056 -0,01732 0,00000 0,00460 -0,01690 -0,00980 12.01.2011 -0,00356 0,00441 0,00000 -0,02975 -0,01433 -0,00990 13.01.2011 0,01429 0,03947 0,00000 -0,00236 -0,00581 -0,02333 14.01.2011 -0,03169 0,00000 -0,01961 -0,03783 -0,02924 -0,02048 17.01.2011 -0,02182 -0,03376 -0,00500 -0,04914 -0,03012 -0,01742 18.01.2011 0,00372 0,07424 0,04020 0,02842 0,00621 -0,03191 19.01.2011 0,04074 -0,00407 0,01449 0,00754 -0,00617 0,02564 20.01.2011 0,01779 -0,02449 -0,01429 -0,02244 -0,00621 -0,00357 21.01.2011 -0,03147 -0,02092 -0,01449 -0,02806 -0,03750 0,02151 25.01.2011 0,00000 0,00000 0,00000 0,00000 0,00000 -0,01053 26.01.2011 0,03249 0,02137 0,01961 0,01050 0,01623 -0,02837 27.01.2011 0,00000 0,00000 0,00000 0,00000 0,00000 0,02190 28.01.2011 0,00000 0,04603 0,00962 0,03117 0,01278 0,02500 31.01.2011 0,00000 0,09600 0,04286 0,01008 0,01577 -0,00697 01.02.2011 0,00350 -0,01095 -0,01370 0,00748 -0,01242 -0,02456 02.02.2011 0,00000 -0,00369 0,00463 0,02228 0,00000 0,02878 03.02.2011 0,00697 -0,00741 0,01382 0,02663 0,01887 -0,01748 04.02.2011 -0,00692 -0,00746 0,00000 0,01415 -0,01852 0,00712 07.02.2011 -0,01742 -0,01880 -0,03636 -0,02326 -0,02516 0,01767 08.02.2011 -0,01064 0,00766 0,00943 -0,01667 -0,01935 -0,01736 09.02.2011 0,01075 0,00380 0,00467 0,02421 0,03947 0,00000 10.02.2011 0,00709 -0,00758 0,00465 -0,00709 0,00633 -0,00353 11.02.2011 -0,00704 -0,01527 0,00000 0,01190 -0,02516 0,00000 14.02.2011 -0,02482 -0,00388 -0,00463 -0,03059 -0,03226 0,00709 15.02.2011 -0,02545 0,00000 -0,02326 -0,01214 -0,04667 -0,00352 16.02.2011 -0,00373 -0,00778 0,00476 -0,00246 -0,02448 0,01060 17.02.2011 0,02996 0,04314 0,01896 0,04187 0,02509 -0,02448 18.02.2011 -0,00727 -0,01504 0,00465 -0,01418 0,02098 -0,01075 21.02.2011 0,00733 0,00763 0,11111 -0,00240 0,00342 -0,02899 22.02.2011 0,01091 0,03409 0,00000 0,00481 -0,00341 -0,07090 23.02.2011 -0,01079 0,00733 -0,00833 -0,00239 -0,01712 0,01205 24.02.2011 -0,00364 0,00364 0,01261 0,00240 0,00697 0,02381 25.02.2011 -0,00365 0,07246 0,02075 -0,00718 0,00346 -0,04651 28.02.2011 0,00000 0,00000 0,00000 0,00000 0,00000 0,03659 01.03.2011 -0,00366 -0,02027 0,04878 -0,00241 -0,00345 0,03922 02.03.2011 0,00000 -0,01034 0,06202 -0,00483 -0,01730 -0,00377 02.03.2011 0,01103 0,01394 -0,10949 0,01699 0,03169 -0,01515 03.03.2011 0,01091 -0,00687 0,00820 0,00239 -0,00341 -0,01515 04.03.2011 0,00714 0,09059 -0,00826 -0,00234 0,00656 0,00769 07.03.2011 -0,00355 -0,05112 -0,05000 -0,02108 -0,01303 0,09160 08.03.2011 -0,00712 -0,02020 0,00877 -0,00718 0,01320 0,00699 09.03.2011 0,00000 0,00687 -0,00870 0,00723 -0,00326 0,02778 10.03.2011 0,00000 0,02048 0,02193 0,00957 -0,00980 -0,01014 11.03.2011

148
Table A.3(continue): Daily Return End of Day IMKB 100's Stock Value ARENA ARMDA ARSAN ASELS ASLAN ASYAB Tarih 0,00000 0,01338 0,01288 -0,00237 -0,00990 -0,02048 14.03.2011 -0,00358 -0,02640 -0,02542 -0,00713 -0,02333 -0,01045 15.03.2011 0,01079 0,00000 0,01327 -0,01193 0,00000 0,00704 16.03.2011 -0,01423 -0,02712 -0,02620 -0,01449 0,07944 0,00699 17.03.2011 0,00361 0,00348 -0,01345 0,01471 0,03030 -0,01389 18.03.2011 -0,01079 -0,01042 -0,02727 -0,00483 -0,04202 0,00704 21.03.2011 0,00000 0,00702 0,00000 0,00000 -0,02632 -0,01049 22.03.2011 -0,03321 -0,02158 -0,03333 -0,01463 -0,03830 0,01413 23.03.2011 -0,02290 -0,02206 -0,04433 -0,01733 0,00000 0,01742 24.03.2011 0,01172 0,01504 0,06186 0,01008 0,01327 0,02397 25.03.2011 0,00772 -0,01481 0,02913 -0,00998 -0,00437 -0,00334 28.03.2011 -0,03065 -0,01880 -0,05189 -0,02015 -0,02632 0,01007 29.03.2011 0,01186 0,00383 0,01990 0,01028 0,03604 0,00000 30.03.2011 0,01563 0,00763 0,00000 0,01018 0,20870 0,03654 31.03.2011 0,01154 0,01136 0,00976 0,01008 -0,10791 0,02564 04.04.2011 0,00380 0,00000 -0,01449 0,00499 0,00000 -0,01875 05.04.2011 -0,01136 -0,01498 -0,01471 -0,00744 0,00806 0,00955 06.04.2011 0,00766 0,04563 0,00995 0,00250 0,00000 -0,00631 07.04.2011 -0,00760 0,12727 -0,00985 0,02494 0,02400 -0,02222 08.04.2011 -0,01149 0,03226 -0,00498 -0,01460 -0,00781 -0,01623 11.04.2011 0,00775 -0,00938 0,00500 -0,00247 0,05512 -0,00990 12.04.2011 0,00769 -0,00631 0,00498 0,00743 -0,01493 0,01667 13.04.2011 0,00000 0,00000 0,00000 0,00000 0,00000 -0,00328 14.04.2011 -0,00763 0,00317 -0,00990 -0,00491 -0,06818 -0,04605 15.04.2011 -0,02308 -0,00949 -0,02000 -0,00741 0,00813 0,03448 18.04.2011 -0,01969 -0,00639 -0,03061 -0,00746 -0,03226 -0,00333 19.04.2011 -0,04016 -0,06109 -0,07895 -0,02757 -0,04167 0,00669 20.04.2011 -0,09205 -0,09589 -0,10286 -0,05928 -0,11304 -0,00332 21.04.2011 0,03687 0,05682 0,07643 0,03562 0,16667 0,01000 22.04.2011 0,00000 0,01434 0,00592 -0,00529 0,05042 -0,00330 25.04.2011 0,00000 0,01338 0,01288 -0,00237 -0,00990 -0,02048 14.03.2011 -0,00358 -0,02640 -0,02542 -0,00713 -0,02333 -0,01045 15.03.2011 0,01079 0,00000 0,01327 -0,01193 0,00000 0,00704 16.03.2011 -0,01423 -0,02712 -0,02620 -0,01449 0,07944 0,00699 17.03.2011 0,00361 0,00348 -0,01345 0,01471 0,03030 -0,01389 18.03.2011 -0,01079 -0,01042 -0,02727 -0,00483 -0,04202 0,00704 21.03.2011 0,00000 0,00702 0,00000 0,00000 -0,02632 -0,01049 22.03.2011 -0,03321 -0,02158 -0,03333 -0,01463 -0,03830 0,01413 23.03.2011 -0,02290 -0,02206 -0,04433 -0,01733 0,00000 0,01742 24.03.2011 0,01172 0,01504 0,06186 0,01008 0,01327 0,02397 25.03.2011 0,00772 -0,01481 0,02913 -0,00998 -0,00437 -0,00334 28.03.2011 -0,03065 -0,01880 -0,05189 -0,02015 -0,02632 0,01007 29.03.2011 0,01186 0,00383 0,01990 0,01028 0,03604 0,00000 30.03.2011 0,01563 0,00763 0,00000 0,01018 0,20870 0,03654 31.03.2011 0,01154 0,01136 0,00976 0,01008 -0,10791 0,02564 04.04.2011

149
APPENDIX A.4 : Composing Variance Matrix with Mathematica Codes

150
APPENDIX A.5 : Composing Correlation Matrix with Mathematica Codes
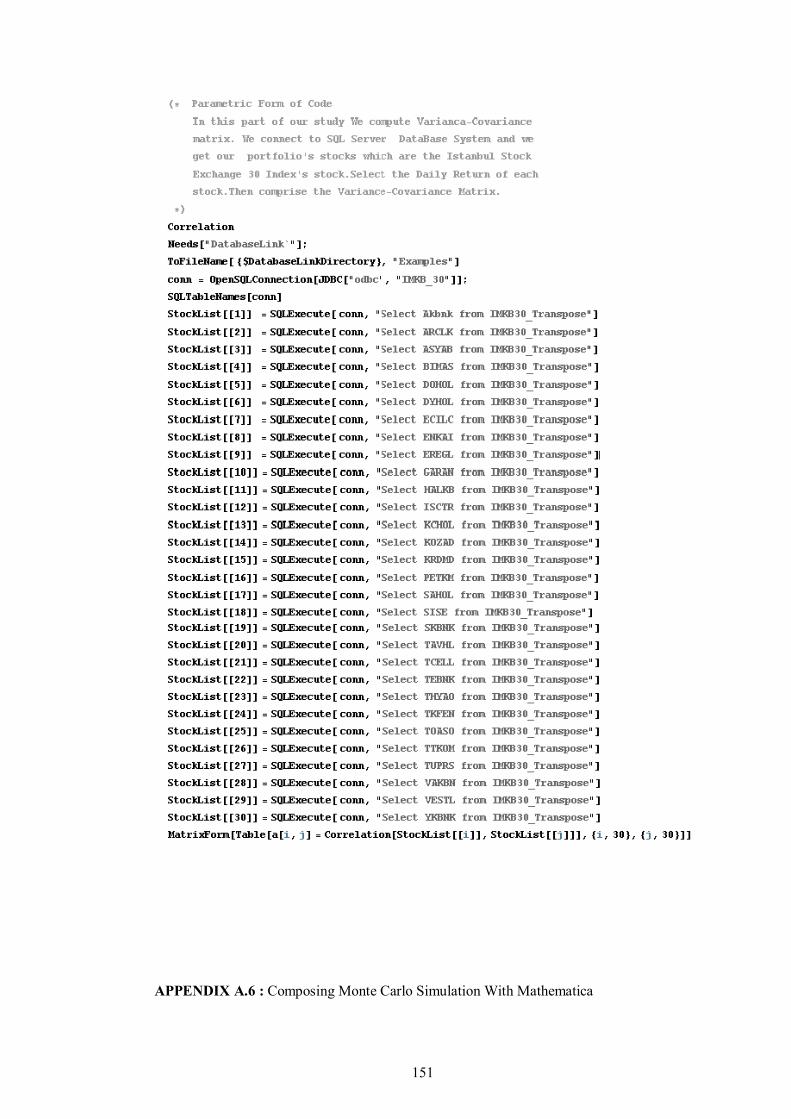
151
APPENDIX A.6 : Composing Monte Carlo Simulation With Mathematica

152
APPENDIX A.7 : Developing C# codes and interface for arranging form of data range
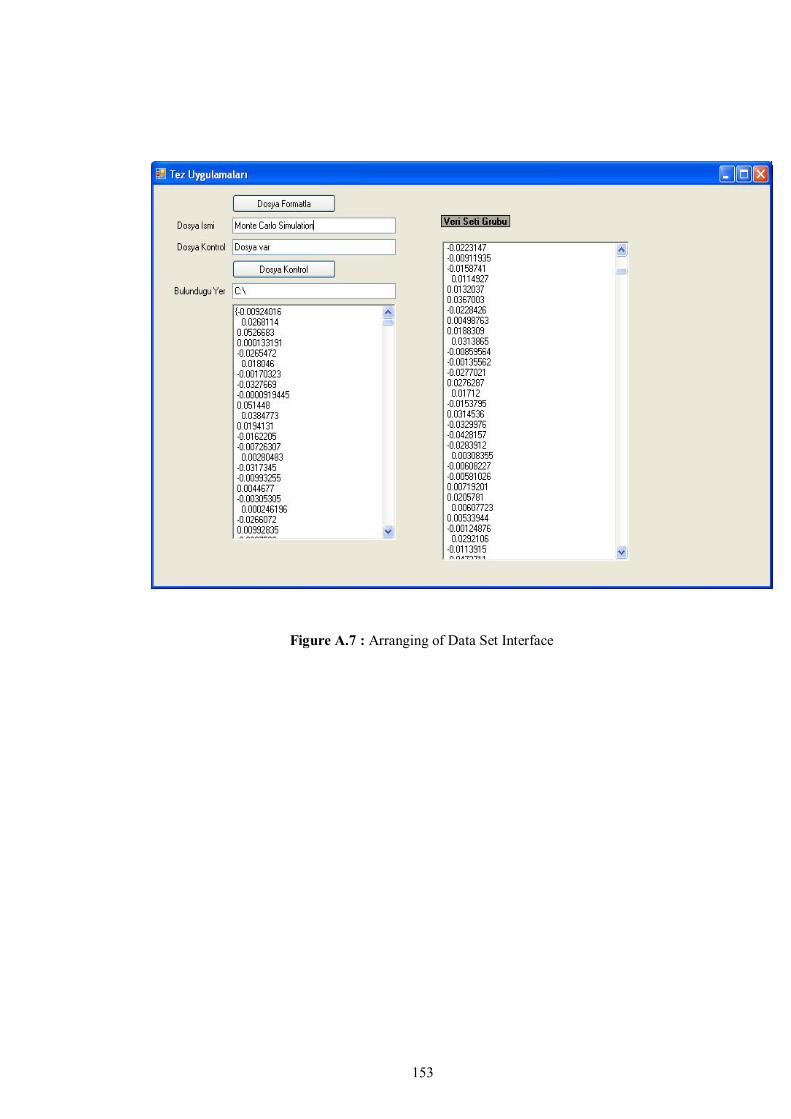
153
Figure A.7 : Arranging of Data Set Interface
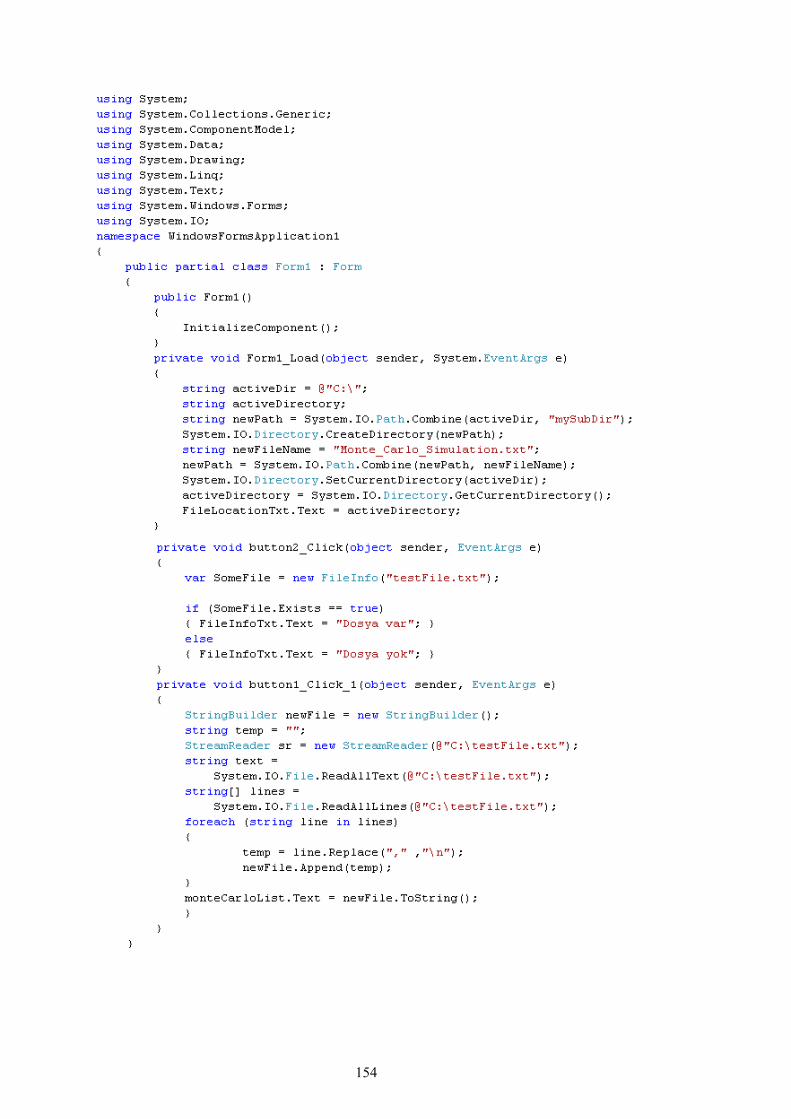
154

155

156
RESUME He was born in Istanbul in 1981. He was completed his high school education at Yeni Lise. Between 2001 and 2005 he had been in Mathematical Engineering in YildizTechni-cal University. Between 2006 and 2010 he had been in Finansbank it department. And Between 2010 and 2011 he had been in Akbank software department.


![Introduction - sites.math.washington.edubviray/papers/BELOV_Sporadic... · ABBEY BOURDON, OZLEM EJDER, YUAN LIU, ... concerning rational torsion of elliptic ... p.399]. The choice](https://img.pdfslide.net/doc/110x75/5b876dc67f8b9aa0218cb599/introduction-sitesmath-bviraypapersbelovsporadic-abbey-bourdon-ozlem.jpg)