Embed Size (px)
Citation preview
Standalone simulations:CAM3, CAM4 and CAM5
CAM5 Model Development TeamCécile Hannay, Rich Neale, Andrew Gettelman, Sungsu Park, Joe Tribbia, Peter Lauritzen, Andrew Conley, Hugh Morrison,
Phil Rasch, Steve Ghan, Xiaohong Liu, and many others
15th Annual CCSM Workshop, Breckenridge, June 28 - July 1, 2010
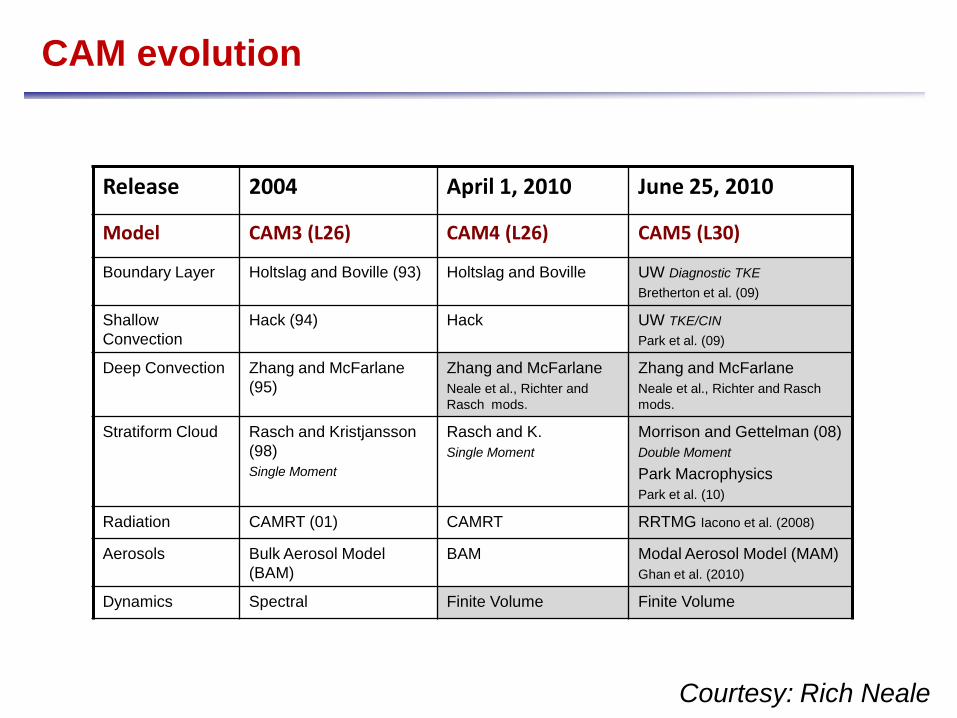
CAM evolution
Release 2004 April 1, 2010 June 25, 2010
Model CAM3 (L26) CAM4 (L26) CAM5 (L30)
Boundary Layer Holtslag and Boville (93) Holtslag and Boville UW Diagnostic TKE Bretherton et al. (09)
Shallow Convection
Hack (94) Hack UW TKE/CIN Park et al. (09)
Deep Convection Zhang and McFarlane (95)
Zhang and McFarlaneNeale et al., Richter and Rasch mods.
Zhang and McFarlaneNeale et al., Richter and Raschmods.
Stratiform Cloud Rasch and Kristjansson (98)Single Moment
Rasch and K.Single Moment
Morrison and Gettelman (08)Double Moment
Park MacrophysicsPark et al. (10)
Radiation CAMRT (01) CAMRT RRTMG Iacono et al. (2008)
Aerosols Bulk Aerosol Model (BAM)
BAM Modal Aerosol Model (MAM)Ghan et al. (2010)
Dynamics Spectral Finite Volume Finite Volume
Courtesy: Rich Neale
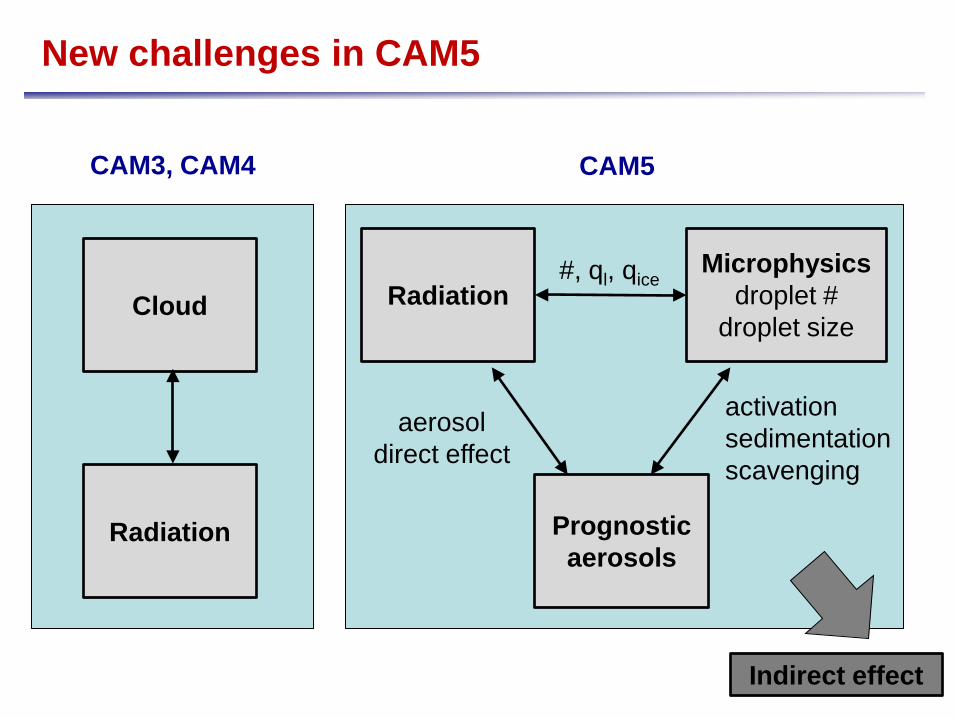
New challenges in CAM5
RadiationMicrophysics
droplet #droplet size
#, ql, qice
Prognostic aerosols
activationsedimentationscavenging
aerosol direct effect
Indirect effect
Cloud
Radiation
CAM3, CAM4 CAM5
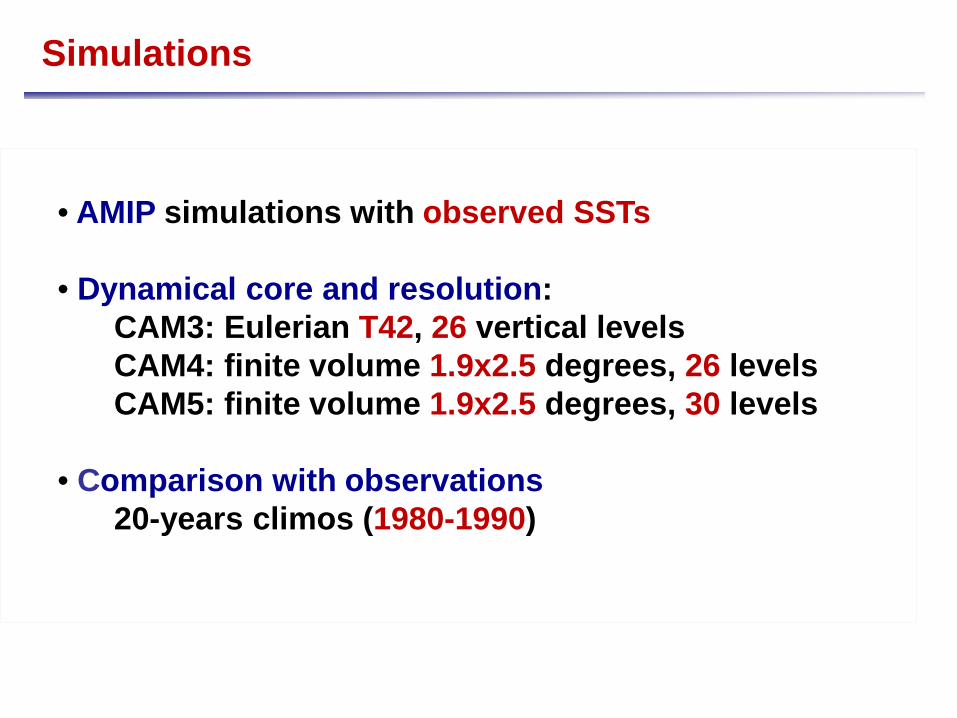
Simulations
• AMIP simulations with observed SSTs
• Dynamical core and resolution: CAM3: Eulerian T42, 26 vertical levelsCAM4: finite volume 1.9x2.5 degrees, 26 levelsCAM5: finite volume 1.9x2.5 degrees, 30 levels
• Comparison with observations20-years climos (1980-1990)
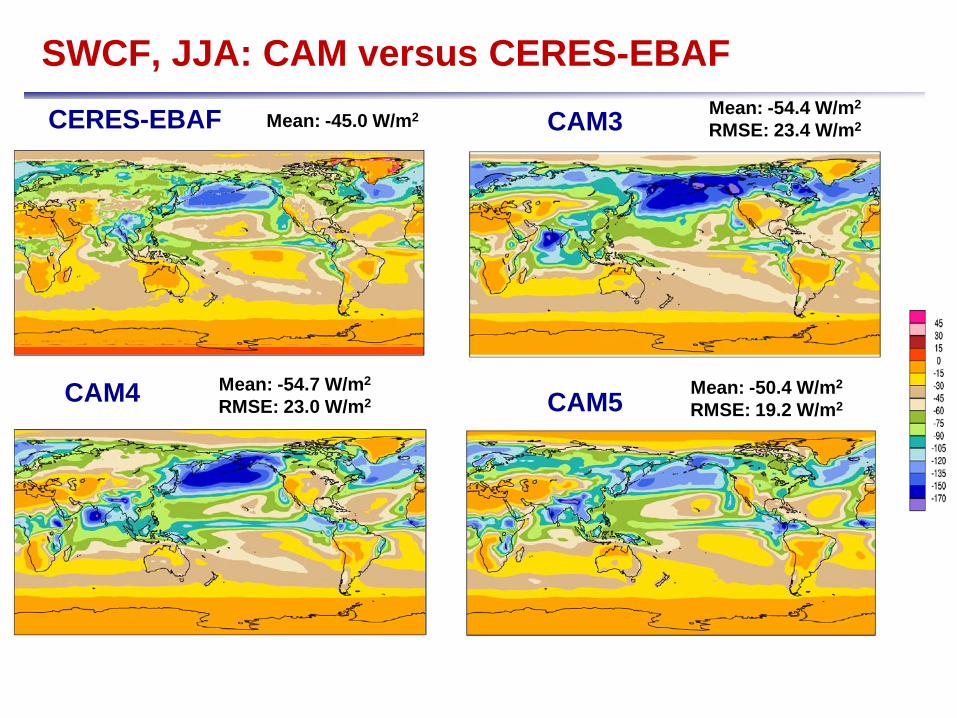
SWCF, JJA: CAM versus CERES-EBAFCAM3
CAM5CAM4
CERES-EBAF Mean: -45.0 W/m2 Mean: -54.4 W/m2
RMSE: 23.4 W/m2
Mean: -54.7 W/m2
RMSE: 23.0 W/m2 Mean: -50.4 W/m2
RMSE: 19.2 W/m2
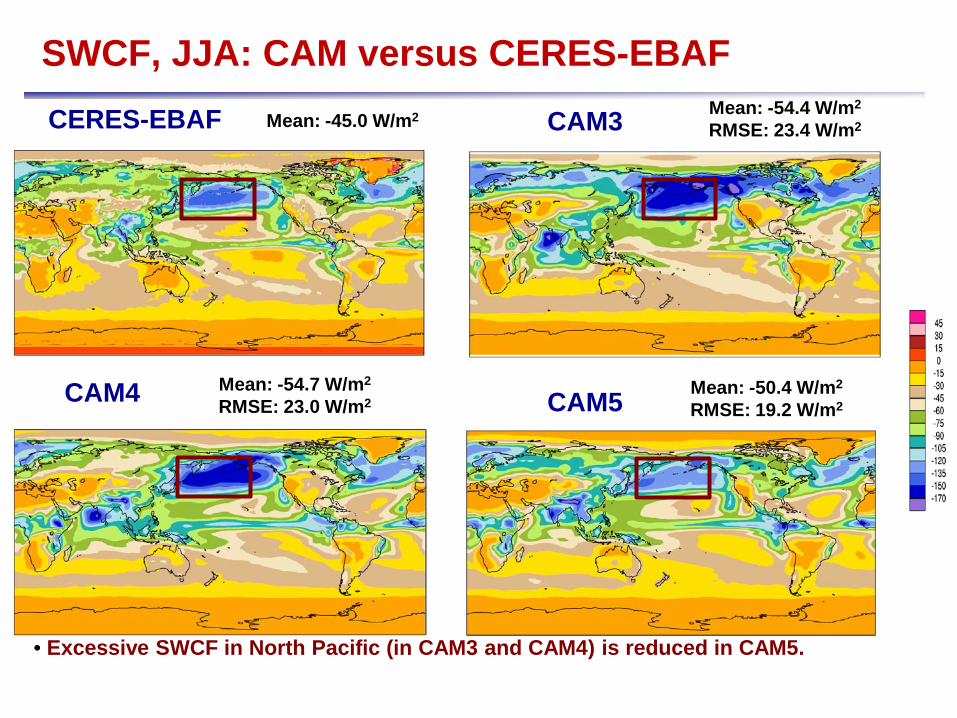
SWCF, JJA: CAM versus CERES-EBAFCAM3
CAM5CAM4
CERES-EBAF Mean: -45.0 W/m2 Mean: -54.4 W/m2
RMSE: 23.4 W/m2
Mean: -54.7 W/m2
RMSE: 23.0 W/m2 Mean: -50.4 W/m2
RMSE: 19.2 W/m2
• Excessive SWCF in North Pacific (in CAM3 and CAM4) is reduced in CAM5.
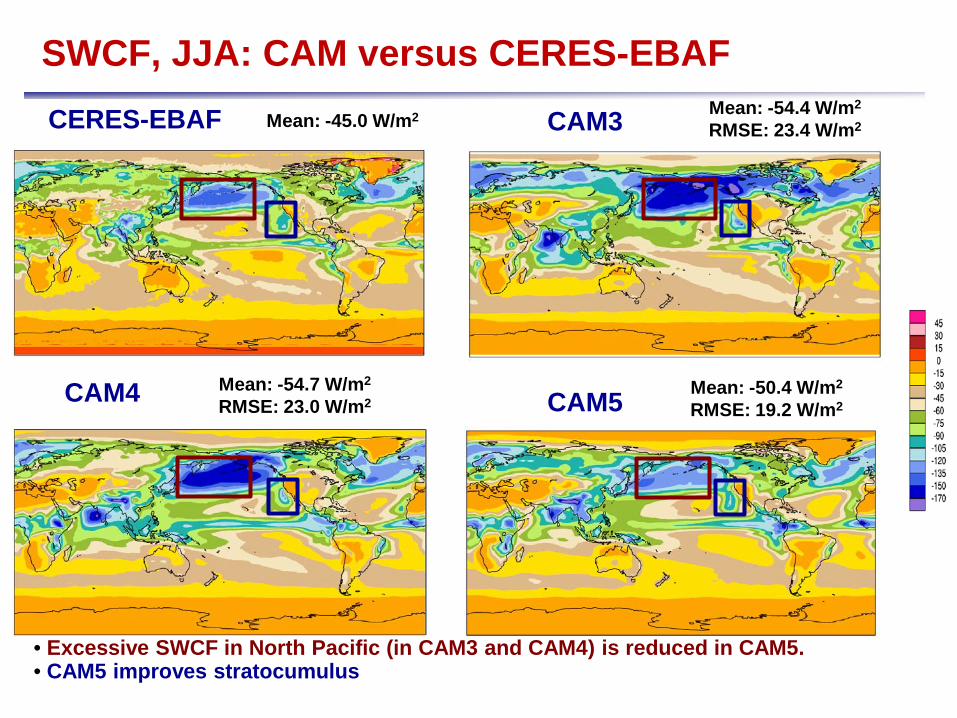
SWCF, JJA: CAM versus CERES-EBAFCAM3
CAM5CAM4
CERES-EBAF Mean: -45.0 W/m2 Mean: -54.4 W/m2
RMSE: 23.4 W/m2
Mean: -54.7 W/m2
RMSE: 23.0 W/m2 Mean: -50.4 W/m2
RMSE: 19.2 W/m2
• CAM5 improves stratocumulus • Excessive SWCF in North Pacific (in CAM3 and CAM4) is reduced in CAM5.
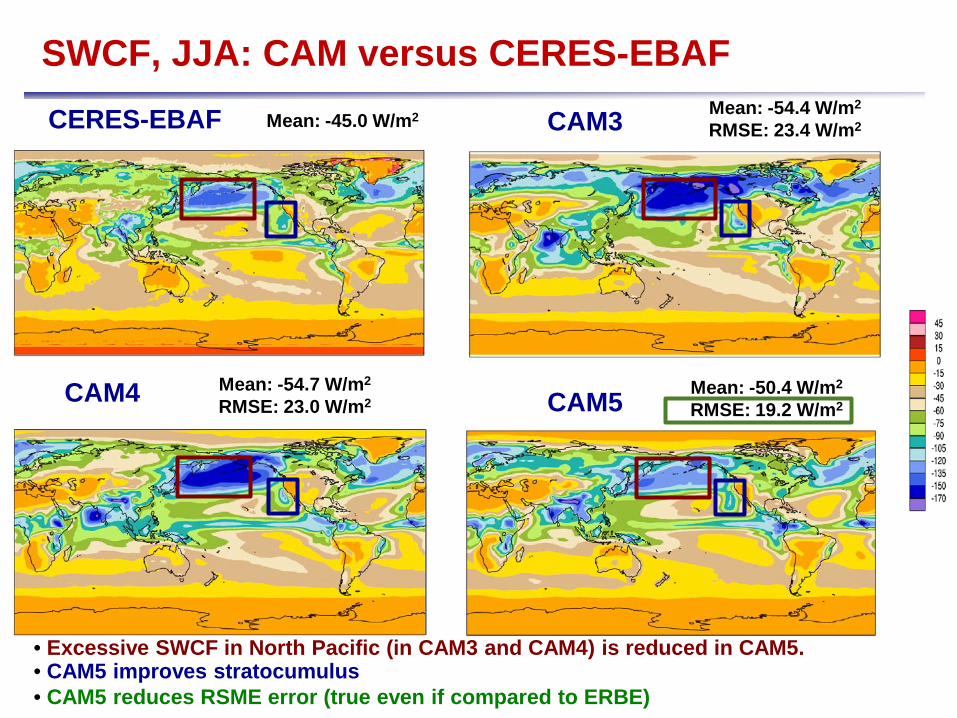
SWCF, JJA: CAM versus CERES-EBAFCAM3
CAM5CAM4
CERES-EBAF Mean: -45.0 W/m2 Mean: -54.4 W/m2
RMSE: 23.4 W/m2
Mean: -54.7 W/m2
RMSE: 23.0 W/m2 Mean: -50.4 W/m2
RMSE: 19.2 W/m2
• CAM5 improves stratocumulus • Excessive SWCF in North Pacific (in CAM3 and CAM4) is reduced in CAM5.
• CAM5 reduces RSME error (true even if compared to ERBE)
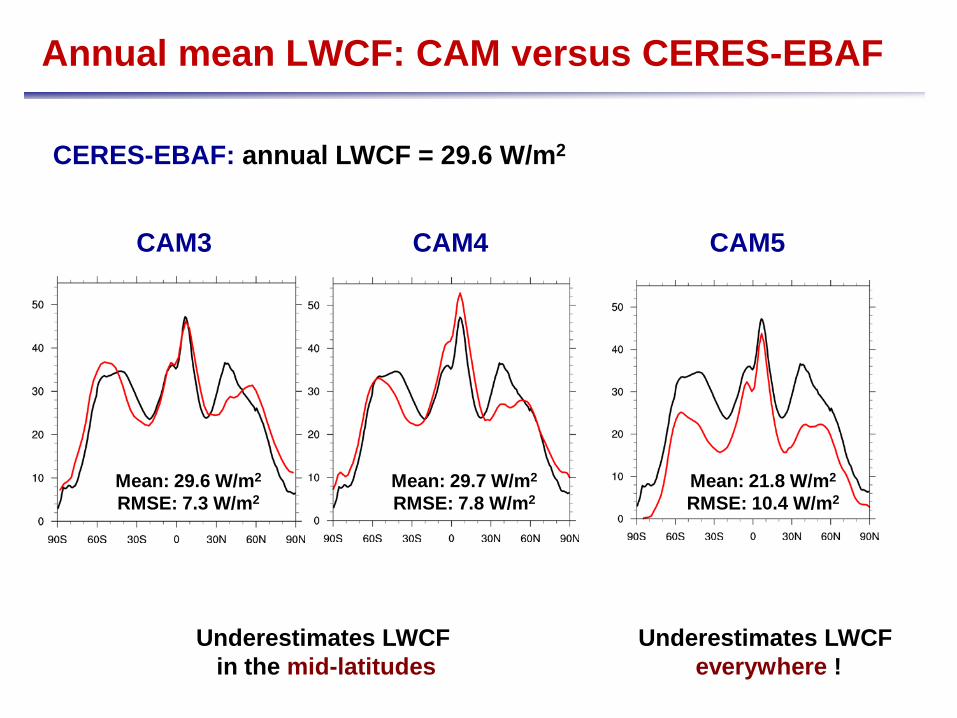
Annual mean LWCF: CAM versus CERES-EBAF
CAM4CAM3 CAM5
Underestimates LWCF in the mid-latitudes
Underestimates LWCF everywhere !
Mean: 29.6 W/m2
RMSE: 7.3 W/m2 Mean: 29.7 W/m2
RMSE: 7.8 W/m2 Mean: 21.8 W/m2
RMSE: 10.4 W/m2
CERES-EBAF: annual LWCF = 29.6 W/m2
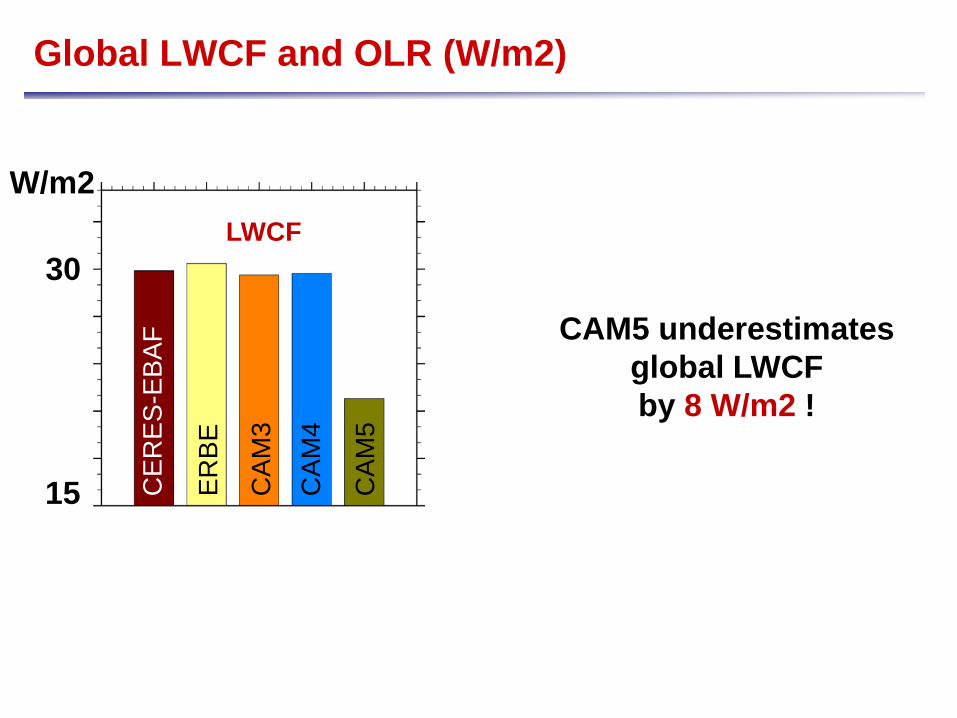
Global LWCF and OLR (W/m2)
CAM5 underestimates global LWCFby 8 W/m2 !
30
CER
ES-E
BAF
ERBE
CAM
4
CAM
5
CAM
3 LWCF
15
W/m2
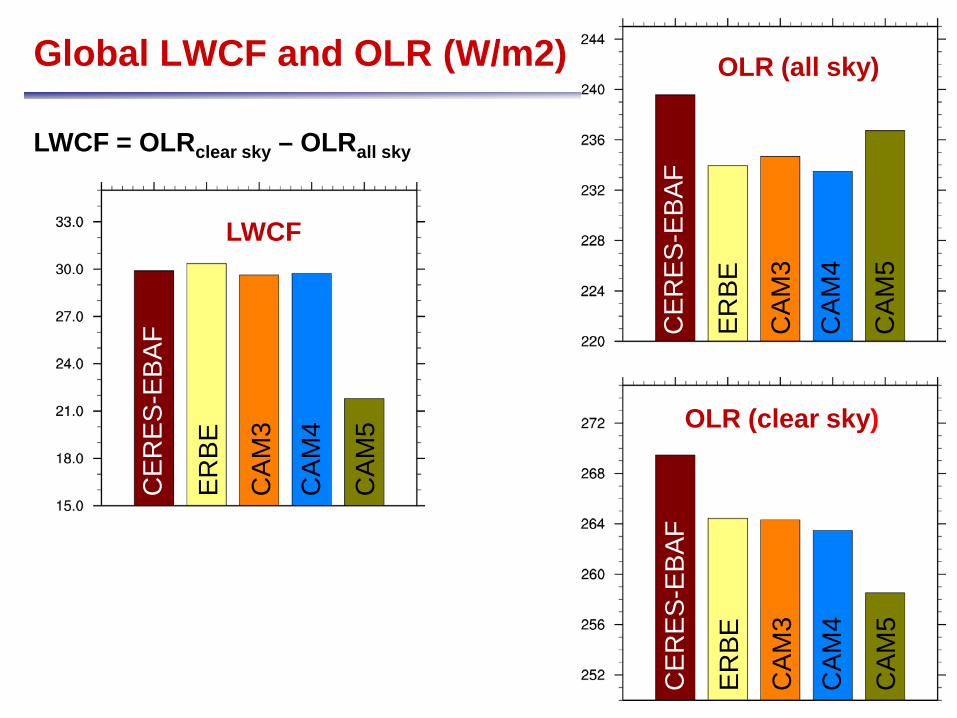
Global LWCF and OLR (W/m2)
LWCF = OLRclear sky – OLRall skyC
ERES
-EBA
F
ERBE
CAM
4
CAM
5
CAM
3
CER
ES-E
BAF
ERBE
CAM
4
CAM
5
CAM
3
CER
ES-E
BAF
ERBE
CAM
4
CAM
5
CAM
3
LWCF
OLR (clear sky)
OLR (all sky)
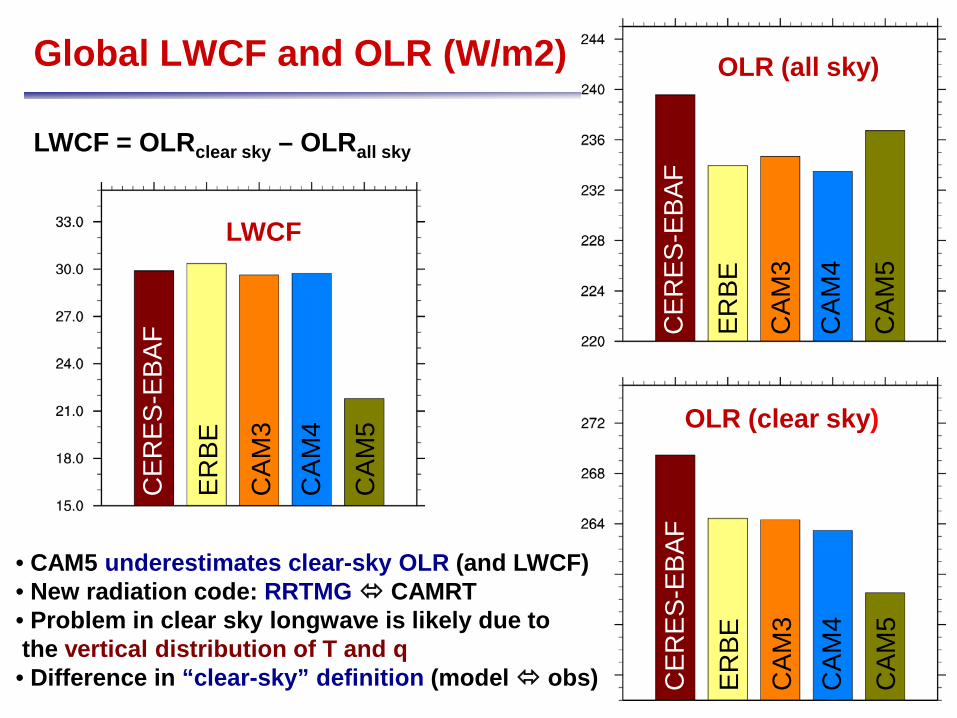
Global LWCF and OLR (W/m2)
LWCF = OLRclear sky – OLRall sky
• CAM5 underestimates clear-sky OLR (and LWCF) • New radiation code: RRTMG CAMRT• Problem in clear sky longwave is likely due to the vertical distribution of T and q• Difference in “clear-sky” definition (model obs)
CER
ES-E
BAF
ERBE
CAM
4
CAM
5
CAM
3
CER
ES-E
BAF
ERBE
CAM
4
CAM
5
CAM
3
CER
ES-E
BAF
ERBE
CAM
4
CAM
5
CAM
3
LWCF
OLR (clear sky)
OLR (all sky)
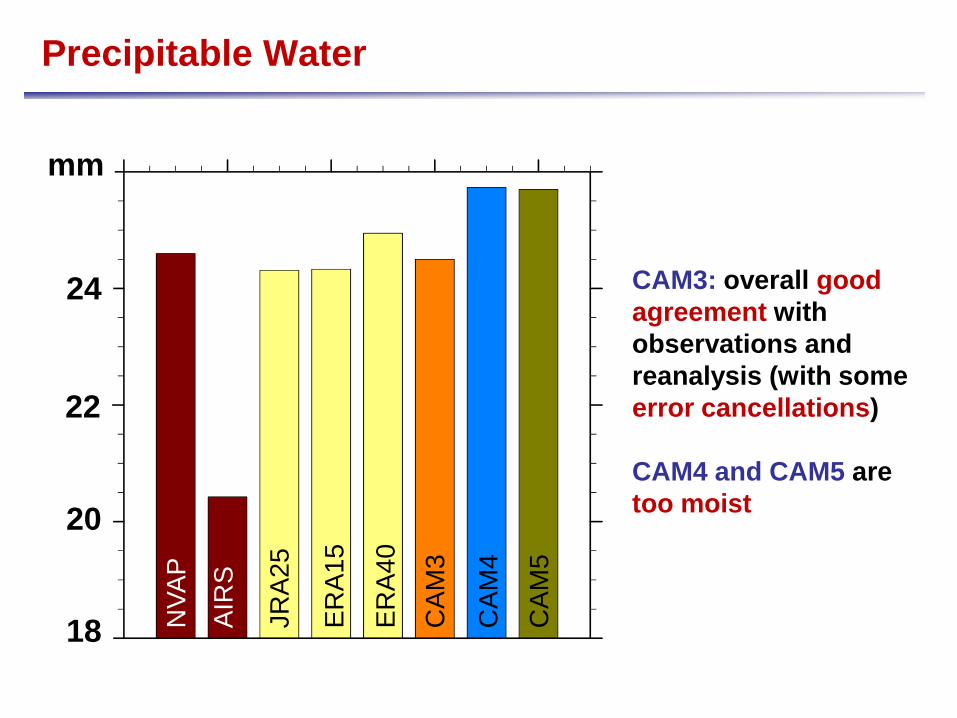
Precipitable Water
CAM3: overall good agreement withobservations and reanalysis (with some error cancellations)
CAM4 and CAM5 are too moist
NVA
P
ERA4
0
CAM
4
CAM
5
CAM
3
AIR
S
ERA1
5
JRA2
524
22
20
18
mm

Precipitation, DJF: CAM versus CMAP (Xie-Arkin)
CAM3-CMAP
CAM5-CMAPCAM4-CMAP
CMAP Mean: 3.19 mm/day Mean: 3.28 mm/dayRMSE: 1.80 mm/day
Mean: 3.45 mm/dayRMSE: 1.80 mm/day
Mean: 3.57 mm/day RMSE: 1.46 mm/day
• CAM3: performs fairly well in the mean but error cancellations • Improved RMSE in CAM5
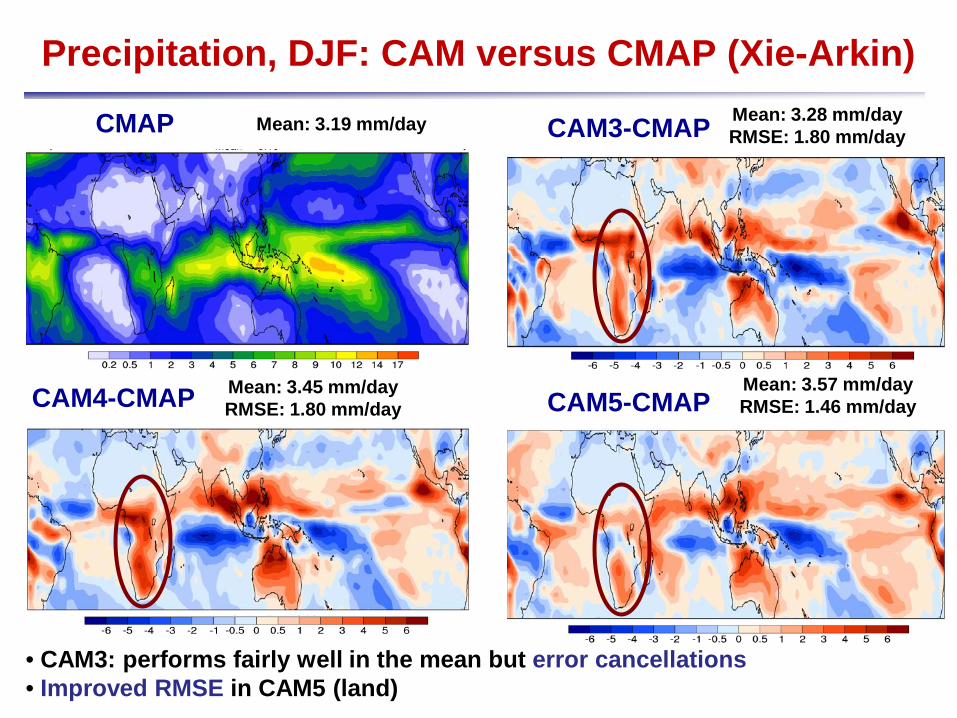
Precipitation, DJF: CAM versus CMAP (Xie-Arkin)
CAM3-CMAP
CAM5-CMAPCAM4-CMAP
CMAP Mean: 3.19 mm/day Mean: 3.28 mm/dayRMSE: 1.80 mm/day
Mean: 3.45 mm/dayRMSE: 1.80 mm/day
Mean: 3.57 mm/day RMSE: 1.46 mm/day
• CAM3: performs fairly well in the mean but error cancellations • Improved RMSE in CAM5 (land)
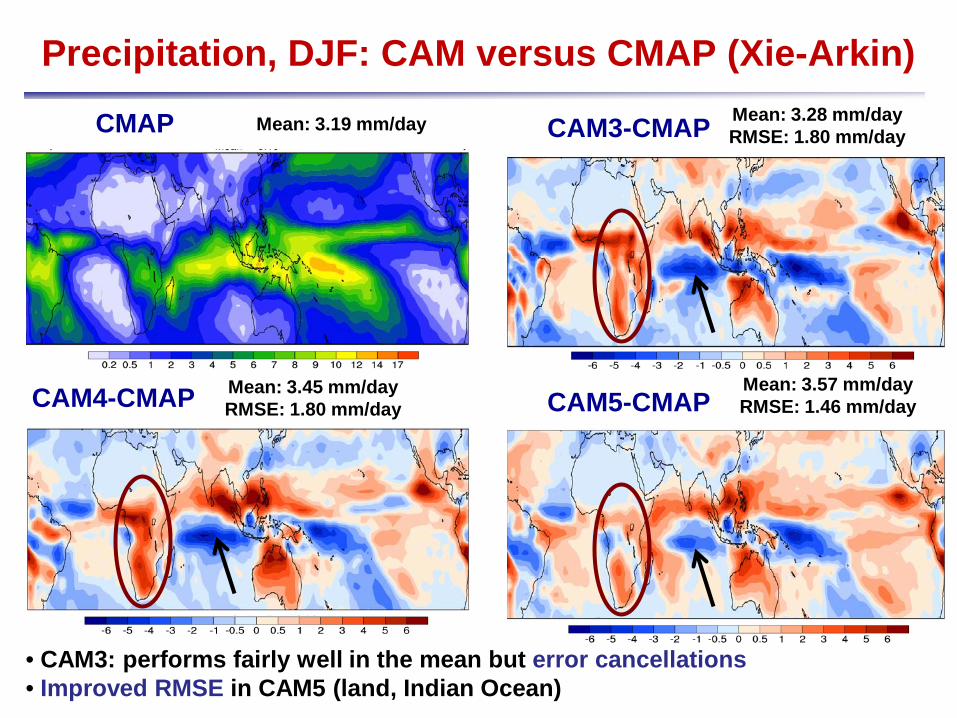
Precipitation, DJF: CAM versus CMAP (Xie-Arkin)
CAM3-CMAP
CAM5-CMAPCAM4-CMAP
CMAP Mean: 3.19 mm/day Mean: 3.28 mm/dayRMSE: 1.80 mm/day
Mean: 3.45 mm/dayRMSE: 1.80 mm/day
Mean: 3.57 mm/day RMSE: 1.46 mm/day
• CAM3: performs fairly well in the mean but error cancellations • Improved RMSE in CAM5 (land, Indian Ocean)
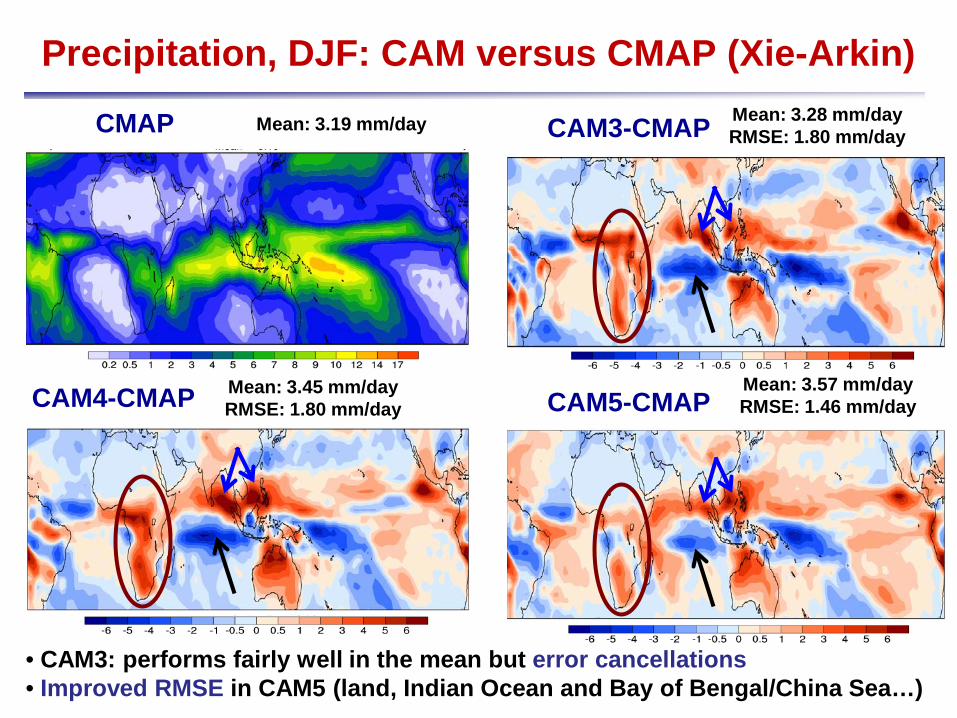
Precipitation, DJF: CAM versus CMAP (Xie-Arkin)
CAM3-CMAP
CAM5-CMAPCAM4-CMAP
CMAP Mean: 3.19 mm/day Mean: 3.28 mm/dayRMSE: 1.80 mm/day
Mean: 3.45 mm/dayRMSE: 1.80 mm/day
Mean: 3.57 mm/day RMSE: 1.46 mm/day
• CAM3: performs fairly well in the mean but error cancellations • Improved RMSE in CAM5 (land, Indian Ocean and Bay of Bengal/China Sea…)
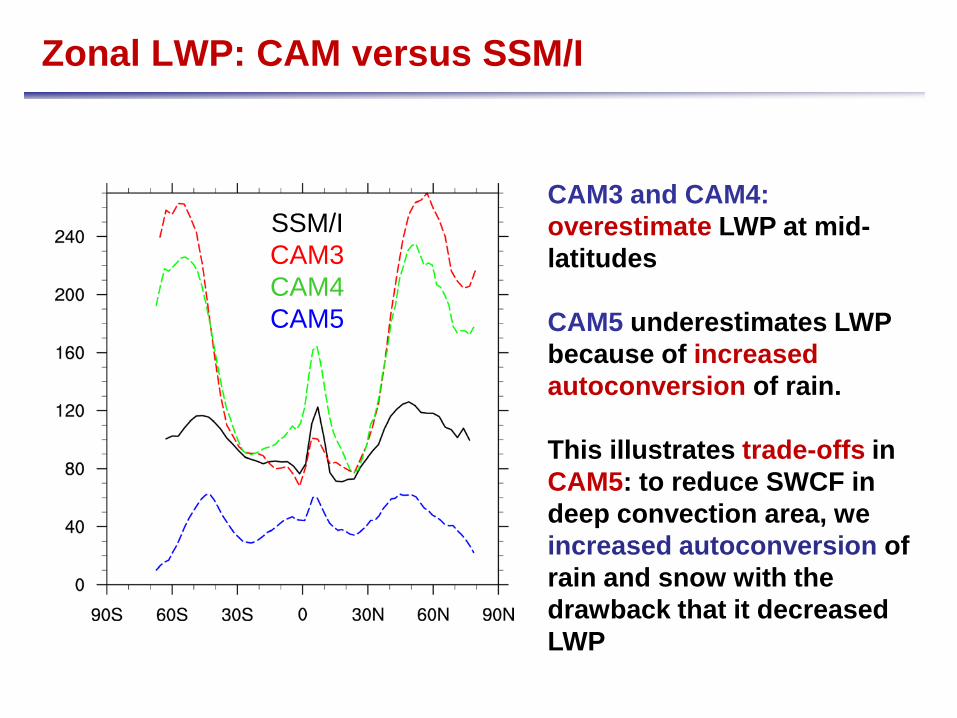
Zonal LWP: CAM versus SSM/I
SSM/ICAM3CAM4CAM5
CAM3 and CAM4: overestimate LWP at mid-latitudes
CAM5 underestimates LWP because of increased autoconversion of rain.
This illustrates trade-offs in CAM5: to reduce SWCF in deep convection area, we increased autoconversion of rain and snow with the drawback that it decreased LWP
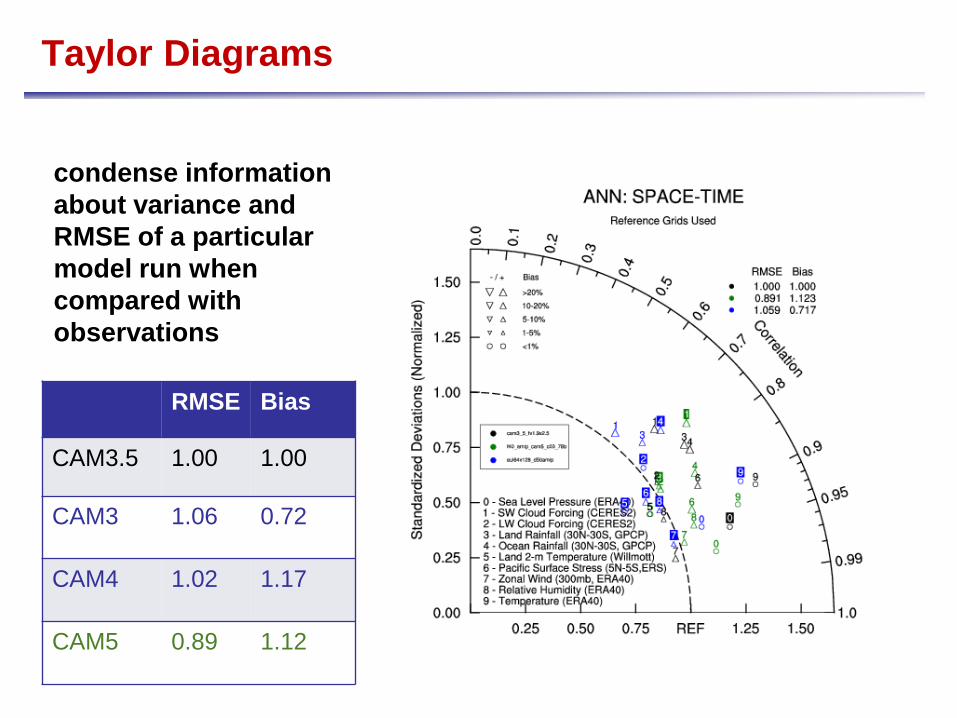
Taylor Diagrams
RMSE Bias
CAM3.5 1.00 1.00
CAM3 1.06 0.72
CAM4 1.02 1.17
CAM5 0.89 1.12
condense information about variance and RMSE of a particular model run when compared with observations
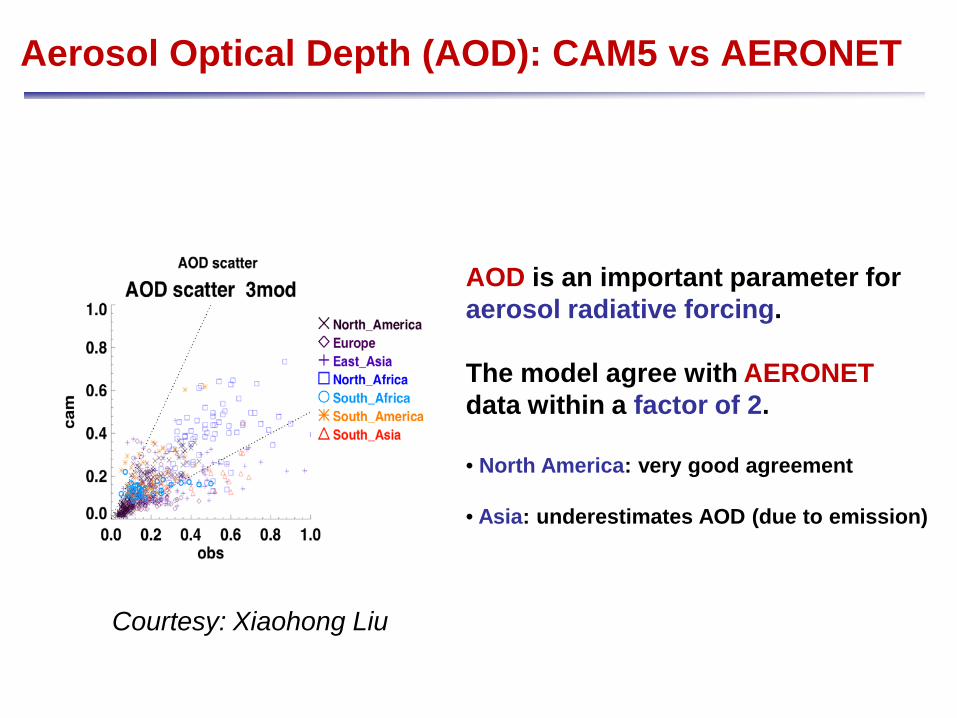
Aerosol Optical Depth (AOD): CAM5 vs AERONET
AOD is an important parameter for aerosol radiative forcing.
The model agree with AERONETdata within a factor of 2.
• North America: very good agreement
• Asia: underestimates AOD (due to emission)
Courtesy: Xiaohong Liu
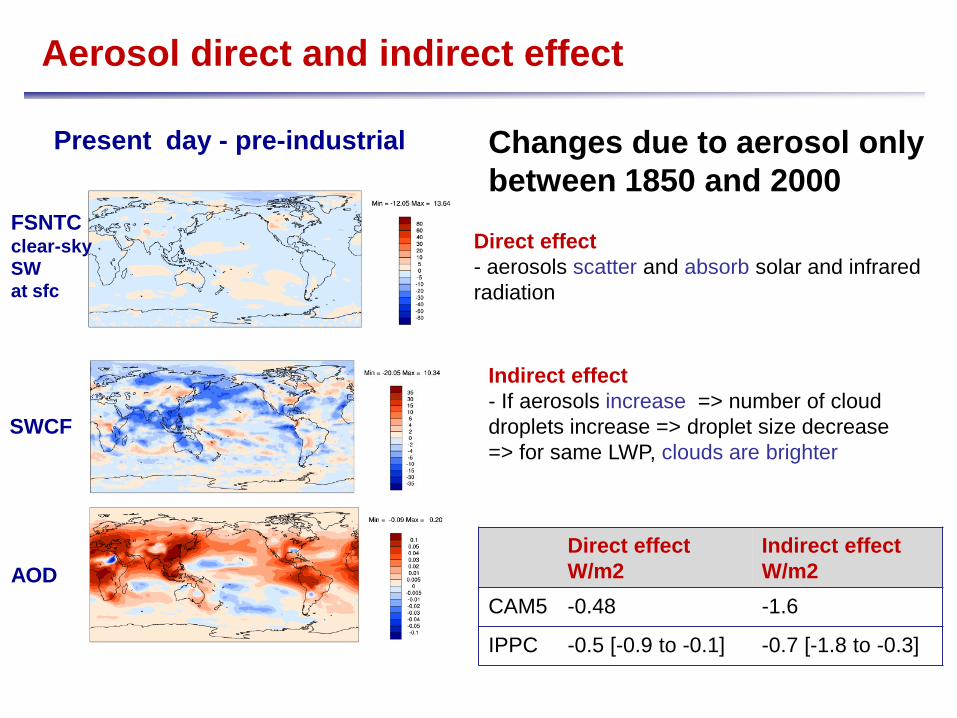
Aerosol direct and indirect effect
Present day - pre-industrial
AOD
SWCF
FSNTCclear-sky SW at sfc
Direct effect- aerosols scatter and absorb solar and infrared radiation
Indirect effect- If aerosols increase => number of cloud droplets increase => droplet size decrease=> for same LWP, clouds are brighter
Direct effectW/m2
Indirect effectW/m2
CAM5 -0.48 -1.6
IPPC -0.5 [-0.9 to -0.1] -0.7 [-1.8 to -0.3]
Changes due to aerosol onlybetween 1850 and 2000
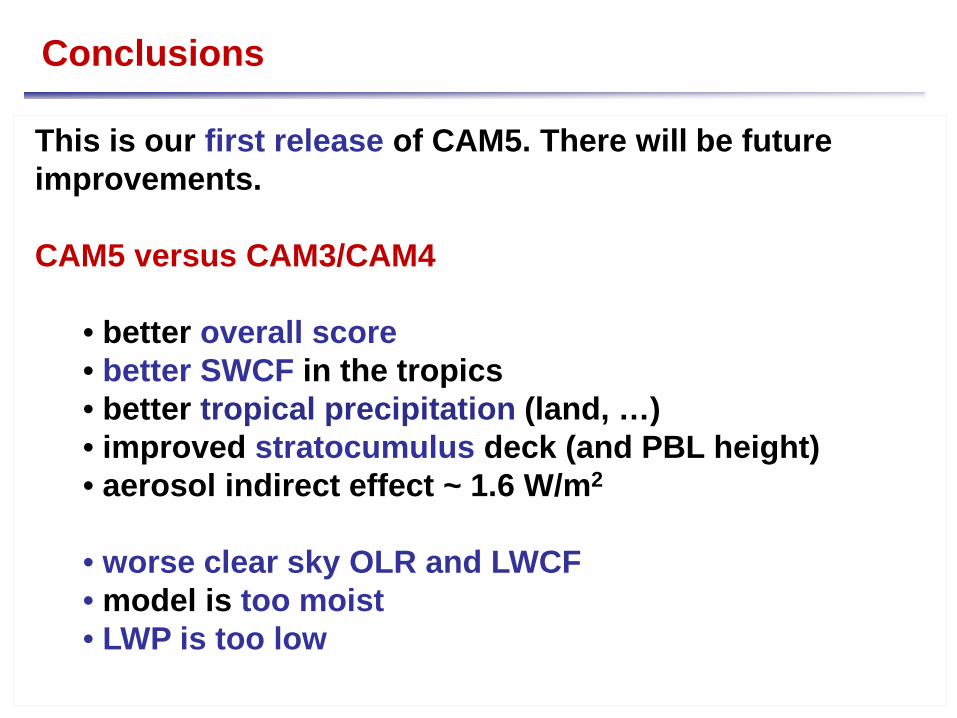
Conclusions
This is our first release of CAM5. There will be future improvements.
CAM5 versus CAM3/CAM4
• better overall score • better SWCF in the tropics • better tropical precipitation (land, …)• improved stratocumulus deck (and PBL height)• aerosol indirect effect ~ 1.6 W/m2
• worse clear sky OLR and LWCF• model is too moist• LWP is too low

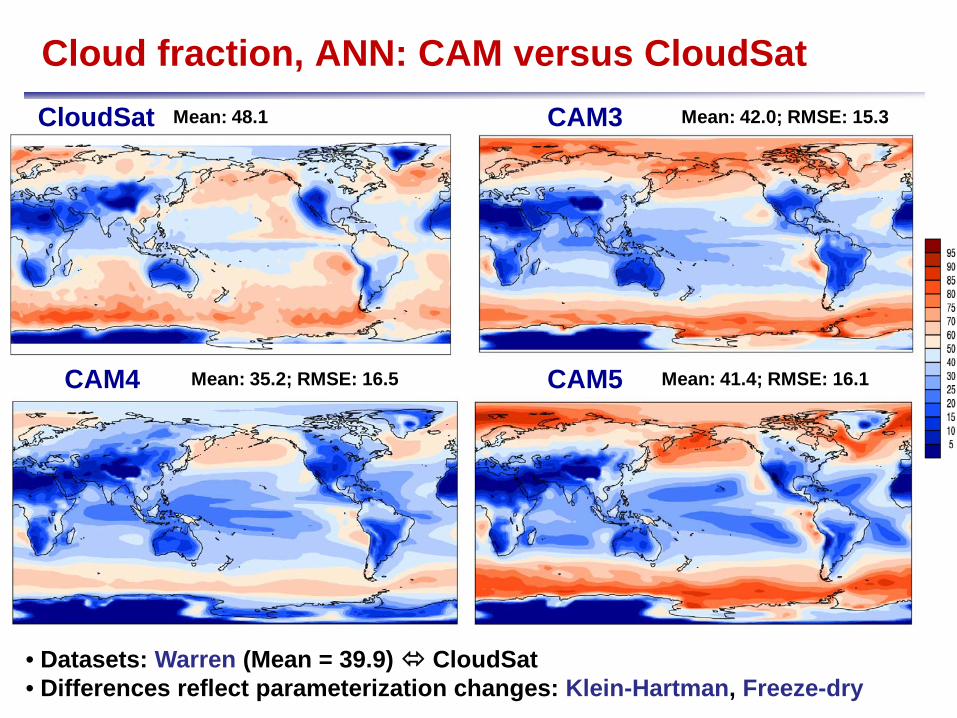
Cloud fraction, ANN: CAM versus CloudSatCAM3
CAM5CAM4
CloudSat Mean: 48.1 Mean: 42.0; RMSE: 15.3
Mean: 35.2; RMSE: 16.5 Mean: 41.4; RMSE: 16.1
• Datasets: Warren (Mean = 39.9) CloudSat• Differences reflect parameterization changes: Klein-Hartman, Freeze-dry