Embed Size (px)
Citation preview
Standard Bank International Funds Limited
Annual Report and Audited Financial Statements
For the year ended 30 September 2017
Standard Bank International Funds Limited
1
Annual Report and Audited Financial Statements
For the year ended 30 September 2017
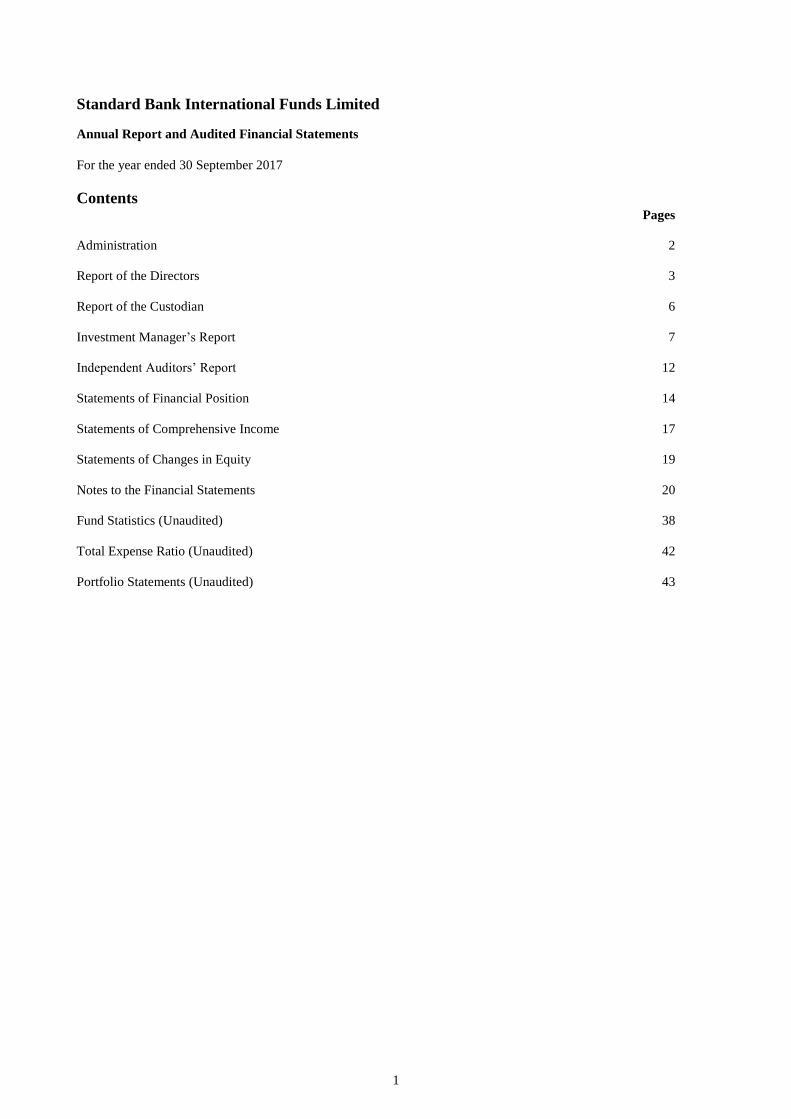
Contents Pages
Administration 2
Report of the Directors 3
Report of the Custodian 6
Investment Manager’s Report 7
Independent Auditors’ Report 12
Statements of Financial Position 14
Statements of Comprehensive Income 17
Statements of Changes in Equity 19
Notes to the Financial Statements 20
Fund Statistics (Unaudited) 38
Total Expense Ratio (Unaudited) 42
Portfolio Statements (Unaudited) 43
Standard Bank International Funds Limited
2
Administration
Directors Graham Baillie (Chairman) (South African)
Michael Farrow* (British)
Helen Holmes (British)
Oliver Sonnbichler (South African)
Sub-Custodian and Banker The Bank of New York Mellon SA/NV London Branch
The Bank of New York Mellon Centre
160 Queen Victoria Street
London EC4V 4LA
United Kingdom
Registered Office Standard Bank House
47 - 49 La Motte Street
St. Helier
Jersey JE2 4SZ
Channel Islands
Administrator BNY Mellon Fund Services (Ireland) Designated Activity Company
One Dockland Central, Guild Street
International Financial Services Centre
Dublin 1
Ireland
Manager and Secretary STANLIB Fund Managers Jersey Limited
Standard Bank House
47 - 49 La Motte Street
St. Helier
Jersey JE2 4SZ
Channel Islands
Independent Auditors PricewaterhouseCoopers
One Spencer Dock
North Wall Quay
Dublin 1
Ireland
Investment Manager Standard Bank International Investments Limited
Standard Bank House
47 - 49 La Motte Street
St. Helier
Jersey JE2 4SZ
Channel Islands
Legal Adviser Ogier
Ogier House
The Esplanade
St. Helier
Jersey JE4 9WG
Channel Islands
Custodian Link Corporate Services (Jersey) Limited
1
12 Castle Street
St. Helier
Jersey JE2 3RT
Channel Islands
* Independent Non-Executive Director 1
Please see Note 12
Standard Bank International Funds Limited
3
Report of the Directors
The directors submit their annual report and audited financial statements for the year ended 30 September 2017.
Incorporation
Standard Bank International Funds Limited (the “Company” or “Fund”) is an ‘Umbrella Fund’ and an open-ended
investment Company incorporated in Jersey on 24 September 1999 with limited liability under the Law and holds a
fund certificate issued pursuant to the Collective Investment Funds (Jersey) Law 1988 and is regulated by the Jersey
Financial Services Commission (“JFSC”). Participating shares may be issued and redeemed at prices based upon each
Class’s underlying net asset value.
Structure
The Company offers investors a choice of classes (each such class being referred to as a “Class Fund”) and the
opportunity to switch from one Class Fund to another. As at 30 September 2017 there are six Class Funds available, see
Objective and investment policy section for more details.
The assets, liabilities, income and expenses attributable to each class of participating share are applied to the Class
Fund established for that class. If they are not attributable to any particular class of participating shares, they are
allocated between all the Class Funds in such manner as the directors deem to be equitable. The Company is a single
legal entity. As a result, although the assets, income, earnings, liabilities and expenses attributable to each Class Fund
will be segregated and kept separate from those attributable to other Class Funds, in the event of the Company not
being able to meet the liabilities attributable to any particular Class Fund out of the assets of such Class Fund, the
excess liabilities may be met out of the assets attributable to other Class Funds.
Objective and investment policy
The objective of the Company is to provide investors with a worldwide range of investment opportunities, which are
professionally managed, with the aim of achieving long-term growth through capital gains and accumulation of income.
The Company offers investors a choice of classes of Participating Shares each such class being designated by reference
to a separate investment portfolio referred to as a “Class Fund”.
There are currently six Class Funds within the Company.
The Multi Manager Global Equity Class Funds USD & GBP are ‘fund of funds’ which only invest in collective
investment funds and are designed to provide long term capital appreciation through investment solely in equity
oriented funds with a bias towards the domestic markets of the base currency of each Class Fund. The Investment
Manager will look to maintain a fully invested equity strategy at all times. These aggressive portfolios are suited to
investors seeking the longer-term reward of equity investment and are prepared to accept the higher level of volatility
normally associated with this type of investment.
The Multi Manager Global Balanced Class Funds USD & GBP are ‘fund of funds’ which only invest in other collective
investment funds and are designed to provide long term capital appreciation through investment in a broad range of
funds covering primarily equity and fixed income asset classes and cash. These aggressive portfolios are suited to
investors seeking the longer term reward of equity investment and are prepared to accept the higher level of volatility
normally associated with this type of investment.
The Multi Manager Absolute Return Class Funds USD & GBP are ‘fund of funds’ which invest in collective
investment funds and are designed to provide long term capital growth through investing in a broad range of funds
covering primarily alternative, fixed income and multi asset strategies, together with inflation-linked real return
strategies. These conservative portfolios are suited to investors seeking returns in excess of inflation with a low level of
volatility.
Each Class Fund may enter into derivatives for the purpose of efficient portfolio management.
Standard Bank International Funds Limited
4
Report of the Directors (continued)
Results and dividends
The results for the year are set out in the Statements of Comprehensive Income on pages 17 and 18. The Company’s
present policy is to accumulate income and as such the Company has not declared or paid a dividend in respect of the
year from 1 October 2016 to 30 September 2017 or 1 October 2015 to 30 September 2016.
Directors
The directors of the Company are set out on page 2.
Graham Baillie is also director of Standard Bank International Investments Limited and Chairman of Melville Douglas
Investment Management (Proprietary) Limited. Helen Holmes is also director of Standard Bank International
Investments Limited, Oliver Sonnbichler is an executive of Melville Douglas Investment Management (Proprietary)
Limited and Michael Farrow is an independent Non-Executive Director.
No director has a service contract with the Company or holds any interest in the capital of the Company.
Statement of Director’s Responsibilities
The directors are responsible for preparing the financial statements in accordance with applicable Jersey law and
United Kingdom Accounting Standards (United Kingdom Generally Accepted Accounting Practice “UK GAAP”),
including Financial Reporting Standard (“FRS”) 102 “The Financial Reporting Standard applicable in the United
Kingdom and Republic of Ireland” (“FRS 102”).
The Companies (Jersey) Law, 1991 requires the directors to prepare the financial statements for each financial year,
which give a true and fair view of the state of affairs of the Company and of the profit and loss of the Company for that
year. In preparing those financial statements, the directors should:
- select suitable accounting policies and then apply them consistently;
- make judgements and estimates that are reasonable and prudent;
- state whether applicable accounting standards have been followed, subject to any material departures disclosed
and explained in the financial statements; and
- prepare the financial statements on the going concern basis unless it is inappropriate to presume that the
Company will continue in operation.
The directors confirm that they have complied with all of the above requirements in preparing the financial statements.
The directors are responsible for keeping proper accounting records, which disclose with reasonable accuracy at any
time the financial position of the Company and enable them to ensure that the financial statements comply with the
Companies (Jersey) Law 1991. They have general responsibility for taking such steps as are reasonably open to them to
safeguard the assets of the Company and to prevent and detect fraud and other irregularities.
So far as the directors are aware, there is no relevant audit information of which the Company's auditors are unaware,
and each director has taken all the steps that he or she ought to have taken as a director in order to make himself or
herself aware of any relevant audit information and to establish that the Company's auditors are aware of that
information.
Connected Persons
The directors are satisfied that there are arrangements in place to ensure that transactions with connected persons
entered into during the year were carried out as if negotiated at arm’s length and were in the best interests of
shareholders.
Standard Bank International Funds Limited
5
Report of the Directors (continued)
Independent Auditors
PricewaterhouseCoopers Ireland have indicated their willingness to continue in office. A resolution to reappoint
PricewaterhouseCoopers Ireland as independent auditors of the Company will be proposed at the annual general
meeting. A copy of the Notice of the Annual Form of Proxy General Meeting is attached and forms part of these
financial statements.
Secretary
The Secretary of the Company during the year ended 30 September 2017 and subsequently was STANLIB Fund
Managers Jersey Limited.
By Order of the Board
STANLIB Fund Managers Jersey Limited
Company Secretary
10 January 2018
Standard Bank International Funds Limited
6
Report of the Custodian
To the members of Standard Bank International Funds Limited.
The Custodian is responsible for the safekeeping of all the property of the Company which is entrusted to it, as
prescribed in the Custodian Agreement.
Under the principles of the Guide to open-ended unclassified collective investment funds offered to the general public
(the "OCIF Guide"), issued by the Jersey Financial Services Commission, the Custodian has a duty to take reasonable
care to ensure that the methods adopted by the Company's Manager in respect to the pricing of, and dealing in, shares
in the Company are compliant with the Company's principal documents.
It is the opinion of Link Corporate Services (Jersey) Limited in respect of the year ended 30 September 2017 that to the
best of our information, knowledge and belief, that in all material respects, the Manager managed the Class Funds in
that year:
a) in accordance with the limitations imposed on the investment and borrowing powers of the Company by the Articles
of Association and Prospectus and;
b) otherwise in accordance with the provisions of the Management and Custodian Agreements.
Link Corporate Services (Jersey) Limited
Custodian
10 January 2018
Standard Bank International Funds Limited
7
Investment Manager’s Report
Performance Commentary
Multi Manager Global Equity Funds
Investment objective:
To provide long-term capital appreciation through investment solely in equity-orientated funds. The manager will look
to maintain a fully invested strategy at all times. A minimum exposure of 40% to larger capitalised shares means that
the manager can position the fund significantly away from that of the peer group or benchmark in order to optimise
performance. It is therefore suited to investors who are willing to accept the higher level of volatility associated with a
fund of this flexibility.
Quantitative analysis:
US Dollar Class
For the period under review; the ‘C’ Share Class return was 19.05%, the ‘B’ Share Class return was 18.75%, the ‘A’
Share Class return was 18.37%. The Fund’s benchmark is the FTSE All World Total Return Net Index in US dollars;
the benchmark’s return was 18.68%.
Sterling Class
For the period under review; the ‘C’ Share Class return was 16.79%, the ‘B’ Share Class return was 16.49%, the ‘A’
Share Class return was 16.10%. The Fund’s benchmark is composed of 40% FTSE UK Total Return Net Index in
Sterling and 60% FTSE All World Total Return Net Index in sterling. The benchmark return was 13.32% for the
period.
Commentary:
Equity markets posted strong gains throughout the year in review, with many indices hitting new all-time highs during
the period. This is against a backdrop of ongoing political uncertainty, with Donald Trump’s surprise US Presidential
election victory, increasing support for populist political parties and rising geopolitical tensions, all with the potential to
disrupt markets. Nevertheless, investor sentiment remains buoyant and economic data continues to evidence robust and
synchronised global growth. Corporate results have, if anything, surprised to the upside and we note that solid earnings
growth has been driven by top line sales’ expansion rather than share buybacks or accounting efficiencies and again,
this seems to be a relatively synchronised global trend.
Both currency classes of the Global Equity Fund posted solid absolute returns for the period, with the US dollar share
classes performing broadly in line with benchmark net of fees, while the Sterling share classes comfortably beat
benchmark.
The difference between the currency share classes is the proportion allocated to the base currency market, and the
reason the Sterling classes outperformed was predominantly due to the significantly larger allocation to UK managers,
who have rebounded strongly in the aftermath of the Brexit vote. The UK small and mid cap managers were
particularly successful, with Aberforth gaining 25.8% and Old Mutual soaring 34.3% in Sterling terms.
Reviewing the performance over the year we note that around two thirds of our managers outperformed and that on a
regional basis the overweight allocations to Japan and emerging markets added value, as did the underweight allocation
to US managers. We continue to adopt a blended approach to portfolio construction with a skew towards mid and
small cap strategies where we believe there is a structural tailwind to long term earnings growth and greater potential
for skilled fund managers to outperform.

Standard Bank International Funds Limited
8
Investment Manager’s Report (continued)
Multi Manager Global Equity Funds (continued)
Commentary (continued):
The US once again proved to be the most difficult region for active managers to add value, with most of our managers
slightly lagging benchmark. At the aggregate index level, we are concerned with the expensive valuations in the US,
which assume extremely optimistic growth projections to justify the current multiples. Yet, within the US there is a
large dispersion of valuation levels between the different sectors and companies. We prefer managers who maintain a
degree of valuation discipline who have avoided the expensive stocks in preference for cheaper companies, often in less
fashionable industries. For the time being momentum continues to drive investor behaviour and our US managers as a
group have struggled to some degree as the expensive stocks get more expensive, however we believe we are well
placed should there be a correction of sorts in the market or in the long term, when these anomalies tend to mean revert.
On a more positive note, our thematic allocations added value during the year, with the China consumer, technology
and infrastructure funds being the star performers. Valuations are also becoming stretched in areas of the technology
and infrastructure sectors and we may look to take profits in these sectors after recent stellar gains.
Forward thinking:
Little has changed in our long term views. We retain a geographic overweight exposure to emerging markets, Asia and
Japan, a neutral exposure to European equities and an underweight to the US and UK.
This is largely a function of where we see long term relative value, particularly in emerging markets where both growth
rates and starting valuations are supportive of significant and prolonged outperformance. The corporate earnings cycle
appears to have turned positive and the long term secular growth opportunity remains compelling, particularly for the
more domestically consumer focussed strategies which continue to benefit from political reform and improving global
growth dynamics.
We also remain committed to the long term secular growth in the healthcare and technology thematic positions, with
the healthcare sector offering good relative value at the present time. Global healthcare demand is set to grow
substantially in the decades ahead due to ageing demographics in developed market countries. Using a specialist
manager with industry expertise we are able to access exciting new technologies in medical science along with leading
healthcare services and pharmaceutical businesses. Meanwhile, the technology sector continues to take share of the
global economy and this trend is only going to accelerate. Our managers can access investment themes with genuine
secular growth opportunities as we progress towards the digital age.
The only change to the thematic positioning during the period was to take advantage of the weakness at the end of
March to introduce a US Financials fund. In our view, Trump will meet less resistance to his deregulation,
infrastructure and tax reforms and these potential tailwinds combined with stronger domestic, growth and a rising
interest rate environment should provide a powerful driver for a recovery in Financials’ earnings
Multi Manager Global Balanced Funds
Investment objective:
To provide long-term capital growth through investing in a diverse range of asset classes including international,
regional and thematic equity funds together with fixed income funds, exchange traded funds and cash. The diverse
nature of the asset classes has historically resulted in a moderate level of volatility, although given the potential
exposure ranges to equity as an asset class, the Fund is suitable only for investors with a longer term investment
horizon, and who are prepared to tolerate the risk of shorter term loss.
Standard Bank International Funds Limited
9
Investment Manager’s Report (continued)
Multi Manager Global Balanced Funds (continued)
Quantitative analysis:
US Dollar Class
For the period under review; the ‘C’ Share Class return was 8.84%, the ‘B’ Share Class return was 8.43%, the ‘A’
Share Class return was 8.06%. The Fund’s benchmark is composed of 30% FTSE All World Total Return Net Index in
US dollars, 20% FTSE USA Total Return Net Index in US dollars and 50% Bloomberg/EFFAS Bond Indices US
Government 1-10 Year Index. The benchmark return was 8.88% for the period.
Sterling Class
For the period under review; the ‘C’ Share Class return was 7.19%, the ‘B’ Share Class return was 6.92%, the ‘A’
Share Class return was 6.60%. The Fund’s benchmark is composed of 30% FTSE All World Total Return Net Index in
sterling, 20% FTSE UK Total Return Net Index in sterling and 50% Bloomberg/EFFAS Bond Indices UK Government
1-10 Year Index. The benchmark return was 5.98% for the period.
Commentary:
Both currency share classes of the Global Balanced Fund posted strong absolute gains for the period. Economic
fundamentals have been consistently resilient and investors have favoured riskier asset classes as a consequence. It
appears that global growth conditions are in something of a sweet spot with robust and synchronised expansion across
most regions combined with a low inflationary backdrop which has allowed monetary policy to remain highly
accommodative. Politics has dominated the headlines for most of the year, with the various elections and President
Trump related news flow often driving short term market sentiment, however for the time being it is the fundamental
backdrop that is driving longer term investment returns.
Many global equity indices have been hitting new all-time highs and it is encouraging to note that this has been
supported by improving corporate earnings and the improvements have been broad based across geographies and
industry sectors. Fixed income markets have also been relatively stable as the US rate cycle moved into the tightening
phase. The total return from both the Sterling and US dollar benchmark indices was fractionally negative over the year
in review and we maintain a short duration policy to minimise the potential impact of potentially rising yields.
The US dollar share classes of the Fund marginally lagged benchmark returns, this was primarily due to slight
underperformance from the US regional equity managers, who continue to struggle to match index returns.
The Sterling share class of the Fund outperformed the benchmark return, largely due to the regional UK equity
managers, who have rebounded strongly in the aftermath of the Brexit vote. The UK small and mid cap managers were
particularly successful, with Aberforth gaining 25.8% and Old Mutual soaring 34.3% in Sterling terms.
For both currency classes, the small exposures to Global REITs and Energy strategies were unhelpful and the Global
Healthcare Fund has also lagged over the period. However, the thematic exposures to technology, infrastructure and
Chinese consumption more than offset this as they outperformed.
A change in the Fund rules which allows for a higher allocation to index tracking exchange traded funds (ETFs) has led
to meaningful change in the portfolio during the year. We have allocated 40% of the portfolio to ETFs and this has
significantly lowered the expense ratio of the Fund and allows us to be more nimble and dynamic with our asset
allocation strategy going forward. To assist with this, from July 2017 we have implemented a Tactical Asset Overlay
process that enhances our asset allocation policy using a combination of fundamental, valuation and technical analysis.
Since the adoption of the tactical asset overlay, asset allocation policy has added value through the overweight
exposure to equities with a significant bias to emerging market equity.
Standard Bank International Funds Limited
10
Investment Manager’s Report (continued)
Multi Manager Global Balanced Funds (continued)
Forward thinking:
While data supports the ongoing pick up in global growth conditions, we remain positive on the outlook for equities
over fixed income. Within equities we are encouraged by the recent corporate earnings season as for the first time in
many years companies have delivered solid top line earnings growth driven by top line sales expansion rather than
share buybacks and accounting efficiencies. Our analysis suggests that with a five year view there is significantly more
upside in emerging than developed markets and we will continue to allocate a meaningful portion of the tactical asset
allocation to emerging market equities while the fundamentals are supportive.
Within the equity component of the Fund we remain committed to the long term secular growth in the healthcare,
technology and China consumer thematic positions, with the healthcare fund offering particularly attractive relative
value at the present time, while the technology sector in general is benefitting from strong investor sentiment and
market momentum.
We have been pleased by the success of the tactical asset allocation overlay, which focusses on short term lead
indicators, market fundamentals, relative valuation and market momentum. This has been implemented via low index
tracking ETFs to give precise representation of our investment views over shorter time periods and to lower the
expense ratio of the Fund. We believe we can add significant value being more dynamic in this area of the portfolio
and have invested significant resource developing our tactical asset allocation processes.
Multi Manager Absolute Return Funds
Investment objective:
The Fund seeks to generate positive returns that are independent of market cycles, by targeting enhanced return
opportunities through a diversified range of investment strategies. These seek to provide, either a regular reliable
income stream, or inflation-protected returns, where the prime investment objective is to preserve the real value of
capital.
The principal investment policy of each class will be to invest in a diversified blend of single manager funds (OIECs),
Absolute Return Fixed Income funds (UCITS), investible indices, exchange tradable securities, forward foreign
exchange contracts and cash positions.
Quantitative Analysis:
USD Class
The ‘C’ Share Class return for the period was +3.96%.The Funds benchmark is US CPI which returned +1.94% over
the period.
Sterling Class
The ‘C’ Share Class return for the period was +3.33%.The Funds benchmark is UK CPI which returned +2.87% over
the period.
Commentary:
Both fund classes have comfortably outperformed their respective benchmarks over the last 12 months, benefitting
from a more benign environment for government, corporate and emerging bonds during 2017.
This was in sharp contrast to the large double digit price falls suffered by longer-dated US Government bonds in the
final quarter of 2016, following Trump’s election, whilst for UK Gilts the declines were limited to low single digit.
During this period of drawdown, the two Fund currency classes still managed to record positive returns since their fixed
interest exposure was spread between short-dated Government bond issues and longer dated corporate and emerging
debt, which benefitted from a sharp compression in their respective spreads.
Standard Bank International Funds Limited
11
Investment Manager’s Report (continued)
Multi Manager Absolute Return Funds (continued)
Commentary (continued):
The Fund’s significant exposure to Sovereign and Investment Grade debt contributed positively, providing a safe haven
to both rising geopolitical tensions and a spike in market volatility. The LMWA Macro Opportunities fund, M&G
Optimal Income fund and the iShares 3-7 Year ETF have performed particularly well, whilst the exposure to local
emerging debt, primarily via the Schroder Emerging Debt Absolute Return Fund and the sub-investment grade credit
exposure, via the Hermes Multi-Strategy Credit fund, also contributed positively.
The UK election result was certainly a big surprise to most political pundits, but the subsequent muted reaction in both
UK equity markets and Sterling was probably a bigger shock. The FTSE 100 index remained above 7,500, whilst
Sterling’s decline from its mid-May peak was limited to just over -2%. Whilst a hung parliament was not predicted,
uncertainty over the difficulty of future negotiations regarding the UK’s departure from the EU certainly was, i.e.
political risk had already been largely discounted. There also appears to be a growing belief that a hung parliament will
increase the likelihood of a ‘softer’ exit, with the Conservative party’s reliance on the Democratic Unionist party for a
majority generally viewed as more market friendly likely avoiding a ‘hard’ exit approach.
Economic news has been broadly positive, with a synchronised global upswing being supported by a low interest rate
environment and relatively subdued inflation. In the US, buoyant consumer confidence and falling unemployment,
below the Federal Reserve’s estimated natural rate of 4.7, pre-empted the Federal Reserve to sanction another 25 basis
point interest rate increase, setting the target range for the federal funds rate to a 1.00% to 1.25% range. Despite
weakness in the core inflation rate, which excludes food and energy, to a two-year low at 1.7%, it was felt that the
current strength in the jobs market warranted such action. A further increase is likely to be sanctioned before the year
end, with further moves over the next few years, as the gradual process towards normalisation gathers pace.
In a move that was widely expected, the US Federal Reserve has also announced that it will be the first Central Bank to
start unwinding its quantitative easing (QE) program, albeit in a very gradual fashion. Starting in October, it will
remove $6bn of US Treasuries and $4bn of mortgage-backed securities from its balance sheet each month, which,
given the relatively small increments (relative to the $4.5trn balance sheet) is unlikely to derail an eight-year economic
expansion (the third longest), which by the summer of 2019 will become the longest in history. However, it’s symbolic
significance is far greater, particularly with both the European Central Bank and the Bank of Japan still actively
engaged in QE programs.
Forward thinking:
The Fund will continue to focus on its underlying exposure to five core areas, fixed income credit, emerging market
debt, inflation-linked strategies, global convertibles and global macro targeted return strategies.
Economic news in the US has been broadly positive and the labour market has continued to strengthen, but this has not
translated so far into higher inflation, suggesting perhaps that longer-term structural deflationary forces might be
holding it in check. With only one interest rate increase anticipated in December, there is a growing belief that both US
interest rates and bond yields might stay lower for longer, rather than quickly normalise. The overall duration in both
currency classes will remain in the region of 2.5 years, but will be extended should long dated bond yields again breach
3.00%.
In such an environment emerging debt markets should continue to thrive, with high single digit domestic nominal
yields, combined with falling inflation rates producing attractive positive real returns not found in any developed bond
market. Given such potential for return, the Fund’s exposure in both currency classes will be increased towards 20% in
the months ahead, especially if there is a market pull-back. Any increase will be matched by a comparable decrease to
the Fund’s exposure to High Yield debt.
Standard Bank International Investments Limited
Investment Manager
14 November 2017
12
Independent auditors’ report to the members of Standard Bank International Funds Limited
Report on the audit of the financial statements
Opinion
In our opinion, Standard Bank International Funds Limited’s financial statements (the “financial statements”):
give a true and fair view of the state of the company’s affairs as at 30 September 2017 and of its loss for the year then ended;
have been properly prepared in accordance with United Kingdom Generally Accepted Accounting Practice (United Kingdom Accounting Standards, comprising FRS 102 “The Financial Reporting Standard applicable in the UK and Republic of Ireland”, and applicable law); and
have been prepared in accordance with the requirements of the Companies (Jersey) Law 1991.
We have audited the financial statements, included within the Annual Report and Audited Financial Statements (the “Annual Report”), which comprise: the Statements of Financial Position as at 30 September 2017; the Statements of Comprehensive Income, and the Statements of Changes in Equity; and the notes to the financial statements, which include a description of the significant accounting policies.
Basis for opinion
We conducted our audit in accordance with International Standards on Auditing (Ireland) (“ISAs (Ireland)”) and applicable law. Our responsibilities under ISAs (Ireland) are further described in the Auditors’ responsibilities for the audit of the financial statements section of our report. We believe that the audit evidence we have obtained is sufficient and appropriate to provide a basis for our opinion.
Independence
We remained independent of the company in accordance with the ethical requirements that are relevant to our audit of the financial statements in Ireland, which includes IAASA’s Ethical Standard, and we have fulfilled our other ethical responsibilities in accordance with these requirements.
Conclusions relating to going concern
We have nothing to report in respect of the following matters in relation to which ISAs (Ireland) require us to report to you when:
the directors’ use of the going concern basis of accounting in the preparation of the financial statements is not appropriate; or
the directors have not disclosed in the financial statements any identified material uncertainties that may cast significant doubt about the company’s ability to continue to adopt the going concern basis of accounting for a period of at least twelve months from the date when the financial statements are authorised for issue.
However, because not all future events or conditions can be predicted, this statement is not a guarantee as to the company’s ability to continue as a going concern.
Reporting on other information
The other information comprises all of the information in the Annual Report other than the financial statements and our auditors’ report thereon. The directors are responsible for the other information. Our opinion on the financial statements does not cover the other information and, accordingly, we do not express an audit opinion or any form of assurance thereon.
In connection with our audit of the financial statements, our responsibility is to read the other information and, in doing so, consider whether the other information is materially inconsistent with the financial statements or our knowledge obtained in the audit, or otherwise appears to be materially misstated. If we identify an apparent material inconsistency or material misstatement, we are required to perform procedures to conclude whether there is a material misstatement of the financial statements or a material misstatement of the other information. If, based on the work we have performed, we conclude that there is a material misstatement of this other information, we are required to report that
fact. We have nothing to report based on these responsibilities.
13
Responsibilities for the financial statements and the audit
Responsibilities of the directors for the financial statements
As explained more fully in the Statement of Directors’ Responsibilities set out on page 4, the directors are responsible for the preparation of the financial statements in accordance with the applicable framework and for being satisfied that they give a true and fair view. The directors are also responsible for such internal control as they determine is necessary to enable the preparation of financial statements that are free from material misstatement, whether due to fraud or error.
In preparing the financial statements, the directors are responsible for assessing the company’s ability to continue as a going concern, disclosing as applicable, matters related to going concern and using the going concern basis of accounting unless the directors either intend to liquidate the company or to cease operations, or have no realistic alternative but to do so.
Auditors’ responsibilities for the audit of the financial statements
Our objectives are to obtain reasonable assurance about whether the financial statements as a whole are free from material misstatement, whether due to fraud or error, and to issue an auditors’ report that includes our opinion. Reasonable assurance is a high level of assurance, but is not a guarantee that an audit conducted in accordance with ISAs (Ireland) will always detect a material misstatement when it exists. Misstatements can arise from fraud or error and are considered material if, individually or in the aggregate, they could reasonably be expected to influence the economic decisions of users taken on the basis of these financial statements.
A further description of our responsibilities for the audit of the financial statements is located on the Irish Auditing and Accounting Supervisory Authority website at: https://www.iaasa.ie/getmedia/b2389013-1cf6-458b-9b8f-a98202dc9c3a/Description_of_auditors_responsibilities_for_audit.pdf
This description forms part of our auditors’ report.
Use of this report
This report, including the opinions, has been prepared for and only for the company’s members as a body in accordance with Article 113A of the Companies (Jersey) Law 1991 and for no other purpose. We do not, in giving these opinions, accept or assume responsibility for any other purpose or to any other person to whom this report is shown or into whose hands it may come save where expressly agreed by our prior consent in writing.
Other required reporting
Companies (Jersey) Law 1991 exception reporting
Under the Companies (Jersey) Law 1991 we are required to report to you if, in our opinion:
we have not received all the information and explanations we require for our audit; or
proper accounting records have not been kept; or
proper returns adequate for our audit have not been received from branches not visited by us; or
the financial statements are not in agreement with the accounting records.
We have no exceptions to report arising from this responsibility.
Declan Murphy for and on behalf of PricewaterhouseCoopers Chartered Accountants Dublin 10 January 2018
Standard Bank International Funds Limited
14
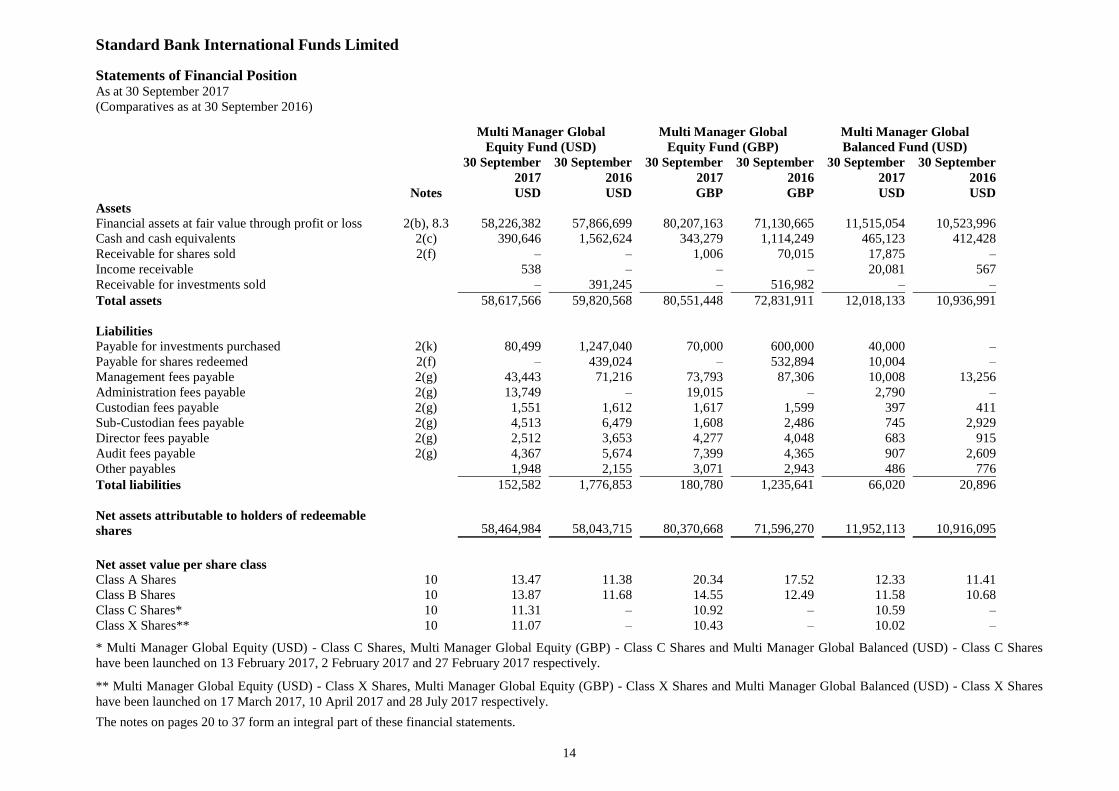
Statements of Financial Position As at 30 September 2017
(Comparatives as at 30 September 2016)
Multi Manager Global
Equity Fund (USD)
Multi Manager Global
Equity Fund (GBP)
Multi Manager Global
Balanced Fund (USD)
30 September
2017
30 September
2016
30 September
2017
30 September
2016
30 September
2017
30 September
2016
Notes USD USD GBP GBP USD USD
Assets
Financial assets at fair value through profit or loss 2(b), 8.3 58,226,382 57,866,699 80,207,163 71,130,665 11,515,054 10,523,996
Cash and cash equivalents 2(c) 390,646 1,562,624 343,279 1,114,249 465,123 412,428
Receivable for shares sold 2(f) – – 1,006 70,015 17,875 –
Income receivable 538 – – – 20,081 567
Receivable for investments sold – 391,245 – 516,982 – –
Total assets 58,617,566 59,820,568 80,551,448 72,831,911 12,018,133 10,936,991
Liabilities
Payable for investments purchased 2(k) 80,499 1,247,040 70,000 600,000 40,000 –
Payable for shares redeemed 2(f) – 439,024 – 532,894 10,004 –
Management fees payable 2(g) 43,443 71,216 73,793 87,306 10,008 13,256
Administration fees payable 2(g) 13,749 – 19,015 – 2,790 –
Custodian fees payable 2(g) 1,551 1,612 1,617 1,599 397 411
Sub-Custodian fees payable 2(g) 4,513 6,479 1,608 2,486 745 2,929
Director fees payable 2(g) 2,512 3,653 4,277 4,048 683 915
Audit fees payable 2(g) 4,367 5,674 7,399 4,365 907 2,609
Other payables 1,948 2,155 3,071 2,943 486 776
Total liabilities 152,582 1,776,853 180,780 1,235,641 66,020 20,896
Net assets attributable to holders of redeemable
shares 58,464,984 58,043,715 80,370,668 71,596,270 11,952,113 10,916,095
Net asset value per share class
Class A Shares 10 13.47 11.38 20.34 17.52 12.33 11.41
Class B Shares 10 13.87 11.68 14.55 12.49 11.58 10.68
Class C Shares* 10 11.31 – 10.92 – 10.59 –
Class X Shares** 10 11.07 – 10.43 – 10.02 –
* Multi Manager Global Equity (USD) - Class C Shares, Multi Manager Global Equity (GBP) - Class C Shares and Multi Manager Global Balanced (USD) - Class C Shares
have been launched on 13 February 2017, 2 February 2017 and 27 February 2017 respectively.
** Multi Manager Global Equity (USD) - Class X Shares, Multi Manager Global Equity (GBP) - Class X Shares and Multi Manager Global Balanced (USD) - Class X Shares
have been launched on 17 March 2017, 10 April 2017 and 28 July 2017 respectively.
The notes on pages 20 to 37 form an integral part of these financial statements.
Standard Bank International Funds Limited
15
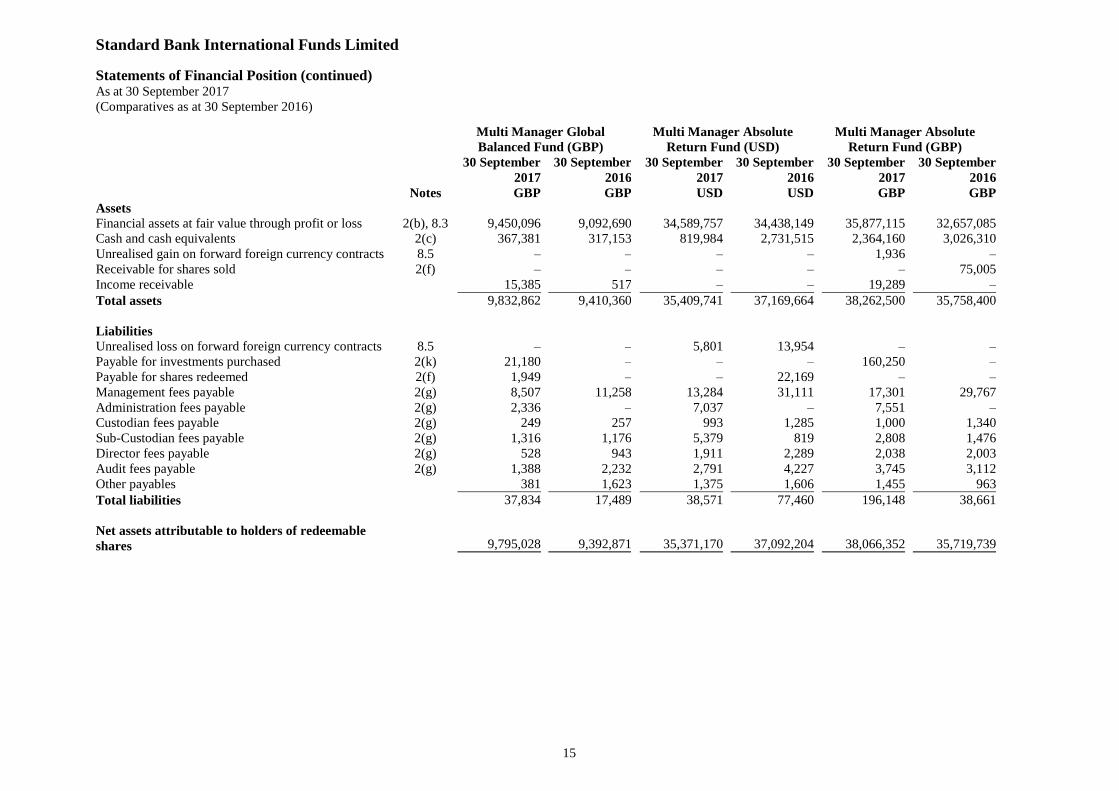
Statements of Financial Position (continued) As at 30 September 2017
(Comparatives as at 30 September 2016)
Multi Manager Global
Balanced Fund (GBP) Multi Manager Absolute
Return Fund (USD) Multi Manager Absolute
Return Fund (GBP)
30 September
2017
30 September
2016 30 September
2017
30 September
2016 30 September
2017
30 September
2016
Notes GBP GBP USD USD GBP GBP
Assets
Financial assets at fair value through profit or loss 2(b), 8.3 9,450,096 9,092,690 34,589,757 34,438,149 35,877,115 32,657,085
Cash and cash equivalents 2(c) 367,381 317,153 819,984 2,731,515 2,364,160 3,026,310
Unrealised gain on forward foreign currency contracts 8.5 – – – – 1,936 –
Receivable for shares sold 2(f) – – – – – 75,005
Income receivable 15,385 517 – – 19,289 –
Total assets 9,832,862 9,410,360 35,409,741 37,169,664 38,262,500 35,758,400
Liabilities
Unrealised loss on forward foreign currency contracts 8.5 – – 5,801 13,954 – –
Payable for investments purchased 2(k) 21,180 – – – 160,250 –
Payable for shares redeemed 2(f) 1,949 – – 22,169 – –
Management fees payable 2(g) 8,507 11,258 13,284 31,111 17,301 29,767
Administration fees payable 2(g) 2,336 – 7,037 – 7,551 –
Custodian fees payable 2(g) 249 257 993 1,285 1,000 1,340
Sub-Custodian fees payable 2(g) 1,316 1,176 5,379 819 2,808 1,476
Director fees payable 2(g) 528 943 1,911 2,289 2,038 2,003
Audit fees payable 2(g) 1,388 2,232 2,791 4,227 3,745 3,112
Other payables 381 1,623 1,375 1,606 1,455 963
Total liabilities 37,834 17,489 38,571 77,460 196,148 38,661
Net assets attributable to holders of redeemable
shares 9,795,028 9,392,871 35,371,170 37,092,204 38,066,352 35,719,739
Standard Bank International Funds Limited
16
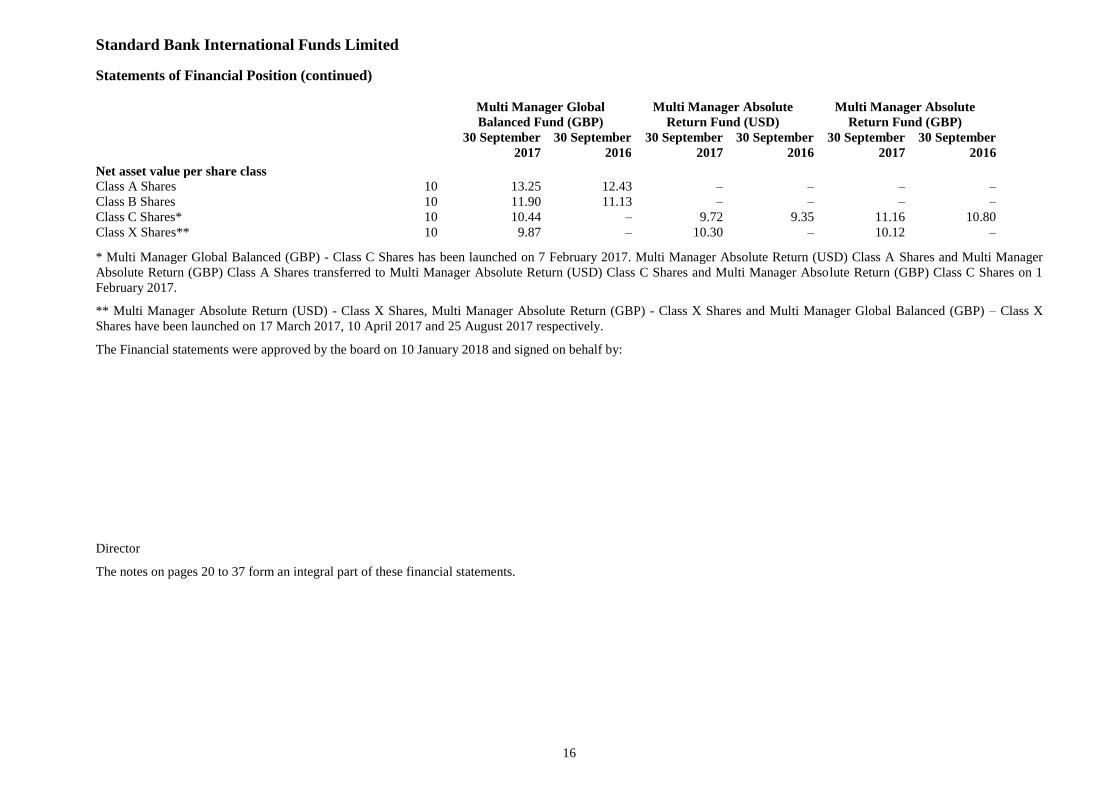
Statements of Financial Position (continued)
Multi Manager Global
Balanced Fund (GBP) Multi Manager Absolute
Return Fund (USD) Multi Manager Absolute
Return Fund (GBP)
30 September
2017
30 September
2016 30 September
2017
30 September
2016 30 September
2017
30 September
2016
Net asset value per share class
Class A Shares 10 13.25 12.43 – – – –
Class B Shares 10 11.90 11.13 – – – –
Class C Shares* 10 10.44 – 9.72 9.35 11.16 10.80
Class X Shares** 10 9.87 – 10.30 – 10.12 –
* Multi Manager Global Balanced (GBP) - Class C Shares has been launched on 7 February 2017. Multi Manager Absolute Return (USD) Class A Shares and Multi Manager
Absolute Return (GBP) Class A Shares transferred to Multi Manager Absolute Return (USD) Class C Shares and Multi Manager Absolute Return (GBP) Class C Shares on 1
February 2017.
** Multi Manager Absolute Return (USD) - Class X Shares, Multi Manager Absolute Return (GBP) - Class X Shares and Multi Manager Global Balanced (GBP) – Class X
Shares have been launched on 17 March 2017, 10 April 2017 and 25 August 2017 respectively.
The Financial statements were approved by the board on 10 January 2018 and signed on behalf by:
Director
The notes on pages 20 to 37 form an integral part of these financial statements.
Standard Bank International Funds Limited
17
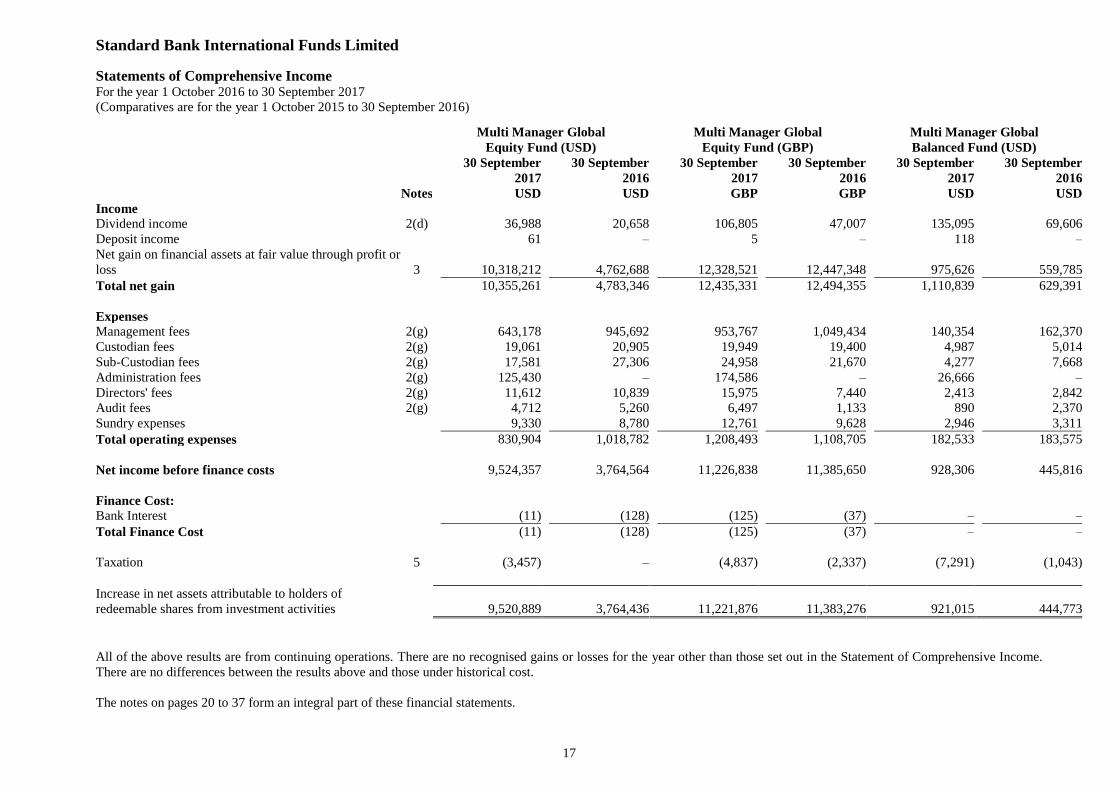
Statements of Comprehensive Income For the year 1 October 2016 to 30 September 2017
(Comparatives are for the year 1 October 2015 to 30 September 2016)
Multi Manager Global
Equity Fund (USD) Multi Manager Global
Equity Fund (GBP) Multi Manager Global
Balanced Fund (USD)
30 September 30 September 30 September 30 September 30 September 30 September
2017 2016 2017 2016 2017 2016
Notes USD USD GBP GBP USD USD
Income
Dividend income 2(d) 36,988 20,658 106,805 47,007 135,095 69,606
Deposit income 61 – 5 – 118 –
Net gain on financial assets at fair value through profit or
loss 3 10,318,212 4,762,688 12,328,521 12,447,348 975,626 559,785
Total net gain 10,355,261 4,783,346 12,435,331 12,494,355 1,110,839 629,391
Expenses
Management fees 2(g) 643,178 945,692 953,767 1,049,434 140,354 162,370
Custodian fees 2(g) 19,061 20,905 19,949 19,400 4,987 5,014
Sub-Custodian fees 2(g) 17,581 27,306 24,958 21,670 4,277 7,668
Administration fees 2(g) 125,430 – 174,586 – 26,666 –
Directors' fees 2(g) 11,612 10,839 15,975 7,440 2,413 2,842
Audit fees 2(g) 4,712 5,260 6,497 1,133 890 2,370
Sundry expenses 9,330 8,780 12,761 9,628 2,946 3,311
Total operating expenses 830,904 1,018,782 1,208,493 1,108,705 182,533 183,575
Net income before finance costs 9,524,357 3,764,564 11,226,838 11,385,650 928,306 445,816
Finance Cost:
Bank Interest (11) (128) (125) (37) – –
Total Finance Cost (11) (128) (125) (37) – –
Taxation 5 (3,457) – (4,837) (2,337) (7,291) (1,043)
Increase in net assets attributable to holders of
redeemable shares from investment activities 9,520,889 3,764,436 11,221,876 11,383,276 921,015 444,773
All of the above results are from continuing operations. There are no recognised gains or losses for the year other than those set out in the Statement of Comprehensive Income.
There are no differences between the results above and those under historical cost.
The notes on pages 20 to 37 form an integral part of these financial statements.
Standard Bank International Funds Limited
18
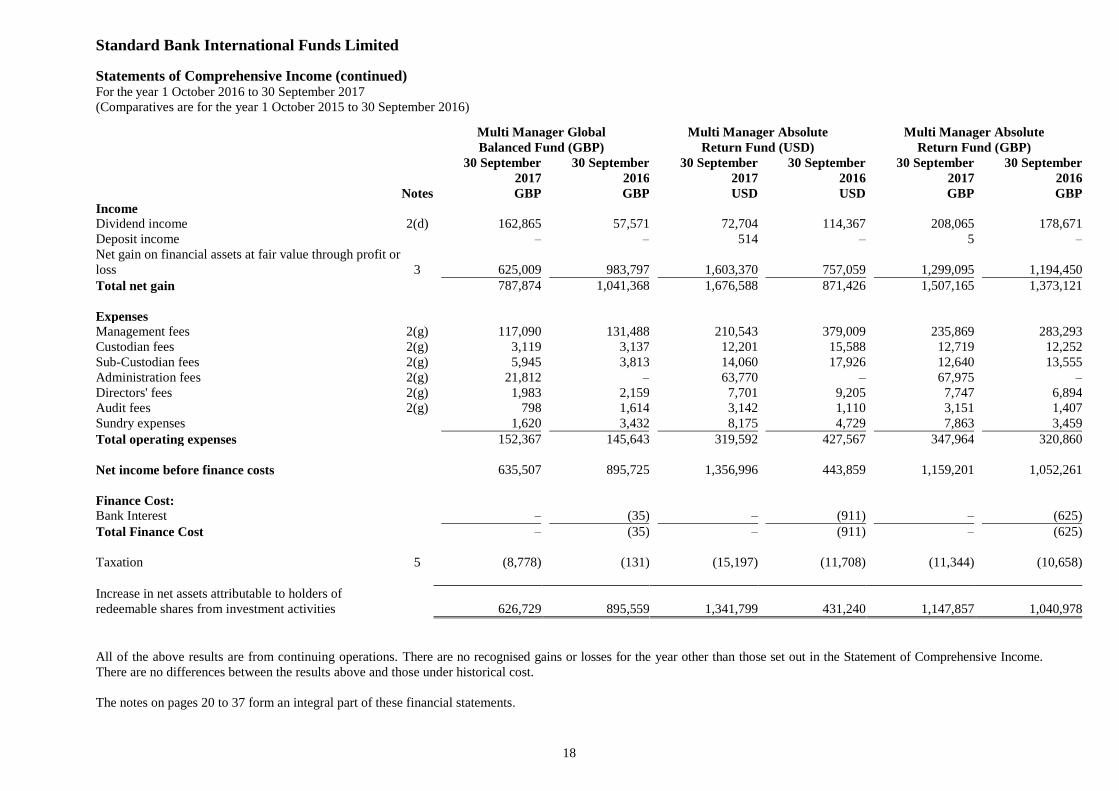
Statements of Comprehensive Income (continued)
For the year 1 October 2016 to 30 September 2017
(Comparatives are for the year 1 October 2015 to 30 September 2016)
Multi Manager Global
Balanced Fund (GBP) Multi Manager Absolute
Return Fund (USD) Multi Manager Absolute
Return Fund (GBP)
30 September 30 September 30 September 30 September 30 September 30 September
2017 2016 2017 2016 2017 2016
Notes GBP GBP USD USD GBP GBP
Income
Dividend income 2(d) 162,865 57,571 72,704 114,367 208,065 178,671
Deposit income – – 514 – 5 –
Net gain on financial assets at fair value through profit or
loss 3 625,009 983,797 1,603,370 757,059 1,299,095 1,194,450
Total net gain 787,874 1,041,368 1,676,588 871,426 1,507,165 1,373,121
Expenses
Management fees 2(g) 117,090 131,488 210,543 379,009 235,869 283,293
Custodian fees 2(g) 3,119 3,137 12,201 15,588 12,719 12,252
Sub-Custodian fees 2(g) 5,945 3,813 14,060 17,926 12,640 13,555
Administration fees 2(g) 21,812 – 63,770 – 67,975 –
Directors' fees 2(g) 1,983 2,159 7,701 9,205 7,747 6,894
Audit fees 2(g) 798 1,614 3,142 1,110 3,151 1,407
Sundry expenses 1,620 3,432 8,175 4,729 7,863 3,459
Total operating expenses 152,367 145,643 319,592 427,567 347,964 320,860
Net income before finance costs 635,507 895,725 1,356,996 443,859 1,159,201 1,052,261
Finance Cost:
Bank Interest – (35) – (911) – (625)
Total Finance Cost – (35) – (911) – (625)
Taxation 5 (8,778) (131) (15,197) (11,708) (11,344) (10,658)
Increase in net assets attributable to holders of
redeemable shares from investment activities 626,729 895,559 1,341,799 431,240 1,147,857 1,040,978
All of the above results are from continuing operations. There are no recognised gains or losses for the year other than those set out in the Statement of Comprehensive Income.
There are no differences between the results above and those under historical cost.
The notes on pages 20 to 37 form an integral part of these financial statements.
Standard Bank International Funds Limited
19
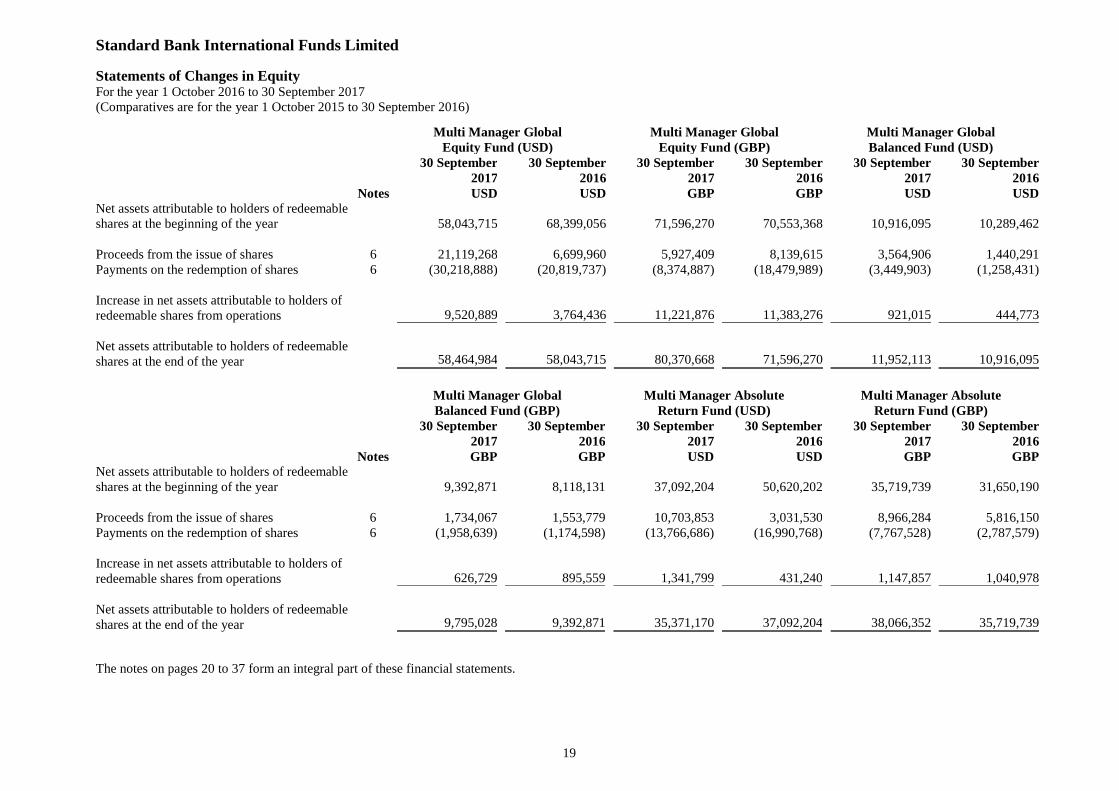
Statements of Changes in Equity For the year 1 October 2016 to 30 September 2017
(Comparatives are for the year 1 October 2015 to 30 September 2016)
Multi Manager Global
Equity Fund (USD)
Multi Manager Global
Equity Fund (GBP)
Multi Manager Global
Balanced Fund (USD)
30 September
2017
30 September
2016
30 September
2017
30 September
2016
30 September
2017
30 September
2016
Notes USD USD GBP GBP USD USD Net assets attributable to holders of redeemable
shares at the beginning of the year 58,043,715 68,399,056 71,596,270 70,553,368 10,916,095 10,289,462
Proceeds from the issue of shares 6 21,119,268 6,699,960 5,927,409 8,139,615 3,564,906 1,440,291
Payments on the redemption of shares 6 (30,218,888) (20,819,737) (8,374,887) (18,479,989) (3,449,903) (1,258,431)
Increase in net assets attributable to holders of
redeemable shares from operations 9,520,889 3,764,436 11,221,876 11,383,276 921,015 444,773
Net assets attributable to holders of redeemable
shares at the end of the year 58,464,984 58,043,715 80,370,668 71,596,270 11,952,113 10,916,095
Multi Manager Global
Balanced Fund (GBP) Multi Manager Absolute
Return Fund (USD) Multi Manager Absolute
Return Fund (GBP)
30 September
2017
30 September
2016 30 September
2017
30 September
2016 30 September
2017
30 September
2016
Notes GBP GBP USD USD GBP GBP Net assets attributable to holders of redeemable
shares at the beginning of the year 9,392,871 8,118,131 37,092,204 50,620,202 35,719,739 31,650,190
Proceeds from the issue of shares 6 1,734,067 1,553,779 10,703,853 3,031,530 8,966,284 5,816,150
Payments on the redemption of shares 6 (1,958,639) (1,174,598) (13,766,686) (16,990,768) (7,767,528) (2,787,579)
Increase in net assets attributable to holders of
redeemable shares from operations 626,729 895,559 1,341,799 431,240 1,147,857 1,040,978
Net assets attributable to holders of redeemable
shares at the end of the year 9,795,028 9,392,871 35,371,170 37,092,204 38,066,352 35,719,739
The notes on pages 20 to 37 form an integral part of these financial statements.
Standard Bank International Funds Limited
Notes to Financial Statements
20
1. Incorporation
The Company was incorporated in Jersey, Channel Islands on 24 September 1999.
The principal accounting policies applied in the preparation of these financial statements are set out below. These
policies have been consistently applied to the years presented unless otherwise stated. These financial statements have
been prepared on a going concern basis under the historical cost convention as modified by the measurement at fair
value of trading financial assets and derivative financial instruments in accordance with applicable Jersey Law and
United Kingdom Generally Accepted Accounting Practice (“UK GAAP”) including Financial Reporting Standard 102
“The Financial Reporting Standard applicable in the United Kingdom and Republic of Ireland” (“FRS 102”). The
Company holds a fund certificate issued pursuant to the Collective Investment Funds (Jersey) Law 1988 and is
regulated by the Jersey Financial Services Commission (“JFSC”) as an unclassified fund. A summary of the more
important accounting policies is set out below.
2. Accounting policies
a. Basis of accounting
These audited annual financial statements for the year ended 30 September 2017 have been prepared in accordance
with FRS 102 as issued by the Financial Reporting Council (''FRC").
The directors of the Company have applied FRS 102 for its annual and FRS 104 “Interim Financial Reporting” for
its unaudited interim financial statements effective 1 October 2014. The Company has also applied “Amendments
to FRS 102 - Fair value hierarchy disclosures” which were issued in March 2016 and are applicable for accounting
periods beginning on or after 1 January 2017 with early application permitted. The Company took the option to
early adopt the amendments and initially implemented these amendments in the interim period ended 31 March
2016.
The information required by FRS 102, to be included in a single statement for the reporting period displaying all
items of income and expenses recognised during the period including those items recognised in determining profit
or loss and items of other comprehensive income and a Reconciliation of Movements in Shareholders’ Funds is, in
the opinion of the directors, contained in the Statement of Comprehensive Income and Statement of Changes in
Equity on pages 17, 18 and 19. In arriving at the results for the period, all amounts in the Statement of
Comprehensive Income on page 17 and 18 relate to continuing activities.
The Company has availed of the exemption available to open-ended investment funds under Section 7 “Statement
of Cash Flows” of FRS 102 (Section 7.1a (c)), not to prepare a cash flow statement on the basis that substantially
all of the Company’s investments are highly liquid and carried at fair value, and the Company provides Statement
of Changes in Equity.
b. Investments
Investments are recognised at cost on the trade date, being the date on which the Class Fund commits to purchase
the investment and becomes party to the contractual provisions of the securities. Transaction costs are recognised
as part of the consideration and capitalised in the purchase cost.
Subsequent to initial recognition, all investments are valued at closing mid-market prices. Financial liabilities are
valued at offer price. Gains and losses on sales of investments are calculated on an average cost basis and are
recognised within net realised gain or loss on investments in the Statements of Comprehensive Income in the
period in which the Company commits to dispose of the securities.
Investments are derecognised when the Class Fund becomes party to contractual provisions of the securities that
give rise to transfer of substantial rights and obligations arising from the securities.
On initial application of FRS 102, in accounting for all of its financial instruments, an entity is required to apply
either (a) the full requirements of Sections 11 “Basic Financial Instruments” and Section 12 “Other Financial
Instruments Issues” of FRS 102, (b) the recognition and measurement provisions of International Accounting
Standards (“IAS”) 39 “Financial Instruments: Recognition and Measurement” (“IAS 39”) as adopted for use in the
European Union and the disclosure requirements of Sections 11 and 12, or (c) the recognition and measurement
provisions of International Financial Reporting Standards (“IFRS”) 9 “Financial Instruments” (“IFRS 9”) and the
disclosure requirements of Sections 11 and 12. The Company has applied FRS 102 from the year ended 30
September 2015 and has elected to apply the full requirements of Sections 11 and Section 12 of FRS 102.
Standard Bank International Funds Limited
Notes to Financial Statements (continued)
21
2. Accounting policies (continued)
c. Cash and cash equivalents
Cash is valued at cost, which approximates fair value.
Cash is held in accounts at The Bank of New York Mellon SA/NV London Branch which allows the Class Funds
instant access to their accounts.
d. Income
Interest income is accounted for on an accruals basis using the effective yield basis. Dividend income is accounted
for on the ex-dividend date. Dividend income is reported gross of withholding tax deducted at source and the
related withholding tax is disclosed separately as a tax charge in the Statements of Comprehensive Income. Interest
on deposit accounts is included on an accruals basis.
e. Foreign currencies
Transactions in foreign currencies are translated into the currency of the Class Funds at the rates of exchange
ruling at the date of the transaction. Monetary assets and liabilities denominated in foreign currencies are translated
into the currency of the Class Funds at the rates of exchange ruling at the Statements of Financial Position date.
Differences arising on the translation of investments are included in the Statements of Comprehensive Income
within net capital gains or losses on investments in the period in which they arise. The functional and
presentational currencies of the Class Funds are US Dollars for the Multi Manager Global Equity Fund (USD),
Multi Manager Global Balanced Fund (USD) and Multi Manager Absolute Return Fund (USD), Sterling for the
Multi Manager Global Equity Fund (GBP), Multi Manager Global Balanced Fund (GBP) and Multi Manager
Absolute Return Fund (GBP).
Foreign currency gains and losses on revenue and expenses due to movements in exchange rates between the
record date and settlement date are included in the Statements of Comprehensive Income with income or expenses.
f. Share issues and redemptions
Shares in the Company may be issued at the issue price and redeemed at the redemption price on subscription days
at the prices calculated in accordance with the Articles of Association and based on the value of the underlying net
assets held in the relevant Class Fund. Participating shares are classified as financial liabilities in the financial
statements as they are not the most subordinated class in the Company.
Receivable for shares sold and payable for shares redeemed represent amounts that have been contracted for but
not yet settled or delivered on the Statement of Financial Position date.
g. Expenses
The Company is responsible for the payment of management, administration, audit, director, custodian and sub-
custodian fees which are accrued for on each valuation point, and the payment of other expenses as detailed in the
Company’s prospectus. All expenses are accounted for on an accruals basis.
h. Net gains/(losses) on financial assets at fair value through profit or loss
This item includes changes in the fair value of financial assets held for trading and excludes interest and dividend
income and expenses. Unrealised gains and losses comprise changes in the fair value of financial instruments for
the year. Realised gains and losses on disposals are calculated using the average cost method and are reflected as
net gains or losses on investments in the Statements of Comprehensive Income.
i. Withholding taxes
In some jurisdictions investment income is subject to withholding tax deducted at the source of the income.
Withholding tax is a generic term used for the amount of withholding tax deducted at the source of the income and
is not significant for the Portfolio. Withholding tax is disclosed separately as a tax charge from the gross
investment income in the Statements of Comprehensive Income.
j. Distribution policy
The Company’s policy is to not distribute any income on its participating shares.
k. Payable for investments purchased
Payable for investments purchased are securities purchased that have been contracted for but not yet delivered by
the year end.
Standard Bank International Funds Limited
Notes to Financial Statements (continued)
22
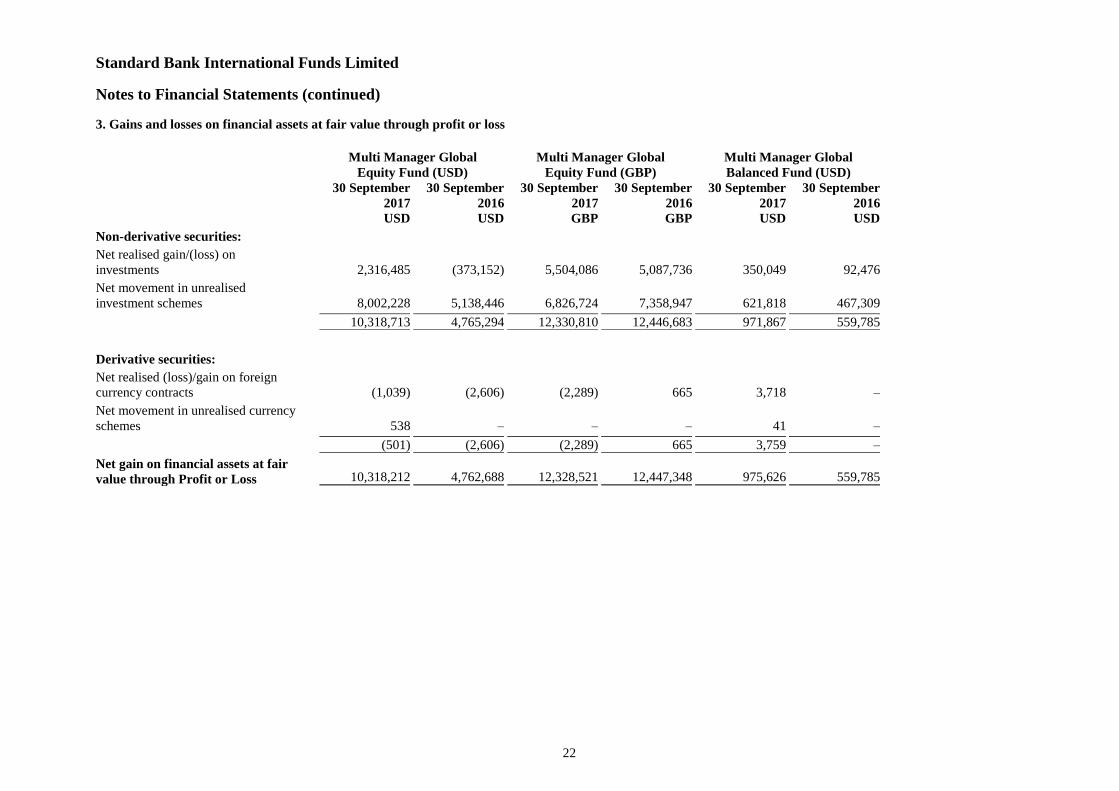
3. Gains and losses on financial assets at fair value through profit or loss
Multi Manager Global
Equity Fund (USD)
Multi Manager Global
Equity Fund (GBP)
Multi Manager Global
Balanced Fund (USD)
30 September
2017
USD
30 September
2016
USD
30 September
2017
GBP
30 September
2016
GBP
30 September
2017
USD
30 September
2016
USD
Non-derivative securities:
Net realised gain/(loss) on
investments 2,316,485 (373,152) 5,504,086 5,087,736 350,049 92,476
Net movement in unrealised
investment schemes 8,002,228 5,138,446 6,826,724 7,358,947 621,818 467,309
10,318,713 4,765,294 12,330,810 12,446,683 971,867 559,785
Derivative securities:
Net realised (loss)/gain on foreign
currency contracts (1,039) (2,606) (2,289) 665 3,718 –
Net movement in unrealised currency
schemes 538 – – – 41 –
(501) (2,606) (2,289) 665 3,759 –
Net gain on financial assets at fair
value through Profit or Loss 10,318,212 4,762,688 12,328,521 12,447,348 975,626 559,785
Standard Bank International Funds Limited
Notes to Financial Statements (continued)
23
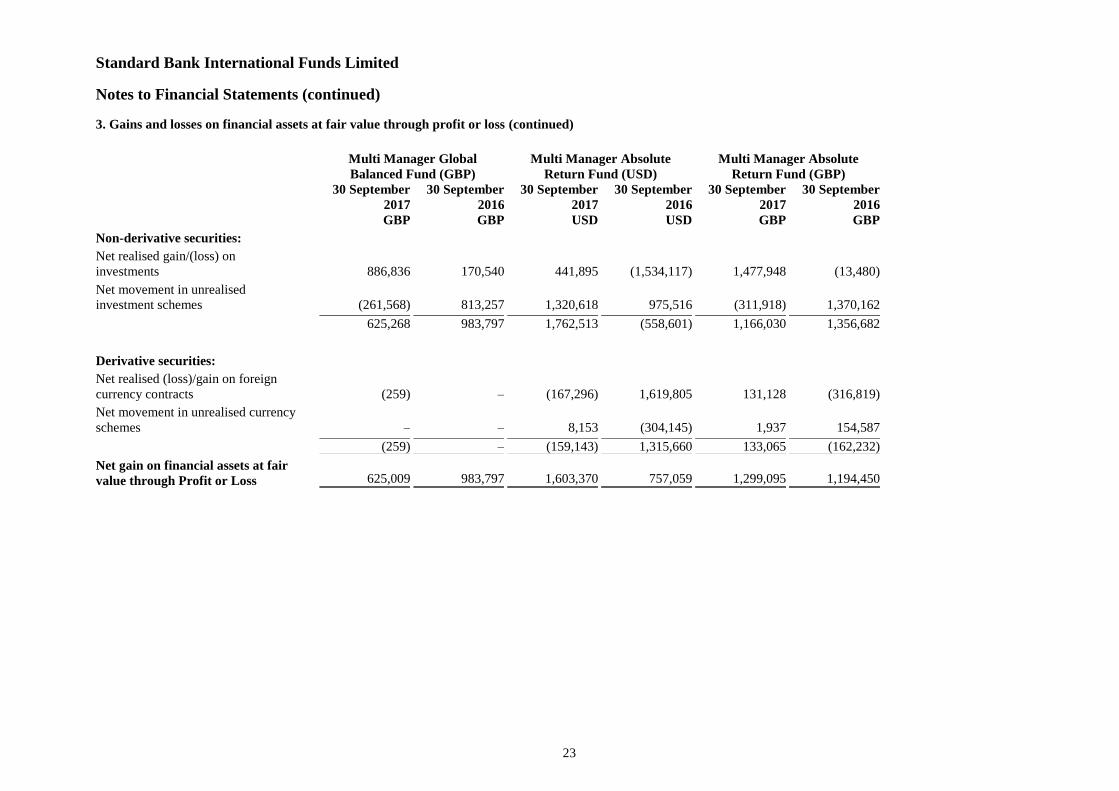
3. Gains and losses on financial assets at fair value through profit or loss (continued)
Multi Manager Global
Balanced Fund (GBP)
Multi Manager Absolute
Return Fund (USD)
Multi Manager Absolute
Return Fund (GBP)
30 September
2017
GBP
30 September
2016
GBP
30 September
2017
USD
30 September
2016
USD
30 September
2017
GBP
30 September
2016
GBP
Non-derivative securities:
Net realised gain/(loss) on
investments 886,836 170,540 441,895 (1,534,117) 1,477,948 (13,480)
Net movement in unrealised
investment schemes (261,568) 813,257 1,320,618 975,516 (311,918) 1,370,162
625,268 983,797 1,762,513 (558,601) 1,166,030 1,356,682
Derivative securities:
Net realised (loss)/gain on foreign
currency contracts (259) – (167,296) 1,619,805 131,128 (316,819)
Net movement in unrealised currency
schemes – – 8,153 (304,145) 1,937 154,587
(259) – (159,143) 1,315,660 133,065 (162,232)
Net gain on financial assets at fair
value through Profit or Loss 625,009 983,797 1,603,370 757,059 1,299,095 1,194,450
Standard Bank International Funds Limited
Notes to Financial Statements (continued)
24
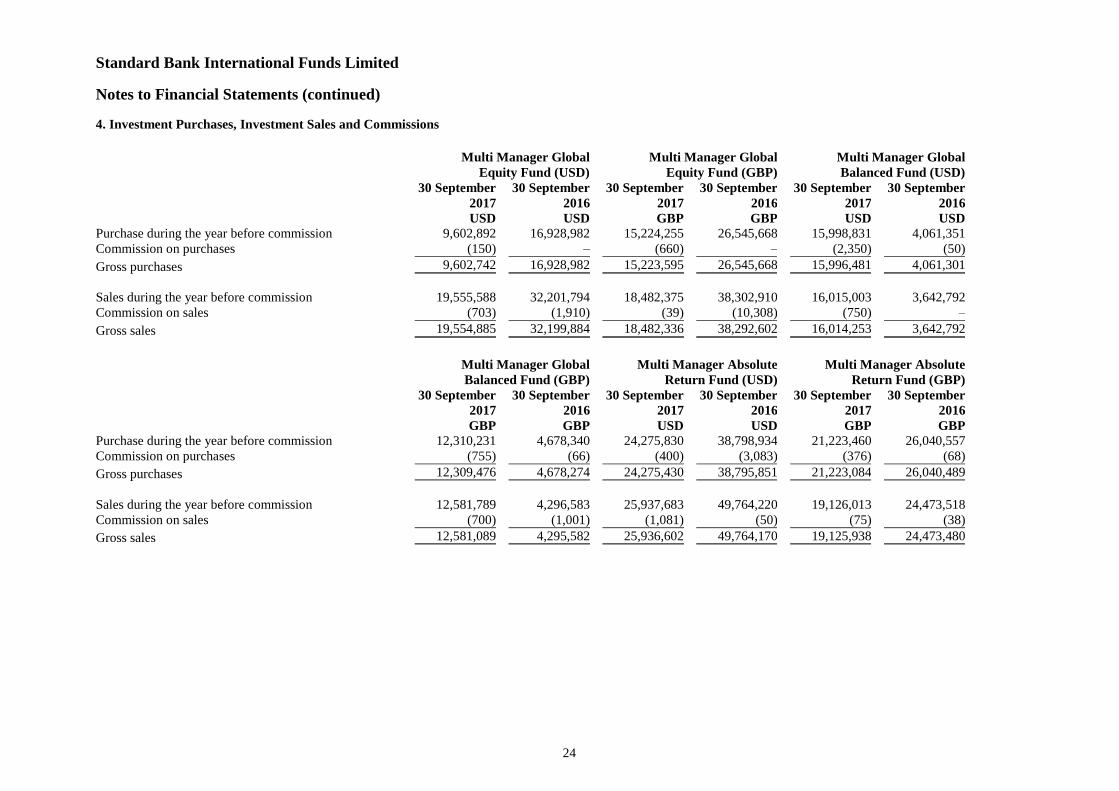
4. Investment Purchases, Investment Sales and Commissions
Multi Manager Global
Equity Fund (USD)
Multi Manager Global
Equity Fund (GBP)
Multi Manager Global
Balanced Fund (USD)
30 September
2017
USD
30 September
2016
USD
30 September
2017
GBP
30 September
2016
GBP
30 September
2017
USD
30 September
2016
USD
Purchase during the year before commission 9,602,892 16,928,982 15,224,255 26,545,668 15,998,831 4,061,351
Commission on purchases (150) – (660) – (2,350) (50)
Gross purchases 9,602,742 16,928,982 15,223,595 26,545,668 15,996,481 4,061,301
Sales during the year before commission 19,555,588 32,201,794 18,482,375 38,302,910 16,015,003 3,642,792
Commission on sales (703) (1,910) (39) (10,308) (750) –
Gross sales 19,554,885 32,199,884 18,482,336 38,292,602 16,014,253 3,642,792
Multi Manager Global
Balanced Fund (GBP)
Multi Manager Absolute
Return Fund (USD)
Multi Manager Absolute
Return Fund (GBP)
30 September
2017
GBP
30 September
2016
GBP
30 September
2017
USD
30 September
2016
USD
30 September
2017
GBP
30 September
2016
GBP
Purchase during the year before commission 12,310,231 4,678,340 24,275,830 38,798,934 21,223,460 26,040,557
Commission on purchases (755) (66) (400) (3,083) (376) (68)
Gross purchases 12,309,476 4,678,274 24,275,430 38,795,851 21,223,084 26,040,489
Sales during the year before commission 12,581,789 4,296,583 25,937,683 49,764,220 19,126,013 24,473,518
Commission on sales (700) (1,001) (1,081) (50) (75) (38)
Gross sales 12,581,089 4,295,582 25,936,602 49,764,170 19,125,938 24,473,480
Standard Bank International Funds Limited
Notes to Financial Statements (continued)
25
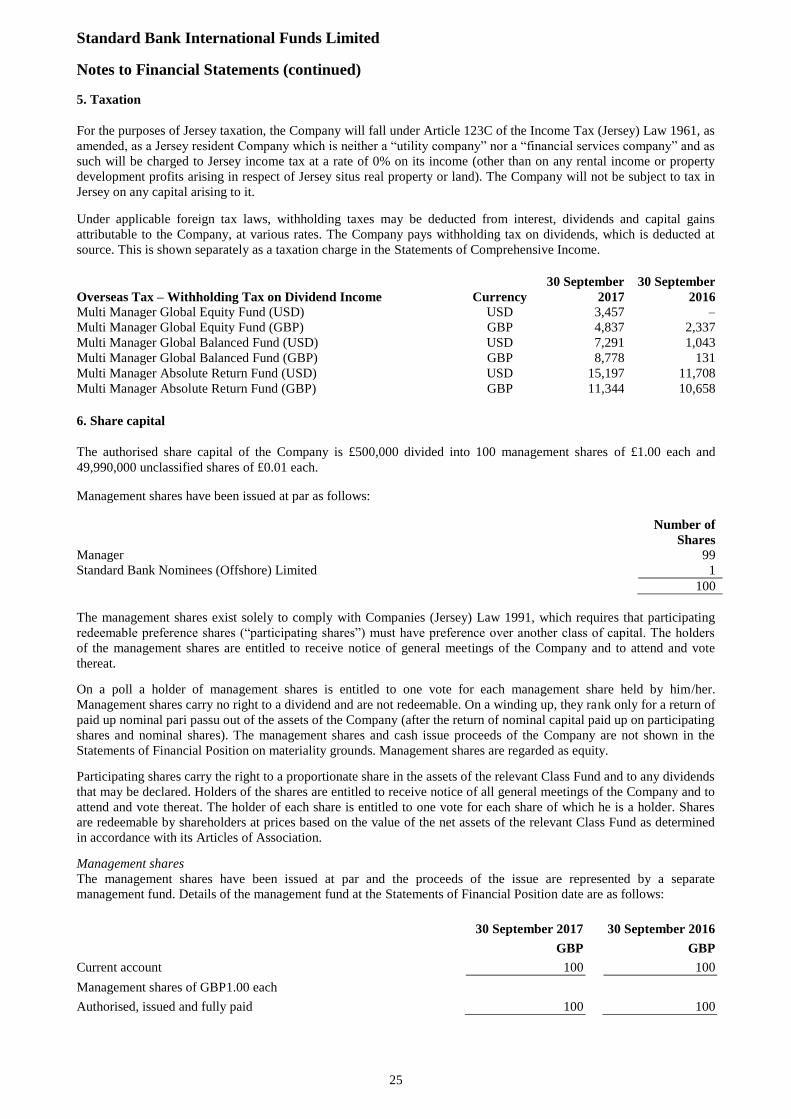
5. Taxation
For the purposes of Jersey taxation, the Company will fall under Article 123C of the Income Tax (Jersey) Law 1961, as
amended, as a Jersey resident Company which is neither a “utility company” nor a “financial services company” and as
such will be charged to Jersey income tax at a rate of 0% on its income (other than on any rental income or property
development profits arising in respect of Jersey situs real property or land). The Company will not be subject to tax in
Jersey on any capital arising to it.
Under applicable foreign tax laws, withholding taxes may be deducted from interest, dividends and capital gains
attributable to the Company, at various rates. The Company pays withholding tax on dividends, which is deducted at
source. This is shown separately as a taxation charge in the Statements of Comprehensive Income.
Overseas Tax – Withholding Tax on Dividend Income Currency
30 September
2017
30 September
2016 Multi Manager Global Equity Fund (USD) USD 3,457 –
Multi Manager Global Equity Fund (GBP) GBP 4,837 2,337
Multi Manager Global Balanced Fund (USD) USD 7,291 1,043
Multi Manager Global Balanced Fund (GBP) GBP 8,778 131
Multi Manager Absolute Return Fund (USD) USD 15,197 11,708
Multi Manager Absolute Return Fund (GBP) GBP 11,344 10,658
6. Share capital
The authorised share capital of the Company is £500,000 divided into 100 management shares of £1.00 each and
49,990,000 unclassified shares of £0.01 each.
Management shares have been issued at par as follows:
Number of
Shares Manager 99
Standard Bank Nominees (Offshore) Limited 1
100
The management shares exist solely to comply with Companies (Jersey) Law 1991, which requires that participating
redeemable preference shares (“participating shares”) must have preference over another class of capital. The holders
of the management shares are entitled to receive notice of general meetings of the Company and to attend and vote
thereat.
On a poll a holder of management shares is entitled to one vote for each management share held by him/her.
Management shares carry no right to a dividend and are not redeemable. On a winding up, they rank only for a return of
paid up nominal pari passu out of the assets of the Company (after the return of nominal capital paid up on participating
shares and nominal shares). The management shares and cash issue proceeds of the Company are not shown in the
Statements of Financial Position on materiality grounds. Management shares are regarded as equity.
Participating shares carry the right to a proportionate share in the assets of the relevant Class Fund and to any dividends
that may be declared. Holders of the shares are entitled to receive notice of all general meetings of the Company and to
attend and vote thereat. The holder of each share is entitled to one vote for each share of which he is a holder. Shares
are redeemable by shareholders at prices based on the value of the net assets of the relevant Class Fund as determined
in accordance with its Articles of Association.
Management shares
The management shares have been issued at par and the proceeds of the issue are represented by a separate
management fund. Details of the management fund at the Statements of Financial Position date are as follows:
30 September 2017 30 September 2016
GBP GBP
Current account 100 100
Management shares of GBP1.00 each
Authorised, issued and fully paid 100 100
Standard Bank International Funds Limited
Notes to Financial Statements (continued)
26
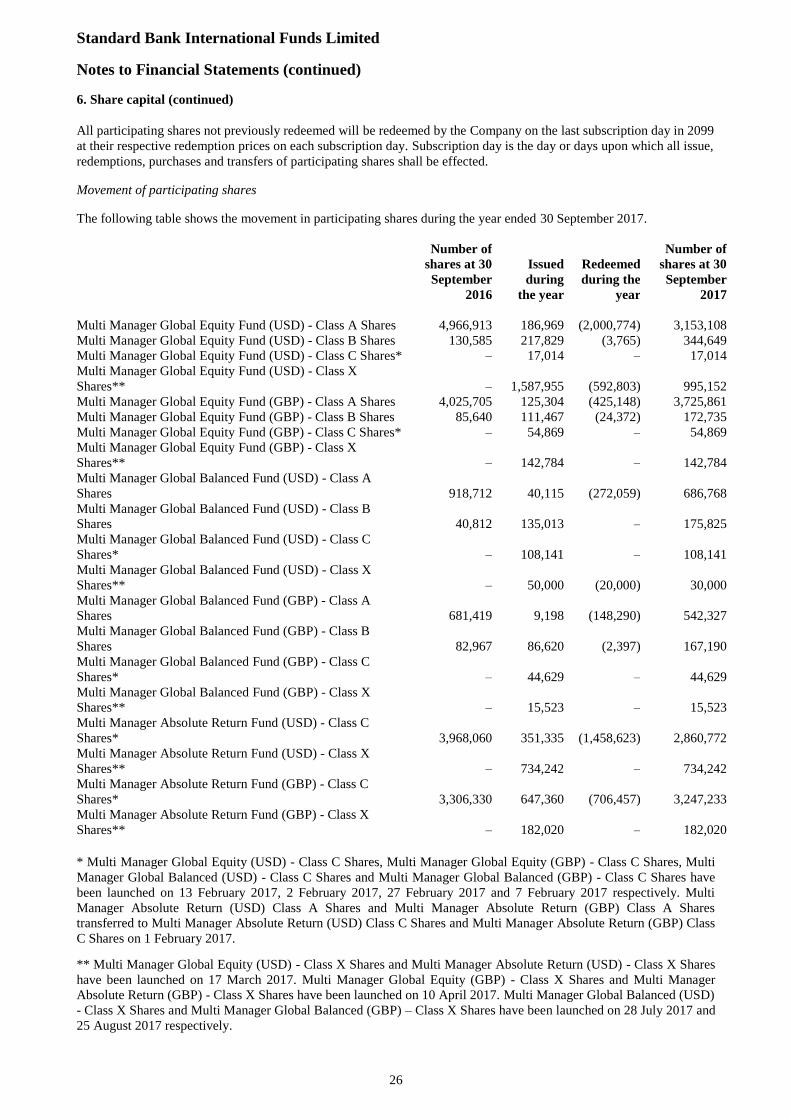
6. Share capital (continued)
All participating shares not previously redeemed will be redeemed by the Company on the last subscription day in 2099
at their respective redemption prices on each subscription day. Subscription day is the day or days upon which all issue,
redemptions, purchases and transfers of participating shares shall be effected.
Movement of participating shares
The following table shows the movement in participating shares during the year ended 30 September 2017.
Number of
shares at 30
September
2016
Issued
during
the year
Redeemed
during the
year
Number of
shares at 30
September
2017
Multi Manager Global Equity Fund (USD) - Class A Shares 4,966,913 186,969 (2,000,774) 3,153,108
Multi Manager Global Equity Fund (USD) - Class B Shares 130,585 217,829 (3,765) 344,649
Multi Manager Global Equity Fund (USD) - Class C Shares* – 17,014 – 17,014
Multi Manager Global Equity Fund (USD) - Class X
Shares** – 1,587,955 (592,803) 995,152
Multi Manager Global Equity Fund (GBP) - Class A Shares 4,025,705 125,304 (425,148) 3,725,861
Multi Manager Global Equity Fund (GBP) - Class B Shares 85,640 111,467 (24,372) 172,735
Multi Manager Global Equity Fund (GBP) - Class C Shares* – 54,869 – 54,869
Multi Manager Global Equity Fund (GBP) - Class X
Shares** – 142,784 – 142,784
Multi Manager Global Balanced Fund (USD) - Class A
Shares 918,712 40,115 (272,059) 686,768
Multi Manager Global Balanced Fund (USD) - Class B
Shares 40,812 135,013 – 175,825
Multi Manager Global Balanced Fund (USD) - Class C
Shares* – 108,141 – 108,141
Multi Manager Global Balanced Fund (USD) - Class X
Shares** – 50,000 (20,000) 30,000
Multi Manager Global Balanced Fund (GBP) - Class A
Shares 681,419 9,198 (148,290) 542,327
Multi Manager Global Balanced Fund (GBP) - Class B
Shares 82,967 86,620 (2,397) 167,190
Multi Manager Global Balanced Fund (GBP) - Class C
Shares* – 44,629 – 44,629
Multi Manager Global Balanced Fund (GBP) - Class X
Shares** – 15,523 – 15,523
Multi Manager Absolute Return Fund (USD) - Class C
Shares* 3,968,060 351,335 (1,458,623) 2,860,772
Multi Manager Absolute Return Fund (USD) - Class X
Shares** – 734,242 – 734,242
Multi Manager Absolute Return Fund (GBP) - Class C
Shares* 3,306,330 647,360 (706,457) 3,247,233
Multi Manager Absolute Return Fund (GBP) - Class X
Shares** – 182,020 – 182,020
* Multi Manager Global Equity (USD) - Class C Shares, Multi Manager Global Equity (GBP) - Class C Shares, Multi
Manager Global Balanced (USD) - Class C Shares and Multi Manager Global Balanced (GBP) - Class C Shares have
been launched on 13 February 2017, 2 February 2017, 27 February 2017 and 7 February 2017 respectively. Multi
Manager Absolute Return (USD) Class A Shares and Multi Manager Absolute Return (GBP) Class A Shares
transferred to Multi Manager Absolute Return (USD) Class C Shares and Multi Manager Absolute Return (GBP) Class
C Shares on 1 February 2017.
** Multi Manager Global Equity (USD) - Class X Shares and Multi Manager Absolute Return (USD) - Class X Shares
have been launched on 17 March 2017. Multi Manager Global Equity (GBP) - Class X Shares and Multi Manager
Absolute Return (GBP) - Class X Shares have been launched on 10 April 2017. Multi Manager Global Balanced (USD)
- Class X Shares and Multi Manager Global Balanced (GBP) – Class X Shares have been launched on 28 July 2017 and
25 August 2017 respectively.

Standard Bank International Funds Limited
Notes to Financial Statements (continued)
27
7. Related Party Transactions and Other Expenses
The following disclosures are made in accordance with the requirements of Section 33 “Related Party Disclosures” of
FRS 102.
STANLIB Fund Managers Jersey Limited (the “Manager”), Standard Bank International Investments Limited (the
“Investment Manager”) and all directors of the Company are related parties of the Company.
The Manager is considered a related party by virtue of its contractual arrangements. The Investment Manager and the
directors are considered related parties to the Company as they make key operating decisions for the Company.
The Manager has the primary responsibility for the management and administration of the Company. The Manager has
appointed the Investment Manager to provide investment management services in relation to the Company. Until 31
January 2017 the Manager was paid a management fee in respect of the Multi Manager Global Equity and the Multi
Manager Global Balanced Class A Shares at the rate of 1.50% per annum, the Multi Manager Global Equity and the
Multi Manager Global Balanced Class B Shares at a rate of 1.20% per annum and at a rate of 0.85% per annum in
respect of the Multi Manager Absolute Return Classes, out of the net asset value of the relevant classes. From 1
February 2017 the Manager shall be paid a management fee in respect of the Multi Manager Global Equity and the
Multi Manager Global Balanced Class A Shares at the rate of 1.20% per annum, the Multi Manager Global Equity and
the Multi Manager Global Balanced Class B Shares at a rate of 0.90% per annum, the Multi Manager Global Equity,
the Multi Manager Global Balanced and the Multi Manger Absolute Return Class C Shares at a rate of 0.60% per
annum, out of the net asset value of the relevant classes, which is payable to the Manager by monthly payments in
arrears. There is no management fee charged in respect of the Class X shares. The Manager remits the above fees in full
to the Investment Manager as an investment management fee.
From 1 February 2017, the Manager is entitled to an annual administration fee at a rate of 0.25% of the net asset value
of the Multi Manager Absolute Return class Funds and at a rate of 0.30% of the net asset value of the Multi Manager
Global Equity and Multi Manager Global Balanced Class Funds. The above amounts accrue on each subscription day
and are payable to the Manager by monthly payments in arrears.
The Custodian is responsible for the safekeeping of all the property of the Company which is entrusted to it, as
prescribed in the Custodian Agreement.
The fees of the Custodian shall be calculated as follows, subject to an overall minimum fee in respect of each Class
Fund of US$5,000 per annum (such minimum fee to be waived in respect of cash funds) (the “Minimum Fee”):
(i). 0.035% per annum on any and all amounts up to USD 50 million of the Net Asset Value of that Class Fund;
(ii). 0.025% per annum on any and all amounts above USD 50 million of the Net Asset Value of that Class Fund
but only up to USD 100 million;
(iii). 0.010% per annum on any and all amounts above USD 100 million of the Net Asset Value of that Class Fund
but only up to USD 500 million; and
(iv). 0.005% per annum on any and all amounts above USD 500 million of the Net Asset Value of that Class Fund.
Such fees shall accrue daily and shall be payable to the Custodian by monthly payments in arrears becoming due on the
first Business Day of each month in respect of the preceding month.
The Custodian is also entitled to be reimbursed out of the Class Funds for charges and transaction fees levied on it by
the Sub-Custodian and other sub-custodians which shall be at rates which have been negotiated on an arm’s length
basis or are otherwise on commercial terms.
Director Fees
The directors are responsible for keeping proper accounting records, which disclose with reasonable accuracy at any
time the financial position of the Company and enable them to ensure that the financial statements comply with the
Companies (Jersey) Law, 1991. They are also responsible for safeguarding the assets of the Company and hence taking
reasonable steps for the prevention and detection of error, fraud and non-compliance with law or regulations.
Michael Farrow is entitled to receive GBP 20,000 per annum as director fees, Helen Holmes, Graham Baillie and
Oliver Sonnbichler are entitled to USD 10,000 per director per annum.
For the Multi Manager Global Equity Fund (USD) directors fees incurred during the year ended 30 September 2017
amounted to USD 11,612 (30 September 2016: USD 10,839) with USD 2,512 (30 September 2016: USD 3,653)
outstanding at the year end.
Standard Bank International Funds Limited
Notes to Financial Statements (continued)
28
7. Related Party Transactions and Other Expenses (continued)
For the Multi Manager Global Equity Fund (GBP) directors fees incurred during the year ended 30 September 2017
amounted to GBP 15,975 (30 September 2016: GBP 7,440) with GBP 4,277 (30 September 2016: GBP 4,048)
outstanding at the year end.
For the Multi Manager Global Balanced Fund (USD) directors fees incurred during the year ended 30 September 2017
amounted to USD 2,413 (30 September 2016: USD 2,842) with USD 683 (30 September 2016: USD 915) outstanding
at the year end.
For the Multi Manager Global Balanced Fund (GBP) directors fees incurred during the year ended 30 September 2017
amounted to GBP 1,983 (30 September 2016: GBP 2,159) with GBP 528 (30 September 2016: GBP 943) outstanding
at the year end.
For the Multi Manager Absolute Return Fund (USD) directors fees incurred during the year ended 30 September 2017
amounted to USD 7,701 (30 September 2016: USD 9,205) with USD 1,911 (30 September 2016: USD 2,289)
outstanding at the year end.
For the Multi Manager Absolute Return Fund (GBP) directors fees incurred during the year ended 30 September 2017
amounted to GBP 7,747 (30 September 2016: GBP 6,894) with GBP 2,038 (30 September 2016: GBP 2,003)
outstanding at the year end.
All transactions with related parties are at arms length.
8. Financial risk management
Consistent with the investment objectives, as noted in the Report of the Directors, the Company’s financial instruments
comprise quoted securities. In addition, the Company holds cash and liquid assets and various items such as debtors
and creditors that arise directly from its operations.
The main risks arising from the Company’s financial instruments are market risk (comprising market price risk, interest
rate risk and currency risk), credit risk and liquidity risk. The Board reviews and agrees with the Manager and
Investment Manager policies for managing each of these risks and they are summarised below.
8.1 Market risk
Market risk is the risk that the fair value of, or future cash flows arising from, financial instruments will fluctuate
because of the changes in market variables. Market risk comprises three types of risks: market price risk, interest rate
risk and currency risk.
Market price risk
Market price risk arises mainly from uncertainty about future prices of equity and equity-linked financial instruments. It
represents the potential loss that the Company may suffer due to movements in securities prices.
The Company’s exposure to market price arises from its equity investments with a maximum exposure at the period
end represented by the carrying value of investments. The exposure levels are in line with the Company’s investment
objectives and market price risk is managed through prescribed investment restrictions. A complete list of the
investment restrictions for each Class can be found in the prospectus. Each Class Fund’s investment portfolio complies
with the investment parameters as disclosed in the prospectus. The spread of investments between various geographic
sectors is disclosed in the Portfolio Statements (Unaudited) at the end of this report.
Sensitivity analysis
The table below summarises the sensitivity of the Class Funds’ net assets attributable to holders of redeemable shares
to market price movements. It shows the increase/(decrease) in the net assets attributable to holders of redeemable
shares for the Class Funds’ given a 5% movement in the underlying investment prices at year end; all other variables
remaining constant (5% is considered to be a reasonable possible change in price):
30 September 2017 30 September 2016
Multi Manager Global Equity Fund (USD) USD2,911,319 USD2,893,335
Multi Manager Global Equity Fund (GBP) GBP4,010,358 GBP3,556,533
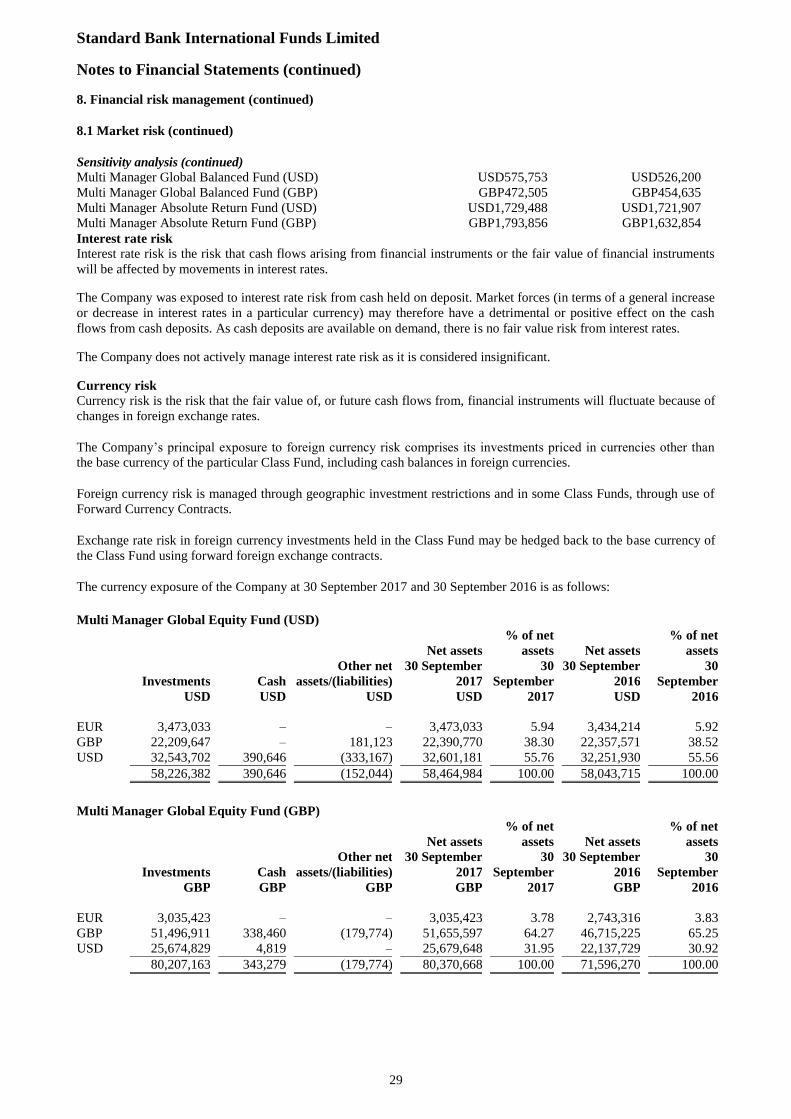
Standard Bank International Funds Limited
Notes to Financial Statements (continued)
29
8. Financial risk management (continued)
8.1 Market risk (continued)
Sensitivity analysis (continued) Multi Manager Global Balanced Fund (USD) USD575,753 USD526,200
Multi Manager Global Balanced Fund (GBP) GBP472,505 GBP454,635
Multi Manager Absolute Return Fund (USD) USD1,729,488 USD1,721,907
Multi Manager Absolute Return Fund (GBP) GBP1,793,856 GBP1,632,854
Interest rate risk
Interest rate risk is the risk that cash flows arising from financial instruments or the fair value of financial instruments
will be affected by movements in interest rates.
The Company was exposed to interest rate risk from cash held on deposit. Market forces (in terms of a general increase
or decrease in interest rates in a particular currency) may therefore have a detrimental or positive effect on the cash
flows from cash deposits. As cash deposits are available on demand, there is no fair value risk from interest rates.
The Company does not actively manage interest rate risk as it is considered insignificant.
Currency risk
Currency risk is the risk that the fair value of, or future cash flows from, financial instruments will fluctuate because of
changes in foreign exchange rates.
The Company’s principal exposure to foreign currency risk comprises its investments priced in currencies other than
the base currency of the particular Class Fund, including cash balances in foreign currencies.
Foreign currency risk is managed through geographic investment restrictions and in some Class Funds, through use of
Forward Currency Contracts.
Exchange rate risk in foreign currency investments held in the Class Fund may be hedged back to the base currency of
the Class Fund using forward foreign exchange contracts.
The currency exposure of the Company at 30 September 2017 and 30 September 2016 is as follows:
Multi Manager Global Equity Fund (USD)
Investments
USD
Cash
USD
Other net
assets/(liabilities)
USD
Net assets
30 September
2017
USD
% of net
assets
30
September
2017
Net assets
30 September
2016
USD
% of net
assets
30
September
2016
EUR 3,473,033 – – 3,473,033 5.94 3,434,214 5.92
GBP 22,209,647 – 181,123 22,390,770 38.30 22,357,571 38.52
USD 32,543,702 390,646 (333,167) 32,601,181 55.76 32,251,930 55.56
58,226,382 390,646 (152,044) 58,464,984 100.00 58,043,715 100.00
Multi Manager Global Equity Fund (GBP)
Investments
GBP
Cash
GBP
Other net
assets/(liabilities)
GBP
Net assets
30 September
2017
GBP
% of net
assets
30
September
2017
Net assets
30 September
2016
GBP
% of net
assets
30
September
2016
EUR 3,035,423 – – 3,035,423 3.78 2,743,316 3 .83
GBP 51,496,911 338,460 (179,774) 51,655,597 64.27 46,715,225 65 .25
USD 25,674,829 4,819 – 25,679,648 31.95 22,137,729 30 .92
80,207,163 343,279 (179,774) 80,370,668 100.00 71,596,270 100.00
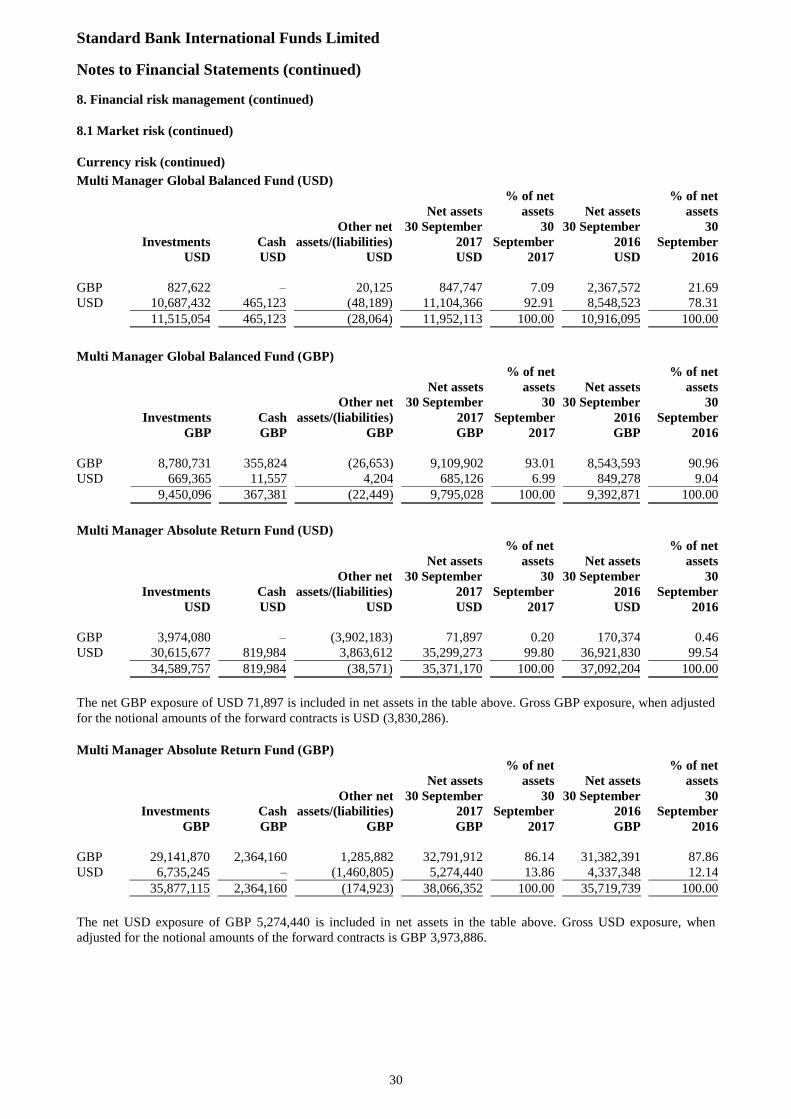
Standard Bank International Funds Limited
Notes to Financial Statements (continued)
30
8. Financial risk management (continued)
8.1 Market risk (continued)
Currency risk (continued)
Multi Manager Global Balanced Fund (USD)
Investments
USD
Cash
USD
Other net
assets/(liabilities)
USD
Net assets
30 September
2017
USD
% of net
assets
30
September
2017
Net assets
30 September
2016
USD
% of net
assets
30
September
2016
GBP 827,622 – 20,125 847,747 7.09 2,367,572 21.69
USD 10,687,432 465,123 (48,189) 11,104,366 92.91 8,548,523 78.31
11,515,054 465,123 (28,064) 11,952,113 100.00 10,916,095 100.00
Multi Manager Global Balanced Fund (GBP)
Investments
GBP
Cash
GBP
Other net
assets/(liabilities)
GBP
Net assets
30 September
2017
GBP
% of net
assets
30
September
2017
Net assets
30 September
2016
GBP
% of net
assets
30
September
2016
GBP 8,780,731 355,824 (26,653) 9,109,902 93.01 8,543,593 90 .96
USD 669,365 11,557 4,204 685,126 6.99 849,278 9 .04
9,450,096 367,381 (22,449) 9,795,028 100.00 9,392,871 100.00
Multi Manager Absolute Return Fund (USD)
Investments
USD
Cash
USD
Other net
assets/(liabilities)
USD
Net assets
30 September
2017
USD
% of net
assets
30
September
2017
Net assets
30 September
2016
USD
% of net
assets
30
September
2016
GBP 3,974,080 – (3,902,183) 71,897 0.20 170,374 0.46
USD 30,615,677 819,984 3,863,612 35,299,273 99.80 36,921,830 99.54
34,589,757 819,984 (38,571) 35,371,170 100.00 37,092,204 100.00
The net GBP exposure of USD 71,897 is included in net assets in the table above. Gross GBP exposure, when adjusted
for the notional amounts of the forward contracts is USD (3,830,286).
Multi Manager Absolute Return Fund (GBP)
Investments
GBP
Cash
GBP
Other net
assets/(liabilities)
GBP
Net assets
30 September
2017
GBP
% of net
assets
30
September
2017
Net assets
30 September
2016
GBP
% of net
assets
30
September
2016
GBP 29,141,870 2,364,160 1,285,882 32,791,912 86.14 31,382,391 87 .86
USD 6,735,245 – (1,460,805) 5,274,440 13.86 4,337,348 12 .14
35,877,115 2,364,160 (174,923) 38,066,352 100.00 35,719,739 100.00
The net USD exposure of GBP 5,274,440 is included in net assets in the table above. Gross USD exposure, when
adjusted for the notional amounts of the forward contracts is GBP 3,973,886.
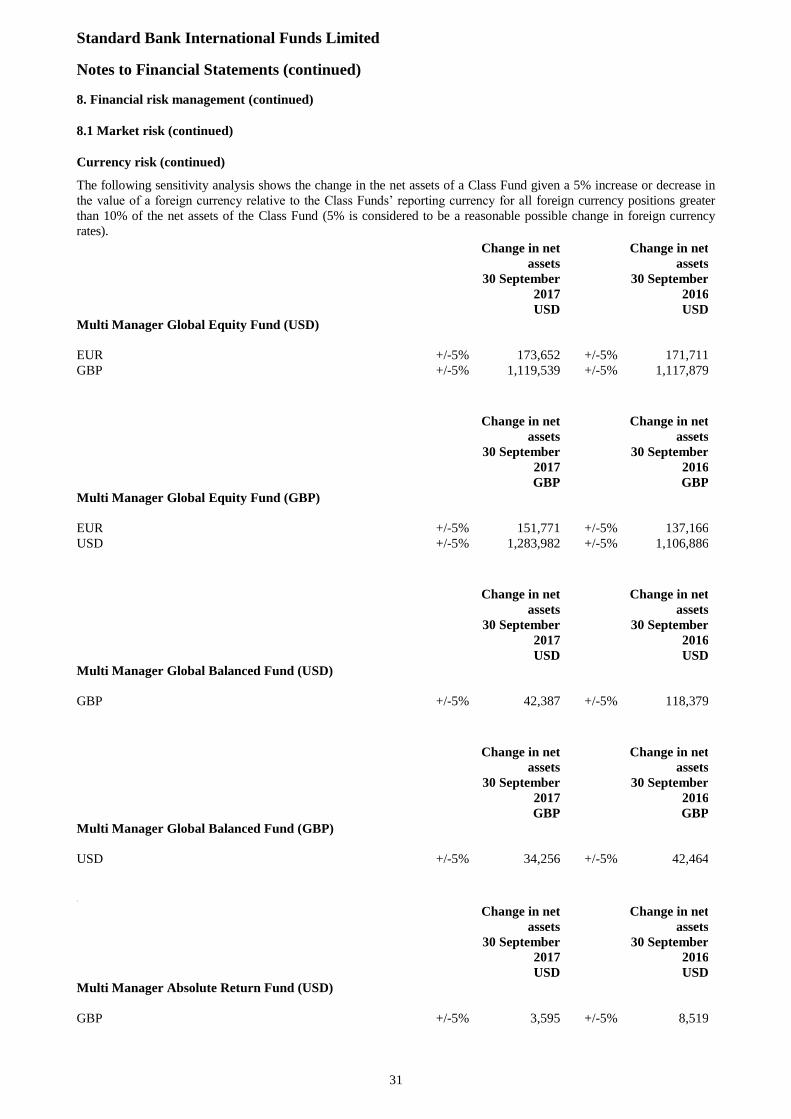
Standard Bank International Funds Limited
Notes to Financial Statements (continued)
31
8. Financial risk management (continued)
8.1 Market risk (continued)
Currency risk (continued)
The following sensitivity analysis shows the change in the net assets of a Class Fund given a 5% increase or decrease in
the value of a foreign currency relative to the Class Funds’ reporting currency for all foreign currency positions greater
than 10% of the net assets of the Class Fund (5% is considered to be a reasonable possible change in foreign currency
rates).
Change in net
assets
30 September
2017
USD
Change in net
assets
30 September
2016
USD
Multi Manager Global Equity Fund (USD)
EUR +/-5% 173,652 +/-5% 171,711
GBP +/-5% 1,119,539 +/-5% 1,117,879
Change in net
assets
30 September
2017
GBP
Change in net
assets
30 September
2016
GBP
Multi Manager Global Equity Fund (GBP)
EUR +/-5% 151,771 +/-5% 137,166
USD +/-5% 1,283,982 +/-5% 1,106,886
Change in net
assets
30 September
2017
USD
Change in net
assets
30 September
2016
USD
Multi Manager Global Balanced Fund (USD)
GBP +/-5% 42,387 +/-5% 118,379
Change in net
assets
30 September
2017
GBP
Change in net
assets
30 September
2016
GBP
Multi Manager Global Balanced Fund (GBP)
USD +/-5% 34,256 +/-5% 42,464
`St
Change in net
assets
30 September
2017
USD
Change in net
assets
30 September
2016
USD
Multi Manager Absolute Return Fund (USD)
GBP +/-5% 3,595 +/-5% 8,519
Standard Bank International Funds Limited
Notes to Financial Statements (continued)
32
8. Financial risk management (continued)
8.1 Market risk (continued)
Currency risk (continued)
Change in net
assets
30 September
2017
GBP
Change in net
assets
30 September
2016
GBP
Multi Manager Absolute Return Fund (GBP)
USD +/-5% 263,722 +/-5% 216,867
Forward exchange contracts are used to hedge against movements in foreign currency rates, mainly as a result of the
trading activity. However, some currency risk may arise from the portfolio of investments denominated in foreign
currencies as they fluctuate in market value, hence is considered as part of price risk.
8.2 Credit risk
Credit risk is the risk that the counterparties to the Company will be unable or unwilling to meet their obligations under
the contractual or agreed terms.
The Company’s maximum exposure to credit risk is represented by the carrying value of cash and debtors.
Cash and debtors are considered “Not Rated” and the credit risk associated with these items is considered insignificant.
The Class Funds are not exposed to credit risk from the Custodian as the Custodian maintains all assets of the Class
Funds in a segregated accounts, which are designated as client assets and are not co-mingled with any proprietary assets
of Capita Trust Company (Jersey) Limited or The Bank of New York Mellon SA/NV London Branch.
The Custodian, Link Corporate Services (Jersey) Limited is not rated with Standard & Poor’s, Moody’s or Fitch.
For the year ended 30 September 2017, the Sub-Custodian and Banker, The Bank of New York Mellon SA/NV London
Branch has a credit rating of AA- (2016: AA-) with Standard & Poor’s, Aa1 (2016 : Aa1) with Moody’s and AA-
(2016 : AA-) with Fitch.
8.3 Fair Value Hierarchy
The FRC has issued “Amendments to FRS 102 - Fair value hierarchy disclosures”, effective for accounting periods
beginning on or after 1 January 2017, with early adoption permitted. FRED 62 proposed to amend paragraphs 34.22
and 34.42 of FRS 102 to require disclosure of financial instruments held at fair value on the basis of a fair value
hierarchy consistent with EU-adopted IFRS based on Level 1, 2 and 3 classification. The Company has availed of early
adoption and the financial statements have been prepared in accordance with these amendments and fair value
measurement is categorised based on Level 1, 2 and 3. These amendments did not have any impact on the Funds'
financial position or performance.
The fair value of financial assets and liabilities traded in active markets (such as publicly traded derivatives and trading
securities) are based on quoted mid-market prices on the year end date.
An active market is a market in which transactions for the asset or liability take place with sufficient frequency and
volume to provide pricing information on an ongoing basis.
A financial instrument is regarded as quoted in an active market if quoted prices are readily and regularly available
from an exchange, dealer, broker, industry group, pricing service, or regulatory agency, and those prices represent
actual and regularly occurring market transactions on an arm’s length basis.
FRS 102 requires the Company to classify fair value measurements using a fair value hierarchy that reflects the
significance of the inputs used in making the measurements.
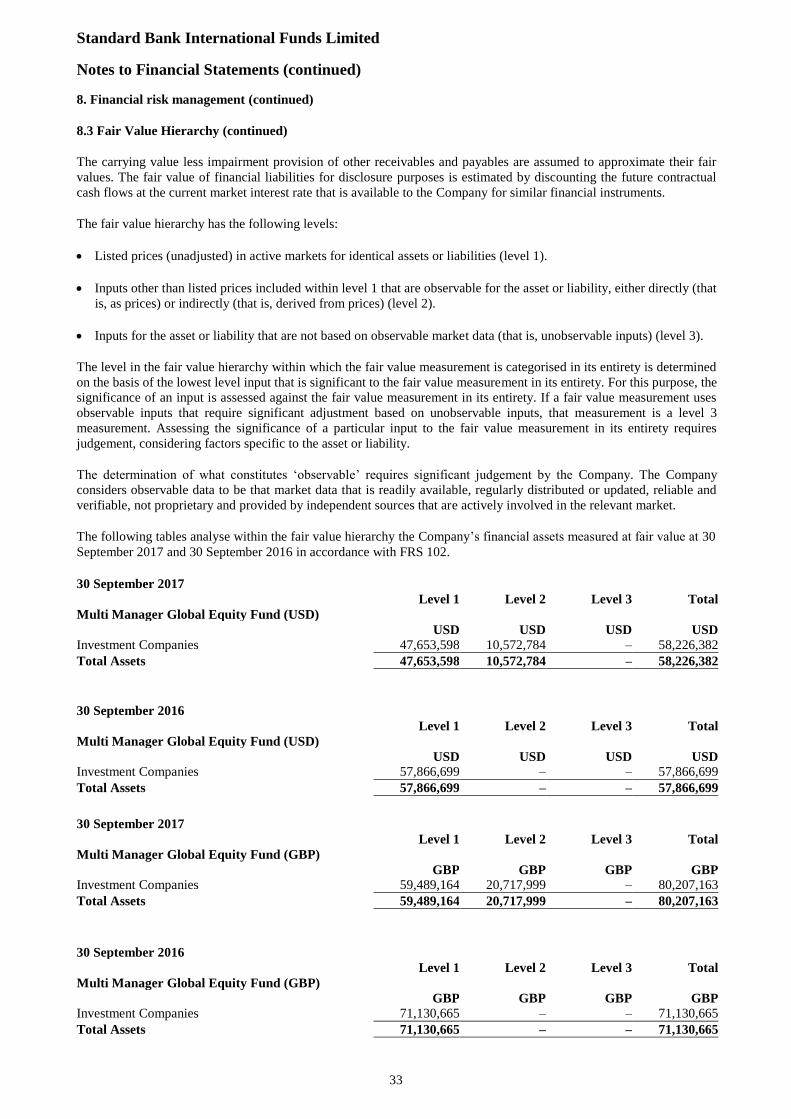
Standard Bank International Funds Limited
Notes to Financial Statements (continued)
33
8. Financial risk management (continued)
8.3 Fair Value Hierarchy (continued)
The carrying value less impairment provision of other receivables and payables are assumed to approximate their fair
values. The fair value of financial liabilities for disclosure purposes is estimated by discounting the future contractual
cash flows at the current market interest rate that is available to the Company for similar financial instruments.
The fair value hierarchy has the following levels:
Listed prices (unadjusted) in active markets for identical assets or liabilities (level 1).
Inputs other than listed prices included within level 1 that are observable for the asset or liability, either directly (that
is, as prices) or indirectly (that is, derived from prices) (level 2).
Inputs for the asset or liability that are not based on observable market data (that is, unobservable inputs) (level 3).
The level in the fair value hierarchy within which the fair value measurement is categorised in its entirety is determined
on the basis of the lowest level input that is significant to the fair value measurement in its entirety. For this purpose, the
significance of an input is assessed against the fair value measurement in its entirety. If a fair value measurement uses
observable inputs that require significant adjustment based on unobservable inputs, that measurement is a level 3
measurement. Assessing the significance of a particular input to the fair value measurement in its entirety requires
judgement, considering factors specific to the asset or liability.
The determination of what constitutes ‘observable’ requires significant judgement by the Company. The Company
considers observable data to be that market data that is readily available, regularly distributed or updated, reliable and
verifiable, not proprietary and provided by independent sources that are actively involved in the relevant market.
The following tables analyse within the fair value hierarchy the Company’s financial assets measured at fair value at 30
September 2017 and 30 September 2016 in accordance with FRS 102.
30 September 2017
Level 1 Level 2 Level 3 Total
Multi Manager Global Equity Fund (USD)
USD USD USD USD
Investment Companies 47,653,598 10,572,784 – 58,226,382
Total Assets 47,653,598 10,572,784 – 58,226,382
30 September 2016
Level 1 Level 2 Level 3 Total
Multi Manager Global Equity Fund (USD)
USD USD USD USD
Investment Companies 57,866,699 – – 57,866,699
Total Assets 57,866,699 – – 57,866,699
30 September 2017
Level 1 Level 2 Level 3 Total
Multi Manager Global Equity Fund (GBP)
GBP GBP GBP GBP
Investment Companies 59,489,164 20,717,999 – 80,207,163
Total Assets 59,489,164 20,717,999 – 80,207,163
30 September 2016
Level 1 Level 2 Level 3 Total
Multi Manager Global Equity Fund (GBP)
GBP GBP GBP GBP
Investment Companies 71,130,665 – – 71,130,665
Total Assets 71,130,665 – – 71,130,665
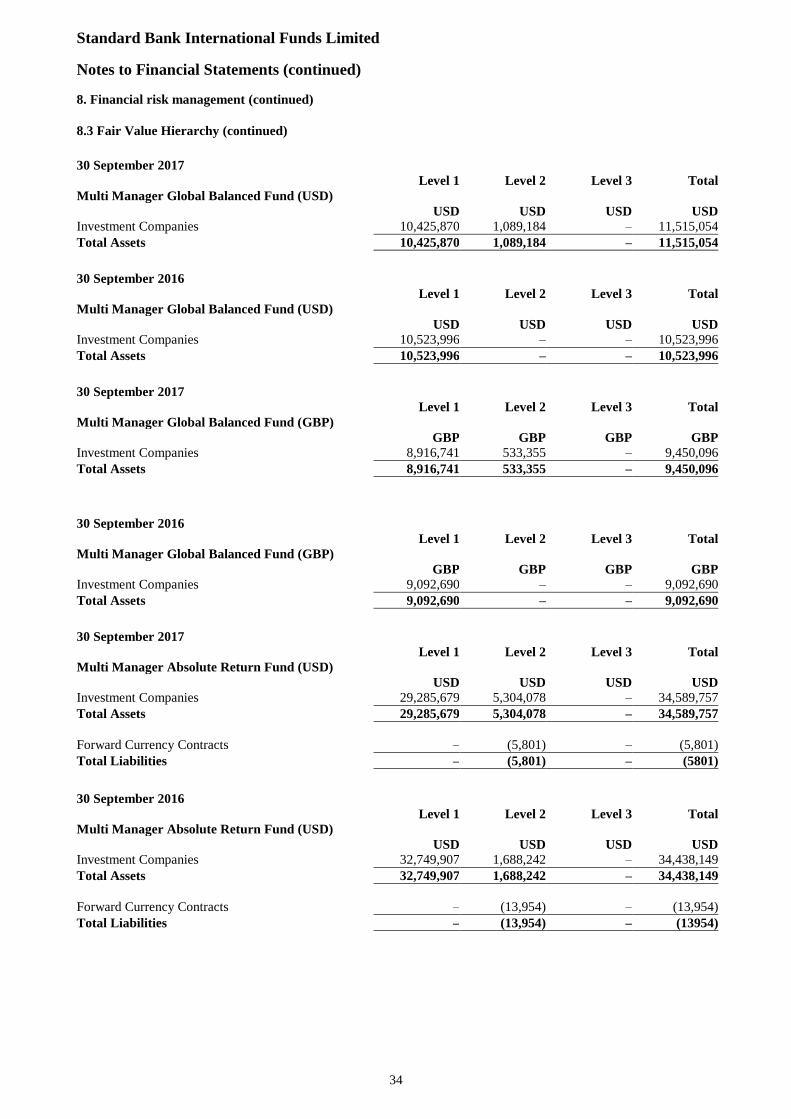
Standard Bank International Funds Limited
Notes to Financial Statements (continued)
34
8. Financial risk management (continued)
8.3 Fair Value Hierarchy (continued)
30 September 2017
Level 1 Level 2 Level 3 Total
Multi Manager Global Balanced Fund (USD)
USD USD USD USD
Investment Companies 10,425,870 1,089,184 – 11,515,054
Total Assets 10,425,870 1,089,184 – 11,515,054
30 September 2016
Level 1 Level 2 Level 3 Total
Multi Manager Global Balanced Fund (USD)
USD USD USD USD
Investment Companies 10,523,996 – – 10,523,996
Total Assets 10,523,996 – – 10,523,996
30 September 2017
Level 1 Level 2 Level 3 Total
Multi Manager Global Balanced Fund (GBP)
GBP GBP GBP GBP
Investment Companies 8,916,741 533,355 – 9,450,096
Total Assets 8,916,741 533,355 – 9,450,096
30 September 2016
Level 1 Level 2 Level 3 Total
Multi Manager Global Balanced Fund (GBP)
GBP GBP GBP GBP
Investment Companies 9,092,690 – – 9,092,690
Total Assets 9,092,690 – – 9,092,690
30 September 2017
Level 1 Level 2 Level 3 Total
Multi Manager Absolute Return Fund (USD)
USD USD USD USD
Investment Companies 29,285,679 5,304,078 – 34,589,757
Total Assets 29,285,679 5,304,078 – 34,589,757
Forward Currency Contracts – (5,801) – (5,801)
Total Liabilities – (5,801) – (5801)
30 September 2016
Level 1 Level 2 Level 3 Total
Multi Manager Absolute Return Fund (USD)
USD USD USD USD
Investment Companies 32,749,907 1,688,242 – 34,438,149
Total Assets 32,749,907 1,688,242 – 34,438,149
Forward Currency Contracts – (13,954) – (13,954)
Total Liabilities – (13,954) – (13954)
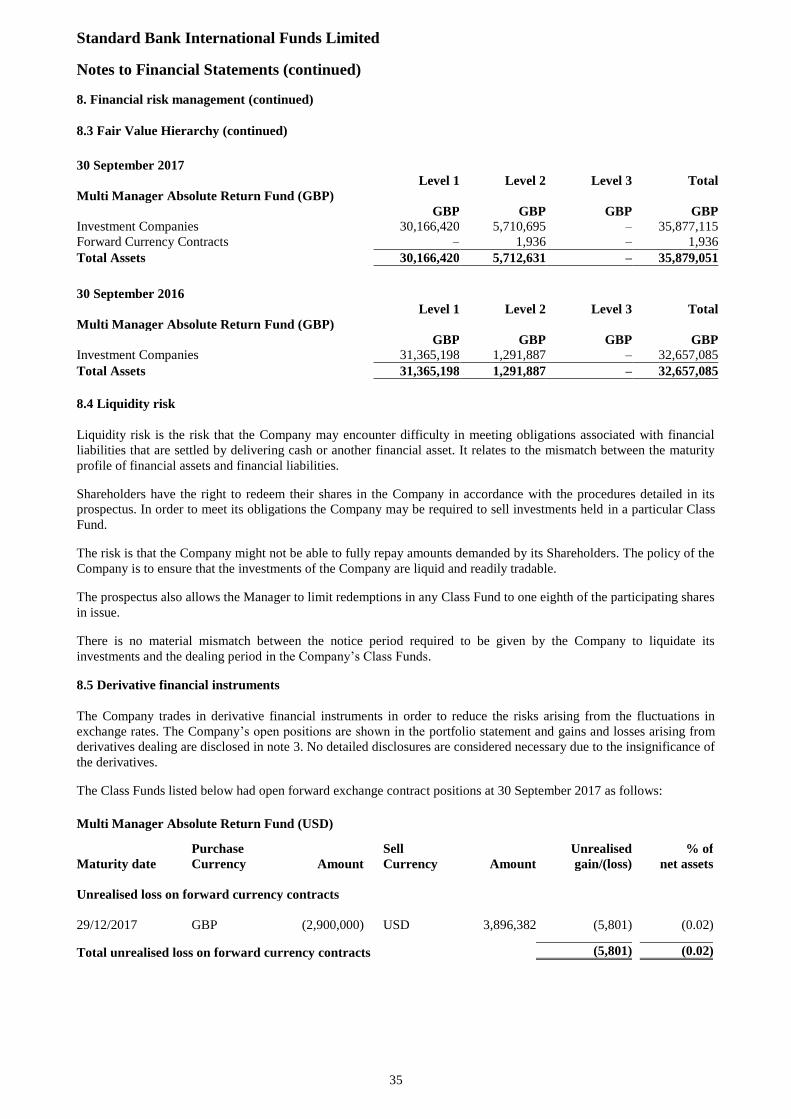
Standard Bank International Funds Limited
Notes to Financial Statements (continued)
35
8. Financial risk management (continued)
8.3 Fair Value Hierarchy (continued)
30 September 2017
Level 1 Level 2 Level 3 Total
Multi Manager Absolute Return Fund (GBP)
GBP GBP GBP GBP
Investment Companies 30,166,420 5,710,695 – 35,877,115
Forward Currency Contracts – 1,936 – 1,936
Total Assets 30,166,420 5,712,631 – 35,879,051
30 September 2016
Level 1 Level 2 Level 3 Total
Multi Manager Absolute Return Fund (GBP)
GBP GBP GBP GBP
Investment Companies 31,365,198 1,291,887 – 32,657,085
Total Assets 31,365,198 1,291,887 – 32,657,085
8.4 Liquidity risk
Liquidity risk is the risk that the Company may encounter difficulty in meeting obligations associated with financial
liabilities that are settled by delivering cash or another financial asset. It relates to the mismatch between the maturity
profile of financial assets and financial liabilities.
Shareholders have the right to redeem their shares in the Company in accordance with the procedures detailed in its
prospectus. In order to meet its obligations the Company may be required to sell investments held in a particular Class
Fund.
The risk is that the Company might not be able to fully repay amounts demanded by its Shareholders. The policy of the
Company is to ensure that the investments of the Company are liquid and readily tradable.
The prospectus also allows the Manager to limit redemptions in any Class Fund to one eighth of the participating shares
in issue.
There is no material mismatch between the notice period required to be given by the Company to liquidate its
investments and the dealing period in the Company’s Class Funds.
8.5 Derivative financial instruments
The Company trades in derivative financial instruments in order to reduce the risks arising from the fluctuations in
exchange rates. The Company’s open positions are shown in the portfolio statement and gains and losses arising from
derivatives dealing are disclosed in note 3. No detailed disclosures are considered necessary due to the insignificance of
the derivatives.
The Class Funds listed below had open forward exchange contract positions at 30 September 2017 as follows:
Multi Manager Absolute Return Fund (USD)
Purchase Sell Unrealised % of
Maturity date Currency Amount Currency Amount gain/(loss) net assets
Unrealised loss on forward currency contracts
29/12/2017 GBP (2,900,000) USD 3,896,382 (5,801) (0.02)
Total unrealised loss on forward currency contracts (5,801) (0.02)
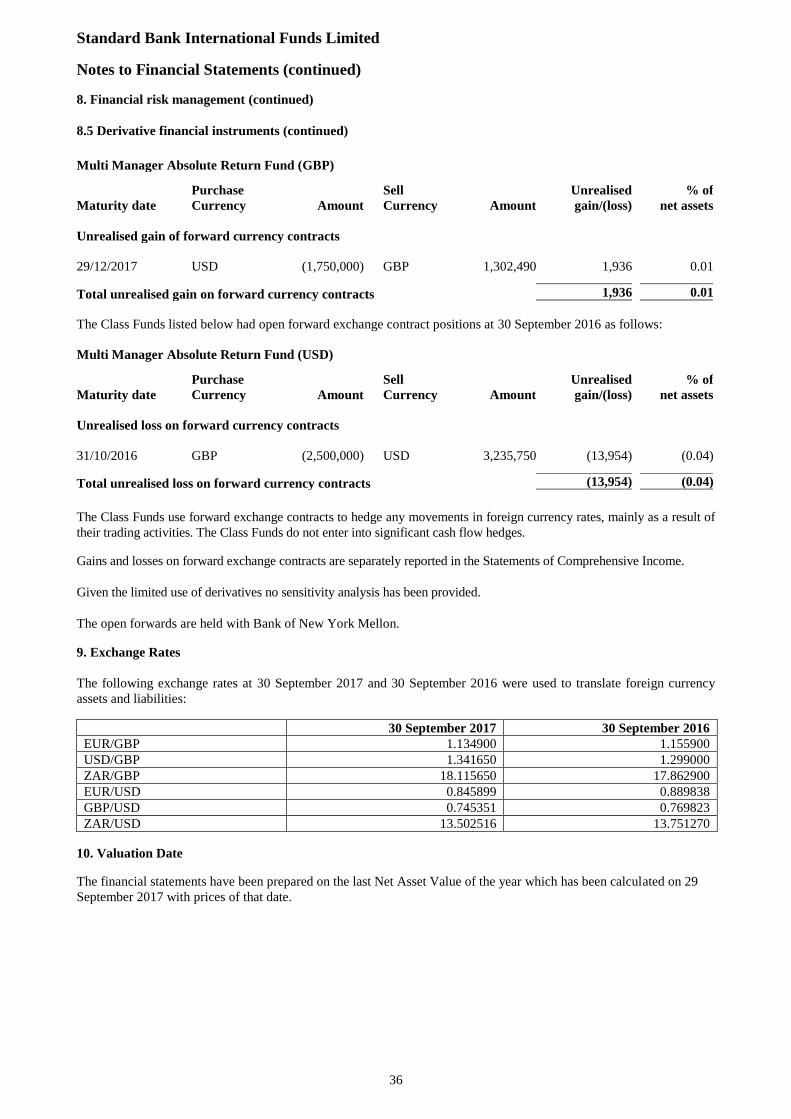
Standard Bank International Funds Limited
Notes to Financial Statements (continued)
36
8. Financial risk management (continued)
8.5 Derivative financial instruments (continued)
Multi Manager Absolute Return Fund (GBP)
Purchase Sell Unrealised % of
Maturity date Currency Amount Currency Amount gain/(loss) net assets
Unrealised gain of forward currency contracts
29/12/2017 USD (1,750,000) GBP 1,302,490 1,936 0.01
Total unrealised gain on forward currency contracts 1,936 0.01
The Class Funds listed below had open forward exchange contract positions at 30 September 2016 as follows:
Multi Manager Absolute Return Fund (USD)
Purchase Sell Unrealised % of
Maturity date Currency Amount Currency Amount gain/(loss) net assets
Unrealised loss on forward currency contracts
31/10/2016 GBP (2,500,000) USD 3,235,750 (13,954) (0.04)
Total unrealised loss on forward currency contracts (13,954) (0.04)
The Class Funds use forward exchange contracts to hedge any movements in foreign currency rates, mainly as a result of
their trading activities. The Class Funds do not enter into significant cash flow hedges.
Gains and losses on forward exchange contracts are separately reported in the Statements of Comprehensive Income.
Given the limited use of derivatives no sensitivity analysis has been provided.
The open forwards are held with Bank of New York Mellon.
9. Exchange Rates
The following exchange rates at 30 September 2017 and 30 September 2016 were used to translate foreign currency
assets and liabilities:
30 September 2017 30 September 2016
EUR/GBP 1.134900 1.155900
USD/GBP 1.341650 1.299000
ZAR/GBP 18.115650 17.862900
EUR/USD 0.845899 0.889838
GBP/USD 0.745351 0.769823
ZAR/USD 13.502516 13.751270
10. Valuation Date
The financial statements have been prepared on the last Net Asset Value of the year which has been calculated on 29
September 2017 with prices of that date.
Standard Bank International Funds Limited
Notes to Financial Statements (continued)
37
11. Significant events during the year
Multi Manager Global Equity (USD) - Class C Shares, Multi Manager Global Equity (USD) - Class X Shares, Multi
Manager Global Equity (GBP) - Class C Shares, Multi Manager Global Balanced (USD) - Class C Shares, Multi
Manager Global Balanced (GBP) - Class C Shares, Multi Manager Absolute Return (USD) - Class X Shares, Multi
Manager Global Balanced (USD) - Class X Shares and Multi Manager Global Balanced (GBP) – Class X Shares
classes have been launched on 13 February 2017, 17 March 2017, 2 February 2017, 27 February 2017, 7 February
2017, 17 March 2017, 28 July 2017 and 25 August 2017 respectively. Multi Manager Absolute Return (USD) Class A
Shares and Multi Manager Absolute Return (GBP) Class A Shares transferred to Multi Manager Absolute Return
(USD) Class C Shares and Multi Manager Absolute Return (GBP) Class C Shares on 1 February 2017. Multi Manager
Absolute Return (GBP) - Class X Shares and Multi Manager Global Equity (GBP) - Class X Shares classes have been
launched on 17 March 2017 and 10 April 2017 respectively.
An updated prospectus was issued in February 2017.
A reduction of the management fees was effective from 1 February 2017, and a Manager Administration fees was
introduced at the same date, as detailed in note 7.
Effective 1 September 2017, the registered address of BNY Mellon Fund Services (Ireland) Designated Activity
Company was changed to One Dockland Central, Guild Street, International Financial Services Centre, Dublin 1,
Ireland.
There were no other significant events during the year that require disclosure in these financial statements.
12. Post Balance Sheet events
An updated prospectus was issued in October 2017.
Capita Trust Company (Jersey) Limited was acquired by the Link Administration Holdings Limited on 6 November
2017 and has been renamed Link Corporate Services (Jersey) Limited.
There were no other significant post balance sheet events that require disclosure in these financial statements.
13. Approval of Financial Statements
The financial statements were approved by the Board of Directors on 10 January 2018.
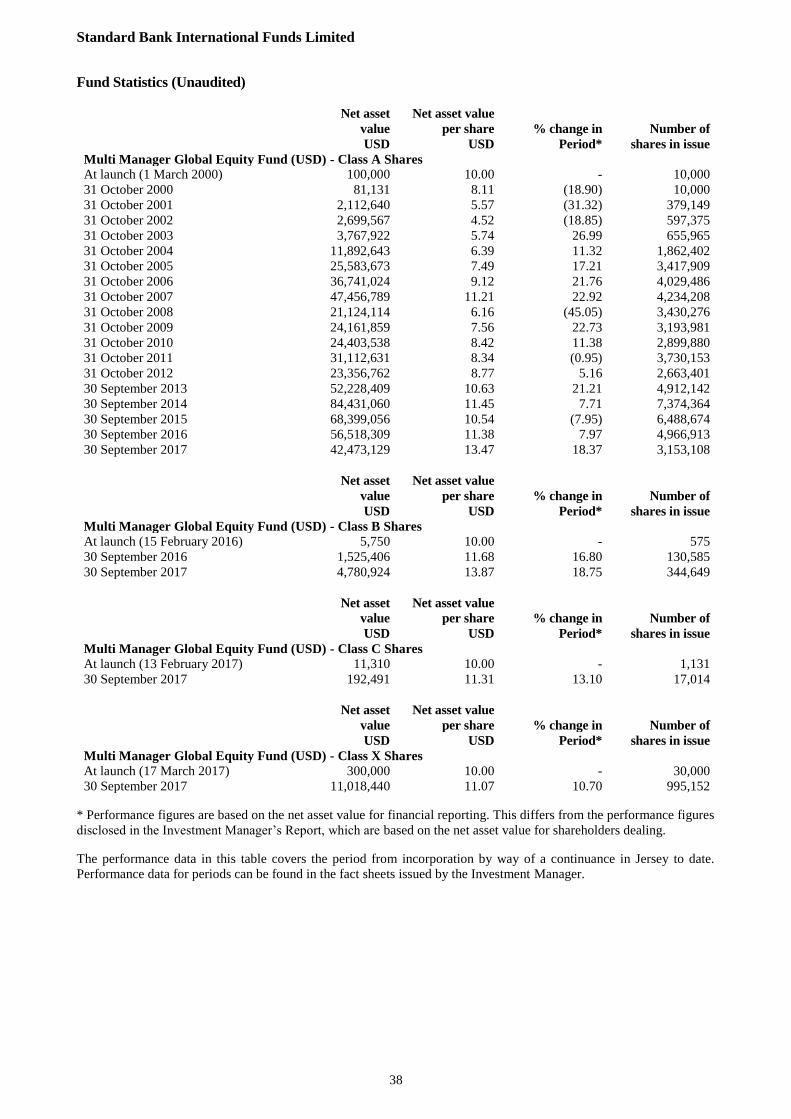
Standard Bank International Funds Limited
38
Fund Statistics (Unaudited)
Net asset
value
Net asset value
per share % change in Number of
USD USD Period* shares in issue
Multi Manager Global Equity Fund (USD) - Class A Shares
At launch (1 March 2000) 100,000 10.00 - 10,000
31 October 2000 81,131 8.11 (18.90) 10,000
31 October 2001 2,112,640 5.57 (31.32) 379,149
31 October 2002 2,699,567 4.52 (18.85) 597,375
31 October 2003 3,767,922 5.74 26.99 655,965
31 October 2004 11,892,643 6.39 11.32 1,862,402
31 October 2005 25,583,673 7.49 17.21 3,417,909
31 October 2006 36,741,024 9.12 21.76 4,029,486
31 October 2007 47,456,789 11.21 22.92 4,234,208
31 October 2008 21,124,114 6.16 (45.05) 3,430,276
31 October 2009 24,161,859 7.56 22.73 3,193,981
31 October 2010 24,403,538 8.42 11.38 2,899,880
31 October 2011 31,112,631 8.34 (0.95) 3,730,153
31 October 2012 23,356,762 8.77 5.16 2,663,401
30 September 2013 52,228,409 10.63 21.21 4,912,142
30 September 2014 84,431,060 11.45 7.71 7,374,364
30 September 2015 68,399,056 10.54 (7.95) 6,488,674
30 September 2016 56,518,309 11.38 7.97 4,966,913
30 September 2017 42,473,129 13.47 18.37 3,153,108
Net asset
value
Net asset value
per share % change in Number of
USD USD Period* shares in issue
Multi Manager Global Equity Fund (USD) - Class B Shares
At launch (15 February 2016) 5,750 10.00 - 575
30 September 2016 1,525,406 11.68 16.80 130,585
30 September 2017 4,780,924 13.87 18.75 344,649
Net asset
value
Net asset value
per share % change in Number of
USD USD Period* shares in issue
Multi Manager Global Equity Fund (USD) - Class C Shares
At launch (13 February 2017) 11,310 10.00 - 1,131
30 September 2017 192,491 11.31 13.10 17,014
Net asset
value
Net asset value
per share % change in Number of
USD USD Period* shares in issue
Multi Manager Global Equity Fund (USD) - Class X Shares
At launch (17 March 2017) 300,000 10.00 - 30,000
30 September 2017 11,018,440 11.07 10.70 995,152
* Performance figures are based on the net asset value for financial reporting. This differs from the performance figures
disclosed in the Investment Manager’s Report, which are based on the net asset value for shareholders dealing.
The performance data in this table covers the period from incorporation by way of a continuance in Jersey to date.
Performance data for periods can be found in the fact sheets issued by the Investment Manager.

Standard Bank International Funds Limited
39
Fund Statistics (Unaudited) (continued)
Net asset
value
Net asset value
per share % change in Number of
GBP GBP Period* shares in issue
Multi Manager Global Equity Fund (GBP) - Class A Shares
At launch (1 March 2000) 100,000 10.00 - 10,000
31 October 2000 88,198 8.82 (11.80) 10,000
31 October 2001 1,613,954 6.39 (27.55) 252,640
31 October 2002 1,570,929 5.16 (19.25) 304,642
31 October 2003 4,885,436 6.33 22.67 772,012
31 October 2004 14,010,880 6.82 7.74 2,055,238
31 October 2005 36,616,712 8.20 20.23 4,465,414
31 October 2006 59,702,648 9.64 17.56 6,190,594
31 October 2007 73,402,794 10.96 13.69 6,697,357
31 October 2008 38,954,839 7.16 (34.67) 5,439,281
31 October 2009 42,396,390 8.91 24.44 4,757,702
31 October 2010 46,089,490 10.13 13.69 4,551,880
31 October 2011 53,094,916 10.22 0.89 5,193,665
31 October 2012 43,056,018 11.15 9.10 3,862,123
30 September 2013 71,936,305 13.63 22.24 5,277,351
30 September 2014 77,550,464 14.53 6.60 5,337,203
30 September 2015 70,553,368 14.74 1.45 4,786,248
30 September 2016 70,526,367 17.52 18.86 4,025,705
30 September 2017 75,769,036 20.34 16.10 3,725,861
Net asset
value
Net asset value
per share % change in Number of
GBP GBP Period* shares in issue
Multi Manager Global Equity Fund (GBP) - Class B Shares
At launch (15 February 2016) 5,490 10.00 - 549
30 September 2016 1,069,903 12.49 24.90 85,640
30 September 2017 2,512,735 14.55 16.49 172,735
Net asset
value
Net asset value
per share % change in Number of
GBP GBP Period* shares in issue
Multi Manager Global Equity Fund (GBP) - Class C Shares
At launch (2 February 2017) 45,830 10.00 - 4,583
30 September 2017 598,946 10.92 9.20 54,869
Net asset
value
Net asset value
per share % change in Number of
USD USD Period* shares in issue
Multi Manager Global Equity Fund (GBP) - Class X Shares
At launch (10 April 2017) 490,100 10.00 - 49,010
30 September 2017 1,489,951 10.43 4.30 142,784
* Performance figures are based on the net asset value for financial reporting. This differs from the performance figures
disclosed in the Investment Manager’s Report, which are based on the net asset value for shareholders dealing.
The performance data in this table covers the period from incorporation by way of a continuance in Jersey to date.
Performance data for periods can be found in the fact sheets issued by the Investment Manager.
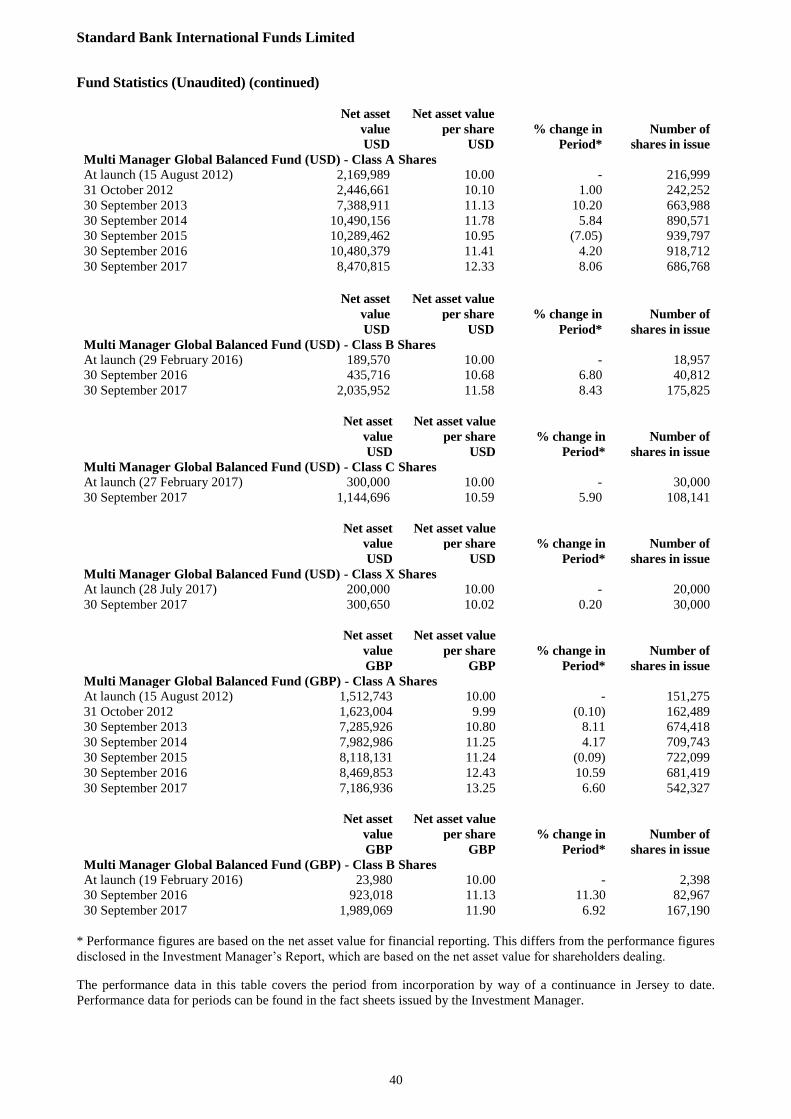
Standard Bank International Funds Limited
40
Fund Statistics (Unaudited) (continued)
Net asset
value
Net asset value
per share % change in Number of
USD USD Period* shares in issue
Multi Manager Global Balanced Fund (USD) - Class A Shares
At launch (15 August 2012) 2,169,989 10.00 - 216,999
31 October 2012 2,446,661 10.10 1.00 242,252
30 September 2013 7,388,911 11.13 10.20 663,988
30 September 2014 10,490,156 11.78 5.84 890,571
30 September 2015 10,289,462 10.95 (7.05) 939,797
30 September 2016 10,480,379 11.41 4.20 918,712
30 September 2017 8,470,815 12.33 8.06 686,768
Net asset
value
Net asset value
per share % change in Number of
USD USD Period* shares in issue
Multi Manager Global Balanced Fund (USD) - Class B Shares
At launch (29 February 2016) 189,570 10.00 - 18,957
30 September 2016 435,716 10.68 6.80 40,812
30 September 2017 2,035,952 11.58 8.43 175,825
Net asset
value
Net asset value
per share % change in Number of
USD USD Period* shares in issue
Multi Manager Global Balanced Fund (USD) - Class C Shares
At launch (27 February 2017) 300,000 10.00 - 30,000
30 September 2017 1,144,696 10.59 5.90 108,141
Net asset
value
Net asset value
per share % change in Number of
USD USD Period* shares in issue
Multi Manager Global Balanced Fund (USD) - Class X Shares
At launch (28 July 2017) 200,000 10.00 - 20,000
30 September 2017 300,650 10.02 0.20 30,000
Net asset
value
Net asset value
per share % change in Number of
GBP GBP Period* shares in issue
Multi Manager Global Balanced Fund (GBP) - Class A Shares
At launch (15 August 2012) 1,512,743 10.00 - 151,275
31 October 2012 1,623,004 9.99 (0.10) 162,489
30 September 2013 7,285,926 10.80 8.11 674,418
30 September 2014 7,982,986 11.25 4.17 709,743
30 September 2015 8,118,131 11.24 (0.09) 722,099
30 September 2016 8,469,853 12.43 10.59 681,419
30 September 2017 7,186,936 13.25 6.60 542,327
Net asset
value
Net asset value
per share % change in Number of
GBP GBP Period* shares in issue
Multi Manager Global Balanced Fund (GBP) - Class B Shares
At launch (19 February 2016) 23,980 10.00 - 2,398
30 September 2016 923,018 11.13 11.30 82,967
30 September 2017 1,989,069 11.90 6.92 167,190
* Performance figures are based on the net asset value for financial reporting. This differs from the performance figures
disclosed in the Investment Manager’s Report, which are based on the net asset value for shareholders dealing.
The performance data in this table covers the period from incorporation by way of a continuance in Jersey to date.
Performance data for periods can be found in the fact sheets issued by the Investment Manager.
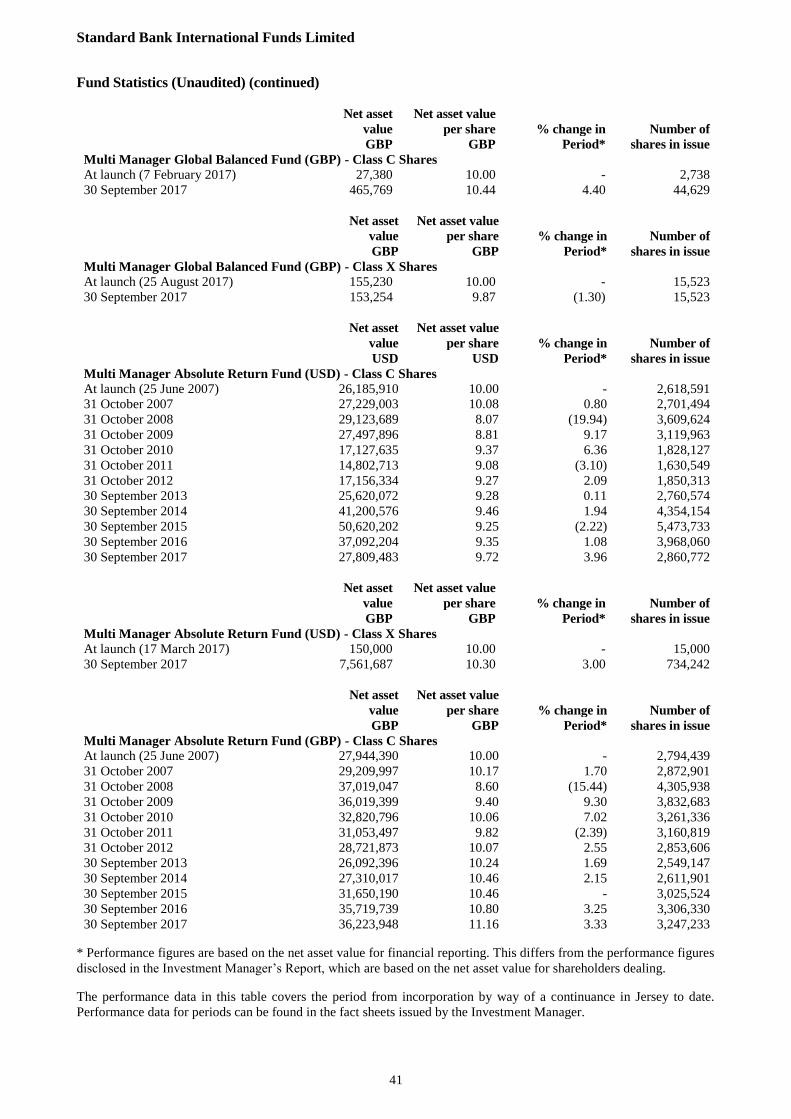
Standard Bank International Funds Limited
41
Fund Statistics (Unaudited) (continued)
Net asset
value
Net asset value
per share % change in Number of
GBP GBP Period* shares in issue
Multi Manager Global Balanced Fund (GBP) - Class C Shares
At launch (7 February 2017) 27,380 10.00 - 2,738
30 September 2017 465,769 10.44 4.40 44,629
Net asset
value
Net asset value
per share % change in Number of
GBP GBP Period* shares in issue
Multi Manager Global Balanced Fund (GBP) - Class X Shares
At launch (25 August 2017) 155,230 10.00 - 15,523
30 September 2017 153,254 9.87 (1.30) 15,523
Net asset
value
Net asset value
per share % change in Number of
USD USD Period* shares in issue
Multi Manager Absolute Return Fund (USD) - Class C Shares
At launch (25 June 2007) 26,185,910 10.00 - 2,618,591
31 October 2007 27,229,003 10.08 0.80 2,701,494
31 October 2008 29,123,689 8.07 (19.94) 3,609,624
31 October 2009 27,497,896 8.81 9.17 3,119,963
31 October 2010 17,127,635 9.37 6.36 1,828,127
31 October 2011 14,802,713 9.08 (3.10) 1,630,549
31 October 2012 17,156,334 9.27 2.09 1,850,313
30 September 2013 25,620,072 9.28 0.11 2,760,574
30 September 2014 41,200,576 9.46 1.94 4,354,154
30 September 2015 50,620,202 9.25 (2.22) 5,473,733
30 September 2016 37,092,204 9.35 1.08 3,968,060
30 September 2017 27,809,483 9.72 3.96 2,860,772
Net asset
value
Net asset value
per share % change in Number of
GBP GBP Period* shares in issue
Multi Manager Absolute Return Fund (USD) - Class X Shares
At launch (17 March 2017) 150,000 10.00 - 15,000
30 September 2017 7,561,687 10.30 3.00 734,242
Net asset
value
Net asset value
per share % change in Number of
GBP GBP Period* shares in issue
Multi Manager Absolute Return Fund (GBP) - Class C Shares
At launch (25 June 2007) 27,944,390 10.00 - 2,794,439
31 October 2007 29,209,997 10.17 1.70 2,872,901
31 October 2008 37,019,047 8.60 (15.44) 4,305,938
31 October 2009 36,019,399 9.40 9.30 3,832,683
31 October 2010 32,820,796 10.06 7.02 3,261,336
31 October 2011 31,053,497 9.82 (2.39) 3,160,819
31 October 2012 28,721,873 10.07 2.55 2,853,606
30 September 2013 26,092,396 10.24 1.69 2,549,147
30 September 2014 27,310,017 10.46 2.15 2,611,901
30 September 2015 31,650,190 10.46 - 3,025,524
30 September 2016 35,719,739 10.80 3.25 3,306,330
30 September 2017 36,223,948 11.16 3.33 3,247,233
* Performance figures are based on the net asset value for financial reporting. This differs from the performance figures
disclosed in the Investment Manager’s Report, which are based on the net asset value for shareholders dealing.
The performance data in this table covers the period from incorporation by way of a continuance in Jersey to date.
Performance data for periods can be found in the fact sheets issued by the Investment Manager.
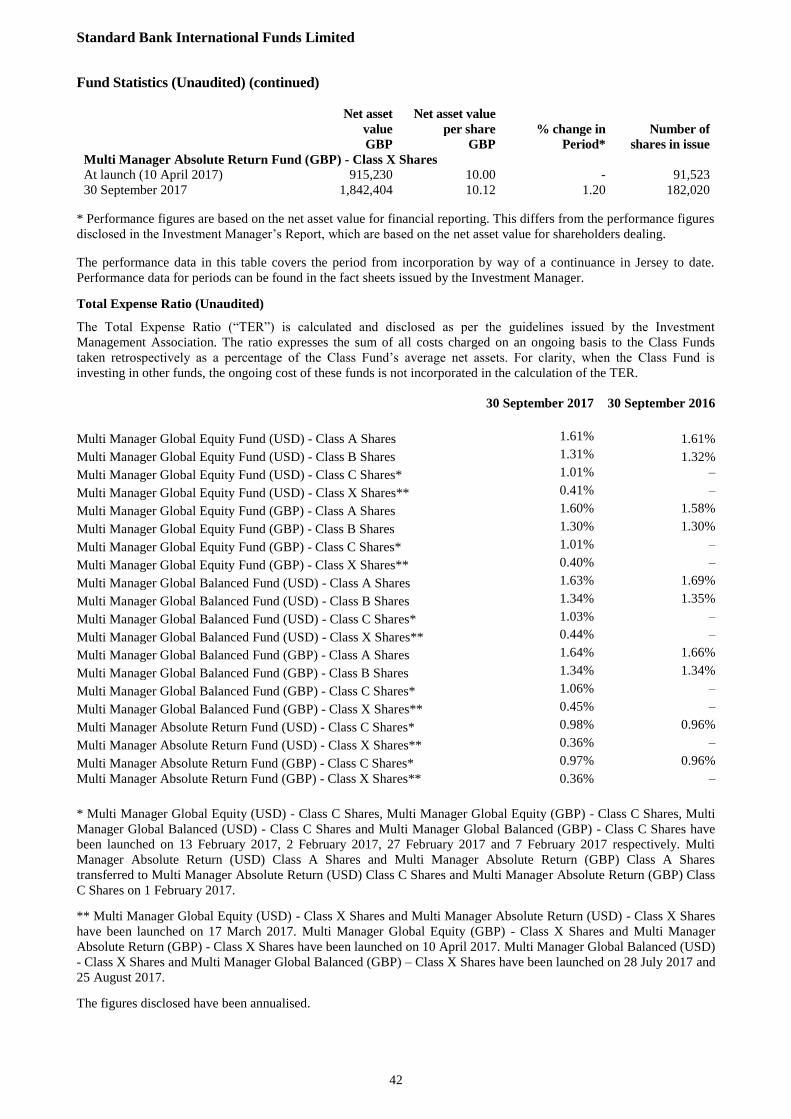
Standard Bank International Funds Limited
42
Fund Statistics (Unaudited) (continued)
Net asset
value
Net asset value
per share % change in Number of
GBP GBP Period* shares in issue
Multi Manager Absolute Return Fund (GBP) - Class X Shares
At launch (10 April 2017) 915,230 10.00 - 91,523
30 September 2017 1,842,404 10.12 1.20 182,020
* Performance figures are based on the net asset value for financial reporting. This differs from the performance figures
disclosed in the Investment Manager’s Report, which are based on the net asset value for shareholders dealing.
The performance data in this table covers the period from incorporation by way of a continuance in Jersey to date.
Performance data for periods can be found in the fact sheets issued by the Investment Manager.
Total Expense Ratio (Unaudited)
The Total Expense Ratio (“TER”) is calculated and disclosed as per the guidelines issued by the Investment
Management Association. The ratio expresses the sum of all costs charged on an ongoing basis to the Class Funds
taken retrospectively as a percentage of the Class Fund’s average net assets. For clarity, when the Class Fund is
investing in other funds, the ongoing cost of these funds is not incorporated in the calculation of the TER.
30 September 2017 30 September 2016
Multi Manager Global Equity Fund (USD) - Class A Shares 1.61% 1.61%
Multi Manager Global Equity Fund (USD) - Class B Shares 1.31% 1.32%
Multi Manager Global Equity Fund (USD) - Class C Shares* 1.01% –
Multi Manager Global Equity Fund (USD) - Class X Shares** 0.41% –
Multi Manager Global Equity Fund (GBP) - Class A Shares 1.60% 1.58%
Multi Manager Global Equity Fund (GBP) - Class B Shares 1.30% 1.30%
Multi Manager Global Equity Fund (GBP) - Class C Shares* 1.01% –
Multi Manager Global Equity Fund (GBP) - Class X Shares** 0.40% –
Multi Manager Global Balanced Fund (USD) - Class A Shares 1.63% 1.69%
Multi Manager Global Balanced Fund (USD) - Class B Shares 1.34% 1.35%
Multi Manager Global Balanced Fund (USD) - Class C Shares* 1.03% –
Multi Manager Global Balanced Fund (USD) - Class X Shares** 0.44% –
Multi Manager Global Balanced Fund (GBP) - Class A Shares 1.64% 1.66%
Multi Manager Global Balanced Fund (GBP) - Class B Shares 1.34% 1.34%
Multi Manager Global Balanced Fund (GBP) - Class C Shares* 1.06% –
Multi Manager Global Balanced Fund (GBP) - Class X Shares** 0.45% –
Multi Manager Absolute Return Fund (USD) - Class C Shares* 0.98% 0.96%
Multi Manager Absolute Return Fund (USD) - Class X Shares** 0.36% –
Multi Manager Absolute Return Fund (GBP) - Class C Shares* 0.97% 0.96%
Multi Manager Absolute Return Fund (GBP) - Class X Shares** 0.36% –
* Multi Manager Global Equity (USD) - Class C Shares, Multi Manager Global Equity (GBP) - Class C Shares, Multi
Manager Global Balanced (USD) - Class C Shares and Multi Manager Global Balanced (GBP) - Class C Shares have
been launched on 13 February 2017, 2 February 2017, 27 February 2017 and 7 February 2017 respectively. Multi
Manager Absolute Return (USD) Class A Shares and Multi Manager Absolute Return (GBP) Class A Shares
transferred to Multi Manager Absolute Return (USD) Class C Shares and Multi Manager Absolute Return (GBP) Class
C Shares on 1 February 2017.
** Multi Manager Global Equity (USD) - Class X Shares and Multi Manager Absolute Return (USD) - Class X Shares
have been launched on 17 March 2017. Multi Manager Global Equity (GBP) - Class X Shares and Multi Manager
Absolute Return (GBP) - Class X Shares have been launched on 10 April 2017. Multi Manager Global Balanced (USD)
- Class X Shares and Multi Manager Global Balanced (GBP) – Class X Shares have been launched on 28 July 2017 and
25 August 2017.
The figures disclosed have been annualised.
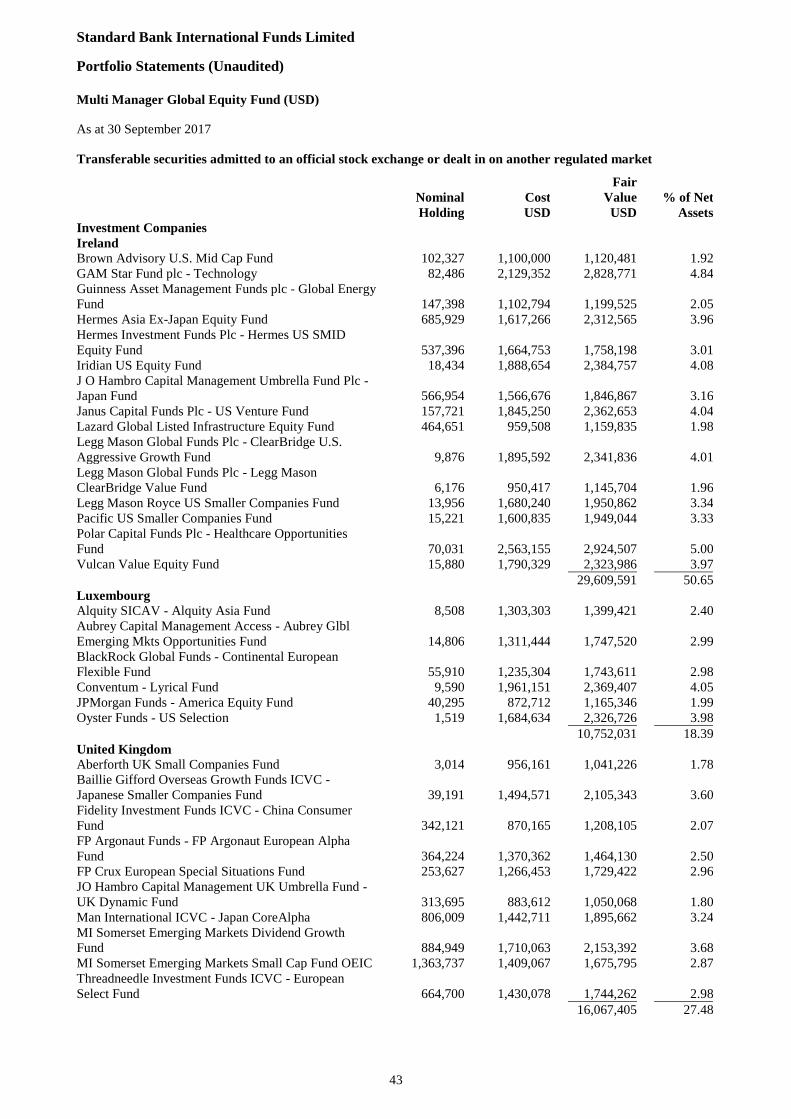
Standard Bank International Funds Limited
Portfolio Statements (Unaudited)
43
Multi Manager Global Equity Fund (USD)
As at 30 September 2017
Transferable securities admitted to an official stock exchange or dealt in on another regulated market
Nominal
Holding
Cost
USD
Fair
Value
USD
% of Net
Assets
Investment Companies
Ireland
Brown Advisory U.S. Mid Cap Fund 102,327 1,100,000 1,120,481 1.92
GAM Star Fund plc - Technology 82,486 2,129,352 2,828,771 4.84
Guinness Asset Management Funds plc - Global Energy
Fund 147,398 1,102,794 1,199,525 2.05
Hermes Asia Ex-Japan Equity Fund 685,929 1,617,266 2,312,565 3.96
Hermes Investment Funds Plc - Hermes US SMID
Equity Fund 537,396 1,664,753 1,758,198 3.01
Iridian US Equity Fund 18,434 1,888,654 2,384,757 4.08
J O Hambro Capital Management Umbrella Fund Plc -
Japan Fund 566,954 1,566,676 1,846,867 3.16
Janus Capital Funds Plc - US Venture Fund 157,721 1,845,250 2,362,653 4.04
Lazard Global Listed Infrastructure Equity Fund 464,651 959,508 1,159,835 1.98
Legg Mason Global Funds Plc - ClearBridge U.S.
Aggressive Growth Fund 9,876 1,895,592 2,341,836 4.01
Legg Mason Global Funds Plc - Legg Mason
ClearBridge Value Fund 6,176 950,417 1,145,704 1.96
Legg Mason Royce US Smaller Companies Fund 13,956 1,680,240 1,950,862 3.34
Pacific US Smaller Companies Fund 15,221 1,600,835 1,949,044 3.33
Polar Capital Funds Plc - Healthcare Opportunities
Fund 70,031 2,563,155 2,924,507 5.00
Vulcan Value Equity Fund 15,880 1,790,329 2,323,986 3.97
29,609,591 50.65
Luxembourg
Alquity SICAV - Alquity Asia Fund 8,508 1,303,303 1,399,421 2.40
Aubrey Capital Management Access - Aubrey Glbl
Emerging Mkts Opportunities Fund 14,806 1,311,444 1,747,520 2.99
BlackRock Global Funds - Continental European
Flexible Fund 55,910 1,235,304 1,743,611 2.98
Conventum - Lyrical Fund 9,590 1,961,151 2,369,407 4.05
JPMorgan Funds - America Equity Fund 40,295 872,712 1,165,346 1.99
Oyster Funds - US Selection 1,519 1,684,634 2,326,726 3.98
10,752,031 18.39
United Kingdom
Aberforth UK Small Companies Fund 3,014 956,161 1,041,226 1.78
Baillie Gifford Overseas Growth Funds ICVC -
Japanese Smaller Companies Fund 39,191 1,494,571 2,105,343 3.60
Fidelity Investment Funds ICVC - China Consumer
Fund 342,121 870,165 1,208,105 2.07
FP Argonaut Funds - FP Argonaut European Alpha
Fund 364,224 1,370,362 1,464,130 2.50
FP Crux European Special Situations Fund 253,627 1,266,453 1,729,422 2.96
JO Hambro Capital Management UK Umbrella Fund -
UK Dynamic Fund 313,695 883,612 1,050,068 1.80
Man International ICVC - Japan CoreAlpha 806,009 1,442,711 1,895,662 3.24
MI Somerset Emerging Markets Dividend Growth
Fund 884,949 1,710,063 2,153,392 3.68
MI Somerset Emerging Markets Small Cap Fund OEIC 1,363,737 1,409,067 1,675,795 2.87
Threadneedle Investment Funds ICVC - European
Select Fund 664,700 1,430,078 1,744,262 2.98
16,067,405 27.48
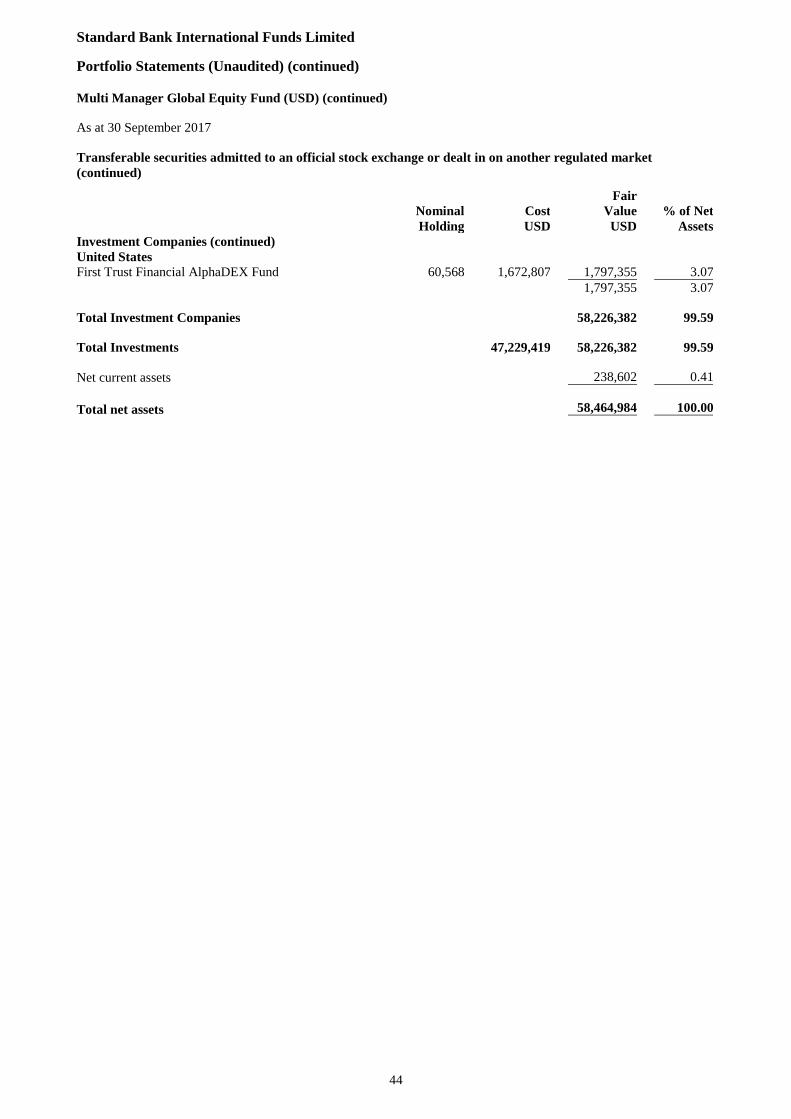
Standard Bank International Funds Limited
Portfolio Statements (Unaudited) (continued)
44
Multi Manager Global Equity Fund (USD) (continued)
As at 30 September 2017
Transferable securities admitted to an official stock exchange or dealt in on another regulated market
(continued)
Nominal
Holding
Cost
USD
Fair
Value
USD
% of Net
Assets
Investment Companies (continued)
United States
First Trust Financial AlphaDEX Fund 60,568 1,672,807 1,797,355 3.07
1,797,355 3.07
Total Investment Companies 58,226,382 99.59
Total Investments 47,229,419 58,226,382 99.59
Net current assets 238,602 0.41
Total net assets 58,464,984 100.00
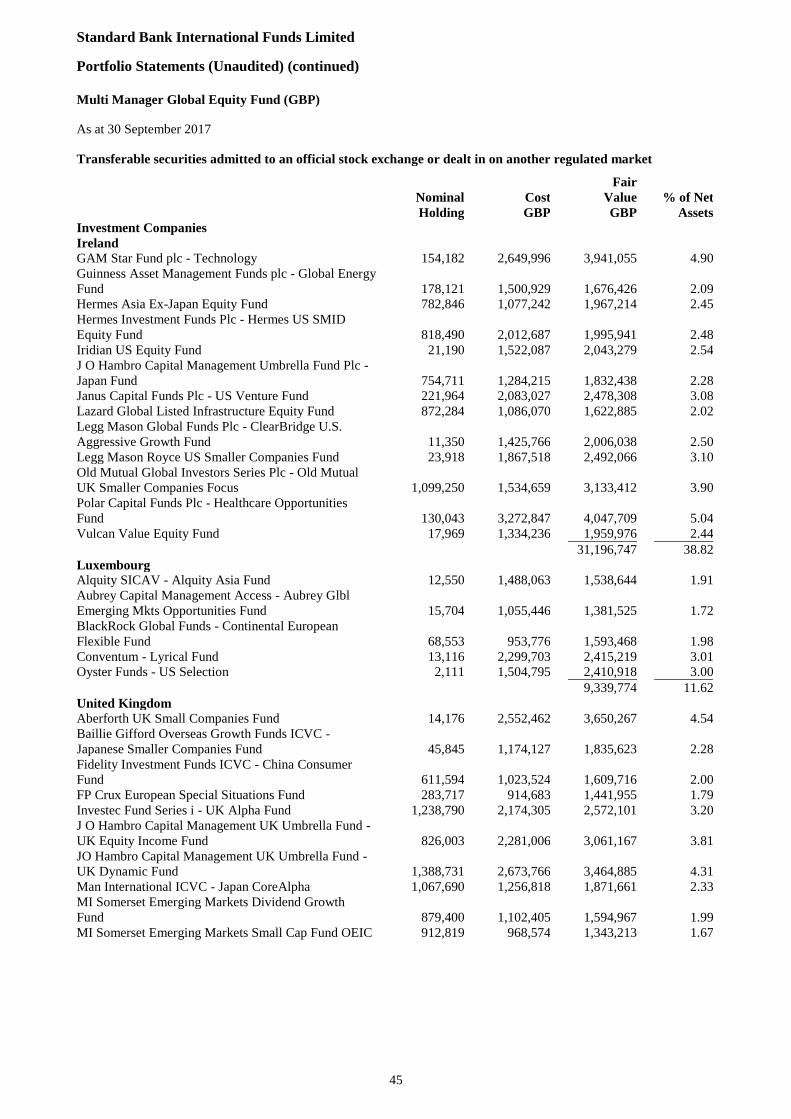
Standard Bank International Funds Limited
Portfolio Statements (Unaudited) (continued)
45
Multi Manager Global Equity Fund (GBP)
As at 30 September 2017
Transferable securities admitted to an official stock exchange or dealt in on another regulated market
Nominal
Holding
Cost
GBP
Fair
Value
GBP
% of Net
Assets
Investment Companies
Ireland
GAM Star Fund plc - Technology 154,182 2,649,996 3,941,055 4.90
Guinness Asset Management Funds plc - Global Energy
Fund 178,121 1,500,929 1,676,426 2.09
Hermes Asia Ex-Japan Equity Fund 782,846 1,077,242 1,967,214 2.45
Hermes Investment Funds Plc - Hermes US SMID
Equity Fund 818,490 2,012,687 1,995,941 2.48
Iridian US Equity Fund 21,190 1,522,087 2,043,279 2.54
J O Hambro Capital Management Umbrella Fund Plc -
Japan Fund 754,711 1,284,215 1,832,438 2.28
Janus Capital Funds Plc - US Venture Fund 221,964 2,083,027 2,478,308 3.08
Lazard Global Listed Infrastructure Equity Fund 872,284 1,086,070 1,622,885 2.02
Legg Mason Global Funds Plc - ClearBridge U.S.
Aggressive Growth Fund 11,350 1,425,766 2,006,038 2.50
Legg Mason Royce US Smaller Companies Fund 23,918 1,867,518 2,492,066 3.10
Old Mutual Global Investors Series Plc - Old Mutual
UK Smaller Companies Focus 1,099,250 1,534,659 3,133,412 3.90
Polar Capital Funds Plc - Healthcare Opportunities
Fund 130,043 3,272,847 4,047,709 5.04
Vulcan Value Equity Fund 17,969 1,334,236 1,959,976 2.44
31,196,747 38.82
Luxembourg
Alquity SICAV - Alquity Asia Fund 12,550 1,488,063 1,538,644 1.91
Aubrey Capital Management Access - Aubrey Glbl
Emerging Mkts Opportunities Fund 15,704 1,055,446 1,381,525 1.72
BlackRock Global Funds - Continental European
Flexible Fund 68,553 953,776 1,593,468 1.98
Conventum - Lyrical Fund 13,116 2,299,703 2,415,219 3.01
Oyster Funds - US Selection 2,111 1,504,795 2,410,918 3.00
9,339,774 11.62
United Kingdom
Aberforth UK Small Companies Fund 14,176 2,552,462 3,650,267 4.54
Baillie Gifford Overseas Growth Funds ICVC -
Japanese Smaller Companies Fund 45,845 1,174,127 1,835,623 2.28
Fidelity Investment Funds ICVC - China Consumer
Fund 611,594 1,023,524 1,609,716 2.00
FP Crux European Special Situations Fund 283,717 914,683 1,441,955 1.79
Investec Fund Series i - UK Alpha Fund 1,238,790 2,174,305 2,572,101 3.20
J O Hambro Capital Management UK Umbrella Fund -
UK Equity Income Fund 826,003 2,281,006 3,061,167 3.81
JO Hambro Capital Management UK Umbrella Fund -
UK Dynamic Fund 1,388,731 2,673,766 3,464,885 4.31
Man International ICVC - Japan CoreAlpha 1,067,690 1,256,818 1,871,661 2.33
MI Somerset Emerging Markets Dividend Growth
Fund 879,400 1,102,405 1,594,967 1.99
MI Somerset Emerging Markets Small Cap Fund OEIC 912,819 968,574 1,343,213 1.67
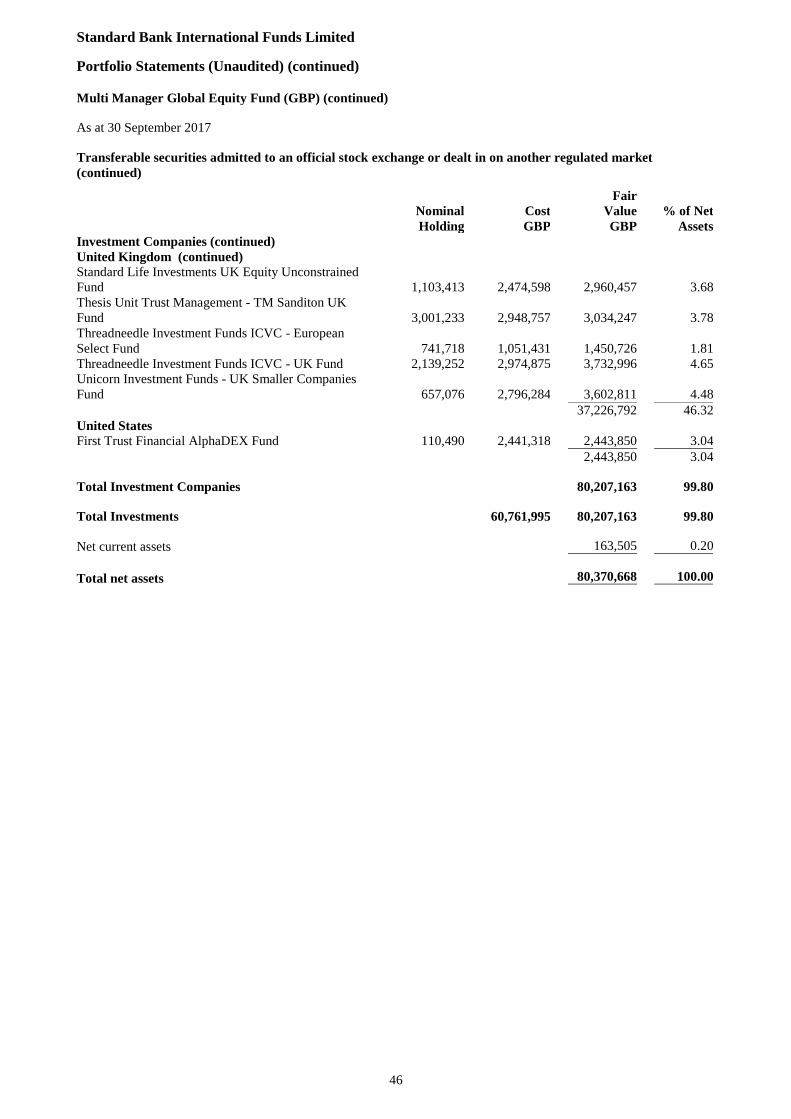
Standard Bank International Funds Limited
Portfolio Statements (Unaudited) (continued)
46
Multi Manager Global Equity Fund (GBP) (continued)
As at 30 September 2017
Transferable securities admitted to an official stock exchange or dealt in on another regulated market
(continued)
Nominal
Holding
Cost
GBP
Fair
Value
GBP
% of Net
Assets
Investment Companies (continued)
United Kingdom (continued)
Standard Life Investments UK Equity Unconstrained
Fund 1,103,413 2,474,598 2,960,457 3.68
Thesis Unit Trust Management - TM Sanditon UK
Fund 3,001,233 2,948,757 3,034,247 3.78
Threadneedle Investment Funds ICVC - European
Select Fund 741,718 1,051,431 1,450,726 1.81
Threadneedle Investment Funds ICVC - UK Fund 2,139,252 2,974,875 3,732,996 4.65
Unicorn Investment Funds - UK Smaller Companies
Fund 657,076 2,796,284 3,602,811 4.48
37,226,792 46.32
United States
First Trust Financial AlphaDEX Fund 110,490 2,441,318 2,443,850 3.04
2,443,850 3.04
Total Investment Companies 80,207,163 99.80
Total Investments 60,761,995 80,207,163 99.80
Net current assets 163,505 0.20
Total net assets 80,370,668 100.00
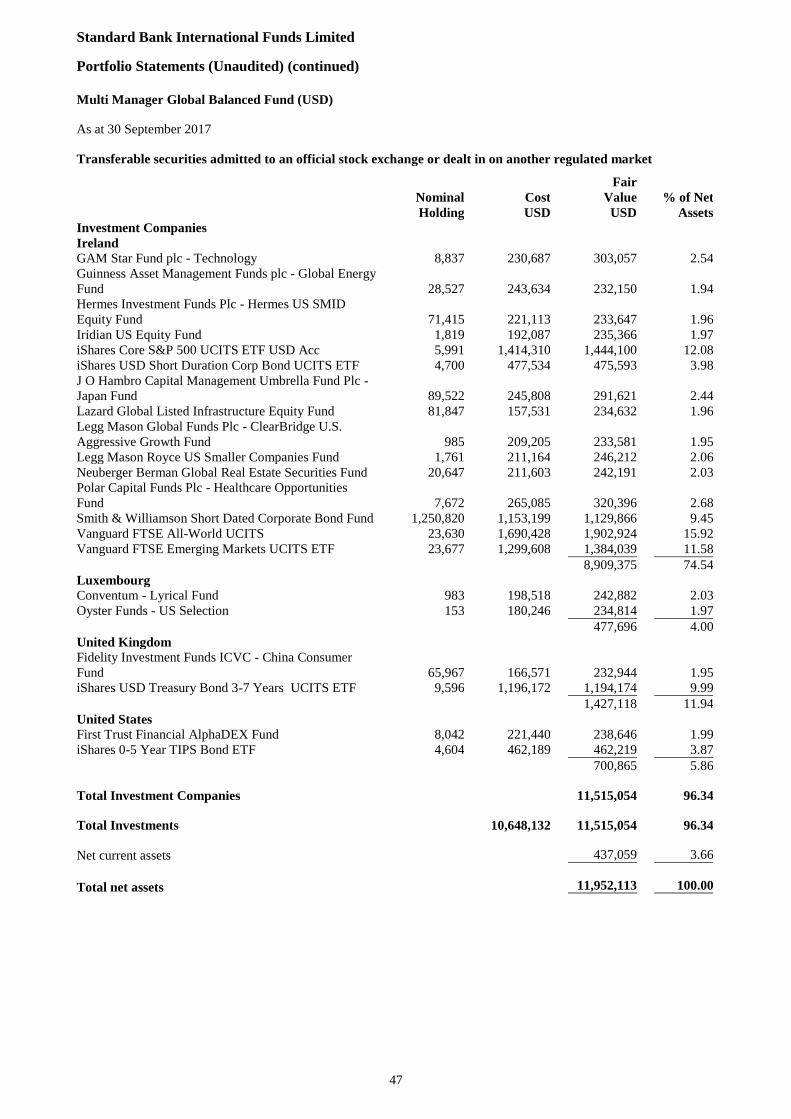
Standard Bank International Funds Limited
Portfolio Statements (Unaudited) (continued)
47
Multi Manager Global Balanced Fund (USD)
As at 30 September 2017
Transferable securities admitted to an official stock exchange or dealt in on another regulated market
Nominal
Holding
Cost
USD
Fair
Value
USD
% of Net
Assets
Investment Companies
Ireland
GAM Star Fund plc - Technology 8,837 230,687 303,057 2.54
Guinness Asset Management Funds plc - Global Energy
Fund 28,527 243,634 232,150 1.94
Hermes Investment Funds Plc - Hermes US SMID
Equity Fund 71,415 221,113 233,647 1.96
Iridian US Equity Fund 1,819 192,087 235,366 1.97
iShares Core S&P 500 UCITS ETF USD Acc 5,991 1,414,310 1,444,100 12.08
iShares USD Short Duration Corp Bond UCITS ETF 4,700 477,534 475,593 3.98
J O Hambro Capital Management Umbrella Fund Plc -
Japan Fund 89,522 245,808 291,621 2.44
Lazard Global Listed Infrastructure Equity Fund 81,847 157,531 234,632 1.96
Legg Mason Global Funds Plc - ClearBridge U.S.
Aggressive Growth Fund 985 209,205 233,581 1.95
Legg Mason Royce US Smaller Companies Fund 1,761 211,164 246,212 2.06
Neuberger Berman Global Real Estate Securities Fund 20,647 211,603 242,191 2.03
Polar Capital Funds Plc - Healthcare Opportunities
Fund 7,672 265,085 320,396 2.68
Smith & Williamson Short Dated Corporate Bond Fund 1,250,820 1,153,199 1,129,866 9.45
Vanguard FTSE All-World UCITS 23,630 1,690,428 1,902,924 15.92
Vanguard FTSE Emerging Markets UCITS ETF 23,677 1,299,608 1,384,039 11.58
8,909,375 74.54
Luxembourg
Conventum - Lyrical Fund 983 198,518 242,882 2.03
Oyster Funds - US Selection 153 180,246 234,814 1.97
477,696 4.00
United Kingdom
Fidelity Investment Funds ICVC - China Consumer
Fund 65,967 166,571 232,944 1.95
iShares USD Treasury Bond 3-7 Years UCITS ETF 9,596 1,196,172 1,194,174 9.99
1,427,118 11.94
United States
First Trust Financial AlphaDEX Fund 8,042 221,440 238,646 1.99
iShares 0-5 Year TIPS Bond ETF 4,604 462,189 462,219 3.87
700,865 5.86
Total Investment Companies 11,515,054 96.34
Total Investments 10,648,132 11,515,054 96.34
Net current assets 437,059 3.66
Total net assets 11,952,113 100.00
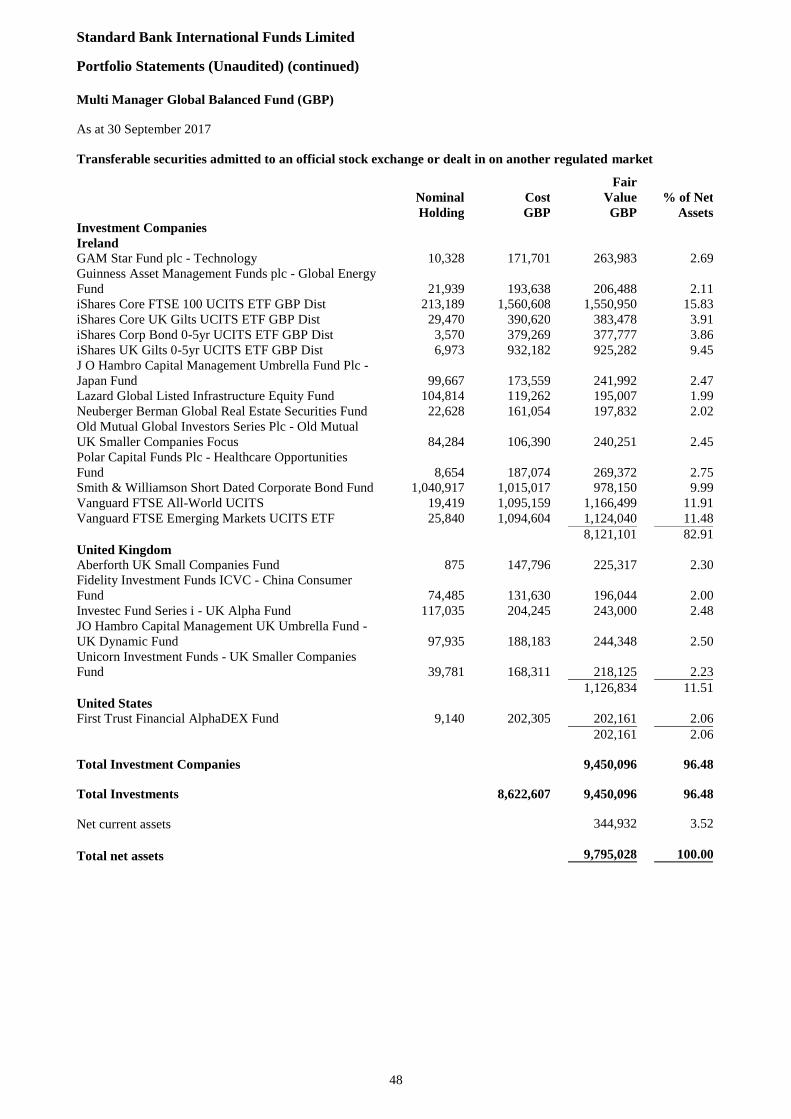
Standard Bank International Funds Limited
Portfolio Statements (Unaudited) (continued)
48
Multi Manager Global Balanced Fund (GBP)
As at 30 September 2017
Transferable securities admitted to an official stock exchange or dealt in on another regulated market
Nominal
Holding
Cost
GBP
Fair
Value
GBP
% of Net
Assets
Investment Companies
Ireland
GAM Star Fund plc - Technology 10,328 171,701 263,983 2.69
Guinness Asset Management Funds plc - Global Energy
Fund 21,939 193,638 206,488 2.11
iShares Core FTSE 100 UCITS ETF GBP Dist 213,189 1,560,608 1,550,950 15.83
iShares Core UK Gilts UCITS ETF GBP Dist 29,470 390,620 383,478 3.91
iShares Corp Bond 0-5yr UCITS ETF GBP Dist 3,570 379,269 377,777 3.86
iShares UK Gilts 0-5yr UCITS ETF GBP Dist 6,973 932,182 925,282 9.45
J O Hambro Capital Management Umbrella Fund Plc -
Japan Fund 99,667 173,559 241,992 2.47
Lazard Global Listed Infrastructure Equity Fund 104,814 119,262 195,007 1.99
Neuberger Berman Global Real Estate Securities Fund 22,628 161,054 197,832 2.02
Old Mutual Global Investors Series Plc - Old Mutual
UK Smaller Companies Focus 84,284 106,390 240,251 2.45
Polar Capital Funds Plc - Healthcare Opportunities
Fund 8,654 187,074 269,372 2.75
Smith & Williamson Short Dated Corporate Bond Fund 1,040,917 1,015,017 978,150 9.99
Vanguard FTSE All-World UCITS 19,419 1,095,159 1,166,499 11.91
Vanguard FTSE Emerging Markets UCITS ETF 25,840 1,094,604 1,124,040 11.48
8,121,101 82.91
United Kingdom
Aberforth UK Small Companies Fund 875 147,796 225,317 2.30
Fidelity Investment Funds ICVC - China Consumer
Fund 74,485 131,630 196,044 2.00
Investec Fund Series i - UK Alpha Fund 117,035 204,245 243,000 2.48
JO Hambro Capital Management UK Umbrella Fund -
UK Dynamic Fund 97,935 188,183 244,348 2.50
Unicorn Investment Funds - UK Smaller Companies
Fund 39,781 168,311 218,125 2.23
1,126,834 11.51
United States
First Trust Financial AlphaDEX Fund 9,140 202,305 202,161 2.06
202,161 2.06
Total Investment Companies 9,450,096 96.48
Total Investments 8,622,607 9,450,096 96.48
Net current assets 344,932 3.52
Total net assets 9,795,028 100.00
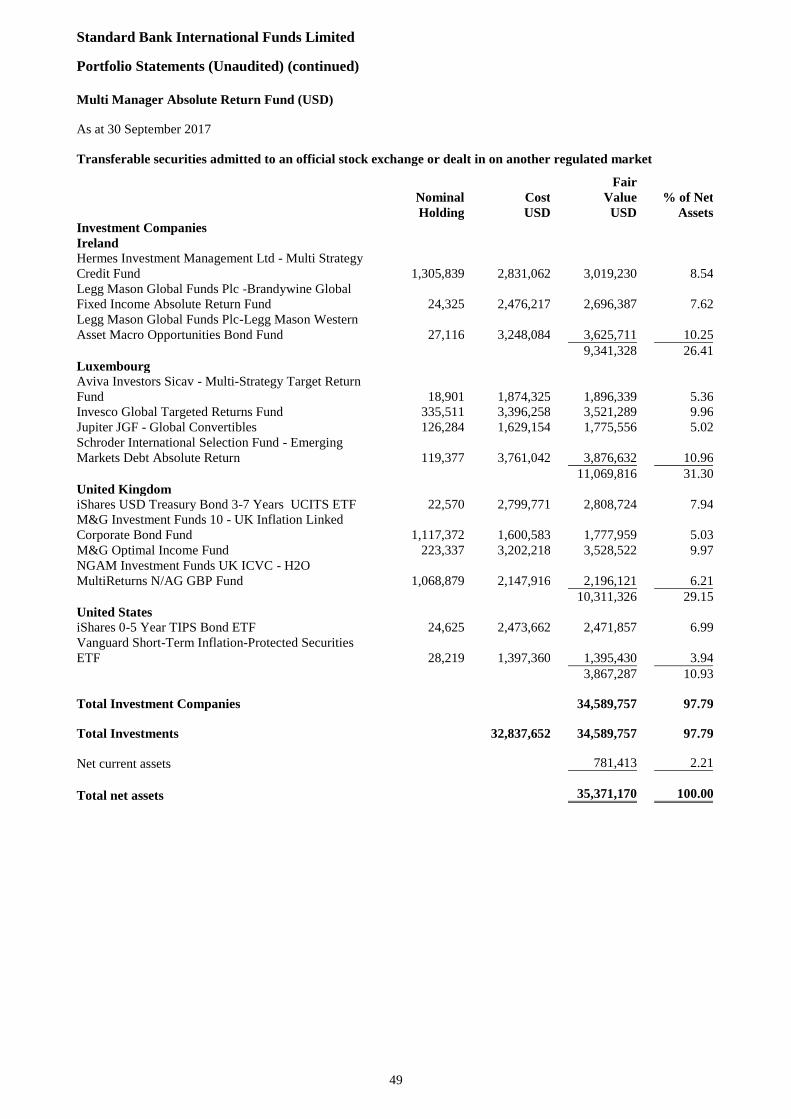
Standard Bank International Funds Limited
Portfolio Statements (Unaudited) (continued)
49
Multi Manager Absolute Return Fund (USD)
As at 30 September 2017
Transferable securities admitted to an official stock exchange or dealt in on another regulated market
Nominal
Holding
Cost
USD
Fair
Value
USD
% of Net
Assets
Investment Companies
Ireland
Hermes Investment Management Ltd - Multi Strategy
Credit Fund 1,305,839 2,831,062 3,019,230 8.54
Legg Mason Global Funds Plc -Brandywine Global
Fixed Income Absolute Return Fund 24,325 2,476,217 2,696,387 7.62
Legg Mason Global Funds Plc-Legg Mason Western
Asset Macro Opportunities Bond Fund 27,116 3,248,084 3,625,711 10.25
9,341,328 26.41
Luxembourg
Aviva Investors Sicav - Multi-Strategy Target Return
Fund 18,901 1,874,325 1,896,339 5.36
Invesco Global Targeted Returns Fund 335,511 3,396,258 3,521,289 9.96
Jupiter JGF - Global Convertibles 126,284 1,629,154 1,775,556 5.02
Schroder International Selection Fund - Emerging
Markets Debt Absolute Return 119,377 3,761,042 3,876,632 10.96
11,069,816 31.30
United Kingdom
iShares USD Treasury Bond 3-7 Years UCITS ETF 22,570 2,799,771 2,808,724 7.94
M&G Investment Funds 10 - UK Inflation Linked
Corporate Bond Fund 1,117,372 1,600,583 1,777,959 5.03
M&G Optimal Income Fund 223,337 3,202,218 3,528,522 9.97
NGAM Investment Funds UK ICVC - H2O
MultiReturns N/AG GBP Fund 1,068,879 2,147,916 2,196,121 6.21
10,311,326 29.15
United States
iShares 0-5 Year TIPS Bond ETF 24,625 2,473,662 2,471,857 6.99
Vanguard Short-Term Inflation-Protected Securities
ETF 28,219 1,397,360 1,395,430 3.94
3,867,287 10.93
Total Investment Companies 34,589,757 97.79
Total Investments 32,837,652 34,589,757 97.79
Net current assets 781,413 2.21
Total net assets 35,371,170 100.00
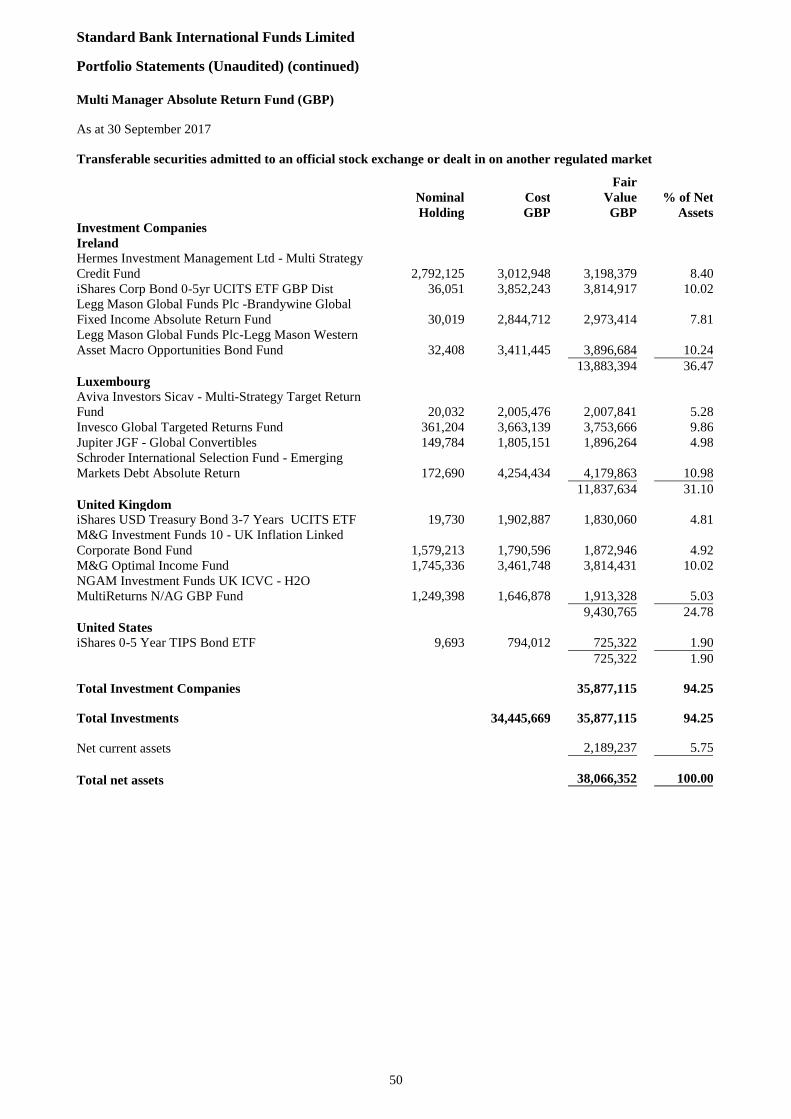
Standard Bank International Funds Limited
Portfolio Statements (Unaudited) (continued)
50
Multi Manager Absolute Return Fund (GBP)
As at 30 September 2017
Transferable securities admitted to an official stock exchange or dealt in on another regulated market
Nominal
Holding
Cost
GBP
Fair
Value
GBP
% of Net
Assets
Investment Companies
Ireland
Hermes Investment Management Ltd - Multi Strategy
Credit Fund 2,792,125 3,012,948 3,198,379 8.40
iShares Corp Bond 0-5yr UCITS ETF GBP Dist 36,051 3,852,243 3,814,917 10.02
Legg Mason Global Funds Plc -Brandywine Global
Fixed Income Absolute Return Fund 30,019 2,844,712 2,973,414 7.81
Legg Mason Global Funds Plc-Legg Mason Western
Asset Macro Opportunities Bond Fund 32,408 3,411,445 3,896,684 10.24
13,883,394 36.47
Luxembourg
Aviva Investors Sicav - Multi-Strategy Target Return
Fund 20,032 2,005,476 2,007,841 5.28
Invesco Global Targeted Returns Fund 361,204 3,663,139 3,753,666 9.86
Jupiter JGF - Global Convertibles 149,784 1,805,151 1,896,264 4.98
Schroder International Selection Fund - Emerging
Markets Debt Absolute Return 172,690 4,254,434 4,179,863 10.98
11,837,634 31.10
United Kingdom
iShares USD Treasury Bond 3-7 Years UCITS ETF 19,730 1,902,887 1,830,060 4.81
M&G Investment Funds 10 - UK Inflation Linked
Corporate Bond Fund 1,579,213 1,790,596 1,872,946 4.92
M&G Optimal Income Fund 1,745,336 3,461,748 3,814,431 10.02
NGAM Investment Funds UK ICVC - H2O
MultiReturns N/AG GBP Fund 1,249,398 1,646,878 1,913,328 5.03
9,430,765 24.78
United States
iShares 0-5 Year TIPS Bond ETF 9,693 794,012 725,322 1.90
725,322 1.90
Total Investment Companies 35,877,115 94.25
Total Investments 34,445,669 35,877,115 94.25
Net current assets 2,189,237 5.75
Total net assets 38,066,352 100.00
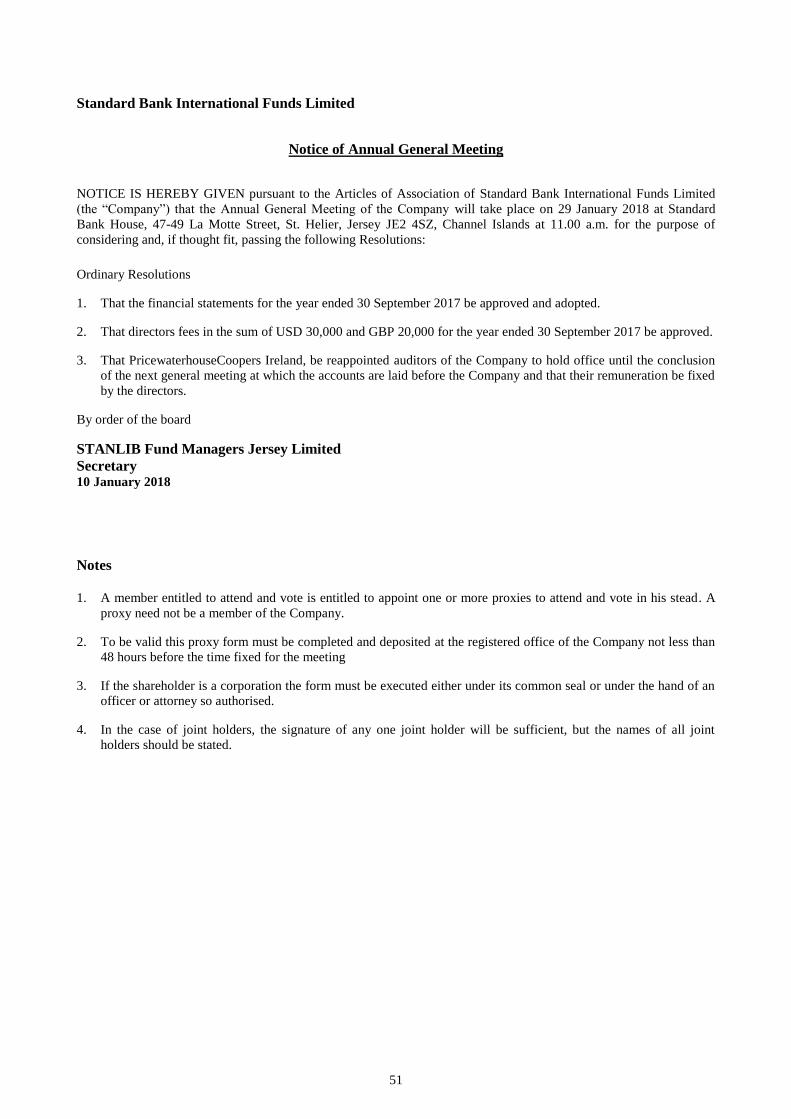
Standard Bank International Funds Limited
51
Notice of Annual General Meeting
NOTICE IS HEREBY GIVEN pursuant to the Articles of Association of Standard Bank International Funds Limited
(the “Company”) that the Annual General Meeting of the Company will take place on 29 January 2018 at Standard
Bank House, 47-49 La Motte Street, St. Helier, Jersey JE2 4SZ, Channel Islands at 11.00 a.m. for the purpose of
considering and, if thought fit, passing the following Resolutions:
Ordinary Resolutions
1. That the financial statements for the year ended 30 September 2017 be approved and adopted.
2. That directors fees in the sum of USD 30,000 and GBP 20,000 for the year ended 30 September 2017 be approved.
3. That PricewaterhouseCoopers Ireland, be reappointed auditors of the Company to hold office until the conclusion
of the next general meeting at which the accounts are laid before the Company and that their remuneration be fixed
by the directors.
By order of the board
STANLIB Fund Managers Jersey Limited
Secretary 10 January 2018
Notes
1. A member entitled to attend and vote is entitled to appoint one or more proxies to attend and vote in his stead. A
proxy need not be a member of the Company.
2. To be valid this proxy form must be completed and deposited at the registered office of the Company not less than
48 hours before the time fixed for the meeting
3. If the shareholder is a corporation the form must be executed either under its common seal or under the hand of an
officer or attorney so authorised.
4. In the case of joint holders, the signature of any one joint holder will be sufficient, but the names of all joint
holders should be stated.
Standard Bank International Funds Limited
52
FORM OF PROXY
The Secretary
Standard Bank International Funds Limited
Standard Bank House
47-49 La Motte Street
St Helier
JERSEY, JE2 4SZ
Standard Bank International Funds Limited (the “Company”)
Form of Proxy
Please complete in
block capitals
I/We
……………………………………………….
Complete only if
Special proxy desired.
(See Note a. below)
being a holder(s) of…………..Participating shares in the capital of the Company hereby
appoint the Chairman of the Meeting or failing him:
as my/our proxy to vote for me/us on my/our behalf at the Annual General Meeting of the
Company to be held on 29 January 2018 at 11.00 a.m. and at any adjournments thereof, in
the following manner:
Resolutions
*Strike out whatever is
not desired
Ordinary Resolution
No 1 For/Against*
No 2 For/Against*
No 3 For/Against*
Signed this _____________day of ____________________2018
Signature ________________________________________
a. If you desire to appoint a proxy other
than indicated above, please delete the
appropriate words and insert the name
and address of your proxy
b. Unless otherwise instructed, the proxy
will vote or abstain from voting as he
thinks fit in relation to the resolutions
referred to above
c. To be valid, the proxy must be lodged
with the secretary of the Company 48
hours prior to the time of the meeting
d. A corporation should complete this
form under its common seal or under
the hand of a duly authorised officer or
attorney