Embed Size (px)
Citation preview
Standard Bank International Funds Limited
1
Melville Douglas Global Growth Fund Limited
Standard Bank International Funds LimitedSeptember 2016
Annual Report and Audited Financial Statements
Standard Bank International Funds Limited
2
Contents
Administration . . . . . . . . . . . . . . . . . . . . . . . . . . . . . . . . . . . . . . . . . . . . . . . . 3
Report of the Directors . . . . . . . . . . . . . . . . . . . . . . . . . . . . . . . . . . . . . . . . . . . . . 4
Report of the Custodian . . . . . . . . . . . . . . . . . . . . . . . . . . . . . . . . . . . . . . . . . . . . 7
Investment Manager’s Report . . . . . . . . . . . . . . . . . . . . . . . . . . . . . . . . . . . . . . . . . 8
Independent Auditors’ Report . . . . . . . . . . . . . . . . . . . . . . . . . . . . . . . . . . . . . . . . . 12
Statement of Financial Position . . . . . . . . . . . . . . . . . . . . . . . . . . . . . . . . . . . . . . . . . 14
Statement of Comprehensive Income . . . . . . . . . . . . . . . . . . . . . . . . . . . . . . . . . . . . . . 15
Statement of Changes in Equity . . . . . . . . . . . . . . . . . . . . . . . . . . . . . . . . . . . . . . . . 16
Notes to the Financial Statements . . . . . . . . . . . . . . . . . . . . . . . . . . . . . . . . . . . . . . . 19
Fund Statistics (Unaudited) . . . . . . . . . . . . . . . . . . . . . . . . . . . . . . . . . . . . . . . . . 43
Total Expenses Ratio (Unaudited) . . . . . . . . . . . . . . . . . . . . . . . . . . . . . . . . . . . . . . .47
Portfolio Statement . . . . . . . . . . . . . . . . . . . . . . . . . . . . . . . . . . . . . . . . . . . . . 48

Standard Bank International Funds Limited
3
Administration
Directors
Graham Baillie Michael Farrow Helen Holmes Oliver Sonnbichler
Sub-Custodian and Banker
The Bank of New York Mellon SA/NV London Branch The Bank of New York Mellon Centre 160 Queen Victoria Street London EC4V 4LA United Kingdom
Registered Office
Standard Bank House 47 – 49 La Motte Street St . Helier Jersey JE2 4SZ Channel Islands
Administrator to the Manager
BNY Mellon Fund Services (Ireland) Designated Activity Company Guild House, Guild Street International Financial Services Centre Dublin 1 Ireland
Manager and Secretary
STANLIB Fund Managers Jersey Limited Standard Bank House 47 – 49 La Motte Street St . Helier Jersey JE2 4SZ Channel Islands
Independent Auditors
PricewaterhouseCoopers One Spencer Dock North Wall Quay Dublin 1 Ireland
Investment Manager
Standard Bank International Investments Limited Standard Bank House 47 – 49 La Motte Street St . Helier Jersey JE2 4SZ Channel Islands
Legal Adviser
Ogier Ogier House The Esplanade St . Helier Jersey JE4 9WG Channel Islands
Custodian
Capita Trust Company (Jersey) Limited 12 Castle Street St . Helier Jersey JE2 3RT Channel Islands
Standard Bank International Funds Limited
4
Report of the Directors
The directors submit their audited annual report and financial statements for the year ended to 30 September 2016 .
Incorporation
Standard Bank International Funds Limited (the “Company” or “Fund”) is an ‘Umbrella Fund’ and an open-ended investment Company incorporated in Jersey on 24 September 1999 with limited liability under the Law and regulated by the Jersey Financial Services Commission (JFSC) . Participating shares may be issued and redeemed at prices based upon each Class’s underlying net asset value .
Structure
The Company offers investors a choice of classes (each such class being referred to as a “Class Fund”) and the opportunity to switch from one Class Fund to another . At present there are six Class Funds available, see Objective and investment policy section for more details .
The assets, liabilities, income and expenses attributable to each class of participating share are applied to the Class Fund established for that class . If they are not attributable to any particular class of participating shares, they are allocated between all the Class Funds in such manner as the directors deem to be equitable . The Company is a single legal entity . As a result, although the assets, income, earnings, liabilities and expenses attributable to each Class Fund will be segregated and kept separate from those attributable to other Class Funds, in the event of the Company not being able to meet the liabilities attributable to any particular Class Fund out of the assets of such Class Fund, the excess liabilities may be met out of the assets attributable to other Class Funds .
Objective and investment policy
The objective of the Company is to provide investors with a worldwide range of investment opportunities, which are professionally managed, with the aim of achieving long-term growth through capital gains and accumulation of income .
The Company offers investors a choice of classes of Participating Shares each such class being designated by reference to a separate investment portfolio referred to as a “Class Fund” .
There are currently six Class Funds within the Company .
The Multi Manager Global Equity Class Funds USD & GBP are ‘fund of funds’ which only invest in collective investment funds and are designed to provide long-term capital appreciation through investment solely in equity oriented funds with a bias towards the domestic markets of the base currency of each Class Fund . The Investment Manager will look to maintain a fully invested equity strategy at all times . These aggressive portfolios are suited to investors seeking the longer-term reward of equity investment and are prepared to accept the higher level of volatility normally associated with this type of investment .
The Multi Manager Global Balanced Class Funds USD & GBP are ‘fund of funds’ which only invest in other collective investment funds and are designed to provide long term capital appreciation through investment in a broad range of funds covering primarily equity and fixed income asset classes and cash . These aggressive portfolios are suited to investors seeking the longer term reward of equity investment and are prepared to accept the higher level of volatility normally associated with this type of investment .
The Multi Manager Absolute Return Class Funds USD & GBP are primarily ‘fund of funds’ which invest in collective investment funds but may also make some direct investments as described below . They are designed to provide long-term capital growth through investing in a diversified portfolio of alternative investments . The principal investment policy of each class will be to invest in a diversified blend of single manager funds, structured products, alternative fixed-income funds, quoted investment trusts, investible indices, exchange tradable securities, forward foreign exchange contracts and cash positions (together the Permitted Investments) .
Each Class Fund may enter into derivatives for the purpose of efficient portfolio management .

Standard Bank International Funds Limited
5
Results and dividends
The results for the year are set out in the Statements of Comprehensive Income on pages 15 and 16 . The Company’s present policy is to accumulate income and as such the Company has not declared or paid a dividend in respect of the year from 1 October 2015 to 30 September 2016 .
Directors
The directors of the Company during the year ended 30 September 2016 and subsequently to the date of this report are set out on page 4 . No director has a service contract with the Company or holds any interest in the capital of the Company .
Graham Baillie is also director of Standard Bank International Investments Limited and Chairman of Melville Douglas Investment Management (Proprietary) Limited . Helen Holmes is also director of Standard Bank International Investments Limited, Oliver Sonnbichler is an executive of Melville Douglas Investment Management (Proprietary) Limited and Michael Farrow is an independent Non-Executive Director .

Standard Bank International Funds Limited
6
Statement of Directors’ Responsibilities
The directors are responsible for preparing the financial statements in accordance with applicable Jersey law and United Kingdom Accounting Standards (United Kingdom Generally Accepted Accounting Practice), including Financial Reporting Standard 102 “The Financial Reporting Standard”, applicable in the UK and Republic of Ireland (“FRS102”) .
The Companies (Jersey) Law, 1991 requires the directors to prepare the financial statements for each financial year, which give a true and fair view of the state of affairs of the Company and of the results of the Company for that year . In preparing these financial statements, the directors are required to:
– select suitable accounting policies and then apply them consistently;
– make judgements and estimates that are reasonable and prudent;
– state whether applicable accounting standards have been followed subject to any material departures disclosed and explained in the financial statements; and
– prepare the financial statements on the going concern basis unless it is inappropriate to assume that the Company will continue in operation .
The directors confirm that they have complied with the above requirements in preparing the financial statements .
The directors are responsible for keeping proper accounting records, which disclose with reasonable accuracy at any time the financial position of the Company and enable them to ensure that the financial statements comply with the Companies (Jersey) Law 1991 and FRS 102 . They are also responsible for safeguarding the assets of the Company and hence taking reasonable steps for the prevention and detection of error, fraud and non-compliance with law or regulations .
So far as each person who is a director at the date of approving this report is aware, there is no relevant audit information, being information needed by the auditor in connection with preparing its report, of which the auditor is unaware . Having made enquiries of fellow directors and the Company’s auditor, each director has taken all the steps that he/she is obliged to take as a director in order to make himself/herself aware of any relevant audit information and to establish that the auditor is aware of the information .
Independent Auditors
PricewaterhouseCoopers Ireland have indicated their willingness to continue in office . A resolution to reappoint PricewaterhouseCoopers Ireland as independent auditors of the Company will be proposed at the annual general meeting . A copy of the Notice of the Annual Form of Proxy General Meeting is attached and form part of these financial statements .
Secretary
The Secretary of the Company during the year ended 30 September 2016 was STANLIB Fund Managers Jersey Limited .
By order of the board STANLIB Fund Managers Jersey Limited Secretary 11 January 2017

Standard Bank International Funds Limited
7
Report of the Custodian
To the members of Standard Bank International Funds Limited .
The Custodian is responsible for the safekeeping of all the property of the Company which is entrusted to it, as prescribed in the Custodian Agreement .
Under the principles of the Guide to open-ended unclassified collective investment funds offered to the general public (the “OCIF Guide”), issued by the Jersey Financial Services Commission, the Custodian has a duty to take reasonable care to ensure that the methods adopted by the Company’s Manager in respect to the pricing of, and dealing in, shares in the Company are compliant with the Company’s principal documents .
It is the opinion of Capita Trust Company (Jersey) Limited in respect of the year ended 30 September 2016 that to the best of our information, knowledge and belief, that in all material respects, the Manager managed the Class Funds in that year:
a) in accordance with the limitations imposed on the investment and borrowing powers of the Company by the Articles and Prospectus and;
b) otherwise in accordance with the provisions of the Management and Custodian Agreements .
Capita Trust Company (Jersey) Limited Custodian 11 January 2017

Standard Bank International Funds Limited
8
Investment Manager’s Report
Performance Commentary
Multi Manager Global Equity Classes
Investment objective
To provide long-term capital appreciation through investment solely in equity-orientated funds . The manager will look to maintain a fully invested strategy at all times . A minimum exposure of 40% to larger capitalised shares means that the manager can position the fund significantly away from that of the peer group or benchmark in order to optimise performance . It is therefore suited to investors who are willing to accept the higher level of volatility associated with a fund of this flexibility .
Quantitative analysis
US Dollar Class
The Fund’s return for the period was 7 .97% . The Fund’s benchmark is the FTSE All World Total Return Net Index in US dollars; the benchmark’s return was 11 .96% .
Sterling Class
The Fund’s return was 18 .78% for the period under review . The Fund’s benchmark is composed of 40% FTSE UK Total Return Net Index in sterling and 60% FTSE All World Total Return Net Index in sterling . The benchmark return was 25 .69% for the period .
Commentary
Both Fund classes delivered strong absolute returns for the period, however it has been a challenging year from a relative return perspective with both classes significantly underperforming their benchmarks . Markets suffered bouts of extreme risk aversion, most recently in the aftermath of the UK Brexit referendum and at the beginning of the year as investors digested the first rise in US interest rates for 10 years amid concerns of a major slowdown in China and ongoing weakness in energy markets . During these periods both classes of the Fund underperformed to some degree, with the Sterling Class in particular losing significant ground on a relative basis post-Brexit .
As always, we focus on earnings growth and valuation and the sense we get when we speak to our managers is that the portfolio is very well placed relative to the benchmark in both respects . The majority of our managers are reporting that they are able to invest in companies that are successfully executing earnings growth typically in the region of 8% – 12% and have fairly high conviction that this trend will continue . Our value managers tell us they believe their portfolios are trading at discounts to intrinsic value not seen since 2009 and in one case even below this .
Conversely, it also seems to us that markets are also extremely stretched in other areas, which is making the equity indices overall look expensive on a valuation basis . One of our managers has described the situation as “1999 in reverse” . He was alluding to the dotcom bubble and the prevailing market behaviour that now seems bizarre, where investors were prepared to pay ludicrous premiums for any form of growth company related to the internet . At the same time high quality companies with steady and dependable growth characteristics were ignored despite the compelling value on offer .
Today, investors seem to be prepared to pay a lofty premium for defensive companies, especially those with a yield and perceived dependability of earnings, while companies with any degree of cyclicality to their businesses are overlooked . While many of these defensive companies are underpinned by a level of earnings growth that will hopefully ensure that a market collapse similar to the bursting of the dotcom bubble can be avoided, we see no value at current levels, especially relative to some of the more cyclical areas of the market where valuations are more attractive with higher potential growth rates .
Standard Bank International Funds Limited
9
Multi Manager Global Equity Classes (continued)
Commentary (continued)
It is always difficult to predict market behaviour and while investors remain focussed on risk aversion with a thirst for yield the current situation could persist for some time, however we maintain our belief that equity prices must be underpinned by earnings over the long term and we will continue to attempt to gain exposure to areas of the market with the most attractive earnings growth and valuation characteristics . At the present time we see significant value in our strategy, particularly in some of the more out of favour areas of the market and for potential new investors this could be an attractive entry point .
Forward thinking
The regional weightings have remained largely unchanged, with underweight exposure to the US and UK and slight overweights in Europe and Japan with a bigger overweight in emerging markets . However with the US exposure we have moved the bias towards mid and small cap strategies . Our preference in this areas is for managers looking for quality companies with strong cash flow and profitability and a tangible growth profile . The recent additions of the Janus US Venture and Pacific US Smaller Companies funds have driven this shift . We are intending to add further to this allocation if fundamentals continue to improve .
We have also increased our exposure to emerging markets with the introduction of the Aubrey Global Emerging Markets Opportunities Fund and the Alquity Asia Fund . After several disappointing years, earnings appear to be stabilising and for the first time since 2012, fund flow data suggests investors are switching money from developed markets to select emerging regions . Should this become an established trend, there is the possibility of a substantial valuation re-rating on top of the superior earnings growth potential .
We are completing due diligence on several interesting new investment ideas, including an additional US mid cap strategy, an Emerging Markets growth fund and a European small cap manager .
Multi Manager Global Balanced Classes
Investment objective
To provide long-term capital growth through investing in a diverse range of asset classes including international, regional and thematic equity funds together with fixed income funds, exchange traded funds and cash . The diverse nature of the asset classes has historically resulted in a moderate level of volatility, although given the potential exposure ranges to equity as an asset class, the Fund is suitable only for investors with a longer term investment horizon, and who are prepared to tolerate the risk of shorter term loss .
Quantitative analysis
US Dollar Class
The Fund’s return for the period was 4 .20% . The Fund’s benchmark is composed of 30% FTSE All World Total Return Net Index in US dollars, 20% FTSE USA Total Return Net Index in US dollars and 50% Bloomberg/EFFAS Bond Indices US Government 1–10 Year Index . The benchmark return was 7 .67% for the period .
Sterling Class
The Fund’s return for the period was 10 .49% . The Fund’s benchmark is composed of 30% FTSE All World Total Return Net Index in sterling, 20% FTSE UK Total Return Net Index in sterling and 50% Bloomberg/EFFAS Bond Indices UK Government 1-10 Year Index . The benchmark return was 15 .49% for the period .
Commentary
The Global Balanced Fund has suffered a difficult year in relative performance terms, albeit with the strategy delivering robust positive returns in both currency classes . Most of the underperformance came in the volatile period following the first increase in US interest rates in December 2015 and in the immediate aftermath of the UK Brexit referendum .
Markets had a dreadful start to the year as investors became increasingly concerned about growth conditions in China and the US and this was exacerbated by rising geopolitical uncertainty, a further collapse in oil prices and softening economic and corporate data . By mid-February most equity indices had posted double digit declines, reflecting expectations of an imminent earnings recession . However as fundamental data gradually improved and central bankers committed to easier monetary policy for longer, markets staged an impressive recovery before returning to panic mode after the shock Brexit vote at the end of June . Markets again subsequently recovered with many indices at or near all-time highs at the end of the period .

Standard Bank International Funds Limited
10
We entered the year with the maximum permissible allocation to equities, reflecting our positive long-term outlook for the asset class and this was detrimental to performance as markets fell at the beginning of the year . Given the deterioration in the fundamental backdrop, particularly from a US earnings perspective, the equity allocation was reduced through the first quarter to a more neutral level to reflect a more cautious long-term outlook .
From an asset allocation perspective, the major drag was the lack of exposure to fixed income assets as bond yields continued to drift lower to new record lows and our short duration, underweight exposure was unhelpful . However the risks in fixed income assets remains asymmetrically skewed to the downside given just how low yields have fallen globally .
As always we are predominantly led by fundamentals when building portfolios, with a focus on earnings growth and valuation across asset classes . We continue to believe the portfolio is very well placed relative to the benchmark in both respects . In particular valuations in fixed income and some of the more defensively perceived areas of the equity market seem to be extremely stretched and in our view the risks are heavily skewed to the downside at current prices . The fixed income allocation therefore remains at the minimum of the permitted band and with minimal exposure to interest rate duration .
Forward thinking
The Fund has recouped some of the relative underperformance suffered in the early part of the year, however at this stage we remain cautious as to whether markets are shifting to a more fundamentally driven environment which would better suit the investment style of our strategy . We have retained a neutral exposure to equities throughout the period on the basis that the incremental improvement in sentiment and data has largely been offset by ongoing weakness in corporate earnings, particularly in the US .
We have also received confirmation from the Fund administrators of a change in the regulations regarding the classification of exchange traded funds (ETFs) . These have previously been classified as direct securities and their use has therefore been extremely limited in our fund of fund portfolios . However they are now to be classified as Collective Investment Schemes the same as the other funds we invest in .
This has potential ramifications for the way me manage multi asset portfolios such as the Global Balanced Fund . The main benefit is that we can gain index exposure quickly and cheaply via ETFs, which will allow us to trade more nimbly in a cost effective manner to allow for a more dynamic, active asset allocation strategy .
We are currently implementing a more dynamic asset allocation process that we will use to drive a more active allocation policy in the future which we are confident will add significant value to investors .
Investment objective
The Fund seeks to generate positive returns that are independent of market cycles, by targeting enhanced return opportunities through a diversified range of investment strategies . These seek to provide, either a regular reliable income stream, or inflation-protected returns, where the prime investment objective is to preserve the real value of capital .
The principal investment policy of each class will be to invest in a diversified blend of single manager funds (OIECs), Absolute Return Fixed Income funds (UCITS), investible indices, exchange tradable securities, forward foreign exchange contracts and cash positions .
Quantitative analysis
US Dollar Class
The Fund’s return for the period was +0 .86% . The Funds benchmark is US CPI which returned +1 .06% over the period .
Sterling Class
The Fund’s return for the period was +2 .96% . The Funds benchmark is UK CPI which returned +0 .60% over the period .
Commentary
The steady performance of the two fund classes over the last 12 months has masked a generally volatile annual period, with sharp intra-month movements, most notably during the early months of 2016 .
The latter part of 2015 was marked by a strong market rally in October following a period of sharp market weakness in both August and September . This was followed by consolidation in November and marginal declines in December .

Standard Bank International Funds Limited
11
Much of the market volatility in the early months of 2016 was attributed to uncertainties about future global economic growth, which were again triggered by concerns in China . Also, the divergence in major central bank actions were further muddying the waters . The US Federal Reserve was no longer to be engaged in an active quantitative easing program, as domestic monetary conditions had already tightened following the 25 basis point interest rate increase in December 2015 . In contrast, the European Central Bank (ECB) and Bank of Japan (BOJ) were still engaged in stimulatory monetary measures in their efforts to fight off deflation, weaken their currencies and spur growth .
Another period a marked volatility came in June following the UK’s decision to exit the EU, which sent shock waves through global financial markets, with Sterling the main casualty, falling over -12% (to September 30 2016) against the US dollar, a level last seen in 1985 and just over -11% versus the Euro, last seen more recently in 2013 . In the immediate aftermath of Brexit, global equity markets struggled, but then rallied strongly in response to expectations that global interest rates would stay lower for longer . Conversely, Government bonds rallied sharply as investors sought risk haven assets, resulting in sharp falls in yields, with the UK 10 year gilt falling to just over 0 .50% for the first time in mid-August .
The impact of Brexit on overall Fund performance was mixed, with both currency classes benefitting from the overweight exposure to credit based strategies and the Sterling class specifically benefitting from its unhedged exposure to the US Dollar . However, a marked negative influence derived from the UK commercial property exposure, which had been reduced from just over 20% in May to 9% immediately following the vote . This exposure was eliminated entirely by early October, when the two remaining funds were redeemed . Both had three month notice periods for redemptions and the sale orders were placed in June .
Although there was a drag on performance caused by the impact of the redemption charges levied with the sale of the two UK commercial property funds, the performance of both fund currency classes was still positive during the third quarter, with the Sterling class up +1 .12% and the US Dollar class rising a more modest +0 .75% .
Forward thinking
Activity in the Fund continues to focus on its underlying exposure to four core areas, overall duration, corporate credit, convertibles and macro targeted return investment strategies, plus an increasingly important factor in determining performance, the currency overlay in each share class .
Standard Bank International Investments Limited Investment Manager 2 November 2016
Standard Bank International Funds Limited
12
Independent auditors’ report to the members of Standard Bank International Funds Limited
Report on the financial statements
Our opinion
In our opinion Melville Douglas Balanced Fund Limited’s financial statements (“the financial statements”);
• give a true and fair view of the state of the company’s affairs as at 30 September 2016 and of its profit for the year then ended;
• have been properly prepared in accordance with United Kingdom Generally Accepted Accounting Practice, including FRS 102, “The Financial Reporting Standard applicable in the United Kingdom and the Republic of Ireland”; and
• have been properly prepared in accordance with the requirements of the Companies (Jersey) Law 1991 .
What we have audited
The financial statements comprise:
• the Statements of Financial Position as at 30 September 2016;
• the Statements of Comprehensive Income for the year then ended;
• the Statements of Changes in Equity for the year then ended;
• the accounting policies; and
• the notes to the financial statements which include other explanatory information .
The financial reporting framework that has been applied in their preparation is applicable law and United Kingdom Generally Accepted Accounting Practice, including FRS 102, “The Financial Reporting Standard applicable in the United Kingdom and the Republic of Ireland” .
In applying the financial reporting framework, the directors have made a number of subjective judgements, for example in respect of significant accounting estimates . In making such estimates, they have made assumptions and considered future events .
Opinion on other matter
In our opinion, the information given in the Directors’ Report for the financial year for which the financial statements are prepared is consistent with the financial statements .
Other matters on which we are required to report by exception
Under the Companies (Jersey) Law 1991 we are required to report to you if, in our opinion:
• we have not received all the information and explanations we require for our audit; or
• proper accounting records have not been kept; or
• the financial statements are not in agreement with the accounting records .
We have no exceptions to report arising from this responsibility .
Standard Bank International Funds Limited
13
Responsibilities for the financial statements and the audit
Our responsibilities and those of the directors
As explained more fully in the Statement of Directors’ Responsibilities set out on page 6, the directors are responsible for the preparation of the financial statements and for being satisfied that they give a true and fair view .
Our responsibility is to audit and express an opinion on the financial statements in accordance with applicable law and International Standards on Auditing (UK and Ireland) . Those standards require us to comply with the Auditing Practices Board’s Ethical Standards for Auditors .
This report, including the opinions, has been prepared for and only for the company’s members as a body in accordance with Article 113A of the Companies (Jersey) Law 1991 and for no other purpose .
We do not, in giving these opinions, accept or assume responsibility for any other purpose or to any other person to whom this report is shown or into whose hands it may come save where expressly agreed by our prior consent in writing .
What an audit of financial statements involves
We conducted our audit in accordance with International standards on Auditing (UK and Ireland) . An audit involves obtaining evidence about the amounts and disclosures in the financial statements sufficient to give reasonable assurance that the financial statements are free from material misstatement, whether caused by fraud or error . This includes an assessment of:
• whether the accounting policies are appropriate to the company’s circumstances and have been consistently applied and adequately disclosed;
• the reasonableness of significant accounting estimates made by the directors; and
• the overall presentation of the financial statements .
We primarily focus our work in these areas by assessing the directors’ judgements against available evidence, forming our own judgements, and evaluating the disclosures in the financial statements .
We test and examine information, using sampling and other auditing techniques, to the extent we consider necessary to provide a reasonable basis for us to draw conclusions . We obtain audit evidence through testing the effectiveness of controls, substantive procedures or a combination of both .
In addition, we read all the financial and non-financial information in the Annual Report to identify material inconsistencies with the audited financial statements and to identify any information that is apparently materially incorrect based on, or materially inconsistent with, the knowledge acquired by us in the course of performing the audit . If we become aware of any apparent material misstatements or inconsistencies we consider the implications for our report .
Declan Murphy for and on behalf of PricewaterhouseCoopers Chartered Accountants Dublin 11 January 2017

Standard Bank International Funds Limited
14
Statement of Financial Position
As at 30 September 2016 (Comparatives as at 30 September 2015)
Multi Manager Global Multi Manager Global Multi Manager GlobalEquity Fund (USD) Equity Fund (GBP) Balanced Fund (USD)
30 September 30 September 30 September 30 September 30 September 30 September2016 2015 2016 2015 2016 2015
Notes USD USD GBP GBP USD USD Assets Financial assets at
fair value through
profit or loss
2(b),
8 .3 57,866,699 68,238,903 71,130,665 70,445,508 10,523,996 9,551,962Cash and cash
equivalents 2(c) 1,562,624 419,044 1,114,249 500,575 412,428 765,669Receivable for
shares sold 2(f) – 19,849 70,015 21,382 – –Income receivable – – – – 567 –Receivable for
investments sold 391,245 241,180 516,982 150,000 – –
Total assets 59,820,568 68,918,976 72,831,91 71,117,465 10,936,991 10,317,631
Liabilities Payable for
investments
purchased 1,247,040 – 600,000 230,325 – –Payable for shares
redeemed 2(f) 439,024 404,759 532,894 211,662 – –Management fees
payable 2(g) 71,216 96,895 87,306 98,212 13,256 15,169Custodian fees
payable 2(g) 1,612 2,076 1,599 1,774 411 466Sub-Custodian fee
payable 2(g) 6,479 5,139 2,486 7,832 2,929 1,583Director fees
payable 2(g) 3,653 3,951 4,048 5,870 915 5,512Audit fees payable 2(g) 5,674 4,758 4,365 6,227 2,609 4,582Other payables 2,155 2,342 2,943 2,195 776 857
Total liabilities 1,776,853 519,920 1,235,641 564,097 20,896 28,169
Net assets attributable to holders of redeemable shares 58,043,715 68,399,056 71,596,270 70,553,368 10,916,095 10,289,462
Net asset value per share class Class A Shares 10 11 .68 10 .54 17 .52 14 .74 11 .41 10 .59Class B Shares* 10 11 .68 – 12 .49 – 10 .68 –
* Multi Manager Global Equity (USD) – Class B Shares, Multi Manager Global Equity (GBP) – Class B Shares and Multi Manager Global Balanced (USD) – Class B Shares have been launched on 15 February 2016, 15 February 2016 and 26 February 2016 respectively .
Director
The notes on pages 19 to 42 form an integral part of these financial statements .

Standard Bank International Funds Limited
15
Notes to Financial Statements (continued)
Multi Manager Global Multi Manager Global Multi Manager GlobalBalanced Fund (GBP) Return Fund (USD) Return Fund (GBP)
30 September 30 September 30 September 30 September 30 September 30 September2016 2015 2016 2015 2016 2015
Notes GBP GBP USD USD GBP GBP Assets
Financial assets at
fair value through
profit or loss
2(b),
8 .3 9,092,690 7,719,293 34,438,149 46,327,356 32,657,085 29,829,443
Cash and cash
equivalents 2(c) 317,153 429,909 2,731,515 4,106,608 3,026,310 1,817,725
Unrealised gain
on forward foreign
currency contracts 8 .5 – – _ 330,450 _ _
Receivable for
shares sold 2(f) – – _ – 75,005 191,814
Income receivable 517 – _ 2,231 _ 1,473
Total assets 9,410,360 8,149,194 37,149,664 50,766,645 35,758,400 31,840,455
Liabilities
Unrealised loss on
forward foreign
currency contracts 8 .5 – – 13,954 40,259 _ 145,587
Payable for shares
redeemed 2(f) – 8,996 22,169 49,627 _ _
Management fees
payable 2(g) 11,258 11,611 31,111 40,367 29,767 25,085
Custodian fees
payable 2(g) 257 291 1,285 1,613 1,340 1,049
Sub-Custodian
fees payable 2(g) 1,176 2,344 819 2,134 1,476 1,862
Director fees
payable 2(g) 943 3,644 2 .89 3,151 2,003 2,015
Audit fees payable 2(g) 2,232 3,614 4,227 7,461 3,112 4,701
Other payables 1,623 573 1,606 1,791 963 966
Total liabilities 17,489 31,063 77,460 146,443 38,661 190,265
Net assets attributable to holders of redeemable shares 9,392,871 8,118,131 37,092,204 50,620,202 35,739 31,650,190
Net asset value per share class
Class A Shares 10 12 .43 11,24 9,34 9,25 10,80 10,46
Class B Shares* 10 11 .13 – – – _ _
* Multi Manager Global Balanced (GBP) - Class B Shares has been launched on 19 February 2016 .The notes on pages 19 to 38 form an integral part of these financial statements .
The Financial statements were approved by the board on 11 January 2017 and signed on behalf by:
Director
The notes on pages 19 to 42 form an integral part of these financial statement
Standard Bank International Funds Limited
16
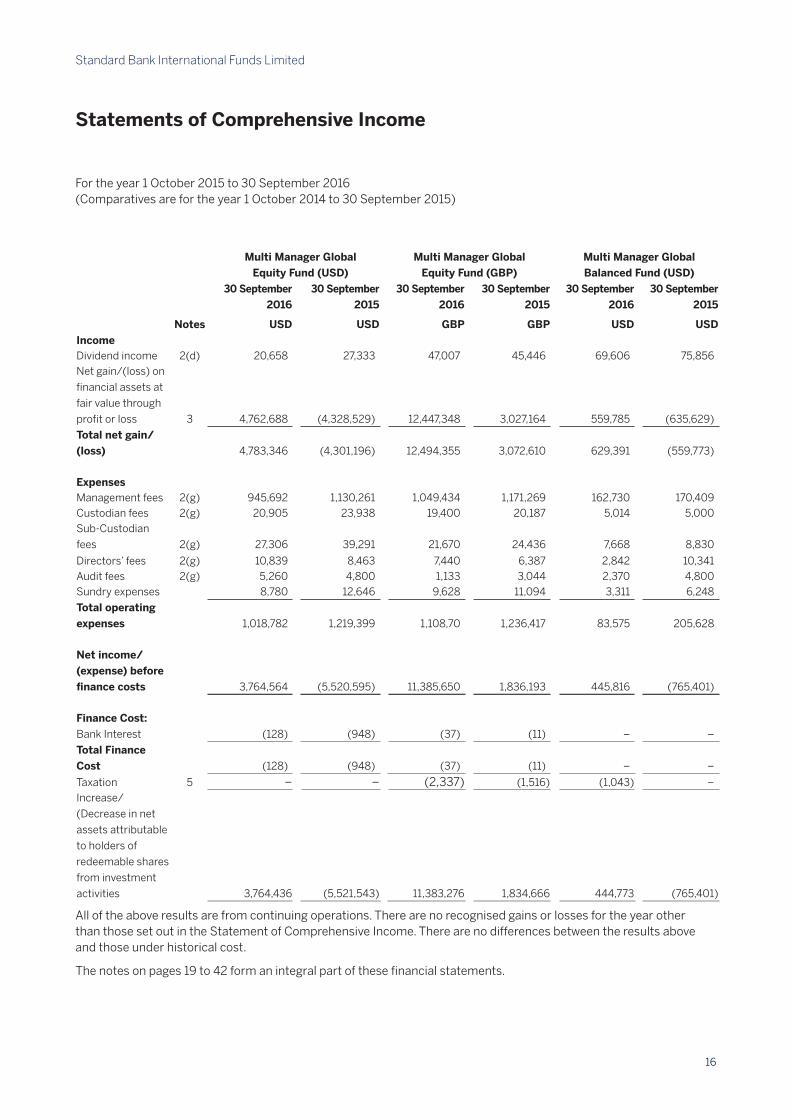
Statements of Comprehensive Income
For the year 1 October 2015 to 30 September 2016 (Comparatives are for the year 1 October 2014 to 30 September 2015)
Multi Manager Global Multi Manager Global Multi Manager GlobalEquity Fund (USD) Equity Fund (GBP) Balanced Fund (USD)
30 September 30 September 30 September 30 September 30 September 30 September2016 2015 2016 2015 2016 2015
Notes USD USD GBP GBP USD USD Income Dividend income 2(d) 20,658 27,333 47,007 45,446 69,606 75,856Net gain/(loss) on
financial assets at
fair value through
profit or loss 3 4,762,688 (4,328,529) 12,447,348 3,027,164 559,785 (635,629)
Total net gain/(loss) 4,783,346 (4,301,196) 12,494,355 3,072,610 629,391 (559,773)
Expenses Management fees 2(g) 945,692 1,130,261 1,049,434 1,171,269 162,730 170,409Custodian fees 2(g) 20,905 23,938 19,400 20,187 5,014 5,000Sub-Custodian
fees 2(g) 27,306 39,291 21,670 24,436 7,668 8,830
Directors’ fees 2(g) 10,839 8,463 7,440 6,387 2,842 10,341Audit fees 2(g) 5,260 4,800 1,133 3,044 2,370 4,800Sundry expenses 8,780 12,646 9,628 11,094 3,311 6,248
Total operating expenses 1,018,782 1,219,399 1,108,70 1,236,417 83,575 205,628
Net income/(expense) before finance costs 3,764,564 (5,520,595) 11,385,650 1,836,193 445,816 (765,401)
Finance Cost:Bank Interest (128) (948) (37) (11) – –
Total Finance Cost (128) (948) (37) (11) – –
Taxation 5 – – (2,337) (1,516) (1,043) –Increase/
(Decrease in net
assets attributable
to holders of
redeemable shares
from investment
activities 3,764,436 (5,521,543) 11,383,276 1,834,666 444,773 (765,401)
All of the above results are from continuing operations . There are no recognised gains or losses for the year other than those set out in the Statement of Comprehensive Income . There are no differences between the results above and those under historical cost .
The notes on pages 19 to 42 form an integral part of these financial statements .

Standard Bank International Funds Limited
17
Statements of Comprehensive Income (continued)
Multi Manager Global Multi Manager Global Multi Manager GlobalEquity Fund (USD) Equity Fund (GBP) Balanced Fund (USD)
30 September 30 September 30 September 30 September 30 September 30 September2016 2015 2016 2015 2016 2015
Notes GBP GBP USD USD GPB GPB Income Dividend income 2(d) 57,571 70,326 114,367 93,345 178,671 118,653Net gain/(loss) on
financial assets at
fair value through
profit or loss 3 983,797 73,825 757,059 (756,108) 1,194,450 160,670
Total net gain/(loss) 1,041,368 144,151 871,426 (662,763) 1,373,121 297,323
Expenses Management fees 2(g) 131,488 126,335 379,009 412,219 283,293 249,201Custodian fees 2(g) 3,137 3,128 15,588 16,944 12,252 10,316Sub-Custodian
fees 2(g) 3,813 4,547 17,926 22,717 13,555 17,168
Directors’ fees 2(g) 2,159 6,448 9,205 9,824 6,894 6,170Audit fees 2(g) 1,614 3,044 1,110 4,678 1,407 3,044Sundry expenses 3,432 4,127 4,729 6,675 3,405 4,027
Total operating expenses 145,643 147,629 427,567 473,057 320,860 289,926
Net income/(expense) before finance costs 895,725 (3,478) 443,859 (1,135,820) 1,052,261 (10,603)
Finance Cost:Bank Interest (35) – (911) (32) (625) –
Total Finance Cost (35) – (911) (32) (625) –
Taxation 5 (131) – (11,708) (3,591) (1,0658) (4,923)
Increase/
(Decrease in net
assets attributable
to holders of
redeemable shares
from investment
activities 895,559 (3,478) 431,240 (1,139,443) 1,040,978 (15,526)
All of the above results are from continuing operations . There are no recognised gains or losses for the year other than those set out in the Statement of Comprehensive Income . There are no differences between the results above and those under historical cost .
The notes on pages 19 to 42 form an integral part of these financial statements .

Standard Bank International Funds Limited
18
Statements of Changes in Equity For the year 1 October 2015 to 30 September 2016 (Comparatives are for the year 1 October 2014 to 30 September 2015)
Multi Manager Global Multi Manager Global Multi Manager GlobalEquity Fund (USD) Equity Fund (GBP) Balanced Fund (USD)
30 September 30 September 30 September 30 September 30 September 30 September2016 2015 2016 2015 2016 2015
Notes USD USD GBP GBP USD USD Net assets
attributable
to holders of
redeemable shares
at the beginning of
the year 68,399,056 84,431,060 70,553,368 77,550,464 10,289,462 10,490,156Proceeds from the
issue of shares 6 6,699,960 9,978,880 8,139,615 4,241,019 1440,291 2,282,783Payments on the
redemption of
shares 6 (20,819,737) (20,489,341) (18,479,989) (13,072,781) (1,258,431) (1,718,076)Increase/
(Decrease) in net
assets attributable
to holders of
redeemable shares
from operations 3,764,436 (5,521,543) 11,383,276 1,34,666 444,773 (765,401)Net assets
attributable
to holders of
redeemable shares
at the end of the year 58,043,715 68,399,056 71,596,270 70,553,368 10,916,095 1,289,462
Multi Manager Global Multi Manager Global Multi Manager GlobalBalanced Fund (GBP) Return Fund (USD) Return Fund (GBP)
30 September 30 September 30 September 30 September 30 September 30 September2016 2015 2016 2015 2016 2015
Notes GBP GBP USD USD GBP GBP Net assets
attributable
to holders of
redeemable shares
at the beginning of
the year 8,118,131 7,982,986 50,620,202 41,200,576 31,650,190 27,310,017Proceeds from the
issue of shares 6 1,553,779 1,495,326 3,031,530 142,725,884 5,816,150 8,097,178Payments on the
redemption of
shares 6 (1,174,598) (1,356,703) (16,996,768) (4,166,185) (2,787,579) (3,741,479)Increase/
(Decrease) in net
assets attributable
to holders of
redeemable shares
from operations 895,559 (3,478) 431,240 (1,139,443) 1,040,978 (15,526)Net assets
attributable
to holders of
redeemable shares
at the end of the
year 9,392,871 8,118,131 37,092,204 50,620,202 53,719,7393 31,650,190
The notes on pages 19 to 42 form an integral part of these financial statements .

Standard Bank International Funds Limited
19
Standard Bank International Funds Limited
Notes to the financial statements
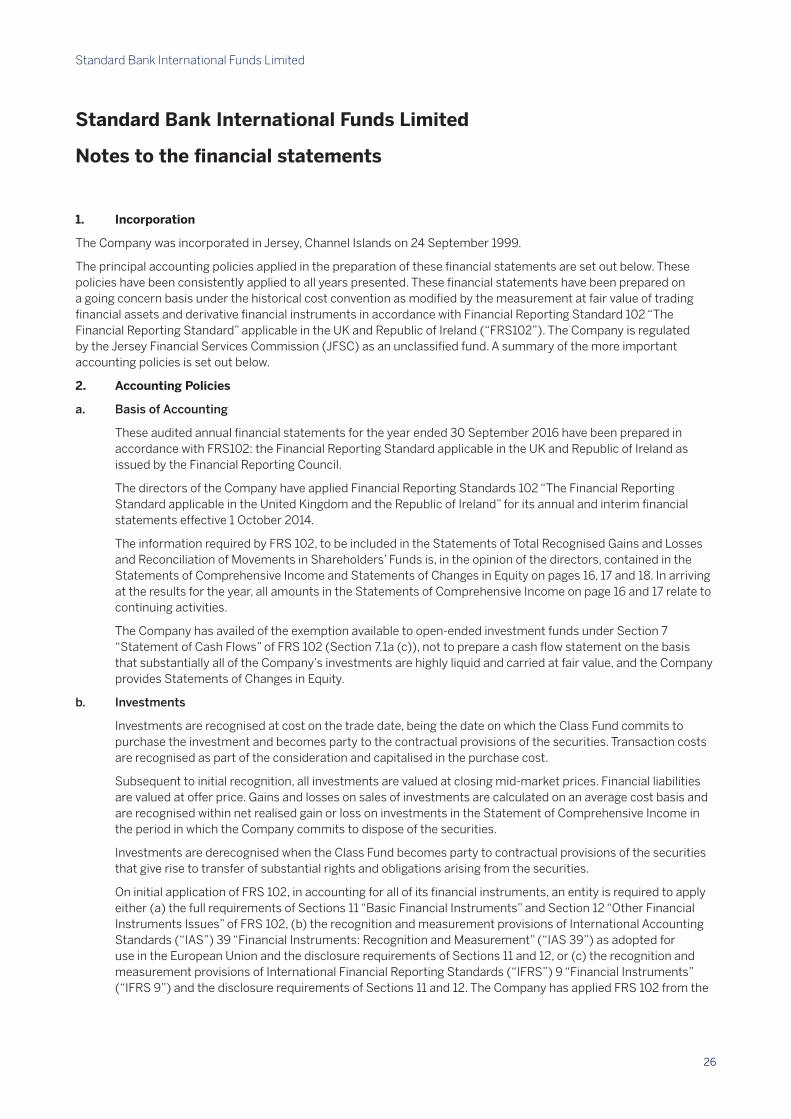
1. Incorporation
The Company was incorporated in Jersey, Channel Islands on 24 September 1999 .
The principal accounting policies applied in the preparation of these financial statements are set out below . These policies have been consistently applied to all years presented . These financial statements have been prepared on a going concern basis under the historical cost convention as modified by the measurement at fair value of trading financial assets and derivative financial instruments in accordance with Financial Reporting Standard 102 “The Financial Reporting Standard” applicable in the UK and Republic of Ireland (“FRS102”) . The Company is regulated by the Jersey Financial Services Commission (JFSC) as an unclassified fund . A summary of the more important accounting policies is set out below .
2. Accounting Policies
a. BasisofAccounting
These audited annual financial statements for the year ended 30 September 2016 have been prepared in accordance with FRS102: the Financial Reporting Standard applicable in the UK and Republic of Ireland as issued by the Financial Reporting Council .
The directors of the Company have applied Financial Reporting Standards 102 “The Financial Reporting Standard applicable in the United Kingdom and the Republic of Ireland” for its annual and interim financial statements effective 1 October 2014 .
The information required by FRS 102, to be included in the Statements of Total Recognised Gains and Losses and Reconciliation of Movements in Shareholders’ Funds is, in the opinion of the directors, contained in the Statements of Comprehensive Income and Statements of Changes in Equity on pages 16, 17 and 18 . In arriving at the results for the year, all amounts in the Statements of Comprehensive Income on page 16 and 17 relate to continuing activities .
The Company has availed of the exemption available to open-ended investment funds under Section 7 “Statement of Cash Flows” of FRS 102 (Section 7 .1a (c)), not to prepare a cash flow statement on the basis that substantially all of the Company’s investments are highly liquid and carried at fair value, and the Company provides Statements of Changes in Equity .
b. Investments
Investments are recognised at cost on the trade date, being the date on which the Class Fund commits to purchase the investment and becomes party to the contractual provisions of the securities . Transaction costs are recognised as part of the consideration and capitalised in the purchase cost .
Subsequent to initial recognition, all investments are valued at closing mid-market prices . Financial liabilities are valued at offer price . Gains and losses on sales of investments are calculated on an average cost basis and are recognised within net realised gain or loss on investments in the Statement of Comprehensive Income in the period in which the Company commits to dispose of the securities .
Investments are derecognised when the Class Fund becomes party to contractual provisions of the securities that give rise to transfer of substantial rights and obligations arising from the securities .
On initial application of FRS 102, in accounting for all of its financial instruments, an entity is required to apply either (a) the full requirements of Sections 11 “Basic Financial Instruments” and Section 12 “Other Financial Instruments Issues” of FRS 102, (b) the recognition and measurement provisions of International Accounting Standards (“IAS”) 39 “Financial Instruments: Recognition and Measurement” (“IAS 39”) as adopted for
Standard Bank International Funds Limited
20
use in the European Union and the disclosure requirements of Sections 11 and 12, or (c) the recognition and measurement provisions of International Financial Reporting Standards (“IFRS”) 9 “Financial Instruments” (“IFRS 9”) and the disclosure requirements of Sections 11 and 12 . The Company has applied FRS 102 from the year ended 30 September 2015 and has elected to apply the full requirements of Sections 11 and Section 12 of FRS 102 . .
2. Accounting Policies (continued)
c. Cashandcashequivalents
Cash is valued at cost, which approximates fair value .
Cash is held in accounts at The Bank of New York Mellon SA/NV London Branch which allows the Class Funds instant access to their accounts . Term deposits are deposits which may be held with various financial institutions bearing fixed or variable interest rates payable at maturity .
d. Income
Interest income is accounted for on an accruals basis using the effective yield basis . Dividend income, including stock dividends, is accounted for on the ex-dividend date gross of withholding tax deducted at source . Withholding tax is reported as taxation expense in the period in which it is incurred . Interest on deposit accounts is included on an accruals basis .
e. Foreigncurrencies
Transactions in foreign currencies are translated into the currency of the Class Funds at the rates of exchange ruling at the date of the transaction . Monetary assets and liabilities denominated in foreign currencies are translated into the currency of the Class Funds at the rates of exchange ruling at the Statements of Financial Position date . Differences arising on the translation of investments are included in the Statements of Comprehensive Income within net capital gains or losses on investments in the period in which they arise . The functional and presentational currencies of the Class Funds are US Dollars for the Multi Manager Global Equity Fund (USD), Multi Manager Global Balanced Fund (USD) and Multi Manager Absolute Return Fund (USD), Sterling for the Multi Manager Global Equity Fund (GBP), Multi Manager Global Balanced Fund (GBP) and Multi Manager Absolute Return Fund (GBP) .
Foreign currency gains and losses on revenue and expenses due to movements in exchange rates between the record date and settlement date are included in the Statements of Comprehensive Income with income or expenses .
f. Shareissuesandredemptions
Shares in the Company may be issued at the issue price and redeemed at the redemption price on subscription days at the prices calculated in accordance with the Articles of Association and based on the value of the underlying net assets held in the relevant Class Fund . Participating shares are classified as financial liabilities in the financial statements as they are not the most subordinated class in the Company .
Receivable for shares sold and payable for shares redeemed represent amounts that have been contracted for but not yet settled or delivered on the Statement of Financial Position date .
g. Expenses
The Company is responsible for the payment of management, audit, director, custodian and sub-custodian fees which are accrued for on each valuation point, and the payment of other expenses as detailed in the Company’s prospectus . All expenses are accounted for on an accruals basis .
h. Netgains/(losses)onfinancialassetsatfairvaluethroughprofitorloss
This item includes changes in the fair value of financial assets held for trading and excludes interest and dividend income and expenses . Unrealised gains and losses comprise changes in the fair value of financial instruments for the year . Realised gains and losses on disposals are calculated using the average cost method and are reflected as net gains or losses on investments in the Statements of Comprehensive Income .

Standard Bank International Funds Limited
21
i. Withholdingtaxes
In some jurisdictions investment income is subject to withholding tax deducted at the source of the income . Withholding tax is a generic term used for the amount of withholding tax deducted at the source of the income and is not significant for the Portfolio . Withholding tax is disclosed separately as a tax charge from the gross investment income in the Statements of Comprehensive Income .
j. Distributionpolicy
The Company’s policy is to not distribute any income on its participating shares .
Standard Bank International Funds Limited
22
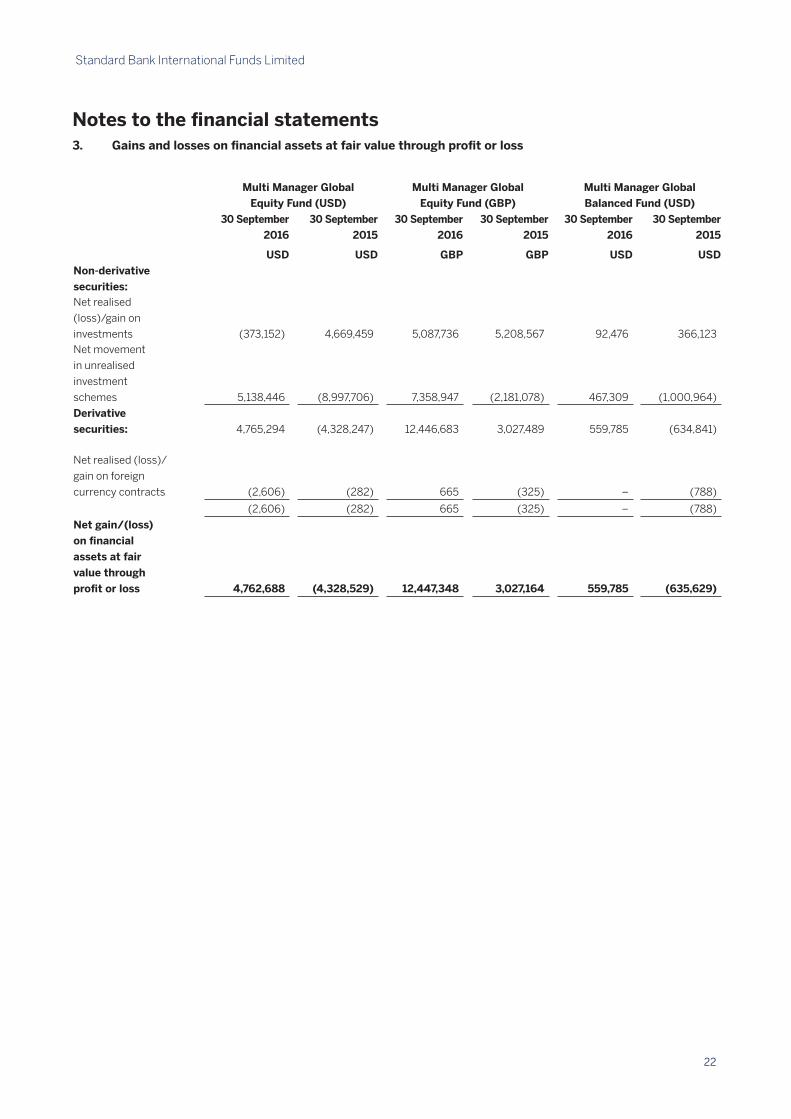
Notes to the financial statements3. Gains and losses on financial assets at fair value through profit or loss
Multi Manager Global Multi Manager Global Multi Manager GlobalEquity Fund (USD) Equity Fund (GBP) Balanced Fund (USD)
30 September 30 September 30 September 30 September 30 September 30 September2016 2015 2016 2015 2016 2015
USD USD GBP GBP USD USD Non-derivative securities: Net realised
(loss)/gain on
investments (373,152) 4,669,459 5,087,736 5,208,567 92,476 366,123Net movement
in unrealised
investment
schemes 5,138,446 (8,997,706) 7,358,947 (2,181,078) 467,309 (1,000,964)
Derivative securities: 4,765,294 (4,328,247) 12,446,683 3,027,489 559,785 (634,841)
Net realised (loss)/
gain on foreign
currency contracts (2,606) (282) 665 (325) – (788)
(2,606) (282) 665 (325) – (788)
Net gain/(loss) on financial assets at fair value through profit or loss 4,762,688 (4,328,529) 12,447,348 3,027,164 559,785 (635,629)
Standard Bank International Funds Limited
23
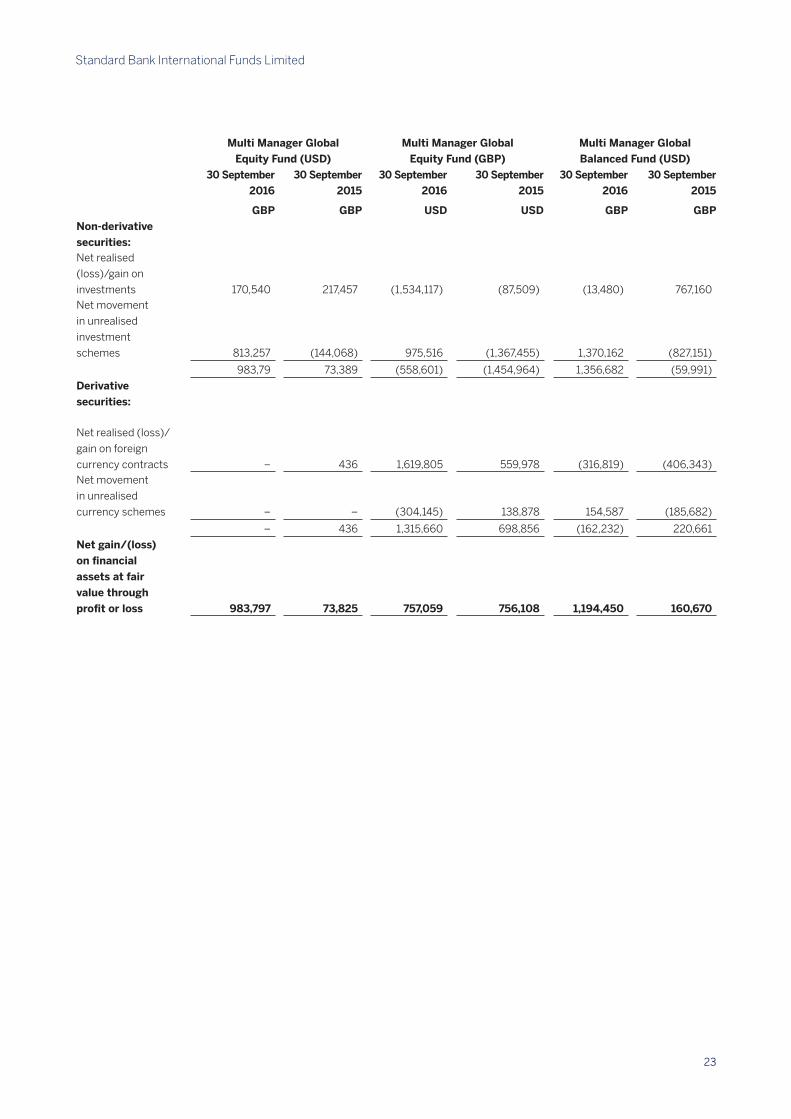
Multi Manager Global Multi Manager Global Multi Manager GlobalEquity Fund (USD) Equity Fund (GBP) Balanced Fund (USD)
30 September 30 September 30 September 30 September 30 September 30 September2016 2015 2016 2015 2016 2015
GBP GBP USD USD GBP GBP Non-derivative securities: Net realised
(loss)/gain on
investments 170,540 217,457 (1,534,117) (87,509) (13,480) 767,160Net movement
in unrealised
investment
schemes 813,257 (144,068) 975,516 (1,367,455) 1,370,162 (827,151)
983,79 73,389 (558,601) (1,454,964) 1,356,682 (59,991)
Derivative securities:
Net realised (loss)/
gain on foreign
currency contracts – 436 1,619,805 559,978 (316,819) (406,343)Net movement
in unrealised
currency schemes – – (304,145) 138,878 154,587 (185,682)
– 436 1,315,660 698,856 (162,232) 220,661
Net gain/(loss) on financial assets at fair value through profit or loss 983,797 73,825 757,059 756,108 1,194,450 160,670

Standard Bank International Funds Limited
24
Notes to Financial Statements (continued)
4. Investment Purchases, Investment Sales and Commissions
Multi Manager Global Multi Manager Global Multi Manager GlobalEquity Fund (USD) Equity Fund (GBP) Balanced Fund (USD)
30 September 30 September 30 September 30 September 30 September 30 September2016 2015 2016 2015 2016 2015
USD USD GBP GBP USD USD Purchase during
the year before
commission 16,928,982 26,554,737 26,545,668 21,575,853 4,061,351 4,980,847Commission on
purchases – – – – (50) –
Gross purchases 16,928,982 26,554,737 26,545,668 21,575,853 4,061,301 4,980,847Sales during the year
before commission 32,201,794 38,195,218 38,302,910 30,466,651 3,642,792 4,474,340Commission on sales (1,910) (2,902) (10,308) – – –Gross sales 32,199,884 38,192,316 38,292,602 30,466,651 3,642,792 4,474,340
Multi Manager Global Multi Manager Global Multi Manager GlobalBalanced Fund (GBP) Return Fund (USD) Return Fund (GBP)
30 September 30 September 30 September 30 September 30 September 30 September2016 2015 2016 2015 2016 2015
GBP GBP USD USD GBP GBP Purchase during
the year before
commission 4,678,340 1,844,836 38,798,934 60,335,046 26,040,557 28,717,555Commission on
purchases (66) – (3,083) – (68) –Gross purchases 4,678,274 1,844,836 38,795,851 60,335,046 26,040,489 28,717,555Sales during the year
before commission 4,296,583 1,549,150 49,764,220 43,616,383 24,473,518 24,713,244Commission on sales (1,001) – (50) (40) (38) (31)
Gross sales 4,295,582 1,549,150 49,764,170 43,616,343 24,473,480 24,713,213

Standard Bank International Funds Limited
25
Notes to Financial Statements (continued)
Multi Manager Global Multi Manager Global Multi Manager GlobalEquity Fund (USD) Equity Fund (GBP) Balanced Fund (USD)
30 September 30 September 30 September 30 September 30 September 30 September2016 2015 2016 2015 2016 2015
GBP USD GBP GBP USD USD Purchase during
the year before
commission 16,928,982 26,554,737 26,545,668 21,575,853 4,061,351 4,980,847
Commission on
purchases – – – – (50) –
Gross purchases 16,928,982 26,554,737 26,545,668 21,575,853 4,061,301 4,980,847
Sales during the year
before commission 32,201,794 38,195,218 38,302,910 30,466,651 3,642,792 4,474,340
Commission on sales (1,910) (2,902) (10,308) – – –
Gross sales 32,199,884 38,192,316 38,292,602 30,466,651 3,642,792 4,474,340
Multi Manager Global Multi Manager Global Multi Manager GlobalBalanced Fund (GBP) Return Fund (USD) Return Fund (GBP)
30 September 30 September 30 September 30 September 30 September 30 September2016 2015 2016 2015 2016 2015
GBP GBP USD USD GBP GBP Purchase during
the year before
commission 4,678,340 1,844,836 38,798,934 60,335,046 26,040,557 28,717,555
Commission on
purchases (66) – (3,083) – (68) –
Gross purchases 4,678,274 1,844,836 38,795,851 60,335,046 26,040,489 28,717,555
Sales during the year
before commission 4,296,583 1,549,150 49,764,220 43,616,383 24,473,518 24,713,244
Commission on sales (1,001) – (50) (40) (38) (31)
Gross sales 4,295,582 1,549,150 49,764,170 43,616,343 24,473,480 24,713,213
Standard Bank International Funds Limited
26
Standard Bank International Funds Limited
Notes to the financial statements
1. Incorporation
The Company was incorporated in Jersey, Channel Islands on 24 September 1999 .
The principal accounting policies applied in the preparation of these financial statements are set out below . These policies have been consistently applied to all years presented . These financial statements have been prepared on a going concern basis under the historical cost convention as modified by the measurement at fair value of trading financial assets and derivative financial instruments in accordance with Financial Reporting Standard 102 “The Financial Reporting Standard” applicable in the UK and Republic of Ireland (“FRS102”) . The Company is regulated by the Jersey Financial Services Commission (JFSC) as an unclassified fund . A summary of the more important accounting policies is set out below .
2. Accounting Policies
a. BasisofAccounting
These audited annual financial statements for the year ended 30 September 2016 have been prepared in accordance with FRS102: the Financial Reporting Standard applicable in the UK and Republic of Ireland as issued by the Financial Reporting Council .
The directors of the Company have applied Financial Reporting Standards 102 “The Financial Reporting Standard applicable in the United Kingdom and the Republic of Ireland” for its annual and interim financial statements effective 1 October 2014 .
The information required by FRS 102, to be included in the Statements of Total Recognised Gains and Losses and Reconciliation of Movements in Shareholders’ Funds is, in the opinion of the directors, contained in the Statements of Comprehensive Income and Statements of Changes in Equity on pages 16, 17 and 18 . In arriving at the results for the year, all amounts in the Statements of Comprehensive Income on page 16 and 17 relate to continuing activities .
The Company has availed of the exemption available to open-ended investment funds under Section 7 “Statement of Cash Flows” of FRS 102 (Section 7 .1a (c)), not to prepare a cash flow statement on the basis that substantially all of the Company’s investments are highly liquid and carried at fair value, and the Company provides Statements of Changes in Equity .
b. Investments
Investments are recognised at cost on the trade date, being the date on which the Class Fund commits to purchase the investment and becomes party to the contractual provisions of the securities . Transaction costs are recognised as part of the consideration and capitalised in the purchase cost .
Subsequent to initial recognition, all investments are valued at closing mid-market prices . Financial liabilities are valued at offer price . Gains and losses on sales of investments are calculated on an average cost basis and are recognised within net realised gain or loss on investments in the Statement of Comprehensive Income in the period in which the Company commits to dispose of the securities .
Investments are derecognised when the Class Fund becomes party to contractual provisions of the securities that give rise to transfer of substantial rights and obligations arising from the securities .
On initial application of FRS 102, in accounting for all of its financial instruments, an entity is required to apply either (a) the full requirements of Sections 11 “Basic Financial Instruments” and Section 12 “Other Financial Instruments Issues” of FRS 102, (b) the recognition and measurement provisions of International Accounting Standards (“IAS”) 39 “Financial Instruments: Recognition and Measurement” (“IAS 39”) as adopted for use in the European Union and the disclosure requirements of Sections 11 and 12, or (c) the recognition and measurement provisions of International Financial Reporting Standards (“IFRS”) 9 “Financial Instruments” (“IFRS 9”) and the disclosure requirements of Sections 11 and 12 . The Company has applied FRS 102 from the

Standard Bank International Funds Limited
27
year ended 30 September 2015 and has elected to apply the full requirements of Sections 11 and Section 12 of FRS 102 . .
2. Accounting Policies (continued)
c. Cashandcashequivalents
Cash is valued at cost, which approximates fair value .
Cash is held in accounts at The Bank of New York Mellon SA/NV London Branch which allows the Class Funds instant access to their accounts . Term deposits are deposits which may be held with various financial institutions bearing fixed or variable interest rates payable at maturity .
d. Income
Interest income is accounted for on an accruals basis using the effective yield basis . Dividend income, including stock dividends, is accounted for on the ex-dividend date gross of withholding tax deducted at source . Withholding tax is reported as taxation expense in the period in which it is incurred . Interest on deposit accounts is included on an accruals basis .
e. Foreigncurrencies
Transactions in foreign currencies are translated into the currency of the Class Funds at the rates of exchange ruling at the date of the transaction . Monetary assets and liabilities denominated in foreign currencies are translated into the currency of the Class Funds at the rates of exchange ruling at the Statements of Financial Position date . Differences arising on the translation of investments are included in the Statements of Comprehensive Income within net capital gains or losses on investments in the period in which they arise . The functional and presentational currencies of the Class Funds are US Dollars for the Multi Manager Global Equity Fund (USD), Multi Manager Global Balanced Fund (USD) and Multi Manager Absolute Return Fund (USD), Sterling for the Multi Manager Global Equity Fund (GBP), Multi Manager Global Balanced Fund (GBP) and Multi Manager Absolute Return Fund (GBP) .
Foreign currency gains and losses on revenue and expenses due to movements in exchange rates between the record date and settlement date are included in the Statements of Comprehensive Income with income or expenses .
f. Shareissuesandredemptions
Shares in the Company may be issued at the issue price and redeemed at the redemption price on subscription days at the prices calculated in accordance with the Articles of Association and based on the value of the underlying net assets held in the relevant Class Fund . Participating shares are classified as financial liabilities in the financial statements as they are not the most subordinated class in the Company .
Receivable for shares sold and payable for shares redeemed represent amounts that have been contracted for but not yet settled or delivered on the Statement of Financial Position date .
g. Expenses
The Company is responsible for the payment of management, audit, director, custodian and sub-custodian fees which are accrued for on each valuation point, and the payment of other expenses as detailed in the Company’s prospectus . All expenses are accounted for on an accruals basis .
h. Netgains/(losses)onfinancialassetsatfairvaluethroughprofitorloss
This item includes changes in the fair value of financial assets held for trading and excludes interest and dividend income and expenses . Unrealised gains and losses comprise changes in the fair value of financial instruments for the year . Realised gains and losses on disposals are calculated using the average cost method and are reflected as net gains or losses on investments in the Statements of Comprehensive Income .

Standard Bank International Funds Limited
28
i. Withholdingtaxes
In some jurisdictions investment income is subject to withholding tax deducted at the source of the income . Withholding tax is a generic term used for the amount of withholding tax deducted at the source of the income and is not significant for the Portfolio . Withholding tax is disclosed separately as a tax charge from the gross investment income in the Statements of Comprehensive Income .
j. Distributionpolicy
The Company’s policy is to not distribute any income on its participating shares .
Standard Bank International Funds Limited
29
Notes to the Financial Statements continued
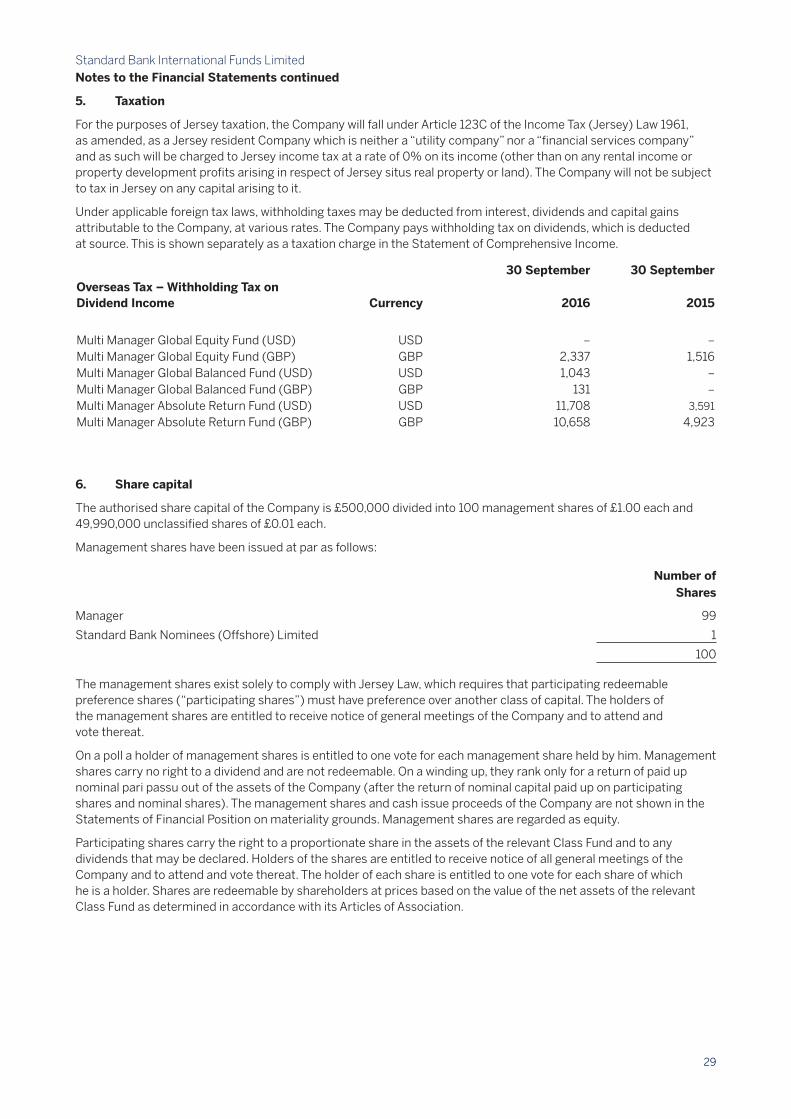
5. Taxation
For the purposes of Jersey taxation, the Company will fall under Article 123C of the Income Tax (Jersey) Law 1961, as amended, as a Jersey resident Company which is neither a “utility company” nor a “financial services company” and as such will be charged to Jersey income tax at a rate of 0% on its income (other than on any rental income or property development profits arising in respect of Jersey situs real property or land) . The Company will not be subject to tax in Jersey on any capital arising to it .
Under applicable foreign tax laws, withholding taxes may be deducted from interest, dividends and capital gains attributable to the Company, at various rates . The Company pays withholding tax on dividends, which is deducted at source . This is shown separately as a taxation charge in the Statement of Comprehensive Income .
30 September 30 SeptemberOverseas Tax – Withholding Tax on Dividend Income Currency 2016 2015
Multi Manager Global Equity Fund (USD) USD – –
Multi Manager Global Equity Fund (GBP) GBP 2,337 1,516Multi Manager Global Balanced Fund (USD) USD 1,043 –
Multi Manager Global Balanced Fund (GBP) GBP 131 –
Multi Manager Absolute Return Fund (USD) USD 11,708 3,591
Multi Manager Absolute Return Fund (GBP) GBP 10,658 4,923
6. Share capital
The authorised share capital of the Company is £500,000 divided into 100 management shares of £1 .00 each and 49,990,000 unclassified shares of £0 .01 each .
Management shares have been issued at par as follows:
Number of Shares
Manager 99
Standard Bank Nominees (Offshore) Limited 1
100
The management shares exist solely to comply with Jersey Law, which requires that participating redeemable preference shares (“participating shares”) must have preference over another class of capital . The holders of the management shares are entitled to receive notice of general meetings of the Company and to attend and vote thereat .
On a poll a holder of management shares is entitled to one vote for each management share held by him . Management shares carry no right to a dividend and are not redeemable . On a winding up, they rank only for a return of paid up nominal pari passu out of the assets of the Company (after the return of nominal capital paid up on participating shares and nominal shares) . The management shares and cash issue proceeds of the Company are not shown in the Statements of Financial Position on materiality grounds . Management shares are regarded as equity .
Participating shares carry the right to a proportionate share in the assets of the relevant Class Fund and to any dividends that may be declared . Holders of the shares are entitled to receive notice of all general meetings of the Company and to attend and vote thereat . The holder of each share is entitled to one vote for each share of which he is a holder . Shares are redeemable by shareholders at prices based on the value of the net assets of the relevant Class Fund as determined in accordance with its Articles of Association .

Standard Bank International Funds Limited
30
Managementshares
The management shares have been issued at par and the proceeds of the issue are represented by a separate management fund . Details of the management fund at the Statements of Financial Position date are as follows:
30 September 2016 30 September 2015GBP GBP
Current account 100 100
Management shares of GBP1 .00 each
Authorised, issued and fully paid 100 100
ThemanagementsharesarenotreflectedintheStatementsofFinancialPosition.
All participating shares not previously redeemed will be redeemed by the Company on the last subscription day in 2099 at their respective redemption prices on each subscription day . Subscription day is the day or days upon which all issue, redemptions, purchases and transfers of participating shares shall be effected .
Movementsofparticipatingshares
The following table shows the movement in participating shares during the year ended 30 September 2016 .
Number of shares at
30 September 2015
Issued during
the year
Redeemed during
the year
Number of shares at
30 September 2016 Multi Manager Global Equity (USD) – Class A Shares 6,488,674 482,362 (2,004,123) 4,966,913Multi Manager Global Equity (USD) – Class B Shares* – 130,585 – 130,585Multi Manager Global Equity (GBP) – Class A Shares 4,786,248 462,932 (1,223,475) 4,025,705Multi Manager Global Equity (GBP) – Class B Shares* – 85,640 – 85,640Multi Manager Global Balanced (USD) – Class A Shares 939,797 91,668 (112,753) 918,712Multi Manager Global Balanced (USD) – Class B Shares* – 40,812 – 40,812Multi Manager Global Balanced (GBP) – Class A Shares 722,099 60,254 (100,934) 681,419Multi Manager Global Balanced (GBP) – Class B Shares* – 82,967 – 82,967Multi Manager Absolute Return (USD) – Class A Shares 5,473,733 324,147 (1,829,820) 3,968,060Multi Manager Absolute Return (GBP) – Class A Shares 3,025,524 542,599 (261,793) 3,306,330
* Multi Manager Global Equity (USD) – Class B Shares, Multi Manager Global Equity (GBP) – Class B Shares, Multi Manager Global Balanced (USD) – Class B Shares, and Multi Manager Global Balanced (GBP) – Class B Shares have been launched on 15 February 2016, 15 February 2016, 26 February 2016 and 19 February 2016 respectively .
Standard Bank International Funds Limited
31
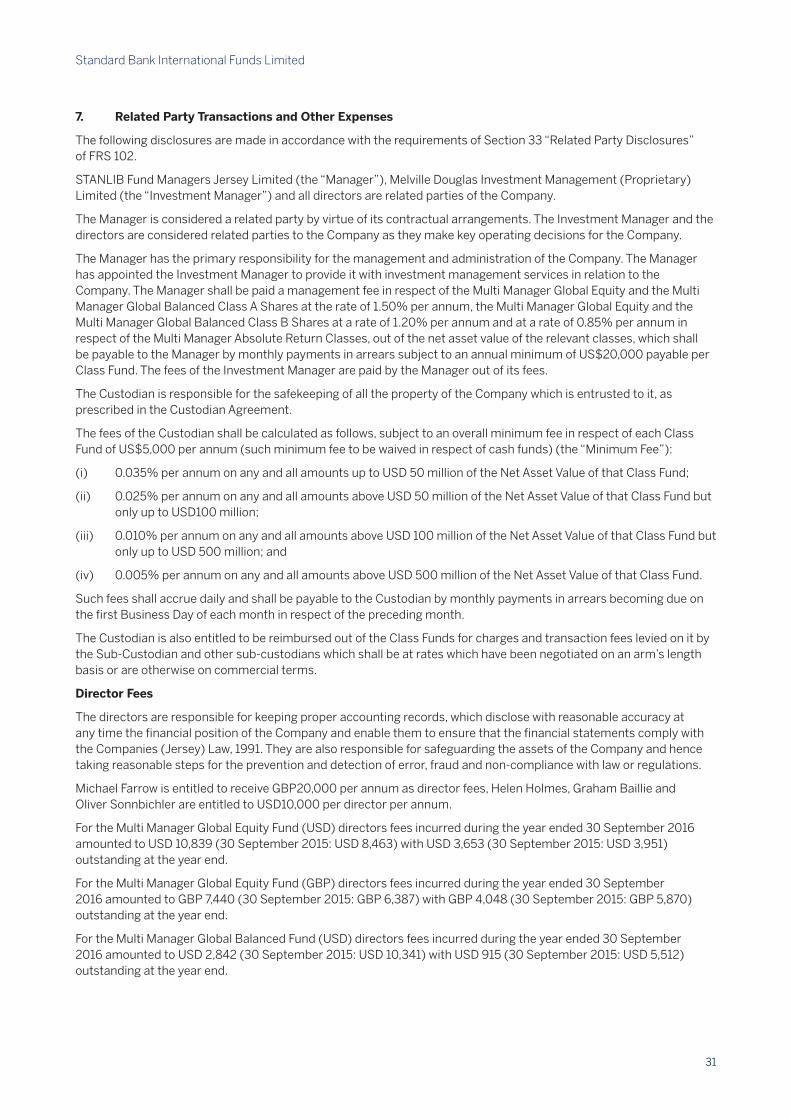
7. Related Party Transactions and Other Expenses
The following disclosures are made in accordance with the requirements of Section 33 “Related Party Disclosures” of FRS 102 .
STANLIB Fund Managers Jersey Limited (the “Manager”), Melville Douglas Investment Management (Proprietary) Limited (the “Investment Manager”) and all directors are related parties of the Company .
The Manager is considered a related party by virtue of its contractual arrangements . The Investment Manager and the directors are considered related parties to the Company as they make key operating decisions for the Company .
The Manager has the primary responsibility for the management and administration of the Company . The Manager has appointed the Investment Manager to provide it with investment management services in relation to the Company . The Manager shall be paid a management fee in respect of the Multi Manager Global Equity and the Multi Manager Global Balanced Class A Shares at the rate of 1 .50% per annum, the Multi Manager Global Equity and the Multi Manager Global Balanced Class B Shares at a rate of 1 .20% per annum and at a rate of 0 .85% per annum in respect of the Multi Manager Absolute Return Classes, out of the net asset value of the relevant classes, which shall be payable to the Manager by monthly payments in arrears subject to an annual minimum of US$20,000 payable per Class Fund . The fees of the Investment Manager are paid by the Manager out of its fees .
The Custodian is responsible for the safekeeping of all the property of the Company which is entrusted to it, as prescribed in the Custodian Agreement .
The fees of the Custodian shall be calculated as follows, subject to an overall minimum fee in respect of each Class Fund of US$5,000 per annum (such minimum fee to be waived in respect of cash funds) (the “Minimum Fee”):
(i) 0 .035% per annum on any and all amounts up to USD 50 million of the Net Asset Value of that Class Fund;
(ii) 0 .025% per annum on any and all amounts above USD 50 million of the Net Asset Value of that Class Fund but only up to USD100 million;
(iii) 0 .010% per annum on any and all amounts above USD 100 million of the Net Asset Value of that Class Fund but only up to USD 500 million; and
(iv) 0 .005% per annum on any and all amounts above USD 500 million of the Net Asset Value of that Class Fund .
Such fees shall accrue daily and shall be payable to the Custodian by monthly payments in arrears becoming due on the first Business Day of each month in respect of the preceding month .
The Custodian is also entitled to be reimbursed out of the Class Funds for charges and transaction fees levied on it by the Sub-Custodian and other sub-custodians which shall be at rates which have been negotiated on an arm’s length basis or are otherwise on commercial terms .
Director Fees
The directors are responsible for keeping proper accounting records, which disclose with reasonable accuracy at any time the financial position of the Company and enable them to ensure that the financial statements comply with the Companies (Jersey) Law, 1991 . They are also responsible for safeguarding the assets of the Company and hence taking reasonable steps for the prevention and detection of error, fraud and non-compliance with law or regulations .
Michael Farrow is entitled to receive GBP20,000 per annum as director fees, Helen Holmes, Graham Baillie and Oliver Sonnbichler are entitled to USD10,000 per director per annum .
For the Multi Manager Global Equity Fund (USD) directors fees incurred during the year ended 30 September 2016 amounted to USD 10,839 (30 September 2015: USD 8,463) with USD 3,653 (30 September 2015: USD 3,951) outstanding at the year end .
For the Multi Manager Global Equity Fund (GBP) directors fees incurred during the year ended 30 September 2016 amounted to GBP 7,440 (30 September 2015: GBP 6,387) with GBP 4,048 (30 September 2015: GBP 5,870) outstanding at the year end .
For the Multi Manager Global Balanced Fund (USD) directors fees incurred during the year ended 30 September 2016 amounted to USD 2,842 (30 September 2015: USD 10,341) with USD 915 (30 September 2015: USD 5,512) outstanding at the year end .

Standard Bank International Funds Limited
32
For the Multi Manager Global Balanced Fund (GBP) directors fees incurred during the year ended 30 September 2016 amounted to GBP 2,159 (30 September 2015: GBP 6,448) with GBP 943 (30 September 2015: GBP 3,644) outstanding at the year end .
For the Multi Manager Absolute Return Fund (USD) directors fees incurred during the year ended 30 September 2016 amounted to USD 9,205 (30 September 2015: USD 9,824) with USD 2,289 (30 September 2015: USD 3,151) outstanding at the year end .
For the Multi Manager Absolute Return Fund (GBP) directors fees incurred during the year ended 30 September 2016 amounted to GBP 6,894 (30 September 2015: GBP 6,170) with GBP 2,003 (30 September 2015: GBP 2,015) outstanding at the year end .
All transactions with related parties are at arms length .
8. Financial risk management
The main risks arising from the Company’s financial instruments are: .
8.1. Market risk
Market risk is the risk that the fair value of, or future cash flows arising from, financial instruments will fluctuate because of the changes in market variables . Market risk comprises three types of risks: market price risk, interest rate risk and currency risk .
Marketpricerisk
Market price risk arises mainly from uncertainty about future prices of equity and equity-linked financial instruments . It represents the potential loss that the Company may suffer due to movements in securities prices . The Company’s exposure to market price arises from its equity investments with a maximum exposure at the period end represented by the carrying value of investments . The exposure levels are in line with the Company’s investment objectives and market price risk is managed through prescribed investment restrictions, which include (generally):
Multi Manager Global Equity and Multi Manager Global Balanced Class Funds
• Not more than 10% of the net asset value of each Class Fund may be invested in collective investment schemes which are not open-ended collective schemes;
• The assets of each Class Fund shall be invested in at least five collective investment schemes, and not more than 20% of the net asset value of each Class Fund may be invested in any one collective investment scheme; and
• Multi Manager Absolute Return Class Funds
• Not more than 5% of the net asset value of each Class Fund shall be invested in any one real property fund;
• Not more than 10% of the net asset value of each Class Fund shall be invested in any single multi-manager hedge fund of funds;
• Not more than 7 .5% of the net asset value of each Class Fund shall be invested in any single manager fund;
• Not more than 22% of the net asset value of each Class Fund shall be invested in any single fund management group; and
• Not more than 15% of the net asset value of each Class Fund shall be invested in structured products .
A complete list of the investment restrictions for each Class can be found in the prospectus . Each Class Fund’s investment portfolio complies with the investment parameters as disclosed in the prospectus . The spread of investments between various geographic sectors is disclosed in the Portfolio Statements at the end of this report .
Standard Bank International Funds Limited
33
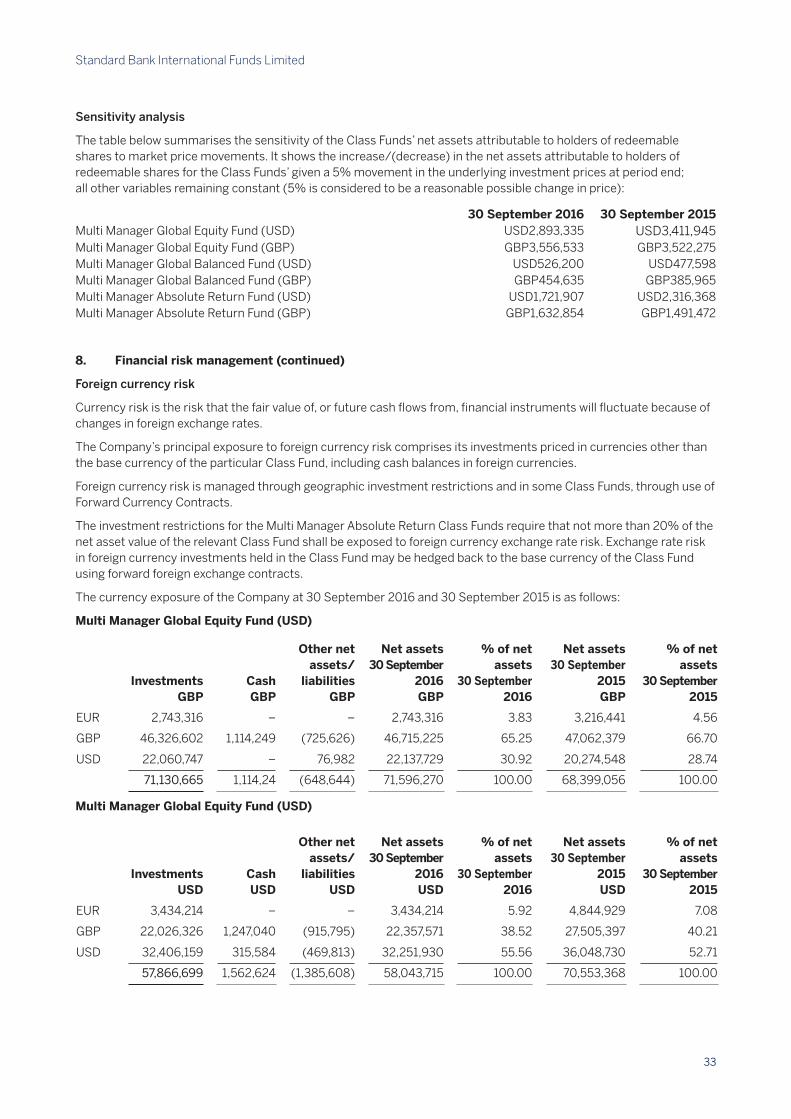
Sensitivityanalysis
The table below summarises the sensitivity of the Class Funds’ net assets attributable to holders of redeemable shares to market price movements . It shows the increase/(decrease) in the net assets attributable to holders of redeemable shares for the Class Funds’ given a 5% movement in the underlying investment prices at period end; all other variables remaining constant (5% is considered to be a reasonable possible change in price):
30 September 2016 30 September 2015Multi Manager Global Equity Fund (USD) USD2,893,335 USD3,411,945 Multi Manager Global Equity Fund (GBP) GBP3,556,533 GBP3,522,275Multi Manager Global Balanced Fund (USD) USD526,200 USD477,598Multi Manager Global Balanced Fund (GBP) GBP454,635 GBP385,965Multi Manager Absolute Return Fund (USD) USD1,721,907 USD2,316,368Multi Manager Absolute Return Fund (GBP) GBP1,632,854 GBP1,491,472
8. Financial risk management (continued)
Foreigncurrencyrisk
Currency risk is the risk that the fair value of, or future cash flows from, financial instruments will fluctuate because of changes in foreign exchange rates .
The Company’s principal exposure to foreign currency risk comprises its investments priced in currencies other than the base currency of the particular Class Fund, including cash balances in foreign currencies .
Foreign currency risk is managed through geographic investment restrictions and in some Class Funds, through use of Forward Currency Contracts .
The investment restrictions for the Multi Manager Absolute Return Class Funds require that not more than 20% of the net asset value of the relevant Class Fund shall be exposed to foreign currency exchange rate risk . Exchange rate risk in foreign currency investments held in the Class Fund may be hedged back to the base currency of the Class Fund using forward foreign exchange contracts .
The currency exposure of the Company at 30 September 2016 and 30 September 2015 is as follows:
Multi Manager Global Equity Fund (USD)
Investments GBP
Cash GBP
Other net assets/
liabilities GBP
Net assets 30 September
2016 GBP
% of net assets
30 September 2016
Net assets 30 September
2015 GBP
% of net assets
30 September 2015
EUR 2,743,316 – – 2,743,316 3 .83 3,216,441 4 .56
GBP 46,326,602 1,114,249 (725,626) 46,715,225 65 .25 47,062,379 66 .70
USD 22,060,747 – 76,982 22,137,729 30 .92 20,274,548 28 .74
71,130,665 1,114,24 (648,644) 71,596,270 100 .00 68,399,056 100 .00
Multi Manager Global Equity Fund (USD)
Investments USD
Cash USD
Other net assets/
liabilities USD
Net assets 30 September
2016 USD
% of net assets
30 September 2016
Net assets 30 September
2015 USD
% of net assets
30 September 2015
EUR 3,434,214 – – 3,434,214 5 .92 4,844,929 7 .08
GBP 22,026,326 1,247,040 (915,795) 22,357,571 38 .52 27,505,397 40 .21
USD 32,406,159 315,584 (469,813) 32,251,930 55 .56 36,048,730 52 .71
57,866,699 1,562,624 (1,385,608) 58,043,715 100 .00 70,553,368 100 .00
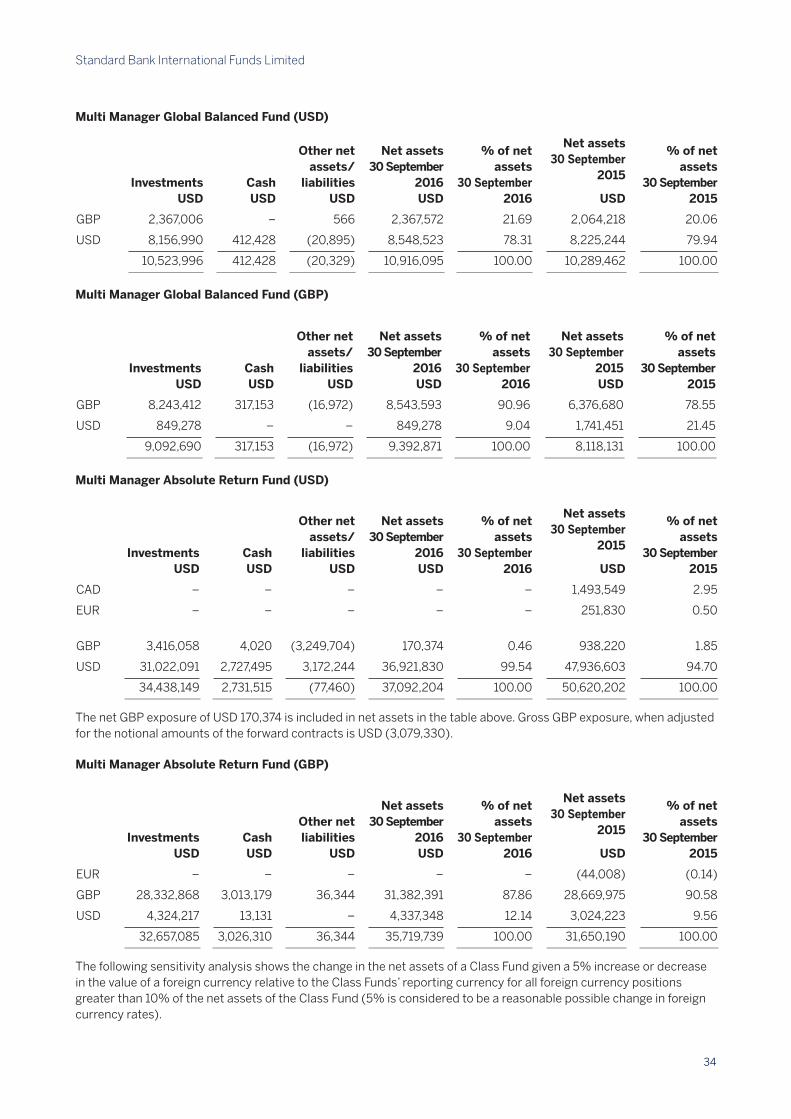
Standard Bank International Funds Limited
34
Multi Manager Global Balanced Fund (USD)
Investments USD
Cash USD
Other net assets/
liabilities USD
Net assets 30 September
2016 USD
% of net assets
30 September 2016
Net assets 30 September
2015
USD
% of net assets
30 September 2015
GBP 2,367,006 – 566 2,367,572 21 .69 2,064,218 20 .06
USD 8,156,990 412,428 (20,895) 8,548,523 78 .31 8,225,244 79 .94
10,523,996 412,428 (20,329) 10,916,095 100 .00 10,289,462 100 .00
Multi Manager Global Balanced Fund (GBP)
Investments USD
Cash USD
Other net assets/
liabilities USD
Net assets 30 September
2016 USD
% of net assets
30 September 2016
Net assets 30 September
2015 USD
% of net assets
30 September 2015
GBP 8,243,412 317,153 (16,972) 8,543,593 90 .96 6,376,680 78 .55
USD 849,278 – – 849,278 9 .04 1,741,451 21 .45
9,092,690 317,153 (16,972) 9,392,871 100 .00 8,118,131 100 .00
Multi Manager Absolute Return Fund (USD)
Investments USD
Cash USD
Other net assets/
liabilities USD
Net assets 30 September
2016 USD
% of net assets
30 September 2016
Net assets 30 September
2015
USD
% of net assets
30 September 2015
CAD – – – – – 1,493,549 2 .95
EUR – – – – – 251,830 0 .50
GBP 3,416,058 4,020 (3,249,704) 170,374 0 .46 938,220 1 .85
USD 31,022,091 2,727,495 3,172,244 36,921,830 99 .54 47,936,603 94 .70
34,438,149 2,731,515 (77,460) 37,092,204 100 .00 50,620,202 100 .00
The net GBP exposure of USD 170,374 is included in net assets in the table above . Gross GBP exposure, when adjusted for the notional amounts of the forward contracts is USD (3,079,330) .
Multi Manager Absolute Return Fund (GBP)
Investments USD
Cash USD
Other net liabilities
USD
Net assets 30 September
2016 USD
% of net assets
30 September 2016
Net assets 30 September
2015
USD
% of net assets
30 September 2015
EUR – – – – – (44,008) (0 .14)
GBP 28,332,868 3,013,179 36,344 31,382,391 87 .86 28,669,975 90 .58
USD 4,324,217 13,131 – 4,337,348 12 .14 3,024,223 9 .56
32,657,085 3,026,310 36,344 35,719,739 100 .00 31,650,190 100 .00
The following sensitivity analysis shows the change in the net assets of a Class Fund given a 5% increase or decrease in the value of a foreign currency relative to the Class Funds’ reporting currency for all foreign currency positions greater than 10% of the net assets of the Class Fund (5% is considered to be a reasonable possible change in foreign currency rates) .
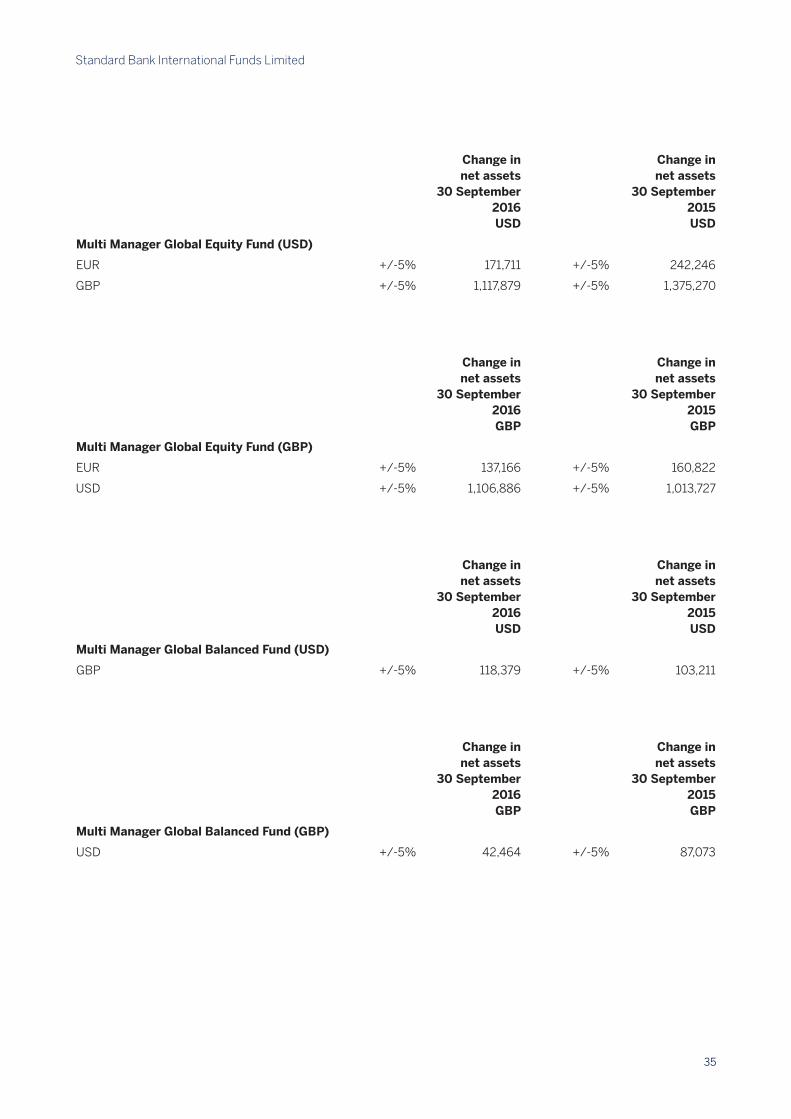
Standard Bank International Funds Limited
35
Change in net assets
30 September 2016 USD
Change in net assets
30 September2015USD
Multi Manager Global Equity Fund (USD)
EUR +/-5% 171,711 +/-5% 242,246
GBP +/-5% 1,117,879 +/-5% 1,375,270
Change in net assets
30 September2016GBP
Change in net assets
30 September2015GBP
Multi Manager Global Equity Fund (GBP)
EUR +/-5% 137,166 +/-5% 160,822
USD +/-5% 1,106,886 +/-5% 1,013,727
Change in net assets
30 September2016USD
Change in net assets
30 September2015USD
Multi Manager Global Balanced Fund (USD)
GBP +/-5% 118,379 +/-5% 103,211
Change in net assets
30 September2016GBP
Change in net assets
30 September2015GBP
Multi Manager Global Balanced Fund (GBP)
USD +/-5% 42,464 +/-5% 87,073
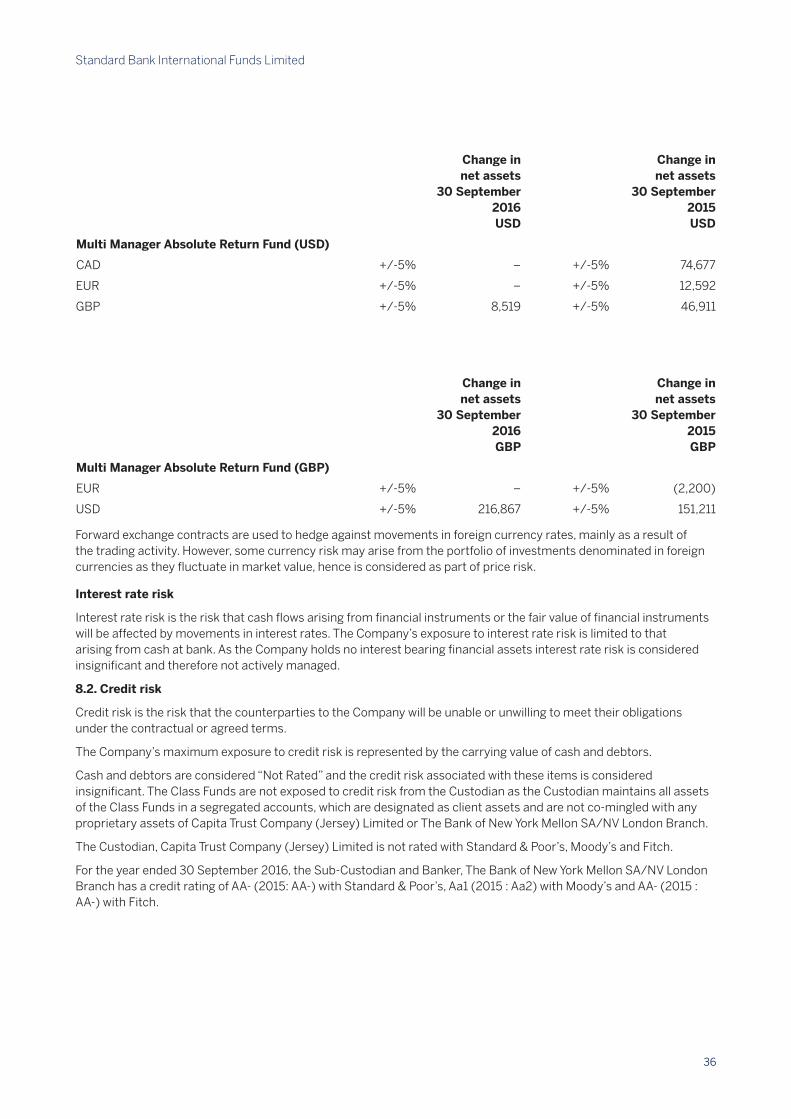
Standard Bank International Funds Limited
36
Change innet assets
30 September2016USD
Change innet assets
30 September2015USD
Multi Manager Absolute Return Fund (USD)
CAD +/-5% – +/-5% 74,677
EUR +/-5% – +/-5% 12,592
GBP +/-5% 8,519 +/-5% 46,911
Change innet assets
30 September2016GBP
Change innet assets
30 September2015GBP
Multi Manager Absolute Return Fund (GBP)
EUR +/-5% – +/-5% (2,200)
USD +/-5% 216,867 +/-5% 151,211
Forward exchange contracts are used to hedge against movements in foreign currency rates, mainly as a result of the trading activity . However, some currency risk may arise from the portfolio of investments denominated in foreign currencies as they fluctuate in market value, hence is considered as part of price risk .
Interest rate risk
Interest rate risk is the risk that cash flows arising from financial instruments or the fair value of financial instruments will be affected by movements in interest rates . The Company’s exposure to interest rate risk is limited to that arising from cash at bank . As the Company holds no interest bearing financial assets interest rate risk is considered insignificant and therefore not actively managed .
8.2. Credit risk
Credit risk is the risk that the counterparties to the Company will be unable or unwilling to meet their obligations under the contractual or agreed terms .
The Company’s maximum exposure to credit risk is represented by the carrying value of cash and debtors .
Cash and debtors are considered “Not Rated” and the credit risk associated with these items is considered insignificant . The Class Funds are not exposed to credit risk from the Custodian as the Custodian maintains all assets of the Class Funds in a segregated accounts, which are designated as client assets and are not co-mingled with any proprietary assets of Capita Trust Company (Jersey) Limited or The Bank of New York Mellon SA/NV London Branch .
The Custodian, Capita Trust Company (Jersey) Limited is not rated with Standard & Poor’s, Moody’s and Fitch .
For the year ended 30 September 2016, the Sub-Custodian and Banker, The Bank of New York Mellon SA/NV London Branch has a credit rating of AA- (2015: AA-) with Standard & Poor’s, Aa1 (2015 : Aa2) with Moody’s and AA- (2015 : AA-) with Fitch .

Standard Bank International Funds Limited
37
8. Financial risk management (continued)
8.3. Fair value hierarchy
The Financial Reporting Council (“FRC”) has issued “Amendments to FRS 102 - Fair value hierarchy disclosures”, effective for accounting periods beginning on or after 1 January 2017, with early adoption permitted . FRED 62 proposes to amend paragraphs 34 .22 and 34 .42 of FRS 102 to require disclosure of financial instruments held at fair value on the basis of a fair value hierarchy consistent with EU-adopted IFRS based on Level 1, 2 and 3 classification . The Company has availed of early adoption and the financial statements have been prepared in accordance with these amendments and fair value measurement is categorised based on Level 1, 2 and 3 . These amendments did not have any impact on the Funds’ financial position or performance .
The fair value of financial assets and liabilities traded in active markets (such as publicly traded derivatives and trading securities) are based on quoted mid-market prices on the year end date .
An active market is a market in which transactions for the asset or liability take place with sufficient frequency and volume to provide pricing information on an ongoing basis .
A financial instrument is regarded as quoted in an active market if quoted prices are readily and regularly available from an exchange, dealer, broker, industry group, pricing service, or regulatory agency, and those prices represent actual and regularly occurring market transactions on an arm’s length basis .
FRS 102 requires the Company to classify fair value measurements using a fair value hierarchy that reflects the significance of the inputs used in making the measurements .
The carrying value less impairment provision of other receivables and payables are assumed to approximate their fair values . The fair value of financial liabilities for disclosure purposes is estimated by discounting the future contractual cash flows at the current market interest rate that is available to the Company for similar financial instruments .
The fair value hierarchy has the following levels:
• Listed prices (unadjusted) in active markets for identical assets or liabilities (Level 1) .
• Inputs other than quoted prices included within Level 1 that are observable for the asset or liability, either directly (that is, as prices) or indirectly (that is, derived from prices) (Level 2) .
• Inputs for the asset or liability that are not based on observable market data (that is, unobservable inputs) (Level 3) .
The level in the fair value hierarchy within which the fair value measurement is categorised in its entirety is determined on the basis of the lowest level input that is significant to the fair value measurement in its entirety . For this purpose, the significance of an input is assessed against the fair value measurement in its entirety . If a fair value measurement uses observable inputs that require significant adjustment based on unobservable inputs, that measurement is a Level 3 measurement . Assessing the significance of a particular input to the fair value measurement in its entirety requires judgement, considering factors specific to the asset or liability .
The determination of what constitutes ‘observable’ requires significant judgement by the Company . The Company considers observable data to be that market data that is readily available, regularly distributed or updated, reliable and verifiable, not proprietary and provided by independent sources that are actively involved in the relevant market .
The following tables analyse within the fair value hierarchy the Company’s financial assets measured at fair value at 30 September 2016 and 30 September 2015 in accordance with FRS 102 . The comparative figures have been reclassified to conform to current year presentation .

Standard Bank International Funds Limited
38
30 September 2016Multi Manager Global Equity Fund (USD)
Level 1 USD
Level 2 USD
Level 3 USD
Total USD
Investment Companies 57,866,699 – – 57,866,699Total Assets 57,866,699 – – 57,866,699
30 September 2015Multi Manager Global Equity Fund (USD)
Level 1 USD
Level 2 USD
Level 3 USD
Total USD
Investment Companies 68,238,903 – – 68,238,903
Total Assets 68,238,903 – – 68,238,903
8. Financial risk management (continued)
8.3. Fair value hierarchy
30 September 2016Multi Manager Global Equity Fund (GBP)
Level 1 GBP
Level 2 GBP
Level 2 GBP
Total GBP
Investment Companies 71,130,665 – – 71,130,665Total Assets 71,130,665 – – 71,130,665
30 September 2015Multi Manager Global Equity Fund (GBP)
Level 1 GBP
Level 2 GBP
Level 3 GBP
Total GBP
Investment Companies 70,445,508 – – 70,445,508
Total Assets 70,445,508 – – 70,445,508
30 September 2016Multi Manager Global Balanced Fund (USD)
Level 1 USD
Level 2 USD
Level 3 USD
Total USD
Investment Companies 10,523,996 – – 10,523,996Total Assets 10,523,996 – – 10,523,996
30 September 2015Multi Manager Global Balanced Fund (USD)
Level 1 USD
Level 2 USD
Level 3 USD
Total USD
Investment Companies 9,551,962 – – 9,551,962
Total Assets 9,551,962 – – 9,551,962
30 September 2016Multi Manager Global Balanced Fund (GBP)
Level 1 GBP
Level 2 GBP
Level 3 GBP
Total GBP
Investment Companies 9,092,690 – – 9,092,690Total Assets 9,092,690 – – 9,092,690
30 September 2015Multi Manager Global Balanced Fund (GBP)
Level 1 GBP
Level 2 GBP
Level 3 GBP
Total GBP
Investment Companies 7,719,293 – – 7,719,293
Total Assets 7,719,2933 – – 7,719,293

Standard Bank International Funds Limited
39
30 September 2016Multi Manager Global Equity Fund (USD)
Level 1 USD
Level 2 USD
Level 3 USD
Total USD
Investment Companies 32,749,907 1,688,242 – 34,438,149Total Assets 32,749,907 1,688,242 – 34,438,149
Investment Companies – (13,954) – (13,954)Total Assets – (13,954) – (13,954)
8. Financial risk management (continued)
8.3. Fair value hierarchy
30 September 2015Multi Manager Absolute Return Fund (USD)
Level 1 USD
Level 2 USD
Level 3 USD
Total USD
Investment Companies 46,327,356 – – 46,327,356
Forward Currency Contracts – 330,450 – 330,450
Total Assets 46,327,356 330,450 – 46,657,806
Forward Currency Contracts – (40,259) – (40,259)
Total Liabilities – (40,259) – (40,259)
30 September 2016Multi Manager Absolute Return Fund (GBP)
Level 1 GBP
Level 2 GBP
Level 3 GBP
Total GBP
Investment Companies 31,365,198 1,291,887 – 32,657,085Total Assets 31,365,198 1,291,887 – 32,657,085
30 September 2015Multi Manager Absolute Return Fund (GBP)
Level 1 GBP
Level 2 GBP
Level 3 GBP
Total GBP
Investment Companies 29,829,443 – – 29,829,443
Total Assets 29,829,443 – – 29,829,443
Forward Currency Contracts – (154,587) – (154,587)Total Liabilities – (154,587) – (154,587)
8.4. Liquidity risk
Liquidity risk is the risk that the Company may encounter difficulty in meeting obligations associated with financial liabilities that are settled by delivering cash or another financial asset . It relates to the mismatch between the maturity profile of financial assets and financial liabilities .
Shareholders have the right to redeem their shares in the Company in accordance with the procedures detailed in its prospectus . In order to meet its obligations the Company may be required to sell investments held in a particular Class Fund .
The risk is that the Company might not be able to fully repay amounts demanded by its Shareholders . The policy of the Company is to ensure that the investments of the Company are liquid and readily tradable .
The prospectus also allows the Manager to limit redemptions in any Class Fund to one eighth of the participating shares in issue .
There is no material mismatch between the notice period required to be given by the Company to liquidate its investments and the dealing period in the Company’s Class Funds .

Standard Bank International Funds Limited
40
8.5. Derivative financial instruments
The Company trades in derivative financial instruments in order to reduce the risks arising from the fluctuations in exchange rates . The Company’s open positions are shown in the portfolio statement and gains and losses arising from derivatives dealing are disclosed in note 3 . No detailed disclosures are considered necessary due to the insignificance of the derivatives .
The Class Funds listed below had open forward exchange contract positions at 30 September 2016 as follows:
Multi Manager Absolute Return Fund (USD)
Maturity datePurchase Currency Amount
Sell Currency Amount
Unrealisedgain/(loss)
% of netassets
Unrealised loss on forward currency contracts31/10/2016 GBP (2,500,000) USD 3,235,750 (13,954) (0 .04)
Total unrealised loss on forward currency contracts (13,954) (0.04)
The Class Funds listed below had open forward exchange contract positions at 30 September 2015 as follows:
Multi Manager Absolute Return Fund (USD)
Maturity datePurchase Currency Amount
Sell Currency Amount
Unrealisedgain/(loss)
% of netassets
Unrealised loss on forward currency contracts30/12/2015 GBP (9,000,000) USD 13,959,000 330,450 0 .65
Total unrealised gain on forward currency contracts 330,450 0.65
Unrealised loss on forward currency contracts12/11/2015 EUR (2,970,000) USD 3,277,247 (40,259) (0 .08)
Total unrealised gain on forward currency contracts (40,259) (0.08)
Multi Manager Absolute Return Fund (GBP)
Maturity datePurchase Currency Amount
Sell Currency Amount
Unrealisedgain/(loss)
% of netassets
Unrealised loss on forward currency contracts22/10/2015 EUR (3,250,000) GBP 2,280,850 (115,207) (0 .36)27/11/2015 USD (1,500,000) GBP 951,173 (39,380) (0 .13)
Total unrealised gain on forward currency contracts (154,587) (0.49)
The Class Funds use forward exchange contracts to hedge any movements in foreign currency rates, mainly as a result of their trading activities . The Class Funds do not enter into significant cash flow hedges .
Gains and losses on forward exchange contracts are separately reported in the Statements of Comprehensive Income .
Given the limited use of derivatives no sensitivity analysis has been provided .
The open forwards are held with Bank of New York Mellon .

Standard Bank International Funds Limited
41
9. Reconciliation of net asset value
The following tables reconcile the difference between the Class Funds’ net assets for financial reporting purposes and its net assets for shareholder dealing purposes for the year ended 30 September 2016 and year ended 30 September 2015 .
Multi Manager Global Equity Fund (USD)
Multi Manager Global Equity Fund (USD)
Multi Manager Global Equity Fund (USD)
30 September 2016 USD
30 September 2015 USD
30 September
2016 GBP
30 September
2015 GBP
30 September
2016 USD
30 September 2015 USD
Net asset value per financial statements 58,043,715 68,399,056 71,596,270 70,553,368 10,916,095 10,289,462Pricing differences1 – 10,947 – 38,772 – 107Net asset value for shareholder dealing 58,043,715 68,410,003 71,596,270 70,592,140 10,916,095 10,289,569
Net asset value per share for reporting purposesClass A Shares* 11 .38 10 .54 17 .52 14 .74 11 .41 10 .95Class B Shares** 11 .68 – 12 .49 – 10 .68 –
Net asset value per share for reporting purposes
Class A Shares* 11 .38 10 .54 17 .52 14 .75 11 .41 10 .95
Class B Shares** 11 .68 – 12 .49 – 10 .68 –
* Multi Manager Global Equity (USD) – Class B Shares, Multi Manager Global Equity (GBP) – Class B Shares and Multi Manager Global Balanced (USD) – Class B Shares share classes have been launched on 15 February 2016, 15 February 2016 and 26 February 2016 respectively .
Multi Manager Global Balanced Fund (GBP)
Multi Manager Absolute Return Fund (USD)
Multi Manager Absolute Return Fund (GBP)
30 September 2016 GBP
30 September 2015 GBP
30 September
2015 USD
30 September
2015 USD
30 September
2015 GBP
30 September 2015 GBP
Net asset value per financial statements 9,392,871 8,118,131 37,092,204 50,620,202 35,719,739 31,650,190Pricing differences1 – 2,436 – 96,846 – 76,234Net asset value for shareholder dealing 9,392,871 8,120,567 37,092,204 50,717,048 35,719,739 31,726,424
Net asset value per share for reporting purposesClass A Shares 12 .43 11 .24 9 .35 9 .25 10 .80 10 .46Class B Shares* 11 .13 – – – – –
Net asset value per share for reporting purposes
Class A Shares 12 .43 11 .25 9 .35 9 .27 10 .80 10 .49
Class B Shares* 11 .13 – – – – –
* Multi Manager Global Balanced (GBP) – Class B Shares share class has been launched on 19 February 2016 .
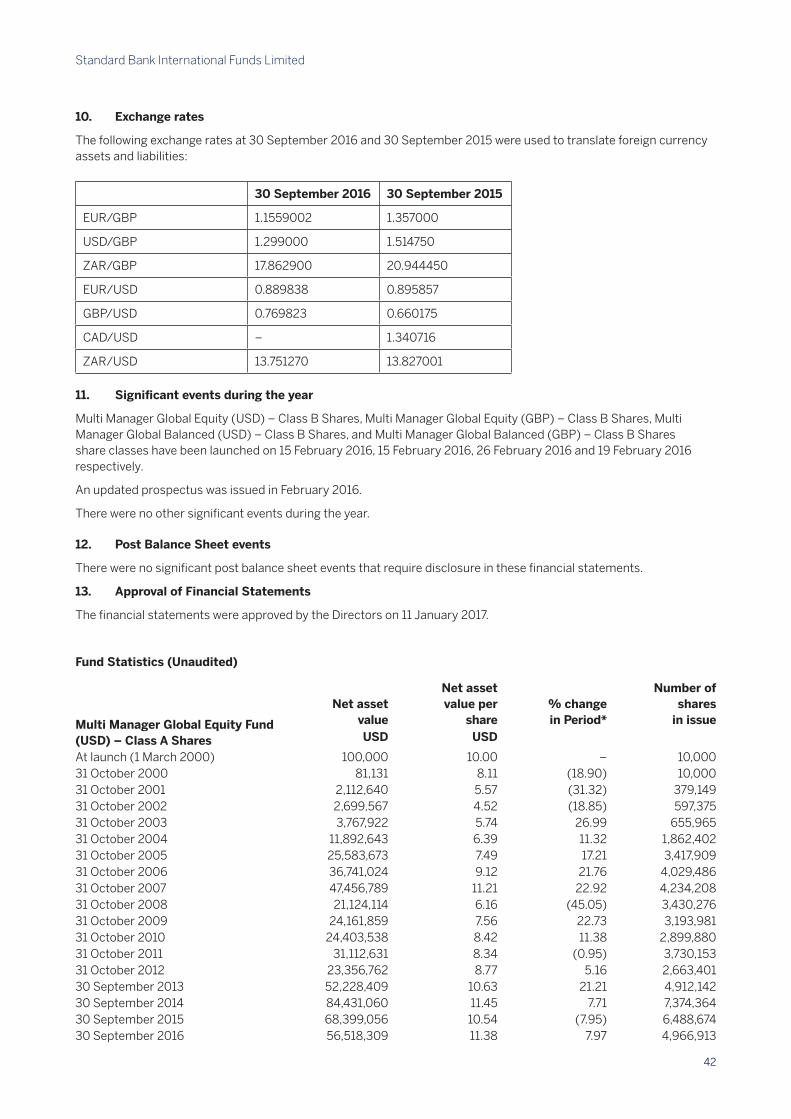
Standard Bank International Funds Limited
42
10. Exchange rates
The following exchange rates at 30 September 2016 and 30 September 2015 were used to translate foreign currency assets and liabilities:
30 September 2016 30 September 2015
EUR/GBP 1 .1559002 1 .357000
USD/GBP 1 .299000 1 .514750
ZAR/GBP 17 .862900 20 .944450
EUR/USD 0 .889838 0 .895857
GBP/USD 0 .769823 0 .660175
CAD/USD – 1 .340716
ZAR/USD 13 .751270 13 .827001
11. Significant events during the year
Multi Manager Global Equity (USD) – Class B Shares, Multi Manager Global Equity (GBP) – Class B Shares, Multi Manager Global Balanced (USD) – Class B Shares, and Multi Manager Global Balanced (GBP) – Class B Shares share classes have been launched on 15 February 2016, 15 February 2016, 26 February 2016 and 19 February 2016 respectively .
An updated prospectus was issued in February 2016 .
There were no other significant events during the year .
12. Post Balance Sheet events
There were no significant post balance sheet events that require disclosure in these financial statements .
13. Approval of Financial Statements
The financial statements were approved by the Directors on 11 January 2017 .
Fund Statistics (Unaudited)
Multi Manager Global Equity Fund (USD) – Class A Shares
Net asset value
Net asset value per
share% change in Period*
Number of shares
in issueUSD USD
At launch (1 March 2000) 100,000 10 .00 – 10,00031 October 2000 81,131 8 .11 (18 .90) 10,00031 October 2001 2,112,640 5 .57 (31 .32) 379,14931 October 2002 2,699,567 4 .52 (18 .85) 597,37531 October 2003 3,767,922 5 .74 26 .99 655,96531 October 2004 11,892,643 6 .39 11 .32 1,862,40231 October 2005 25,583,673 7 .49 17 .21 3,417,90931 October 2006 36,741,024 9 .12 21 .76 4,029,48631 October 2007 47,456,789 11 .21 22 .92 4,234,20831 October 2008 21,124,114 6 .16 (45 .05) 3,430,27631 October 2009 24,161,859 7 .56 22 .73 3,193,98131 October 2010 24,403,538 8 .42 11 .38 2,899,88031 October 2011 31,112,631 8 .34 (0 .95) 3,730,15331 October 2012 23,356,762 8 .77 5 .16 2,663,40130 September 2013 52,228,409 10 .63 21 .21 4,912,14230 September 2014 84,431,060 11 .45 7 .71 7,374,36430 September 2015 68,399,056 10 .54 (7 .95) 6,488,67430 September 2016 56,518,309 11 .38 7 .97 4,966,913
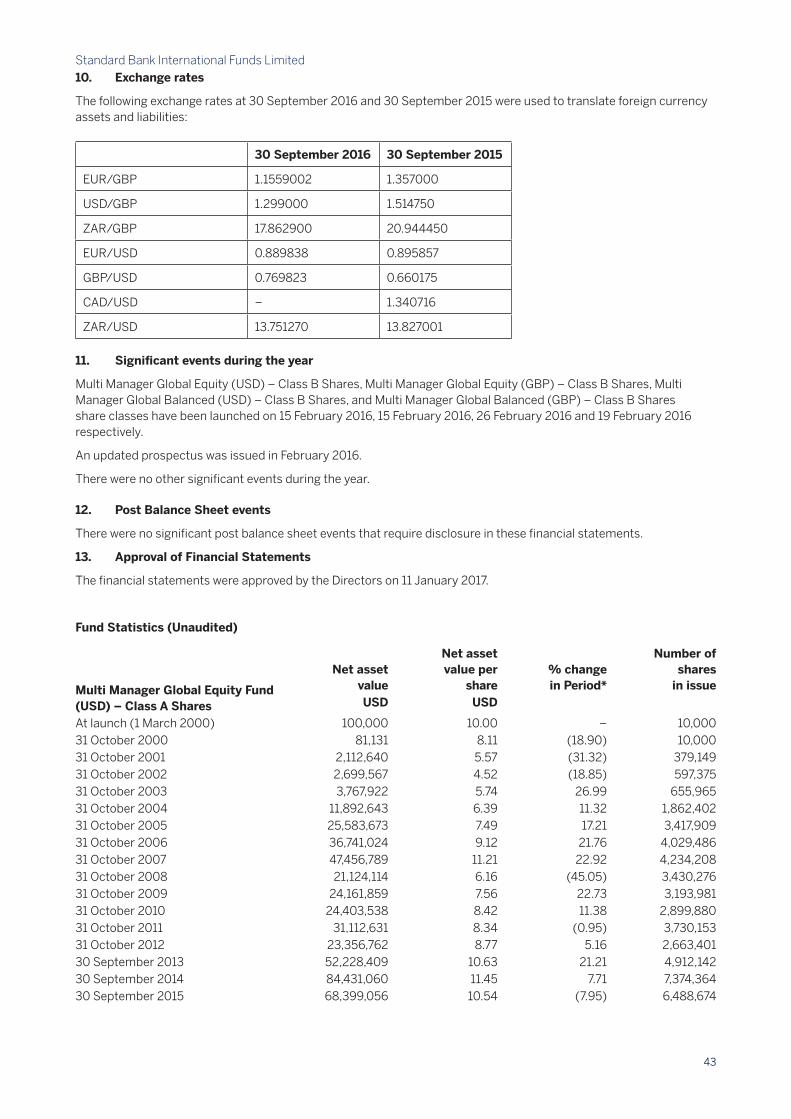
Standard Bank International Funds Limited
43
10. Exchange rates
The following exchange rates at 30 September 2016 and 30 September 2015 were used to translate foreign currency assets and liabilities:
30 September 2016 30 September 2015
EUR/GBP 1 .1559002 1 .357000
USD/GBP 1 .299000 1 .514750
ZAR/GBP 17 .862900 20 .944450
EUR/USD 0 .889838 0 .895857
GBP/USD 0 .769823 0 .660175
CAD/USD – 1 .340716
ZAR/USD 13 .751270 13 .827001
11. Significant events during the year
Multi Manager Global Equity (USD) – Class B Shares, Multi Manager Global Equity (GBP) – Class B Shares, Multi Manager Global Balanced (USD) – Class B Shares, and Multi Manager Global Balanced (GBP) – Class B Shares share classes have been launched on 15 February 2016, 15 February 2016, 26 February 2016 and 19 February 2016 respectively .
An updated prospectus was issued in February 2016 .
There were no other significant events during the year .
12. Post Balance Sheet events
There were no significant post balance sheet events that require disclosure in these financial statements .
13. Approval of Financial Statements
The financial statements were approved by the Directors on 11 January 2017 .
Fund Statistics (Unaudited)
Multi Manager Global Equity Fund (USD) – Class A Shares
Net asset value
Net asset value per
share% change in Period*
Number of shares
in issueUSD USD
At launch (1 March 2000) 100,000 10 .00 – 10,00031 October 2000 81,131 8 .11 (18 .90) 10,00031 October 2001 2,112,640 5 .57 (31 .32) 379,14931 October 2002 2,699,567 4 .52 (18 .85) 597,37531 October 2003 3,767,922 5 .74 26 .99 655,96531 October 2004 11,892,643 6 .39 11 .32 1,862,40231 October 2005 25,583,673 7 .49 17 .21 3,417,90931 October 2006 36,741,024 9 .12 21 .76 4,029,48631 October 2007 47,456,789 11 .21 22 .92 4,234,20831 October 2008 21,124,114 6 .16 (45 .05) 3,430,27631 October 2009 24,161,859 7 .56 22 .73 3,193,98131 October 2010 24,403,538 8 .42 11 .38 2,899,88031 October 2011 31,112,631 8 .34 (0 .95) 3,730,15331 October 2012 23,356,762 8 .77 5 .16 2,663,40130 September 2013 52,228,409 10 .63 21 .21 4,912,14230 September 2014 84,431,060 11 .45 7 .71 7,374,36430 September 2015 68,399,056 10 .54 (7 .95) 6,488,674

Standard Bank International Funds Limited
44
13. Approval of Financial Statements (continued)
Fund Statistics (Unaudited)
Net asset value
Net asset value per
share% change in
Period*
Number of shares in
issueUSD USD
Multi Manager Global Equity Fund (USD) – Class B SharesAt launch (15 February 2016) 5,750 10 .00 – 57530 September 2016 1,525,406 11 .68 16 .80 130,585
Net asset value
Net asset value per
share% change in Period*
Number of shares
in issueGBP GBP
Multi Manager Global Equity Fund (GBP) – Class A SharesAt launch (1 March 2000) 100,000 10 .00 – 10,00031 October 2000 88,198 8 .82 (11 .80) 10,00031 October 2001 1,613,954 6 .39 (27 .55) 252,64031 October 2002 1,570,929 5 .16 (19 .25) 304,64231 October 2003 4,885,436 6 .33 22 .67 772,01231 October 2004 14,010,880 6 .82 7 .74 2,055,23831 October 2005 36,616,712 8 .20 20 .23 4,465,41431 October 2006 59,702,648 9 .64 17 .56 6,190,59431 October 2007 73,402,794 10 .96 13 .69 6,697,35731 October 2008 38,954,839 7 .16 (34 .67) 5,439,28131 October 2009 42,396,390 8 .91 24 .44 4,757,70231 October 2010 46,089,490 10 .13 13 .69 4,551,88031 October 2011 53,094,916 10 .22 0 .89 5,193,66531 October 2012 43,056,018 11 .15 9 .10 3,862,12330 September 2013 71,936,305 13 .63 22 .24 5,277,35130 September 2014 77,550,464 14 .53 6 .60 5,337,20330 September 2015 70,553,368 14 .74 1 .45 4,786,24830 September 2016 70,526,367 17 .52 18 .86 4,025,705
* Performance figures are based on the net asset value for financial reporting . This differs from the performance figures disclosed in the Investment Manager’s Report, which are based on the net asset value for shareholders dealing .
The performance data in this table covers the period from incorporation by way of a continuance in Jersey to date . Performance data for periods can be found in the fact sheets issued by the Investment Manager .
Net asset value
Net asset value per
share% change in Period*
Number of shares
in issueGBP GBP
Multi Manager Global Equity Fund (GBP) – Class B SharesAt launch (15 February 2016) 5,490 10 .00 – 54930 September 2016 1,069,903 12 .49 24 .90 85,640

Standard Bank International Funds Limited
45
13. Approval of Financial Statements (continued)
Fund Statistics (Unaudited)
Net asset value
Net asset value per
share% change in Period*
Number of shares
in issueUSD USD
Multi Manager Global Balanced Fund (USD) – Class A SharesAt launch (15 August 2012) 2,169,989 10 .00 – 216,99931 October 2012 2,446,661 10 .10 1 .00 242,25230 September 2013 7,388,911 11 .13 10 .20 663,98830 September 2014 10,490,156 11 .78 5 .84 890,57130 September 2015 10,289,462 10 .95 (7 .05) 939,79730 September 2016 10,480,379 11 .41 4 .20 918,712
Net asset value
Net asset value
per share% change in Period*
Number of shares
in issueUSD USD
Multi Manager Global Balanced Fund (USD) – Class B SharesAt launch (29 February 2016) 189,570 10 .00 – 18,95730 September 2016 435,716 10 .68 6 .80 40,812
Net asset value
Net asset value
per share% change in Period*
Number of shares
in issueGBP GBP
Multi Manager Global Balanced Fund (GBP) – Class A SharesAt launch (15 August 2012) 1,512,743 10 .00 – 151,27531 October 2012 1,623,004 9 .99 (0 .10) 162,48930 September 2013 7,285,926 10 .80 8 .11 674,41830 September 2014 7,982,986 11 .25 4 .17 709,74330 September 2015 8,118,131 11 .24 (0 .09) 722,09930 September 2016 8,469,853 12 .43 10 .59 681,419
Net asset value
Net asset value
per share% change in Period*
Number of shares
in issueGBP GBP
Multi Manager Global Balanced Fund (GBP) – Class B SharesAt launch (19 February 2016) 23,980 10 .00 – 2,39830 September 2016 923,018 11 .13 11 .30 82,967
* Performance figures are based on the net asset value for financial reporting . This differs from the performance figures disclosed in the Investment Manager’s Report, which are based on the net asset value for shareholders dealing .
The performance data in this table covers the period from incorporation by way of a continuance in Jersey to date . Performance data for periods can be found in the fact sheets issued by the Investment Manager .

Standard Bank International Funds Limited
46
13. Approval of Financial Statements (continued)
Fund Statistics (Unaudited)
Net asset value
Net asset value
per share% change in Period*
Number of shares
in issueUSD USD
Multi Manager Absolute Return Fund (USD) – Class A SharesAt launch (25 June 2007) 26,185,910 10 .00 – 2,618,59131 October 2007 27,229,003 10 .08 0 .80 2,701,49431 October 2008 29,123,689 8 .07 (19 .94) 3,609,62431 October 2009 27,497,896 8 .81 9 .17 3,119,96331 October 2010 17,127,635 9 .37 6 .36 1,828,12731 October 2011 14,802,713 9 .08 (3 .10) 1,630,54931 October 2012 17,156,334 9 .27 2 .09 1,850,31330 September 2013 25,620,072 9 .28 0 .11 2,760,57430 September 2014 41,200,576 9 .46 1 .94 4,354,15430 September 2015 50,620,202 9 .25 (2 .22) 5,473,73330 September 2016 37,092,204 9 .35 1 .08 3,968,060
Net asset value
Net asset value
per share% change in Period*
Number of shares
in issueGBP GBP
Multi Manager Absolute Return Fund (GBP) – Class A SharesAt launch (25 June 2007) 27,944,390 10 .00 – 2,794,43931 October 2007 29,209,997 10 .17 1 .70 2,872,90131 October 2008 37,019,047 8 .60 (15 .44) 4,305,93831 October 2009 36,019,399 9 .40 9 .30 3,832,68331 October 2010 32,820,796 10 .06 7 .02 3,261,33631 October 2011 31,053,497 9 .82 (2 .39) 3,160,81931 October 2012 28,721,873 10 .07 2 .55 2,853,60630 September 2013 26,092,396 10 .24 1 .69 2,549,14730 September 2014 27,310,017 10 .46 2 .15 2,611,90130 September 2015 31,650,190 10 .46 – 3,025,52430 September 2016 35,719,739 10 .80 3 .25 3,306,330
* Performance figures are based on the net asset value for financial reporting . This differs from the performance figures disclosed in the Investment Manager’s Report, which are based on the net asset value for shareholders dealing .
The performance data in this table covers the period from incorporation by way of a continuance in Jersey to date . Performance data for periods can be found in the fact sheets issued by the Investment Manager .

Standard Bank International Funds Limited
47
TotalExpenseRatio(Unaudited)
The Total Expense Ratio (“TER”) is calculated and disclosed as per the guidelines issued by the Investment Management Association . The ratio expresses the sum of all costs charged on an ongoing basis to the Class Fund taken retrospectively as a percentage of the Class Fund’s average net assets . For clarity, when the Class Fund is investing in other funds, the ongoing cost of these funds is not incorporated in the calculation of the TER .
30 September 2016 30 September 2015Multi Manager Global Equity (USD) – Class AShares 1 .61% 1 .62% Multi Manager Global Equity (USD) – Class B Shares* 1 .32% –Multi Manager Global Equity (GBP) – Class AShares 1 .58% 1 .59%Multi Manager Global Equity (GBP) – Class B Shares* 1 .30% –Multi Manager Global Balanced (USD) – Class AShares 1 .69% 1 .81%Multi Manager Global Balanced (USD) – Class B Shares* 1 .35% –Multi Manager Global Balanced (GBP) – Class AShares 1 .66% 1 .75%Multi Manager Global Balanced (GBP) – Class B Shares* 1 .34% –Multi Manager Absolute Return (USD) – Class A Shares 0 .96% 0 .97%Multi Manager Absolute Return (GBP) – Class A Shares 0 .96% 0 .99%
* Multi Manager Global Equity (USD) – Class B Shares, Multi Manager Global Equity (GBP) – Class B Shares, Multi Manager Global Balanced (USD) – Class B Shares, and Multi Manager Global Balanced (GBP) – Class B Shares share classes have been launched on 15 February 2016, 15 February 2016, 26 February 2016 and 19 February 2016 respectively .
The figures disclosed have been annualised .
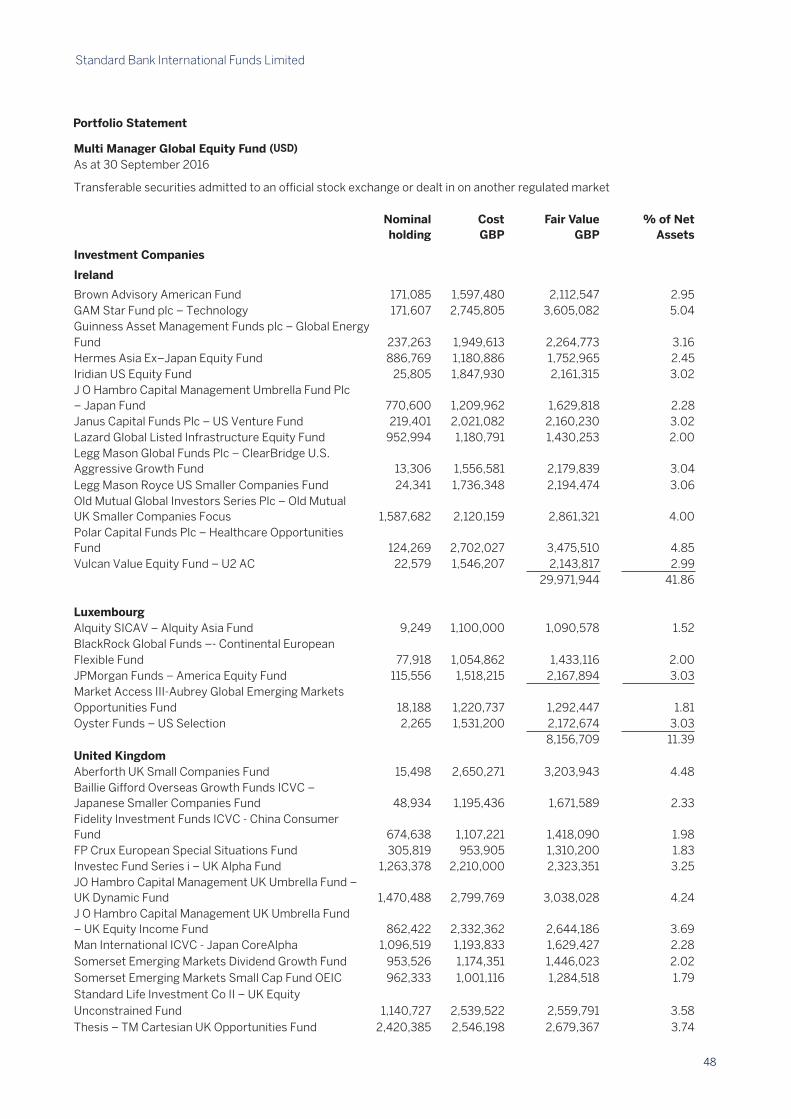
Standard Bank International Funds Limited
48
Standard Bank International Funds Limited
42
Portfolio Statement (continued)
Multi Manager Global Equity Fund (GBP)As at 30 September 2016
Transferable securities admitted to an official stock exchange or dealt in on another regulated market
Nominal holding
Cost GBP
Fair Value GBP
% of Net Assets
Investment Companies
Ireland
Brown Advisory American Fund 171,085 1,597,480 2,112,547 2 .95GAM Star Fund plc – Technology 171,607 2,745,805 3,605,082 5 .04Guinness Asset Management Funds plc – Global EnergyFund 237,263 1,949,613 2,264,773 3 .16Hermes Asia Ex–Japan Equity Fund 886,769 1,180,886 1,752,965 2 .45Iridian US Equity Fund 25,805 1,847,930 2,161,315 3 .02J O Hambro Capital Management Umbrella Fund Plc – Japan Fund 770,600 1,209,962 1,629,818 2 .28Janus Capital Funds Plc – US Venture Fund 219,401 2,021,082 2,160,230 3 .02Lazard Global Listed Infrastructure Equity Fund 952,994 1,180,791 1,430,253 2 .00Legg Mason Global Funds Plc – ClearBridge U .S . Aggressive Growth Fund 13,306 1,556,581 2,179,839 3 .04Legg Mason Royce US Smaller Companies Fund 24,341 1,736,348 2,194,474 3 .06Old Mutual Global Investors Series Plc – Old Mutual UK Smaller Companies Focus 1,587,682 2,120,159 2,861,321 4 .00Polar Capital Funds Plc – Healthcare Opportunities Fund 124,269 2,702,027 3,475,510 4 .85Vulcan Value Equity Fund – U2 AC 22,579 1,546,207 2,143,817 2 .99
29,971,944 41 .86
Luxembourg Alquity SICAV – Alquity Asia Fund 9,249 1,100,000 1,090,578 1 .52BlackRock Global Funds –- Continental EuropeanFlexible Fund 77,918 1,054,862 1,433,116 2 .00JPMorgan Funds – America Equity Fund 115,556 1,518,215 2,167,894 3 .03Market Access III-Aubrey Global Emerging MarketsOpportunities Fund 18,188 1,220,737 1,292,447 1 .81Oyster Funds – US Selection 2,265 1,531,200 2,172,674 3 .03
8,156,709 11 .39United Kingdom Aberforth UK Small Companies Fund 15,498 2,650,271 3,203,943 4 .48Baillie Gifford Overseas Growth Funds ICVC – Japanese Smaller Companies Fund 48,934 1,195,436 1,671,589 2 .33Fidelity Investment Funds ICVC - China Consumer Fund 674,638 1,107,221 1,418,090 1 .98FP Crux European Special Situations Fund 305,819 953,905 1,310,200 1 .83Investec Fund Series i – UK Alpha Fund 1,263,378 2,210,000 2,323,351 3 .25JO Hambro Capital Management UK Umbrella Fund – UK Dynamic Fund 1,470,488 2,799,769 3,038,028 4 .24J O Hambro Capital Management UK Umbrella Fund – UK Equity Income Fund 862,422 2,332,362 2,644,186 3 .69Man International ICVC - Japan CoreAlpha 1,096,519 1,193,833 1,629,427 2 .28Somerset Emerging Markets Dividend Growth Fund 953,526 1,174,351 1,446,023 2 .02Somerset Emerging Markets Small Cap Fund OEIC 962,333 1,001,116 1,284,518 1 .79Standard Life Investment Co II – UK EquityUnconstrained Fund 1,140,727 2,539,522 2,559,791 3 .58Thesis – TM Cartesian UK Opportunities Fund 2,420,385 2,546,198 2,679,367 3 .74
(USD)

Standard Bank International Funds Limited
49
Standard Bank International Funds Limited
41
Portfolio Statement (continued)
Multi Manager Global Equity Fund (USD) (continued)
As at 30 September 2016
Transferable securities admitted to an official stock exchange or dealt in on another regulated market (continued)
Nominal holding
Cost USD
Fair Value USD
% of Net Assets
Investment Companies (continued) United Kingdom (continued)
Threadneedle Investment Funds ICVC – European Select Fund 814,498 1,737,140 1,745,331 3 .01 16,023,192 27 .61
Total Investment Companies 57,866,699 99.70 Total Investments 54,871,501 57,866,699 99.70
Net current assets 177,016 0 .30Total net assets 58,043,715 100.00

Standard Bank International Funds Limited
50
Standard Bank International Funds Limited
40
Portfolio Statement
Multi Manager Global Equity Fund (USD)As at 30 September 2016
Transferable securities admitted to an official stock exchange or dealt in on another regulated market .
Nominal holding
Cost USD
Fair Value USD
% of Net Assets
Investment Companies
Ireland
Brown Advisory American Fund 106,895 1,548,191 1,714,602 2 .95GAM Star Fund plc – Technology 109,054 2,823,062 2,976,001 5 .13Guinness Asset Management Funds plc – Global EnergyFund 227,498 1,792,300 1,812,590 3 .12Hermes Asia Ex-Japan Equity Fund 894,117 2,058,075 2,295,969 3 .96Iridian US Equity Fund 21,259 2,144,688 2,312,949 3 .99J O Hambro Capital Management Umbrella Fund Plc – Japan Fund 669,189 1,850,945 1,838,521 3 .17Janus Capital Funds Plc – US Venture Fund 184,571 2,142,917 2,360,666 4 .07Lazard Global Listed Infrastructure Equity Fund 593,802 1,203,297 1,157,641 1 .99Legg Mason Global Funds Plc – ClearBridge U .S . Aggressive Growth Fund 10,921 2,046,310 2,324,171 4 .00Legg Mason Global Funds Plc – Legg Mason ClearBridge Value Fund 14,688 2,323,776 2,356,324 4 .06Legg Mason Royce US Smaller Companies Fund 16,383 1,937,526 1,918,669 3 .31Pacific U .S . Smaller Companies Fund 18,218 1,900,000 1,916,354 3 .30Polar Capital Funds Plc – Healthcare Opportunities Fund 78,907 2,738,073 2,866,688 4 .94Polar Capital North American Fund 62,817 941,915 1,160,863 2 .00Vulcan Value Equity Fund – U2 AC 19,032 2,074,955 2,347,328 4 .04
31,359,336 54 .03
Luxembourg Alquity SICAV – Alquity Asia Fund 8,086 1,246,560 1,238,532 2 .14BlackRock Global Funds – Continental EuropeanFlexible Fund 69,769 1,528,822 1,666,917 2 .87Conventum – Lyrical Fund 11,458 2,336,393 2,276,876 3 .92JPMorgan Funds – America Equity Fund 48,157 1,020,517 1,173,574 3 .92Market Access III-Aubrey Global Emerging Markets 1,735,849 2 .02Opportunities Fund 18,805 1,662,724 2,392,423 2 .99Oyster Funds – US Selection 1,920 2,122,336 3,361,928 4 .12
10,484,171 18 .06United Kingdom Aberforth UK Small Companies Fund 3,923 1,192,242 1,053,524 1 .82Baillie Gifford Overseas Growth Funds ICVC – Japanese Smaller Companies Fund 45,270 1,651,375 2,008,792 3 .46Fidelity Investment Funds ICVC – China Consumer Fund 435,495 1,097,565 1,189,118 2 .05FP Argonaut Funds – FP Argonaut European Alpha Fund 424,718 1,594,981 1,468,759 2 .53FP Crux European Special Situations Fund 317,561 1,569,763 1,767,297 3 .05J O Hambro Capital Management UK Umbrella Fund – UK Dynamic Fund 372,973 1,051,072 1,000,960 1 .72Man International ICVC – Japan CoreAlpha 983,707 1,745,874 1,898,863 3 .27Somerset Emerging Markets Dividend Growth Fund 1,093,598 2,102,520 2,154,315 3 .71Somerset Emerging Markets Small Cap Fund OEIC 1,605,438 1,685,587 1,736,233 2 .99

Standard Bank International Funds Limited
51
Standard Bank International Funds Limited
43
Portfolio Statement (continued)
Multi Manager Global Equity Fund (GBP) (continued)
As at 30 September 2016
Transferable securities admitted to an official stock exchange or dealt in on another regulated market (continued)
Nominal holding
Cost USD
Fair Value USD
% of Net Assets
Investment Companies (continued) United Kingdom (continued)
Threadneedle Investment Funds ICVC – European Select Fund 784,487 1,111,684 1,294,090 1 .81Threadneedle Investment Funds ICVC – UK Fund 2,115,200 2,865,538 3,287,020 4 .59Unicorn Investment Funds – UK Smaller Companies Fund 720,460 3,011,101 3,212,389 4 .49
33,002,012 46 .10
Total Investment Companies 71,130,665 99.35 Total Investments 58,512,192 71,130,665 99.35
Net current assets 465,605 0 .65Total net assets 71,596,270 100.00
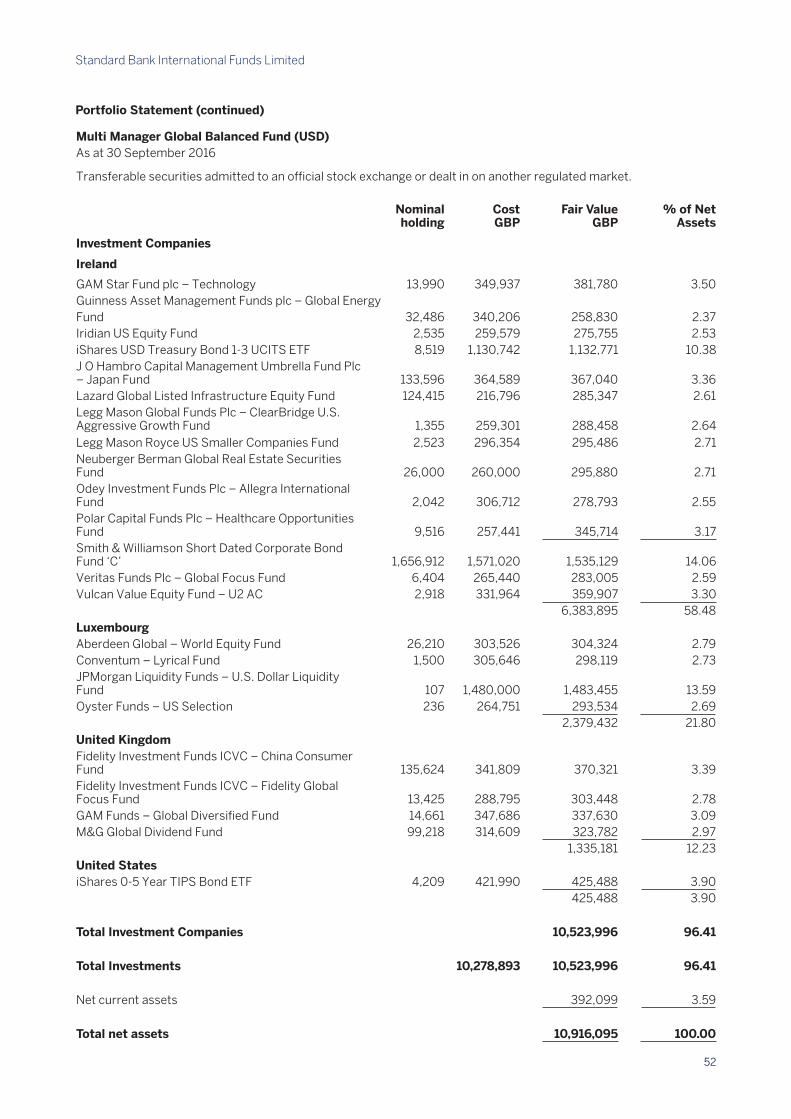
Standard Bank International Funds Limited
52
Standard Bank International Funds Limited
44
Portfolio Statement (continued)
Multi Manager Global Balanced Fund (USD)As at 30 September 2016
Transferable securities admitted to an official stock exchange or dealt in on another regulated market .
Nominal holding
Cost GBP
Fair Value GBP
% of Net Assets
Investment Companies
Ireland
GAM Star Fund plc – Technology 13,990 349,937 381,780 3 .50Guinness Asset Management Funds plc – Global EnergyFund 32,486 340,206 258,830 2 .37Iridian US Equity Fund 2,535 259,579 275,755 2 .53iShares USD Treasury Bond 1-3 UCITS ETF 8,519 1,130,742 1,132,771 10 .38J O Hambro Capital Management Umbrella Fund Plc – Japan Fund 133,596 364,589 367,040 3 .36Lazard Global Listed Infrastructure Equity Fund 124,415 216,796 285,347 2 .61Legg Mason Global Funds Plc – ClearBridge U .S . Aggressive Growth Fund 1,355 259,301 288,458 2 .64Legg Mason Royce US Smaller Companies Fund 2,523 296,354 295,486 2 .71Neuberger Berman Global Real Estate Securities Fund 26,000 260,000 295,880 2 .71Odey Investment Funds Plc – Allegra International Fund 2,042 306,712 278,793 2 .55Polar Capital Funds Plc – Healthcare Opportunities Fund 9,516 257,441 345,714 3 .17Smith & Williamson Short Dated Corporate Bond Fund ‘C’ 1,656,912 1,571,020 1,535,129 14 .06Veritas Funds Plc – Global Focus Fund 6,404 265,440 283,005 2 .59Vulcan Value Equity Fund – U2 AC 2,918 331,964 359,907 3 .30
6,383,895 58 .48Luxembourg Aberdeen Global – World Equity Fund 26,210 303,526 304,324 2 .79Conventum – Lyrical Fund 1,500 305,646 298,119 2 .73JPMorgan Liquidity Funds – U .S . Dollar Liquidity Fund 107 1,480,000 1,483,455 13 .59Oyster Funds – US Selection 236 264,751 293,534 2 .69
2,379,432 21 .80United Kingdom Fidelity Investment Funds ICVC – China Consumer Fund 135,624 341,809 370,321 3 .39Fidelity Investment Funds ICVC – Fidelity Global Focus Fund 13,425 288,795 303,448 2 .78GAM Funds – Global Diversified Fund 14,661 347,686 337,630 3 .09M&G Global Dividend Fund 99,218 314,609 323,782 2 .97
1,335,181 12 .23United StatesiShares 0-5 Year TIPS Bond ETF 4,209 421,990 425,488 3 .90 425,488 3 .90
Total Investment Companies 10,523,996 96.41
Total Investments 10,278,893 10,523,996 96.41
Net current assets 392,099 3 .59
Total net assets 10,916,095 100.00
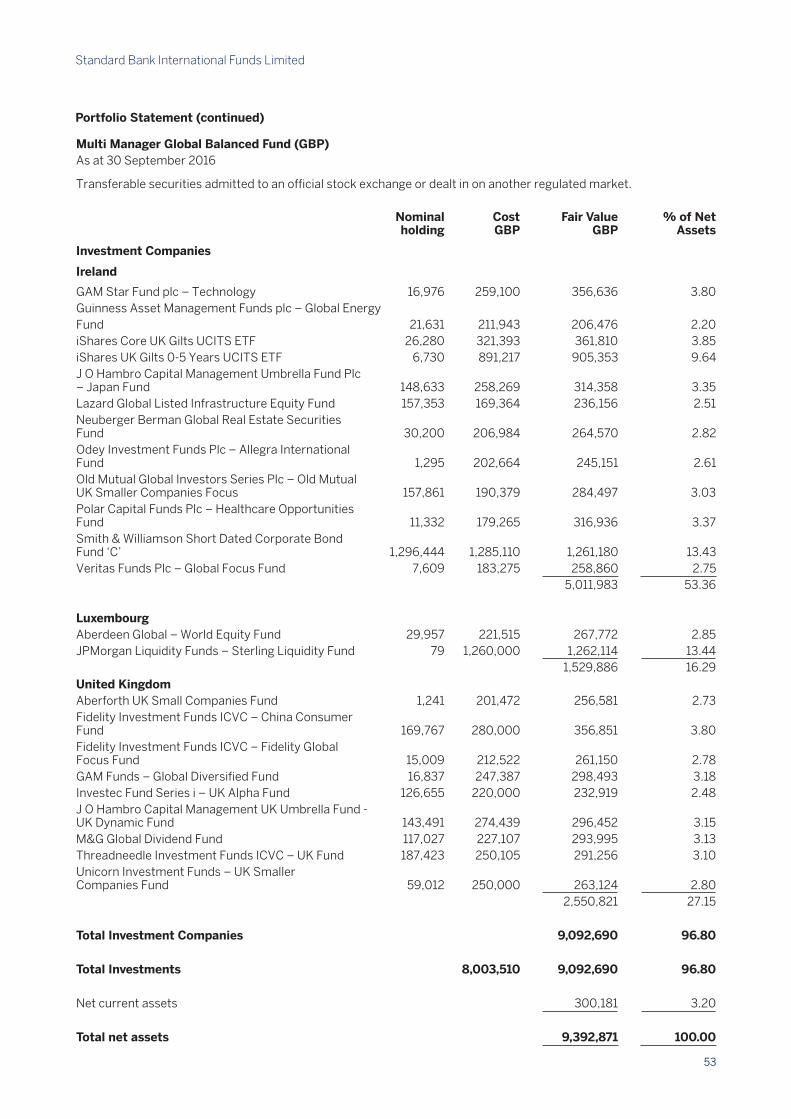
Standard Bank International Funds Limited
53
Standard Bank International Funds Limited
45
Portfolio Statement (continued)
Multi Manager Global Balanced Fund (GBP)As at 30 September 2016
Transferable securities admitted to an official stock exchange or dealt in on another regulated market .
Nominal holding
Cost GBP
Fair Value GBP
% of Net Assets
Investment Companies
Ireland
GAM Star Fund plc – Technology 16,976 259,100 356,636 3 .80Guinness Asset Management Funds plc – Global EnergyFund 21,631 211,943 206,476 2 .20iShares Core UK Gilts UCITS ETF 26,280 321,393 361,810 3 .85iShares UK Gilts 0-5 Years UCITS ETF 6,730 891,217 905,353 9 .64J O Hambro Capital Management Umbrella Fund Plc – Japan Fund 148,633 258,269 314,358 3 .35Lazard Global Listed Infrastructure Equity Fund 157,353 169,364 236,156 2 .51Neuberger Berman Global Real Estate Securities Fund 30,200 206,984 264,570 2 .82Odey Investment Funds Plc – Allegra International Fund 1,295 202,664 245,151 2 .61Old Mutual Global Investors Series Plc – Old Mutual UK Smaller Companies Focus 157,861 190,379 284,497 3 .03Polar Capital Funds Plc – Healthcare Opportunities Fund 11,332 179,265 316,936 3 .37Smith & Williamson Short Dated Corporate Bond Fund ‘C’ 1,296,444 1,285,110 1,261,180 13 .43Veritas Funds Plc – Global Focus Fund 7,609 183,275 258,860 2 .75
5,011,983 53 .36
Luxembourg Aberdeen Global – World Equity Fund 29,957 221,515 267,772 2 .85JPMorgan Liquidity Funds – Sterling Liquidity Fund 79 1,260,000 1,262,114 13 .44
1,529,886 16 .29United Kingdom Aberforth UK Small Companies Fund 1,241 201,472 256,581 2 .73Fidelity Investment Funds ICVC – China Consumer Fund 169,767 280,000 356,851 3 .80Fidelity Investment Funds ICVC – Fidelity Global Focus Fund 15,009 212,522 261,150 2 .78GAM Funds – Global Diversified Fund 16,837 247,387 298,493 3 .18Investec Fund Series i – UK Alpha Fund 126,655 220,000 232,919 2 .48J O Hambro Capital Management UK Umbrella Fund - UK Dynamic Fund 143,491 274,439 296,452 3 .15M&G Global Dividend Fund 117,027 227,107 293,995 3 .13Threadneedle Investment Funds ICVC – UK Fund 187,423 250,105 291,256 3 .10Unicorn Investment Funds – UK Smaller Companies Fund 59,012 250,000 263,124 2 .80
2,550,821 27 .15
Total Investment Companies 9,092,690 96.80
Total Investments 8,003,510 9,092,690 96.80
Net current assets 300,181 3 .20
Total net assets 9,392,871 100.00

Standard Bank International Funds Limited
54
Standard Bank International Funds Limited
46
Portfolio Statement (continued)
Multi Manager Global Balanced Fund (USD)As at 30 September 2016
Transferable securities admitted to an official stock exchange or dealt in on another regulated market .
Nominal holding
Cost GBP
Fair Value GBP
% of Net Assets
Investment Companies
Ireland
Hermes Investment Management Ltd – Multi Strategy Credit Fund 1,232,851 2,512,171 2,692,916 7 .26iShares $ Short Duration Corporate Bond UCITS ETF 14,580 1,482,732 1,482,859 4 .00Kames Strategic Global Bond Fund 169,632 2,216,586 2,227,780 6 .01Legg Mason Global Funds Plc – Brandywine Global Fixed Income Absolute Return Fund 26,437 2,693,750 2,699,512 7 .28Legg Mason Global Funds Plc – Legg Mason Western Asset Macro Opportunities Bond Fund 22,942 2,589,474 2,688,837 7 .25Muzinich Funds – Long Short Credit Yield 14,588 1,801,153 1,852,118 4 .99Polar Capital Funds plc – Global Convertible Fund 80,055 924,735 935,844 2 .52
14,579,866 39 .31
Jersey Schroder Indirect Real Estate Fund/The ‘B’ 9,681 1,570,293 1,688,242 4 .55
1,688,242 4 .55
Luxembourg Aviva Investors – Global Convertibles Absolute Return Fund 5,627 714,150 753,602 2 .03Aviva Investors Sicav – Multi-Strategy Target Return Fund 27,344 2,709,482 2,695,486 7 .27Invesco Global Targeted Returns Fund 264,579 2,631,917 2,697,856 7 .27JPMorgan Liquidity Funds - U .S . Dollar Liquidity Fund 107 1,480,448 1,481,140 3 .99Jupiter JGF – Global Convertibles 66,474 819,154 861,507 2 .32Mirabaud-Convertible Bonds Global 2,188 230,912 233,275 0 .63Schroder International Selection Fund – Emerging Markets Debt Absolute Return 83,468 2,514,057 2,598,400 7 .01
11,321,266 30 .52
United Kingdom
M&G Optimal Income Fund 185,363 2,594,449 2,708,410 7 .30NGAM Investment Funds UK ICVC – H2O MultiReturns Fund 1,068,879 2,147,916 1,727,816 4 .66
4,436,226 11 .96 United StatesiShares 0 – 5 Year TIPS Bond ETF 23,863 2,373,251 2,412,549 6 .50 2,412,549 6 .50
Total Investment Companies 34,438,149 92.84
Total Investments 34,006,630 34,438,149 92.84
Net current assets 2,654,055 7 .16
Total net assets 37,092,204 100.00

Standard Bank International Funds Limited
55
Notice of Annual general Meeting
NOTICE IS HEREBY GIVEN pursuant to the Articles of Association of Melville Douglas Select Fund Limited (the “Company”) that the Annual General Meeting of the Company will take place on 1 February 2017 at Standard Bank House, 47–49 La Motte Street, St . Helier, Jersey, Channel Islands at 11 .15 a .m . for the purpose of considering and, if thought fit, passing the following Resolutions:
Ordinaryresolution
1 . That the financial statements for the year ended 30 September 2016 be approved and adopted .
2 . That directors fees in the sum of USD30,000 and GBP4,000 for the year ended 30 September 2016 be approved .
3 . That PricewaterhouseCoopers Ireland, be reappointed auditors of the Company to hold office until the conclusion of the next general meeting at which the accounts are laid before the Company and that their remuneration be fixed by the directors .
By order of the board STANLIB Fund Managers Jersey Limited Secretary 11 January 2017
Notes
1 . A member entitled to attend and vote is entitled to appoint one or more proxies to attend and vote in his stead a proxy need not be a member of the Company .
2 . To be valid this proxy form must be completed and deposited at the registered office of the Company not less than 48 hours before the time fixed for the meeting .
3 . If the shareholder is a corporation the form must be executed either under its common seal or under the hand of an officer or attorney so authorised .
4 . In the case of joint holders, the signature of any one joint holder will be sufficient, but the names of all joint holders should be stated .
Standard Bank International Funds Limited
56
The Secretary Standard Bank International Funds Limited Standard Bank House 47 – 49 La Motte Street St. Helier JERSEY JE2 4SZ
Standard Bank International Funds Limited (the “Company”)
Form of ProxyPlease complete in block capitals
I/We ………………………………………………………………………………
Complete only if Special proxy desired. (See Note a. below)
being a holder(s) of………… . .Participating shares in the capital of the Company hereby appoint the Chairman of the Meeting or failing him:
as my/our proxy to vote for me/us on my/our behalf at the Annual General Meeting of the Company to be held on 1 February 2017 at 11:15 a .m . and at any adjournments thereof, in the following manner:
Resolutions
*Strike out whatever is not desired
Ordinary Resolution No . 1 For/Against*
No . 2 For/Against*
No . 3 For/Against*
Signed this _______________________________ day of __________________________ 2017
Signature ______________________________________________________________________
a . If you desire to appoint a proxy other than indicated above, please delete the appropriate words and insert the name and address of your proxy
b . Unless otherwise instructed, the proxy will vote or abstain from voting as he thinks fit in relation to the resolutions referred to above
c . Unless otherwise instructed, the proxy will vote or abstain from voting as he thinks fit in relation to the resolutions referred to above
d . A corporation should complete this form under its common seal or under the hand of a duly authorised officer or attorney