Embed Size (px)
Citation preview
STANDARD OPERATING PROCEDURES
SOP: 1713
PAGE: 1 of 32
REV: 1.0
DATE: 05/13/99
SPECTRACE 9000 FIELD PORTABLE X-RAY FLUORESCENCE
OPERATING PROCEDURE
CONTENTS
1.0 SCOPE AND APPLICATION
1.1 Principles of Operation
1.1.1 Characteristic X-rays
1.1.2 Scattered X-rays
1.2 Sample Types
2.0 METHOD SUMMARY
3.0 SAMPLE PRESERVATION, CONTAINERS, HANDLING, AND STORAGE
4.0 INTERFERENCES AND POTENTIAL PROBLEMS
4.1 Sample Placement
4.2 Sample Representivity
4.3 Reference Analysis
4.4 Chemical Matrix Effects (Due to the Chemical Composition of the Sample)
4.5 Physical Matrix Effects (Due to Sample Morphology)
4.6 Application Error
4.7 Moisture Content
4.8 Cases of Severe X-ray Spectrum Overlaps
5.0 EQUIPMENT / APPARATUS
5.1 Description of the Spectrace 9000 System*
5.2 Equipment and Apparatus List
5.2.1 Spectrace 9000 Analyzer System
5.2.2 Optional Items
5.2.3 Limits and Precautions
5.3 Peripheral Devices
5.3.1 Communication Cable Connection
5.3.2 Communication Port Setup
5.3.3 User Software
5.4 Instrument Maintenance
5.4.1 Probe Window
STANDARD OPERATING PROCEDURES
SOP: 1713
PAGE: 2 of 32
REV: 1.0
DATE: 05/13/99
SPECTRACE 9000 FIELD PORTABLE X-RAY FLUORESCENCE
OPERATING PROCEDURE
5.4.2 Further Information and Troubleshooting
6.0 REAGENTS
7.0 PROCEDURE
7.1 Prerequisites
7.1.1 Gain Control
7.1.2 Setting Data and Spectrum Store/Send Mode
7.2 General Keys and Menu Software
7.2.1 The Keyboard
7.2.2 The Measure (Ready) Screen
7.2.3 The Choose an Application Screen
7.2.4 The Review Stored Results Screen
7.2.5 The Review Stored Spectra Screen
7.2.6 The More (Other Functions) Screen
7.2.7 The Results Screen
7.3 Preoperational Checks
7.3.1 Energy Calibration and Energy Calibration Check*
7.3.2 Resolution Check
7.3.3 Blank (Zero) Sample Check
7.3.4 Target Element Response Check
7.4 Selecting Source Measuring Time
7.4.1 Minimum Source Measuring Times
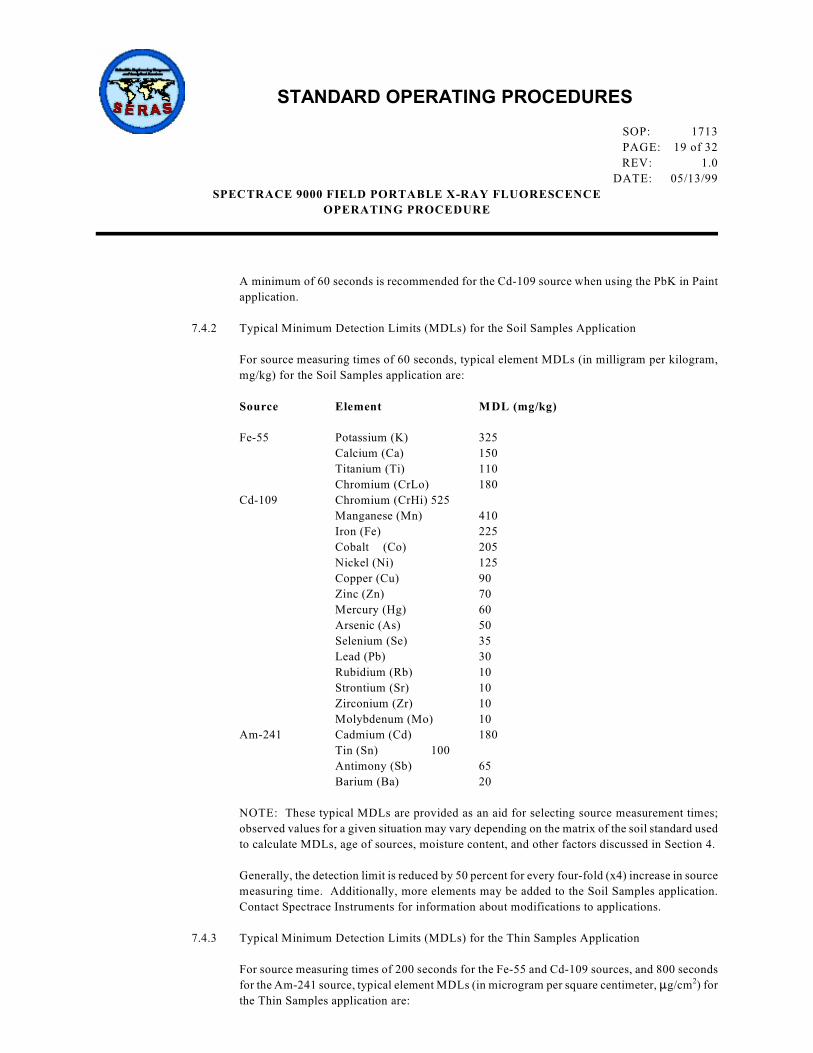
7.4.2 Typical Minimum Detection Limits (MDLs) for the Soil Samples Application
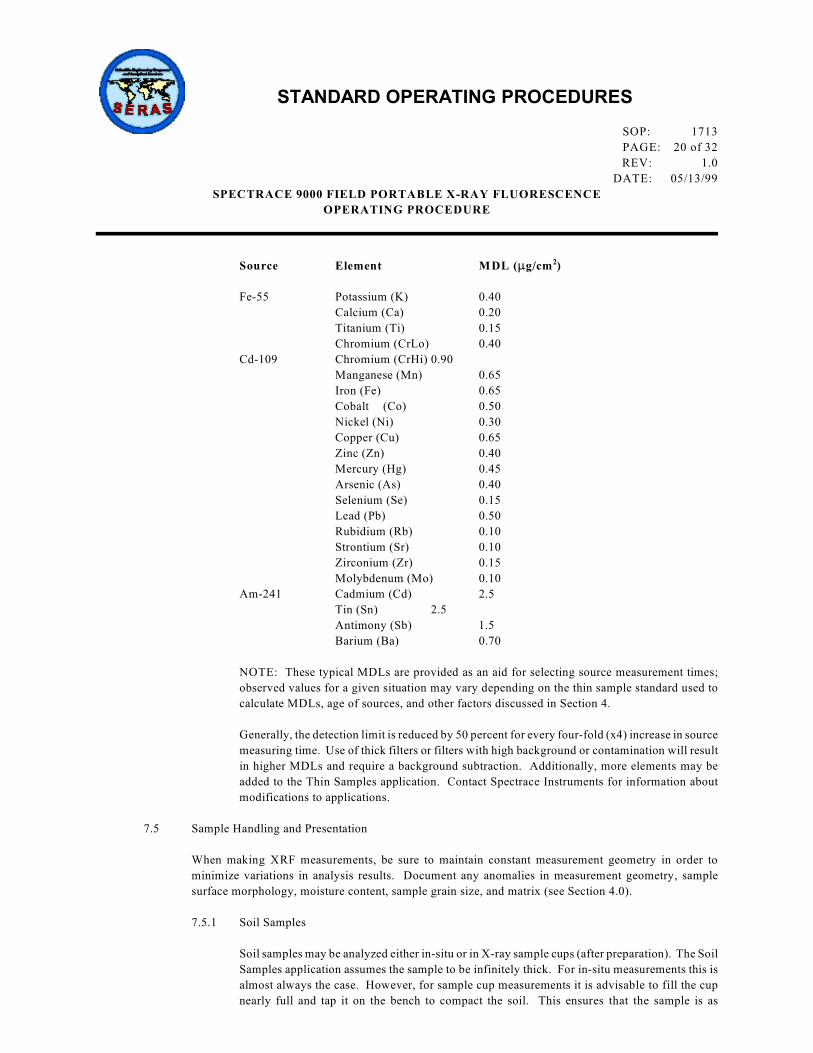
7.4.3 Typical Minimum Detection Limits (MDLs) for the Thin Samples Application
7.5 Sample Handling and Presentation
7.5.1 Soil Samples*
7.5.2 Thin (Filter) Samples*
7.5.3 Lead in Paint*
8.0 CALCULATIONS
9.0 QUALITY ASSURANCE / QUALITY CONTROL
9.1 Precision
STANDARD OPERATING PROCEDURES
SOP: 1713
PAGE: 3 of 32
REV: 1.0
DATE: 05/13/99
SPECTRACE 9000 FIELD PORTABLE X-RAY FLUORESCENCE
OPERATING PROCEDURE
9.1.1 The Method Detection Limit (MDL) and Method Quantitation Limit (MQL)
9.2 Reporting Results*
9.3 Accuracy
9.3.1 Matrix Considerations
10.0 DATA VALIDATION
10.1 Confirmation Samples
10.2 Recording Results
10.3 Downloading Stored Results and Spectra
11.0 HEALTH AND SAFETY
12.0 REFERENCES
13.0 BIBLIOGRAPHY*
14.0 APPENDIX
A. Figures
* These sections affected by Revision 1.0
SUPERCEDES: SOP #1713, Revision 0.0; 01/26/95; U.S. EPA Contract 68-C4-0022.
1.0
STANDARD OPERATING PROCEDURES
SOP: 1713
PAGE: 4 of 32
REV: 1.0
DATE: 05/13/99
SPECTRACE 9000 FIELD PORTABLE X-RAY FLUORESCENCE
OPERATING PROCEDURE
SCOPE AND APPLICATION
The purpose of this Standard Operating Procedure (SOP) is to serve as a guide to the start-up, check out, operation,
calibration, and routine use of the Spectrace 9000 field portable x-ray fluorescence instrument for field use in
screening hazardous or potentially hazardous inorganic materials. It is not intended to replace or diminish the use
of the Spectrace 9000 Operating Instructions. The Operating Instructions contain additional information for
optimizing instrument performance and for utilizing different applications.
The procedures contained herein are general operating guidelines which may be changed as required, depending on
site conditions, equipment limitations, limitations imposed by Quality Assurance\Quality Control (QA\QC)
procedure or other protocol limitations. In all instances, the procedures finally employed should be documented and
included in the final report.
Mention of trade names or commercial products does not constitute endorsement or recommendation for use.
1.1 Principles of Operation
X-ray Fluorescence (XRF) spectroscopy is a non destructive qualitative and quantitative analytical
technique used to determine the chemical composition of samples. In a source excited XRF analysis,
primary X-rays emitted from a sealed radioisotope source are utilized to irradiate samples. During
interaction with samples, source X-rays may either undergo scattering (dominating process) or absorption
by sample atoms in a process known as the photoelectric effect (absorption coefficient). This phenomenon
originates when incident radiation knocks out an electron from the innermost shell of an atom creating a
vacancy. The atom is excited and releases its surplus energy almost instantly by filling the vacancy with
an electron from one of the higher energy shells. This rearrangement of electrons is associated with the
emission of X-rays characteristic (in terms of energy) of the given atom. This process is referred to as
emission of fluorescent X-rays (fluorescent yield). The overall efficiency of the fluorescence process is
referred to as excitation efficiency and is proportional to the product of the absorption coefficient and the
fluorescent yield.
1.1.1 Characteristic X-rays
The Spectrace 9000 utilizes characteristic X-ray lines originating from the innermost shells of
the atoms: K, L, and occasionally M. The characteristic X-ray lines of the K series are the most
energetic lines for any element and, therefore, are the preferred analytical lines. The K lines are
always accompanied by the L and M lines of the same element. However, with energies much
lower than those of the K lines, they can usually be neglected for those elements for which the
K lines are analytically useful. For heavy elements such as cerium (Ce) (atomic number [Z]=58),
to uranium (U, Z=92), the L lines are the preferred lines for analysis. The L and L lines have
almost equal intensities, and the choice of one or the other depends on what interfering lines
might be present. A source just energetic enough to excite the L lines will not excite the K lines
of the same element. The M lines will appear together with the L lines.
" $
The Spectrace 9000 Operating Instructions contain a table that identifies the X-rays (K or L) and
elements measured for each excitation source.
STANDARD OPERATING PROCEDURES
SOP: 1713
PAGE: 5 of 32
REV: 1.0
DATE: 05/13/99
SPECTRACE 9000 FIELD PORTABLE X-RAY FLUORESCENCE
OPERATING PROCEDURE
An X-ray source can excite characteristic X-rays from an element only if the source energy is
greater than the absorption edge energy for the particular line group of the element (e.g., K
absorption edge, L absorption edge, M absorption edge). The absorption edge energy is
somewhat greater than the corresponding line energy. The K absorption edge energy is
approximately the sum of the K, L, and M line energies, and the L absorption edge energy is
approximately the sum of the L and M line energies of the particular element.
Energies of the characteristic fluorescent X-rays are converted (within the detector) into a train
of electric pulses, the amplitudes of which are linearly proportional to the energy. An electronic
multichannel analyzer (electronic unit) measures the pulse amplitudes, which is the basis of a
qualitative X-ray analysis. The number of counts at a given energy is representative of element
concentration in a sample and is the basis for quantitative analysis.
1.1.2 Scattered X-rays
The source radiation is scattered from the sample by two physical processes: coherent or elastic
scattering (no energy loss), and Compton or inelastic scattering (small energy loss). Thus, source
backscatter (background signal) consists of two components with X-ray lines close together. The
higher energy line is equal to the source energy. Since the whole sample takes part in scattering,
the scattered X-rays usually yield the most intense lines in the spectrum. Furthermore, the scat
tered X-rays have the highest energies in the spectrum and, therefore, contribute most of the total
measured intensity signal.
1.2 Sample Types
Solid and liquid samples can be analyzed for elements aluminum (Al) through uranium (U) with proper
X-ray source selection and instrument calibration. Typical environmental applications are:
C Heavy metals in soil (in-situ or samples collected from the surface or from bore hole drillings,
etc.), sludges, and liquids (e.g., lead (Pb) in gasoline)
C Light elements in liquids (e.g., phosphorus [P], sulphur [S], and chlorine [Cl] in organic
solutions)
C Heavy metals in industrial waste stream effluents
C PCB in transformer oil by Cl analysis
C Heavy metal air particulates collected on membrane filters, either from personnel samplers or
from high volume samplers.
C Lead (Pb) in paint
2.0 METHOD SUMMARY
STANDARD OPERATING PROCEDURES
SOP: 1713
PAGE: 6 of 32
REV: 1.0
DATE: 05/13/99
SPECTRACE 9000 FIELD PORTABLE X-RAY FLUORESCENCE
OPERATING PROCEDURE
The Spectrace 9000 Portable XRF Analyzer employs three radioactive isotope sources: iron-55 (Fe-55), cadmium
109 (Cd-109), and americium-241 (Am-241) for the production of primary X-rays. Each source emits a specific
set of primary X-rays which excite a corresponding range of elements in a sample. When more than one source can
excite the element of interest, the appropriate source is selected according to its excitation efficiency for the element
of interest. See page 1-2 of the Spectrace 9000 Operating Instructions for a chart of source type versus element
range.
The sample is positioned in front of the source-detector window and sample measurement is initiated which exposes
the sample to primary radiation from the source. Fluorescent and backscattered X-rays from the sample enter
through the beryllium (Be) detector window and are counted in the high resolution mercuric iodide (HgI ) detector. 2
Elemental concentrations are computed using a Fundamental Parameter (FP) algorithm of the form:
Concentration = R x S x (1 + SUM{A x C }) n n
"R" is the measured analyte X-ray intensity relative to the pure element; "S" is a calculated sensitivity coefficient.
The quantity SUM{} is a summation of "n"-element absorption-enhancement terms containing calculated alpha-
coefficients and iteratively computed element concentrations. The Spectrace 9000 utilizes FP XRF calibrations
derived from theoretical considerations (as opposed to empirical data). The menu-driven software in the Spectrace
9000 supports multiple XRF calibrations called "applications." Each application is a complete analysis configuration
including elements to be measured, interfering elements in the sample, and a set of FP calibration coefficients.
The measurement time of each source is user-selectable. The shorter source measurement times (15 -30s) are
generally used for initial screening and hot spot delineation, while longer measurement times (30 - 500s) are
typically used for higher precision and accuracy requirements.
3.0 SAMPLE PRESERVATION, CONTAINERS, HANDLING AND STORAGE
This SOP specifically describes equipment operating procedures for the Spectrace 9000; hence, this section is not
applicable to this SOP.
4.0 INTERFERENCES AND POTENTIAL PROBLEMS
The total method error for XRF analysis is defined as the square root of the sum of squares of both instrument
precision and user or application related error. Generally, the instrument precision is the least significant source of
error in XRF analysis. User- or application-related error is generally more significant and will vary with each site
and method used. The components of the user or application related error are the following.
4.1 Sample Placement
This is a potential source of error because the X-ray signal decreases as the distance from the radioactive
source is increased. However, this error is minimized by maintaining the same distance for each sample.
4.2 Sample Representivity
STANDARD OPERATING PROCEDURES
SOP: 1713
PAGE: 7 of 32
REV: 1.0
DATE: 05/13/99
SPECTRACE 9000 FIELD PORTABLE X-RAY FLUORESCENCE
OPERATING PROCEDURE
In order to accurately characterize site conditions, samples collected must be representative of the site or
area under investigation. Representative soil sampling ensures that a sample or group of samples
accurately reflects the concentration of the contaminant(s) of concern at a given time and location.
Analytical results from representative samples reflect the variation in pollutant presence and concentration
range throughout a site. Variables affecting sample representativeness include: (1) geologic variability,
(2) contaminant concentration variability, (3) collection and preparation variability, and (4) analytical
variability. Attempts should be made to minimize these sources of variability. For additional information
on representative sampling, refer to the "Removal Program Representative Sampling Guidance, Volume
1 - Soil."(1)
4.3 Reference Analysis
Soil chemical and physical matrix effects may be corrected by using site-specific soil samples which have
been analyzed by Inductively-Coupled Plasma (ICP) or Atomic Absorption (AA) spectroscopy as
calibration samples. A major source of error can result if these samples are not representative of the site
and/or if the analytical error is large. Additionally, when comparing XRF results with reference analyses
results, the efficiency of the sample digestion reference analysis should be considered. Some digestion
methods may breakdown different sample matrices more efficiently than others.
4.4 Chemical Matrix Effects (Due to the Chemical Composition of the Sample)
Chemical matrix effects result from differences in concentrations of interfering elements. These effects
appear as either spectral interferences (peak overlaps) or as X-ray absorption/enhancement phenomena.
Both effects are common in soils contaminated with heavy metals. For example, iron (Fe) tends to absorb
copper (Cu) X-rays, reducing the intensity of Cu measured by the detector. This effect can be corrected
mathematically through the use of FP coefficients.
4.5 Physical Matrix Effects (Due to Sample Morphology)
Physical matrix effects are the result of variations in the physical character of the sample. They include
parameters such as particle size, uniformity, homogeneity, and surface condition. For example, consider
a sample in which the analyte exists in the form of very fine particles within a matrix composed of much
courser material. If two separate aliquots of the sample are prepared in such a way that the matrix particles
in one are much larger than in the other, then the relative volume of analyte occupied by the analyte
containing particles will be different in each. When measured, a larger amount of the analyte will be
exposed to the source X-rays in the sample containing finer matrix particles; this results in a higher
intensity reading for that sample and, consequently, an apparently higher measured concentration for that
element.
4.6 Application Error
Generally, the error in the application calibration model is insignificant (relative to the other sources of
error) PROVIDED the instrument's operating instructions are followed correctly. However, if the sample
matrix varies significantly from the design of the application, the error may become significant (e.g., using
the soils application to analyze a 50 percent iron mine tailing sample).
STANDARD OPERATING PROCEDURES
SOP: 1713
PAGE: 8 of 32
REV: 1.0
DATE: 05/13/99
SPECTRACE 9000 FIELD PORTABLE X-RAY FLUORESCENCE
OPERATING PROCEDURE
4.7 Moisture Content
Sample moisture content will affect the analytical accuracy of soils or sludges. The overall error may be
secondary when the moisture range is small (5-20 percent), or it may be a major source of error when
measuring the surface of soils that are saturated with water.
4.8 Cases of Severe X-ray Spectrum Overlaps
When present in the sample, certain X-ray lines from different elements can be very close in energy and,
therefore, can interfere by producing a severely overlapped spectrum.
The typical spectral overlaps are caused by the K$ line of element Z-1 (or as with heavier elements, Z-2
or Z-3) overlapping with the K line of element Z. This is the so-called K /K interference. Since the " " $
K :K$ intensity ratio for the given element usually varies from 5:1 to 7:1, the interfering element, Z-1,
must be present in large concentrations in order to disturb the measurement of analyte Z. For example,
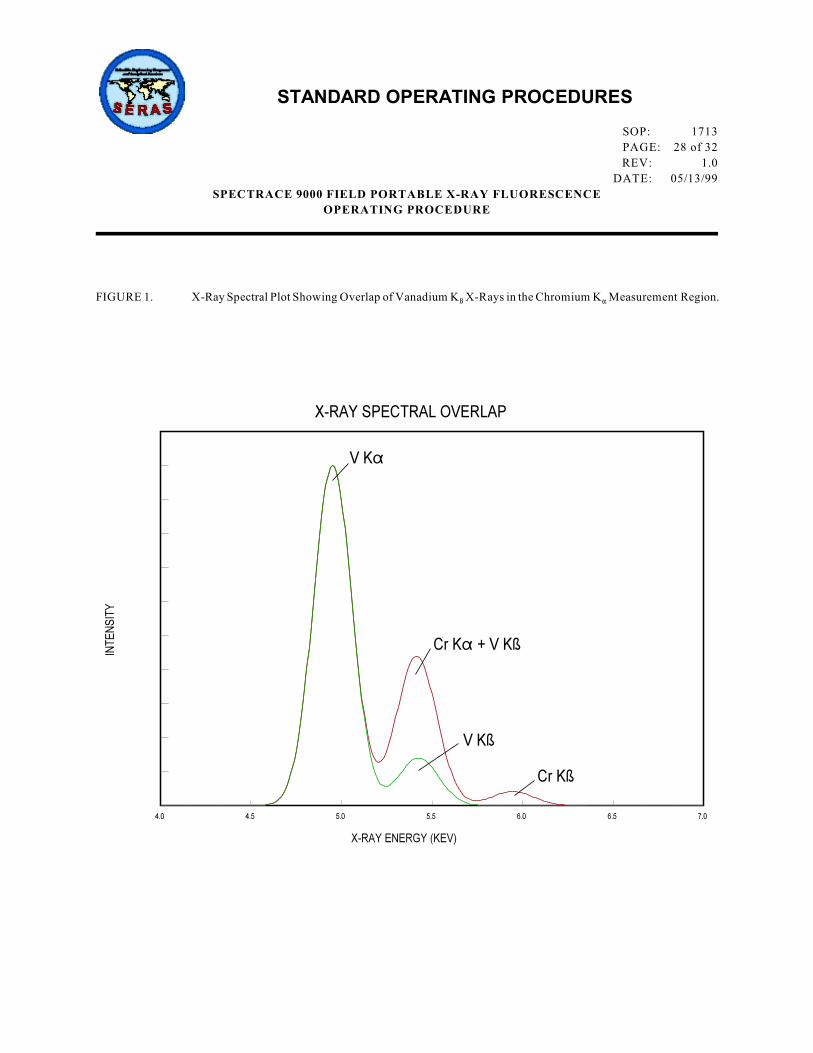
the presence of large concentrations of vanadium (V) could disturb the measurement of chromium (Cr).
The V K" and K$ energies are 4.951 and 5.427 Kev, respectively. The Cr K" energy is 5.41 Kev. The
resolution of the detector is approximately 270 eV. Therefore, large amounts of V in a sample will result
in spectral overlap of the V K $ with the Cr K " peak (see Figure 1, Appendix A) and the measured X-ray
spectrum will include TOTAL counts for Cr plus V lines.
"
Other interferences arise from K/L, K/M, and L/M line overlaps. While these are less common, the
following are examples of severe overlap:
As K /Pb L , S K /Pb M " " " "
In the arsenic (As)/lead case, Pb can be measured from the Pb L line, and arsenic from either the As K"
or the As K$ line; this way the unwanted interference can be corrected. However, due to the limits of
mathematical corrections, measurement sensitivity is reduced. Generally, arsenic concentrations can not
be efficiently calculated in samples with Pb:As ratios of 10:1 or more. This may result in zero arsenic
being reported regardless of what the actual concentration is.
$
The Spectrace 9000 uses overlap factors to correct for X-ray spectral overlaps for the elements of interest
for a given application.
5.0 EQUIPMENT / APPARATUS
5.1 Description of the Spectrace 9000 System
The analyzer utilizes the method of Energy Dispersive X-Ray Fluorescence (EDXRF) spectrometry to
determine the elemental composition of soils, sludges, aqueous solutions, oils, and other waste materials.
The Spectrace 9000 analyzer includes three compact, sealed radiation sources contained in a measuring
probe: Fe-55, Cd-109, and Am-241. The analyzer software automatically selects which sources to use
as well as measurement time for each source based on stored information for each application. The probe
STANDARD OPERATING PROCEDURES
SOP: 1713
PAGE: 9 of 32
REV: 1.0
DATE: 05/13/99
SPECTRACE 9000 FIELD PORTABLE X-RAY FLUORESCENCE
OPERATING PROCEDURE
is equipped with a high resolution HgI detector, which is connected by cable to an environmentally sealed
electronic module. 2
The electronic unit provides internal non volatile memory for storage of 120 spectra and 300 multi-element
analysis reports. An RS-232 serial port is provided for downloading data and spectra to a peripheral
device. The multi-element analysis reports and the 2000-channel spectra can be displayed on the
instrument's LCD panel. The replaceable and rechargeable internal battery provides for field-portable
operation.
The Spectrace 9000 is supplied with four factory-installed FP-based applications (calibrations). The "Soil
Samples" application is for analysis of soils where the balance of the sample (that portion not directly
measured by the instrument) is silica (SiO ). The "Thin Film" application is for analysis of thin films such
as air monitoring filters or wipes. The "PbK in Paint" application is for analyzing Pb in paint films and
is reasonably independent of the type of substrate. Finally, the “Fine Particle Soil” application is for
analysis of prepared soil samples that have been ground into fine particles (typically, less than 120 mesh).
Spectrace Instruments will also develop new applications to meet user specific requirements (e.g., adding
elements to the "Soil Samples" application). The PC-based Spectrace 9000 Application Generator
software may also be used to develop new applications.
2
The Spectrace 9000 can be powered from a 115-volt (or 220-volt) wall outlet or from its 4-hour capacity obattery. It can be operated in temperatures ranging from 32 to 120 Fahrenheit (F). Furthermore, the probe
and electronic unit may be exposed to a light rain. However, additional protection is provided when the
system (electronic unit and probe) is contained in the optional water repellant carrying case.
5.2 Equipment and Apparatus List
5.2.1 Spectrace 9000 Analyzer System
The complete Spectrace 9000 Analyzer System includes:
C Analyzer unit for data acquisition, processing, and display
C Hand-held probe including:
- High-resolution HgI detector 2
- Three excitation sources ( 55Fe, 109Cd, 241Am)
- Safety cover
C Probe laboratory stand with the following:
- Base for table top use
- Safety shield over sample
- Positioning fixtures for standard 30-mm and 40-mm X-ray sample cups
C Interconnecting cable
C RS-232C Serial I/O Interface cable
STANDARD OPERATING PROCEDURES
SOP: 1713
PAGE: 10 of 32
REV: 1.0
DATE: 05/13/99
SPECTRACE 9000 FIELD PORTABLE X-RAY FLUORESCENCE
OPERATING PROCEDURE
C Two blank check samples
C Pure element check samples
C Battery charger
C Battery pack
C System carrying/shipping case
C Spectrace 9000 Operating Instructions, application software, and utilities software. The
application software is specific to each unit and cannot be interchanged between
different units. The software is identified by the serial number of the unit.
5.2.2 Optional Items
C 31-mm diameter sample cups
C XRF polypropylene film, 0.2 mil thick
C Field carrying case
C Peripheral devices such as a printer and IBM compatible Personal Computer (PC)
C Spare probe window assembly
C Spare battery pack, charger, and charger adaptor (required to charge spare battery
outside of electronic unit)
See the Spectrace 9000 Accessories Price List for additional options.
For mobile lab or laboratory X-ray sample preparation accessories (such as drying ovens,
grinders, sieves, etc.), consult general laboratory equipment suppliers.
5.2.3 Limits and Precautions
The probes should be handled in accordance with the following radiological control practices.
1. The probe should always be in contact with the surface of the material being analyzed,
and that material should completely cover the probe opening (aperture) when the
sources are exposed. Do not remove a sample or move the probe while the indicators
show SOURCE ON.
SOURCE ON indicators are:

STANDARD OPERATING PROCEDURES
SOP: 1713
PAGE: 11 of 32
REV: 1.0
DATE: 05/13/99
SPECTRACE 9000 FIELD PORTABLE X-RAY FLUORESCENCE
OPERATING PROCEDURE
C the message on the screen "SOURCE ON"
C the flashing light at the base of the probe.
2. When the sources are exposed, under no circumstances should the probe be pointed at
the operator or surrounding personnel.
3. Do not place any part of the operator's or co-worker's bodies in line of exposure when
the sources are exposed or partially covered.
4. The probe must be covered with the safety cover or laboratory safety shield when not
in use.
5. Spectrace Instruments must be notified immediately of any condition or concern
relative to the probe's structural integrity, source shielding, source switching condition,
or operability.
6. The appropriate state agency or the Nuclear Regulatory Commission (NRC) office
must be notified immediately of any damage to the radioactive source, or any loss or
theft of the device (see factory supplied data on radiological safety).
7. Labels or instructions on the probe(s) must not be altered or removed.
8. The user must not attempt to open the probe.
9. The source(s) in the probe must be leak-tested every 6 months as described in the
Spectrace 9000 Operating Instructions. The leak test certificates must be kept on file,
and a copy must accompany the instrument at all times.
10. The probe laboratory safety shield assembly must be used when the probe is inverted
for measuring samples contained in cups.
11. During operation, the probe must be kept at least 10 feet from computer monitors and
any other source of radio frequency (RF). Some monitors have very poor RF shielding
and will affect measurement results.
12. The Spectrace 9000 should not be dropped or exposed to conditions of excessive shock
or vibration.
13. The electronic unit should be left on whenever the battery charger is connected to it.
If the electronic unit is shut off with the battery charger plugged in, the battery may be
damaged due to overcharging.
Additional precautions include:
1. The probe cable must never be pulled while unplugging the probe. The probe plug
STANDARD OPERATING PROCEDURES
SOP: 1713
PAGE: 12 of 32
REV: 1.0
DATE: 05/13/99
SPECTRACE 9000 FIELD PORTABLE X-RAY FLUORESCENCE
OPERATING PROCEDURE
should be grasped at the ribbed metal connector and squeezed and pulled gently while
the connector is unplugged. The connector must never be forced when plugging in the
connector.
2. The handle of the electronic unit must not be rotated unless the release buttons on each
side of the handle are depressed.
o3. The Spectrace 9000 should not be stored at an ambient temperature below -4 F or
above 110°F.
4. The battery charging unit should only be used indoors in dry conditions.
5. Battery packs should be changed only in dry conditions.
5.3 Peripheral Devices
The Spectrace 9000 may be used with a wide range of peripheral devices for electronic data capture or
printed readout as long as they are compatible with the RS-232 serial I/O protocol. Such devices include
terminals, printers, electronic data loggers, personal computers, etc.
5.3.1 Communication Cable Connection
Plug the 25-pin connector of the RS-232 Serial I/O cable into the Spectrace 9000 25-pin
connector (the connection just below the display screen on the electronic unit) and the 9-pin
connector of the cable into the serial port of the receiving device.
5.3.2 Communication Port Setup
To communicate with an external device, the Spectrace 9000 MUST be set at the same baud rate,
word length, and parity as the receiving device. The Spectrace 9000 allows you to select various
configurations for these parameters in the communication (Comm.) port setup portion of the
More submenu (which can be accessed from the main menu).
The default COM setup for application and utilities software is 9600,N,8,1.
5.3.3 User Software
Refer to your PC software manual for details on additional settings that may be required for
proper interfacing between the Spectrace 9000 and your particular software.
5.4 Instrument Maintenance
5.4.1 Probe Window
When the probe window becomes damaged or punctured, it should be replaced as soon as
STANDARD OPERATING PROCEDURES
SOP: 1713
PAGE: 13 of 32
REV: 1.0
DATE: 05/13/99
SPECTRACE 9000 FIELD PORTABLE X-RAY FLUORESCENCE
OPERATING PROCEDURE
possible to prevent dust and moisture from entering the probe. Replacement window assemblies
can be ordered from Spectrace Instruments. Note the location of the window aperture; it is closer
to one end of the window plate. Simply unscrew the old window plate, press any corner of it,
and remove it. Stretch the O-ring for 10 seconds, and lay it back in the groove. The O-ring must
lie flat in the groove in order for the new window plate to be installed. Install the new window
assembly in the same manner as the old. If the surface of the window plat is not flush with the
face of the probe, the O-ring has probably come out of the grove. Remove the assembly, and try
the same procedure again.
5.4.2 Further Information and Troubleshooting
Refer to the Spectrace 9000 Operating Instructions for additional detailed operational and/or
maintenance and troubleshooting instructions. If no solution is found in the manual, contact
Spectrace Instruments for assistance.
An instrument log should be maintained to document specific corrective actions taken to alleviate
any instrumental problems, or for recording any service that has been performed.
6.0 REAGENTS
Generally, calibration standards are not necessary for site screening and extent of contamination analyses with the
Spectrace 9000. Optionally, an application (only the Soil Sample application will be discussed here) can be
optimized or verified to be 1:1 proportional to another analytical (reference) method (see Section 9.3 and 10.1). This
can be done by analyzing a suitable set of Site-Specific Calibration Standards (SSCS) or Standard Reference
Materials (SRMs) and performing a regression analysis on the reference (dependent) and the Spectrace 9000 results
(independent) for each element of concern. SSCS and SRMs must be representative of the sample matrix to be
analyzed by XRF, for example, National Institute of Standards and Technology (NIST) SRMs 2709, 2710, and 2711
for the soil application. In an application, any element's calibration can be adjusted by entering the desired slope
and offset (intercept) in the Adjust Calibration menu. If any element's calibration has been adjusted in an
application, "adj" will appear on the results screen. An adjusted element calibration can always be changed back
to the initial slope and offset values of 1 and 0, respectively.
7.0 PROCEDURE
7.1 Prerequisites
If the Spectrace 9000 will be used in a location where AC power outlets are conveniently accessible,
connect the battery charger to the electronic unit and plug the charger cord into the outlet. The probe cable
must be connected before switching on the power. Plugging and unplugging this cable with the power on
can damage the detector.
To connect the battery, set the electronics unit on its face and use a flat blade screwdriver to loosen the two
one-quarter turn fasteners on the back. Remove the battery pack. Inside, find the cord with the red cap
covering the three-pronged plug. Remove the cap and plug it into the battery pack. Put the battery pack
into the unit and tighten the fasteners.
STANDARD OPERATING PROCEDURES
SOP: 1713
PAGE: 14 of 32
REV: 1.0
DATE: 05/13/99
SPECTRACE 9000 FIELD PORTABLE X-RAY FLUORESCENCE
OPERATING PROCEDURE
Apply power to the Spectrace 9000 by pressing the <ON> button. The electronic unit may not come on
with the battery charger hooked up if the battery has been totally drained. The drained battery may require
a 10 minute charge prior to startup. In a few seconds the display shows the version of software. If
necessary, adjust the contrast knob located on the underside of the front display. This knob can be turned
so far that the display appears blank.
The initial screen displays for about 10 seconds and then a prompt will ask if the time and date are set
correctly. The date MUST be set correctly otherwise serious errors in source-decay compensation can
result. Additionally, results tables include the time and date of analysis. The main menu appears after the
time and date screens.
If a "battery low" message appears, recharge or change the battery before proceeding, or operate the unit
using line voltage.
Allow the Spectrace 9000 to warm up for approximately 30 minutes after it has been turned on before
performing analysis.
7.1.1 Gain Control
Automatic gain compensation is a feature of both Soil and Thin Samples applications, which
allows operation of the instrument over a wide range of ambient temperatures and from one day
to another without standardization. To maintain gain control compensation, it is necessary to
occasionally operate with a minimum acquisition time of 50 seconds on the Cd-109 source. If
the automatic gain control fails or is out of range, an error message will appear on the screen.
If the error message continues to appear after repeat analyses, then the Cd-109 measurement time
should be checked and/or an energy calibration should be performed. If the problem continues,
contact Spectrace Instruments for help.
7.1.2 Setting Data and Spectrum Store/Send Mode
The Set store/send modes option is located in the More screen which can be accessed from the
main menu. Data and/or Spectrum storage must be enabled for automatic on-board storing to
occur. Sufficient memory is available to store up to 300 sets of analysis results and up to 120
spectra (40 samples since each sample has three spectra). When the available memory is full,
the respective spectra or results storage mode is automatically disabled. The spectra or results
memory must be cleared (deleted) and the respective store mode enabled before results and/or
spectra can be stored again.
7.2 General Keys and Menu Software
This section outlines the general keys and basic menu software. Flow charts which describe the menu
structure in detail are located on pages 4-13 through 4-17 in the Spectrace 9000 Operating Instructions.
7.2.1 The Keyboard
The row of numeric keys under the LCD screen performs functions defined by labels (a menu)
STANDARD OPERATING PROCEDURES
SOP: 1713
PAGE: 15 of 32
REV: 1.0
DATE: 05/13/99
SPECTRACE 9000 FIELD PORTABLE X-RAY FLUORESCENCE
OPERATING PROCEDURE
written to the bottom line of the display by the Spectrace 9000 software. As the operator moves
through the various menus, the keys are redefined to provide an efficient user interface.
The keypad to the right of the screen is used for numeric entry. The <Cont/Pause> key (referred
to as the <Cont>) is used:
C to enter information as an <Enter> key
C to begin an analysis
C to pause an analysis in progress
The left arrow <7> key is used to edit entries before pressing <Cont>.
7.2.2 The Measure (Ready) Screen
This main menu selection displays the application name, revision date, measurement time for
each source, and accesses other options (see flow diagrams in Spectrace 9000 Operating
Instructions).
7.2.3 The Choose an Application Screen
This main menu selection lists the applications currently loaded in the unit. Applications are
selected and source measurement times may be modified in this screen (see flow diagrams in
Spectrace 9000 Operating Instructions).
7.2.4 The Review Stored Results Screen
This main menu selection lists the stored results. Up and Down scroll are used on many screens.
When Up and Down are displayed, pressing the <0> (zero) key will toggle to PgUP and PgDN
for rapid movement through long lists. Stored results may be reviewed, deleted, or downloaded
to the COM port (see flow diagrams in Spectrace 9000 Operating Instructions).
7.2.5 The Review Stored Spectra Screen
This main menu selection lists the stored spectra which may be deleted or transmitted to the
COM port (see flow diagrams in Spectrace 9000 Operating Instructions). Spectra may be
displayed in the Examine Spectrum portion of the More screen (accessed from the main menu)
or in the Examine Spectrum selection from the Results screen under the More Options menu
selection.
7.2.6 The More (Other Functions) Screen
This main menu selection lists the following functions:
C Set clock/calendar
C Comm. port setup
C Set store/send modes
STANDARD OPERATING PROCEDURES
SOP: 1713
PAGE: 16 of 32
REV: 1.0
DATE: 05/13/99
SPECTRACE 9000 FIELD PORTABLE X-RAY FLUORESCENCE
OPERATING PROCEDURE
C Application maintenance
C Examine spectrum
7.2.7 The Results Screen
The Results screen is displayed at the end of the analysis. If the automatic Store Results mode
is enabled, the operator will be prompted for sample identification (ID) before the Results screen
is displayed. Up or Down scrolls the screen to view more results. When Up and Down are
displayed, pressing the <0> (zero) key will toggle to PgUP and PgDN for rapid movement
through long lists. Send transmits results to the COM port. Store prompts for an ID and then
stores results in memory. Measr will immediately begin another analysis cycle. Opts displays
the first of two screens listing special options under the Results screen (the second screen is
located under More Opts of the first screen. See flow diagrams in Spectrace 9000 Operating
Instructions). The most frequently used functions are the Examine Spectrum and
Enable/Disable Display Thresholds located on the second screen of options.
7.3 Preoperational Checks
7.3.1 Energy Calibration Check
An energy calibration should be performed after an instrument is shipped and periodically
(approximately every 2-4 weeks) to ensure proper energy calibration. The Energy Calibration
function is located in the Options section of the Measure Screen. The operator will be prompted
to place the safety shield on the probe and then initiate a 600- second analysis that will update
the X-ray energy calibration.
The energy calibration check is performed in the field daily and after an energy calibration to
verify proper energy calibration. To perform an energy calibration check, place the safety shield
on the probe. Select the Soil Samples application and measure the safety shield using a
minimum acquisition time of 60 seconds for each source. Save the results and spectra for
documentation. Select Opts, More Options, and then Examine Spectrum . Examine the
spectrum of each source. Locate and record the centroid KeV (using the x12 horizontal
magnification, X6 for Fe-55) for each of the following peaks:
Source Peak Theoretical Specification
(KeV) (KeV)
Cd-109 Pb L-alpha 10.54 10.50 - 10.58
Pb L-beta 12.61 12.57 - 12.65
Pb L-gamma 14.76 14.72 - 14.80
Source line 22.10 22.06 - 22.14
Fe-55 S K-alpha 2.31 2.29 - 2.33
STANDARD OPERATING PROCEDURES
SOP: 1713
PAGE: 17 of 32
REV: 1.0
DATE: 05/13/99
SPECTRACE 9000 FIELD PORTABLE X-RAY FLUORESCENCE
OPERATING PROCEDURE
Source line 5.89 5.87 - 5.91
Am-241 Pb L-alpha 10.54 10.49 - 10.59
Pb L-beta 12.61 12.56 - 12.66
Source line 59.5 59.3 - 59.7
Perform an Energy calibration (see Spectrace 9000 Operating Instructions) and then do another
energy calibration check if any of the peaks fail to meet specification. The energy calibration
check should be performed once at the beginning of the day, after an energy calibration, after
loading an application, and whenever the instrument exhibits a persistent drift.
7.3.2 Resolution Check
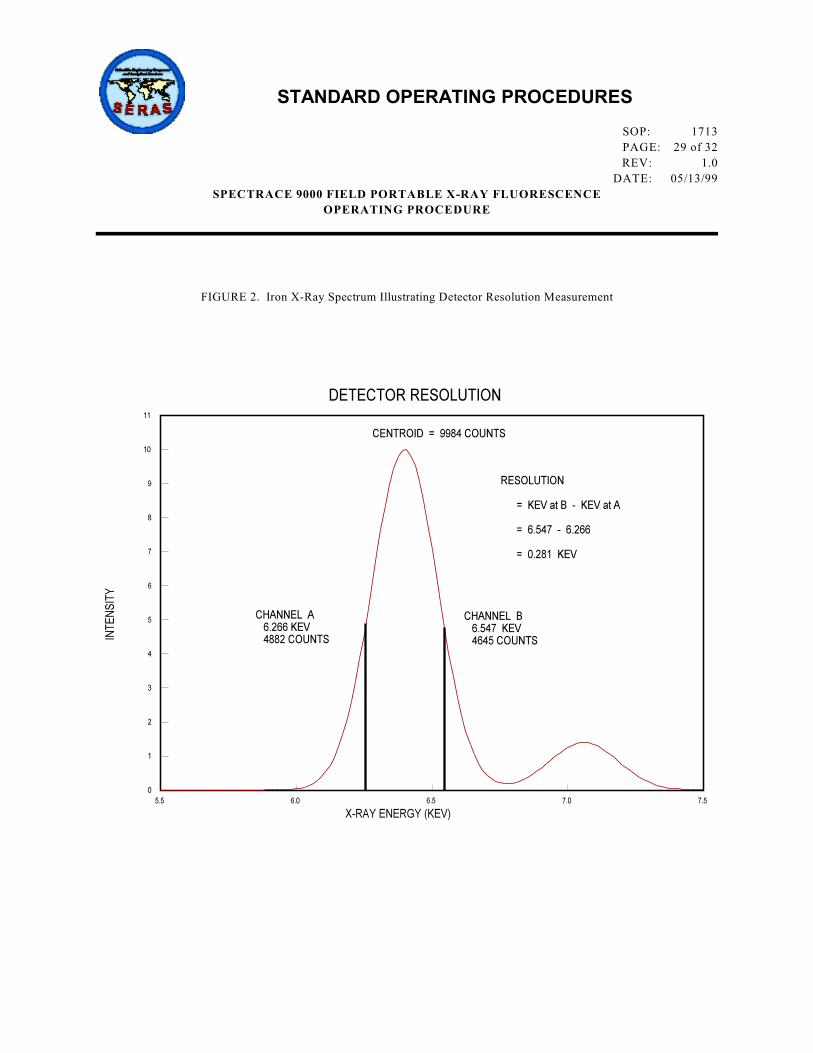
The resolution check examines the detector's ability to resolve X-ray energies. This should be
performed once at the beginning of the day. Select the Soil Samples application, and measure
a sample of pure iron using a minimum acquisition time of 60 seconds for the Cd-109 source.
Save the results and spectra for documentation. Select Examine spectrum under the More
Options section of the Results screen. Examine the Cd-109 spectrum. Locate and record the
maximum peak counts (must be >1000 counts) of the iron K-alpha peak (6.4 KeV) using the x12
horizontal magnification (see Figure 2, Appendix A). Divide the maximum peak counts by two.
Examine the right (high energy) side of the peak and record the counts and KeV of the channel
with counts less than or equal to one-half the maximum peak count value (channel B, Figure 2).
Examine the left (low energy) side of the peak and record the counts and KeV of the channel
with counts less than or equal to one-half the maximum peak count value (channel A, Figure 2).
Subtract the left-side KeV from the right-side KeV (KeV at B - Kev at A, Figure 2). The
difference should be less than 0.300 KeV. If the unit fails to meet this specification, call
Spectrace Instruments for assistance.
7.3.3 Blank (Zero) Sample Check
The blank (Zero) sample check is performed to monitor the instrument's zero drift in the selected
application. The blank sample check and the Aquire Background Data operation (discussed
below) only apply to the application currently selected. This should be done once at the
beginning of the day, after an energy calibration, after loading an application, and whenever the
instrument exhibits a persistent drift on a blank or low-level sample.
Mount the probe in the laboratory stand and select the Soil Samples application. Disable the
display thresholds. This will permit results less than one standard deviation (STD) to be
displayed (even negatives). Measure the quartz blank provided with the unit (or a "clean" sand
sample) using a minimum acquisition time of 60 seconds for each source. Review the results
table. All elemental results for target elements with atomic number 24 (Cr) and higher in the
periodic table should be within 3 standard deviations of zero (0 ± 3 @ |STD|); all non-target
element results should be within 5 standard deviations (0 ± 5 @ |STD|). Repeat the measurement
if the unit fails to meet these specifications. If several elements continue to be significantly out
of these specifications, check the probe window and the blank sample for contamination or
perform the Acquire background data operation located in the Measure (Ready) screen option.
STANDARD OPERATING PROCEDURES
SOP: 1713
PAGE: 18 of 32
REV: 1.0
DATE: 05/13/99
SPECTRACE 9000 FIELD PORTABLE X-RAY FLUORESCENCE
OPERATING PROCEDURE
Perform the blank (Zero) sample check again. Save the results and spectra for documentation.
Enable the display thresholds prior to sample analysis after the blank sample check procedure
is completed.
7.3.4 Target Element Response Check
The purpose of the target element response check is to ensure that the instrument and the selected
application are working properly prior to performing sample analysis. This check should be
performed at the beginning of the day. Use low, mid, and high samples, or standards with known
concentrations for some or all of the target elements to be checked. Select a low sample near the
quantitation limit of the target elements. Select a mid sample near the site action level and a high
sample near the maximum concentration of the target elements expected on site.
These samples should be measured using the same source acquisition times that will be used for
sample analysis. Save the sample check results and spectra for documentation.
7.4 Selecting Source Measuring Time
The source measuring time may be modified under the Measure screen. Zero (seconds) measuring time
should never be selected for any source for any application. Generally, the element detection limit
is reduced by 50 percent for every four-fold (x4) increase in source measuring time. Although counting
statistics improve as measurement time increases, the practical upper limit for typical applications is 600
to 800 seconds. The elements are grouped together according to the radioisotope used for their excitation
with typical minimum detection limits shown in Sections 7.4.2. and 7.4.3.
Automatic gain compensation is a feature of both the Soil and Thin Samples applications and allows
operation of the instrument over a wide range of ambient temperatures and from one day to another
without standardization. To maintain this gain control compensation, it is necessary to occasionally
operate with a minimum acquisition time of 50 seconds on the Cd-109 source.
The Real/live option toggles between real time (elapsed clock time) and live time (actual time the
instrument is counting). The latter adds time to the analysis to correct for the time the system is busy
processing pulses.
7.4.1 Minimum Source Measuring Times
A minimum measuring time (real or live) of 15 seconds for the Fe-55 source, 30 seconds for the
Cd-109 source, and 10 seconds for the Am-241 source is recommended when using the Soil
Samples application. Measuring times for a source that excites a target element can be increased
if lower detection limits are required.
When using the Thin Samples application, the measuring time for any source may be reduced
to 10 seconds if the source does not excite a target element since this application does not correct
for interelement effects. If a source excites a target element, a minimum measuring time (real
or live) of 60 seconds for the Fe-55 source, 60 seconds for the Cd-109 source, and 120 seconds
for the Am-241 source is recommended.
STANDARD OPERATING PROCEDURES
SOP: 1713
PAGE: 19 of 32
REV: 1.0
DATE: 05/13/99
SPECTRACE 9000 FIELD PORTABLE X-RAY FLUORESCENCE
OPERATING PROCEDURE
A minimum of 60 seconds is recommended for the Cd-109 source when using the PbK in Paint
application.
7.4.2 Typical Minimum Detection Limits (MDLs) for the Soil Samples Application
For source measuring times of 60 seconds, typical element MDLs (in milligram per kilogram,
mg/kg) for the Soil Samples application are:
Source Element MDL (mg/kg)
Fe-55 Potassium (K) 325
Calcium (Ca) 150
Titanium (Ti) 110
Chromium (CrLo) 180
Cd-109 Chromium (CrHi) 525
Manganese (Mn) 410
Iron (Fe) 225
Cobalt (Co) 205
Nickel (Ni) 125
Copper (Cu) 90
Zinc (Zn) 70
Mercury (Hg) 60
Arsenic (As) 50
Selenium (Se) 35
Lead (Pb) 30
Rubidium (Rb) 10
Strontium (Sr) 10
Zirconium (Zr) 10
Molybdenum (Mo) 10
Am-241 Cadmium (Cd) 180
Tin (Sn) 100
Antimony (Sb) 65
Barium (Ba) 20
NOTE: These typical MDLs are provided as an aid for selecting source measurement times;
observed values for a given situation may vary depending on the matrix of the soil standard used
to calculate MDLs, age of sources, moisture content, and other factors discussed in Section 4.
Generally, the detection limit is reduced by 50 percent for every four-fold (x4) increase in source
measuring time. Additionally, more elements may be added to the Soil Samples application.
Contact Spectrace Instruments for information about modifications to applications.
7.4.3 Typical Minimum Detection Limits (MDLs) for the Thin Samples Application
For source measuring times of 200 seconds for the Fe-55 and Cd-109 sources, and 800 seconds
for the Am-241 source, typical element MDLs (in microgram per square centimeter, :g/cm ) for
the Thin Samples application are:
2
STANDARD OPERATING PROCEDURES
SOP: 1713
PAGE: 20 of 32
REV: 1.0
DATE: 05/13/99
SPECTRACE 9000 FIELD PORTABLE X-RAY FLUORESCENCE
OPERATING PROCEDURE
2Source Element MDL (:g/cm )
Fe-55 Potassium (K) 0.40
Calcium (Ca) 0.20
Titanium (Ti) 0.15
Chromium (CrLo) 0.40
Cd-109 Chromium (CrHi) 0.90
Manganese (Mn) 0.65
Iron (Fe) 0.65
Cobalt (Co) 0.50
Nickel (Ni) 0.30
Copper (Cu) 0.65
Zinc (Zn) 0.40
Mercury (Hg) 0.45
Arsenic (As) 0.40
Selenium (Se) 0.15
Lead (Pb) 0.50
Rubidium (Rb) 0.10
Strontium (Sr) 0.10
Zirconium (Zr) 0.15
Molybdenum (Mo) 0.10
Am-241 Cadmium (Cd) 2.5
Tin (Sn) 2.5
Antimony (Sb) 1.5
Barium (Ba) 0.70
NOTE: These typical MDLs are provided as an aid for selecting source measurement times;
observed values for a given situation may vary depending on the thin sample standard used to
calculate MDLs, age of sources, and other factors discussed in Section 4.
Generally, the detection limit is reduced by 50 percent for every four-fold (x4) increase in source
measuring time. Use of thick filters or filters with high background or contamination will result
in higher MDLs and require a background subtraction. Additionally, more elements may be
added to the Thin Samples application. Contact Spectrace Instruments for information about
modifications to applications.
7.5 Sample Handling and Presentation
When making XRF measurements, be sure to maintain constant measurement geometry in order to
minimize variations in analysis results. Document any anomalies in measurement geometry, sample
surface morphology, moisture content, sample grain size, and matrix (see Section 4.0).
7.5.1 Soil Samples
Soil samples may be analyzed either in-situ or in X-ray sample cups (after preparation). The Soil
Samples application assumes the sample to be infinitely thick. For in-situ measurements this is
almost always the case. However, for sample cup measurements it is advisable to fill the cup
nearly full and tap it on the bench to compact the soil. This ensures that the sample is as
STANDARD OPERATING PROCEDURES
SOP: 1713
PAGE: 21 of 32
REV: 1.0
DATE: 05/13/99
SPECTRACE 9000 FIELD PORTABLE X-RAY FLUORESCENCE
OPERATING PROCEDURE
uniformly thick as possible from analysis to analysis. The Spectrace 9000 laboratory stand and
safety shield should be used when analyzing sample cups.
An area for in-situ analysis should be prepared by removing large rocks and debris. The soil
surface should be rendered flat and compact prior to analysis. The Spectrace 9000 probe should
be held firmly on the ground to maximize instrument contact with the ground. The probe should
not be moved during analysis. Analysis of water saturated soils should be avoided. A thin layer
of 0.2-mil polypropylene XRF film may be mounted on the surface probe to minimize
contamination. Use of varying thicknesses of plastic (bags) have been shown to interfere in the
light element (low atomic number) measurement and may affect the FP calibration of the other
element concentrations.(2) Additionally, plastic may contain significant levels of target element
contamination.
Course-grained soil conditions or nuggets of contaminated material may preclude a truly
representative sample and adversely affect the analysis results (typically by under reporting the
target element). Such samples should be prepared before analysis. Preparation consistency is
important to minimize variation in analytical results.
This application is specifically designed for soil with the assumption that the balance of the
material is silica. If samples with a much lighter (lower atomic number) balance are analyzed,
the results will typically be elevated by a factor of two to four. Contact Spectrace Instruments
for help in analysis of different matrices.
7.5.2 Thin (Filter) Samples
The Thin Samples application is for analysis of thin samples such as filters or wipes. The
detection limits are affected by the thickness of the substrate. Best results are obtained on the
thinnest substrates. Always use the probe safety cover when measuring thin samples. This is
not only for user safety, but also ensures a controlled background environment and provides a
reference signal for the automatic gain control. Probe safety covers should never be interchanged
between instruments.
Filters and wipes should be prescreened before use to establish background and contamination
levels. Care should be used to prevent zinc oxide contamination from disposable gloves. Small
37-mm filters can be mounted between two layers of 0.2-mil thick polypropylene XRF film on
40-mm XRF cups for analysis. Larger filters can be placed on the probe with a sheet of 0.2- mil
thick polypropylene XRF film between the filter and probe surface to prevent the window from
being contaminated, and the probe safety cover should be placed over the filter prior to analysis.
Filters should be presented loaded side down and wrinkle free.
7.5.3 Lead in Paint
The area selected for analysis should be smooth, representative and free of surface dirt. The
Spectrace 9000 probe should be held firmly on the surface to maximize instrument contact. The
probe should not be moved during analysis.
When used for specimen application (e.g., on paint chips or nonbacked films) remember to use
the probe safety cover. In the PbK Application, a thick neutral sample, such as the quartz disk
STANDARD OPERATING PROCEDURES
SOP: 1713
PAGE: 22 of 32
REV: 1.0
DATE: 05/13/99
SPECTRACE 9000 FIELD PORTABLE X-RAY FLUORESCENCE
OPERATING PROCEDURE
(blank), should be positioned behind the specimen before the safety lid is closed. Otherwise, the
PbK X-rays excited in the safety cover will be sensed by the detector. In this application, do not
perform the Acquire background data option from the list of options under the Ready screen.
8.0 CALCULATIONS
The Spectrace 9000 is a direct readout instrument that does not require any calculations.
9.0 QUALITY ASSURANCE/QUALITY CONTROL
9.1 Precision
The precision of the method is monitored by reading a low- or mid-target element concentration sample
(or SSCS or SRMs selected as described in Sections 6.0) at the start and end of sample analysis and after
approximately every tenth sample. (A daily total of seven measurements is recommended.) Determining
the precision around the site action level can be extremely important if the XRF results are to be used in
an enforcement action. Therefore, selection of a sample with a target element concentration at or near the
site action level or level of concern is recommended. The sample is analyzed by the instrument for the
normal field analysis time, and the results are recorded. The standard deviation for each target element
is calculated. The relative standard deviation (RSD) of the sample mean can be used to calculate precision.
The RSD should be within ± 20 percent for the data to be considered adequately precise.(3)
9.1.1 The Method Detection Limit (MDL) and Method Quantitation Limit (MQL)
The MDL and MQL may be calculated from the measurement of either a low or blank sample,
(or a SSCS or SRMs selected as described in section 6.0), at the start and end of sample analysis,
and after approximately every tenth sample (a daily total of seven measurements is
recommended). Alternatively, the quartz blank or "clean" sand may be used if a blank soil or
sediment sample is unavailable.
Disable the display thresholds. This will permit results less then one standard deviation (STD)
to be displayed (even negatives). Measure the sample using the same application and measuring
time used for the samples. Enable the display thresholds prior to analyzing the next sample.
The sample standard deviation of the mean for each target element is calculated. If the standard
deviation has a fractional component, round up to the next whole number prior to calculating the
MDL and MQL.
The definition of the MDL is three times the calculated standard deviation value.
The definition of the MQL is 10 times the calculated standard deviation value.
9.2 Reporting Results
All raw XRF data should be reported including the individual results of multiple analyses of samples and
sampling points. The average and concentration range of each multiple analysis should also be reported.
A "reported" value for each analysis or average of multiple analyses should be processed in the following
manner.
STANDARD OPERATING PROCEDURES
SOP: 1713
PAGE: 23 of 32
REV: 1.0
DATE: 05/13/99
SPECTRACE 9000 FIELD PORTABLE X-RAY FLUORESCENCE
OPERATING PROCEDURE
1. Round the value to the same degree of significance contained in the SSCS or SRM sample assay
values (usually two) if the element's calibration has been adjusted (see Section 6.0). Round to
2 significant figures for sample results. DO NOT round results for standards used to determine
MDL or RSD values (use raw data).
2. Report all values less than the MDL as not detected (U).
3. OPTIONAL: Flag and note all values greater than or equal to the MDL and less than the MQL
(usually with a "J" next to the reported value).
4. Report all values equal to or greater than the MDL and within the linear calibration range (if the
element's calibration has been adjusted, see section 6.0).
5. If SSCS were used and the calibration was adjusted, flag and note all values above the linear
calibration range (ie, values greater than the highest concentration used in the calibration
adjustment procedure).
9.3 Accuracy
Accuracy, relative to a specific digestion method and elemental analysis procedure, is determined by
submitting an XRF analyzed sample (prepared sample cups may be submitted) for AA or ICP analysis
at a laboratory.
The on-site analysis of soils by XRF instrumentation should be considered a screening effort only (QA1
data). Data derived from the instrument should be used with discretion. Confirmatory analyses on a
subset of the screening samples (minimum 10 percent) can be used to determine if the XRF data meets
QA2 data objectives. The confirmation samples should ideally be selected randomly from the sample set
and include a number of samples at or near the critical level. The results of the metal analysis (dependent) 2and the XRF analysis (independent) are evaluated with a regression analysis. The correlation factor (R )
should be 0.7 or greater.(3)
XRF results may be multiplied by the slope prior to substitution for metal analysis results in contouring,
kriging programs, or removal volume estimates. Correcting the XRF results based on confirmatory
analyses should only be undertaken after careful consideration. It must be understood that the
confirmatory analysis (AA or ICP) is an estimate of the concentration of metal contamination and is
dependent upon the specific instrumentation and sampling methodology used. Since XRF is a total
elemental technique, any comparison with referee results must account for the possibility of variable
extraction, dependent upon the digestion method used and its ability to dissolve the waste or mineral form
in question.
9.3.1 Matrix Considerations
Other types of QA/QC verification should include verification that the instrument calibration is
appropriate for the specific site to be assessed. This includes verification of potential multiple
soil matrix types that may exist at a site. Matrix differences which affect the XRF measurement
include large variations in calcium content, which may be encountered when going from
siliceous to calcareous soils, as well as large variations in iron content.
10.0 DATA VALIDATION
STANDARD OPERATING PROCEDURES
SOP: 1713
PAGE: 24 of 32
REV: 1.0
DATE: 05/13/99
SPECTRACE 9000 FIELD PORTABLE X-RAY FLUORESCENCE
OPERATING PROCEDURE
10.1 Confirmation Samples
Confirmation samples are recommended at a minimum rate of 10 percent and are required if QA2 data
objectives have been established for site activities.(3) Ideally, the sample cup that was analyzed by XRF
should be the same sample that is submitted for AA/ICP analysis. When confirming an in-situ analysis,
collect a sample from a 6-inch by 6-inch area for both an XRF measurement and confirmation analysis.
The XRF and metals results are analyzed with a regression analysis using a statistical program (such as
SAS®) or a spreadsheet with the intercept calculated in the regression. The correlation factor (coefficient
of determination, COV) between XRF and AA/ICP data must be 0.7 or greater for QA2 data objectives.(3)
10.2 Recording Results
Record all results and monitoring activities in a laboratory or field notebook. Alternatively, record results
electronically on a hard drive or floppy disk.
10.3 Downloading Stored Results and Spectra
Results (analytical reports) and spectra which have been stored in the Spectrace 9000 internal memory
should be downloaded and captured in disk files on a PC (see section 5). Spectrace Instruments provides
software for this purpose. Additionally, they provide software to prepare results or spectra for importing
into a spreadsheet. Refer to the instructions provided with the programs for details on their operation.
Alternatively, other software with terminal data logging capabilities may be used to capture results and
spectra to disk files.
After capturing results to a file, print a copy and save both the disk files and the printout for future
reference and documentation purposes.
11.0 HEALTH AND SAFETY
When working with potentially hazardous materials, follow U.S. EPA, OSHA, corporate and/or any other applicable
health and safety practices.
STANDARD OPERATING PROCEDURES
SOP: 1713
PAGE: 25 of 32
REV: 1.0
DATE: 05/13/99
SPECTRACE 9000 FIELD PORTABLE X-RAY FLUORESCENCE
OPERATING PROCEDURE
12.0 REFERENCES
(1) U.S. EPA/ERT, "Representative Sampling Guidance, Volume 1 - Soil," November, 1991 (OSWER
Directive 9360.4-10).
(2) Kalnicky, Dennis, "Effects of Thickness Variations on XRF Analyses of Soil Samples When Using Plastic
Bags as Measurement Containers," U.S. EPA Contract No. 68-03-3482, March, 1992.
(3) U.S. EPA/ERT, Quality Assurance Technical Information Bulletin. "Field-Portable X-Ray Fluorescence,"
Volume 1, Number 4, May, 1991.
13.0 BIBLIOGRAPHY
1. Spectrace 9000 Portable XRF Analyzer Operating Instructions, Revision 0.3, January, 1992.
2. Bernick, Mark , P. Berry, G. Voots, G. Prince, et. al. , "A High Resolution Portable XRF HgI 2
Spectrometer for Field Screening of Hazardous Metal Wastes," Pacific-International Congress on X-ray
Analytical Methods, August, 1991.
3. Bernick, Mark "Thin Film Standard Evaluation of the OEI X-MET 880 HEPS Probe and the Spectrace
9000 Field Portable X-ray Fluorescence Analyzers," U.S. EPA Contract No. 68-03-3482, March, 1992.
4. Andreas, C.M. and W. Coakley, "X-ray Fluorescence Spectrometry: Uses and Applications at Hazardous
Waste Sites," HMCRI Research and Development Conference, San Francisco, California, February, 1992.
5. P. Berry, S. Little, G. Voots, M. Bernick, G. Prince, "XRF Determination of Lead in Paint, Soil, and
Sampled Particulates with Field Portable Instrumentation", American Chemical Society-Division of
Environmental Chemistry, August, 1992.
6. Bernick, Mark, D. Idler, L. Kaelin, D. Miller, J. Patel, G. Prince, "An Evaluation of Field Portable XRF
Soil Preparation Methods," Second International Symposium on Field Screening Methods for Hazardous
and Toxic Chemicals, February, 1991.
7. Dzubay, T. Ed, "X-ray Fluorescence Analysis of Environmental Samples," Ann Arbor Science, 1977, p.
310.
8. Chappell, R., Davis, A., Olsen, R, "Portable X-ray Fluorescence as a Screening Tool for Analysis of Heavy
Metals in Soils and Mine Wastes," Proceedings Conference Management of Uncontrolled Hazardous
Waste Sites, Washington, D.C., 1986, p 115.
9. Piorek, Stan, Rhodes, J., "A New Calibration Technique for X-ray Analyzers Used in Hazardous Waste
Screening," Proceedings 5th National RCRA/Superfund Conference, April 1988, Las Vegas, NV.
10. "Data Quality Objectives for Remedial Response Activities," EPA\540\G-87\004, March 1987.
11. Rhodes, J., Stout, J., Schlinder, J., and Piorek, S., "Portable X-ray Survey Meters for In-Situ Trace
Element Monitoring of Air Particulates," American Society for Testing and Materials, Special Technical
Publication 786, 1982, pp. 70 - 82.
STANDARD OPERATING PROCEDURES
SOP: 1713
PAGE: 26 of 32
REV: 1.0
DATE: 05/13/99
SPECTRACE 9000 FIELD PORTABLE X-RAY FLUORESCENCE
OPERATING PROCEDURE
12. Piorek, S., Rhodes, J., "In-Situ Analysis of Waste Water Using Portable Pre-concentration Techniques and
a Portable XRF Analyzer," Presented at the Electron Microscopy and X-ray Applications to
Environmental and Occupational Health Analysis Symposium, Penn. State Univ., Oct. 14 - 17, 1980.
13. Piorek, S., Rhodes, J., "Hazardous Waste Screening Using a Portable X-ray Analyzer," Presented at the
Symposium on Waste Minimization and Environmental Programs within D.O.D., American Defense
Preparedness Assoc., Long Beach, CA., April 1987.
14. "Field-Portable X-Ray Fluorescence," U.S. EPA/ERT Quality Assurance Technical Information Bulletin,
Vol. 1, No. 4, May 1991.
15. Kalnicky, D., "Effects of Thickness Variations on XRF Analyses of Soil Samples When Using Plastic
Bags as Sample Containers," U.S. EPA Contract no. 68-03-3482, March, 1992.
16. Kalnicky, D., "Hazardous Materials Characterization with Field Portable XRF: Observations and
Recommendations," U.S. EPA Contract no. 68-03-3482, March, 1992.
17. Kalnicky, D., "XRF Method Development, Analysis of PCB in Oil Using Field Portable XRF
Instrumentation," U.S. EPA Contract no. 68-03-3482, July, 1992.
18. Kalnicky, D. J., Patel, J., and Singhvi, R., "Factors Affecting Comparability of Field XRF and Laboratory
Analyses of Soil Contaminants," presented at the Denver X-ray Conference, Colorado Springs, CO,
August, 1992.
19. Kalnicky, D. J., Soroka, J. M., Singhvi, R., and Prince, G., “XRF Analyzers, Field-Portable,” in
Encyclopedia of Environmental Analysis and Remediation, R. A. Meyers, ed., John Wiley & Sons, Inc.,
New York, 1998, Vol. 8, pp. 5315-5342, ISBN 0-471-11708-0.
STANDARD OPERATING PROCEDURES
SOP: 1713
PAGE: 27 of 32
REV: 1.0
DATE: 05/13/99
SPECTRACE 9000 FIELD PORTABLE X-RAY FLUORESCENCE
OPERATING PROCEDURE
APPENDIX A
Figures
SOP #1713
April 1999
STANDARD OPERATING PROCEDURES
SOP: 1713
PAGE: 28 of 32
REV: 1.0
DATE: 05/13/99
SPECTRACE 9000 FIELD PORTABLE X-RAY FLUORESCENCE
OPERATING PROCEDURE
FIGURE 1. X-Ray Spectral Plot Showing Overlap of Vanadium K X-Rays in the Chromium K Measurement Region. ß "
STANDARD OPERATING PROCEDURES
SOP: 1713
PAGE: 29 of 32
REV: 1.0
DATE: 05/13/99
SPECTRACE 9000 FIELD PORTABLE X-RAY FLUORESCENCE
OPERATING PROCEDURE
FIGURE 2. Iron X-Ray Spectrum Illustrating Detector Resolution Measurement


![Personal Computer CF-51 Series · 2 Click [Stand by] or [Hibernate] for [When I clo se the lid of my portabl e computer:] / [When I press the power button on my computer:], and then](https://img.pdfslide.net/doc/110x75/5f0455487e708231d40d75c9/personal-computer-cf-51-series-2-click-stand-by-or-hibernate-for-when-i-clo.jpg)