Embed Size (px)
Citation preview

SOUTHWEST MAUI WATERSHED PLAN
VOLUME II
IMPLEMENTATION AND MANAGEMENT STRATEGIES

SOUTHWEST MAUI WATERSHED PLAN
FUNDED BY:
HAWAII STATE DEPARTMENT OF HEALTH &
UNITED STATES ENVIRONMENTAL PROTECTION AGENCY
PREPARED FOR:
CENTRAL MAUI SOIL AND WATER CONSERVATION DISTRICT
& SOUTHWEST MAUI WATERSHED ADVISORY GROUP
PREPARED BY:
WATER QUALITY CONSULTING, INC
February 2013
EPA and DOH Disclaimer
The following disclaimer statement must be included as a condition of the grant funding: “This project has been jointly funded by the U.S. Environmental Agency (EPA) under Section 319(h) of the Clean Water Act (CWA), and the Hawaii State Department of Health (DOH) Clean Water Branch. Although the information in this document has been funded wholly or in part by a Federal Grant to the DOH, it may not necessarily reflect the views of the EPA and the DOH and no official endorsement should be inferred.”

Acknowledgements
Our thanks to the contributing stakeholders, whose input led to the development of this Watershed Plan. We are especially grateful to our Water Resource Engineer, Dr. Mohammad Tufail, for his technical support and guidance and to the Maui Conservation Specialists, John Astilla and Kira Nims (former and current). We also acknowledge the Department of Health (DOH) Clean Water Branch, Polluted Runoff Control Staff for their assistance and patience in the development of this Watershed Plan.
Individuals Lee Altenberg Michelle Anderson Tui Anderson Roland Asakura John Astilla Noelle Aviles Flo Bahr Jeanice Barcelo Cindy Barger Norma Lynn Barton Karen Bennett Shanti Berg Joe Bertram III Ann Blyde Dale Bonar Amy Bowman Michael Brady Monroe Bryce Dustyn Buchanan August John Buck Andrea Buckman Marti Buckner Julie-Ann Cachola Patricia Cadiz Luisa Castro Rhiannon Chandler Jennifer Chirico Athline Clark Jennifer Clarke Dan Clegg Walter Clur Alison Cohan Frannie Coopersmith Joyclynn Costa Rowena Dagdag-Andaya Meghan Dailer Lucienne deNaie Alex Deroode Lance DeSilva Sumner Erdman Tia Ferguson Emily Fielding Liz Foote Rory Frampton
Alex Franco Jacob Freeman Kristen Freeman Grace Fung Stuart Funke-d’Egnuff Ranae Ganske-Cerizo Mercedes Garcia Far Garcia Robles Charlene Griffin Brett Gobar John Gorman Mary Groode Netra Halperin Ruby Hastings Skippy Hau Adele Haywood Harry Hecht Iuri Herzfeld Michael Howden Pat Hoskin Charles Hunt Mark Hyde Victoria Johnson Kevin Jones Daniel Kanahele Pamela Kantarova Kimokeo Kapahulehua Ke`eaumoku Kapu Keone Billy King Maury King Robin Knox Paul Koehler Ellen Kraftsow Maggie Kramp Denise Laitinen Doylene (Dee) Larson Teri Leonard Tom Lewicke Rick Long Doug MacCluer Dave Mackwell Pam Madan Sasha Madan Joe Maestre Tom Mann
Edna Manzano Iris Matsumoto Rose Matsumoto Dick Mayer Scott Meidell Iokepa Meno Patty Miller Mike Miyamoto Mike Moran Ron Montgomery Ricky Murray Glynnis Nakai Robin Newbold Kira Nims Mia Nykoluk Charleston Sean O'Keefe Cheryl Okuma Paul Otani Steve Parabicoli Kachina Palencia Rob Parsons Wendy Peterson Pam Pogue Deborah Pozin Dennis Reep Richard Renn George Rixey Eileen Robb Scott Rollins Cole Santos Janet Schoenhaus Hudson Slay Dana Lynn Smith Russell Sparks Hugh Starr Julia Staley John Seebart Gerritt Steenbergen Cheryl Sterling Larry Stevens Jennifer Stites David Stoltzfus Greg Stratton Drew Sulock Richard Sylva Roxie Sylva
Dave Taylor Forrest Taylor Joie Taylor Mohammad Tufail Rene Umberger Myia Wannemiller Pat Ware Bill Watts Megan Webster Maggie Welker Rob Wheeler Darla White Gene Zarro Theresa Zipf Entities Central Maui SWCD Haleakala Ranch Ka’ono’ulu Ranch Kihei Community Association Kula Community Association Maui Surfrider Foundation Thompson Ranch Ulupalakua Ranch Leeward Haleakala Watershed Restoration Partnership Whole Foods

I APRIL 11, 2013
TABLE OF CONTENTS
1.0 EXECUTIVE SUMMARY .................................................................................................1-1
2.0 INTRODUCTION .............................................................................................................2-3 2.1 Estimate Pollutant Loads ......................................................................................2-5
2.1.1 Watershed Modeling .............................................................................2-6
2.1.2 Rainfall-Runoff Modeling .......................................................................2-7
2.1.3 Water Quality Modeling .........................................................................2-9
2.1.4 Recommendations for Future Work ..................................................... 2-10 2.2 Set Goals and Identify Load Reductions............................................................. 2-10
3.0 MANAGEMENT STRATEGIES…. ................................................................................. 3-12 3.1 Pollution Control Strategies ................................................................................ 3-12
3.2 Implementation Strategies .................................................................................. 3-13
4.0 DSILT PROJECTS ........................................................................................................ 4-14 4.1 Excavated Basins in Series ................................................................................ 4-14
4.2 High Impact Zone Mitigation Sites ...................................................................... 4-17
4.3 Riparian Protection and Restoration ................................................................... 4-19
4.4 Unpaved Roads ................................................................................................. 4-23
4.5 Grazing Management Measures ........................................................................ 4-23
4.6 Pi’ilani Basin Utilization Strategy ........................................................................ 4-26
5.0 WATER REUSE ............................................................................................................ 5-27 5.1 Expansion of R-1 Reuse Area ............................................................................ 5-27
6.0 BEST MANAGEMENT PRACTICES (BMPS) ................................................................ 6-29
7.0 REEF REJUVENATION ................................................................................................ 7-30
8.0 EDUCATION AND OUTREACH PLAN.......................................................................... 8-37
9.0 MONITORING PLAN ..................................................................................................... 9-39
10.0 CONCLUSIONS AND RECOMMENDATIONS .......................................................... 10-40
11.0 REFERENCES .......................................................................................................... 11-42
APPENDIX A. SOUTHWEST MAUI WATERSHED PLAN POSSIBLE IMPLEMENTATION MAPS .......................................................................................... A-1
APPENDIX B. SOUTHWEST MAUI WATERSHED SUB-BASIN MAPS ...................... B-1
APPENDIX C. RAINFALL DATA (INTENSITY AND IDF CURVES) ............................. C-1 1. Rainfall Data for all Sub-basins ............................................................................. D-1
2. IDF Curves ............................................................................................................ D-2
APPENDIX D. HYDROLOGIC MODELING METHODS ............................................... E-8 1. Rational Method .................................................................................................... E-8
2. HEC-HMS Model for Sub-basins ........................................................................... E-9
APPENDIX E. HYDROGRAPHS FOR SUB-BASINS BY SCS HYPOTHETICAL STORM (TYPE-1)……… ......................................................................................................... F-16
LIST OF TABLES
Table 2-1 Details of Sub Basins ...............................................................................................2-7
II APRIL 11, 2013
Table 2-2 Comparison of Peak discharges using different methods .........................................2-8
Table 2-3 24-Hour runoff volume for sub-basin ........................................................................2-9
Table 4-1 Major Permits Required for Project Installation ....................................................... 4-17
Table 7-1 Implementation Strategy Matrix .............................................................................. 7-34
Table 11-1 Rainfall Intensities for each Sub-Basin .................................................................. D-1
Table 11-2 Rainfall Depths for each Sub-Basin ....................................................................... D-1
Table 11-3 Runoff Coefficient C values ................................................................................... E-8
Table 11-4 Peak Discharge for each sub-basin based on Rational Method of Peak DischargeE-9
Table 11-5 Time of Concentration, Lag time and Curve Number (CN) for Sub-Basins ............ E-9
Table 11-7 Selected 24 hour rainfall depths for SCS Hypothetical storm method .................. E-15
Table 11-8 Peak discharge using SCS Curve Number method (Hypothetical storm Type I) .. E-15
LIST OF FIGURES
Figure 2-1 Conceptual Model ...................................................................................................2-4
Figure 2-2 Rainfall Runoff Model as a Surface Water Budget Model ........................................2-7
Figure 4-1 "String of Pearls" Excavated Detention Schematic ................................................ 4-13
Figure 4-2 Waikamoi Intakes: Side Intake, West Intake, & East Intake (Respectively) ........... 4-14
Figure 4-3 High Impact Zone Mitigation Site Schematic ......................................................... 4-17
Figure 4-4 Pi'ilani Mauka Detention Basin .............................................................................. 4-23
Figure 4-5 Drainage Structures at Pi'ilani Mauka Detention Basin .......................................... 4-23
Figure 4-6 42" Diameter Drain Outlet Structure ...................................................................... 4-23
Figure 7-1 Reef restored with GCRA Biorock® Technology. .................................................. 7-30
Figure 11-1 Average Velocities for Estimating Time for Shallow Concentrated Flow ............. E-14

III APRIL 11, 2013
LIST OF ACRONYMS AND ABBREVIATIONS
AEHR Annual Erosion Hazard Rates ALISH Agricultural Lands of Importance in the State of Hawaii AURORA Autonomous Unmanned Remote Monitoring Robotic Airship BLM Bureau of Land Management BMPs Best Management Practices C-CAP Coastal Change Analysis Program CWA Clean Water Act CMSWCD Central Maui Soil and Water Conservation District CFS Cubic Feet per Second CFU Colony Forming Unit COM County of Maui CORAL Coral Reef Alliance CSC Coastal Services Center CTAHR University of Hawaii College of Tropical Agriculture and Human Resources CWB Clean Water Branch CWC Clean Water Committee CWD Community Work Day CWRM Commission on Water Resource Management CZMA Coastal Zone Management Area DAR Division of Aquatic Resources DEM Digital Elevation Model DHHL Department of Hawaiian Homelands DLNR Department of Land and Natural Resources DOFAW Department of Fish and Wildlife DOH Hawaii Department of Health DPW Department of Public Works DSILT Detained Stormwater Infiltration using Low Technology DWS Department of Water Supply EMC Estimated Mean Concentration EN El Niño EPA U.S. Environmental Protection Agency FEMA Federal Emergency Management Agency FTU Formazin Turbidity Unit HAR Hawaii Administrative Rules HAWP Hawaii Association of Watershed Partnerships HCRI Hawaii Coral Reef Initiative HEC-HMS Hydrologic Engineering Center-Hydrologic Modeling System HFRA Healthy Forest Restoration Act HIHWNMS Hawaii Humpback Whale National Marine Sanctuary HRS Hawaii Revised Statutes

IV APRIL 11, 2013
HUC Hydrologic Unit Code HWEA Hawaii Water Environment Association HWWA Hawaii Water Works Association KCA Kula or Kihei Community Association LHWRP Leeward Haleakala Watershed Restoration Partnership LICH Landscape Industry Council of Hawaii LIDAR Light Detection and Ranging MGD Million Gallons per Day MNMRC Maui Nui Marine Resource Council MRTP Maui Research and Technology Park MSL Mean Sea Level NEMO Nonpoint Education for Municipal Officials NOAA National Oceanic and Atmospheric Administration NPDES National Pollutant Discharge Elimination System NRCS Natural Resources Conservation Service NSP Nonpoint Source Pollution OM Organic Matter PRISM Parameter-elevation Regressions on Independent Slopes Model RC&D Research, Conservation, and Development R-1 water Reclaimed Effluent Meeting R-1 Quality Criteria for Reuse SCAS/OSU Spatial Climate Analysis Service at Oregon State University SCS Soil Conservation Service SMA Special Management Areas SMWAG Southwest Maui Watershed Advisory Group SMWP Southwest Maui Watershed Plan SO Southern Oscillation SOEST School of Ocean and Earth Science and Technology SRLF Southern Regional Library Facility (University of California) SWCD Soil & Water Conservation District TMDL Total Maximum Daily Load TMK Tax Map Key USACE U.S. Army Corps of Engineers USDA U.S. Department of Agriculture USEPA U.S. Environmental Protection Agency WAG Watershed Advisory Group WET Watershed Education Training WQS Water Quality Standards WUDP Water Use and Development Plan WWRF Wastewater Reclamation Facility WWTP Wastewater Treatment Plant ZAED Zoning Administration and Enforcement Division

V APRIL 11, 2013
GLOSSARY
Advection – The transfer of a property of the atmosphere, such as heat, cold, or humidity, by the horizontal movement of an air mass
Ahupua’a – Common subdivision of the land in Hawaii
Keiki – Child
Kona – Southerly, from the south
Leeward – “Dry side” of an island receiving orographic precipitation
Limu – Seaweed
Mauka – Toward the mountains, upslope
Makai – Toward the ocean, downslope
N.T.U. – Nephelometric Turbidity Units: A comparison of the intensity of light scattered by the sample under defined conditions with the intensity of light scattered by a standard reference suspension under the same conditions
Orographic – Precipitation that results from the lifting of moist air over an orographic barrier such as a mountain range
Trade Winds – Northeasterly winds
Windward – “Wet side” of an island receiving orographic precipitation

VI APRIL 11, 2013
Page intentionally left blank

1-1
1.0 EXECUTIVE SUMMARY A watershed is the area of land that contributes water to a lake, river, stream, wetland, estuary bay, or ocean. The types of activities, management measures, and practices that are conducted on the land in a watershed can impact the quality of the receiving waterbodies. Watershed Management Plans protect water quality by characterizing watersheds, identifying pollutant sources and impacted natural resources, engaging stakeholders, quantifying pollutant loads, and identifying and implementing management measures and best management practices to reduce nonpoint source pollution.
The development of the Southwest Maui Watershed Plan (SMWP) (herein referred to as the Plan) began with the formation of a Watershed Advisory Group (WAG) and it involves stakeholders to determine how to manage the watershed in ways that satisfy environmental, human health, and economic interests. This Watershed Plan has been developed by the Central Maui Soil and Water Conservation District (SWCD) and the Southwest Maui Watershed Advisory Group (WAG) which consists of participants representing diverse interests including local, state, and federal agencies; private landowners and other residents; and nonprofit organizations. The WAG sought input from affected stakeholders in the process of developing the Watershed Plan. Three goals were identified in this process:
The Plan is composed of two volumes: Volume I: Watershed Characterization, and Volume II: Implementation and Management Strategies (this document). It focuses on the 49,688-acre area designated by the State of Hawaii as the Hapapa, Wailea, and Mo’oloa watersheds. The planning area extends from near the summit of Haleakala down to coastal areas, with 11 major drainage basins discharging to the Kihei-Wailea-Makena coastline. The entire coastline of the planning area is part of the Hawaiian Islands Humpback Whale National Marine Sanctuary. The upcountry areas are primarily forests, farms, and ranch lands, and the coastal areas are developed resort, urban, and residential areas. Long-term rainfall averages range from 10 inches per year near the Kihei coastline to over 40 inches per year at 9,400 feet elevation near the summit of Haleakala. The three watersheds of the planning area encompass diverse habitat types utilized by a significant number of threatened and endangered species, including alpine, dryland forest, scrub and shrub, grasslands, coastal and elevated wetlands, ephemeral (intermittent) streams, estuaries, dune systems, tidal pools, rocky shorelines, and coral reefs.
The 3 watersheds include some of the nation’s fastest growing population areas, increasing an average of 3.3% per year upcountry and 10% per year in the coastal areas. There is a trend of increased impervious surface and habitat loss due to development. The County of Maui Planning Department (COM planning) reported that there are at total of ~11,610 acres of planned development projects within the Southwest Maui planning area, which more than doubles the existing impervious surface area (existing development area totals ~4,194 acres). Some of these projects are already completed or are currently being completed; these projects

1-2
total 196 acres. Planned/Committed projects total 8,445 acres, Planned/Designated projects total 961 acres, and Planned/Proposed projects total 2,010 acres. Most of the potable water for this area is imported to the coastal areas from the wet Kahalawai, Iao Watershed, in which water allocations are currently being regulated, and to the upcountry areas from the upper Kula water system at Waikamoi.
The DOH Integrated Water Quality Report to the EPA and Congress pursuant to Clean Water Act Section 303(d) indicates that more than 26 coastal waterbodies are impaired and not meeting state and federal water quality standards. Total Maximum Daily Load studies to determine needed pollutant load reductions are mandated for more than 74 waterbody/pollutant combinations within the planning area, but none are listed as high priority for state program funding. Of the 33 waterbodies assessed, more than 28 lack adequate data for assessment.
The primary source of water pollutants identified by this Plan is contaminated runoff. While there is evidence of other pollutant sources in the planning area, it is beyond the scope of this planning project to address them. This process will depend on gathering additional watershed monitoring data for water quality model development, obtaining commitments from stakeholders, and obtaining funding.
The goal of the pollution control strategy and implementation plan is to focus on sediment reduction measures, utilizing treated wastewater for irrigation (replacing the use of potable water or brackish Kama’ole aquifer wells), and supporting ecosystem restoration projects that reduce flooding and runoff.
Southwest Maui’s economic engine depends upon water-environment related commercial, recreational, and cultural/traditional gathering opportunities to residents and visitors such as boating, fishing, swimming, snorkeling, diving, hiking, and many other outdoor related activities. The goal of this Watershed Plan is to show the ways to improved water quality to enhance all of these uses, and to establish management practices on the land which will support them into the future. All urban/rural, agricultural, and conservation land uses can benefit from improved management measures which reduce soil loss caused by erosion during heavy rainfall.

2-3
2.0 INTRODUCTION A watershed is the area of land where all of the water that is under it or drains from it flows into the same place. This Plan is a community based watershed plan to protect and restore water quality. Pollutants such as nutrients, toxic chemicals, pathogens, and sediments originate from a variety of sources within the watershed and potentially threaten both human and environmental health. These pollutants are transported via surface or groundwater throughout the watershed, reducing the quality of water in groundwater, streams, wetlands, estuaries, coastal, and oceanic waters. Nonpoint source pollution (NSP) originates from diffuse sources associated with a variety of land uses including urban, agricultural, residential, and conservation. The combined effects of point and nonpoint source pollution can be seen with the decreased water clarity, presence of harmful or nuisance algal blooms, increased nutrients, presence of toxic pollutants and pathogens, and the resulting decline in the health of native ecosystems and aquatic organisms that are subjected to multiple stressors. Due to limited data and financial and time-based restrictions, this Plan focuses mainly on sedimentation as the major pollutant of the planning area’s watersheds, and describes management measures which will reduce erosion and promote watershed health.
In order to make progress toward restoring waters impaired by nonpoint sources of pollutants, EPA recommends the creation and implementation of watershed-based plans that include nine specific components and a six-step process. The development of the Southwest Maui Watershed Plan (SMWP) involved stakeholders to determine how to manage the watershed in ways that satisfy environmental, human health, and economic interests. This Watershed Plan has been developed by the Central Maui Soil and Water Conservation District (SWCD) and the Southwest Maui Watershed Advisory Group (WAG) which consists of participants representing diverse interests including local, state, and federal agencies; private landowners and other residents; and nonprofit organizations.
The WAG sought input from affected stakeholders in the process of developing the Watershed Plan, and developed a conceptual model (Figure 2-1) that identifies pollutant sources, stressors, impacts, and impairments. Using this conceptual model as a guideline, pollutants of interest were identified for water quality modeling and practical and applicable management strategies were examined. These strategies are detailed in the chapters which follow.
Three goals were defined during this community based planning process: 1.Fishable/Swimmable waters, 2. Increased Safety and Reduced Flood Property Damage, and 3. Increased Future Water Resources. Due to the limitations of the present planning project, both financial and staffing, goal 1. Fishable/Swimmable Waters was chosen as the focus of this Watershed Plan.

2-4
Figure 2-1 Conceptual Model

2-5
2.1 Estimate Pollutant Loads
The approach to pollutant load estimation is to develop a hydrologic model and apply literature data event mean pollutant concentrations (EMC) to calculate pollutant load. Those pollutant load estimates can then be further analyzed and evaluated to develop practical strategies for load reductions aimed at improving the water quality in the watershed under study. This section will briefly describe the modeling methodology that was used for the Southwest Maui Watershed Plan. A detailed report of the hydrologic and water quality modeling used in this Plan will not be presented in this document since it was determined that the EMC values established by this study do not relate fairly to the planning area. However, a summary of the Hydrology Report is provided below. An ongoing monitoring program is recommended for this watershed, to collect relevant data, so that the hydrologic models can be adequately calibrated in the future, and pollutant loads estimated.

2-6
Watershed Modeling 2.1.1
Given budgetary support, several key factors are considered in selecting the best model to be used in the development of a watershed management plan. These may include factors such as: applicability and accuracy of predictions; soundness of model theory and underlying equations; extent, availability, and cost of required input data; model familiarity and ease of use; long term modeling needs and requirements; financial constraints, etc. For this Plan, the choice of the recommended type and analysis of modeling technique was evaluated under the above factors, leading to the following conclusions:
There is no data collection and monitoring program in place in the watershed to collect required data such as stream flow and water quality concentrations (discrete or continuous).
There is no long term modeling need identified, to-date.
Future technical expertise of who will maintain the models, once developed, is not clear at this stage.
There are financial constraints that prohibit the purchase of expensive proprietary software for use in the modeling exercise of the watershed management plan.
Based on the above observations, a relatively simplified modeling plan was adopted that was easy to implement, and which fulfills the short term needs of the project in the absence of a reliable and effective data collection and water quality sampling and monitoring plan. Two different computational methods were investigated for runoff estimates: 1) Rational Method of Peak Discharge Analysis and 2) SCS Runoff Curve Number Method, using the US Army of Corps hydrologic simulation program named HEC-HMS. It should be noted that the Rational Method is often used to simulate runoff for smaller watersheds (up to 200 acres), and is not very applicable to this study, but was selected as a way of comparison to the more applicable SCS Runoff Curve Number Method.
Catchment data
The project area selected for hydrological analysis includes three major watersheds: Hapapa, Wailea, and Mo’oloa. These major watersheds are then further divided in to eleven sub-basins. The sub-basins present in each watershed along with their corresponding areas are given in the Table 2-1; maps of each sub-basin are given in Appendix B.
Rainfall Data
Rainfall data was collected and compiled for all the sub-basins in the project area from the NOAA Atlas 14 (http://hdsc.nws.noaa.gov/hdsc/pfds/pfds_map_hi.html) of the region, and from local sources. Intensity Duration Frequency (IDF) Curves were plotted using the rainfall data for all relevant return periods for all sub-basins. Detailed rainfall data and IDF curves for each sub-basin are given in Appendix C.

2-7
Table 2-1 Details of Sub Basins
S. No. Watershed Sub-Basin Accumulated areas
(Acres) (km2) 1 a. Hapapa Kulanihako'i 10677.1 43.21 2 Waipu’ilani 7212.0 29.19 3 Keokea 8592.2 34.77 Total 26481.3 4 b. Wailea Kama’ole 3847.4 15.57 5 Li’ilioholo 3120.9 12.63 6 Kilohana 4493.7 18.19 7 Paeahu 2708.8 10.96 8 Palauea 2543 10.29 9 Papa’anui 4243.8 17.17 10 Mohopilo 1030.3 4.17 Total 21987.9 11 c. Mo’oloa Mo’oloa 1213.0 4.91
Rainfall-Runoff Modeling 2.1.2
The main objective of the rainfall-runoff modeling for hydrological systems in the sub-basins is:
To assess the peak flood discharge which occurs at the point of discharge for a particular basin or sub-basin under study for selected frequencies (return periods)
To derive flood hydrographs (graph of discharge against time) for a particular basin or sub-basin under study for selected frequencies (return periods)
Not all the rain that falls on the catchment contributes to runoff; a part of it is lost as infiltration into the ground, interception and transpiration by vegetation, and to fill in surface depressions. The net rainfall contributing to runoff is called effective or excess rainfall and the difference between the total observed rainfall and excess rainfall is termed as abstractions or losses.
The rainfall-runoff model for any watershed can be conceptualized as a surface water budget model, incorporating the loss mechanism into the catchment model, as shown below.
Figure 2-2 Rainfall Runoff Model as a Surface Water Budget Model
Rainfall
Catchment Model
Losses and Infiltration
Surface
Depression
Storage
Runoff

2-8
Rational Method
Although it is often considered simplistic, the Rational Method is still appropriate for estimating peak discharges for small drainage areas of up to about 200 acres (80 hectares) in which no significant flood storage appears. While this method is not very applicable to this study, it was used as a way of comparison to the more applicable SCS Runoff Curve Number Method.
The IDF curves were used for the calculation of rainfall intensity for each sub-basin, which were then used to calculate peak discharge for each sub-basin. The design period used for the analysis included 2, 5, 10, 25, 50, and 100-year return periods. The details of the Rational Method computations are given in Appendix E, Section 1.
SCS Runoff Curve Number Method
The hydrological study was facilitated with the computer model HEC-HMS that utilizes the commonly used SCS Curve Number method and unit hydrograph technique of routing. A HEC-HMS model was developed for each sub-basin in the study area to compute the peak discharge hydrograph of the sub-basin for various return periods. The HEC-HMS model consists of various components including 1) meteorological or rainfall data, 2) basin data describing the land use and loss data, and 3) control data describing the simulation time parameters such as total simulation time as well as simulation increments.
The sub-basins were delineated and included outlet points for each of the 11 sub-basins. The Time of Concentration (Tc) and Curve Numbers (CN) for these sub-basins were calculated by utilizing data either collected from the field or assumed based on visual inspection of the streams. The details of the HEC-HMS computations are given in Appendix E, Section 2. Once all the input data related to the sub-basin characteristics, land use, and rainfall data were finalized, the runoff computations were carried out to obtain runoff volume and peak runoff hydrographs for each sub-basin. The runoff hydrographs are included in Appendix F.
Results
The peak discharge results using each method are summarized in Appendix E. Comparison of peak discharges for both runoff methods (Rational method versus SCS Curve Number method) for all sub-basins is tabulated in Table 2-2.
Table 2-2 Comparison of Peak discharges using different methods
Sr. No.
Water-shed Sub Basin Method Peak Discharge-24 hour rainfall (cfs)
1 Yr 2 Yr 5 Yr 10 Yr 25 Yr 50 Yr 100 Yr 1 Hapapa Kulanihakoi SCS Curve No 237 540 1112 1653 2508 3257 4078 Rational method 546 692 983 1202 1457 1785 2112 2 Waipuilani SCS Curve No 100 244 529 807 1248 1625 2076 Rational method 278 394 533 672 881 927 1136 3 Keokea SCS Curve No 117 279 582 872 1326 1727 2165 Rational method 331 463 629 761 993 1158 1357

2-9
Sr. No.
Water-shed Sub Basin Method Peak Discharge-24 hour rainfall (cfs)
1 Yr 2 Yr 5 Yr 10 Yr 25 Yr 50 Yr 100 Yr 4 Wailea Kamaole SCS Curve No 68 231 641 1061 1751 2360 3047 Rational method 655 819 1228 1474 1801 2096 2375 5 Liilioholo SCS Curve No 43 109 242 374 584 767 972 Rational method 184 250 355 421 513 631 658 6 Kilohana SCS Curve No 68 170 382 589 921 1213 1536 Rational method 385 499 658 794 1043 1202 1338 7 Paeahu SCS Curve No 51 133 301 466 730 960 1214 Rational method 292 390 543 668 808 961 1086 8 Palauea SCS Curve No 82 289 727 1152 1820 2400 3037 Rational method 864 1115 1478 1778 2167 2467 2743 9 Papaanui SCS Curve No 59 152 256 563 902 1210 1559 Rational method 372 496 682 867 1074 1219 1404 10 Mohopilo SCS Curve No 29 124 341 553 902 1214 1567 Rational method 317 420 562 669 821 947 1070 11 Mooloa Mooloa SCS Curve No 41 152 391 623 1002 1336 1706 Rational method 325 430 584 689 855 981 1085
A summary of the runoff volume for each sub-basin corresponding to different return periods as simulated in the HEC-HMS model is given in below.
Table 2-3 24-Hour runoff volume for sub-basin
S. No. Watershed Sub Basin Total Volume-24 hour rainfall (acre-ft)
1 Year 2 Year 5 Year 10 Year 25 Year 50 Year 100 Year 1 Hapapa Kulanihakoi 320 708 1413 2066 3087 3975 4946 2 Waipuilani 146 364 782 1184 1819 2384 3004 3 Keokea 187 454 954 1430 2173 2831 3550 4 Wailea Kamaole 68 178 393 596 920 1203 1518 5 Liilioholo 58 148 321 488 749 975 1226 6 Kilohana 88 223 478 721 1103 1435 1800 7 Paeahu 61 147 307 457 694 897 1120 8 Palauea 65 151 308 454 682 880 1097 9 Papaanui 73 194 428 656 1023 1351 1720 10 Mohopilo 23 56 118 177 272 356 450 11 Mooloa Mooloa 31 71 147 218 331 430 539
Water Quality Modeling 2.1.3
The purpose of water quality modeling is to determine the water quality loads generated in all the sub-basins included in the study area of the watershed. The following pollutants of interest were identified for water quality modeling for each sub-basin in the study area:
Total suspended solids
Total nitrogen
Nitrite-nitrate nitrogen
Ammonia nitrogen
Enterococcus bacteria
Total phosphorus

2-10
The water quality loads for all parameters of interest identified for the sub-basins would usually be calculated based on the Event Mean Concentration (EMC) values for all such pollutants of interest. Since there is no monitoring data (discrete or continuous) available for the watersheds that would typically provide for estimates of the pollutant concentrations for all pollutants of interest, no water quality modeling was feasible.
In the absence of on-site actual monitoring data, secondary data collected in the US during various water quality studies were analyzed to determine if the base conditions observed in such studies and database sets relate to the base conditions of the Southwest Maui watersheds, particularly with regard to runoff, rainfall, and land use data. The secondary data studied were: 1) the National Stormwater Quality Database (NSQD) and the 2) Nationwide Urban Runoff Program (NURP).
After studying the land use and rainfall/runoff characteristics the NSQD and NURP, it was determined that the EMC values determined by these studies do not relate to the land use and runoff/rainfall characteristics of the watershed under study. It would not be practical and feasible to apply these EMC values to the sub-basins of our study area to calculate the loading estimates of the watershed.
Recommendations for Future Work 2.1.4
The peak discharge and water quality analysis for the sub-basins in the study area point to the lack of monitoring data related to both flows and water quality constituents of interest. In order for the flow calculations and loading estimates to provide a practical mechanism for load reduction strategies, it is important that an extensive data collection exercise is made part of the watershed planning process. It is the recommendation of this study that a comprehensive data collection program is developed and implemented in the Southwest Maui Watershed and its associated sub-basins including stream flow and water quality sampling over an extended period of time. Data collected during such an exercise can then be effectively used to develop more thorough and reliable hydrologic and water quality models for long term use in the watershed. The hydrologic and water quality models can only then be effectively calibrated using the monitoring data leading to more reliable estimates of flow and water quality loading estimates. The loading estimates obtained in such a manner can then be further analyzed and evaluated to develop practical strategies for load reductions aimed at improving the water quality in the watershed.
2.2 Set Goals and Identify Load Reductions
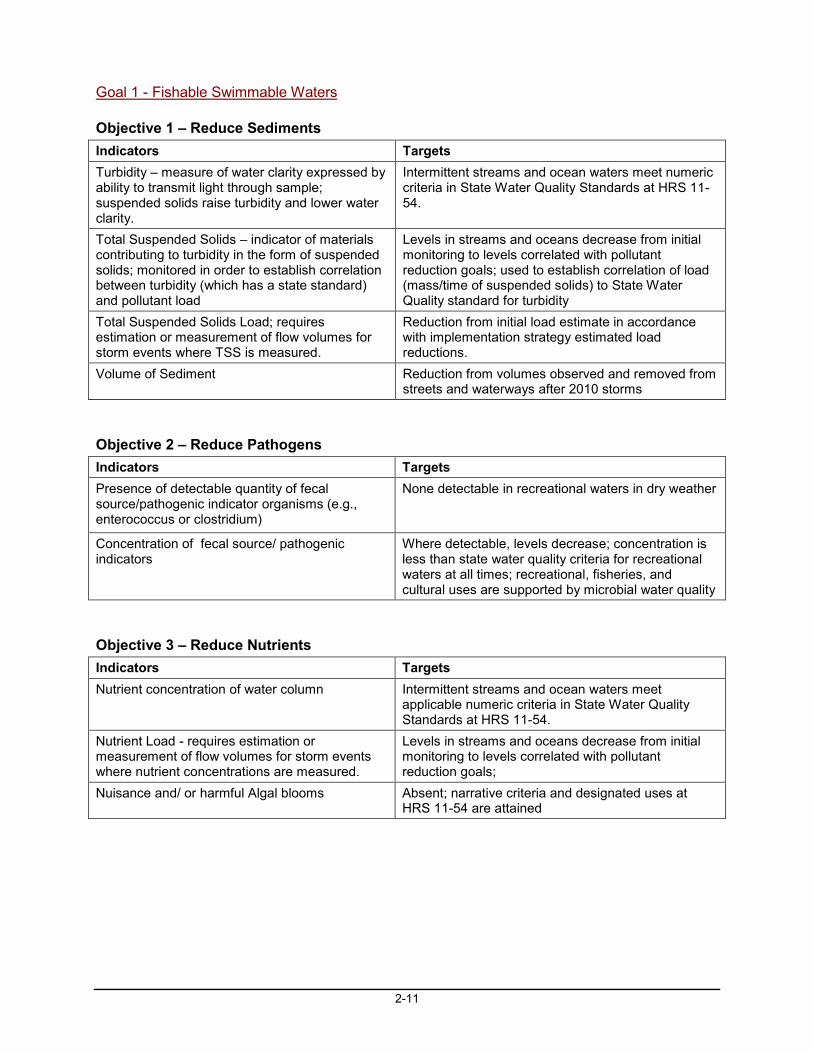
Although data are lacking at present that would allow for the estimation of pollutant loads and load reductions, the Watershed Advisory Group was able to establish some basic qualitative goals, objectives, targets, and indicators (discussed in Volume I, Chapter 2, Section 2.1.7.) The primary and most feasible goal at present, fishable swimmable waters, is summarized in the following tables.
2-11
Goal 1 - Fishable Swimmable Waters
Objective 1 – Reduce Sediments Indicators Targets Turbidity – measure of water clarity expressed by ability to transmit light through sample; suspended solids raise turbidity and lower water clarity.
Intermittent streams and ocean waters meet numeric criteria in State Water Quality Standards at HRS 11-54.
Total Suspended Solids – indicator of materials contributing to turbidity in the form of suspended solids; monitored in order to establish correlation between turbidity (which has a state standard) and pollutant load
Levels in streams and oceans decrease from initial monitoring to levels correlated with pollutant reduction goals; used to establish correlation of load (mass/time of suspended solids) to State Water Quality standard for turbidity
Total Suspended Solids Load; requires estimation or measurement of flow volumes for storm events where TSS is measured.
Reduction from initial load estimate in accordance with implementation strategy estimated load reductions.
Volume of Sediment Reduction from volumes observed and removed from streets and waterways after 2010 storms
Objective 2 – Reduce Pathogens Indicators Targets Presence of detectable quantity of fecal source/pathogenic indicator organisms (e.g., enterococcus or clostridium)
None detectable in recreational waters in dry weather
Concentration of fecal source/ pathogenic indicators
Where detectable, levels decrease; concentration is less than state water quality criteria for recreational waters at all times; recreational, fisheries, and cultural uses are supported by microbial water quality
Objective 3 – Reduce Nutrients Indicators Targets Nutrient concentration of water column Intermittent streams and ocean waters meet
applicable numeric criteria in State Water Quality Standards at HRS 11-54.
Nutrient Load - requires estimation or measurement of flow volumes for storm events where nutrient concentrations are measured.
Levels in streams and oceans decrease from initial monitoring to levels correlated with pollutant reduction goals;
Nuisance and/ or harmful Algal blooms Absent; narrative criteria and designated uses at HRS 11-54 are attained

3-12
3.0 MANAGEMENT STRATEGIES
3.1 Pollution Control Strategies
The pollution control strategy is meant to integrate management of water resources to prevent and control point and nonpoint source pollution while supporting ecosystem restoration and natural resource conservation. In the words of Watershed Advisory Group member Michael Howden: “If using Keyline principles, we run swales on contour out across the landscapes…these channels will help us hold both the moisture and the organic matter carried in these waters…rather than running out into the ocean, helping to kill our corals and otherwise polluting the nearshore waters” (Maui Weekly, 2/16/12).
The following paragraphs discuss the main pollution control strategies developed by this Plan. Each pollution control strategy will then be further dissected into specific implementation projects.
NOTE: Pollution control strategies not only support the clean water goal (fishable swimmable waters) but also support the goals of reducing the effects of flooding and increasing available future water supplies.
DSILT (Detained Stormwater Infiltration using Low Technology)
These are projects to control pollutant delivery to the ocean by detaining stormwater, trapping sediment, and facilitating infiltration (reducing sediment, nutrients, debris, and pathogens). DSILT endeavors include projects such as riparian buffers, terracing, and off-line peak flow diversion/storage/infiltration.
Water Reuse
These are projects that can reduce pollutant delivery to the ocean by re-using rather than disposing of recycled water. Use of these water resources for restoring ecosystem function is included (e.g. use R-1 water to irrigate riparian buffers, stabilize stream banks through establishing vegetation, and restore wetlands).
Best Management Practices (BMPs) and Other Strategies
Identify appropriate BMPs for categories of sources/land use/cover/activity.
Education and Outreach
Identify target audiences and develop training materials
Conduct targeted stakeholder education and outreach (events, workshops, meetings, presentations, newsletters)

3-13
Monitoring Plan
A long term monitoring plan of NSP “pollutants of concern”, designed to develop a data base to inform decision making regarding funding and implementation projects, needs to be conducted. Ongoing and rain-event sampling, photo-monitoring, and stream flow gage installations are also recommended.
3.2 Implementation Strategies
An overarching comprehensive implementation ambition of this Plan is to identify watershed plan linkages to existing programs, policies and plans; identify potential projects; seek funding; develop local, fiscal project management and technical capacity; identify project teaming partners and make teaming agreements; scope projects; write grants; raise funds; and implement projects through partnering arrangements.
Broad to specific:
While there are many other important stressors identified in the conceptual model (Figure 2-1) of this Watershed Plan, sedimentation is clearly the stressor with the most contributing factors and the most impact, causing the most impairment in the Southwest Maui Watershed planning area. Therefore implementation strategies that aim to reduce sedimentation are most fully assessed. Six DSILT (Detained Stormwater Infiltration using Low Technology) sediment reduction projects were identified by the WAG for implementation: 1) Excavated basins, 2) High impact zone mitigation sites, 3) Riparian protection and restoration, 4) Unpaved roads, 5) Grazing management measures, and 6) Pi’ilani basin utilization strategy. The DSILT projects have been prioritized by their importance to water quality improvements and by feasibility. They will be listed below, in order, from higher to lower priority. In addition, one water reuse project was identified and a brief summary of BMPs, and an innovative coral reef rejuvenation project, are presented. Each will present a description of its implementation methodology or provide links to informational websites.
…
4-14
4.0 DSILT PROJECTS Climate extremes are increasing, causing larger, more intense rain events, which lead to flooding. Sediment, nutrients, and other non-point source pollutants carried by runoff, from many diverse sources, are transported through the watershed by a few large gulch systems. These systems drain the watershed from near 9,000 feet to sea level. From 200 or more acres of wetland in 1965, to 83 acres in 2001, the capacity of the Kihei wetlands to manage storm flows has been reduced dramatically by development, leading to flooding in the urban area along the shore (Erickson, NRCS, 2002). Protecting the community requires draining these floodwaters into the nearshore marine environment, causing impacts to the reef and marine life. Intercepting the sediment flow is a primary objective of the methods described in this chapter.
4.1 Excavated Basins in Series
The following DSILT project will describe what could be the most effective stormwater management system for the Southwest Maui watersheds.
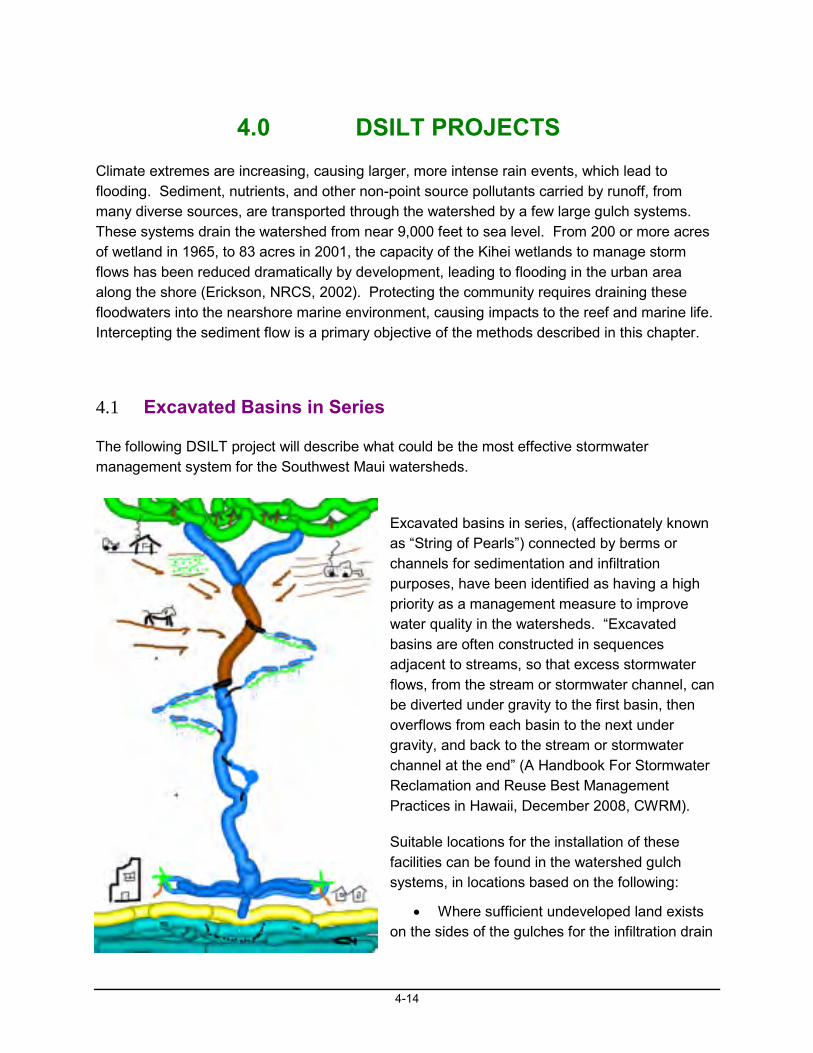
Excavated basins in series, (affectionately known as “String of Pearls”) connected by berms or channels for sedimentation and infiltration purposes, have been identified as having a high priority as a management measure to improve water quality in the watersheds. “Excavated basins are often constructed in sequences adjacent to streams, so that excess stormwater flows, from the stream or stormwater channel, can be diverted under gravity to the first basin, then overflows from each basin to the next under gravity, and back to the stream or stormwater channel at the end” (A Handbook For Stormwater Reclamation and Reuse Best Management Practices in Hawaii, December 2008, CWRM).
Suitable locations for the installation of these facilities can be found in the watershed gulch systems, in locations based on the following:
Where sufficient undeveloped land exists on the sides of the gulches for the infiltration drain

4-15
field
After the convergence of tributaries to maximize efficiency
Preferably in shallow segments where earth-moving to extract the water can be minimized
In locations where stormwater intakes can be feasibly installed
On soils which have adequate permeability
The following pictures show examples of shallow, flatter sections of gulches suitable for intake and drain field installations.
“Maui 2 Location- Southwest Maui Watershed Stabilization and Central Maui Soil and Water Conservation- Construct stormwater infiltration basins or contour terrace ditches to capture, store, and infiltrate stormwater. The infiltrated water would sub-irrigate grass for cattle feed, recharge aquifers, and water left in the ponds would be used by livestock and wildlife. The terrace ditches would run perpendicular to the slope and capture overland flow runoff. This dry area of Maui is also prone to wildfires, which could be slowed by the moisture around these stormwater retention areas.” (Kula Stormwater Reclamation Study-KSWRS Final 2011,p.11, Task 1, Existing Conditions Report).
Four of the nine priority candidate projects for stormwater management in the State of Hawaii, which were identified by The Bureau of Reclamation 2005 study which is quoted in the paragraph above, emphasize stormwater infiltration into the aquifer.
4-16
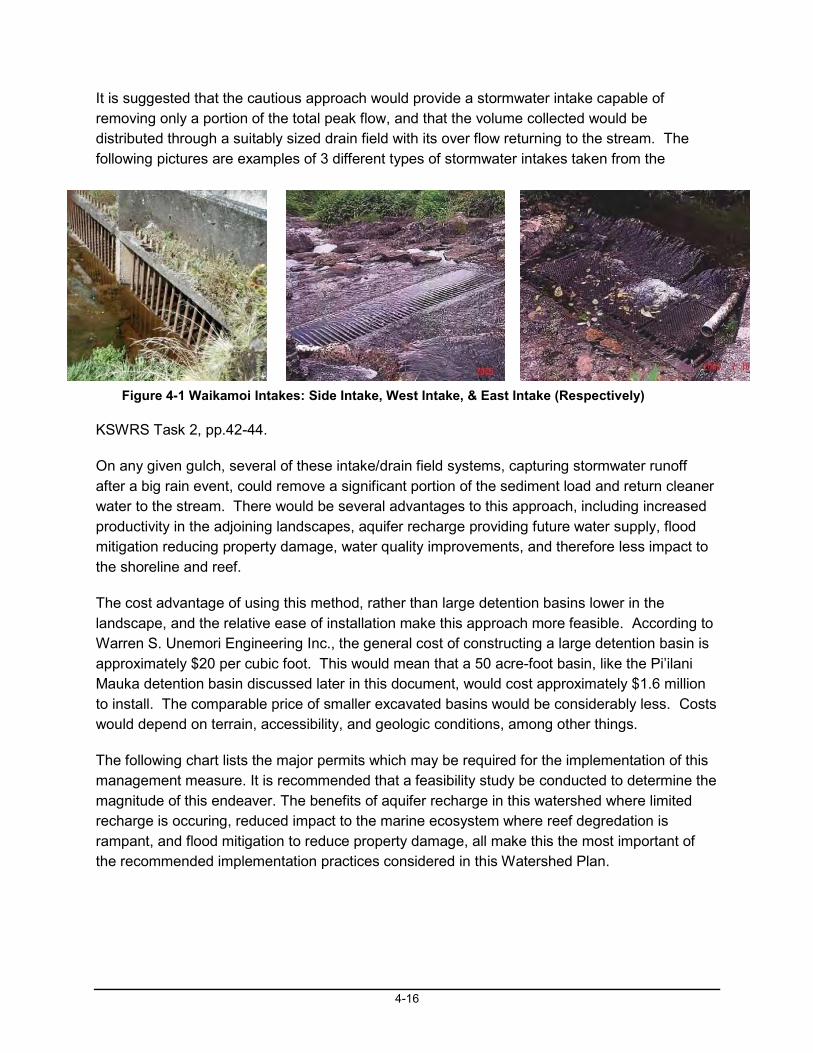
It is suggested that the cautious approach would provide a stormwater intake capable of removing only a portion of the total peak flow, and that the volume collected would be distributed through a suitably sized drain field with its over flow returning to the stream. The following pictures are examples of 3 different types of stormwater intakes taken from the
KSWRS Task 2, pp.42-44.
On any given gulch, several of these intake/drain field systems, capturing stormwater runoff after a big rain event, could remove a significant portion of the sediment load and return cleaner water to the stream. There would be several advantages to this approach, including increased productivity in the adjoining landscapes, aquifer recharge providing future water supply, flood mitigation reducing property damage, water quality improvements, and therefore less impact to the shoreline and reef.
The cost advantage of using this method, rather than large detention basins lower in the landscape, and the relative ease of installation make this approach more feasible. According to Warren S. Unemori Engineering Inc., the general cost of constructing a large detention basin is approximately $20 per cubic foot. This would mean that a 50 acre-foot basin, like the Pi’ilani Mauka detention basin discussed later in this document, would cost approximately $1.6 million to install. The comparable price of smaller excavated basins would be considerably less. Costs would depend on terrain, accessibility, and geologic conditions, among other things.
The following chart lists the major permits which may be required for the implementation of this management measure. It is recommended that a feasibility study be conducted to determine the magnitude of this endeaver. The benefits of aquifer recharge in this watershed where limited recharge is occuring, reduced impact to the marine ecosystem where reef degredation is rampant, and flood mitigation to reduce property damage, all make this the most important of the recommended implementation practices considered in this Watershed Plan.
Figure 4-1 Waikamoi Intakes: Side Intake, West Intake, & East Intake (Respectively)

4-17
Table 4-1 Major Permits Required for Project Installation
4.2 High Impact Zone Mitigation Sites
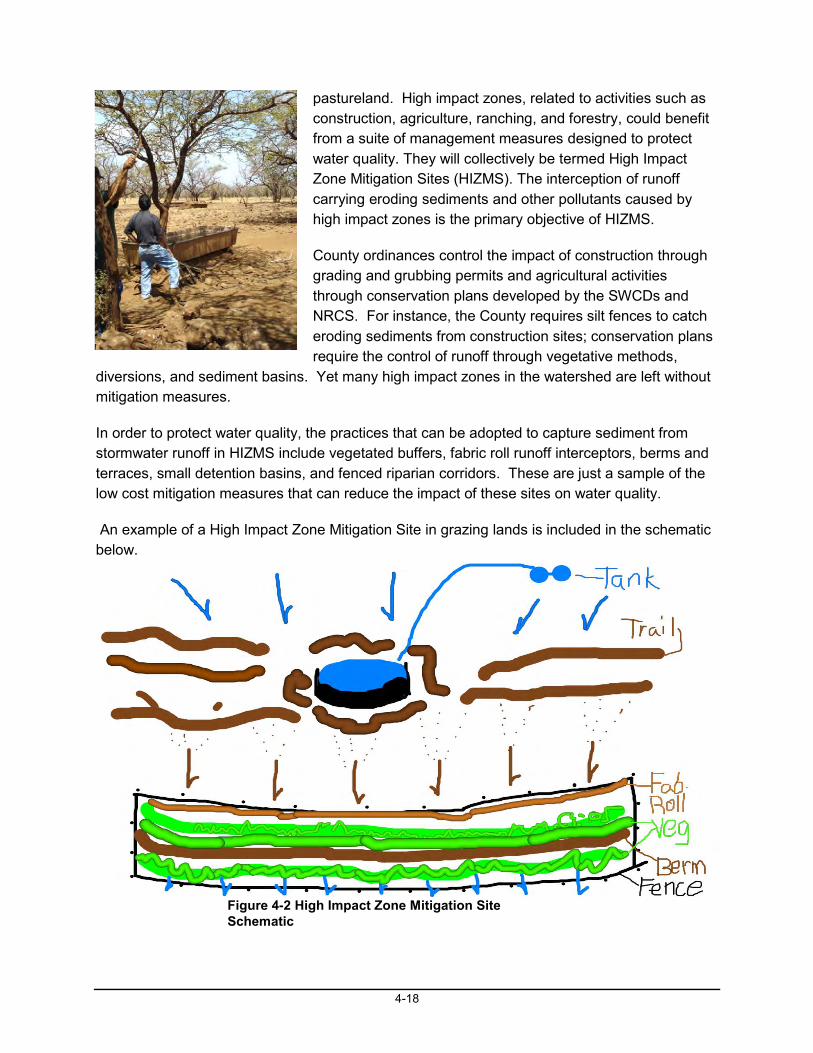
Any land use activity that reduces the vegetative cover and loosens soil can produce a site vulnerable to erosion called a high impact zone. The picture to the left is an example of a high impact zone in grazing lands, where a single water trough serves hundreds of acres of dry
4-18
pastureland. High impact zones, related to activities such as construction, agriculture, ranching, and forestry, could benefit from a suite of management measures designed to protect water quality. They will collectively be termed High Impact Zone Mitigation Sites (HIZMS). The interception of runoff carrying eroding sediments and other pollutants caused by high impact zones is the primary objective of HIZMS.
County ordinances control the impact of construction through grading and grubbing permits and agricultural activities through conservation plans developed by the SWCDs and NRCS. For instance, the County requires silt fences to catch eroding sediments from construction sites; conservation plans require the control of runoff through vegetative methods,
diversions, and sediment basins. Yet many high impact zones in the watershed are left without mitigation measures.
In order to protect water quality, the practices that can be adopted to capture sediment from stormwater runoff in HIZMS include vegetated buffers, fabric roll runoff interceptors, berms and terraces, small detention basins, and fenced riparian corridors. These are just a sample of the low cost mitigation measures that can reduce the impact of these sites on water quality.
An example of a High Impact Zone Mitigation Site in grazing lands is included in the schematic below.
Figure 4-2 High Impact Zone Mitigation Site Schematic

4-19
This HIZMS is a trough site much like the site shown in the picture provided previously. A strip of land downslope of the trough (or other primary stressor factor) is fenced, separately, and vegetated (green lines) to produce a sediment filtering effect. Water from the trough system would be available at the site to establish the vegetation, and various types of sediment filtering plants, such as native grasses, vetiver, etc. could be planted. In addition, seeded fabric rolls can be staked on the contour to intercept sediment/nutrient-laden runoff. Sediment buildup can be monitored to demonstrate the effectiveness of this technique. It has proven successful in other similar locations. The fabric rolls can be seeded with a combination of native shrubs and grasses to enhance native habitat and create a living filter. A berm designed to catch and infiltrate runoff could also be installed in the buffer as an additional deterrent to sediment transport.
Cost Estimates
Fencing - 6’ game fencing costs are estimated between $12 -$18 per foot, including materials and installation, depending on access, terrain, soil conditions, etc.
Fabric rolls - 9’ by 50’ rolls are approximately $150 each, including wooden stakes, seed, and installation.
Irrigation – systems would depend on the size and extent of the buffer and are estimated to be between $200 and $500, installed.
Plantings - vetiver - $10 to $15 per foot with irrigation installed
Native grasses and shrubs –These are available locally and cost will vary depending on whether seed is dispersed or nursery-grown plants are used, and according to size and rarity. Costs will also depend on plant selection and quantity. General prices for nursery grown plants range from dibbles@$4, 1 gal.@$12-$18, 5gal.@$45-$85,7gal.@$125, 15gal.@$50-$225, and 20gal. tubs with larger trees for $200 or more
4.3 Riparian Protection and Restoration
All of the gulches in the Southwest Maui Watershed project area can benefit from protection and restoration management measures (see Implementation Map in Appendix A). Various site-specific measures can be utilized depending on the resources available. A general description of riparian protection and restoration follows.

4-20
Unfenced riparian zones are grazed by livestock and provide hidden trails used by deer and other feral ungulates. As a result, vegetation is grazed and trampled and soil is loosened; this contributes to unstable stream banks and causes erosion and muddy streamwater during runoff events. Fencing is the primary tool for protection, preventing access by hoofed animals. The effectiveness of the removal of sediments and nutrients from stormwater runoff increases with buffer width (see Riparian Buffer Width, Vegetative Cover, and Nitrogen Removal Effectiveness, EPA/600/R-05/118, October 2005). Access crossings through the gulches are incorporated into the fence design, and stream curtains are installed to prevent animals from entering the buffers while crossing. These curtains allow stormwater to pass under without destroying the fence.
A fenced, re-vegetated corridor will also provide a sediment filter for the sheet flow from adjacent lands, as demonstrated by Operation TAKO POKE, a 319(h), R-1 irrigated riparian buffer project completed in 2005 on Keokea Gulch (pictures to right, and sediment trapped in buffer shown).
Even un-irrigated buffers will revegetate after fencing, given time. Options include allowing existing vegetation to reestablish itself, or actively seeding and out planting native grasses, shrubs, and trees to further enhance native habitat (see list of native species). Native plant charts from Pelekane Bay Watershed Restoration Project, Final Report, May 31, 2011, are shown below.
Fabric rolls impregnated with native seeds can be utilized to both intercept sediment and provide a living filter. They can be staked as check dams in the stream flow and serve as streambank stabilizers. The cost for a 9-foot wide, 50-foot long roll is approximately $150 installed.

4-21
The expense of fencing prevents landowners from committing riparian areas for protection and restoration. It is therefore recommended that riparian fencing be one of the major funded implementation strategies in the watershed and that it be provided to any willing landowner. An example of per foot material costs for a typical fence can be found in the following table from the Pelekane Bay Watershed Restoration Project, Final Report, May 31, 2011. It should be noted that the fence was designed to keep goats and cattle out.

4-22
On Maui, in the last 10 years, the deer population has increased dramatically, and higher fences will be required to protect riparian buffers. Recent installed fencing costs, on Maui, for 6 foot game fencing, range from $12 to $14 per foot in the open and accessible grazing lands, to $18 per foot in inaccessible, remote upland areas at 6,000 to 8,000 foot elevation.
The following quote from the “Erosion and Sediment Control Course and Field Practicum”, prepared for the Hawaii Coastal Zone Management Program (2004), states clearly that, “Erosion is the process in which, by the actions of wind or water, soil particles are detached and transported. Sediment is eroded material suspended in wind or water. Sedimentation is the deposition of eroded material…Erosion control is a source control that treats the soil as a resource that has value and should be kept in place… When possible, use erosion controls as the primary protection, with sediment controls as a secondary system.”
Therefore, the benefits of riparian fencing higher up in the landscape cannot be over stressed, and can prevent the need for bigger, more expensive solutions downslope, (i.e. large expensive detention basins). However, riparian buffer fencing in the lower elevations is also important to prevent sediments from entering the stream corridors. It is difficult to prioritize the specific areas for the installation of riparian BMPs because it is such a compelling need in the entire southwest Maui watershed, but a commitment to funding incremental installation is advised (see Implementation Map in Appendix A)
Another potential source of pollutants in the gulches is the dumping of waste, which has been the traditional method of disposal. Education is needed to change peoples’ behaviors and
4-23
habits. Even yard waste thrown in a gulch is problematic when a big storm comes. Workshops should be provided to educate gulch landowners about the methods available for water quality protection, and a “Gulch Guardian “ protocol promoted through educational fliers, workshops, etc.
4.4 Unpaved Roads
Many of the unpaved roads in the Southwest Maui Watershed are on slopes and much of the landscape is dry, most of the time. Occasional storms lead to runoff, which moves sediments down roads. This situation is common in many places in this and other watersheds.
“Roads alter water movement across the landscape, which can concentrate and accelerate flow and cause soil erosion and gully formation.” Bill Zeedyk, Water Harvesting From Low Standard Rural Roads, April 2006. http://www.nm.nrcs.usda.gov/technical/tech-notes/eng/eng1a.pdf
While this can be a problem for water quality because of sediments and other pollutants, it can also be an opportunity. In an area that has very low average rainfall (10 to 20 inches/year in the lower elevations), stormwater from these roads could be harvested to the benefit of the surrounding land.
Roads guru, Bill Zeedyk of Sandia Park, New Mexico, has put together a manual for water harvesting techniques and road maintenance programs (see quote and website above), which includes a list of management strategies, guidelines, and practices. Landowners can use this resource to help solve some of their road maintenance problems and harvest stormwater at the same time.
Workshops with Zeedyk and other experts could help land managers and equipment operators understand the principles of better road design, and ultimately reduce sediment-laden stormwater runoff. These and other educational workshops are an inexpensive way to raise awareness about watershed issues. Approximate cost per workshop is between $1500 to $2500.
4.5 Grazing Management Measures
More than half of the lands in the Southwest Maui Watershed are grazed by a combination of domestic and feral animals, including cattle, deer, pigs, goats, sheep, and elk. Much of the grazing acreage is rough and prone to drought, and grazing management is necessary in order to maintain the health of the watershed. While some of the ranchers have adopted managed grazing practices, much of the acreage could benefit from improved management, as outlined below.
NRCS promotes what is called “Prescribed Grazing”.

4-24
DEFINITION Managing the harvest of vegetation with grazing and/or browsing animals. PURPOSE This practice may be applied as a part of conservation management system to achieve one or more of the following: • Improve or maintain desired species composition and vigor of plant communities. • Improve or maintain quantity and quality of forage for grazing and browsing animals’ health and productivity. • Improve or maintain surface and/or subsurface water quality and quantity. • Improve or maintain riparian and watershed function. • Reduce accelerated soil erosion, and maintain or improve soil condition. • Improve or maintain the quantity and quality of food and/or cover available for wildlife. • Manage fine fuel loads to achieve desired conditions. • Promote economic stability through grazing land sustainability. CONDITIONS WHERE PRACTICE APPLIES This practice applies to all lands where grazing and/or browsing animals are managed. CRITERIA General Criteria Applicable to All Purposes Removal of herbage will be in accordance with site production limitations, rate of plant growth, and physiological needs of forage plants and the nutritional needs of the animals. Adequate quantity and quality drinking water will be supplied at all times during period of occupancy. Adjust intensity, frequency, timing and duration of grazing and/or browsing to meet desired objectives for the plant communities and the associated resources, including the grazing and/or browsing animal. Manage kind of animal, animal number, grazing distribution, length of grazing and/or browsing periods, and timing of use to provide grazed plants sufficient recovery time to meet planned objectives. The recovery period of non-grazing can be for the entire year or during the growing season of key plants. Deferment (non-grazing period less than one year) and/or rest (non-grazing period equal or greater than one year) will be planned for critical periods of plant needs. Provide deferment or rest from grazing or browsing to ensure the success of prescribed fire, brush management, seeding or other conservation practices that cause stress or damage to key plants. Manage grazing and/or browsing animals to maintain adequate vegetative cover on sensitive areas (i.e. riparian, wetland, habitats of concern, karst areas). Manage livestock movements based on rate of plant growth, available forage, and allowable utilization or stubble height target.
Develop contingency plans to deal with expected episodic disturbance events e.g. insect infestation, drought, wildfire, etc.
In addition, mob-grazing practices, as described in Allan Savory’s book, Holistic Resource Management, Island Press, 1988, increase the benefits to the plant community, soil microbes, the hydrologic cycle, and overall diversity and health of the pasturelands. As stated on p.176,
“The discovery that brittle environments need periodic disturbance to maintain stable soil cover…leads us to recognize animal impact as perhaps the only practical tool that can realistically halt the advance of deserts over billions of acres of rough country.”

4-25
A holistic grazing management clinic on Maui, led by Kirk Gadzia, a Certified Educator with the Allan Savory Center for Holistic Management, was held in 2005. Central Maui SWCD sponsored it with modest funding from NOAA and the Hawaii Coastal Zone Management Program, to educate graziers (term for people who manage grazing animals) about the methods and benefits of mob grazing. The free clinic also provided ranchers and others with tools for increasing productivity of grazed lands, improving animal health and soil quality, managing plants and reducing erosion, and harvesting water from low maintenance roads. Participants had the opportunity to observe well-managed pasturelands and learn to make a grazing plan. (see pictures below) A program of similar workshops would be worthy of future funding to continue this educational effort. Approximate cost per workshop is between $1500 and $2500.

4-26
4.6 Pi’ilani Basin Utilization Strategy
The Pi’ilani Mauka Detention Basin No.1, located above Elleaire Golf Course in central Kihei, intercepts and captures a portion of the offsite surface runoff from a drainage basin extending up Mount Haleakala, which is slowly released downstream into an existing drainage way through Elleaire Golf Course. This drainage way continues downstream through Elleaire Golf Course to Pi’ilani Highway.
The Pi’ilani Mauka Detention Basin No.1, an approximately 50 acre-ft. detention basin
occupying approximately 5 acres, consists of 48” and 60” diameter drain inlet risers with grated inlets.
The captured stormwater begins to exit the basin through 60” drain inlet no. 1, when it reaches a depth of approximately 8 feet. All water below that level remains in the basin and infiltrates down into the aquifer. Sediment remains in the basin to be cleaned out as needed.
This huge unlined detention basin is a potential resource for DSILT in the Waipu'ilani drainage basin. If engineering studies would accommodate it, a portion of the flow from Waipu’ilani could be diverted through this basin to allow stormwater sediments to be settled out before continuing down the stream. It would require the outlet structure to be redirected back into Waipu’ilani after detention. The design would place the stormwater intake at approximately 200 ft. elevation in Waipu’ilani Gulch, and channel the water into the basin, which is located 150 to 200 ft. to the south of the gulch. Using this method, some of the muddy stormwaters could be cleaned up before returning to the stream and the 8 feet of water remaining in the basin would infiltrate into the aquifer. This would change the nature of the floodwaters in Kihei by reducing their volume and sediment load. An engineering study is recommended to determine the feasibility of this project. Cost estimate is $25,000 to $30,000.
Figure 4-3 Pi'ilani Mauka Detention Basin
Figure 4-4 42" Diameter Drain Outlet Structure

5-27
5.0 WATER REUSE
5.1 Expansion of R-1 Reuse Area
Most of the wastewater from the Kihei urban area is collected and treated at a central Wastewater Reclamation Facility (presently, approximately 4 to 5 mgd). Some of this wastewater is greywater from sinks, showers, washing machines, etc. Easing the restrictions on the use of this water for onsite irrigation would reduce the cost for wastewater treatment at the WWRF. Presently, regulations prohibit this onsite use. Rules and regulations regarding greywater use need to be examined in the light of recently developed technologies for safe re-use.
The current County of Maui Wastewater Operations Program Superintendent has indicated that at present, 50% to 60% of the treated R-1 recycled water is being reused for irrigation purposes by a golf course, park, residential, commercial, and agricultural entities. He provided us with a copy of the potential expansion plan for the R-1 system in Kihei (South Maui R-1 Recycled Water Verification Study, December 2009). Refer to the maps below.

5-28
He indicated that he is committed to providing R-1 water to certain expansion projects that are coming online in the next few years, and there won't be much R-1 to inject after that. This plan is currently beyond the County’s ability to fund. It is considered a priority by this Watershed Plan that funding be made available for R-1 reuse expansion, so that this valuable resource can be utilized and not injected and wasted. A multi-agency financial support mechanism is recommended in order to accomplish this goal. Consult with Maui County on the estimated cost of this project.

6-29
6.0 BEST MANAGEMENT PRACTICES (BMPS) The Hawaii Watershed Guidance has outlined the management measures for reducing NSP in urban/rural areas.
See Coastal Nonpoint Pollution Control Program, http://hawaii.gov/dbedt/czm/initiative/nonpoint/HI%20Watershed%20Guidance%20Final.pdf
http://hawaii.gov/dbedt/czm/initiative/nonpoint.php
Also recommended are the techniques described in the following websites:
LID – http://www.lowimpactdevelopment.org
The list below highlights some of the main goals and principles of LID:
Provide an improved technology for environmental protection of receiving waters.
Provide economic incentives that encourage environmentally sensitive development.
Develop the full potential of environmentally sensitive site planning and design.
Encourage public education and participation in environmental protection.
Help build communities based on environmental stewardship.
Reduce construction and maintenance costs of the stormwater infrastructure.
Introduce new concepts, technologies, and objectives for stormwater management such as micromanagement and multi- functional landscape features (bioretention areas, swales, and conservation areas); mimic or replicate hydrologic functions; and maintain the ecological/biological integrity of receiving streams.
Encourage flexibility in regulations that allows innovative engineering and site planning to promote “smart growth” principles.
Encourage debate on the economic, environmental, and technical viability and applicability of current stormwater practices and alternative approaches.
NEMO - http://nemo.uconn.edu/ Nonpoint Education for Municipal Officials
Google NEMO Hawaii for more information.
The goal of NEMO is to “provide decision makers with the skills and resources that they need to identify local water quality problems and to adopt effective pollution controls”.
SEEP - http://www.plrcd.org/SEEP/ Stormwater & Erosion Education Program
The SEEP Program's Purpose:

7-30
Increase skill and knowledge levels in the stormwater and erosion fields.
Foster communication and collaboration between industry, agencies, and landowners.
Protect resources, including people, water, and the economy.
Develop a local pool of experts as resources for the development community.
Change current perception in development practices.
7.0 REEF REJUVENATION
Figure 7-1 5 year-old Biorock reef on formerly barren sand. Reef restored with GCRA Biorock® Technology. Photo May 2012, Pemuteran, Bali, by EunJae Im
“Mineral accretion was first developed by architect Wolf Hilbertz in order to provide alternative construction materials, and he and Thomas Goreau of the Global Coral Reef Alliance developed its use for reef restoration and shore protection. They hold a patent on such applications. They have recently joined forces with Professor Alexander Gorlov, the inventor of a remarkable new electrical generator which can be powered by ocean tidal currents that holds great promise with typical tidal flows found around oceanic islands. They are seeking to develop projects using mineral accretion for reef restoration, shore protection, and renewable energy development with

7-31
interested groups around the world.” (New Wave Coral Reef Rejuvenation, Asian Geographic June/August 2000, Michael Aw)
With all the publicity given to the degradation of the coral reefs, because of climate change and land based pollution, very little about ways to rebuild them has been proposed. At the Hawaii Conservation Conference in 2006, Thomas Goreau made a presentation about a proven method he has developed to rejuvenate and rebuild dying reefs by growing coral on electrically energized rebar grids. (Refer to the websites below)
http://www.globalcoral.org/coral_and_coral_reefs_commentary.htm
http://www.biorock.net/Technologies/
http://www.globalcoral.org/
According to Goreau, rules and regulations are so restrictive in Hawaii that he was prevented from installing any of these systems here. It is recommended that research be initiated to find ways to legally allow this technology to be used in Hawaii’s waters to rebuild degraded reefs.
* * * * * * * * Summary of Actions for Plan Development
Identify Programmatic Linkages
Develop a matrix or graphic depiction of the applicable State, Federal, and County regulations in the watershed planning area, the implementing programs, policy, authorities, managers, facilities, and activities within the watershed. Linkages identified will refine understanding of potential project partners, resources, and constraints.
Identify projects
The following general project concepts were developed by the WAG. All projects and practices at a minimum should be consistent within the framework of the Management Measures in the Hawaii Watershed Guidance and the EPA Watershed Planning Guidance. All projects will require monitoring of metrics for actions (e.g. number of measures implemented) and water quality improvements or pollutant load reduction accountability. Other programmatic criteria may apply to specific projects and will be identified during the programmatic analysis and partnering efforts.
Four major categories of project are envisioned:

7-32
1. DSILT projects to reduce sediment delivery to the ocean, reduce or mitigate flood volume, and increase stormwater infiltration.
2. Reclaimed water reuse to better capture this valuable resource.
3. Monitoring projects to gather data for water quality modeling, pollutant and load estimation, assessment of designated use support, water quality standards attainment, and other measures of waterbody health or project performance.
4. Best Management Practices (BMPs) derived for specific sources, land uses, or activities. BMPS will fall within the framework of the existing management measures. Projects include BMP training and technology transfer programs, and development or adaptation of BMPs to address issues specific to Hawaii watersheds.
More Specifically…
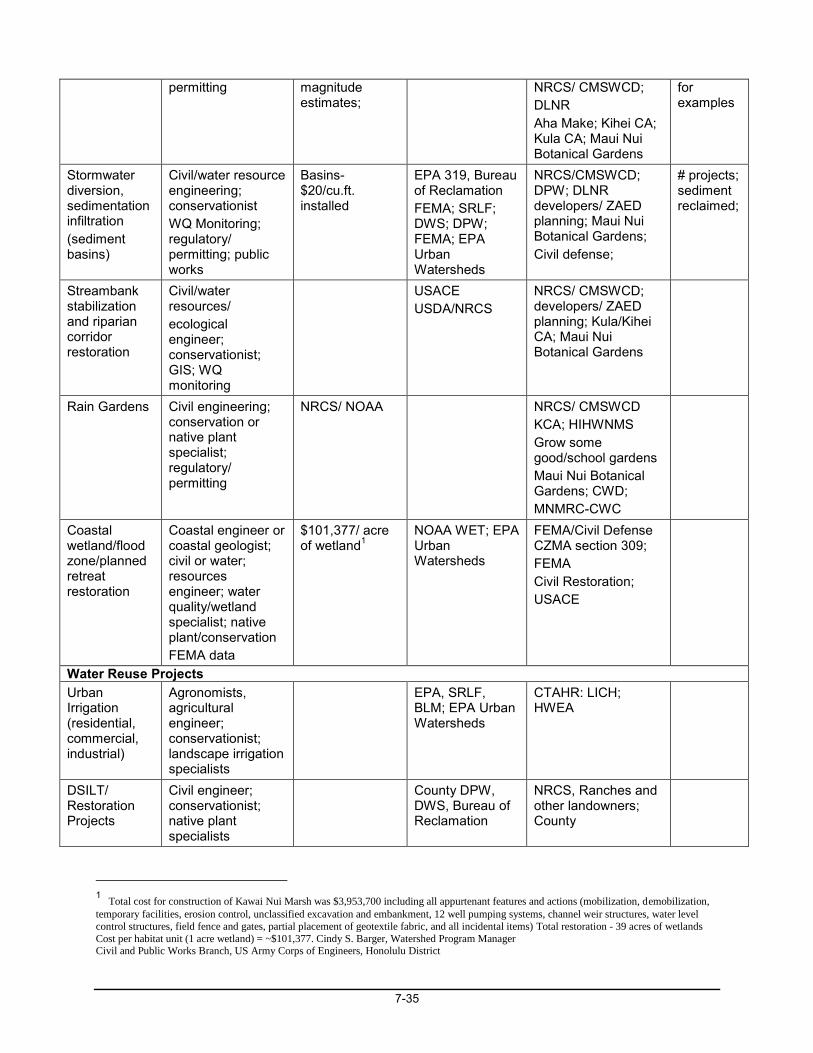
DSILT Project Concepts (see map in Appendix A for potential locations)
1. Projects that facilitate stormwater diversion, sedimentation, and infiltration on undeveloped lands. Project objectives are to reduce flood peak volume and sediment load delivered to the urban coastal areas and increase stormwater infiltration into the Kama’ole shallow coastal aquifer. Design concepts suggested for consideration include 1) sedimentation basins and 2) “String of Pearls” creation of artificial meanders (use of terraces, diversions, and other features) to divert water away from stream bed across the landscape and facilitate sedimentation and infiltration by allowing the water to slow in a series of shallow impoundments. Areas of highest priority are in Kulanihako’i, Waipu’ilani, and Keokea sub-basins.
2. Stream bank stabilization and riparian corridor restoration – mauka to makai, where needed, to reduce sediment loads with priority in Kulanihako’i, Waipu’ilani, and Keokea Sub-basins; also may be compatible with dryland forest restoration and cultural access preservation efforts in Kama’ole and potentially other Wailea and Mo'oloa (Makena) sub-basins.
3. Green infrastructure pilot or demonstration projects to both retrofit existing urban areas and to reduce impact of future development of impervious surfaces.
Green rooftops, which will reduce localized flood volume, could be irrigated with R-1 or grey water, reducing wastewater treatment volumes and loads, and will help alleviate urban hot spots in Kihei.
Rain garden at Whale Sanctuary/Kalepolepo to publicly demonstrate the effectiveness of healthy soil conditions and native plants to protect the ocean from land-based nonpoint source pollution.
4. Coastal wetland restoration/flood zone restoration/planned shoreline retreat. Identify projects that can meet multiple objectives related to flood control, wetland and floodplain development and restoration, and mitigation of coastal hazards and nonpoint source pollution. Potential project areas along South Kihei Road include the La’ie Wetlands,

7-33
Kalama Park, Kama’ole Park, and the area from Maui Lu Resort to Menehune Shores Condominium Complex.
Water Reuse Projects
1. Irrigated green belts or riparian buffers to improve water quality
2. Use of R-1 water in ecosystem restoration (including DSILT project irrigation)
3. Expansion of R-1 reuse area to provide infrastructure for 100% reuse
Monitoring Projects
Interagency/stakeholder monitoring coordination
Water Guardians – Mauka to Makai Gulch and Shoreline Watch program
Under direction of Watershed Coordinator and coordinated community programs that provide training, trained professionals and volunteers will supervise all work in the field. All monitoring sites will have appropriate safe and legal access. Data will be used in watershed planning and to monitor results of plan implementation.
Citizen Scientists will:
o Conduct visual assessment of gulches and shorelines over time
o Collect and ground truth physical stream and outlet data and drainage basin conditions
o Collect ocean and groundwater samples for water quality analysis
o Conduct flow and water level monitoring
o Sample stormwater runoff
o Record data and report via CORAL Data Portal
Establish BMPs for Land Uses/Activities
Provide financial support for landowners and others to facilitate BMP implementation for the various land use categories defined in the Hawaii Watershed Guidance
Other Actions Supporting the Plan
1. Identify Teaming Partners and Make Agreements
a. WAG hosting/grant management
b. Projects
c. Project management
d. Watershed coordinator
e. Community coordination

7-34
2. Seek Funding
a. Grant writing, fund raising; in-kind support is provided by partners/stakeholders
b. Potential funding sources/grants
i. NOAA programs for monitoring, marine education, coral reef preservation, climate change adaptation, fisheries, coastal zone and watershed management
1. Bay Watershed Education and Training Program (B-WET)
2. Coastal Resilience Network (CRest)
3. Marine Debris Removal Project Grants
4. Marine Education and Training Mini Grants
ii. USDA
1. Landowner incentives or project funding
iii. EPA http://water.epa.gov/grants_funding/shedfund/federal.cfm
1. Community Action for a Renewed Environment
2. State Clean Water Revolving Loan Fund
3. Environmental Education Grant Programs
4. Environmental Justice Grant programs
5. Five Star Restoration Program
6. Nonpoint Source Pollution Control (319)
7. Targeted Watersheds Grants
8. Regional Grants
3. Develop Capacity
a. Hire professional staff
b. Intern programs Targeted education/outreach to stakeholders
Table 7-1 Implementation Strategy Matrix
Project Type Technical Resources (TYPE OF RESOURCE)
Financial Resources $$$$
Funding Sources
Teaming Partners Measure-able Milestones
Reforestation -mauka and dryland
Forestry/native restoration, WQ monitoring GIS; regulatory/
Check watershed partnership annual report for order of
DWS DOFAW
Dept. of Water Supply; Leeward Haleakala Partnership;
See Leeward Management Plan
7-35
permitting magnitude estimates;
NRCS/ CMSWCD; DLNR Aha Make; Kihei CA; Kula CA; Maui Nui Botanical Gardens
for examples
Stormwater diversion, sedimentation infiltration (sediment basins)
Civil/water resource engineering; conservationist WQ Monitoring; regulatory/ permitting; public works
Basins- $20/cu.ft. installed
EPA 319, Bureau of Reclamation FEMA; SRLF; DWS; DPW; FEMA; EPA Urban Watersheds
NRCS/CMSWCD; DPW; DLNR developers/ ZAED planning; Maui Nui Botanical Gardens; Civil defense;
# projects; sediment reclaimed;
Streambank stabilization and riparian corridor restoration
Civil/water resources/ ecological engineer; conservationist; GIS; WQ monitoring
USACE USDA/NRCS
NRCS/ CMSWCD; developers/ ZAED planning; Kula/Kihei CA; Maui Nui Botanical Gardens
Rain Gardens Civil engineering; conservation or native plant specialist; regulatory/ permitting
NRCS/ NOAA NRCS/ CMSWCD KCA; HIHWNMS Grow some good/school gardens Maui Nui Botanical Gardens; CWD; MNMRC-CWC
Coastal wetland/flood zone/planned retreat restoration
Coastal engineer or coastal geologist; civil or water; resources engineer; water quality/wetland specialist; native plant/conservation FEMA data
$101,377/ acre of wetland1
NOAA WET; EPA Urban Watersheds
FEMA/Civil Defense CZMA section 309; FEMA Civil Restoration; USACE
Water Reuse Projects Urban Irrigation (residential, commercial, industrial)
Agronomists, agricultural engineer; conservationist; landscape irrigation specialists
EPA, SRLF, BLM; EPA Urban Watersheds
CTAHR: LICH; HWEA
DSILT/ Restoration Projects
Civil engineer; conservationist; native plant specialists
County DPW, DWS, Bureau of Reclamation
NRCS, Ranches and other landowners; County
1 Total cost for construction of Kawai Nui Marsh was $3,953,700 including all appurtenant features and actions (mobilization, demobilization,
temporary facilities, erosion control, unclassified excavation and embankment, 12 well pumping systems, channel weir structures, water level
control structures, field fence and gates, partial placement of geotextile fabric, and all incidental items) Total restoration - 39 acres of wetlands
Cost per habitat unit (1 acre wetland) = ~$101,377. Cindy S. Barger, Watershed Program Manager Civil and Public Works Branch, US Army Corps of Engineers, Honolulu District

7-36
Identify BMPS for each land use and activity
Local engineering; NRCS; LICH; aha Moku
NRCS LICH; Aha Moku ;Trade professional associations
Identify targeted stakeholders
Trade professional associations; County and professional agencies
MNMRC; LICH;
Develop targeted educational materials
Educators, editing, publishing, graphics
NOAA; EPA/NEMO
CTAHR; UH Maui; FEMA
Conduct Outreach Events
Event coordination and logistics
MNMRC; HIHWNMS
Monitoring Projects Interagency/ Stakeholder Monitoring workgroup
Water quality scientists; social scientists
HCRI, EPA, DOH, DAR, UH Maui Sea Grant; Pacific Services Center
HCRI; Pacioos; HIHWNMS; UH Maui
Water Guardians
WQ scientist; Coral MNMRC; HIHWNMS CORAL; CWD;UH MAUI; Kihei and Kula CA
Management/Administration Project and Grant Management
Grant and Project Manager; Project fiscal and administrative support
Project/grant manager (part-time)
Grant admin fees; Hawaii Community Fund; Interagency personnel placement
Tri-Isle RC&D; SWCD; UH County
Watershed Coordination
Environmental professional (scientist engineer)
$150,000/yr (full time plus benefits and overhead)
Hawaii Community Foundation; EPA 319
HAWP;HWWA; Hawaii Community Foundation
Community Coordination
Event coordinator Social Networker
$70k/year (part-time plus benefits and overhead)
Hawaii Community Foundation; NOAA B-WET; EPA public education/ outreach grants
MNMRC; HIHWNMS; CORAL; Surfrider. Maui Tomorrow Foundation

8-37
8.0 EDUCATION AND OUTREACH PLAN The WAG proposed an Education and Outreach Plan outlined below:
1. WHO ARE WE EDUCATING?
a. Keiki (Children) b. Water Users c. Average community member d. Policy makers e. Planners f. Developers
2. WHY ARE WE EDUCATING? a. To further the implementation of WAG planning recommendations b. So that the community can make informed policy decisions
i. Voting ii. Land use iii. Who to support
c. To establish and maintain a connection to the land and the interconnectedness of water resources to the land
d. To establish a “culture of care” i.e. community-based peer pressure to prevent pollution
3. WHAT ARE WE EDUCATING ABOUT? a. What a watershed is b. Why a watershed is important to protect c. How each person as an individual can help d. How we collectively can help (through kupuna, businesses, community, and
government organizations) 4. HOW ARE WE EDUCATING?
a. Mauiwatershed.org b. Facebook.com c. Water quality monitoring sites d. Akaku e. Internships f. Handouts and fliers g. Talks and presentations h. Volunteer activities
5. HOW ARE WE EDUCATING? a. Keiki
i. Community events (club meetings, fairs, festivals) ii. Water Quality Monitoring (beach or stream water sites) iii. Classroom demonstrations by volunteers
b. Water users i. Posters or fliers at popular stores ii. Turbidity Task Force\raises awareness through observation and
monitoring c. Average community member
i. Mauiwatershed.org

8-38
ii. Facebook.com page iii. Akaku advertisement campaign iv. Public meetings v. Booths at fairs and festivals (Whale Day, County Fair, etc.) vi. Speakers at neighborhood/community associations or civic clubs (Rotary,
etc.) d. Policy Makers
i. Invitation to WAG meetings ii. Write letters or testimony iii. Presentations to County Council Committees, Planning Commission,
County Planning Department e. Planners and Developers
i. Develop workshops for Pollution Prevention Techniques (Best Management Practices) for construction, roads, drainage etc., Nonpoint Source Education for Municipal Officials (NEMO)
f. Stakeholders i. Presentations or workshops for landowners and managers at ranches,
resorts, community associations ii. Educate businesses engaging in practices that make a difference to water
quality 6. ADDITIONAL RESOURCES FOR OUTREACH AND EDUCATION
a. Volunteers i. Identify existing and potential sources of volunteers
1. Hawaiian Islands Humpback Whale National Marine Sanctuary (HIHWNMS) Citizen Scientist/ Volunteer Water Quality Monitoring Program
2. Maui Nui Marine Resource Council , Clean Water Committee and Turbidity Task Force
3. South Maui Sustainability Group 4. Upcountry Sustainability Group
ii. Establish what aspect of outreach could be helped by volunteers iii. Establish co-ordination of volunteer efforts with existing groups
b. Meeting spaces, educational materials, and visual aids? i. County ii. Schools iii. Nonprofits (PWF, Hawaii Ecotube, Digital Bus, Aquanimity NOW) iv. State (DAR, DOH, UH) and Federal (NOAA, EPA, HIHWNMS)
As a part of the education and outreach effort a signage program for the three main roads (South Kihei Rd, Pi’ilani Hwy, and Kula Hwy) that travel through the watershed that identifies the watersheds by name (Hapapa, Wailea, Mo’oloa) would raise public awareness.

9-39
9.0 MONITORING PLAN Cultural practices are being impaired due to declining marine ecosystem health (less fish, coral, native algae (limu)) and restricted access to cultural gathering sites. Kihei was historically one of the largest sites for fishing and other coastal cultural activities. In addition, the economic health of the tourist industry depends on preserving the health of the marine ecosystem.
A monitoring program is needed to develop a database for this area to aid management efforts. Components of the monitoring plan would include an ongoing water sampling effort to determine the primary pollutants causing the decline of the health of the reef and nearshore waters.
Data that needs to be collected to further the implementation of the pollution control strategy:
Location/ground truthing, mapping of all ocean outfalls (including storm outlets), especially the Wailea and Makena watersheds.
Monitoring to characterize stormwater pollutant loads (flow and pollutant concentration for TSS, Nutrients, and fecal indicators) during runoff events (Gulch monitoring with Kulanihako’i and Waipu’ilani as priority). USGS stream gages need to be re-established.
Monitoring of the daily irrigation runoff for flow, nutrients (there are several flowing locations in Wailea)
Monitoring to characterize the range of nearshore oceanographic conditions occurring along the coastlines of the watersheds (wind velocity and direction, current velocity and direction, turbidity, salinity, temperature).
Monitoring of ocean water quality (turbidity, nutrients, salinity, pH, dissolved oxygen and fecal indicators) under a range of conditions and locations (e.g., include areas near stream mouths, wet weather conditions).
Monitoring of groundwater well levels and water quality (salinity, silica, turbidity, nutrients, dissolved oxygen, redox, and pH) will also be important to understanding the contribution of groundwater to the overall pollutant load. Well monitoring is suggested as an important component in a future Monitoring Plan.

10-40
10.0 CONCLUSIONS AND RECOMMENDATIONS Existing data and assessments indicate that water quality and designated use impairments exist within the watershed planning area. The major streams in the Hapapa watershed have documented heavy sediment discharges, in some cases to shallow coastal waters with limited flushing, where wind and waves can drive re-suspension of past sediment deposits. Sediment plumes offshore after runoff events are evidence of the lack of adequate erosion prevention in the watershed. The development of coral reef ecosystems is inhibited, and algal blooms proliferate in the areas of high sedimentation. Algal blooms, water quality impairments, and elevated dissolved nutrient levels are seen at locations further south in the Wailea and Mo’oloa Watersheds. Dissolved nutrients are likely transported from land by both surface runoff and submarine discharges of groundwater.
Preliminary Conclusions and Recommendations include:
1) Funding support for management measures outlined in the Implementation Strategy is needed to accomplish the desired results of cleaner water going to the sea.
2) The most effective methods of runoff control need to be aggressively established, including stormwater management in the upcountry landscape, buffering of the major gulches, and infiltration features where feasible.
3) Given the reduced size and capacity of the historic wetlands in the area, protection and restoration of the remaining wetlands is critical, and new artificial wetland installations will be important to replacing that lost storage and treatment capacity.
4) Reuse of all of the available recycled R-1 water for irrigation will avoid wasting this valuable resource, and reduce the amount of potable water that is needed in the coastal region. The expansion plan for the Kihei WWTF will help to accomplish this goal.
5) Further analysis of existing data:
Review of existing compiled reports, EIS, etc., submitted late in the review process, or not readily analyzed (due to hard copy only or no electronically editable files)
Compilation and reporting of new data generated by the watershed coordinator and WAG (whale sanctuary volunteers data, La’ie wetland data, data from flooding events, photo documentation of stream flow, flood aftermath, sedimentation events, stream reconnaissance)

10-41
Page intentionally left blank

11-42
11.0 REFERENCES
A Handbook For Stormwater Reclamation and Reuse Best Management Practices in Hawaii, December 2008, CWRM).
Aw, Michael, New Wave Coral Reef Rejuvenation, Asian Geographic June/August 2000.
Bay-Delta Modeling Forum (BDMF) (1997), “Bylaws of Bay-Delta Modeling Forum,” BDMF, Richmond, CA.
Cesar Environmental Economics Consulting. (2002). Economic Valuation of the Coral Reefs of Hawaii.
Church, J. A. and N. J. White., 2006. 20th century acceleration in global sea-level rise, Geophys. Res. Lett., 33(1), L01602.
Commission on Water Resource Managment. (2008). Hawaii Water Plan ; WaterResource Protection Plan. Department of Land and Natural Resources, CWRM.
County of Maui. (2006 rev. 2009). Socio-economic Forecast. Planning Department.
Dailer, M. l., Smith, J. E., Knox, R. S., Napier, M., & Smith, C. M. (2010). Using δ15N values in algal tissue to map locations and potential sources of anthropogenic nutrient inputs on the island of Maui, Hawaii. Marine Pollution Bulletin , 60, 655-671.
Division of Aquatic Resources. (April 2008). Atlas of Hawaiian Watershed & Their Aquatic Resources. Department of Land and Natural Resources (DLNR) State of Hawaii.
(2009). Draft Maui Island Plan; Volume II- Recommendations. County of Maui, County Long Range Planning Document. County of Maui.
Edwards, D. and Hamson, Mike. (1990). Guide to Mathematical Modeling. CRC Press, Boca Raton, Florida.
Environmental Protection Agency (EPA), (2005). Watershed and Water Quality Modeling Technical Support Center Website. http://www.epa.gov/athens/wwqtsc/index.html)
EPA (1983). Results of the Nationwide Urban Runoff Program, Volume -1 Final Report (December 1983).

11-43
Fletcher, C.H., Mullane, R.A., and Richmond, B.M., 1997. Beach loss along armored shorelines of Oahu, Hawaiian Islands. Journal of Coastal Research, v. 13, p. 209-215.
George A.L. Yuen and Associates, Inc. (1990). Water Resources Protection Plan.
Giambelluca, & Sanderson. (1993). In Fujioka, & J. Fujioka, Effects of Island Shape and Mountain Orientation on Orographic Precipitation in Hawaii.
Ground-water Data Managment Iao and Waihe’e Aquifers, Maui, HI.
Hawaii Department of Health. (2006). State of Hawaii Water Quality Monitoring And Assessment Report: Integrated Report to the U.S. EPA and U.S. Congress Pursuant to §303(D) and §305(B), Clean Water Act (P.L. (Vol. IV). Honolulu, Hawaii: Hawaii, Department of Health.
Holistic Resource Management, Island Press, 1988
Hwang, D.J., 2005. Hawaii Coastal Hazard Mitigation Guidebook, University of Hawaii Sea Grant College Program (UNIHI-SEAGRANT-BA-03-01), 216p.
http://www.stateforesters.org/reports/COMMUNITIESATRISKFG.pdf).
Juvik, S., & Juvik, J. O. (1998 3rd edition). Atlas of Hawaii. Honolulu: University of Hawaii Press.
Kelley, T. E. (n.d.). Learning from Kihei Maui Cumulative Impacts and Mitigation of Wetlands.
King, C.S., Gilmartin, W.G., Bernard, H.J., Nakai, G., and Balazs, G.H. In Press. Twenty Years of Hawksbill Sea Turtle (Eretmochelys imbricata) Nesting Activity on the Island of Maui, Hawai‘i (1991-2010). Proceedings of the 32nd Annual Symposium on Sea Turtle Conservation and Biology (Oaxaca, Mexico, 2012).
(Kula Stormwater Reclamation Study-KSWRS Final 2011,p.11, Task 1, Existing Conditions Report
Maui County Planning Department. (June 2006). Socio-economic Forecast, The Economic Projections for the County General Plan 2030.
Mayer, D. P. (2010). US Census Data for Maui.
MCFB. (2003). ?
Mink and Yuen. (2002). Draft Supplemental Environmental Impact Statement for the East Maui Water Development Plan.
Mink and Yuen. (2000). Water for the Wailea Ranch Development, Maui: An Overview.
Mink, & Yuen. (2010a). Kula Stormwater Reclamation Study Existing Conditions Report.

11-44
Mink, J. F., & Lau, L. S. (2006). Hydrology of the Hawaiian Islands. University of Hawaii Press.
Nance, T. (2010). Assessment of the potential Impact on Water Resources of the Honua'ula Project in Wailea, Maui.
NRCS. (1997). Upcountry Watershed Plan.
Nullet, D., & Sanderson, M. (1993). Radiation and energy balances and air temperature. In M. Sanderson, Prevailing Trade Winds: Weather and climate in Hawaii. Honolulu: University of Hawaii Press.
PBR & Associates, Inc. Hawaii. (March 2010). Honua'ula Draft Environmental Impact Statement. County of Maui, Maui Planning Department.
PRISM Group. (2006).
Riparian Buffer Width, Vegetative Cover, and Nitrogen Removal Effectiveness, EPA/600/R-05/118, October 2005
R.M. Towill Corporation /URS Corporation. (2005). Technical Support Data Notebook for Riverine Flood Insurance Studies/Restudies Throughout Region iX, EMF-2003-CO-0046, Task Order 002".
R.M. Towill. (2009). DRAFT Kihei Drainage Master Plan Waiakoa Gulch to Kilohana Drive Existing Conditions. Wailuku, HI: County of Maui.
R.M. Towill/Dewberry and Davis , LLC. (2008). Coastal Technical Support Data Notebook for Maui County Hawaii Hurricane Study.
Rice, R. W., & Izuino, F. T. (1998). Research Technical Bulletin 906. University of Florida, Florida Agricultural Experiement Station.
Richmond, R. H., Rongo, T., Golbuu, Y., Victor, S., Idechong, N., Davis, G., et al. (2007). Watersheds and coral reefs: conservation science, policy, and implementation. Bioscience , Vol. 57, no. 7. pp 598-607.
Robert Pitt, Alex Maestre, and Renee Morquecho, (2004). The National Storm Water Quality Database (NSQD), Version 1.1, Feb 16, 2004.
Savory, Allan, (1988). Holistic Resource Management, Island Press.
Sawdey. (2009). Rapid Watershed Assessment: Kama`ole Watershed, Maui Island, Hawaii. Internal Draft (unpublished). USDA Natural Resources Conservation Service. Honolulu, Hawaii.: USDA Natural Resources Conservation Service.

11-45
Soil Conservation Service. (1972). Soil Survey of Islands of Kauai, Oahu, Maui, Molokai, and Lanai, State of Hawaii. US Department of Agriculture.
Soil Conservation Service. (March 1981). Soil Survey of Islands of Kauai, Oahu, Maui, Molokai, and Lanai. USDA.
South Maui R-1 Recycled Water Verification Study, December 2009.
US Census Bureau. (February 2011). 2010 Census Redistricting Data (Public Law 94-171).
US Census. (1960-2010). US Census Data .
USEPA. (1994). EPA-841-F-94-005.
USEPA. (1998, September). Bulletin 236-F-98-007e. USEPA.
USEPA. (2005). Guidance for 2006 Assessment, Listing and Reporting Requirements Pursuant to Sections 303(d), 305(b) and 314 of the Clean Water Act. USEPA U.S. Environmental Protection Agency, Office of wetlands, oceans, and watersheds. USEPA.
USEPA. (2009). Handbook for Developing Watershed Plans to Restore and Protect our Waters.
USEPA. (November 2008). The Ecological and Hydrological Significance of Ephemeral and Intermittent Streams in the Arid and Semi-arid American Southwest. US Environmental Protection Agency, Reserarch and Development. USEPA.
USEPA, (1997). Compendium of Tools for Watershed Assessment and TMDL Development. EPA-841-B-97-006, U.S. Environmental Protection Agency, Office of Water, Washington, DC.
Waimea Water Services, Inc. (June 2004). Water Resources Review of the Kamaole Aquifer Unit (Kihei to Makena, Maui).
Water Quality Consulting, Inc. (2009). "Integrated Water Quality Reporting Criteria for Use Attainment Decisions for Hawaii Surface Waters. Hawaii Department of Health.
(http://en.wikipedia.org/wiki/Maui)


A-1
Appendix A. SOUTHWEST MAUI WATERSHED PLAN POSSIBLE
IMPLEMENTATION MAPS

A-2

A-3

A-4
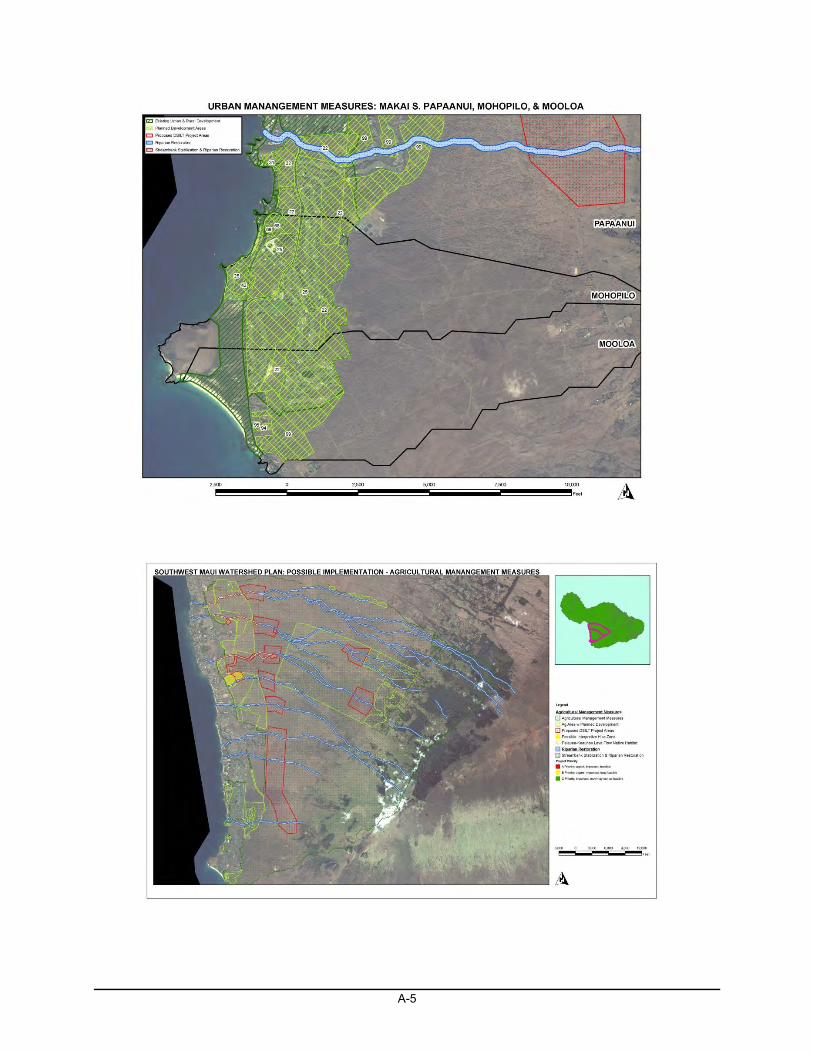
A-5
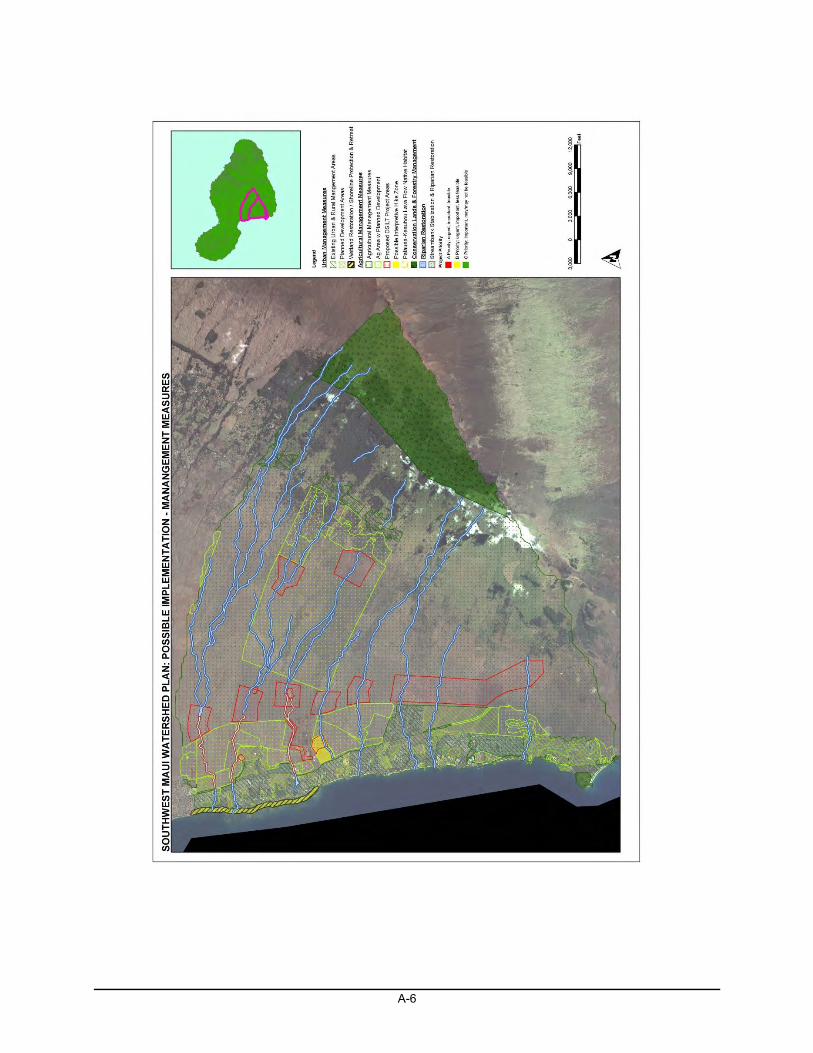
A-6

B-1
Appendix B. SOUTHWEST MAUI WATERSHED SUB-BASIN MAPS

B-2

B-3
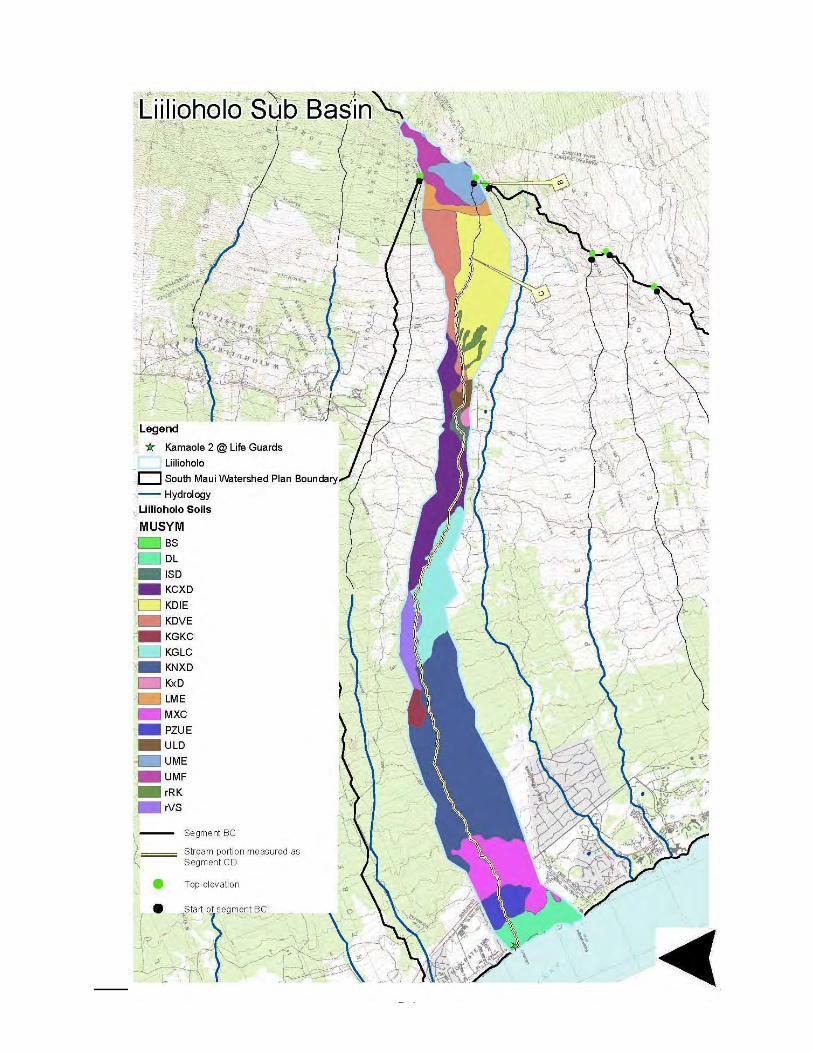
B-4
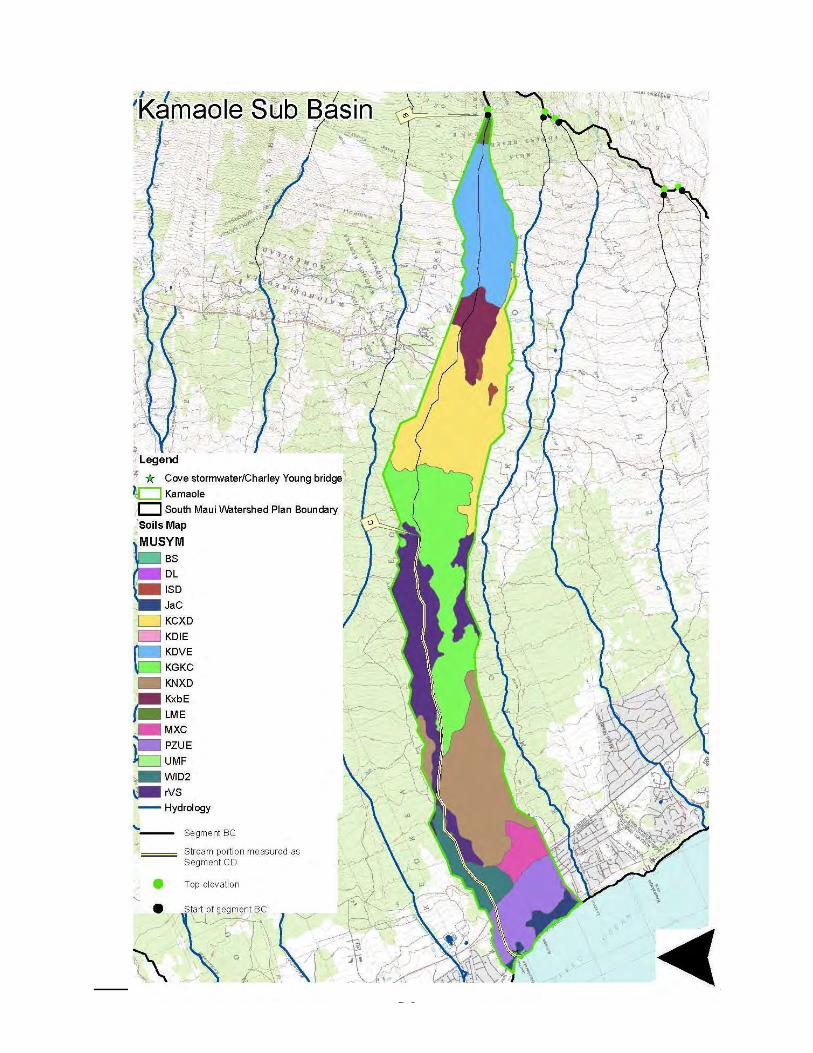
B-5

B-6

B-7

B-8

B-9

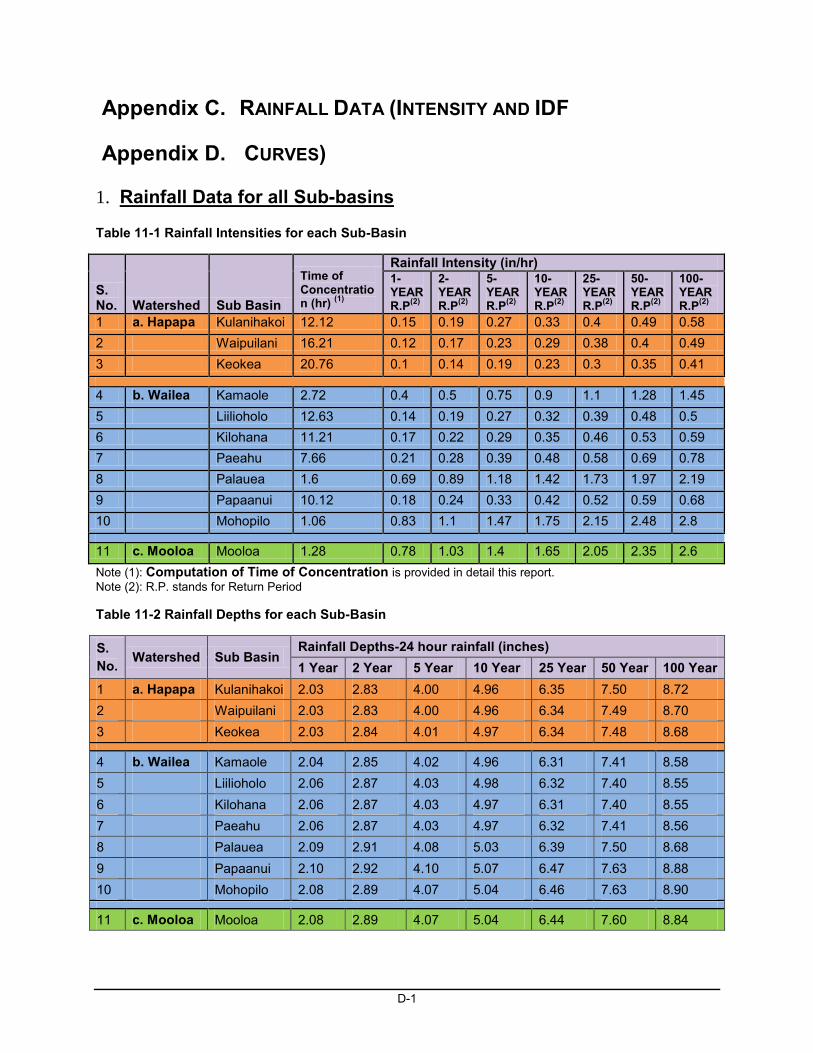
D-1
Appendix C. RAINFALL DATA (INTENSITY AND IDF
Appendix D. CURVES)
1. Rainfall Data for all Sub-basins
Table 11-1 Rainfall Intensities for each Sub-Basin
S. No. Watershed Sub Basin
Time of Concentration (hr) (1)
Rainfall Intensity (in/hr) 1-YEAR R.P(2)
2-YEAR R.P(2)
5-YEAR R.P(2)
10-YEAR R.P(2)
25-YEAR R.P(2)
50-YEAR R.P(2)
100-YEAR R.P(2)
1 a. Hapapa Kulanihakoi 12.12 0.15 0.19 0.27 0.33 0.4 0.49 0.58 2 Waipuilani 16.21 0.12 0.17 0.23 0.29 0.38 0.4 0.49 3 Keokea 20.76 0.1 0.14 0.19 0.23 0.3 0.35 0.41 4 b. Wailea Kamaole 2.72 0.4 0.5 0.75 0.9 1.1 1.28 1.45 5 Liilioholo 12.63 0.14 0.19 0.27 0.32 0.39 0.48 0.5 6 Kilohana 11.21 0.17 0.22 0.29 0.35 0.46 0.53 0.59 7 Paeahu 7.66 0.21 0.28 0.39 0.48 0.58 0.69 0.78 8 Palauea 1.6 0.69 0.89 1.18 1.42 1.73 1.97 2.19 9 Papaanui 10.12 0.18 0.24 0.33 0.42 0.52 0.59 0.68 10 Mohopilo 1.06 0.83 1.1 1.47 1.75 2.15 2.48 2.8 11 c. Mooloa Mooloa 1.28 0.78 1.03 1.4 1.65 2.05 2.35 2.6 Note (1): Computation of Time of Concentration is provided in detail this report. Note (2): R.P. stands for Return Period
Table 11-2 Rainfall Depths for each Sub-Basin
S. No. Watershed Sub Basin
Rainfall Depths-24 hour rainfall (inches) 1 Year 2 Year 5 Year 10 Year 25 Year 50 Year 100 Year
1 a. Hapapa Kulanihakoi 2.03 2.83 4.00 4.96 6.35 7.50 8.72 2 Waipuilani 2.03 2.83 4.00 4.96 6.34 7.49 8.70 3 Keokea 2.03 2.84 4.01 4.97 6.34 7.48 8.68
4 b. Wailea Kamaole 2.04 2.85 4.02 4.96 6.31 7.41 8.58 5 Liilioholo 2.06 2.87 4.03 4.98 6.32 7.40 8.55 6 Kilohana 2.06 2.87 4.03 4.97 6.31 7.40 8.55 7 Paeahu 2.06 2.87 4.03 4.97 6.32 7.41 8.56 8 Palauea 2.09 2.91 4.08 5.03 6.39 7.50 8.68 9 Papaanui 2.10 2.92 4.10 5.07 6.47 7.63 8.88 10 Mohopilo 2.08 2.89 4.07 5.04 6.46 7.63 8.90
11 c. Mooloa Mooloa 2.08 2.89 4.07 5.04 6.44 7.60 8.84

D-2
2. IDF Curves Kulanihako’i IDF Curves for 24 Hours Rainfall
Waipu’ilani IDF Curves for 24 Hours Rainfall

D-3
Keokea IDF Curves for 24 Hours Rainfall
Kama’ole IDF Curves for 24 Hours Rainfall

D-4
Liilioholo IDF Curves for 24 Hours Rainfall
Kilohana IDF Curves for 24 Hours Rainfall
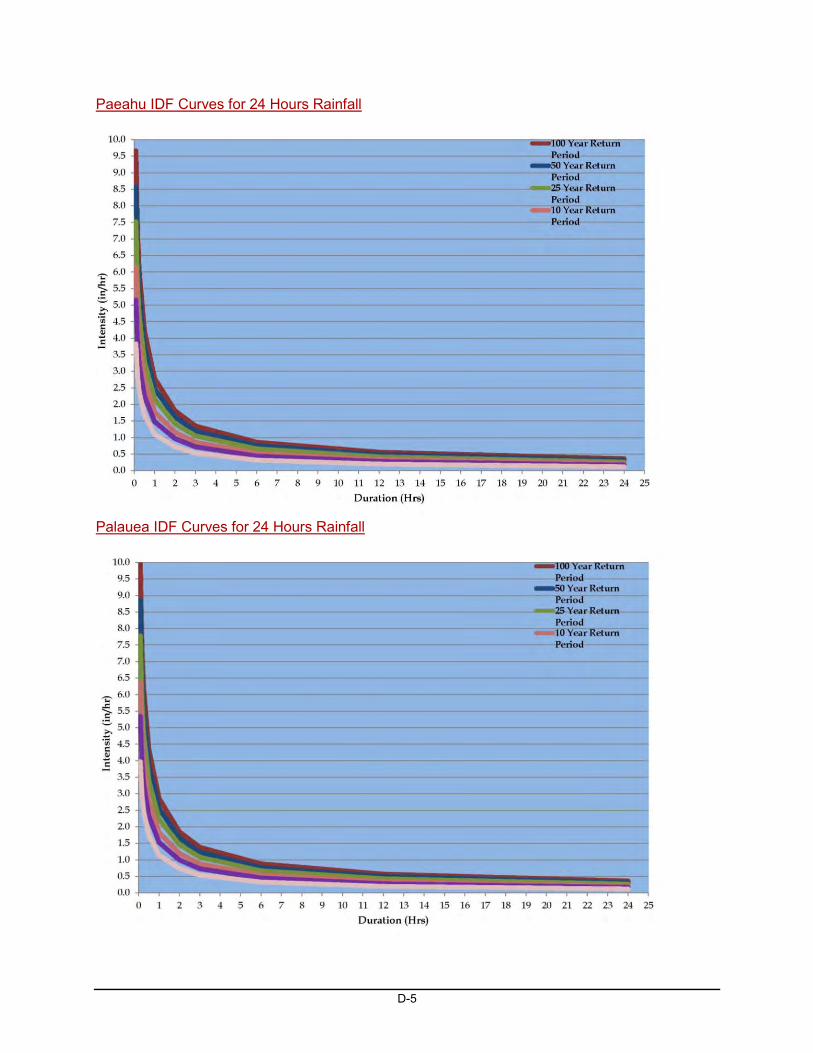
D-5
Paeahu IDF Curves for 24 Hours Rainfall
Palauea IDF Curves for 24 Hours Rainfall
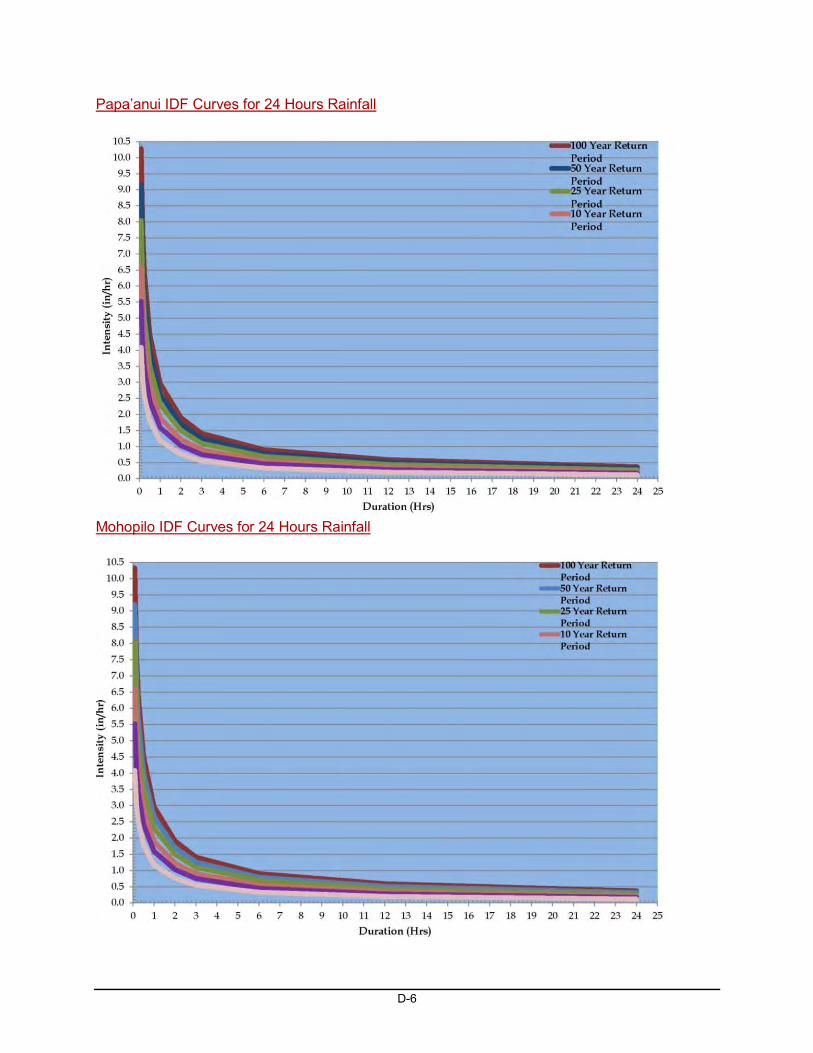
D-6
Papa’anui IDF Curves for 24 Hours Rainfall
Mohopilo IDF Curves for 24 Hours Rainfall

D-7
Mo’oloa IDF Curves for 24 Hours Rainfall

E-8
Appendix E. HYDROLOGIC MODELING METHODS
1. Rational Method
The Rational Method was first introduced in 1889. Although it is often considered simplistic, it still is appropriate for estimating peak discharges for small drainage areas of up to about 200 acres (80 hectares) in which no significant flood storage appears. The peak discharge for all the sub-basins was determined by using the Rational Method. The design period used for the analysis included 2, 5, 10, 25, 50, and 100-year return periods. According to the Rational Method, the peak discharge is given by the following equation:
Equation 11-1 Q = CIA
Q is defined as the maximum rate of runoff generated in cubic feet per second (cfs).
C is a runoff coefficient and is a function of the land use type of the sub-basin,
I represents the average intensity of rainfall in inches per hour for durations equal to the time of concentration, and
A is the contributing basin or catchment area in Acres.
The runoff coefficient, C, represents the integrated effects of infiltration, evaporation, retention, flow routing, and interception, all which effect the time distribution and peak rate of runoff. The values are presented for different surface characteristics as well as for different aggregate land uses. Given the land use in each of the sub-basin, the C values were obtained from Table 11-3.
The rainfall intensity “I” for all the sub-basins is derived from the Intensity Duration Frequency (IDF). The rainfall intensity is read from the IDF curve using the storm duration (which is set to the time of concentration) and corresponding return period.
Table 11-3 Runoff Coefficient C values
Ground Cover Selected Land Cover Runoff Coefficient, C Selected C Values Lawns 0.05 - 0.35 Forest Evergreen Forest and scrub/shrub 0.05 - 0.25 0.25 Cultivated land Cultivated Land 0.08-0.41 0.41 Meadow 0.1 - 0.5 Parks, cemeteries Open Water 0.1 - 0.25 0.25 Unimproved areas Bare Land 0.1 - 0.3 0.3 Pasture Pasture/Hay and Grassland 0.12 - 0.62 0.62 Residential areas 0.3 - 0.75 Business areas 0.5 - 0.95 Industrial areas 0.5 - 0.9 Asphalt streets Developed Open space 0.7 - 0.95 0.95 Brick streets 0.7 - 0.85 Roofs 0.75 - 0.95 Concrete streets Impervious 0.7 - 0.95 0.95

E-9
Table 11-4 Peak Discharge for each sub-basin based on Rational Method of Peak Discharge
Sr No
Water-shed Sub Basin Runoff (ft3/sec)
2-YEAR Q 5-YEAR Q 10-YEAR Q 25-YEAR Q 50-YEAR Q 100-YEAR Q 1 Hapapa Kulanihakoi 692.0 983.4 1201.9 1456.9 1784.7 2112.5 2 Waipuilani 394.1 533.2 672.3 881.0 927.4 1136.0 3 Keokea 463.3 628.7 761.1 992.7 1158.2 1356.7 4 Wailea Kamaole 818.8 1228.2 1473.9 1801.4 2096.2 2374.6 5 Liilioholo 249.9 355.1 420.8 512.9 631.3 657.6 6 Kilohana 498.8 657.5 793.6 1043.0 1201.7 1337.7 7 Paeahu 389.9 543.1 668.4 807.7 960.8 1086.2 8 Palauea 1114.6 1477.8 1778.4 2166.6 2467.2 2742.7 9 Papaanui 495.7 681.5 867.4 1074.0 1218.5 1404.4 10 Mohopilo 420.2 561.6 668.5 821.3 947.4 1069.6 11 Mooloa Mooloa 429.8 584.2 688.5 855.4 980.6 1084.9
2. HEC-HMS Model for Sub-basins
Delineation of Sub-Basins
Sub-basins are delineated including outlet points for these sub-basins. As already discussed, there are a total of eleven (11) Sub-basins delineated as part of three major Watersheds in the Project area. The Time of Concentration (Tc) and Curve Numbers (CN) for these sub-basins were calculated by utilizing data either collected from the field or assumed based on visual inspection of the streams. The summary of computed Time of concentration (Tc), and Curve numbers for the Sub-basins along with Lag time are given in the full hydrology modeling report found at www.mauiwatershed.org .
Table 11-5 Time of Concentration, Lag time and Curve Number (CN) for Sub-Basins
Sr. No. Watershed Sub Basin
Accumulated areas
Curve N0.
Time of concentration Lag Time
(Acres) (mi2) CN min min 1 a. Hapapa Kulanihakoi 10677 16.68 74 727 436 2 Waipuilani 7212 11.27 70 972 583 3 Keokea 8592 13.43 71 1246 747 4 b. Wailea Kamaole 3847 6.01 68 163 98 5 Liilioholo 3121 4.88 68 758 455 6 Kilohana 4494 7.02 69 673 404 7 Paeahu 2709 4.23 70 460 276 8 Palauea 2543 3.97 71 96 58 9 Papaanui 4244 6.63 67 607 364 10 Mohopilo 1030 1.61 70 64 38 11 c. Mooloa Mooloa 1213 1.9 71 77 46
Computation of Runoff Volumes
The options in HEC-HMS include infiltration-based methods, continuous soil moisture accounting techniques, and SCS abstraction method, i.e. Curve Number approach.

E-10
The chosen method is SCS Curve Number method. Developed in 1972, the method estimates the precipitation excess as a function of cumulative precipitation, soil cover, land use, and antecedent moisture conditions. The theory of the method is available in many text references, such as Chow 1988.
Despite some of the inherent drawbacks, the method still has many advantages to consider it most appropriate for use, such as:
Simple, predictable, and stable method
Relies on only one parameter, which varies as a function of soil group, land use and treatment, surface conditions, and antecedent moisture conditions
Features readily grasped and reasonably well documented environmental input
Well-established method, widely accepted for use in US and abroad
Has widely been used on various large irrigation and river engineering projects
Once the losses are accounted for, and excess rainfall computed, the runoff hydrograph is computed using the SCS unit hydrograph technique available as an option in the HEC-HMS program. In summary, the parameters needed to compute the hydrograph include the catchment area, curve number, and the lag time T lag. While catchment area is read from the delineated sub-basin maps marked on the topographic sheets, the time lag is computed from the relationship:
Equation 11-2 T lag = 0.6 Tc
Where Tc is the time of concentration defined as the travel time of water from the hydraulically most distant point in the catchment to reach the point of interest, which in this case the outlet of the sub-basin.
Computation of Curve Number (CN)
Computation of Curve number is the most important aspect of SCS curve number method. Curve number is a dimensionless parameter that defines the relationship between the actual and excess rainfall. The curve number depends upon the catchment characteristics including the soils; cover type, treatment, and hydrologic conditions/land use etc.
In general our project area of eleven sub-basins considered for hydrological modeling is characterized as:
1. Impervious
2. Open spaces
3. Cultivated land
4. Pastured land

E-11
5. Grass land
6. Ever green forest
7. Shrubs
8. Barren land
Typically, floods are generated in the upland hill ranges, where steep slopes, thin soils, and exposed bare rock are conducive to runoff. In lowland and piedmont areas the deep dry soils and pervious gravels are not conducive to runoff, which may be confined to particularly impervious land (e.g. tracks, fine silt/clay land bordering nullahs and similar material in depressions) or intense storms, which have been preceded by a considerable depth of rainfall, sufficient to saturate the soil. Exceptionally, very intense storms may cause runoff by exceeding the infiltration capacity of the soil. For the CN estimation the above land use classifications are further divided in to three hydrologic groups as given below:
Soil Hydrologic Group A: Soils have low runoff potential and high infiltration rates even when thoroughly wetted. They consist chiefly of deep, well to excessively drained sand or gravel and have a high rate of water transmission (> 0.30 in/hr).
Soil Hydrologic Group B: Soils have moderate infiltration rates when thoroughly wetted and consist chiefly of moderately deep to deep, moderately well to well drained soils with moderately fine to moderately coarse textures. These soils have a moderate rate of water transmission (0.15-0.30 in/hr).
Soil Hydrologic Group C: Soils have low infiltration rates when thoroughly wetted and consist chiefly of soils with a layer that impedes downward movement of water and soils with moderately fine-to-fine texture. These soils have a low rate of water transmission (0.05-0.15 in/hr).
Composite CN representative of the entire watershed is calculated by following equation:
Equation 11-3 CN Composite i C Ni
Computation of Time of Concentration
Travel time (Tt) is the time it takes water to travel from one location to another in a watershed. Tt is typically computed for various flow paths in a sub-basin and the sum of all travel paths provides the total travel time or time of concentration (Tc), which is the time for runoff to travel from the hydraulically most distant point of the watershed to a point of interest within the watershed.
Water moves through a watershed as sheet flow, shallow concentrated flow, open channel flow, or some combination of these. The type that occurs is a function of the conveyance system and is best determined by field inspection.

E-12
Travel time (Tt) is the ratio of flow length to flow velocity:
Equation 11-4 Tt = L/3600 V
Where:
Tt = travel time (hr)
L = flow length (ft)
V = average velocity (ft/s)
3600 = conversion factor from seconds to hours.
Time of concentration (Tc) is the sum of Tt values for the various consecutive flow segment paths including sheet flow, shallow concentrated flow, and open channel flow as described below:
Equation 11-5 Tc = Tt1 + Tt2 +............ Ttm
Where:
Tc = time of concentration (hr)
m = number of flow segments
Sheet Flow
Sheet flow is flow over plane surfaces. It usually occurs in the headwater of streams. With sheet flow, the friction value (Manning’s n) is an effective roughness coefficient that includes the effect of raindrop impact; drag over the plane surface; obstacles such as litter, crop ridges, and rocks; and erosion and transportation of sediment.
For sheet flow of less than 300 feet, use Manning’s kinematic solution (Overtop and Meadows 1976) to compute Tt:
Equation 11-6 Tt = 0.007 (nL) 0.8/P2 0.5 s0.4
Where:
Tt = travel time (hr)
n = Manning’s roughness coefficient
L = flow length (ft)
P2 = 2-year, 24-hour rainfall (in)
s = slope of hydraulic grade line (land slope, ft/ft)

E-13
This simplified form of the Manning’s kinematic solution is based on the following: (1) shallow steady uniform flow, (2) constant intensity of rainfall excess (that part of a rain available for runoff), (3) rainfall duration of 24 hours, and (4) minor effect of infiltration on travel time.
Shallow Concentrated Flow
After a maximum of 300 feet, sheet flow usually becomes shallow concentrated flow. The average velocity for this flow can be determined from the graphs given in TR-55 Manual in which average velocity is a function of watercourse slope and type of channel. For slopes less than 0.005 ft/ft, use equations given in Figure 11-1 taken from Appendix F of the TR-55 Manual. Tillage can affect the direction of shallow concentrated flow. Flow may not always be directly down the watershed slope if tillage runs across the slope. After determining average velocity in Figure 11-1, use above equation of sheet flow to estimate travel time for the shallow concentrated flow segment.
Open Channels
Shallow concentrated flow becomes open channel flow when it enters a well-defined channel. For the sub-basins under study, field visits were conducted in the sub-basin to determine or assume the shape of the channel. Manning’s equation or water surface profile information can be used to estimate average flow velocity. Average flow velocity is usually determined for bank full elevation.
Equation 11-7 Manning’s equation is: V = 1.49 r2/3 s1/2/n
Where:
V = average velocity (ft/s)
r = hydraulic radius (ft)
a = cross sectional flow area (ft2)
s = slope of the hydraulic grade line (channel slope, ft/ft)
n = Manning’s roughness coefficient for open channel flow
The time of concentration (Tc) is thus calculated by adding the travel times for all different flow paths (overland flow, shallow concentrated flow, and channels flow).
Meteorological Model of HEC-HMS
The meteorological models consist of point rainfall depths in inches for each sub-basin and a method to distribute this rainfall with the help of an appropriate rainfall distribution to establish the rainfall hydrograph. In the SCS unit hydrograph method, the point rainfall depth is converted into a rainfall hyetograph by using the appropriate SCS dimensionless 24-hour distribution applicable for this part of the US i.e. the SCS Hypothetical Storm Distribution Type I, which is

E-14
available as an option in the HEC-HMS program. 24-hour rainfall depths for different return periods are used as input to the meteorological model. The return periods selected for hydrological modeling are 1, 2, 5, 10, 25, 50, and 100 years.
Figure 11-1 Average Velocities for Estimating Time for Shallow Concentrated Flow (TR-55 Manual Figure 3-1)

E-15
Runoff Simulations
Once all the input data related to the sub-basin characteristics, land use, and rainfall data were finalized for all sub-basins; the runoff computations were carried out in the hydrologic software program HEC-HMS program to obtain runoff volume and peak runoff hydrograph. The simulations were performed for rainfall data corresponding to return periods of 1, 2, 5, 10, 25, 50, and 100 years as described above.
Table 11-6 Selected 24 hour rainfall depths for SCS Hypothetical storm method
Sr. No. Watershed Sub Basin Rainfall Depths-24 hour rainfall (in) 1 Year 2 Year 5 Year 10 Year 25 Year 50 Year 100 Year
1 Hapapa Kulanihakoi 2.03 2.83 4.00 4.96 6.35 7.50 8.72 2 Waipuilani 2.03 2.83 4.00 4.96 6.34 7.49 8.70 3 Keokea 2.03 2.84 4.01 4.97 6.34 7.48 8.68 4 Wailea Kamaole 2.04 2.85 4.02 4.96 6.31 7.41 8.58 5 Liilioholo 2.06 2.87 4.03 4.98 6.32 7.40 8.55 6 Kilohana 2.06 2.87 4.03 4.97 6.31 7.40 8.55 7 Paeahu 2.06 2.87 4.03 4.97 6.32 7.41 8.56 8 Palauea 2.09 2.91 4.08 5.03 6.39 7.50 8.68 9 Papaanui 2.10 2.92 4.10 5.07 6.47 7.63 8.88 10 Mohopilo 2.08 2.89 4.07 5.04 6.46 7.63 8.90 11 Mooloa Mooloa 2.08 2.89 4.07 5.04 6.44 7.60 8.84
Table 11-7 Peak discharge using SCS Curve Number method (Hypothetical storm Type I)
Sr. No.
Water-shed Sub Basin Peak Discharge-24 hour rainfall (cfs)
1 Yr 2 Yr 5 Yr 10 Yr 25 Yr 50 Yr 100 Yr 1 Hapapa Kulanihakoi 237 540 1112 1653 2508 3257 4078 2 Waipuilani 100 244 529 807 1248 1625 2076 3 Keokea 117 279 582 872 1326 1727 2165 4 Wailea Kamaole 68 231 641 1061 1751 2360 3047 5 Liilioholo 43 109 242 374 584 767 972 6 Kilohana 68 170 382 589 921 1213 1536 7 Paeahu 51 133 301 466 730 960 1214 8 Palauea 82 289 727 1152 1820 2400 3037 9 Papaanui 59 152 256 563 902 1210 1559 10 Mohopilo 29 124 341 553 902 1214 1567 11 Mooloa Mooloa 41 152 391 623 1002 1336 1706

F-16
Appendix F. HYDROGRAPHS FOR SUB-BASINS BY SCS
HYPOTHETICAL STORM (TYPE-1)
0
300
600
900
1200
1500
1800
2100
2400
2700
3000
3300
3600
3900
4200
0 500 1000 1500 2000 2500 3000 3500 4000 4500 5000
Dis
cha
rge
(cf
s)
Duration/Time (mins)
Hydrographs for Kulanihakoi sub basin 1 Year R.P
2 Year R.P
5 Year R.P
10 Year R.P
25 Year R.P
50 Year R.P
100 Year R.P
0
150
300
450
600
750
900
1050
1200
1350
1500
1650
1800
1950
2100
0 500 1000 1500 2000 2500 3000 3500 4000 4500 5000
Dis
cha
rge
(cf
s)
Duration/Time (mins)
Hydrographs for Waipuilani sub basin 1 Year R.P
2 Year R.P
5 Year R.P
10 Year R.P
25 Year R.P
50 Year R.P
100 Year R.P

F-17
0
200
400
600
800
1000
1200
1400
1600
1800
2000
2200
0 500 1000 1500 2000 2500 3000 3500 4000 4500 5000
Dis
cha
rge
(cf
s)
Duration/Time (mins)
Hydrographs for Keokea sub basin 1 Year R.P
2 Year R.P
5 Year R.P
10 Year R.P
25 Year R.P
50 Year R.P
100 Year R.P
0
200
400
600
800
1000
1200
1400
1600
1800
2000
2200
2400
2600
2800
3000
3200
0 250 500 750 1000 1250 1500 1750 2000 2250 2500 2750 3000
Dis
cha
rge
(cf
s)
Duration/Time (mins)
Hydrographs for Kamaole sub basin 1 Year R.P
2 Year R.P
5 Year R.P
10 Year R.P
25 Year R.P
50 Year R.P
100 Year R.P

F-18
0
100
200
300
400
500
600
700
800
900
1000
0 500 1000 1500 2000 2500 3000 3500 4000 4500 5000
Dis
cha
rge
(cf
s)
Duration/Time (mins)
Hydrographs for Liilioholo sub basin 1 Year R.P
2 Year R.P
5 Year R.P
10 Year R.P
25 Year R.P
50 Year R.P
100 Year R.P
0
200
400
600
800
1000
1200
1400
1600
0 500 1000 1500 2000 2500 3000 3500 4000 4500 5000
Dis
cha
rge
(cf
s)
Duration/Time (mins)
Hydrographs for Kilohana sub basin 1 Year R.P
2 Year R.P
5 Year R.P
10 Year R.P
25 Year R.P
50 Year R.P
100 Year R.P

F-19
0
100
200
300
400
500
600
700
800
900
1000
1100
1200
1300
0 500 1000 1500 2000 2500 3000 3500 4000 4500 5000
Dis
cha
rge
(cf
s)
Duration/Time (mins)
Hydrographs for Paeahu sub basin 1 Year R.P
2 Year R.P
5 Year R.P
10 Year R.P
25 Year R.P
50 Year R.P
100 Year R.P
0
200
400
600
800
1000
1200
1400
1600
1800
2000
2200
2400
2600
2800
3000
3200
0 250 500 750 1000 1250 1500 1750 2000 2250 2500 2750 3000
Dis
cha
rge
(cf
s)
Duration/Time (mins)
Hydrographs for Palauea sub basin 1 Year R.P
2 Year R.P
5 Year R.P
10 Year R.P
25 Year R.P
50 Year R.P
100 Year R.P
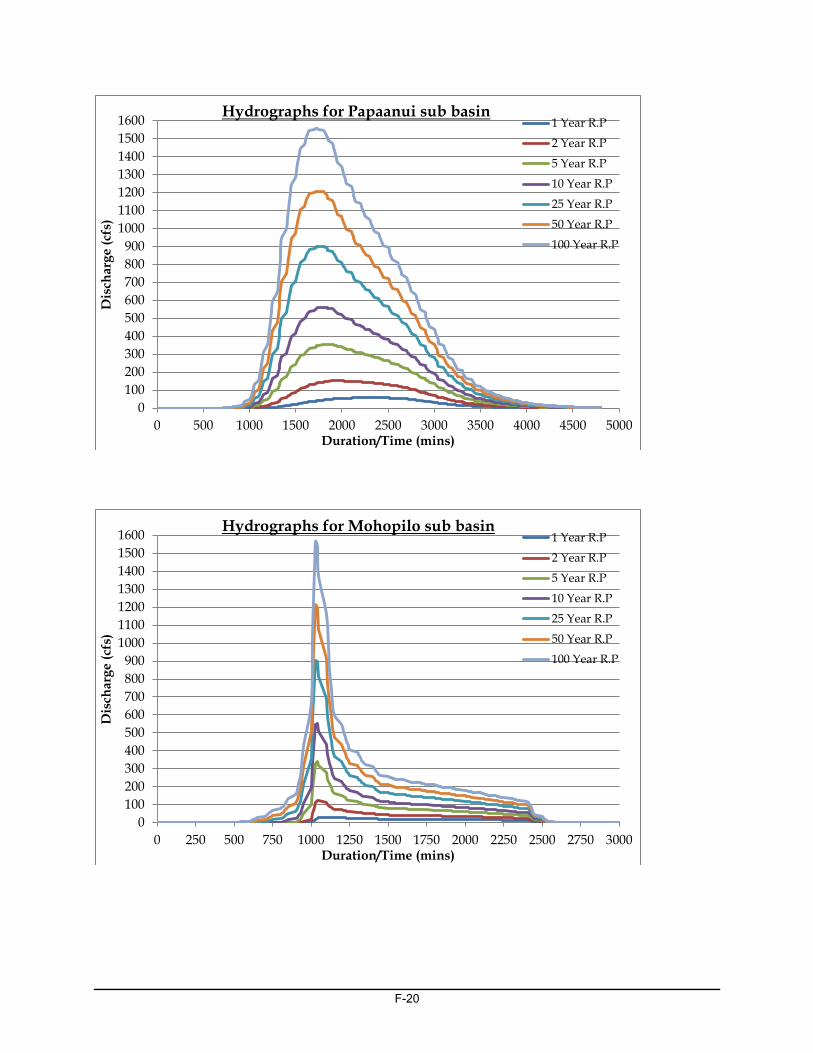
F-20
0
100
200
300
400
500
600
700
800
900
1000
1100
1200
1300
1400
1500
1600
0 500 1000 1500 2000 2500 3000 3500 4000 4500 5000
Dis
cha
rge
(cf
s)
Duration/Time (mins)
Hydrographs for Papaanui sub basin 1 Year R.P
2 Year R.P
5 Year R.P
10 Year R.P
25 Year R.P
50 Year R.P
100 Year R.P
0
100
200
300
400
500
600
700
800
900
1000
1100
1200
1300
1400
1500
1600
0 250 500 750 1000 1250 1500 1750 2000 2250 2500 2750 3000
Dis
cha
rge
(cf
s)
Duration/Time (mins)
Hydrographs for Mohopilo sub basin 1 Year R.P
2 Year R.P
5 Year R.P
10 Year R.P
25 Year R.P
50 Year R.P
100 Year R.P

F-21
0
200
400
600
800
1000
1200
1400
1600
1800
0 250 500 750 1000 1250 1500 1750 2000 2250 2500 2750 3000
Dis
cha
rge
(cf
s)
Duration/Time (mins)
Hydrographs for Mooloa sub basin 1 Year R.P
2 Year R.P
5 Year R.P
10 Year R.P
25 Year R.P
50 Year R.P
100 Year R.P

G-22
Appendix G. PELEKANE BAY WATERSHED RESTORATION PROJECT-
FINAL REPORT, MAY 31, 2011.
- The Kohala Center, www.kohalacenter.org/kwppelekane/about.html


![[Product Monograph Template - Standard]](https://img.pdfslide.net/doc/110x75/584951901a28aba93a8d61b7/product-monograph-template-standard.jpg)