Embed Size (px)
Citation preview

Standard Title Page - Report on State Project Report No.
Report Date
No. Pages
Type Report: Final
Project No.: 71177
VTRC 05-CR16
May 2005 77 Period Covered: 10/01/03 to 04/30/05
Contract No. 04-0437-09
Title: Stabilization of Soft Clay Subgrades in Virginia: Phase I Laboratory Study
Key Words: Stabilization, Soft Clay, Subgrade
Authors: Christopher M. Geiman, George M. Filz, Ph.D., P.E., and Thomas L. Brandon, Ph.D.
Performing Organization Name and Address: Department of Civil and Environmental Engineering Virginia Tech 200 Patton Hall Blacksburg, Virginia 24061-0105
Sponsoring Agencies’ Name and Address Virginia Department of Transportation 1401 E. Broad Street Richmond, VA 23219
Supplementary Notes
Abstract Many pavement subgrades in Virginia consist of wet, highly plastic clay or other troublesome soils. Such soils can be treated with traditional lime and cement stabilization methods. Alternatives, including lignosulfonates and polymers, are available, but their performance record is mixed and solid engineering data are lacking, which prevents reliable design. The goal of this research was to screen a suite of traditional and non-traditional stabilizers against three Virginia soils that have caused problems during construction or resulted in poor performance in service. The selected stabilizers were: quicklime, hydrated lime, pelletized lime, cement, lignosulfonate, synthetic polymer, magnesium chloride, and a proprietary cementitious stabilizer. A laboratory procedure was developed and applied to three Virginia soils obtained from Northern Virginia, Staunton, and Lynchburg. Key findings from the research include: (1) traditional lime and cement stabilizers were far more effective than liquid stabilizers (lignosulfonate, synthetic polymer, and magnesium chloride) in increasing strength; (2) the liquid stabilizers were ineffective on soils with a high moisture content; (3) the proprietary cementitious stabilizer was more effective in increasing strength than lime for all cases tested but not was not as effective as the cement stabilizer; (4) quicklime and hydrated lime increased the workability of the soils although they did not produce strengths comparable to cement; (5) the strength of soils stabilized with cement and the proprietary cementitious stabilizer can be estimated based on the water-amendment ratio of the mixture; and (6) the strength of soils stabilized with lime can be estimated based on a combination of the plasticity index and the water-amendment ratio of the mixture. The benefits of subgrade stabilization are that it improves the strength, stiffness, and durability of soft subgrade soils. Such improvement allows a reduction in the required thickness of overlying pavement courses and/or an increase in pavement life. Quantifying the life cycle cost benefits requires performing pavement design studies based on anticipated traffic levels, desired serviceability, etc. The preferred design method would be a mechanistic design, which requires resilient modulus values for the stabilized subgrade and other pavement layers. Neither resilient modulus testing nor pavement design studies were included in the scope of the work for this project, but they should be included in subsequent phases.

FINAL CONTRACT REPORT
STABILIZATION OF SOFT CLAY SUBGRADES IN VIRGINIA: PHASE I LABORATORY STUDY
Christopher M. Geiman, Graduate Research Assistant George M. Filz, Professor
Thomas L. Brandon, Associate Professor
Via Department of Civil and Environmental Engineering Virginia Polytechnic Institute & State University
Project Manager David W. Mokarem, Ph.D., Virginia Transportation Research Council
Contract Research Sponsored by Virginia Transportation Research Council
Virginia Transportation Research Council (A Cooperative Organization Sponsored Jointly by the
Virginia Department of Transportation and the University of Virginia)
Charlottesville, Virginia
May 2005
VTRC 05-CR16

ii
NOTICE
The project that is the subject of this report was done under contract for the Virginia Department of Transportation, Virginia Transportation Research Council. The contents of this report reflect the views of the authors, who are responsible for the facts and the accuracy of the data presented herein. The contents do not necessarily reflect the official views or policies of the Virginia Department of Transportation, the Commonwealth Transportation Board, or the Federal Highway Administration. This report does not constitute a standard, specification, or regulation. Each contract report is peer reviewed and accepted for publication by Research Council staff with expertise in related technical areas. Final editing and proofreading of the report are performed by the contractor.
Copyright 2005 by the Commonwealth of Virginia.

iii
ABSTRACT Many pavement subgrades in Virginia consist of wet, highly plastic clay or other troublesome soils. Such soils can be treated with traditional lime and cement stabilization methods. Alternatives, including lignosulfonates and polymers, are available, but their performance record is mixed and solid engineering data are lacking, which prevents reliable design. The goal of this research was to screen a suite of traditional and non-traditional stabilizers against three Virginia soils that have caused problems during construction or resulted in poor performance in service. The selected stabilizers were: quicklime, hydrated lime, pelletized lime, cement, lignosulfonate, synthetic polymer, magnesium chloride, and a proprietary cementitious stabilizer. A laboratory procedure was developed and applied to three Virginia soils obtained from Northern Virginia, Staunton, and Lynchburg. Key findings from the research include: (1) traditional lime and cement stabilizers were far more effective than liquid stabilizers (lignosulfonate, synthetic polymer, and magnesium chloride) in increasing strength; (2) the liquid stabilizers were ineffective on soils with a high moisture content; (3) the proprietary cementitious stabilizer was more effective in increasing strength than lime for all cases tested but not was not as effective as the cement stabilizer; (4) quicklime and hydrated lime increased the workability of the soils although they did not produce strengths comparable to cement; (5) the strength of soils stabilized with cement and the proprietary cementitious stabilizer can be estimated based on the water-amendment ratio of the mixture; and (6) the strength of soils stabilized with lime can be estimated based on a combination of the plasticity index and the water-amendment ratio of the mixture. The benefits of subgrade stabilization are that it improves the strength, stiffness, and durability of soft subgrade soils. Such improvement allows a reduction in the required thickness of overlying pavement courses and/or an increase in pavement life. Quantifying the life cycle cost benefits requires performing pavement design studies based on anticipated traffic levels, desired serviceability, etc. The preferred design method would be a mechanistic design, which requires resilient modulus values for the stabilized subgrade and other pavement layers. Neither resilient modulus testing nor pavement design studies were included in the scope of the work for this project, but they should be included in subsequent phases.

1
FINAL CONTRACT REPORT
STABILIZATION OF SOFT CLAY SUBGRADES IN VIRGINIA: PHASE I LABORATORY STUDY
Christopher M. Geiman, Graduate Research Assistant George M. Filz, Professor
Thomas L. Brandon, Associate Professor
Via Department of Civil and Environmental Engineering Virginia Polytechnic Institute & State University
INTRODUCTION
Many pavement subgrades in Virginia consist of wet, highly plastic clay soil. Subgrade quality has a dramatic impact on both the initial cost of pavements and on the subsequent maintenance costs. Options for dealing with soft pavement subgrades include attempting to dry and compact the subgrade; reinforcing the subgrade with a geosynthetic material; applying a chemical stabilizer such as lime, cement, polymer, or other amendment; and/or designing a very thick and expensive pavement section. Traditional lime and cement treatment can be very effective, but many Virginia contractors are hesitant to use lime and cement due to issues with dust control and other handling problems. Hydrated lime and pelletized lime offer alternatives that help reduce the handling issues but they do not eliminate them. Many other non-traditional amendments, including resins and polymers, are marketed, but their performance record is mixed and solid engineering data are lacking, preventing reliable design. This research addresses these deficiencies by performing laboratory tests on selected Virginia soils using several different amendments at varying dose rates and curing times. The effectiveness of the non-traditional stabilizers is then compared with the effectiveness of more traditional stabilizers, whose reactions are better understood and documented.
PURPOSE AND SCOPE
The primary purpose of this research was to screen a suite of traditional and non-traditional stabilizers against three Virginia soils that have caused problems during construction or resulted in poor performance in service. The selected stabilizers are: quicklime, hydrated lime, pelletized lime, cement, lignosulfonate, synthetic polymer, magnesium chloride, and a proprietary cementitious stabilizer. The scope of this research includes:
�� Characterizing the soils by performing the following tests: natural water content, particle size distribution, Atterberg limits, moisture-density relationship using standard Proctor effort, organic content, sulfate content, and mineralogy of the clay fraction.

2
�� Reviewing literature pertaining to standardized laboratory procedures for preparing mixtures using traditional stabilizers, as well as other procedures for mixtures involving non-traditional stabilizers that have been studied previously by other researchers.
�� Developing a laboratory mixture preparation and testing procedure that can be used to
evaluate and compare traditional and non-traditional stabilizers.
�� Identifying the existence and significance of trends among base soil characteristics, amendment type, amendment dose rate, and strength characteristics using the laboratory procedure developed.
Specimens prepared near the optimum water content give an indication of how well the
amendments can strengthen and stiffen a subgrade in order to help reduce the required thickness of the pavement section. Specimens prepared substantially above the optimum water content give an indication of whether the workability of the soil can be improved such that the soils can be compacted to an adequate strength and stiffness without extensive drying and/or processing.
This research provides insight into which stabilizers are most effective for stabilizing soft soils commonly encountered in Virginia. This report is not meant to replace laboratory testing on specific projects; however, it can be used as a guide to help select an appropriate stabilizer type and amount based on soil properties and desired strength. In addition, the laboratory procedure developed for this research can be used to help evaluate specific soils for specific projects.
LITERATURE REVIEW
Extensive research has been completed pertaining to the use of traditional stabilizers,
namely lime and cement. The stabilization mechanisms for lime and cement are well documented, and the effectiveness of these traditional stabilizers has been demonstrated in many applications. However, relatively little research documenting the use of nontraditional stabilizers such as lignosulfonates, synthetic polymers, and magnesium chloride is available, and their performance record is varied. Although much promotional material exists attesting to the effectiveness of nontraditional stabilizers, such materials often lack documentation of measured engineering properties, and often they do not explain the stabilization mechanism involved. This literature review focuses on the known properties of both traditional and nontraditional stabilizers, as relevant to this research. The literature review also discusses factors influencing development of the laboratory test procedures used for this research.

3
Lime Stabilization Stabilization Mechanism
Laboratory testing indicates that lime reacts with medium, moderately fine, and fine-grained soils to produce decreased plasticity, increased workability, and increased strength (Little, 1995). Strength gain is primarily due to the chemical reactions that occur between the lime and soil particles. These chemical reactions occur in two phases, with both immediate and long-term benefits.
The first phase of the chemical reaction involves immediate changes in soil texture and
soil properties caused by cation exchange. The free calcium of the lime exchanges with the adsorbed cations of the clay mineral, resulting in reduction in size of the diffused water layer surrounding the clay particles. This reduction in the diffused water layer allows the clay particles to come into closer contact with one another, causing flocculation/agglomeration of the clay particles, which transforms the clay into a more silt-like or sand-like material. Overall, the flocculation and agglomeration phase of lime stabilization results in a soil that is more readily mixable, workable, and, ultimately, compactable. According to Eades and Grim (1960), practically all fine-grained soils undergo this rapid cation exchange and flocculation/agglomeration reactions when treated with lime in the presence of water.
The second phase of the chemical reaction involves pozzolanic reactions within the lime-
soil mixture, resulting in strength gain over time. When lime is combined with a clay soil, the pH of the pore water increases. When the pH reaches 12.4, the silica and alumina from the clay become soluble and are released from the clay mineral. In turn, the released silica and alumina react with the calcium from the lime to form cement, which strengthens in a gradual process that continues for several years (Eades and Grim, 1960). As long as there is sufficient calcium from the lime to combine with the soluble silica and alumina, the pozzolanic reaction will continue as long as the pH remains high enough to maintain the solubility of the silica and alumina (Little, 1995). Strength gain also largely depends on the amount of silica and alumina available from the clay itself; thus, it has been found that lime stabilization is more effective for montmorillonitic soils than for kaolinitic soils (Lees et al., 1982).
In addition to pozzolanic reactions, carbonation can also lead to long-term strength
increases for soils stabilized with lime. Carbonation occurs when lime reacts with carbon dioxide from the atmosphere to produce a relatively insoluble calcium carbonate. This can be advantageous since after mixing, the slow process of carbonation and formation of cementitious products can lead to long-term strength increases (Arman and Munfakh, 1970). However, prior to mixing, exposure of lime to air should be avoided through proper handling methods and expedited construction procedures in order to avoid premature carbonation of the lime (Chou, 1987). Mixture Design and Strength Characteristics
When using lime as a stabilizer, the goal of the mixture design is to find the optimum lime content to adequately stabilize the soil to meet desired strength requirements. Strength

4
requirements can vary from project to project depending on the intended use of the subgrade and the overall costs associated with construction. In some instances it may be desirable to achieve the strongest subgrade possible in order to minimize pavement thickness or increase service life of the pavement. In other instances, it may be desirable to reach a lower strength level that reduces the life cycle costs for the pavement. In still other instances, the goal may be to only improve the workability of the soils such that they are compactable. Therefore, a wide range of lime contents can be used to produce various desired results.
The most common approach to mixture design is to determine the optimum lime content
that provides the maximum strength. Several procedures such as the Thompson Procedure, Eades and Grim Procedure, and the Texas Procedure, as summarized by Chou (1987), involve comparing results of strength testing using varying lime contents until a lime content that provides the maximum strength is encountered. For the Thompson Procedure and Eades and Grim Procedure, the optimum lime content is first estimated by measuring the pH of several soil-lime mixtures with varying lime contents. The lowest lime content that provides a pH of 12.4 is then used as the starting point for determining the optimum lime content. For Illinois soils, it was demonstrated that the lime content determined by the pH test was approximately the same as the lime content producing the maximum compressive strength (Thompson and Eades, 1970). While the pH test gives a good indication of the lime content that provides the maximum soil strength, this must be verified through strength testing as indicated by Eades and Grim (1966). Specimens prepared at the starting lime content determined by the pH test, as well as lime contents above and below the starting point (typically in increments of 2 percent), are then subjected to strength testing to determine the actual optimum lime content.
The Texas Procedure, as summarized by Chou (1987), first estimates the optimum lime content using the plasticity index of the soil and the percentage of soil passing the No. 40 sieve as indicated in Figure 1. After estimating of the optimum lime content, strength testing is then used to verify the actual optimum lime content.
While the procedures outlined help to identify the lime content that will provide the
greatest strength, many factors influence the strength of soil-lime mixtures. The variability of these factors makes it practically impossible to pinpoint the strength that may be achieved for lime stabilization of a particular soil. Therefore, strengths of soil-lime mixtures must be verified through strength tests such as CBR, unconfined compressive strength, or resilient modulus. Lime contents between 2 to 10 percent are typically capable of producing significant strength gains (Little, 1995). While there is no universal definition of significant strength gain, most design procedures implement a requirement for a compressive strength increase of 50 psi for lime stabilization to be a viable option (Chou, 1987).

5
Figure 1. Texas Department of Transportation Selection of Optimum Lime Content
Cement Stabilization Stabilization Mechanism
Strength gain in soils using cement stabilization occurs through the same type of pozzolanic reactions found using lime stabilization. Both lime and cement contain the calcium required for the pozzolanic reactions to occur; however, the origin of the silica required for the pozzolanic reactions to occur differs. With lime stabilization, the silica is provided when the clay particle is broken down. With cement stabilization, the cement already contains the silica without needing to break down the clay mineral. Thus, unlike lime stabilization, cement stabilization is fairly independent of the soil properties; the only requirement is that the soil contains some water for the hydration process to begin.
Similar to lime stabilization, carbonation can also occur when using cement stabilization.
When cement is exposed to air, the cement will react with carbon dioxide from the atmosphere to

6
produce a relatively insoluble calcium carbonate. Thus, similar to lime, proper handling methods and expedited construction procedures should be employed to avoid premature carbonation of cement through exposure to air. Mixture Design and Strength Characteristics
Unlike lime stabilization, the goal of mixture design using cement stabilization is to find the lowest cement content that will produce a desired strength. Ingles and Metcalf (1972) indicate that strength gain of soil-cement mixtures increases linearly with cement content. Accordingly, many mixture design procedures involve molding and curing specimens at varying cement contents until the lowest cement content that provides the required strength is achieved.
However, it was shown by Miura et al. (2002) for soil-cement prepared by the deep mixing method that the primary factor governing the behavior of cement-stabilized soil is the water-cement ratio. The water-cement ratio is defined as the ratio of moisture content of the soil to the cement content, with both the moisture content and cement content expressed in terms of dry weight of soil. Test results indicated that increasing water-cement ratio produced decreasing strength of the cement-stabilized soil. For Hong Kong clay, the 28-day unconfined compressive strength, qu, was related to the water-cement ratio, w/c, by the equation qu = 2461 kPa/1.22w/c (Miura et al., 2002).
It has also been shown by Mitchell et al. (1974) that the unconfined compressive strength
of soil-cement mixtures increases with increasing cement content according to:
qu(t) = qu(t0) + K log t/t0 where: qu(t) = Unconfined compressive strength at t days, kPa qu(t0) = Unconfined compressive strength at t0 days, kPa K = 480 Aw for granular soils and 70 Aw for fine-grained soils Aw = Cement content, percent by mass t = Curing time
Stabilization Using Polymers
A variety of natural polymers, such as lignosulfonate and synthetic polymers are
marketed, but the constituents of the polymers are typically undisclosed by suppliers. We were not able to locate publications describing research into the exact physical or chemical reactions that take place between the soil and polymer. However, it is known that the polymers consist of hydrocarbon chains, and it is thought that these chains become entwined within the soil particles thus producing a stabilizing effect. In effect, the polymers act as a binder to glue the soil particles together reducing dust, and even stabilizing the entire soil matrix (Brown et al., 2004).
Tingle et al. (2003) performed unconfined compressive strength testing on lean clay and fat clay treated with various natural and synthetic polymers. For the lean clay, the greatest increase in strength compared to untreated samples was obtained from treatment with lignosulfonate. Treatment with synthetic polymer also showed an increase in strength for the lean clay, although not as great of an increase as encountered with lignosulfonate treatment. For

7
the fat clay, treatment with synthetic polymer also showed increases in strength. Lignosulfonate treatment of the fat clay was not included in the testing program.
Gow et al. (1960) also demonstrated that lignosulfonate could be an effective stabilizer. The lignosulfonate was used to treat a soil-aggregate mixture, then California Bearing Ratio (CBR) tests were performed on compacted samples. Unsoaked specimens showed the greatest increases in CBR value after curing for a week. Soaked specimens still showed an increase in strength after curing for a week, but the strength increase was markedly less than that seen with unsoaked specimens. This phenomenon seems to be linked to the hydrophilic nature of the lignosulfonate, as it will tend to dissolve in water.
Testing performed by Sinha et al. (1957) using lignins mixed with Iowa loess (silty clay loam) showed little promise in increasing soil strength. Several forms of lignins were used (it is unknown whether these same lignins are still marketed today), producing similar results with relatively insignificant increases in strength. However, Sinha et al. (1957) did imply that lignins could be more effective on granular soils than fine-grained soils.
Stabilization Using a Proprietary Cementitious Stabilizer
This section summarizes key information from one reference related to a proprietary cementitious stabilizer that was included in our research. This stabilizer, which is known as RBI Grade 81, is produced by Anyway Solid Environmental Solutions, LTD. Due to the proprietary nature of the stabilizer, the constituents of the product are not revealed by the manufacturer. However, according Yotam Engineering Ltd. (2004), the proprietary cementitious product consists of natural components that act to stabilize soils by means of a hydration process very similar to that found in concrete. When the proprietary cementitious product is mixed with a soil, the soil and stabilizer exchange ions thus creating ionic bonds between the soil and stabilizer particles. The soil voids are then filled with “crystalline reaction products,” producing mechanical ties between the soil and stabilizer particles. This chemical process is described as continuing over a period of time, thus improving soil strength over time.
As documented by Yotam Engineering, Ltd. (2004), the proprietary cementitious
stabilizer improves the index properties of the soil. The literature indicates that this stabilizer produces decreases in liquid limit and plasticity index, with the most pronounced effects occurring for fat clays or elastic silts (liquid limits greater than 50 percent). The data indicate that, when mixed with soils with high liquid limits, the liquid limit and plasticity index are reduced by approximately 25 to 50 percent using a stabilizer content of 4 percent. However, for lean clays or silts (plasticity indices less than 50 percent), the liquid limit of the soil remains relatively unchanged when mixed with the stabilizer.
In addition, when mixed with the proprietary product, the unconfined compressive
strengths and CBR values of lean clays and fat clays increased compared to untreated samples (Yotam Engineering Ltd., 2004). Unconfined compressive strengths for untreated specimens, ranging from 0 to 43 psi, were increased to a range of 100 to 600 psi for stabilizer concentrations between 2 and 4 percent. CBR values for untreated specimens of 2.5 to 3 percent were increased to 9.5 to 12 percent using a stabilizer concentration of 6 percent.
8
Sample Storage and Preparation Prior to Addition of Stabilizer Several sources indicate that the following measures should be taken for storage and preparation of soil samples prior to laboratory mixing with soil stabilizers.
�� The Swedish Geotechnical Society states that samples should be stored at a constant ambient temperature similar to that in-situ (Carlsten and Ekstrom, 1995).
�� Samples should be stored at 100 percent relative humidity in sealed, airtight
containers free of excess air to prevent drying of the samples (Carlsten and Ekstrom, 1995).
�� After soil mixing but prior to stabilizer addition, a mellowing time is sometimes
recommended to allow for moisture equalization of the sample. A period of 16 hours is recommended by Rauch et al. (2002). However, if oxidation, aging, and/or aerobic reactions alter the physical and/or chemical characteristics of the soil, it may be desirable to reduce or eliminate this mellowing time.
Laboratory Sample Production and Sample Extraction
Relatively little testing of non-traditional stabilizers has been performed to date and a
standard procedure for preparation and testing has not been established. ASTM test procedures and research involving preparation of cement and lime soil mixtures were reviewed, as well as research involving testing of non-traditional stabilizers similar to those used in this study. An association matrix that compares and contrasts the methods suggested by these different sources is presented in Table 1. Based on this association matrix and some preliminary testing trials, a test procedure was developed for use in this research. The laboratory procedures reviewed generally did not indicate a specific mixing time for the mixture of soil and stabilizer. However, there is a consensus in that mixing should continue until the mixture is thoroughly blended and a high degree of homogeneity is achieved. Through this research, a maximum 5-minute mixing time was found to be adequate to achieve the desired homogeneity and was used accordingly.

9

10
Several different methods for compaction of the soil-stabilizer mixtures have been used in previous research, some of which make it difficult to gauge how much compaction energy was used. The methods employed for compaction of the mixtures include rodding, statically compressing, or tamping with a mallet (see Table 1), which provide for varying amounts of compaction energy that, in many cases, cannot be measured accurately. For this research, standard Proctor compaction energy was used in order to minimize variations in compaction energy. This allowed for more consistency throughout sample production and, ultimately, more consistent results. Standardized methods for extracting specimens from the molds have not been established since they vary depending on the type of mold used. The mold types used in previous research include plastic molds, cardboard molds, and standard or modified Proctor molds. Independent of the mold type used, the samples must be prepared in such a manner that the ends are smooth, flat surfaces perpendicular to the sample length.
METHODS AND MATERIALS
Soil Characterization Moisture Content (ASTM D 2216-98 and ASTM D 4643-00)
Both the oven-drying method and the microwave oven method were used to determine the moisture contents of the samples. For the oven-drying method, small, representative specimens obtained from large bulk samples were weighed as received, then oven-dried at 105�C for 24 hours. The sample was then reweighed, and the difference in weight was assumed to be the weight of the water driven off during drying. The difference in weight was divided by the weight of the dry soil, giving the water content on a dry weight basis. For the microwave oven method, the samples were subjected to an interval of drying in the microwave oven, then reweighed. This procedure was repeated until a nearly constant mass was obtained, then the moisture content was calculated in the same fashion as for the oven drying method. Particle Size Distribution (ASTM D 422-63)
Approximately 50 grams of dry soil was treated with a dispersing agent for 18 hours. A hydrometer analysis was then performed to measure the amount of silt and clay size particles. The sample was then washed through a series of sieves with progressively smaller screen sizes to determine the percentage of sand-sized particles in the specimens. Atterberg Limits (ASTM D 4318-00)
Representative samples of each soil were subjected to Atterberg limits testing to determine the plasticity of the soils. An Atterberg limits device was used to determine the liquid limit of each soil using the material passing through a 475 �m (No. 40) sieve. The plastic limit of each soil was determined by using soil passing through a 475 �m sieve and rolling 3-mm diameter threads of soil until they began to crack. The plasticity index was then computed for

11
each soil based on the liquid and plastic limit obtained. The liquid limit and plasticity index were then used to classify each soil. Classification (ASTM D 2487-00)
Each soil was classified using the Unified Soil Classification System (USCS). Using the particle size distribution and the Atterberg limits, the USCS designates a two letter symbol and a group name for each soil. A visual-manual procedure can also be used to identify soils easily in the field; however, all classifications provided in this research are based on the laboratory testing-based procedure. Organic Content (ASTM D 2974-00)
The organic content of each soil was determined by first oven-drying a representative sample of each soil at 105�C for 24 hours, then recording the moisture content. The sample was then placed in a muffle furnace, heated to 440�C, and then reweighed after a nearly constant mass was achieved. The ash content of the sample was then recorded as the weight loss due to ignition divided by the initial dry weight. The organic content was then calculated as 1 minus the ash content. Specific Gravity (ASTM D 854-00)
Values for specific gravity of the soil solids were determined by placing a known weight of oven-dried soil in a flask, then filling the flask with water. The weight of displaced water was then calculated by comparing the weight of the soil and water in the flask with the weight of flask containing only water. The specific gravity was then calculated by dividing the weight of the dry soil by the weight of the displaced water. pH (ASTM D 4972-01)
The pH values of each soil were obtained by adjusting air-dried samples to a moisture content of 100 percent by adding distilled water. Values of pH were then measured using a calibrated pH probe. Sulfate Content (AASHTO T290-95)
The water-soluble sulfate content was determined for each soil by mixing oven-dried samples with a known amount of water. The mixture was then placed in a centrifuge, and the sulfate ion concentration of the supernatant was measured. The sulfate content was then reported as mg of sulfate per kg of dry soil. Mineralogical Analysis
Mineralogical analysis of each soil consisted of x-ray diffraction (XRD) and thermal analysis on the clay fraction (<2 �m). Pretreatment of the entire sample for mineralogical analysis included removal of organic matter with 30% H2O2 buffered at a pH of 5 with 1 M

12
NaOAc (Kunze, 1965). Sand was separated by retention on a #300 mesh wet sieve. The suspension passing through the sieve included the silt and clay fractions, which were separated by centrifuging and decanting using a 1 M Na2CO3 (pH 9.5) as a dispersant. X-ray diffraction was used to determine clay-mineral suites present by analyzing oriented, magnesium-saturated, glycerol-solvated samples both with no heat treatment and after four hours of heating at 110�C. A similar analysis was performed on potassium-saturated samples both with no heat treatment and after heating for four hours at 110, 300, and 500�C. Samples were scanned at a fixed counting time of four seconds at 0.075� of 2� per step using CuK� radiation (20 MA, 40 kV). Mineral quantities were estimated as integrated intensities of their respective x-ray diffraction peaks. Sub-samples of the potassium-saturated clay fractions were also analyzed by thermogravimetric (TGA) analyses. Samples were heated from 50 to 1000�C in a nitrogen atmosphere at a rate of 20�C per minute. Kaolinite and gibbsite quantities were verified by mass-equivalent calibration of weight loss using poorly crystalline Georgia kaolinite and Reynolds synthetic gibbsite as standards.
Standardized Methods for Preparing and Testing Specimens
Our standardized test procedure synthesizes ASTM procedures for mixing specimens using traditional stabilizers with other procedures used for mixing specimens for non-traditional stabilizers. An association matrix comparing and contrasting the various methods was presented in Table 1. The following is a brief discussion and explanation of the procedures used for preparing and testing the specimens. The complete step-by-step procedure is included in Appendix A. Pretreatment Sample Care and Pre-treatment Storage
In order to prevent moisture loss or premature oxidation, care was taken to protect the bulk soil samples. Bulk samples were placed inside thick-gauge plastic bags, a small hand vacuum was used to remove excess air from the bags, and the bags were tightly sealed after air removal. The bags were then placed on a rack inside of a plastic tub, allowing for a clearance of 1 to 2 inches above the bottom of the tub. Next, water was poured into the plastic tub to completely cover the bottom, but the water was not allowed to touch the bottom of the plastic bags. A tight lid was then placed over the tub. The tubs with bulk samples were then kept sealed and stored at room temperature. This storage technique produced a humid environment and prevented the samples from drying. Obtaining a Representative Sample
After obtaining enough soil from the large bulk samples to create one batch of specimens (approximately 1800 grams), any particles larger than 5 mm were removed. This was typically accomplished by hand, but a wire mesh screen can also be used. The screened soil was then blended together by hand until uniform.

13
Initial Moisture Content
Representative samples were taken to determine the moisture content of the sample. If the natural moisture content of the sample was higher than desired for mixing, the sample was air-dried to a moisture content just below the target value. Special care was taken to frequently mix the soil to promote uniform drying throughout the sample. Mixing of Soil and Stabilizer Mixing Device
A 450 watt KitchenAid� stand mixer with 4 liter capacity mixing bowl was used for mixing of the soil and stabilizer. A mixer of this size allowed for production of four specimens per batch (one for each of four curing times) to be made. Two batches were prepared for each mixture so that a total of eight specimens were created, which permitted testing two specimens at each of four curing times. In this research, a dough hook proved effective for blending the soil and stabilizer together. Mixing Procedure
If necessary to achieve the desired moisture content for the batch, additional water was first blended into the soil and mixed for 3 to 5 minutes. After water addition, the appropriate amounts of stabilizer were then added to the mixture and blended thoroughly for 3 to 5 minutes. The mixer was set at the lowest speed, and the water and stabilizer were each added slowly to promote uniform blending and to prevent clumping of the soil and/or stabilizer. It was sometimes necessary to stop the mixer and scrape unmixed portions from the sides and bottom of the bowl into the mixture and resume mixing. Dosage Rates
Dosage rates can be specified in many different ways, but the most common way to define the dosage rate is based on the dry weight of soil to be treated. Manufacturer’s recommendations for the stabilizers used in this research are given as a percentage of the dry weight of the untreated soil. Accordingly, the amount of stabilizer to be used was found from the following formula:
Amount of stabilizer = PS x WTOT / (1 + w) where: PS = Percent by dry weight of stabilizer to be used WTOT = Wet weight of batch prior to addition of stabilizer w = Moisture content of soil prior to addition of stabilizer, expressed as a decimal
For the stabilizers used, manufacturer’s recommendations and historical data indicate that typical dosage rates commonly used range from about 2 to 5 percent. These ranges were expanded in this research to cover a broader range of moisture contents and stabilizer concentrations.

14
Mellowing Time
Some published test procedures mention a “mellowing time,” which is a rest time between mixing the amendment with the soil and compacting the mixture into molds to form specimens. For cement-amended soils, a mellowing time is generally not specified, but ASTM D 3551 indicates that a one hour mellowing time is typical for soil-lime mixtures. In addition, Rauch et al. (2002) indicate that for mixtures involving polymers, a mellowing time of one hour should be allowed. However, Tingle et al. (2003), Jacobson et al. (2003), and Little (1995) do not allow for any mellowing time after addition of stabilizer. Due to this discrepancy, a study of the effects of mellowing time on unconfined compressive strength of some select soil mixtures was performed. Based on the results of the mellowing time study (which can be found in the Results section of this report), it was determined that a mellowing time would not be included in the standardized laboratory procedure. However, a maximum allowable time of 30 minutes was specified between mixing and compaction. Specimen Molding Procedures Strength testing was performed on samples cured in 50 mm diameter by 100 mm tall plastic molds. In order to quickly and conveniently compact the soil into the plastic molds for unconfined compressive strength testing, a special cylindrical mold stand was fabricated. The stand provides support for the plastic mold during compaction. In addition, a special hammer was designed for this project to provide the same compactive effort as a traditional standard Proctor hammer, but it is scaled down to accommodate the smaller molds to be used for sample preparation. In addition, the special hammer is designed so that the ratio of the hammer face area to the compacted surface area of the cylinder is identical to that of the standard Proctor hammer and mold. The dimensions of the mold stand and special hammer are shown in Figure 2, and pictures of the mold stand and special hammer are shown in Figure 3.
The specimen preparation procedure involved placing the soil-stabilizer mixture into the molds in three layers of approximately equal thickness. However, prior to placement of the three layers, an initial thin lift of the soil-stabilizer mixture approximately ¼-inch thick was compacted with a small rod around the perimeter of the mold. During preliminary testing, it was noticed that loose material in the bottom corners of the mold not only caused difficulty in extracting intact specimens, but also produced erratic and inaccurate test results. To prevent this, the initial thin lift compacted around the perimeter helped to ensure that the mixture was compacted into the bottom corners of the mold, and this technique eliminated the problems initially encountered.
After placement of the initial thin lift, the three layers of the soil-stabilizer mixture were
compacted into the molds using 22 blows of a 2.75 pound hammer with a six inch drop at a rate of approximately 22 blows per minute in a manner to provide complete, uniform coverage of the specimen surface. A straight edge was then used to screed off the specimen flush with the top of the plastic mold, and the mold was then capped with a plastic lid. Compaction of all specimens from a single batch was completed within 30 minutes of completion of mixing.

15
Figure 2. Cylinder Mold Stand and Special Hammer Dimensions
Figure 3. Cylinder Mold Stand (left) and Special Hammer (right)
To verify that the test specimen compaction procedure is equivalent to that of a standard
Proctor hammer, moisture-density relationship tests were performed on each soil using the special hammer and mold. The points developed using the smaller hammer and molds are plotted on the moisture-density plots for these soils (see Appendix B). The verification points

16
show a reasonably good relationship between standard Proctor densities and the densities achieved using the test specimen compaction procedure. Curing Curing Temperature and Humidity Since this research did not involve investigation of variations of curing temperature, all samples were cured at room temperature (approximately 20�C). In addition, the tightly sealed samples were submerged in a water bath to provide a curing environment of 100% relative humidity. Alternatively, the sealed samples could have been stored in a humid room at 100% relative humidity. Curing Time Curing times of 3, 7, 14, and 28 days were used in this research. Two samples for each curing time were prepared in order to provide an indication of reproducibility as well as to provide sufficient data for accurate interpolation of the results. Additional curing times beyond 28 days may be desired in some cases to investigate longer term changes in strength. Sample Extraction and Preparation for Strength Testing Several different techniques were tried for extracting the specimens from the molds without damaging them or subjecting them to excessive stress. The best procedure for extracting the samples was to use a Dremel rotary cutting tool to cut through the mold, taking care not to cut into the specimen. The mold was cut from top to bottom along three or four equally spaced lines around the mold, and then the mold was peeled off the specimen. For softer specimens, it was also necessary to cut off the bottom of the mold to facilitate extraction of the specimen. If necessary, a straight edge and miter box was used to trim the specimen ends so that the ends were planar and parallel. Unconfined Compressive Strength Testing (ASTM D 2166-00) Unconfined compressive strength testing was performed on all extracted specimens using a strain rate of approximately 1 percent per minute. A data acquisition system was used to record the applied load and deformation. Corrections to the cross-sectional area were applied prior to calculating the compressive stress on the specimen. Each specimen was loaded until peak stress was obtained, or until an axial strain of approximately 15% was obtained.
Stabilizers Lime Three types of lime were used in this study. High calcium quicklime (CaO) and hydrated lime (Ca(OH)2) were donated by Chemical Lime, which is a lime manufacturing plant located in

17
Ripplemead, Virginia. In addition, pelletized lime (Ca(OH)2) was purchased from a local hardware store. Cement Type I/II portland cement was purchased from a local hardware store for use in this research. Type I/II cement provides the general performance characteristics of Type I cement while also providing moderate sulfate resistance and lower heat of hydration attributed to Type II cement (Kosmatka and Panerese, 1994). Lignosulfonate Lignosulfonate, produced under the name Norlig A, was donated by Lignotech USA. Norlig A is a calcium-based lignosulfonate in liquid form that is primarily used for dust control applications. The exact constituents in the lignosulfonate were unavailable, but lignins are typically derived as a byproduct of the paper industry. The lignin acts as a binder to adhere soil particles together, similar to a glue. Synthetic Polymer A synthetic polymer in liquid form, produced under the name Enviroseal M10-2001�, was donated by the Enviroseal Corporation. This synthetic polymer is primarily used as a topical coating to reduce UV damage and surface damage, but it has also been used for stabilization of silty, sandy, and gravelly soils, as well as a containment agent for preventing leaching of water into sensitive groundwater systems. According to the manufacturer, this product is identical to the synthetic polymer used in research performed by Tingle et al. (2003), except that it has an additional additive to help reduce UV damage. Magnesium Chloride Magnesium chloride under the name RSP MG was donated by Innovative Municipal Products. This magnesium chloride is typically used for dust control applications. According to the manufacturer, the magnesium chloride can also help reduce road maintenance costs due to its hygroscopic nature. Proprietary Cementitious Stabilizer A cementitious soil stabilizer in powder form, produced under the name RBI Grade 81, was donated by Anyway Solid Environmental Solutions, LTD. RBI Grade 81 is a proprietary product and, as such, the components of the stabilizer are undisclosed. However, documentation provided by the manufacturer indicates that RBI Grade 81 consists of natural components that provide soil stabilization by means of a hydration process, similar to that encountered with portland cement.

18
RESULTS The following section presents the results of laboratory tests performed for three Virginia soils that have caused problems during construction or resulted in poor performance in service. The three soils were obtained from three different regions of the state: Northern Virginia, Staunton, and Lynchburg. General descriptions of the soils are presented first, results of the soil characterization tests are presented second, and results of unconfined compressive strength testing are presented last. Raw test data are not provided with this report, but they are available upon request.
General Soil Descriptions Northern Virginia Sandy Lean Clay Northern Virginia Sandy Lean Clay (NoVa Clay) was obtained from an alluvial deposit in Springfield, Virginia. It consists primarily of low to medium plasticity fines, some fine to medium sands, and trace subrounded gravel, and it is orangish red in color. Based on results of characterization tests performed, this soil classifies as a CL according to the USCS classification system and as an A-6 according to the AASHTO classification system. The maximum dry unit weight corresponding to standard Proctor effort is 106.3 pcf with an optimum moisture content of 20.2 percent. Staunton Fat Clay Staunton Fat Clay (Staunton Clay) is a residual soil obtained from Staunton, Virginia. It consists primarily of medium to high plasticity fines with a small proportion of fine to medium sands, and is reddish orange in color. Based on results of characterization tests performed, this soil classifies as a CH according to the USCS classification system and as an A-7-5 according to the AASHTO classification system. The maximum dry unit weight corresponding to standard Proctor effort is 92.0 pcf with an optimum moisture content of 26.0 percent. Lynchburg Silty Sand Lynchburg Silty Sand (Lynchburg Sand) is a residual soil obtained from Lynchburg, Virginia. It consists primarily of fine to medium sands with some non-plastic fines, and it is tan, brown, and silver in color. Based on results of characterization tests performed, this soil classifies as an SM according to the USCS classification system and as an A-2-4 according to the AASHTO classification system. The maximum dry unit weight corresponding to standard Proctor effort is 101.3 pcf with an optimum moisture content of 19.2 percent.
Soil Characterization Tests Soil characterization tests were performed on each soil sample in accordance with accepted ASTM and AASHTO procedures, or other accepted procedures as outlined in the “Methods and Materials” section of this report. The results of the characterization tests are in Table 2.

19
Table 2. Soil Characterization Test Results on Sealed Specimens
Atterberg Limits
Sample
Moisture Content
(%) LL PL PI % Fines % Clay (<2�) GS
Organic Content
(%)
Sulfate Content
(%) pH NoVa Clay 18.4% 40 20 20 66 32 2.80 2.7 8.8 4.4 Staunton Clay 24.2% 53 25 28 81 59 2.74 3.7 8.5 4.3 Lynchburg Sand 13.8% 31 NP* NP* 23 3 2.73 2.5 23.7 5.9
* NP = non-plastic In addition, the effects of drying and exposure to air were investigated for each of the soils in order to determine impacts on the plasticity of the soil. The Atterberg limits were determined on the soil particles passing the 475 �m (No. 40) sieve for three cases: sealed condition (no drying), air drying, and oven drying. As seen in Table 3, fairly significant decreases in both liquid limit and plasticity index were noted for the clay soils, with oven drying providing the largest decrease. The Lynchburg Sand showed a slight drop in liquid limit. Therefore, since exposure to air and drying of the soils made them less plastic than would be encountered in their natural states, care was taken to ensure that the samples remained at the field moisture content.
Table 3. Comparison of Atterberg Limits for Three Exposure Conditions
Sealed Condition Air-Dried Condition Oven-Dried Condition Sample LL PL PI LL PL PI LL PL PI NoVa Clay 40 20 20 35 21 14 32 22 10 Staunton Clay 53 25 28 49 24 25 44 25 19 Lynchburg Silt 31 NP* NP* 28 NP* NP* 25 NP* NP*
* NP = non-plastic Full grain size distribution analyses (including hydrometer) were also performed for each soil. The grain size distributions are presented in Figure 4. In addition to basic characterization tests, mineralogical analyses of the clay fraction were performed. As shown in Table 4, the clay fraction of the NoVa and Staunton Clays are dominated by kaolinite and montmorillonite, while the clay fraction of the Lynchburg Sand is dominated by kaolinite only. Lesser quantities of other minerals including mica, vermiculite, and quartz are also present.

20
10 20 40 60 100
140
200
4
0
20
40
60
80
100
0.00
1
0.010.
1110
Particle Diameter, mm
Perc
ent F
iner
NoVa ClayStaunton ClayLynchburg Sand
U.S. Standard Sieve Numbers Hydrometer
Sand Coarse Medium Fine Silt and Clay
Figure 4. Grain Size Distribution Curves for NoVa Clay, Staunton Clay, and Lynchburg Sand
Table 4. Mineralogical Analysis Results
Percent of Clay Fraction (<2�) Sample Kaolinite Montmorillonite Mica Vermiculite HIV* Gibbsite Quartz NoVa Clay 25 35 5 15 5 3 12 Staunton Clay 45 20 10 10 4 1 10 Lynchburg Sand 50 0 15 10 10 10 5
*HIV = Hydroxy Interlayered Vermiculite = a 2:1 type mineral containing partially neutralized aluminum in the interlayer.
Unconfined Compressive Strength Testing
Preliminary Investigation of Mellowing Time
Since there seemed to be discrepancies in the literature regarding whether or not to
include a mellowing time, a study of the effects of mellowing time on unconfined compressive strength of soil mixtures involving cement, quicklime, lignosulfonate, and polymer was performed. The mellowing study was performed using the NoVa Clay and the Staunton Clay. The procedure involved mixing the soil with the stabilizer and allowing the mixture to mellow in a sealed container for different periods of time before compacting the mixture into the molds. Eight specimens were created for each soil using quicklime, cement, lignosulfonate, and polymer

21
stabilizers. The first specimen was compacted immediately after completion of mixing. The remaining specimens were then compacted at 15-minute intervals, with a maximum mellowing time of 105 minutes allowed. The mixture was sealed with plastic between creation of successive specimens to prevent evaporation losses.
The specimens were compacted in plastic molds and sealed with plastic lids. The sealed specimens were submerged in water at room temperature to prevent drying by diffusion of moisture out of the sealed compaction molds. The specimens were cured for 7 days, then extracted from the molds and subjected to unconfined compressive strength testing. The test results from the mellowing study are shown in Figure 5 for NoVa Clay and Figure 6 for Staunton Clay, with dosage rates indicated for each amendment used.
0
20
40
60
80
100
120
140
160
0 20 40 60 80 100 120
Mellowing Time, min
Unc
onfin
ed C
ompr
essi
ve S
treng
th, p
si
Quicklime (5%) Type I/II Cement (5%) Lignosulfonate (2%) Synthetic Polymer (2%)
Figure 5. Mellowing Time vs. Unconfined Compressive Strength – NoVa Clay

22
0
20
40
60
80
100
120
140
160
0 20 40 60 80 100 120
Mellowing Time, min
Unc
onfin
ed C
ompr
essi
ve S
treng
th, p
si
Quicklime (5%) Type I/II Cement (5%) Lignosulfonate (2%) Synthetic Polymer (2%)
Figure 6. Mellowing Time vs. Unconfined Compressive Strength – Staunton Clay
The mellowing study shows that mellowing time has little effect on the unconfined compressive strength of the samples stabilized with quicklime, lignosulfonate, and synthetic polymer. Soils stabilized with lignosulfonate and polymer showed the least variation in compressive strength. Soils stabilized with quicklime showed more variation in compressive strength; however, the strength values tended to vary around the mean strength value with no consistent trend of change in strength due to mellowing time. The largest variation in compressive strength is seen when using cement stabilization.
As shown in Figure 6, the cement-treated Staunton Clay seems to exhibit a trend of
decreasing strength with increasing mellowing time, although there are wide fluctuations in the trend, presumably due to variations from specimen to specimen. The data in Figure 5 show that the cement-treated NoVa Clay is unaffected by mellowing time.
Based on the results of this mellowing study, it was decided that a mellowing time would
not be included in the standardized laboratory procedure. However, a maximum allowable time of 30 minutes was specified between mixing and compaction. Testing Program For this research, it was desired to evaluate the effectiveness of the stabilizers mixed with soils at the optimum moisture content as well as substantially above the optimum moisture content. Low to medium dosage rates were used for soils at optimum moisture content, while

23
medium to high dosage rates were used for soils substantially wet of optimum. The stabilizer dosage rates and soil moisture contents used for this study are summarized in Tables 5 through 7.
Table 5. Dosage Rates and Moisture Contents for Northern Virginia Sandy Lean Clay
Amendment Dose Rate
(% by dry weight)
Soil Moisture Content
Amendment
Low Medium High None Control Hydrated lime 3% 5% Quick lime 5% Pelletized lime 5% Portland cement 3% 5% Lignosulfonate 1.5% Synthetic Polymer 2% 3% Magnesium Chloride 2% 3%
Optimum
Proprietary Cementitious Stabilizer 3% 5% None Control Hydrated lime 5% 9% Quick lime 9% Pelletized lime 9% Portland cement 5% 9% Lignosulfonate 1.5% Synthetic Polymer 3%
1.2 x Optimum
Proprietary Cementitious Stabilizer 5% 9%
Table 6. Dosage Rates and Moisture Contents for Staunton Fat Clay
Amendment Dose Rate
(% by dry weight)
Soil Moisture Content
Amendment
Low Medium High None Control Hydrated lime 3% 5% 9% Quick lime 5% 9% Pelletized lime 5% Portland cement 3% 5% Lignosulfonate 1.5% Synthetic Polymer 3%
Optimum
Proprietary Cementitious Stabilizer 3% 5% None Control Hydrated lime 5% 9% Quick lime 9% Pelletized lime 9% Portland cement 5% 9%
1.2 x Optimum
Proprietary Cementitious Stabilizer 5% 9%

24
Table 7. Dosage Rates and Moisture Contents for Lynchburg Silty Sand
Amendment Dose Rate (% by dry weight)
Soil Moisture
Content
Amendment
Low Medium High None Control Hydrated lime 3% 5% Quick lime 5% Pelletized lime 5% Portland cement 3% 5% Lignosulfonate 1.5% Synthetic Polymer 2% 3%
Optimum
Proprietary Cementitious Stabilizer 3% 5% None Control Hydrated lime 5% 9% Quick lime 9% Pelletized lime 9% Portland cement 5% 9% Lignosulfonate 1.5% Synthetic Polymer 3%
1.2 x Optimum
Proprietary Cementitious Stabilizer 5% 9% Overall, 56 batches (consisting of eight cylinders per batch) corresponding to each moisture content and amendment dose rate were created, cured, and subjected to compressive strength testing. Samples are identified in the figures contained in this report using the notations shown in Table 8.
Table 8. Sample Identification System
Designation Stabilizer U Untreated
HL Hydrated Lime QL Quicklime PL Pelletized Lime PC Portland Cement LS Lignosulfonate SP Synthetic Polymer MC Magnesium Chloride PS Proprietary Cementitious Stabilizer
Compressive Strength Testing Results – Soils at Optimum Moisture Content The following sections present the results of unconfined compressive strength testing conducted on the NoVa Clay, Staunton Clay, and Lynchburg Sand at their optimum moisture contents. The data points represent the unconfined compressive strength for the samples at varying curing times. The logarithmic trend lines shown provide a good fit for the strength versus curing time data obtained from this research. The trend lines were fit to the data in the form qu = qu 0 + a ln(t) where: qu = unconfined compressive strength; t = time; and qu 0 and a are coefficients obtained by least-squares regression. All referenced strength values refer to the strengths obtained from the trend lines fit to the data.

25
NoVa Clay at Optimum Moisture Content – 28-day Unconfined Compressive Strengths A summary of the 28-day unconfined compressive strengths for NoVa Clay samples treated at optimum moisture content can be found in Table 9. The individual results for each stabilizer are addressed in subsequent sections.
Table 9. 28-day UC Strengths for NoVa Clay Samples Treated at Optimum Moisture Content
Amendment Dose Rate Amendment Low Medium High
None 16 psi Hydrated lime 52 psi 62 psi Quick lime 65 psi Pelletized lime 41 psi Portland cement 100 psi 258 psi Lignosulfonate 19 psi Synthetic Polymer 18 psi 17 psi Magnesium Chloride 15 psi NR* Proprietary Cementitious Stabilizer 110 psi 213 psi *NR = No result; the mixture could not be compacted into the molds.
NoVa Clay at Optimum Moisture Content – Lime Treatment Figure 7 presents unconfined compressive strength test results for lime-treated NoVa Clay samples molded at optimum moisture content for varying curing times. The dosage rate and type of lime are indicated in the legend using the sample identification system in Table 8.
0
10
20
30
40
50
60
70
80
90
0 5 10 15 20 25 30
Curing Time, days
Unc
onfin
ed C
ompr
essi
ve S
treng
th, p
si
U3% HL5% HL5% QL5% PL
Figure 7. UC Strengths vs. Curing Time for NoVa Clay at OMC – Lime Treatment

26
For lime treatment, specimens treated with 5 percent quicklime achieved the greatest strengths for all curing times, followed by 5 percent hydrated lime, 3 percent hydrated lime, and 5 percent pelletized lime. Specimens treated with 5 percent quicklime achieved a 28-day compressive strength of 65 psi, resulting in a strength increase of 306 percent from the untreated strength of 16 psi. Treatment with 5 percent hydrated lime produced somewhat similar results, attaining a 28-day strength of 62 psi, equating to a strength increase of 288 percent. The compressive strength achieved using 3 percent hydrated lime was 52 psi, resulting in a 225 percent strength increase. Treatment with 5 percent pelletized lime was the least effective of the limes tested, resulting in a compressive strength of 41 psi and a strength increase of only 156 percent. Curing time did not have a drastic impact on the strength of the lime-treated samples. The strength of the specimens tested at a curing time of 3 days achieved 82 to 90 percent of the 28-day strength, and reached 89 to 95 percent of the 28-day strength at 7 days. Specimens treated with 3 percent hydrated lime were least affected by curing time, achieving 90 percent of the 28-day strength at 3 days and 95 percent at 7 days. Treatment with 5 percent pelletized lime was most affected by curing time, achieving 82 percent of the 28-day strength at 3 days and requiring 14 days to reach 94 percent. NoVa Clay at Optimum Moisture Content – Cement Treatment Figure 8 presents unconfined compressive strength test results for cement-treated NoVa Clay samples molded at optimum moisture content for varying curing times. The dosage rate is indicated in the legend using the sample identification system in Table 8.
0
50
100
150
200
250
300
350
0 5 10 15 20 25 30
Curing Time, days
Unc
onfin
ed C
ompr
essi
ve S
treng
th, p
si
U3% PC5% PC
Figure 8. UC Strength vs. Curing Time for NoVa Clay at OMC – Cement Treatment

27
For a relatively small increase in cement dosage rate from 3 to 5 percent, the strength of the samples increased drastically. Five percent cement treatment produced a 28-day compressive strength of 258 psi, 158 percent higher than the strength of 100 psi achieved using 3 percent cement. In addition, cement treatment was far more effective than lime treatment. With respect to untreated samples (28-day strength of 16 psi), treatment with 5 percent and 3 percent cement achieved strength increases of 1,512 percent and 525 percent compared to an increase of only 306 percent for the most effective lime treatment (5 percent quicklime). The strength of cement-treated specimens was more dependent on curing time than lime-treated samples, particularly at the lower cement dosage rate. For specimens treated with 3 percent cement, only 62 percent of the 28-day strength was achieved within 3 days (compared to 82 to 90 percent for lime treatment), and even at 14 days had only reached 88 percent of the 28-day strength. The effects of curing time had less impact on 5 percent cement treatment, with the specimens reaching 75 percent of the 28-day strength at 3 days and 92 percent at 14 days. NoVa Clay at Optimum Moisture Content – Liquid Stabilizer Treatment Figure 9 presents unconfined compressive strength test results for NoVa Clay samples molded at optimum moisture content treated with the liquid stabilizers (lignosulfonate and synthetic polymer) for varying curing times. The dosage rate is indicated in the legend using the sample identification system in Table 8.
0
5
10
15
20
25
0 5 10 15 20 25 30
Curing Time, days
Unc
onfin
ed C
ompr
essi
ve S
treng
th, p
si
U1.5% LS2% SP3% SP
Figure 9. UC Strengths vs. Curing Time for NoVa Clay at OMC – Liquid Stabilizer Treatment

28
Treatment with the liquid stabilizers showed fairly insignificant strength gain compared to the other stabilizers tested. Strength gains of only 6 to 18 percent with respect to the untreated soil strength were realized, compared with a 156 percent strength increase with the least effective traditional stabilizer (pelletized lime). Lignosulfonate treatment at 1.5 percent was the most effective of the liquid stabilizers, producing a 28-day strength of 19 psi. Treatment with 2 percent and 3 percent synthetic polymer achieved 28-day strengths of 18 psi and 17 psi, indicating decreasing strength with increasing stabilizer concentration for the amounts tested. Curing time was a relatively insignificant factor for the liquid stabilizers. Of the liquid stabilizers, lignosulfonate treatment appears to be the most dependent on curing time. However, lignosulfonate treatment still achieved 91 percent of the 28-day strength within 3 days of curing and 97 percent within 7 days. Samples treated with 2 percent synthetic polymer achieved 96 percent of the 28-day strength within 3 days. When the synthetic polymer dosage rate was increased to 3 percent, a trend of strength increase with curing time was not discernible, remaining relatively constant throughout the 28-day curing period.
In addition to the specimens created using lignosulfonate and synthetic polymer, one set of two specimens was created using a 2 percent dosage rate of the magnesium chloride stabilizer. The specimens were cured for 7 days and subjected to unconfined compressive strength testing. The strengths of the two specimens were 13 psi and 17 psi, indicating no distinct change in strength from the 16 psi untreated strength. It was then attempted to create another set of two specimens using an increased dosage rate of 3 percent. However, upon mixing of the soil and stabilizer, the mixture became very liquid and impossible to compact into the plastic molds. Since a low dosage rate of the magnesium chloride stabilizer showed no promise in increasing the soil strength, and increasing the dosage rate was detrimental to the strength of the soil mixture, no further testing was performed using the magnesium chloride stabilizer on the NoVa Clay or any of the remaining soils. NoVa Clay at Optimum Moisture Content –Proprietary Cementitious Stabilizer Treatment Figure 10 presents unconfined compressive strength test results for NoVa Clay samples molded at optimum moisture content treated with the proprietary cementitious stabilizer for varying curing times. The dosage rate is indicated in the legend using the sample identification system in Table 8.

29
0
50
100
150
200
250
300
350
0 5 10 15 20 25 30
Curing Time, days
Unc
onfin
ed C
ompr
essi
ve S
treng
th, p
siU3% PS5% PS
Figure 10. UC Strengths vs. Curing Time for NoVa Clay at OMC – Proprietary Cementitious
Stabilizer Treatment Treatment using a low dosage rate of the proprietary cementitious stabilizer produced somewhat higher strengths than treatment with a low dosage rate of cement. However, for increased dosage rates of proprietary cementitious stabilizer and cement, cement treatment was far more effective. Treatment with 3 percent proprietary cementitious stabilizer produced a 28-day strength of 110 psi, 10 psi higher than 3 percent cement treatment. However, when the dosage rate of proprietary cementitious stabilizer was increased to 5 percent, a 28-day strength of 213 psi was achieved, resulting in a strength 45 psi lower than the strength achieved using 5 percent cement treatment. Nonetheless, treatment with proprietary cementitious stabilizer was still more effective than lime treatment, providing a 69 percent higher strength at the low dosage rate than the most effective lime treatment (5 percent quicklime producing a strength of 65 psi). Curing time had some impact on the strength of the specimens containing proprietary cementitious stabilizer. The strength of the specimens tested at a curing time of 3 days achieved 79 to 83 percent of the 28-day strength, and reached 87 to 89 percent of the 28-day strength at 7 days. At 14 days, treatment with proprietary cementitious stabilizer achieved 94 to 95 percent of the 28-day strength. Also, it should be noted that an increase in proprietary cementitious stabilizer dosage rate from 3 to 5 percent did not seem to impact the influence of curing time on strength gain, as similar strength gain trends were noted for each dosage rate.

30
Staunton Clay at Optimum Moisture Content – 28-day Unconfined Compressive Strengths A summary of the 28-day unconfined compressive strengths for Staunton Clay samples treated at optimum moisture content can be found in Table 10. The individual results for each stabilizer are addressed in subsequent sections.
Table 10. 28-day UC Strengths for Staunton Clay Samples Treated at Optimum Moisture Content
Amendment Dose Rate Amendment Low Medium High
None 15 psi Hydrated lime 63 psi 70 psi 75 psi Quick lime 75 psi 81 psi Pelletized lime 31 psi Portland cement 73 psi 197 psi Lignosulfonate 18 psi Synthetic Polymer 17 psi Proprietary Cementitious Stabilizer 81psi 175 psi
Staunton Clay at Optimum Moisture Content – Lime Treatment Figure 11 presents unconfined compressive strength test results for lime-treated Staunton Clay samples molded at optimum moisture content for varying curing times. The dosage rate and type of lime are indicated in the legend using the sample identification system in Table 8.
0
10
20
30
40
50
60
70
80
90
0 5 10 15 20 25 30
Curing Time, days
Unc
onfin
ed C
ompr
essi
ve S
treng
th, p
si
U3% HL5% HL9% HL5% QL9%QL5% PL
Figure 11. UC Strengths vs. Curing Time for Staunton Clay at OMC – Lime Treatment

31
Since hydrated lime and quicklime proved to be the most effective of the lime treatments for NoVa Clay, tests conducted on Staunton Clay also included a high dosage rate of 9 percent for these particular limes. Specimens treated with quicklime at this high dosage rate achieved the greatest strength of 81 psi, resulting in a strength increase of 440 percent from the untreated strength of 15 psi. Both the 9 percent hydrated lime and 5 percent quicklime dosage rates achieved 28-day strengths of 75 psi, equating to strength increases of 400 percent. The next highest strengths were achieved using 5 percent hydrated lime, reaching a 28-day strength of 70 psi for a strength increase of 366 percent compared to the untreated strength. After the medium and high dosage rates of hydrated lime and quicklime, treatment with the low dosage rate of hydrated lime produced the next highest strength. Treatment with 3 percent hydrated lime achieved a 28-day strength of 63 psi, equating to a 320 percent strength increase. Similar to the results obtained for NoVa Clay, the least effective of the lime stabilizers was 5 percent pelletized lime. The pelletized lime treatment achieved a 28-day strength of 31 psi (a 106 percent strength increase), less than half that achieved by the lowest concentration of hydrated lime. For hydrated lime treatment, increases in strength seemed to be more sensitive to variations in dosage rate at lower concentrations than at higher concentrations. For the dosage rate increase from 3 to 5 percent, the strength increased by 13 psi. But for the dosage rate increase from 5 to 9 percent, the strength increased by only 5 psi. This indicates that for hydrated lime, the limit where an increase in dosage rate no longer provides for an increase in strength is being approached around 9 percent. As with NoVa Clay, curing time did not have a drastic impact on the strength of the lime-treated Staunton Clay samples. The strength of the specimens tested at a curing time of 3 days achieved 81 to 92 percent of the 28-day strength, and reached 88 to 96 percent of the 28-day strength at 7 days. Also similar to NoVa Clay, 5 percent pelletized lime treatment was most affected by curing time, achieving 81 percent of the 28-day strength at 3 days and requiring 14 days to reach 94 percent. Staunton Clay at Optimum Moisture Content – Cement Treatment Figure 12 presents unconfined compressive strength test results for cement-treated Staunton Clay samples molded at optimum moisture content for varying curing times. The dosage rate is indicated in the legend using the sample identification system in Table 8.

32
0
50
100
150
200
250
300
350
0 5 10 15 20 25 30
Curing Time, days
Unc
onfin
ed C
ompr
essi
ve S
treng
th, p
siU3% PC5% PC
Figure 12. UC Strength vs. Curing Time for Staunton Clay at OMC – Cement Treatment
Similar to the results obtained for NoVa Clay, cement treatment for Staunton Clay indicated that for relatively small increases in cement dosage rate, strength of the samples increased drastically. Five percent cement treatment produced a 28-day compressive strength of 197 psi, 170 percent higher than the strength of 73 psi achieved using 3 percent cement. Compared to lime treatment, the 197 psi strength achieved using 5 percent cement treatment was much higher than the largest strength of 81 psi achieved with 9 percent quicklime treatment. However, referring to Table 10, strengths using medium to high dosage rates of lime are much more comparable to (and in most cases better than) the low dosage rate of cement. Similar to NoVa Clay, the strength of cement-treated specimens was more dependent on curing time than lime-treated specimens, particularly at the lower cement dosage rate. For the specimens containing 3 percent cement, only 53 percent of the 28-day strength was achieved within 3 days (compared to 81 to 92 percent for lime treatment), and only 86 percent of the 28-day strength was achieved at 14 days. The effects of curing time had less impact on 5 percent cement treatment, with the specimens reaching 74 percent of the 28-day strength at 3 days and 92 percent at 14 days. Staunton Clay at Optimum Moisture Content – Liquid Stabilizer Treatment Figure 13 presents unconfined compressive strength test results for Staunton Clay samples molded at optimum moisture content treated with the liquid stabilizers (lignosulfonate and synthetic polymer) for varying curing times. The dosage rate is indicated in the legend using the sample identification system in Table 8.

33
0
5
10
15
20
25
0 5 10 15 20 25 30
Curing Time, days
Unc
onfin
ed C
ompr
essi
ve S
treng
th, p
siU1.5% LS3% SP
Figure 13. UC Strength vs. Curing Time for Staunton Clay at OMC – Liquid Stabilizer Treatment
Strengths obtained using the liquid stabilizers were insignificant compared to the strengths achieved using other stabilizers. Strength gains of only 13 to 20 percent were realized compared with a 160 percent strength increase using the least effective traditional stabilizer (pelletized lime). Strengths using 1.5 percent lignosulfonate and 3 percent synthetic polymer dosage rates were similar, with strengths of 18 psi and 17 psi at 28 days. Curing time was a relatively insignificant factor for the liquid stabilizers mixed with Staunton Clay. Specimens treated with lignosulfonate achieved 81 percent of the 28-day strength at 3 days, while specimens treated with synthetic polymer achieved 86 percent. At 7 days, the specimens treated with lignosulfonate and synthetic polymer achieved 88 percent and 91 percent of the 28-day strength. Staunton Clay at Optimum Moisture Content – Proprietary Cementitious Stabilizer Treatment Figure 14 presents unconfined compressive strength test results for Staunton Clay samples molded at optimum moisture content treated with the proprietary cementitious stabilizer for varying curing times. The dosage rate is indicated in the legend using the sample identification system in Table 8.
34
0
50
100
150
200
250
300
350
0 5 10 15 20 25 30
Curing Time, days
Unc
onfin
ed C
ompr
essi
ve S
treng
th, p
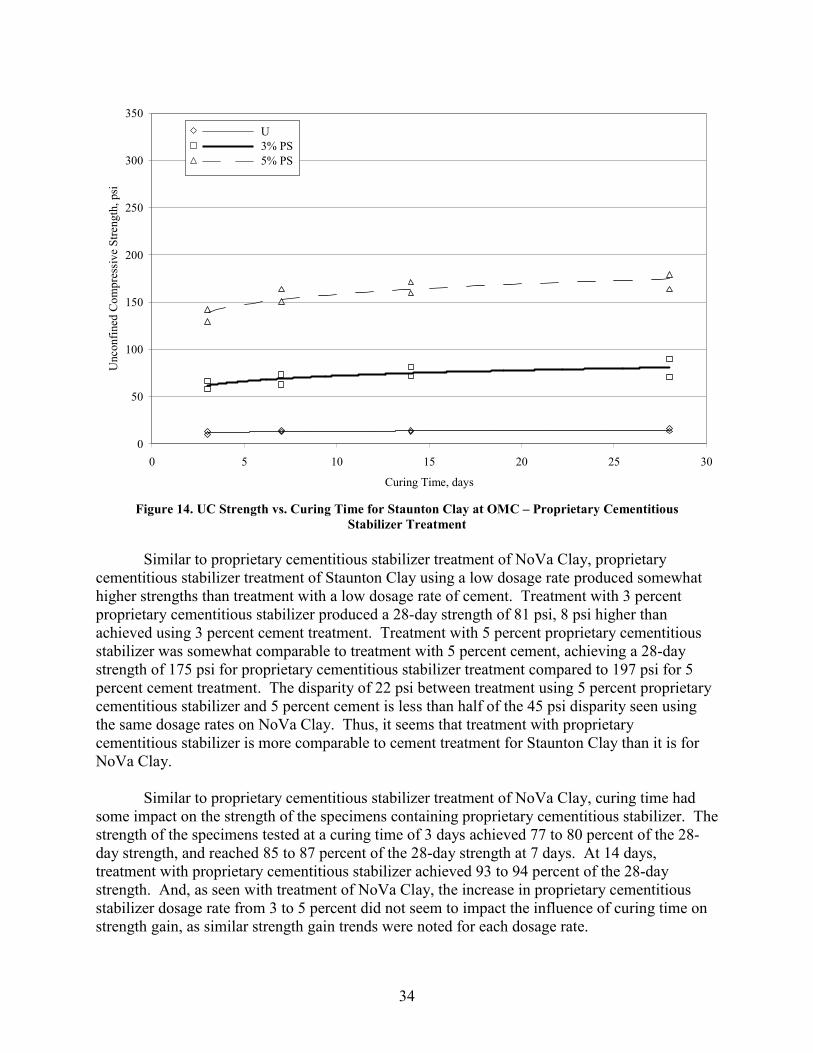
siU3% PS5% PS
Figure 14. UC Strength vs. Curing Time for Staunton Clay at OMC – Proprietary Cementitious
Stabilizer Treatment Similar to proprietary cementitious stabilizer treatment of NoVa Clay, proprietary cementitious stabilizer treatment of Staunton Clay using a low dosage rate produced somewhat higher strengths than treatment with a low dosage rate of cement. Treatment with 3 percent proprietary cementitious stabilizer produced a 28-day strength of 81 psi, 8 psi higher than achieved using 3 percent cement treatment. Treatment with 5 percent proprietary cementitious stabilizer was somewhat comparable to treatment with 5 percent cement, achieving a 28-day strength of 175 psi for proprietary cementitious stabilizer treatment compared to 197 psi for 5 percent cement treatment. The disparity of 22 psi between treatment using 5 percent proprietary cementitious stabilizer and 5 percent cement is less than half of the 45 psi disparity seen using the same dosage rates on NoVa Clay. Thus, it seems that treatment with proprietary cementitious stabilizer is more comparable to cement treatment for Staunton Clay than it is for NoVa Clay. Similar to proprietary cementitious stabilizer treatment of NoVa Clay, curing time had some impact on the strength of the specimens containing proprietary cementitious stabilizer. The strength of the specimens tested at a curing time of 3 days achieved 77 to 80 percent of the 28-day strength, and reached 85 to 87 percent of the 28-day strength at 7 days. At 14 days, treatment with proprietary cementitious stabilizer achieved 93 to 94 percent of the 28-day strength. And, as seen with treatment of NoVa Clay, the increase in proprietary cementitious stabilizer dosage rate from 3 to 5 percent did not seem to impact the influence of curing time on strength gain, as similar strength gain trends were noted for each dosage rate.

35
Lynchburg Sand at Optimum Moisture Content – 28-day Unconfined Compressive Strengths A summary of the 28-day unconfined compressive strengths for Lynchburg Sand samples treated at optimum moisture content can be found in Table 11. The individual results for each stabilizer are addressed in subsequent sections.
Table 11. 28-day UC Strengths for Lynchburg Sand Samples Treated at Optimum Moisture Content
Amendment Dose Rate Amendment Low Medium High
None 7 psi Hydrated lime 34 psi 52 psi Quick lime 46 psi Pelletized lime 31 psi Portland cement 112 psi 292 psi Lignosulfonate 7 psi Synthetic Polymer 19 psi 21 psi Proprietary Cementitious Stabilizer 58 psi 151 psi
Lynchburg Sand at Optimum Moisture Content – Lime Treatment Figure 15 presents unconfined compressive strength test results for lime-treated Lynchburg Sand molded at optimum moisture content for varying curing times. The dosage rate and type of lime are indicated in the legend using the sample identification system in Table 8.
0
10
20
30
40
50
60
70
80
90
0 5 10 15 20 25 30
Curing Time, days
Unc
onfin
ed C
ompr
essi
ve S
treng
th, p
si
U3% HL5% HL5% QL5% PL
Figure 15. UC Strengths vs. Curing Time for Lynchburg Sand at OMC – Lime Treatment

36
Unlike NoVa Clay and Staunton Clay where quicklime was the most effective lime treatment, hydrated lime treatment produced the highest strengths for Lynchburg Sand. Treatment with 5 percent hydrated lime produced a 28-day strength of 52 psi, resulting in a strength increase of 642 percent from the untreated strength of 7 psi. Following hydrated lime, treatment with 5 percent quicklime achieved the next highest 28-day strength of 46 psi, resulting in a 557 percent strength increase. Treatments with 3 percent hydrated lime and 5 percent pelletized lime were the least effective of the limes tested, achieving 28-day strengths of 34 psi and 31 psi. With the exception of specimens treated with 5 percent pelletized lime, curing time had little effect on the strength of the lime-treated specimens. The specimens treated with hydrated lime and quicklime achieved 93 percent or more of their 28-day strengths within 3 days. The specimens treated with 5 percent pelletized lime only achieved 64 percent of the 28-day strength at 3 days and required 14 days to reach 90 percent of the 28-day strength. Lynchburg Sand at Optimum Moisture Content – Cement Treatment Figure 16 presents unconfined compressive strength test results for cement-treated Lynchburg Sand samples molded at optimum moisture content for varying curing times. The dosage rate is indicated in the legend using the sample identification system discussed in Table 8.
0
50
100
150
200
250
300
350
0 5 10 15 20 25 30
Curing Time, days
Unc
onfin
ed C
ompr
essi
ve S
treng
th, p
si
U3% PC5% PC
Figure 16. UC Strengths vs. Curing Time for Lynchburg Sand at OMC – Cement Treatment
As seen with cement treatment of NoVa Clay and Staunton Clay, relatively small increases in cement dosage rate dramatically increased the strength of cement-treated Lynchburg Sand. Treatment with 5 percent cement achieved a 28-day compressive strength of 292 psi, 161

37
percent higher than the strength of 112 psi achieved with 3 percent cement. Cement treatment was much more effective than lime treatment, with the lowest dosage of cement achieving more than double the largest strength of 52 psi produced by lime treatment (5 percent hydrated lime). Similar to NoVa Clay and Staunton Clay, strength of cement-treated samples was more dependent on curing time than lime-treated samples. For specimens containing 3 percent cement, 73 percent of the 28-day strength was achieved within 3 days (compared to greater than 93 percent for quicklime and hydrated lime treatment), and required 14 days to reach 91 percent of the 28-day strength. The effects of curing time had less impact on the strength of specimens treated with 5 percent cement, reaching 83 percent of the 28-day strength at 3 days and 95 percent at 14 days. Lynchburg Sand at Optimum Moisture Content – Liquid Stabilizer Treatment Figure 17 presents unconfined compressive strength test results for Lynchburg Sand samples molded at optimum moisture content treated with the liquid stabilizers (lignosulfonate and synthetic polymer) for varying curing times. The dosage rate is indicated in the legend using the sample identification system in Table 8.
0
5
10
15
20
25
0 5 10 15 20 25 30
Curing Time, days
Unc
onfin
ed C
ompr
essi
ve S
treng
th, p
si
U1.5% LS2% SP3% SP
Figure 17. UC Strengths vs. Curing Time for Lynchburg Sand at OMC – Liquid Stabilizer Treatment
Compared to treatment with the dry stabilizers, the liquid stabilizers had little effect on compressive strength when mixed with the Lynchburg Sand, particularly the lignosulfonate. A strength gain of less than 1 percent was realized using 1.5 percent lignosulfonate. The synthetic polymers worked much more effectively than the lignosulfonate, reaching 28-day strengths of 19 psi and 21 psi for dosage rates of 2 percent and 3 percent.

38
Curing time was a relatively insignificant factor for the liquid stabilizers. For specimens containing lignosulfonate and 2 percent synthetic polymer, the strengths remained relatively constant over the curing periods, with no noticeable trend of increasing strength with increasing curing time. The specimens treated with 3 percent synthetic polymer experienced some increase in strength with curing time, but still achieved 86 percent of the 28-day strength at 3 days of curing and 91 percent at 7 days. Lynchburg Sand at Optimum Moisture Content – Proprietary Cementitious Stabilizer Treatment Figure 18 presents unconfined compressive strength test results for Lynchburg Sand samples molded at optimum moisture content treated with the proprietary cementitious stabilizer for varying curing times. The dosage rate is indicated in the legend using the sample identification system in Table 8.
0
50
100
150
200
250
300
350
0 5 10 15 20 25 30
Curing Time, days
Unc
onfin
ed C
ompr
essi
ve S
treng
th, p
si
U3% PS5% PS
Figure 18. UC Strengths vs. Curing Time for Lynchburg Sand at OMC – Proprietary Cementitious
Stabilizer Treatment Treatment using the proprietary cementitious stabilizer was much less effective for Lynchburg Sand than for NoVa and Staunton Clays. Treatment with 3 percent proprietary cementitious stabilizer produced a 28-day compressive strength of 58 psi compared to strengths of 110 psi and 81 psi for NoVa and Staunton Clays using the same stabilizer dosage rate. For 5 percent proprietary cementitious stabilizer treatment, a 28-day strength of 151 psi was achieved, still markedly lower than the 213 psi and 175 psi achieved for NoVa and Staunton Clay at this dosage rate. Although proprietary cementitious stabilizer treatment of Lynchburg Sand did not provide strengths comparable to cement treatment, it was still more effective than lime treatment.

39
Five percent hydrated lime treatment (the most effective of the lime treatments) achieved a strength of 52 psi compared to the strength 58 psi achieved using 3 percent proprietary cementitious stabilizer treatment (the least effective proprietary cementitious stabilizer treatments). Curing time had more of an influence on strength gain at the 3 percent dosage rate than the 5 percent dosage rate. The trend in strength gain over the curing period for 3 percent proprietary cementitious stabilizer treatment was similar to that seen for cement treatment, while the trend in strength gain over the curing period for 5 percent proprietary cementitious stabilizer seemed to mimic that seen with proprietary cementitious stabilizer treatment of the NoVa and Staunton Clays. For 3 percent proprietary cementitious stabilizer treatment, only 69 percent of the 28-day strength was gained within 3 days, compared to 86 percent for 5 percent treatment. At 7 days, 3 percent treatment attained 81 percent of the 28-day strength while 5 percent treatment attained 92 percent of the 28-day strength. At 14 days, 90 and 96 percent of the 28-day strength was achieved for 3 and 5 percent treatment. Compressive Strength Testing Results – Soils at 20% Above Optimum Moisture Content The following sections present the results of unconfined compressive strength testing conducted on the NoVa Clay, Staunton Clay, and Lynchburg Sand at moisture contents 20 percent above the optimum moisture contents. The data points represent the unconfined compressive strength for the samples at varying curing times. The logarithmic trend lines shown provide a good fit for the strength versus curing time data obtained from this research. All referenced strength values refer to the strengths obtained from the trend lines fit to the data. NoVa Clay at 20% Above Optimum Moisture Content – 28-day UC Strengths A summary of the 28-day unconfined compressive strengths for NoVa Clay samples treated at optimum moisture content can be found in Table 12. The individual results for each stabilizer are addressed in subsequent sections.
Table 12. 28-day UC Strengths for NoVa Clay Samples Treated at 20% Above Optimum Moisture Content
Amendment Dose Rate Amendment Low Medium High
None 13 psi Hydrated lime 46 psi 83 psi Quick lime 91 psi Pelletized lime 63 psi Portland cement 200 psi 303 psi Lignosulfonate 10 psi Synthetic Polymer 14 psi Proprietary Cementitious Stabilizer 146 psi 237 psi

40
NoVa Clay at 20% Above Optimum Moisture Content – Lime Treatment Figure 19 presents unconfined compressive strength test results for lime-treated NoVa Clay samples molded at 20 percent above optimum moisture content for varying curing times. The dosage rate is indicated in the legend using the sample identification system in Table 8.
0
10
20
30
40
50
60
70
80
90
100
0 5 10 15 20 25 30
Curing Time, days
Unc
onfin
ed C
ompr
essi
ve S
treng
th, p
si
U5% HL9% HL9% QL9% PL
Figure 19. UC Strengths vs. Curing Time for NoVa Clay at 1.2 x OMC – Lime Treatment
For lime treatment, specimens treated with 9 percent quicklime achieved the greatest strengths for all curing times, followed by 9 percent hydrated lime, 9 percent pelletized lime, and 5 percent hydrated lime. Specimens containing 9 percent quicklime achieved a 28-day compressive strength of 91 psi, resulting in a strength increase of 600 percent from the untreated strength of 13 psi. Treatment with 9 percent hydrated lime attained a 28-day specimen strengths of 83 psi, equating to a strength increase of 538 percent. Treatment with 9 percent pelletized lime achieved a 28-day strength of 63 psi, equating to a strength increase of 385 percent with respect to untreated soil. The compressive strength achieved for specimens treated with 5 percent hydrated lime was 46 psi, approximately half the strength achieved using the most effective lime (9 percent quicklime). Curing time had a larger influence on strength gain for lime-treated NoVa clay above optimum moisture content than for the clay at optimum moisture content. At optimum moisture content, lime-treated samples typically achieved 90 percent of the 28-day strength within 7 days. With the exception of quicklime, 90 percent of the 28-day strength was not achieved by the samples molded at 20 percent above the optimum moisture content until about 14 days. The percentage of 28-day strength achieved for each material at various curing times is listed in Table 13.

41
Table 13. Percentage of 28-day Compressive Strength Achieved for Lime-Treated NoVa Clay at 20% Above Optimum Moisture Content
Percentage of 28-day Unconfined Compressive Strength Achieved Stabilizer 3 days 7 days 14 days
5% Hydrated Lime 54% 71% 86% 9% Hydrated Lime 81% 88% 94% 9% Pelletized Lime 71% 82% 91%
9% Quicklime 88% 92% 96% NoVa Clay at 20% Above Optimum Moisture Content – Cement Treatment Figure 20 presents unconfined compressive strength test results for cement-treated NoVa Clay samples molded at 20 percent above optimum moisture content for varying curing times. The dosage rate is indicated in the legend using the sample identification system in Table 8.
0
50
100
150
200
250
300
350
0 5 10 15 20 25 30
Curing Time, days
Unc
onfin
ed C
ompr
essi
ve S
treng
th, p
si
U5% PC9% PC
Figure 20. UC Strengths vs. Curing Time for NoVa Clay at 1.2 x OMC – Cement Treatment
Treatment with 9 percent cement resulted in a 28-day strength 52 percent higher than treatment with 5 percent cement. Specimens containing 9 percent cement yielded a 28-day strength of 303 psi, while specimens containing 5 percent cement achieved a strength of 200 psi. Strength gain of the cement-treated specimens was dependent on curing time. Specimens treated with 5 percent cement achieved 72 percent of the 28-day strength at 3 days, reaching 91 percent at 14 days. Specimens treated with 9 percent cement were less dependent than those

42
treated with 5 percent cement, but still only reached 78 percent of the 28-day strength at 3 days and 93 percent at 14 days. NoVa Clay at 20% Above Optimum Moisture Content – Liquid Stabilizer Treatment Figure 21 presents unconfined compressive strength test results for NoVa Clay samples molded at 20 percent above optimum moisture content treated with the liquid stabilizers (lignosulfonate and synthetic polymer) for varying curing times. The dosage rate is indicated in the legend using the sample identification system in Table 8.
0
5
10
15
20
25
0 5 10 15 20 25 30
Curing Time, days
Unc
onfin
ed C
ompr
essi
ve S
treng
th, p
si
U1.5% LS3% SP
Figure 21. UC Strengths vs. Curing Time for NoVa Clay at 1.2 x OMC – Liquid Stabilizer Treatment
Treatment with 3 percent synthetic polymer had minimal effect on strength increase for NoVa Clay molded at 20 percent above optimum moisture content. Treatment with synthetic polymer only increased the 28-day compressive strength to 14 psi from the untreated strength of 13 psi. Treatment with 1.5 percent lignosulfonate was detrimental to the strength of the samples, decreasing the strength to 10 psi at 28 days. In addition, curing time had no effect on strength gain of samples treated with the liquid stabilizers. NoVa Clay at 20% Above Optimum Moisture Content – Proprietary Cementitious Stabilizer Treatment Figure 22 presents unconfined compressive strength test results for NoVa Clay samples molded at 20 percent above optimum moisture content treated with the proprietary cementitious stabilizer for varying curing times. The dosage rate is indicated in the legend using the sample identification system in Table 8.

43
0
50
100
150
200
250
300
350
0 5 10 15 20 25 30
Curing Time, days
Unc
onfin
ed C
ompr
essi
ve S
treng
th, p
siU5% PS9% PS
Figure 22. UC Strengths vs. Curing Time for NoVa Clay at 1.2 x OMC – Proprietary Cementitious
Stabilizer Treatment Proprietary cementitious stabilizer treatment of NoVa Clay at 20 percent above optimum moisture was not as effective as cement treatment as proprietary cementitious stabilizer treatment of NoVa Clay at optimum moisture content. For 5 percent proprietary cementitious stabilizer treatment, a 28-day strength of 146 psi was achieved, compared to 200 psi for cement treatment at the 5 percent dosage rate. Increasing the dosage rate to 9 percent proprietary cementitious stabilizer increased the specimen strength to 237 psi, compared to 303 psi achieved using 9 percent cement. However, proprietary cementitious stabilizer treatment produced 28-day strengths greater than the most effective lime treatment of 91 psi (9 percent quicklime). As with proprietary cementitious stabilizer treatment of NoVa Clay samples at optimum moisture content, curing time had only some impact on the strength of proprietary cementitious stabilizer treatment for NoVa clay samples at 20 percent above optimum moisture content. The strength of the specimens tested at a curing time of 3 days achieved 85 to 89 percent of the 28-day strength, and reached 90 to 93 percent of the 28-day strength at 7 days. At 14 days, treatment with proprietary cementitious stabilizer achieved 95 to 97 percent of the 28-day strength. An increase in proprietary cementitious stabilizer dosage rate from 5 to 9 percent did not seem to impact the influence of curing time on strength gain, as similar strength gain trends were noted for each dosage rate.

44
Staunton Clay at 20% Above Optimum Moisture Content – 28-day UC Strengths A summary of the 28-day unconfined compressive strengths for Staunton Clay samples treated at 20 percent above optimum moisture content can be found in Table 14. The individual results for each stabilizer are addressed in subsequent sections.
Table 14. 28-day UC Strengths for Staunton Clay Samples Treated at 20% Above Optimum Moisture Content
Amendment Dose Rate
Amendment Low Medium High None 8 psi Hydrated lime 50 psi 62 psi Quick lime 71 psi Pelletized lime 44 psi Portland cement 155 psi 274 psi Proprietary Cementitious Stabilizer 125 psi 229 psi
Staunton Clay at 20% Above Optimum Moisture Content – Lime Treatment Figure 23 presents unconfined compressive strength test results for lime-treated Staunton Clay samples molded at 20 percent above optimum moisture content for varying curing times. The dosage rate is indicated in the legend using the sample identification system in Table 8.
0
10
20
30
40
50
60
70
80
90
100
0 5 10 15 20 25 30
Curing Time, days
Unc
onfin
ed C
ompr
essi
ve S
treng
th, p
si
U5% HL9% HL9% QL9% PL
Figure 23. UC Strengths vs. Curing Time for Staunton Clay at 1.2 x OMC – Lime Treatment

45
Similar to lime treatment of NoVa Clay at 20 percent above optimum moisture content, treatment with 9 percent quicklime and 9 percent hydrated lime were most effective for Staunton Clay at 20 percent above optimum moisture content. Specimens containing 9 percent quicklime achieved a 28-day compressive strength of 71 psi, resulting in a strength increase of 787 percent from the untreated strength of 8 psi. Treatment with 9 percent hydrated lime yielded a 28-day strength of 62 psi, equating to a 675 percent strength increase. Unlike lime treatment of NoVa Clay at 20 percent above optimum moisture content, treatment with 5 percent hydrated lime was more effective than treatment with 9 percent pelletized lime for Staunton Clay at 20 percent above optimum moisture content. Five percent hydrated lime treatment of Staunton Clay resulted in a 28-day strength of 50 psi, resulting in a strength increase of 525 percent (compared to a 254 percent increase when treating NoVa Clay). Specimens treated with 9 percent pelletized lime produced a 28-day strength of 44 psi, resulting in a strength increase of 450 percent. Unlike the large influence on strength with curing time encountered with NoVa Clay at 20 percent above optimum moisture content, curing time had relatively little influence on the strength of lime-treated Staunton Clay samples at 20 percent above optimum moisture content. The strength of the specimens tested at a curing time of 3 days achieved 89 to 92 percent of the 28-day strength, and reached 92 to 94 percent of the 28-day strength at 7 days. Strengths of lime-treated Staunton Clay samples above optimum moisture content seemed less dependent on curing time than Staunton Clay samples at optimum moisture content, but nonetheless were relatively independent of the curing time. Staunton Clay at 20% Above Optimum Moisture Content – Cement Treatment Figure 24 presents unconfined compressive strength test results for cement-treated Staunton Clay samples molded at 20 percent above optimum moisture content for varying curing times. The dosage rate is indicated in the legend using the sample identification system in Table 8. Treatment with 9 percent cement resulted in a 28-day strength 77 percent higher than treatment with 5 percent cement. Specimens containing 9 percent cement yielded a 28-day strength of 274 psi, while specimens containing 5 percent cement achieved a strength of 155 psi. Cement treatment was much more effective than lime treatment, with the medium dosage rate of cement (5 percent) producing strengths more than double that achieved using the most effective lime (9 percent quicklime). Strength gain of the cement-treated specimens was largely dependent on curing time. Specimens treated with 5 percent cement achieved 64 percent of the 28-day strength at 3 days, reaching 88 percent at 14 days. Similarly, specimens treated with 9 percent cement achieved 65 percent of the 28-day strength at 3 days, reaching 89 percent at 14 days. This is very similar to the trend encountered with cement treatment NoVa Clay at 20 percent above optimum moisture content.

46
0
50
100
150
200
250
300
350
0 5 10 15 20 25 30
Curing Time, days
Unc
onfin
ed C
ompr
essi
ve S
treng
th, p
siU5% PC9% PC
Figure 24. UC Strengths vs. Curing Time for Staunton Clay at 1.2 x OMC – Cement Treatment
Staunton Clay at 20% Above Optimum Moisture Content – Liquid Stabilizer Treatment
Due to poor results obtained using liquid stabilizer treatment of NoVa Clay and Lynchburg Sand samples, the liquid stabilizers were omitted from the testing program for the Staunton Clay. Staunton Clay at 20% Above Optimum Moisture Content – Proprietary Cementitious Stabilizer Figure 25 presents unconfined compressive strength test results for Staunton Clay samples molded at 20 percent above optimum moisture content treated with the proprietary cementitious stabilizer for varying curing times. The dosage rate is indicated in the legend using the sample identification system in Table 8.
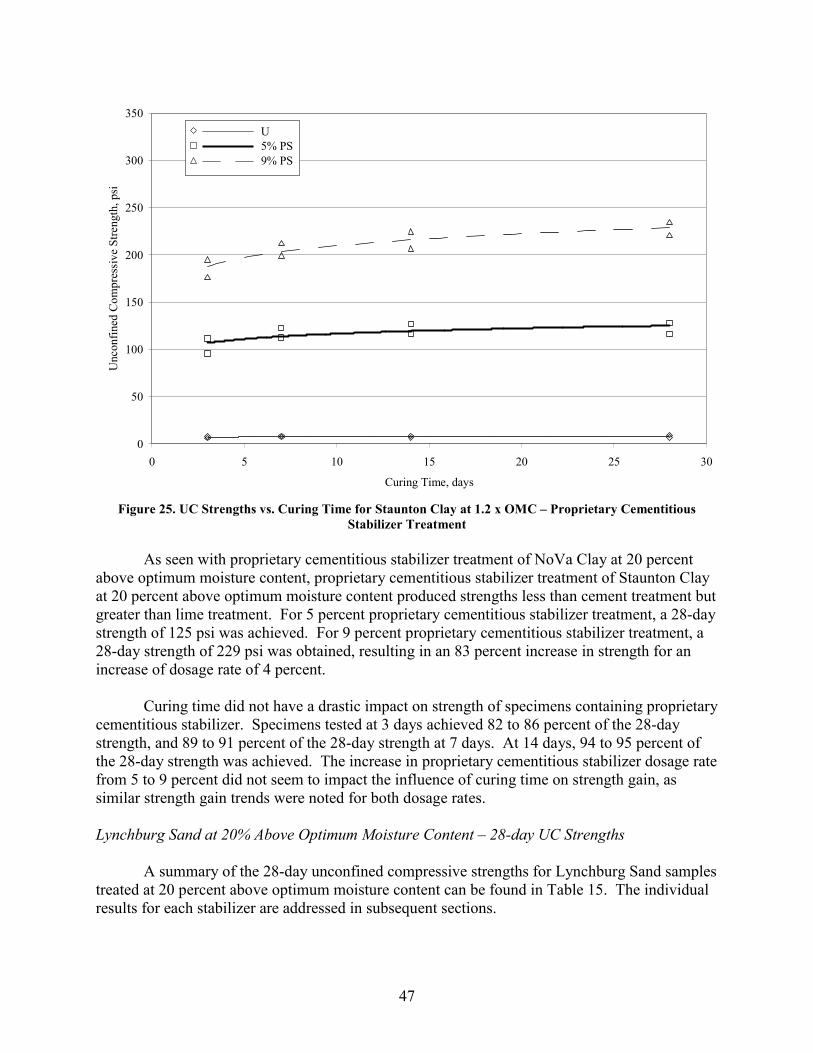
47
0
50
100
150
200
250
300
350
0 5 10 15 20 25 30
Curing Time, days
Unc
onfin
ed C
ompr
essi
ve S
treng
th, p
siU5% PS9% PS
Figure 25. UC Strengths vs. Curing Time for Staunton Clay at 1.2 x OMC – Proprietary Cementitious
Stabilizer Treatment As seen with proprietary cementitious stabilizer treatment of NoVa Clay at 20 percent above optimum moisture content, proprietary cementitious stabilizer treatment of Staunton Clay at 20 percent above optimum moisture content produced strengths less than cement treatment but greater than lime treatment. For 5 percent proprietary cementitious stabilizer treatment, a 28-day strength of 125 psi was achieved. For 9 percent proprietary cementitious stabilizer treatment, a 28-day strength of 229 psi was obtained, resulting in an 83 percent increase in strength for an increase of dosage rate of 4 percent. Curing time did not have a drastic impact on strength of specimens containing proprietary cementitious stabilizer. Specimens tested at 3 days achieved 82 to 86 percent of the 28-day strength, and 89 to 91 percent of the 28-day strength at 7 days. At 14 days, 94 to 95 percent of the 28-day strength was achieved. The increase in proprietary cementitious stabilizer dosage rate from 5 to 9 percent did not seem to impact the influence of curing time on strength gain, as similar strength gain trends were noted for both dosage rates. Lynchburg Sand at 20% Above Optimum Moisture Content – 28-day UC Strengths A summary of the 28-day unconfined compressive strengths for Lynchburg Sand samples treated at 20 percent above optimum moisture content can be found in Table 15. The individual results for each stabilizer are addressed in subsequent sections.
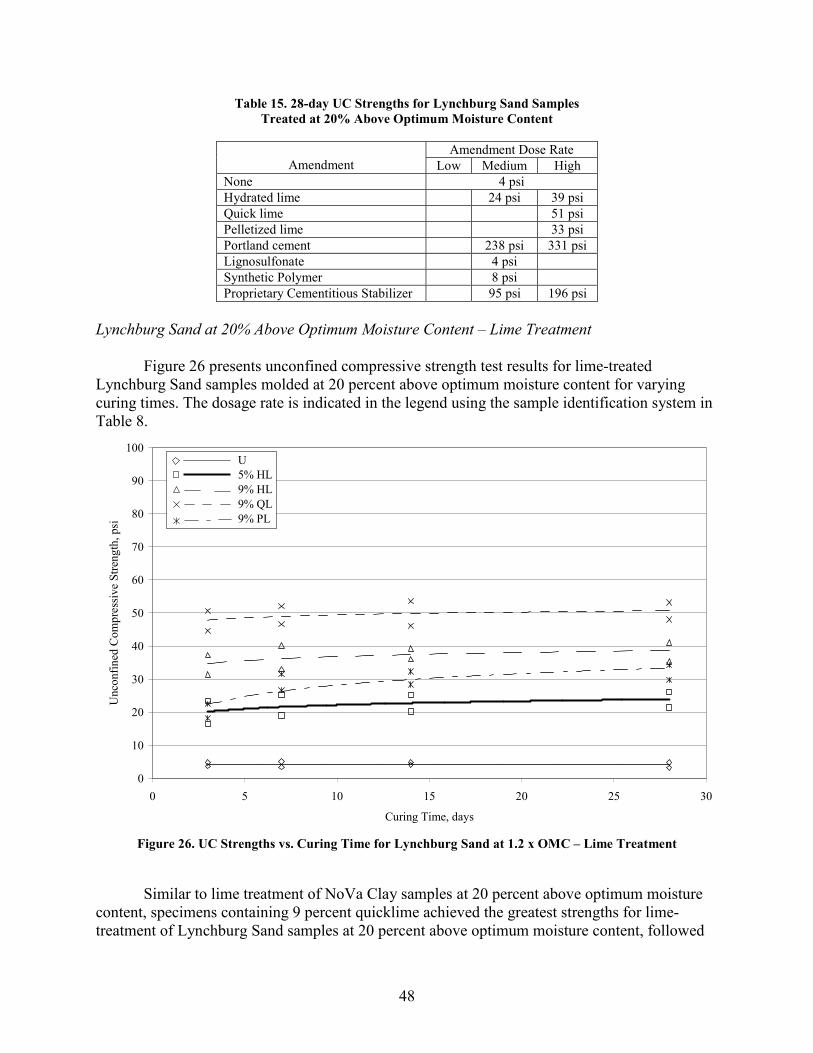
48
Table 15. 28-day UC Strengths for Lynchburg Sand Samples Treated at 20% Above Optimum Moisture Content
Amendment Dose Rate
Amendment Low Medium High None 4 psi Hydrated lime 24 psi 39 psi Quick lime 51 psi Pelletized lime 33 psi Portland cement 238 psi 331 psi Lignosulfonate 4 psi Synthetic Polymer 8 psi Proprietary Cementitious Stabilizer 95 psi 196 psi
Lynchburg Sand at 20% Above Optimum Moisture Content – Lime Treatment Figure 26 presents unconfined compressive strength test results for lime-treated Lynchburg Sand samples molded at 20 percent above optimum moisture content for varying curing times. The dosage rate is indicated in the legend using the sample identification system in Table 8.
0
10
20
30
40
50
60
70
80
90
100
0 5 10 15 20 25 30
Curing Time, days
Unc
onfin
ed C
ompr
essi
ve S
treng
th, p
si
U5% HL9% HL9% QL9% PL
Figure 26. UC Strengths vs. Curing Time for Lynchburg Sand at 1.2 x OMC – Lime Treatment
Similar to lime treatment of NoVa Clay samples at 20 percent above optimum moisture content, specimens containing 9 percent quicklime achieved the greatest strengths for lime-treatment of Lynchburg Sand samples at 20 percent above optimum moisture content, followed
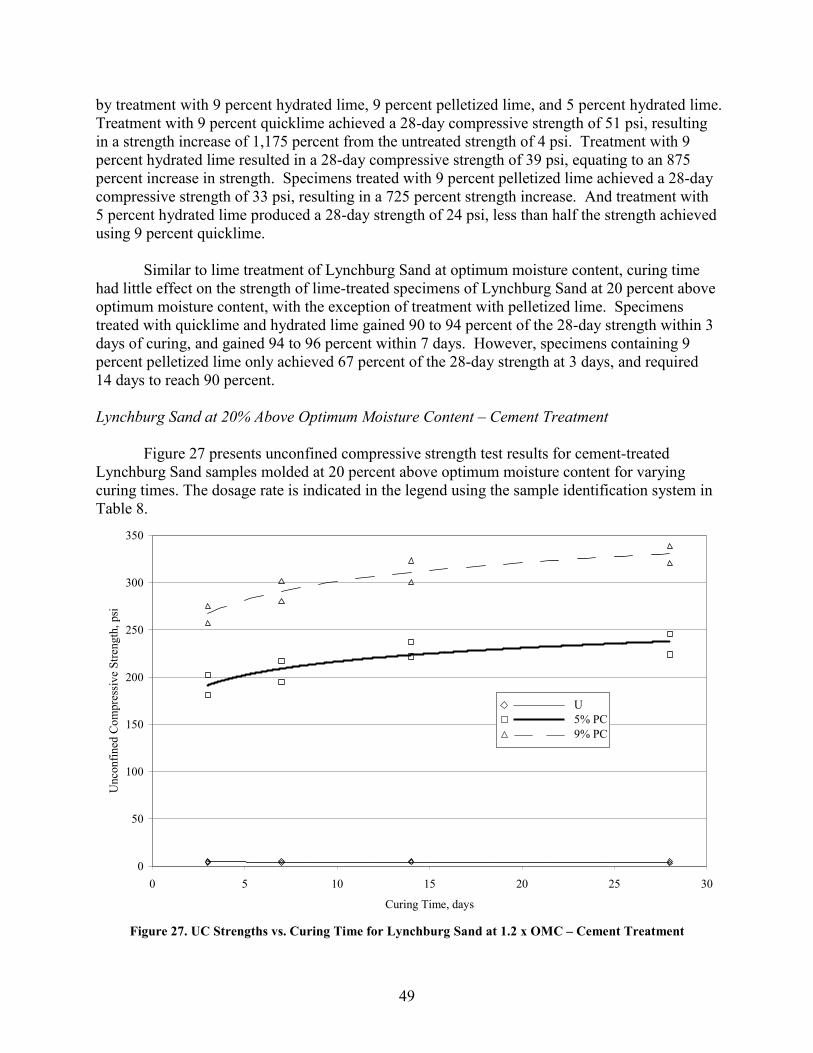
49
by treatment with 9 percent hydrated lime, 9 percent pelletized lime, and 5 percent hydrated lime. Treatment with 9 percent quicklime achieved a 28-day compressive strength of 51 psi, resulting in a strength increase of 1,175 percent from the untreated strength of 4 psi. Treatment with 9 percent hydrated lime resulted in a 28-day compressive strength of 39 psi, equating to an 875 percent increase in strength. Specimens treated with 9 percent pelletized lime achieved a 28-day compressive strength of 33 psi, resulting in a 725 percent strength increase. And treatment with 5 percent hydrated lime produced a 28-day strength of 24 psi, less than half the strength achieved using 9 percent quicklime. Similar to lime treatment of Lynchburg Sand at optimum moisture content, curing time had little effect on the strength of lime-treated specimens of Lynchburg Sand at 20 percent above optimum moisture content, with the exception of treatment with pelletized lime. Specimens treated with quicklime and hydrated lime gained 90 to 94 percent of the 28-day strength within 3 days of curing, and gained 94 to 96 percent within 7 days. However, specimens containing 9 percent pelletized lime only achieved 67 percent of the 28-day strength at 3 days, and required 14 days to reach 90 percent. Lynchburg Sand at 20% Above Optimum Moisture Content – Cement Treatment Figure 27 presents unconfined compressive strength test results for cement-treated Lynchburg Sand samples molded at 20 percent above optimum moisture content for varying curing times. The dosage rate is indicated in the legend using the sample identification system in Table 8.
0
50
100
150
200
250
300
350
0 5 10 15 20 25 30
Curing Time, days
Unc
onfin
ed C
ompr
essi
ve S
treng
th, p
si
U5% PC9% PC
Figure 27. UC Strengths vs. Curing Time for Lynchburg Sand at 1.2 x OMC – Cement Treatment

50
Cement treatment was far more effective than lime treatment for Lynchburg Sand at 20 percent above optimum moisture content. Treatment with 9 percent cement achieved a 28-day strength of 331 psi, while 5 percent cement treatment achieved a 28-day strength of 238 psi. The most effective lime (9 percent quicklime) only achieved 51 psi, approximately one quarter of the strength achieved by the lowest cement dosage rate of 5 percent. Strength gain of the cement-treated Lynchburg Sand specimens was somewhat dependent on curing time, but not to the extent seen with cement-treated NoVa Clay specimens. For both dosage rates of cement, specimens achieved approximately 80 percent of the 28-day strength within 3 days, and 94 percent within 14 days. Lynchburg Sand at 20% Above Optimum Moisture Content – Liquid Stabilizer Treatment Figure 28 presents unconfined compressive strength test results for Lynchburg Sand samples molded at 20 percent above optimum moisture content treated with the liquid stabilizers (lignosulfonate and synthetic polymer) for varying curing times. The dosage rate is indicated in the legend using the sample identification system in Table 8.
0
5
10
15
20
25
0 5 10 15 20 25 30
Curing Time, days
Unc
onfin
ed C
ompr
essi
ve S
treng
th, p
si
U1.5% LS3% SP
Figure 28. UC Strengths vs. Curing Time for Lynchburg Sand at 1.2 x OMC – Liquid Stabilizer Treatment
Treatment with 3 percent synthetic polymer showed a slight increase in strength for Lynchburg Sand molded at 20 percent above optimum moisture content. Treatment with synthetic polymer increased the 28-day compressive strength to 8 psi from the untreated strength of 4 psi. Treatment with 1.5 percent lignosulfonate was detrimental to the strength of the samples, decreasing the strength to a little less than 4 psi at 28 days. In addition, curing time had no effect on strength gain of samples treated with the liquid stabilizers.

51
Lynchburg Sand at 20% Above Optimum Moisture Content – Proprietary Cementitious Stabilizer Treatment Figure 29 presents unconfined compressive strength test results for Lynchburg Sand samples molded at 20 percent above optimum moisture content treated with the proprietary cementitious stabilizer for varying curing times. The dosage rate is indicated in the legend using the sample identification system in Table 8.
0
50
100
150
200
250
300
350
0 5 10 15 20 25 30
Curing Time, days
Unc
onfin
ed C
ompr
essi
ve S
treng
th, p
si
U5% PS9% PS
Figure 29. UC Strengths vs. Curing Time for Lynchburg Sand at 1.2 x OMC – Proprietary Cementitious Stabilizer Treatment
Cement treatment was much more effective than proprietary cementitious stabilizer treatment for Lynchburg Sand at 20 percent above optimum moisture content. For treatment with 5 percent proprietary cementitious stabilizer, specimens achieved a 28-day compressive strength of 95 psi compared to a strength of 238 psi achieved using 5 percent cement treatment. For samples treated with 9 percent proprietary cementitious stabilizer, a 28-day strength of 196 psi was achieved, which is still well below the 238 psi strength achieved using only 5 percent cement. However, strengths achieved using the proprietary cementitious stabilizer were still significantly larger than the 51 psi strength achieved using the most effective lime treatment (9 percent quicklime). Curing time had little effect on specimen strength for 9 percent proprietary cementitious stabilizer treatment, but the effect was more pronounced for 5 percent treatment. For 9 percent treatment, 87 percent of the 28-day strength was reached within 3 days of curing, and 92 percent

52
of the 28-day strength was achieved within 7 days. However, for 5 percent proprietary cementitious stabilizer treatment, only 76 percent of the 28-day strength was reached at 3 days. At 7 days, 85 percent of the 28-day strength was achieved, increasing to 93 percent at 14 days.
Moisture Content of Cured Samples Soils at Optimum Moisture Content In conjunction with unconfined compressive strength testing, the moisture content of the samples after curing was recorded. Tables 16, 17, and 18 depict the average change in moisture content for the 28-day cure times for each amendment treated. A negative number indicates a decrease from the initial uncured moisture content and a positive number indicates an increase from the initial uncured moisture condition. For example, for a NoVa Clay specimen with optimum moisture content of 20.2 percent, a value of -1.1 percent represents a cured moisture content of 19.1 percent.
Table 16. Change From Initial Moisture Content after 28-day Curing Period for NoVa Clay Samples
Average Change in Moisture Content Relative
to Initial Condition
Soil Moisture
Content
Amendment
Low Medium High None 0.0% Hydrated lime -1.1% -2.8% Quick lime -3.6% Pelletized lime -0.6% Portland cement -1.0% -2.9% Lignosulfonate +0.7% Synthetic Polymer +0.8% +1.2% Magnesium Chloride +1.0% +1.4%
Optimum
Proprietary Cementitious Stabilizer -0.8% -2.4% None 0.0% Hydrated lime -1.5% -2.6% Quick lime -3.1% Pelletized lime -1.1% Portland cement -1.6% -2.9% Lignosulfonate +0.6% Synthetic Polymer +1.3%
1.2 x Optimum
Proprietary Cementitious Stabilizer -1.2% -2.3%

53
Table 17. Change From Initial Moisture Content after 28-day Curing Period for Staunton Clay Samples
Average Change in
Moisture Content Relative to Initial Condition
Soil Moisture
Content
Amendment
Low Medium High None 0.0% Hydrated lime -1.3% -3.0% -4.3% Quick lime -3.8% -4.7% Pelletized lime -0.5% Portland cement -1.1% -3.1% Lignosulfonate +0.8% Synthetic Polymer +1.3%
Optimum
Proprietary Cementitious Stabilizer -0.9% -2.7% None 0.0% Hydrated lime -1.6% -2.9% Quick lime -3.7% Pelletized lime -0.9% Portland cement -1.8% -3.4%
1.2 x Optimum
Proprietary Cementitious Stabilizer -1.4% -2.8%
Table 18. Change From Initial Moisture Content after 28-day Curing Period for Lynchburg Sand Samples
Average Change in Moisture Content Relative
to Initial Condition
Soil Moisture
Content
Amendment
Low Medium High None 0.0% Hydrated lime -0.9% -2.2% Quick lime -3.5% Pelletized lime -0.4% Portland cement -1.3% -3.4% Lignosulfonate +0.6% Synthetic Polymer +0.9% +1.2%
Optimum
Proprietary Cementitious Stabilizer -0.7% -2.9% None 0.0% Hydrated lime -1.2% -2.2% Quick lime -3.6% Pelletized lime -0.9% Portland cement -1.9% -3.4% Lignosulfonate +0.5% Synthetic Polymer +1.3%
1.2 x Optimum
Proprietary Cementitious Stabilizer -1.3% -2.8% Samples using lime, cement, and proprietary cementitious stabilizer showed decreases in moisture content after curing. Quicklime consistently produced the largest decrease in moisture content for the dry stabilizers. This result was also noted by Alexander et al. (1972) in studying the effects of different types of lime on clays at moisture contents above optimum. Cement, hydrated lime, and proprietary cementitious stabilizer showed about the same decreases in moisture content, but were less effective than quicklime. Pelletized lime appeared to be the least effective of the dry stabilizers in decreasing the water content during curing.

54
Contrary to the dry stabilizers, the liquid stabilizers (lignosulfonate, synthetic polymer, and magnesium chloride) produced increases in water content after curing. Since the lignosulfonate, synthetic polymer, and magnesium chloride contain approximately 40 percent water, these increases agree with expectations.
DISCUSSION The testing program for this research involved investigating the influence of several variables on stabilized soil strength, including stabilizer type, stabilizer dosage rate, and initial moisture content. These factors are discussed in the following sections.
Cement Stabilization The results of this research suggest that the water-cement ratio is the primary factor influencing the effectiveness of cement stabilization. The water-cement ratio is computed as the moisture content divided by the dosage rate, both in terms of percentage of dry weight of soil to be treated. The soil characteristics, including fines content, plasticity, and percentage of clay, were considered, but none of these characteristics dominated the strength characteristics as clearly as the water-cement ratio. Figure 30 depicts the relationship between the water-cement ratio and the 28-day unconfined compressive strength of the cement-treated soils.
0
50
100
150
200
250
300
350
400
450
0 1 2 3 4 5 6 7 8 9 10
Water-Cement Ratio
Unc
onfin
ed C
ompr
essi
ve S
treng
th, p
si
NoVa ClayStaunton ClayLynchburg Sand
Figure 30. Relationship Between 28-day Unconfined Compressive Strength and Water-Cement Ratio

55
The relationship in Figure 30 can be used to predict the amount of cement needed to achieve a desired strength. For example, if the desired strength is 150 psi, the necessary water-cement ratio is 6, according to Figure 30. If the water content of the soil is 30 percent, a cement dose rate of 5 percent on a dry weight basis would be needed.
Lime Stabilization Similar to cement stabilization, the ratio of water content to amendment concentration influences the compressive strength of lime-stabilized soil. However, unlike cement stabilization where strength is relatively independent of the soil properties, lime stabilization also depends on the properties of the soil. Figure 31 shows the relationship between the ratio of plasticity index (expressed as a percentage and based on particles passing the No. 40 sieve) to water-amendment ratio compared to 28-day unconfined compressive strength. The definition of the water-amendment ratio is analogous to that of the water-cement ratio; the water-amendment ratio is computed as the moisture content divided by the dosage rate of the amendment, both in terms of percentage of dry weight of soil to be treated. The plasticity index is expressed as a percentage, and the water-amendment ratio is non-dimensional. For example, for a plasticity index of 25 percent, a water content of 30 percent, and a lime content of 6 percent, the ratio of plasticity index to water-amendment ratio is 25/(30/6) or 5.
0
10
20
30
40
50
60
70
80
90
100
0 2 4 6 8 10 12Plasticity Index / Water-Amendment Ratio
Unc
onfin
ed C
ompr
essi
ve S
treng
th, p
si
Hydrated LimeQuicklimePelletized Lime
Figure 31. Relationship Between 28-day Unconfined Compressive Strength and
Plasticity Index/Water-Amendment Ratio for Lime Treatment

56
The relationship between plasticity index and water-amendment ratio indicates that lime stabilization will be more effective and efficient for soils of higher plasticity. As the ratio of plasticity index to water content increases, less lime is required to reach a desired unconfined compressive strength. Thus, it will be more advantageous to use lime in a wet, high plasticity clay than a wet, low plasticity clay. There is quite a bit of scatter in the data, but the trend lines permit estimates of the amount of lime required to achieve a desired compressive strength when the plasticity index and moisture content of the clay are known. For example, supposed that an unconfined compressive strength of 70 psi is desired. The trend lines in Figure 31 indicate that the required plasticity index to water-amendment ratio is 4.7 for quicklime and 7.3 for hydrated lime. Suppose the site soil has a water content of 28 percent and a plasticity index of 25. The resulting dose rates for quicklime and hydrated lime are (4.7)(28)/(25) = 5.3% and (7.3)(28)/(25) = 8.2% respectively, on a dry weight basis. Site specific testing would be necessary to improve these estimates.
Liquid Stabilizers Compressive strength testing of soils stabilized with lignosulfonate, synthetic polymer, and magnesium chloride produced results that were not competitive with those achieved using traditional stabilizers. While strength increases of up to 50 percent were achieved in some cases, these increases represent an increase of only 5 to 10 psi compared to increases of upwards of 50 to 250 psi using traditional stabilizers and the proprietary cementitious stabilizer. While clear relationships between the liquid stabilizers and soil properties could not be established, several trends are apparent regarding the effectiveness of the liquid stabilizers. It seems that the curing environment has a major influence on the effectiveness of the non-traditional stabilizers. In the sealed curing environment used for this research, the soils were not allowed to dry out. Since the moisture is not allowed to escape and is not consumed by chemical reactions as it is with lime or cement, it appears that for lignosulfonate and synthetic polymer, bonding of the stabilizer to the soil particles is hindered by the “trapped” water, and bonding does not occur to the extent necessary to produce high soil strengths. For stabilization with magnesium chloride, it appears that a combination of the high water content of the solution and the sealed curing environment is detrimental to strength gain. It appears that the chemical reactions that occur between the magnesium chloride and the soil are hindered by the excess water in the soil matrix, preventing considerable strength gain of the mixture. The effectiveness of the non-traditional stabilizers also appears to be dependent on the initial moisture condition of the soil. The lignosulfonate and synthetic polymer seemed to be more effective on the soils at optimum moisture content than the soils above optimum moisture content. This may be because the non-traditional stabilizers are water soluble and become more “diluted” in soils with high moisture contents. Also, soils with higher initial moisture contents magnify the problem with bonding between the stabilizers and soil particles.
Proprietary Cementitious Stabilizer This research suggests that the water-amendment ratio is the primary factor influencing the effectiveness of strength gain when treating soils with the proprietary cementitious stabilizer.

57
However, unlike cement treatment where strength was dependent on the water-cement ratio but independent of the soil type, it appears that, for treatment with the proprietary cementitious stabilizer, strength is dependent on both the water-amendment ratio and the soil type. Figure 32 depicts two distinct trend lines for the relationship between the water-amendment ratio and the 28-day unconfined compressive strength for the clays and sand. These trend lines can be used in the same way as illustrated above for cement treatment.
0
50
100
150
200
250
300
350
400
450
0 1 2 3 4 5 6 7 8 9 10
Water-Amendment Ratio
Unc
onfin
ed C
ompr
essi
ve S
treng
th, p
si
NoVa ClayStaunton ClayLynchburg SandClay Trend LineSand Trend Line
Figure 32. Relationship Between 28-day Unconfined Compressive Strength and Water-Amendment Ratio
for Proprietary Cementitious Stabilizer Treatment
CONCLUSIONS
�� Dry stabilizers, including lime, portland cement, and the proprietary cementitious stabilizer,
were far more effective than the liquid stabilizers in increasing the strength of the soils tested. portland cement treatment produced the highest strength.
�� The proprietary cementitious stabilizer was more effective in increasing the strength of soils
tested than the lime stabilizers. For low dosage rates, treatment with the proprietary cementitious stabilizer and cement achieved comparable strengths.
�� The non-traditional liquid stabilizers (lignosulfonate, synthetic polymer, and magnesium
chloride) proved relatively ineffective in increasing the strength of the soils tested. This may be due, in part, to the sealed curing conditions that were employed in this testing. These

58
curing conditions were selected in collaboration with VDOT personnel to replicate moist curing that may occur in the field under various weather and ground water conditions.
�� While cement treatment produced stronger samples, quicklime, hydrated lime, and the
proprietary cementitious stabilizer were equally effective in reducing the moisture content of the soils. Use of quicklime, hydrated lime, or the proprietary cementitious stabilizer may be useful in situations where workability of the soil rather than strength of the soil is a priority.
�� For cement stabilization, a trend line was established relating the water-cement ratio to the
unconfined compressive strength for the soils tested. �� For lime stabilization, trend lines were established relating the plasticity index and water-
amendment ratio to the unconfined compressive strength for the soils tested. These trend lines can be used to design laboratory testing programs and for preliminary design studies.
�� The majority of the strength gain for samples treated with lime, lignosulfonate, synthetic
polymer, and the proprietary cementitious stabilizer occurs within 7 days of curing. Strength test results obtained for specimens that are cured for only 7 days may be valuable for time-sensitive projects for which an abbreviated screening process may be necessary.
�� Strength gain for samples treated with cement occurs more gradually than for the other
amendments tested. Cement-treated samples generally achieve 65 to 75 percent of their 28-day strength within 7 days of curing.
RECOMMENDATIONS
Recommended Laboratory Procedure The laboratory procedure in Appendix A can be used for preparing specimens and determining the unconfined compressive strength of soils using traditional and non-traditional stabilizers. This procedure offers a step-by-step process for the following:
1. Storing and handling the base soil. 2. Preparing the base soil for mixing with the stabilizer.
3. Preparing the stabilizer for mixing.
4. Mixing the soil and stabilizer.
5. Placing the mixture into molds for curing.
6. Storing the specimens during curing.

59
7. Extraction of the cured specimens from the molds and preparation of the specimens prior to testing.
8. Strength testing of the cured specimens.
This procedure can be used to investigate the impact of stabilizer type and stabilizer dose rate for laboratory mix design studies.
Recommended Use of New Relationships between Strength and Dose Rate The trend lines in Figures 30, 31, and 32 provide means to select amendment dose rates that can achieve a desired subgrade strength based on amendment type and easily determined soil characteristics, such as water content and plasticity. These trend lines can be used to help design laboratory test programs, and they can also be used for preliminary pavement design studies. Final pavement designs should be based on site specific laboratory test programs.
Recommended Areas for Further Research The following items, which were not part of the scope of the Phase I research described in this report, should be addressed in subsequent phases:
�� Resilient Modulus Testing of Laboratory-Prepared Samples. The recommended laboratory procedure outlined in this report is an effective way to evaluate the impact of various stabilizers with respect to unconfined compressive strength of soil-stabilizer mixtures. However, since resilient modulus values rather than unconfined compressive strengths are used for mechanistic pavement design procedures, it is recommended that resilient modulus testing be conducted to provide correlations with unconfined compressive strength testing of stabilized soils prepared and tested using the recommended laboratory procedure.
�� Impact of Subgrade Stabilization on Life-Cycle Cost of Pavements. A tremendous
amount of money is spent every year in Virginia to construct new pavements and rehabilitate existing pavements. For new pavement construction, the life-cycle cost depends strongly on the support quality provided by the pavement subgrade. Weak subgrades can result in fatigue cracking and rutting in asphalt pavement systems. These problems can be prevented by using thick and expensive pavement sections, which distribute the vertical load from a vehicle wheel to reduce the pressure increment on the subgrade, and thereby limit tensile strain development in the pavement section. Tensile strains are the primary cause of fatigue cracking in asphalt pavements. An alternative to thick pavement sections is to improve the subgrade support quality through soil stabilization. Subgrade stabilization can reduce pavement deflections, prevent fatigue cracking, and limit rutting. An investigation of the impact of subgrade stabilization on the life-cycle cost of pavements has the potential to produce substantial savings for roadway pavements in Virginia.
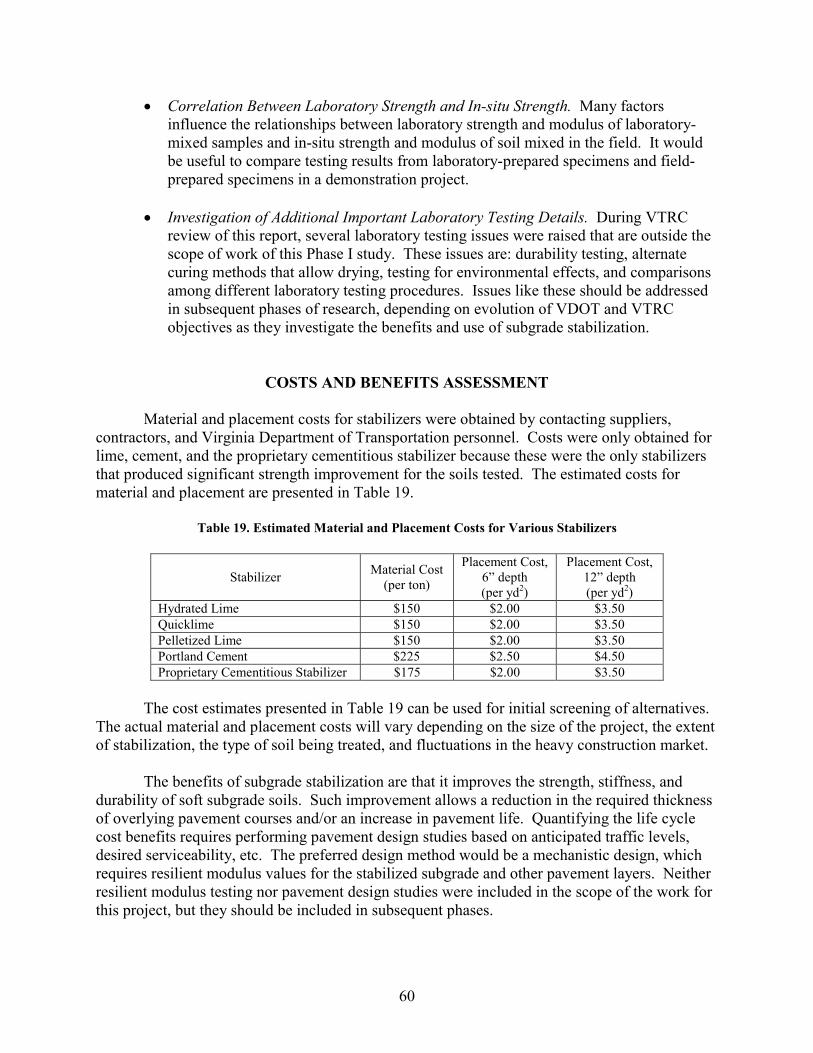
60
�� Correlation Between Laboratory Strength and In-situ Strength. Many factors influence the relationships between laboratory strength and modulus of laboratory-mixed samples and in-situ strength and modulus of soil mixed in the field. It would be useful to compare testing results from laboratory-prepared specimens and field-prepared specimens in a demonstration project.
�� Investigation of Additional Important Laboratory Testing Details. During VTRC
review of this report, several laboratory testing issues were raised that are outside the scope of work of this Phase I study. These issues are: durability testing, alternate curing methods that allow drying, testing for environmental effects, and comparisons among different laboratory testing procedures. Issues like these should be addressed in subsequent phases of research, depending on evolution of VDOT and VTRC objectives as they investigate the benefits and use of subgrade stabilization.
COSTS AND BENEFITS ASSESSMENT Material and placement costs for stabilizers were obtained by contacting suppliers, contractors, and Virginia Department of Transportation personnel. Costs were only obtained for lime, cement, and the proprietary cementitious stabilizer because these were the only stabilizers that produced significant strength improvement for the soils tested. The estimated costs for material and placement are presented in Table 19.
Table 19. Estimated Material and Placement Costs for Various Stabilizers
Stabilizer Material Cost (per ton)
Placement Cost, 6” depth (per yd2)
Placement Cost, 12” depth (per yd2)
Hydrated Lime $150 $2.00 $3.50 Quicklime $150 $2.00 $3.50 Pelletized Lime $150 $2.00 $3.50 Portland Cement $225 $2.50 $4.50 Proprietary Cementitious Stabilizer $175 $2.00 $3.50
The cost estimates presented in Table 19 can be used for initial screening of alternatives. The actual material and placement costs will vary depending on the size of the project, the extent of stabilization, the type of soil being treated, and fluctuations in the heavy construction market. The benefits of subgrade stabilization are that it improves the strength, stiffness, and durability of soft subgrade soils. Such improvement allows a reduction in the required thickness of overlying pavement courses and/or an increase in pavement life. Quantifying the life cycle cost benefits requires performing pavement design studies based on anticipated traffic levels, desired serviceability, etc. The preferred design method would be a mechanistic design, which requires resilient modulus values for the stabilized subgrade and other pavement layers. Neither resilient modulus testing nor pavement design studies were included in the scope of the work for this project, but they should be included in subsequent phases.

61
ACKNOWLEDGMENTS The Virginia Transportation Research Council and the Virginia Department of Transportation provided funding for this work. Dr. David Mokarem, Mr. Stan Hite, Dr. Edward Hoppe, Dr. Shabbir Hossain, and Dr. Jose Gomez of the Virginia Transportation Research Council all made important contributions to the research. The authors also recognize the contributions of Dana Keese and Jonathan Brown for their contributions to the laboratory effort and report composition.
The authors also thank the Northern Virginia, Staunton, and Lynchburg districts of the Virginia Department of Transportation for their assistance in collecting the soil samples used for this research. We also recognize the generosity of Chemical Lime Company, Lignotech USA, Enviroseal Corporation, Innovative Municipal Products, and Anyway Solid Environmental Solutions for their donations of the stabilizers used in this research.
REFERENCES Alexander, M.L., Smith, R.E., and Sherman, G.B. Relative Stabilizing Effect of Various Limes
on Clayey Soils. Bulletin 381, Highway Research Board, Washington, DC, 1972.
Arman, A., and Munfakh, G.A. Stabilization of Organic Soils with Lime. Engineering Research Bulletin No. 103, Division of Engineering Research, Louisiana State University, Baton Rouge, 1970.
ASTM, Inc. ASTM D 422-63, 2002. Standard Test Method for Particle-Size Analysis of Soils.
Annual Book of ASTM Standards, Vol. 04.08, West Conshohoken, PA. ASTM, Inc. ASTM D 558-96, 2002. Standard Test Methods for Moisture-Density Relations of
Soil-Cement Mixes. Annual Book of ASTM Standards, Vol. 04.08, West Conshohoken, PA.
ASTM, Inc. ASTM D 854-00, 2002. Standard Test Method for Specific Gravity of Soils.
Annual Book of ASTM Standards, Vol. 04.08, West Conshohoken, PA. ASTM, Inc. ASTM D 1632-96, 2002. Standard Practice for Making and Curing Soil-Cement
Compression and Flexure Test Specimens in the Laboratory. Annual Book of ASTM Standards, Vol. 04.08, West Conshohoken, PA.
ASTM, Inc. ASTM D 2166-00, 2002. Standard Test Method for Unconfined Compressive
Strength of Cohesive Soil. Annual Book of ASTM Standards, Vol. 04.08, West Conshohoken, PA.

62
ASTM, Inc. ASTM D 2216-98, 2002. Standard Test Method for Laboratory Determination of Water (Moisture) Content of Soil and Rock by Mass. Annual Book of ASTM Standards, Vol. 04.08, West Conshohoken, PA.
ASTM, Inc. ASTM D 2487-00, 2002. Standard Practice for Classification of Soils for
Engineering Purposes (Unified Soil Classification System). Annual Book of ASTM Standards, Vol. 04.08, West Conshohoken, PA.
ASTM, Inc. ASTM D 2488-00, 2002. Standard Practice for Description and Identification of
Soils (Visual-Manual Procedure). Annual Book of ASTM Standards, Vol. 04.08, West Conshohoken, PA.
ASTM, Inc. ASTM D 2974-00, 2002. Standard Test Methods for Moisture, Ash, and Organic
Matter of Peat and Other Organic Soils. Annual Book of ASTM Standards, Vol. 04.08, West Conshohoken, PA.
ASTM, Inc. ASTM D 3551-90, 2002. Standard Practice for Laboratory Preparation of Soil-
Lime Mixtures Using a Mechanical Mixer. Annual Book of ASTM Standards, Vol. 04.08, West Conshohoken, PA.
ASTM, Inc. ASTM D 4318-00, 2002. Standard Test Methods for Liquid Limit, Plastic Limit,
and Plasticity Index of Soils. Annual Book of ASTM Standards, Vol. 04.08, West Conshohoken, PA.
ASTM, Inc. ASTM D 4643-00, 2002. Standard Test Method for Determination of Water
(Moisture) Content of Soil by the Microwave Oven Heating. Annual Book of ASTM Standards, Vol. 04.08, West Conshohoken, PA.
ASTM, Inc. ASTM D 4832-95, 2002. Standard Test Method for Preparation and Testing of
Controlled Low Strength Material (CLSM) Test Cylinders. Annual Book of ASTM Standards, Vol. 04.08, West Conshohoken, PA.
ASTM, Inc. ASTM D 4972-01, 2002. Standard Test Method for pH of Soils. Annual Book of
ASTM Standards, Vol. 04.08, West Conshohoken, PA. ASTM, Inc. ASTM D 2974-00, 2002. Standard Test Methods for Moisture, Ash, and Organic
Matter of Peat and Other Organic Soils. Annual Book of ASTM Standards, Vol. 04.08, West Conshohoken, PA.
Brown, J.J., Brandon, T.L., Daniels, W.L., DeFazio, T.L., Filz, G.M., and Mitchell, J.K. Rapid
Stabilization/Polymerization of Wet Clay Soils: Phase I Literature Review. Air Force Research Laboratory, Tyndall AFB, FL, 2004.
Carlsten, P., and Ekstrom, J. Lime and Lime/Cement Columns. Swedish Geotechnical Society
Report 4:95E, Linköping, 1995.

63
Chou, L. Lime Stabilization: Reactions, Properties, Design, and Construction. State of the Art Report 5, Transportation Research Board, Washington, DC, 1987.
Eades, J.L, and Grim, R.E. Reaction of Hydrated Lime with Pure Clay Minerals in Soil
Stabilization. Bulletin 262, Highway Research Board, Washington, DC, 1960. Eades, J.L., and Grim, R.E. A Quick Test to Determine Lime Requirements for Soil
Stabilization. Highway Research Record 139, Highway Research Board, Washington, DC, 1966.
Gow, A.J., Davidson, D.T., and Sheeler, J.B. Relative Effects of Chlorides, Lignosulfonates and
Molasses on Properties of a Soil-Aggregate Mix. Bulletin 282, Highway Research Board, Washington, DC, 1960.
Ingles, O.G., and Metcalf, J.B. Soil Stabilization: Principles and Practice. Butterworths, Sydney, 1972.
Jacobson, J.R., Filz, G.M., and Mitchell, J.K., Factors Affecting Strength Gain in Lime-Cement
Columns and Development of a Laboratory Testing Procedure, VTRC 03-CR16, Virginia Transportation Research Council, Charlottesville, 2003.
Kosmatka, S.H., and Panarese, W.C. Design and Control of Concrete Mixtures, Thirteenth
Edition. Portland Cement Association, Skokie, IL, 1994. Kunze, G.W. Pretreatment for Mineralogical Analysis. C.A. Black et al., eds., Methods of Soil
Analysis, Part 1, Agronomy Monograph 9. American Society of Agronomy, Madison, WI, 1965.
Lees, G., Abdelkader, M.O., and Hamdani, S.K. (1982). Sodium Chloride as an Additive in
Lime-Soil Stabilisation. Highway Engineer, Vol. 29, No. 12, 1982, pp. 2-8.
Little, D.N. Handbook for Stabilization of Pavement Subgrades and Base Courses with Lime. Kendall/Hunt, Iowa, 1995.
Mitchell, J.K., Veng, T.S., and Monismith, C.L. Behavior of Stabilized Soils Under Repeated
Loading. Department of Civil Engineering, University of California, Berkeley, 1974. Miura, N., Horpibulsuk, S., and Nagaraj, T.S. Engineering Behavior of Cement Stabilized Clay
at High Water Content. Soils and Foundations, Japanese Geotechnical Society, Vol. 41, No. 5, 2002, pp. 33-45.
Rauch, A.F., Harmon, J.S., Katz, L.E., and Liljestrand, H.M. Liquid Soil Stabilizers: Measured
Effects on Engineering Properties of Clay. In Transportation Research Record No. 1787. Transportation Research Board, Washington, DC, 2002.

64
Sinha, S.P., Davidson, D.T., and Hoover, J.M. Lignins as Stabilizing Agents for Northeastern Iowa Loess. Proceedings of the Iowa Academy of Science, 69th Session, Iowa, 1957.
Thompson, M.R., and Eades, J.L. Evaluation of a Quick Test for Lime Stabilization. Journal of the Soil Mechanics and Foundation Division, ASCE, Vol. 96, No. SM2, 1970.
Tingle, J.S, and Santoni, R.L. Stabilization of Clay Soils with Nontraditional Additives. In
Transportation Research Record 1819. Transportation Research Board, Washington, DC, 2003.
Yotam Engineering Ltd. RBI Grade 81: A Soil Stabilizer for Paving Technology. Yotam
Engineering Ltd., Israel, 2004.

65
APPENDIX A
LABORATORY PROCEDURE FOR PREPARING AND DETERMINING STRENGTH OF SOIL SPECIMENS STABILIZED WITH LIME, CEMENT, AND LIQUID SOIL
STABILIZERS

66

67
Equipment
1. 50 mm diameter, 100 mm tall plastic molds with lids. 2. Aluminum mold stand with collar. 3. Customized Proctor hammer (2.75 lb, 6 in. drop). 4. KitchenAid stand mixer with bowl: 4 liter capacity, 450 watt, model K455 with dough
hook. 5. Mixing bowls. 6. Moisture tins. 7. No. 4 (4.75 mm) sieve. 8. Dremel cutting tool or equivalent. 9. Scale. 10. Spoon or trowel. 11. ¼ in. metal rod. 12. Spatula. 13. Straight edge or knife. 14. Unconfined compression apparatus. 15. Camera.
Soil Preparation
1. Obtain approximately 1800 g of wet soil from sealed bulk samples. This amount of soil will produce four specimens, allowing strength testing of one specimen at each of four cure times. Remove excess air from the plastic bags containing the bulk samples, using a vacuum if necessary, and re-seal them. It is recommended that this entire procedure be repeated so that eight specimens are created. Then, two specimens, one from each batch, can be tested at each of four curing times. Alternatively, if a mixer with a larger bowl is employed, it may be possible to mix enough for eight specimens in one batch.
2. Break up any large soil clods. Remove and discard any particles exceeding 5 mm in
diameter. If necessary, a No. 4 sieve can be used for this operation. Blend the soil together to promote even moisture distribution throughout the sample.
3. If the natural moisture content is above that desired for mixing, air dry the soil to a water
content slightly below the target value, being careful to frequently mix the soil to promote uniform drying.
4. Take two representative 50 g samples to determine the moisture content of the soil. To
reduce exposure of air to the soil, the microwave drying method (ASTM D 4643) may be used for soils with low organic content. Otherwise, the moisture content may be performed using the oven drying method (ASTM D 2216) at least 24 hours prior to batching of the samples.
5. Weigh the remaining soil to the nearest gram.
6. Calculate the amount of water required to raise the water content to the desired value.

68
7. With the mixer on low speed, gradually add the water to the soil sample. After all the
water is added, continue mixing for 3 to 5 minutes. It may be necessary to stop the mixer and, using a spatula or knife, scrape unmixed soil from the sides and bottom of the mixing bowl into the mixed portion and resume mixing.
8. Determine and weigh the amount of stabilizer to be added. For these studies, the
percentage of stabilizer to be used is defined in terms of the dry weight of soil to be treated. Thus, the required amount of stabilizer to be used can be found using the following formula:
Amount of stabilizer = PS x WTOT / (1 + w) Where: PS = Percent by dry weight of stabilizer to be used WTOT = Wet weight of batch prior to addition of stabilizer w = Moisture content of batch prior to addition of stabilizer
9. Using the dough hook as the mixing tool, begin mixing the untreated soil on low speed.
Sprinkle the stabilizer over the soil within the first minute of mixing. Mix for a minimum of 3 minutes until the mixture achieves uniform color and consistency, but do not mix for more than 5 minutes. It may be necessary to stop the mixer and, using a spatula or knife, scrape unmixed soil from the sides and bottom of the mixing bowl into the mixed portion and resume mixing.
10. Seal the mixed soil in a plastic container or with plastic wrap to minimize evaporation
losses while placing mixture into specimen molds. If a mellowing time for the soil is desired after completion of mixing, seal the specimen in a plastic container for the desired mellowing period.
Placement of Mixture in Molds 11. Place an appropriately labeled, clean, dry plastic mold into the aluminum mold stand and
secure the collar. The molds should be labeled before mixing the soil and stabilizer. 12. Place a thin layer of the soil mixture into the plastic mold using a spoon or trowel and
spread into a uniform layer approximately ¼ inch thick. Using the metal rod, tamp the mixture 25 times around the perimeter of the mold using moderate effort. This will help to ensure that the mixture is compacted into the bottom corners of the mold and that loose material does not remain in the bottom corners after specimen compaction.
13. The soil mixture is to be compacted into the molds in three layers of approximately equal thickness. Place loose soil into the mold using a spoon or trowel and spread into a layer of uniform thickness. Compact each layer using 22 hammer blows at a uniform rate of approximately 22 blows per minute in a manner to provide complete, uniform coverage of the specimen surface.

69
14. Following compaction of the last layer, remove the collar from the aluminum mold stand, being careful not to disturb the soil. This can be accomplished by either resting the compaction device on the compacted sample or lightly pressing on the compacted sample while twisting off the collar. After removing the collar, if the specimen does not extend above the top of the mold or if it extends more than ¼ inch above the top of the mold, the specimen shall be discarded.
15. Screed off the top of the specimen flush with the top of the plastic mold using a straight
edge. Then remove the plastic mold and specimen from the aluminum mold stand, and cap the mold securely with the lid.
16. Place samples in a moist environment (100% relative humidity) at room temperature. If a
humid room is not available, samples in watertight molds may be submerged in water.
17. Repeat steps 11 – 16 for each specimen. These steps should be completed for all specimens from a single batch within 30 minutes of completion of mixing. This is easy to accomplish for four specimens, but it requires rapid work for eight specimens.
Unconfined Compressive Strength Preparation and Testing
18. Using the Dremel cutting tool or equivalent, cut through the mold from top to bottom
along three or four equally spaced lines, being careful not to damage the specimen. With practice, this can be done effectively. After cutting the slots through the mold, it can be peeled off of the specimen. If the soil is still not easily removed from the mold or if disturbance of the soil specimen occurs, the bottom of the mold may also be cut off to facilitate extracting the specimen.
19. When necessary, use a straight edge and miter box to trim the specimen ends such that
the ends are planar and parallel.
20. Measure and record each specimen height and diameter in at least two locations and record the weight of each specimen.
21. Record the time and date of sample removal and testing.
22. Run unconfined compression tests in accordance with ASTM D 2166-98a at a strain rate
of approximately 1 percent per minute.
23. Record load versus deformation data in order to create a stress versus strain plot.
24. Record the mode of failure and photograph the failed specimen.
25. After performing the unconfined compression test, collect the entire failed specimen (or a representative sample of the failed specimen fragments) and determine the moisture content.

70

71
APPENDIX B
MOISTURE-DENSITY PLOTS

72

73
Natural MC% Fines
LLPLPIGs
OMC
MDD
Sample
Sample Location
Sample Depth
Soil Description106.3 pcf
20.2%2.8020204066
18.4%Northern Virginia Sandy Lean Clay
Springfield, VA
1'-3'
Sandy Lean Clay (CL, A-6) - mostly low to medium plasticity fines, few fine to medium sands, trace subrounded gravel, moist, red/orange with light gray, firm.
PROCTOR CURVESASTM D-698
75
80
85
90
95
100
105
110
115
120
125
130
135
140
145
150
155
160
165
0 5 10 15 20 25 30 35 40
Moisture Content - Percent of Dry Weight
Dry
Den
sity
- Po
unds
per
Cub
ic F
oot Gs = 2.6
Gs = 2.7
Gs = 2.8
Regular Proctor Hammer Special Proctor Hammer
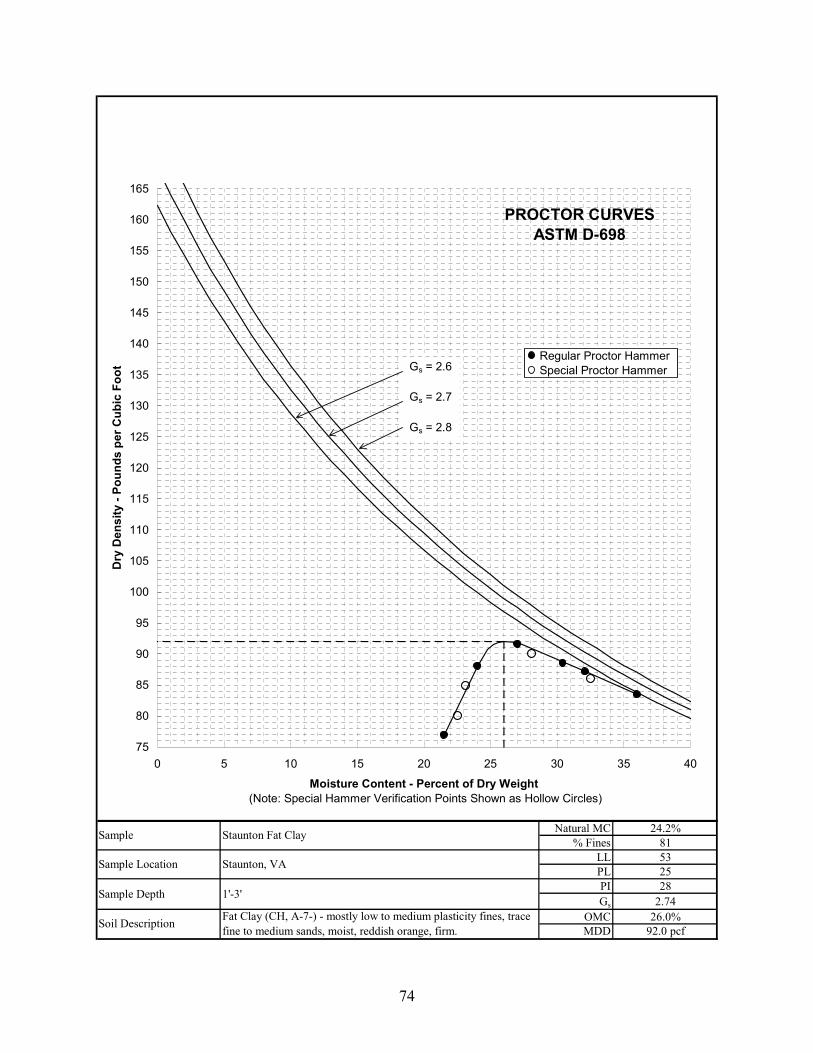
74
Natural MC% Fines
LLPLPIGs
OMCMDD
Sample
Sample Location
Sample Depth
Soil Description 92.0 pcf26.0%2.7428255381
24.2%Staunton Fat Clay
Staunton, VA
1'-3'
Fat Clay (CH, A-7-) - mostly low to medium plasticity fines, trace fine to medium sands, moist, reddish orange, firm.
PROCTOR CURVESASTM D-698
75
80
85
90
95
100
105
110
115
120
125
130
135
140
145
150
155
160
165
0 5 10 15 20 25 30 35 40
Moisture Content - Percent of Dry Weight (Note: Special Hammer Verification Points Shown as Hollow Circles)
Dry
Den
sity
- Po
unds
per
Cub
ic F
oot Gs = 2.6
Gs = 2.7
Gs = 2.8
Regular Proctor Hammer Special Proctor Hammer

75
Natural MC% Fines
LLPLPIGs
OMCMDD
Lynchburg Silty Sand
Lynchburg, VA
1'-3'
Silty Sand (SM, A-2-4) - mostly fine to medium sands, some non-plastic micaceous fines, moist, tan/brown/silver, firm.
NP3123
13.8%
101.3 pcf19.2%2.73NP
Sample
Sample Location
Sample Depth
Soil Description
PROCTOR CURVESASTM D-698
75
80
85
90
95
100
105
110
115
120
125
130
135
140
145
150
155
160
165
0 5 10 15 20 25 30 35 40
Moisture Content - Percent of Dry Weight
Dry
Den
sity
- Po
unds
per
Cub
ic F
oot Gs = 2.6
Gs = 2.7
Gs = 2.8
Regular Proctor Hammer Special Proctor Hammer