Embed Size (px)
Citation preview
World Journal of Engineering and Technology, 2017, 5, 51-61 http://www.scirp.org/journal/wjet
ISSN Online: 2331-4249 ISSN Print: 2331-4222
DOI: 10.4236/wjet.2017.54B006 Oct. 12, 2017 51 World Journal of Engineering and Technology
Standardization of the Main Dimensions of Design Container Ships in Ports—A Case Study
Soheil Radfar, Amir Taherkhani, Roozbeh Panahi*
Department of Marine Structures, Tarbiat Modares University, Tehran, Iran
Abstract Ports are crucial element in the export and import chains of each country. Therefore, sufficient and efficient designing of ports is of great importance to increase the safety of operations and to lower the construction costs. Their de-sign procedure is iterative and specifications of the design ship are of the most important inputs in this regard. The design ship is characterized with its length (L), breadth (B), and draft (d). In this research a regression analysis has been carried out in the southern coasts of Iran (Persian Gulf) to obtain these specifications. The results have shown under- and over-estimations of the main dimensions. Hence, this supports the idea that it is worth performing individual regression analysis, especially in restricted waterways and in the re-gions with specific fleet for the sake of verification of recommended values by standard technical guidelines.
Keywords Length, Breadth, Draft, Dead Weight Tonnage, Terminal
1. Introduction
A port complex consists of many elements including quays, breakwaters, turning basins, berthing structures, and mooring facilities. Design process of these ele-ments is an iterative procedure. An important parameter in this regard is the correct determination of the capacity and the main dimensions of the design ship that utilizes port facilities [1] [2] [3].
A design ship is characterized by its length (L), breadth (B) and draft (d) as its main dimensions as well as its Dead Weight Tonnage (DWT) or Gross Regis-tered Tonnage (GRT). In the design guidelines and technical standards it is com-mon to present formulae and design charts based on the correlation between DWT/GRT with L, B and D.
How to cite this paper: Radfar, S., Ta-herkhani, A. and Panahi, R. (2017) Stan-dardization of the Main Dimensions of Design Container Ships in Ports—A Case Study. World Journal of Engineering and Technology, 5, 51-61. https://doi.org/10.4236/wjet.2017.54B006 Received: August 30, 2017 Accepted: October 9, 2017 Published: October 12, 2017
S. Radfar et al.
DOI: 10.4236/wjet.2017.54B006 52 World Journal of Engineering and Technology
To determine the main characteristics of the design ship, a statistical analysis; known as regression analysis is needed. Required data for such analysis may be gathered from many sources e.g. port authorities, governmental organizations, classification societies and global ship tracking databases.
Over the past two decades, Japanese were the pioneers of these analyses for local and global purposes. First serious study on the main dimensions was car-ried out by Port and Harbor Research Institute (PHRI) in Japan [4]. They uti-lized Japanese port data and fitted formulae for the design purposes of their port facilities. Later, Akakura and Takahashi [4] in order the generalization of for-mulae for all over the world, utilized 1-year data (1995-1996) from Lloyd’s Reg-ister of Ships and performed a regression analysis on the main dimensions of the design ship. This fundamental research is the basis of some latter guidelines e.g. [5], [6] and [7]. Using this approach, Takahashi et al. [2] based on 1-month data from LMIU1 Shipping Data (January of 2004) and 1-year data from Japanese Register of Ships (2004) conducted regression analysis on nine distinct ship types. This research was later became the reference of Technical Standards and Commentaries of Port and Harbor Facilities [8].
Since the results of previous studies and hence available guidelines and tech-nical standards, propose formulae for all over the world and have general nature, it is worth performing individual regression analyses in each country and local ports. Overestimation of the main dimensions increases the final cost of the port construction/development, and conversely, under estimation of the dimensions would increase the risk accidents, port failures and low efficiency operations. Ac-cordingly, in current research a regression analysis has been carried out in the southern coasts of Iran (Persian Gulf).
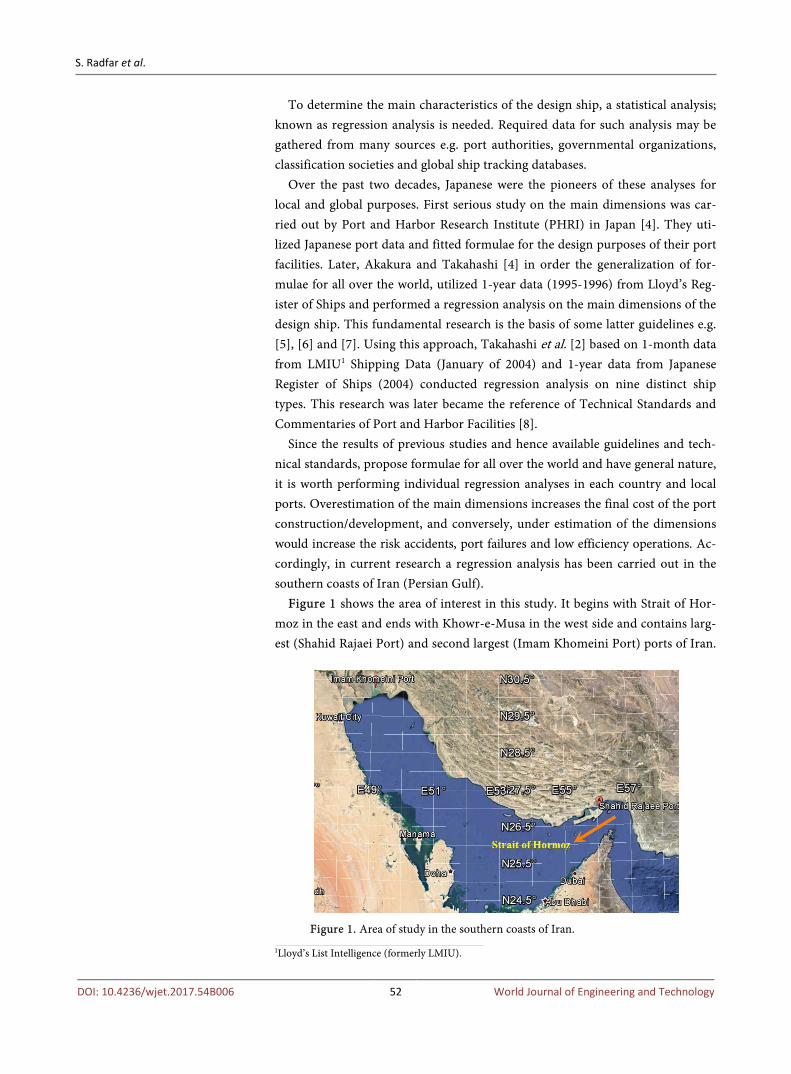
Figure 1 shows the area of interest in this study. It begins with Strait of Hor-moz in the east and ends with Khowr-e-Musa in the west side and contains larg-est (Shahid Rajaei Port) and second largest (Imam Khomeini Port) ports of Iran.
Figure 1. Area of study in the southern coasts of Iran.
1Lloyd’s List Intelligence (formerly LMIU).
S. Radfar et al.
DOI: 10.4236/wjet.2017.54B006 53 World Journal of Engineering and Technology
Overall throughput of these ports is 76,246,210 and 42,931,757 tons, respectively [9].
This study is structured as follows: in Section 2, methods of statistical analysis have been described and materials of the research are defined. In Section 3.1, the regression analysis has been performed on the available data for container ships and the results are presented. In Section 3.2, obtained results are compared against the results from [5], [6] and [8], and their differences have been speci-fied. Finally, in Section 4, the main conclusions of performed study have been presented.
2. Materials and Methods 2.1. Data
The data used for statistical analysis in this research have been provided by Port and Maritime Organization of Iran (PMO). The data include information such as IMO number, ship name, DWT, GRT, length overall, breadth molded and full load draft for ships calling the Iranian ports of the Persian Gulf since 1999 (17-year data). Total port calls for container ships in the analysis is 985.
2.2. Data Validation
For any statistical analysis it is necessary to evaluate the correctness of available data. To remove/reduce noise and errors from recorded data, “Data filtration” is needed [10]. Here, filtration is performed in two distinct steps. At first, main dimensions of ships are checked with an international source [11] using their IMO number and name. This resulted in 2% of elimination in raw data. Then, due to diversity of data, a standard deviation analysis is performed to exclude out of range data. It yielded into 19% data removal.
2.3. Analysis Methods
As it is mentioned earlier, it is common to demonstrate the main specifications of the design ship in the form of formulae and design charts, which correlate L, B, and D with DWT. This is possible using so called the regression analysis. There are three main technics to perform such analysis:
2.3.1. Logarithmic Regression Analysis Method According to this method, relationship between main specifications (L, B, D and GRT) of the design ship with its DWT is outlined in the following form:
Y X βα= (1)
here, Y is L, B, D of the specific ship, and X is DWT of the ship. Applying a logarithm on both sides of Equation (1), it transforms to the fol-
lowing equation:
( ) ( ) ( )log log logY Xα β= + (2)
This linear regression equation simplifies applying of coverage rate (will be discussed in Section 2.4) on available dat.
S. Radfar et al.
DOI: 10.4236/wjet.2017.54B006 54 World Journal of Engineering and Technology
2.3.2. Linear Regression Analysis Method In this method, relationship between main specifications (L, B, D and GRT) of the design ship with its DWT obeys a normal straight line in the form of Equa-tion (3):
Y aX b= + (3)
here, Y and X are as before and a, b are constants.
2.3.3. Average Value Analysis Method In cases where a ship specification is constant regardless of the change in DWT, the average value of the data is calculated as 50% value (a single constant line parallel to DWT-axis). A representative example of this case is the B-DWT rela-tionship for container ships. This happens due to limited breadth for traveling ships in the Panama Canal.
2.4. Coverage Rate
For a specific port it is possible that about 50% of called ships can have bigger dimensions than design values. So, port authorities must be aware of considering safety studies as necessary for the ship with greater dimensions. As it is obvious, increasing the confidence limit will raise the cost of improving port facilities to focus on high service levels. In this study, regression equations according to coverage rates equal to 50%, 75%, and 90% have been set. Here, it is assumed that the distribution of data around the regression equations obeys a normal distribution. This assumption causes a parallel translation form the regression equation of the average value will be obtained from based on the value of condi-tional standard deviation. The amount of this parallel translation is K*σ; known as conditional standard deviation (CSD) [12].
2.5. Performance Indicators
In the statistical analysis, it is necessary to compare obtained results with those available. This is possible using statistical indices. In this study, coefficient of de-termination (R2) has been calculated for this purpose [2]. Closer the R2 value to one, the better the proposed results are.
3. Results and Discussion 3.1. Analysis on the Main Specifications of Design Container Ship
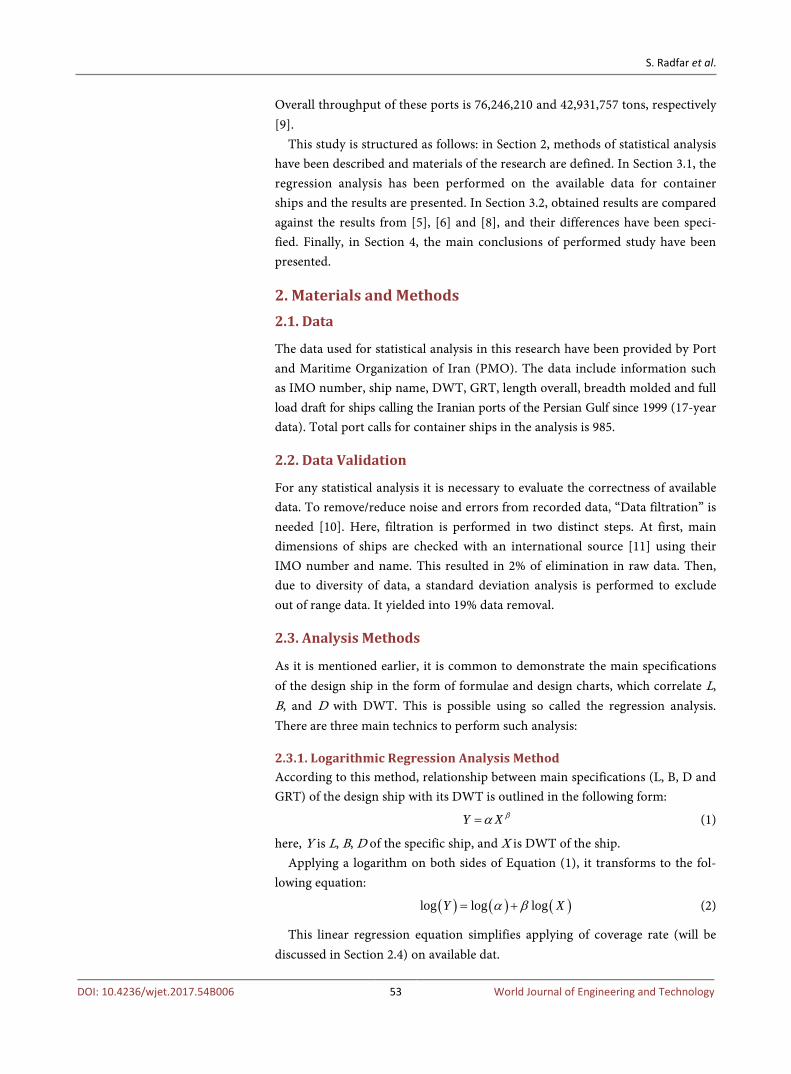
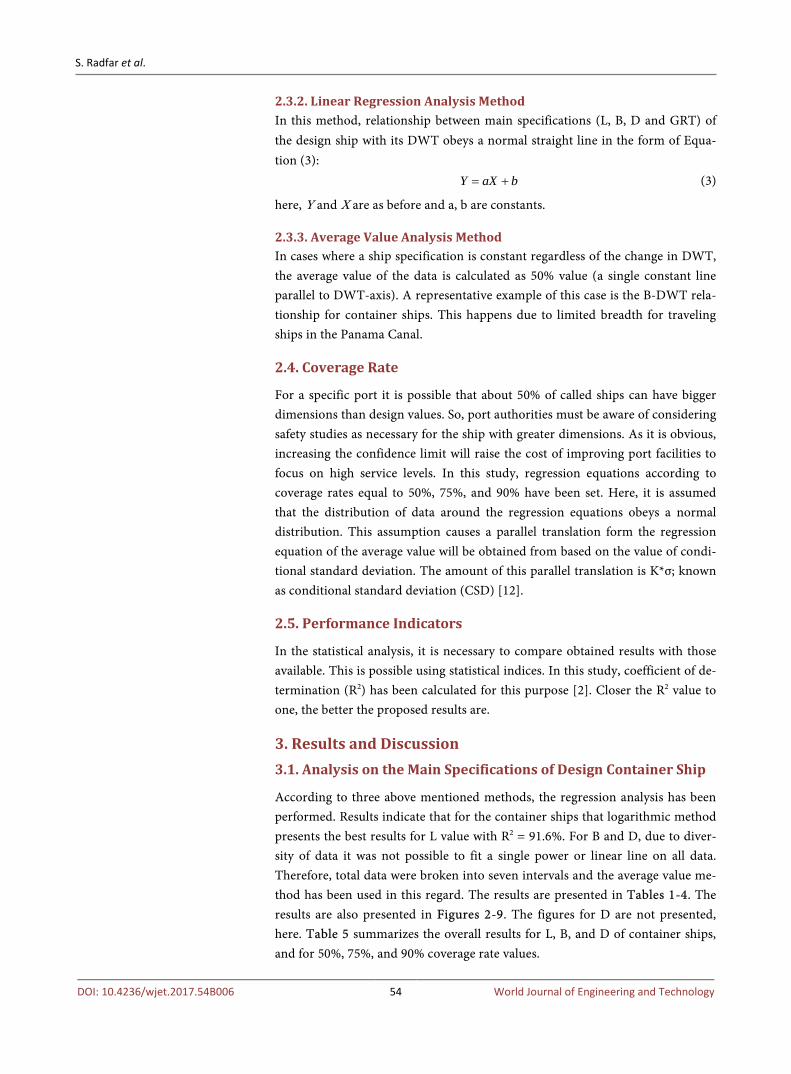
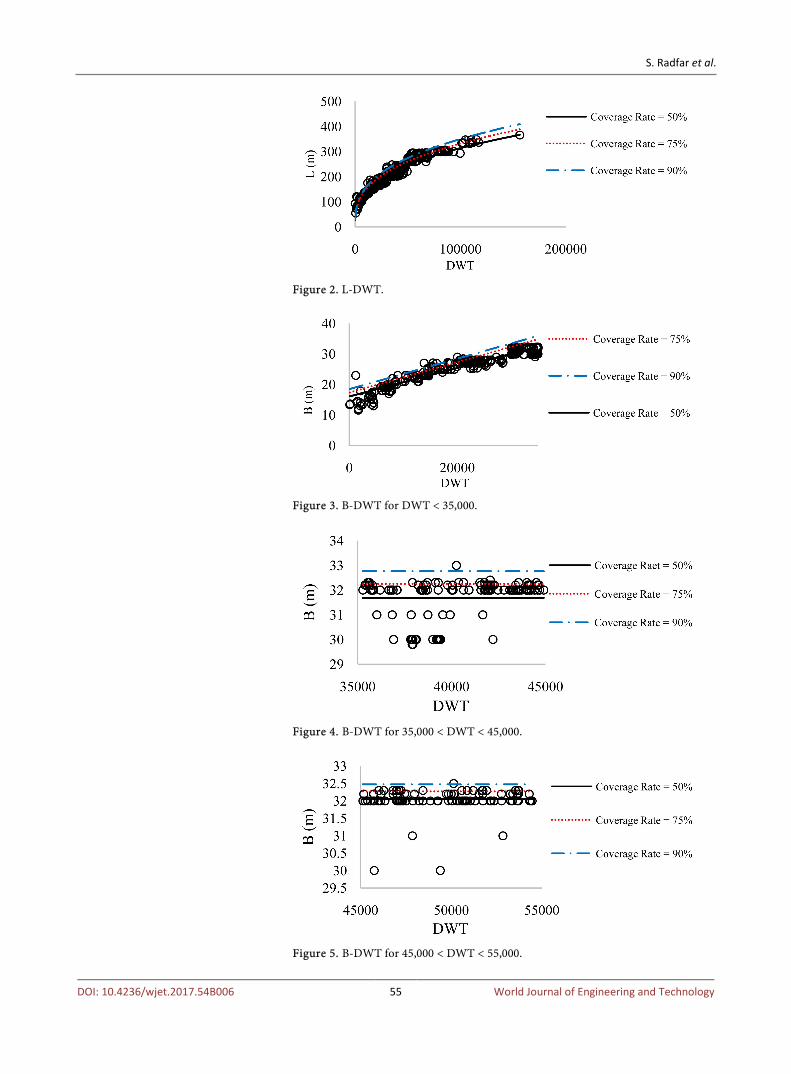
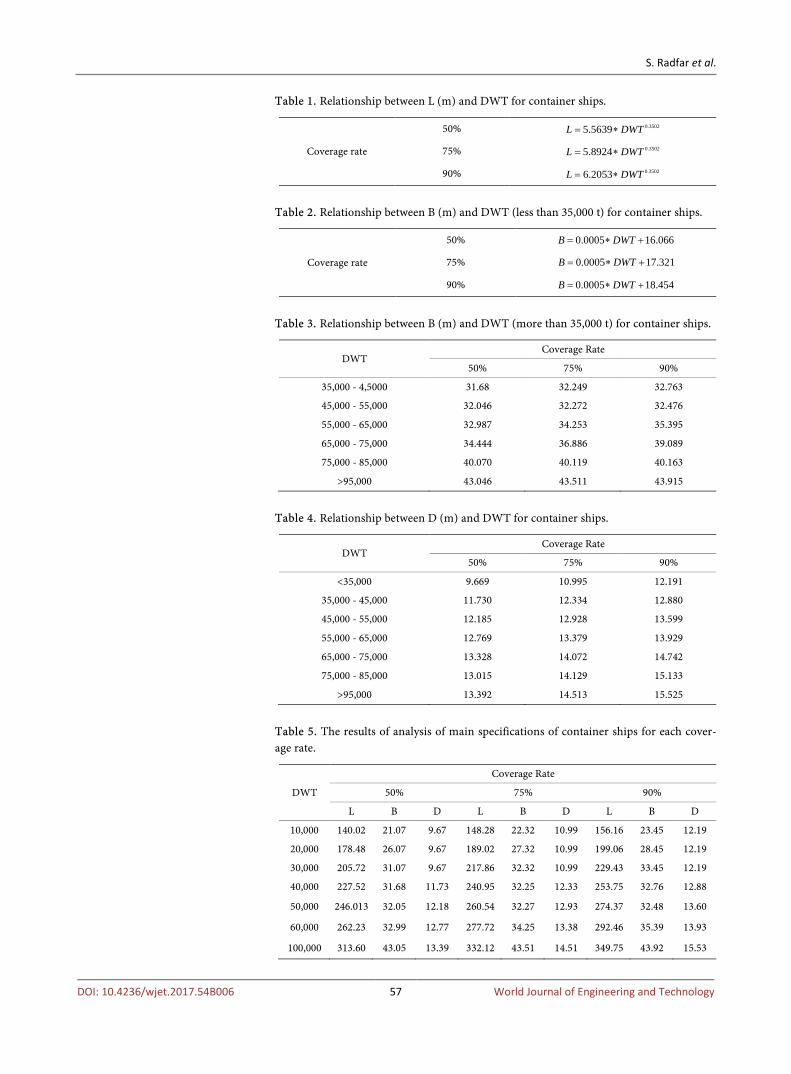
According to three above mentioned methods, the regression analysis has been performed. Results indicate that for the container ships that logarithmic method presents the best results for L value with R2 = 91.6%. For B and D, due to diver-sity of data it was not possible to fit a single power or linear line on all data. Therefore, total data were broken into seven intervals and the average value me-thod has been used in this regard. The results are presented in Tables 1-4. The results are also presented in Figures 2-9. The figures for D are not presented, here. Table 5 summarizes the overall results for L, B, and D of container ships, and for 50%, 75%, and 90% coverage rate values.
S. Radfar et al.
DOI: 10.4236/wjet.2017.54B006 55 World Journal of Engineering and Technology
Figure 2. L-DWT.
Figure 3. B-DWT for DWT < 35,000.
Figure 4. B-DWT for 35,000 < DWT < 45,000.
Figure 5. B-DWT for 45,000 < DWT < 55,000.
S. Radfar et al.
DOI: 10.4236/wjet.2017.54B006 56 World Journal of Engineering and Technology
Figure 6. B-DWT for 55,000 < DWT < 65,000.
Figure 7. B-DWT for 65,000 < DWT < 75,000.
Figure 8. B-DWT for 75,000 < DWT < 85,000.
Figure 9. B-DWT for DWT > 95,000.
S. Radfar et al.
DOI: 10.4236/wjet.2017.54B006 57 World Journal of Engineering and Technology
Table 1. Relationship between L (m) and DWT for container ships.
Coverage rate
50% 0.35025.5639L DWT= ∗
75% 0.35025.8924L DWT= ∗
90% 0.35026.2053L DWT= ∗
Table 2. Relationship between B (m) and DWT (less than 35,000 t) for container ships.
Coverage rate
50% 0.0005 16.066B DWT= ∗ +
75% 0.0005 17.321B DWT= ∗ +
90% 0.0005 18.454B DWT= ∗ +
Table 3. Relationship between B (m) and DWT (more than 35,000 t) for container ships.
DWT Coverage Rate
50% 75% 90%
35,000 - 4,5000 31.68 32.249 32.763
45,000 - 55,000 32.046 32.272 32.476
55,000 - 65,000 32.987 34.253 35.395
65,000 - 75,000 34.444 36.886 39.089
75,000 - 85,000 40.070 40.119 40.163
>95,000 43.046 43.511 43.915
Table 4. Relationship between D (m) and DWT for container ships.
DWT Coverage Rate
50% 75% 90%
<35,000 9.669 10.995 12.191
35,000 - 45,000 11.730 12.334 12.880
45,000 - 55,000 12.185 12.928 13.599
55,000 - 65,000 12.769 13.379 13.929
65,000 - 75,000 13.328 14.072 14.742
75,000 - 85,000 13.015 14.129 15.133
>95,000 13.392 14.513 15.525
Table 5. The results of analysis of main specifications of container ships for each cover-age rate.
DWT
Coverage Rate
50% 75% 90%
L B D L B D L B D
10,000 140.02 21.07 9.67 148.28 22.32 10.99 156.16 23.45 12.19
20,000 178.48 26.07 9.67 189.02 27.32 10.99 199.06 28.45 12.19
30,000 205.72 31.07 9.67 217.86 32.32 10.99 229.43 33.45 12.19
40,000 227.52 31.68 11.73 240.95 32.25 12.33 253.75 32.76 12.88
50,000 246.013 32.05 12.18 260.54 32.27 12.93 274.37 32.48 13.60
60,000 262.23 32.99 12.77 277.72 34.25 13.38 292.46 35.39 13.93
100,000 313.60 43.05 13.39 332.12 43.51 14.51 349.75 43.92 15.53
S. Radfar et al.
DOI: 10.4236/wjet.2017.54B006 58 World Journal of Engineering and Technology
3.2. Comparison with Recommended Values of Guidelines
To assess the new obtained results with corresponding values in guidelines, in this section, the results of statistical analysis are compared against the recom-mendations of three well-known international guidelines such as ROM [5], Jap-anese standard [8], and port designer’s handbook [6] for coverage rate of 75%. It should be noted that underestimation of dimensions increase the risks of ha-zards and overestimation imposes excessive costs on port projects.
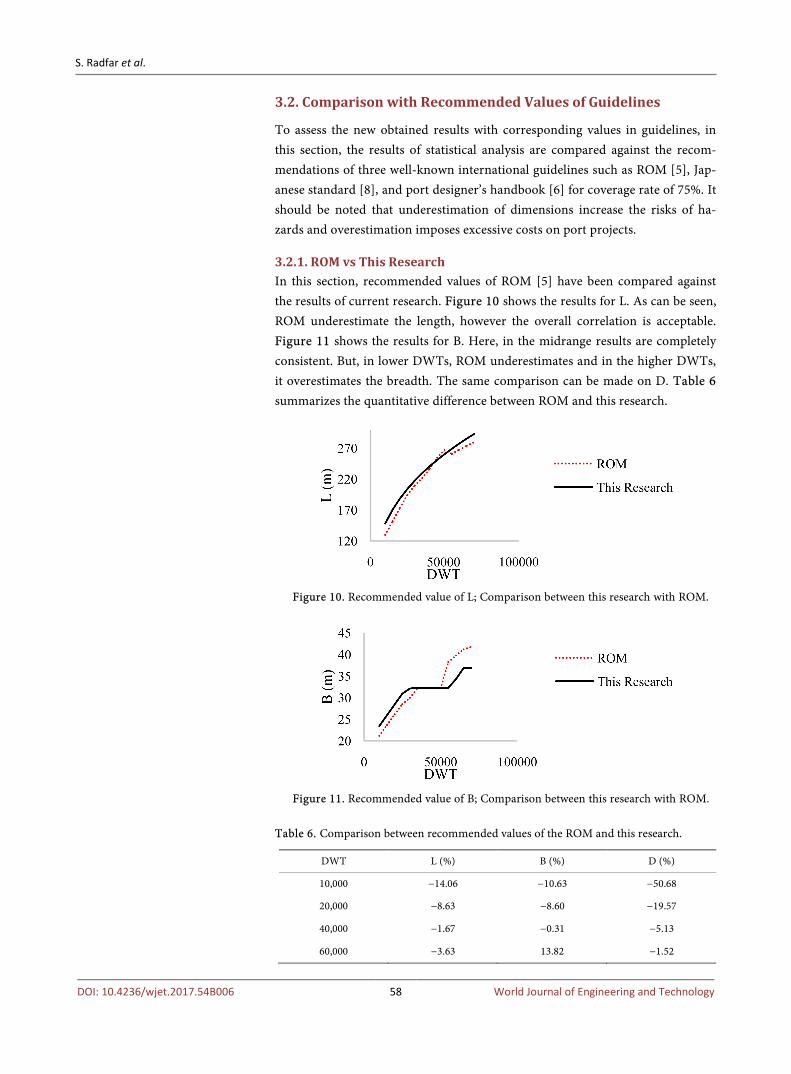
3.2.1. ROM vs This Research In this section, recommended values of ROM [5] have been compared against the results of current research. Figure 10 shows the results for L. As can be seen, ROM underestimate the length, however the overall correlation is acceptable. Figure 11 shows the results for B. Here, in the midrange results are completely consistent. But, in lower DWTs, ROM underestimates and in the higher DWTs, it overestimates the breadth. The same comparison can be made on D. Table 6 summarizes the quantitative difference between ROM and this research.
Figure 10. Recommended value of L; Comparison between this research with ROM.
Figure 11. Recommended value of B; Comparison between this research with ROM.
Table 6. Comparison between recommended values of the ROM and this research.
DWT L (%) B (%) D (%)
10,000 −14.06 −10.63 −50.68
20,000 −8.63 −8.60 −19.57
40,000 −1.67 −0.31 −5.13
60,000 −3.63 13.82 −1.52
S. Radfar et al.
DOI: 10.4236/wjet.2017.54B006 59 World Journal of Engineering and Technology
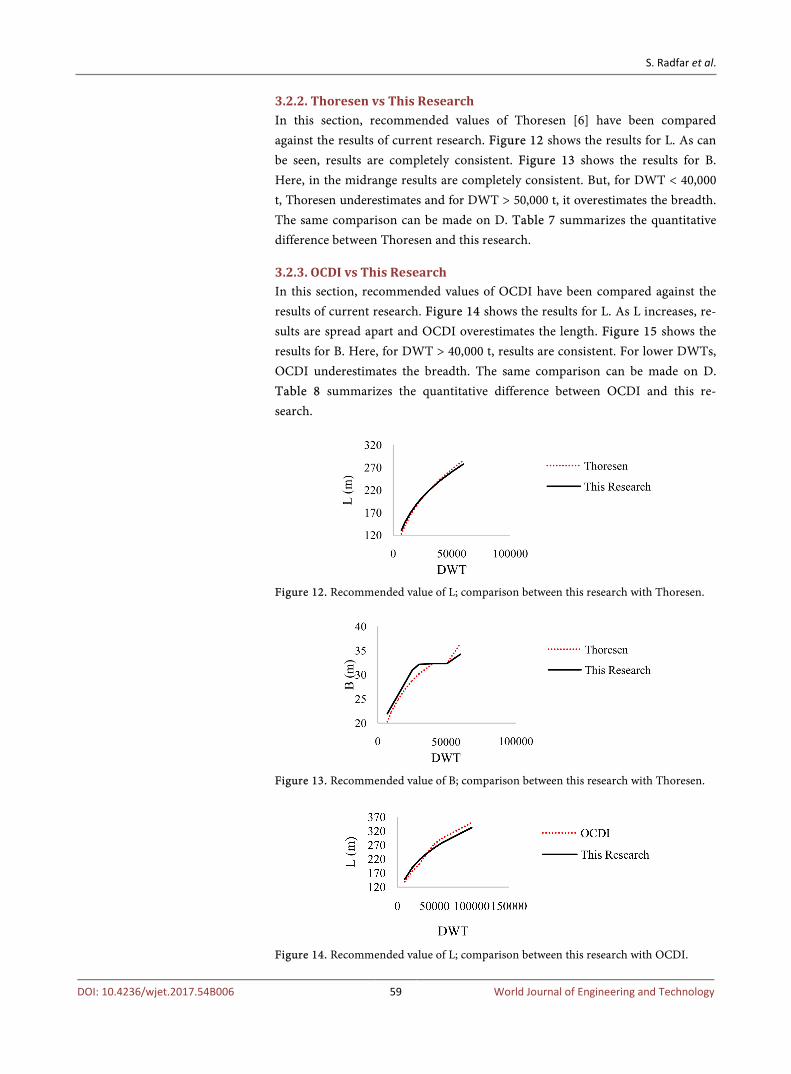
3.2.2. Thoresen vs This Research In this section, recommended values of Thoresen [6] have been compared against the results of current research. Figure 12 shows the results for L. As can be seen, results are completely consistent. Figure 13 shows the results for B. Here, in the midrange results are completely consistent. But, for DWT < 40,000 t, Thoresen underestimates and for DWT > 50,000 t, it overestimates the breadth. The same comparison can be made on D. Table 7 summarizes the quantitative difference between Thoresen and this research.
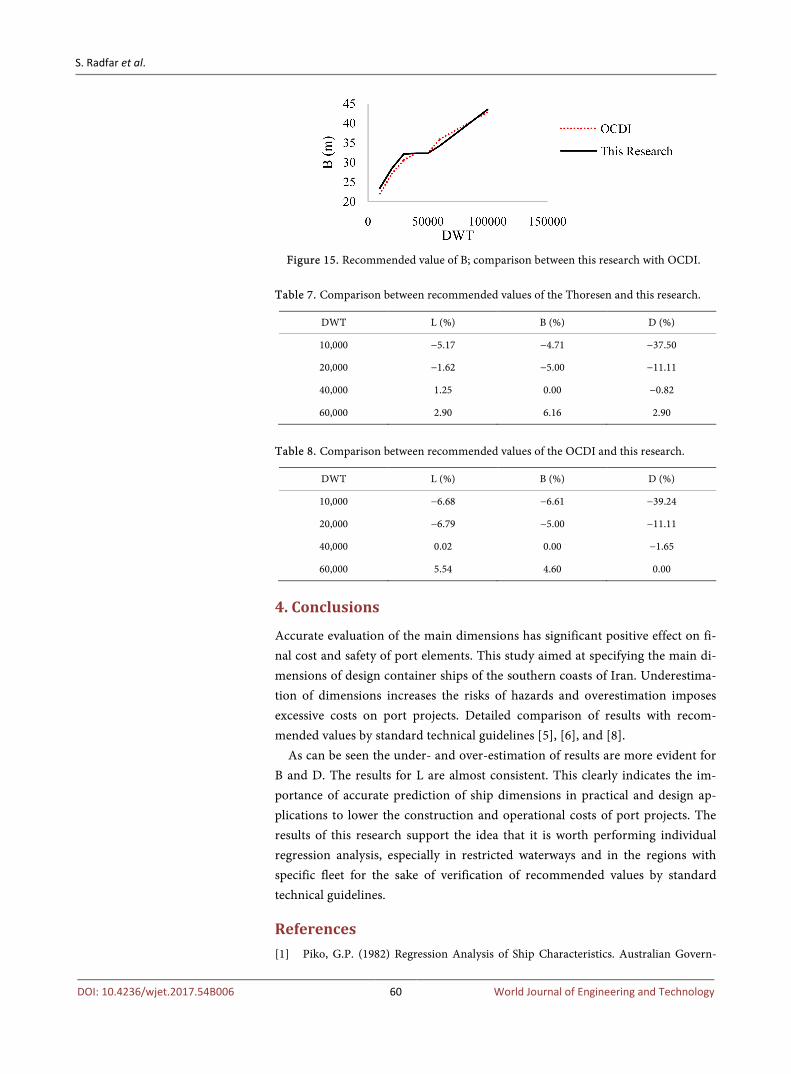
3.2.3. OCDI vs This Research In this section, recommended values of OCDI have been compared against the results of current research. Figure 14 shows the results for L. As L increases, re-sults are spread apart and OCDI overestimates the length. Figure 15 shows the results for B. Here, for DWT > 40,000 t, results are consistent. For lower DWTs, OCDI underestimates the breadth. The same comparison can be made on D. Table 8 summarizes the quantitative difference between OCDI and this re-search.
Figure 12. Recommended value of L; comparison between this research with Thoresen.
Figure 13. Recommended value of B; comparison between this research with Thoresen.
Figure 14. Recommended value of L; comparison between this research with OCDI.
S. Radfar et al.
DOI: 10.4236/wjet.2017.54B006 60 World Journal of Engineering and Technology
Figure 15. Recommended value of B; comparison between this research with OCDI.
Table 7. Comparison between recommended values of the Thoresen and this research.
DWT L (%) B (%) D (%)
10,000 −5.17 −4.71 −37.50
20,000 −1.62 −5.00 −11.11
40,000 1.25 0.00 −0.82
60,000 2.90 6.16 2.90
Table 8. Comparison between recommended values of the OCDI and this research.
DWT L (%) B (%) D (%)
10,000 −6.68 −6.61 −39.24
20,000 −6.79 −5.00 −11.11
40,000 0.02 0.00 −1.65
60,000 5.54 4.60 0.00
4. Conclusions
Accurate evaluation of the main dimensions has significant positive effect on fi-nal cost and safety of port elements. This study aimed at specifying the main di-mensions of design container ships of the southern coasts of Iran. Underestima-tion of dimensions increases the risks of hazards and overestimation imposes excessive costs on port projects. Detailed comparison of results with recom-mended values by standard technical guidelines [5], [6], and [8].
As can be seen the under- and over-estimation of results are more evident for B and D. The results for L are almost consistent. This clearly indicates the im-portance of accurate prediction of ship dimensions in practical and design ap-plications to lower the construction and operational costs of port projects. The results of this research support the idea that it is worth performing individual regression analysis, especially in restricted waterways and in the regions with specific fleet for the sake of verification of recommended values by standard technical guidelines.
References [1] Piko, G.P. (1982) Regression Analysis of Ship Characteristics. Australian Govern-
S. Radfar et al.
DOI: 10.4236/wjet.2017.54B006 61 World Journal of Engineering and Technology
ment Publishing Service, Australia.
[2] Takahashi, H., Goto, A. and Abe, M. (2006) Study on Standards for Main Dimen-sions of the Design Ship. Technical Note of National Institute for Land and Infra-structure Management, Japan.
[3] Takahashi, H. and Goto, A. (2007) Study on Ship Height by Statistical Analysis. Report of National Institute for Land and Infrastructure Management, Japan.
[4] OCDI (2009) Technical Standards and Commentaries for Port and Harbour Facili-ties in Japan. OCDI, Japan.
[5] Del Estado, P. (1999) Recommendations for Maritime Works (Spain) ROM 3.1-99. Designing Maritime Configuration of Ports. Approach Channels and Floatation Areas, Spain.
[6] Thoresen, C.A. (2014) Port Designer’s Handbook. 3rd Edition, ICE Publishing.
[7] Akakura, Y. and Takahashi, H. (1998) Ship Dimensions of Design Ship under Given Confidence Limits. Technical Note of the Port and Harbour Research Institute, Ministry of Transport, Japan.
[8] Thoresen, C.A. (2003) Port Designer’s Handbook: Recommendations and Guide-lines. Thomas Telford. https://doi.org/10.1680/pdhrag.32286
[9] PMO (2016) System Operations Statistics year 2016. Ports and Maritime Organiza-tion of Iran.
[10] IGI-Global (2017) What Is Data Filtering. http://www.igi-global.com/dictionary/data-filtering/34068
[11] MarineTraffic Ship Database. http://www.marinetraffic.com
[12] Montgomery, J. (2016) Marginal and Conditional Standard Deviation. http://pageswustledu/montgomery/articles/3152