Embed Size (px)
Citation preview

1
Standardized catch rates of Atlantic sharpnose sharks (Rhizoprionodon terraenovae) in the U.S. Gulf of Mexico from
the Shark Bottom Longline Observer Program, 1994-2011
John Carlson and Simon Gulak
SEDAR34-WP-01
Submitted: 6 May 2013 Updated: 8 July 2013
This information is distributed solely for the purpose of pre-dissemination peer review. It does not represent and should not be construed to represent any agency determination or policy.
2
Please cite this document as: Carlson, J. and S. Gulak. 2013. Standardized catch rates of Atlantic sharpnose sharks (Rhizoprionodon terraenovae) in the U.S. Gulf of Mexico from the Shark Bottom Longline Observer Program, 1994-2011SEDAR34-WP-01. SEDAR, North Charleston, SC. 22 pp.

3
Standardized catch rates of Atlantic sharpnose sharks (Rhizoprionodon terraenovae) in the U.S. Gulf of Mexico from the Shark Bottom Longline Observer Program, 1994-2011 John Carlson and Simon Gulak NOAA Fisheries Service Southeast Fisheries Science Center 3500 Delwood Beach Drive Panama City, FL 32408 USA SEDAR 34-WP-01
4
Abstract Catch rate series were developed for Atlantic sharpnose shark from the data collected by on-boards observers in the shark bottom longline fishery for the period 1994-2011. Data were subjected to a Generalized Linear Model (GLM) standardization technique that treats separately the proportion of sets with positive catches (i.e., where at least one shark was caught) assuming a binomial error distribution with a logit link function, and the catch rates of sets with positive catches assuming a lognormal error distribution with a log link function. Year and bait type were significant as a main effects in the binomial model and year, bait type, area and time of day were significant in the lognormal model. Outside a peak in 2000, the relative abundance index showed a general flat trend in abundance. Introduction Observations by at-sea observers of the shark-directed bottom longline fishery in the Atlantic Ocean and Gulf of Mexico have been conducted since 1994 (e.g. Hale and Carlson, 2007, Hale et al., 2007, Morgan et al. 2009, Hale et al., 2009, Hale et al. 2010, Hale et al. 2011, and Hale et al. 2012). Currently 208 U.S. fishers are permitted to target sharks (excluding dogfish) in the Atlantic Ocean and Gulf of Mexico, and an additional 253 fishers are permitted to land sharks incidentally. Amendments to the Consolidated Atlantic Highly Migratory Species Fishery Management Plan based on stock assessments have eliminated the major directed shark fishery in the U.S. Atlantic (NMFS 2007). These amendments implemented a shark research fishery, which allows NMFS to select a limited number of commercial shark vessels on an annual basis to collect life history data and catch data for future stock assessments. Since 2008, only commercial shark fishers participating in the shark research fishery are allowed to land sandbar sharks, Carcharhinus plumbeus, and must carry an observer on 100% of all trips (compared to a coverage level of 4-6% outside the research fishery). Outside the research fishery, fishers are permitted to land 33 non-sandbar large coastal sharks (including blacktip shark, Carcharhinus limbatus, bull shark, Carcharhinus leucas, lemon shark, Negaprion brevirostris, nurse shark, Ginglymostoma cirratum, silky shark, Carcharhinus falciformis, spinner shark, Carcharhinus brevipinna, tiger shark, Galeocerdo cuvier, great hammerhead shark, Sphyrna mokarran, and scalloped hammerhead shark, Sphyrna lewini). Methods Catch rate analysis A combined data set was developed based on observer programs from Morgan et al. (2009) and Hale et al. (2012). With the introduction of the shark research fishery, some vessels were not subjected to random selection. whereas others outside the research fishery were not permitted to land sandbar sharks. Because of this switch, a factor (research fishery) was added to account for the differences in target and harvest of sharks. Catch rates were standardized in a two-part generalized linear model analysis using the PROC GENMOD procedure in SAS (SAS Inst., Inc.). For the purposes of analysis, several categorical variables were constructed:

5
● “Year” 1994-2011 ● “Time of Day”: the time of day the set started defined from the time the first hook was set in the water Day = 0501-1800 hrs Night = 1801-0500 hrs ●“Season”
Winter = January-March Spring = April-June Summer = July-September Fall = October-December
●“Depth”: defined as the mean depth when the first hook was set and the last hook was retrieved
0-100 ft 100-200 ft 200-300 ft >300 ft
●“Hook type”: the hook that was used by the majority of the set
Large hook (> size 13 hook) Medium hook (size 10-13 hook) Small hook (< size 10 hook) Hook size undefined
●“Bait type”: the bait that was used by the majority of the set
Shark or ray (Elasmobranchii) Herring (Clupeidae) or mullet (Mugilidae) Tuna or mackeral (Scombridae) Other teleosts (non-Clupeidae, Mugilidae or Scombridae) Other (undefined or multiple bait types)
● Research
Yes (a set conducted under the shark research fishery) No (a set not conducted under the shark research fishery)
● Hooktimer
Yes (a set was conducted with hooktimers) No (a set was conducted without hooktimers)
The proportion of sets that caught sharks (when at least one shark was caught) was modeled assuming a binomial distribution with a logit link function. Positive catches were modeled using
6
a dependent variable of the natural logarithm of CPUE expressed as the natural logarithm of the number of sharks caught per 10,000 hooks
CPUE = log [(sharks kept+sharks released/10,000 hooks)] A null model was run with no factors entered into the model. Models were then fit in a stepwise-forward manner adding one independent variable. Each factor was ranked from greatest to least reduction in deviance per degree of freedom when compared to the null model. The factor with the greatest reduction in deviance was then incorporated into the model provided the effect was significant at p<0.05 based on a Chi-Square test, and the deviance per degree of freedom was reduced by at least 1% from the less complex model. The process was continued until no factors met the criterion for incorporation into the final model. Regardless of its level of significance, year was kept in all final models. After selecting the set of fixed factors and interactions for each error distribution, all interactions that included the factor year were treated as random interactions (Ortiz and Arocha, 2004). This process converted the basic models from generalized linear models into generalized linear mixed models. The final model determination was evaluated using the Akaike Information Criteria (AIC), and Schwarz’s Bayesian Criterion (BIC). Models with smaller AIC and BIC values are preferred to those with larger values. These models were fit using a SAS macro, GLIMMIX (glmm800MaOB.sas: Russ Wolfinger, SAS Institute Inc.) and the MIXED procedure in SAS statistical computer software (PROC GLIMMIX). Relative indices of abundance were calculated as the product of the year effect least square means from the two independent models. Size Information Length information for sharks obtained from the Longline Observer Program was analyzed using regression analysis to examine trends in size with time (year). Results and Discussion All Areas The final bottom longline dataset analyzed contained 2119 sets (Figure 1). Of those sets, Atlantic sharpnose sharks were reported caught on 54.2% of sets. The stepwise construction of the model is summarized in Table 1 and the index statistics can be found in Table 2. Table 3 provides a table of the frequency of observations by factor and level. The standardized abundance index is shown in Figure 2 and the diagnostic plots assessing the fit of the models were deemed acceptable (Figure 3). The length distribution (cm FL) of sharks caught by year and sex is shown in Figure 4 and average length by year is in Table 4.

7
Table 1. Analysis of deviance of explanatory variables for the binomial and lognormal generalized linear and mixed model formulations of the proportion of positive and positive catches for Atlantic sharpnose sharks (all areas). Final models selected are in bold. Proportion positive-Binomial error distribution FACTOR DEVIANCE/DF %DIFF DELTA% CHISQUARE PR>CHI NULL 1.398 YEAR 1.358 2.855 2.855 104.08 <.0001 YEAR+ BAIT 1.337 4.350 1.495 47.32 <.0001 HOOKTYPE 1.347 3.649 26.26 <.0001 SEASON 1.348 3.556 23.72 <.0001 DEPTH 1.351 3.363 18.25 0.0004 TIME 1.351 3.363 15.63 <.0001 HOOKTIMER 1.355 3.062 7.2 0.0073 SRF 1.355 3.041 6.53 0.0106 AREA 4.23 0.0398 YEAR+BAIT+ SEASON 1.326 5.094 0.744 24.78 <.0001 DEPTH 1.327 5.087 24.68 <.0001 HOOKTYPE 1.328 4.951 20.94 0.0001 AREA 1.329 4.916 17.25 <.0001 TIME 1.332 4.730 12.07 0.0005 SRF 1.333 4.629 9.08 0.0026 HOOKTIMER 1.334 4.586 7.95 0.0048 FINAL MODEL AIC YEAR+BAIT 197.3 YEAR+BAIT YEAR*BAIT 199.6 Proportion positive-Lognormal error distribution
FACTOR DEVIANCE/DF %DIFF DELTA% CHISQUARE PR>CHI NULL 2.170 YEAR 2.000 7.822 7.822 110.82 <.0001 YEAR+ BAIT 1.815 16.354 8.532 115.74 <.0001 TIME 1.893 12.736 64.02 <.0001 DEPTH 1.955 9.873 28.95 <.0001 HOOKTYPE 1.969 9.246 20.95 0.0001 AREA 1.974 9.025 16.11 <.0001 SEASON 1.992 8.205 7.86 0.049 HOOKTIMER 1.993 8.126 4.8 0.0284 SRF 1.997 7.960 2.73 0.0983 YEAR+BAIT+ AREA 1.741 19.756 3.402 48.76 <.0001
8
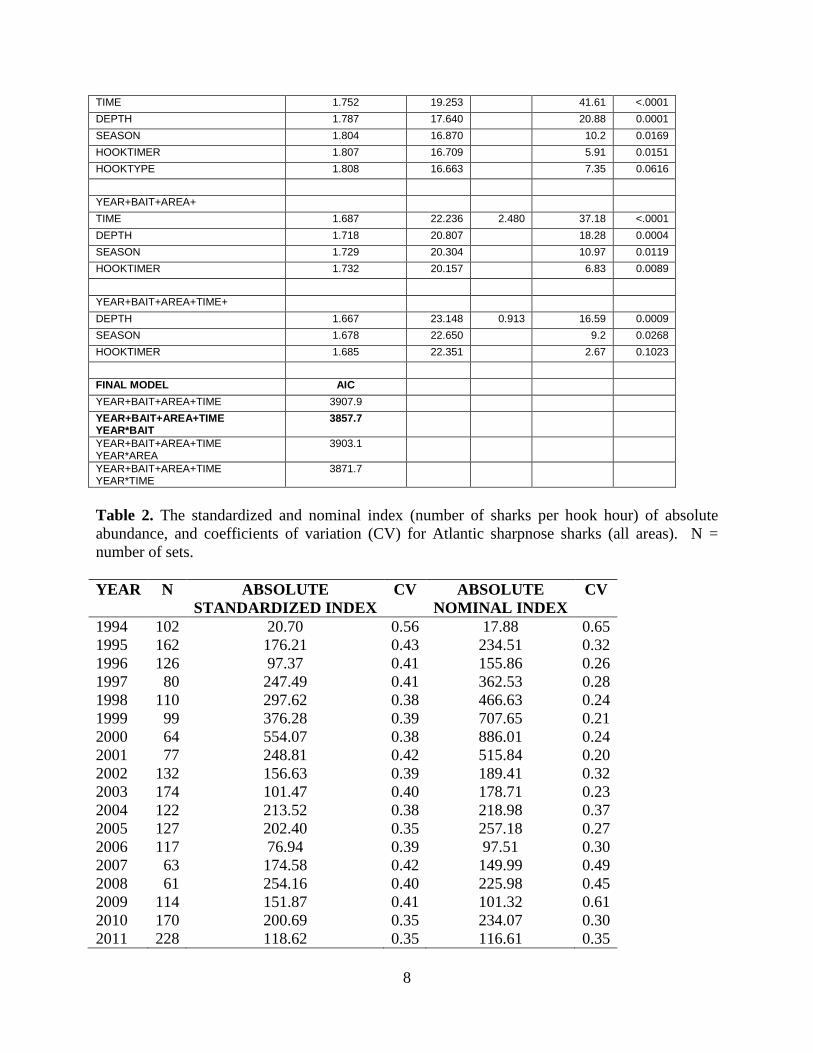
TIME 1.752 19.253 41.61 <.0001 DEPTH 1.787 17.640 20.88 0.0001 SEASON 1.804 16.870 10.2 0.0169 HOOKTIMER 1.807 16.709 5.91 0.0151 HOOKTYPE 1.808 16.663 7.35 0.0616 YEAR+BAIT+AREA+ TIME 1.687 22.236 2.480 37.18 <.0001 DEPTH 1.718 20.807 18.28 0.0004 SEASON 1.729 20.304 10.97 0.0119 HOOKTIMER 1.732 20.157 6.83 0.0089
YEAR+BAIT+AREA+TIME+ DEPTH 1.667 23.148 0.913 16.59 0.0009 SEASON 1.678 22.650 9.2 0.0268 HOOKTIMER 1.685 22.351 2.67 0.1023 FINAL MODEL AIC YEAR+BAIT+AREA+TIME 3907.9 YEAR+BAIT+AREA+TIME YEAR*BAIT
3857.7
YEAR+BAIT+AREA+TIME YEAR*AREA
3903.1
YEAR+BAIT+AREA+TIME YEAR*TIME
3871.7
Table 2. The standardized and nominal index (number of sharks per hook hour) of absolute abundance, and coefficients of variation (CV) for Atlantic sharpnose sharks (all areas). N = number of sets. YEAR N ABSOLUTE
STANDARDIZED INDEX CV ABSOLUTE
NOMINAL INDEX CV
1994 102 20.70 0.56 17.88 0.65 1995 162 176.21 0.43 234.51 0.32 1996 126 97.37 0.41 155.86 0.26 1997 80 247.49 0.41 362.53 0.28 1998 110 297.62 0.38 466.63 0.24 1999 99 376.28 0.39 707.65 0.21 2000 64 554.07 0.38 886.01 0.24 2001 77 248.81 0.42 515.84 0.20 2002 132 156.63 0.39 189.41 0.32 2003 174 101.47 0.40 178.71 0.23 2004 122 213.52 0.38 218.98 0.37 2005 127 202.40 0.35 257.18 0.27 2006 117 76.94 0.39 97.51 0.30 2007 63 174.58 0.42 149.99 0.49 2008 61 254.16 0.40 225.98 0.45 2009 114 151.87 0.41 101.32 0.61 2010 170 200.69 0.35 234.07 0.30 2011 228 118.62 0.35 116.61 0.35

9
Table 3. Frequency of observations by factor and level used in the development of the standardized catch rate series.
FACTOR LEVEL FREQUENCY OF TOTAL
Year 1994 4.8 1995 7.6 1996 5.9 1997 3.8 1998 5.2 1999 4.7 2000 3.0 2001 3.6 2002 6.2 2003 8.2 2004 5.7 2005 6.0 2006 5.5 2007 3.0 2008 2.9 2009 5.4 2010 8.0 2011 10.7 Research Fishery Yes 25.1 No 74.9 Area Atlantic 56.9 Gulf of Mexico 43.1 Season Fall 7.8 Spring 12.0 Summer 41.8 Winter 38.4 Time of Day Day 31.3 Night 68.7 Hook Type Large 63.5 Medium 6.5 Other 27.2 Small 2.7 Bait type Clupeids+Mugilids 3.9 Elasmobranchs 20.8 Other 43.7 Other Teleosts 13.8 Scombrids 17.8 Set Depth 0-100 58.7 100-200 25.6 200-300 9.9 300> 5.7 Hooktimer Yes 5.1 No 94.9
10
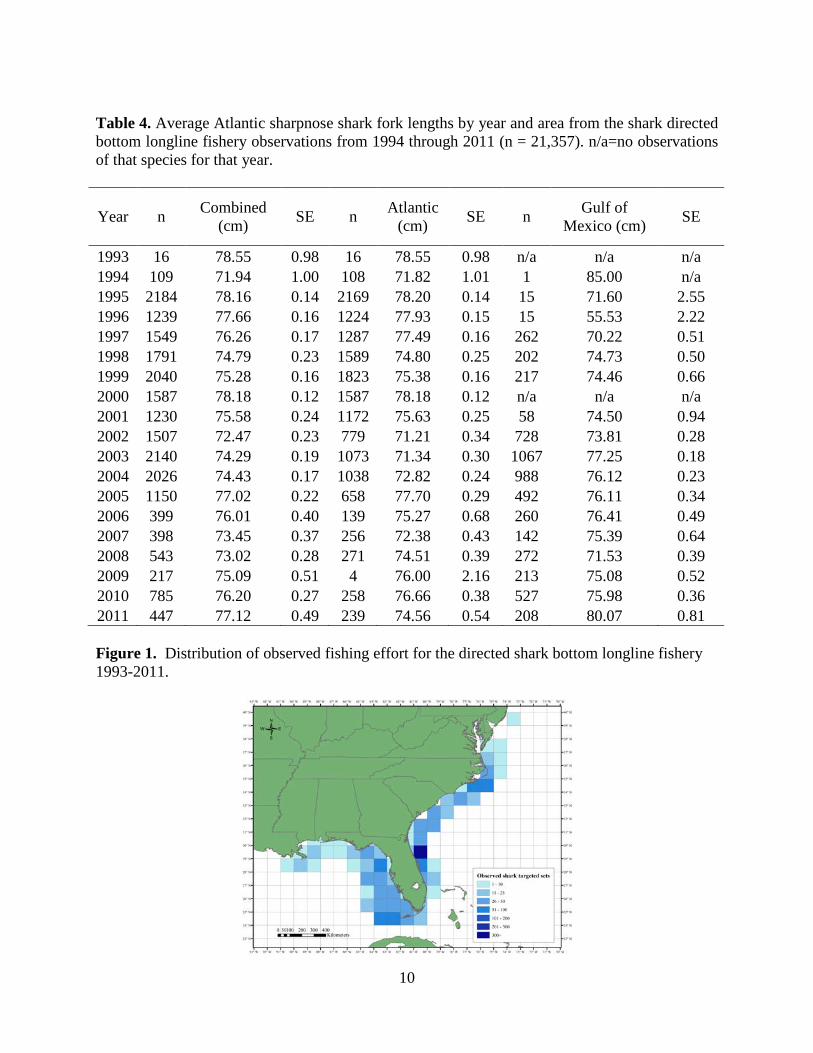
Table 4. Average Atlantic sharpnose shark fork lengths by year and area from the shark directed bottom longline fishery observations from 1994 through 2011 (n = 21,357). n/a=no observations of that species for that year.
Year n Combined (cm) SE n Atlantic
(cm) SE n Gulf of Mexico (cm) SE
1993 16 78.55 0.98 16 78.55 0.98 n/a n/a n/a 1994 109 71.94 1.00 108 71.82 1.01 1 85.00 n/a 1995 2184 78.16 0.14 2169 78.20 0.14 15 71.60 2.55 1996 1239 77.66 0.16 1224 77.93 0.15 15 55.53 2.22 1997 1549 76.26 0.17 1287 77.49 0.16 262 70.22 0.51 1998 1791 74.79 0.23 1589 74.80 0.25 202 74.73 0.50 1999 2040 75.28 0.16 1823 75.38 0.16 217 74.46 0.66 2000 1587 78.18 0.12 1587 78.18 0.12 n/a n/a n/a 2001 1230 75.58 0.24 1172 75.63 0.25 58 74.50 0.94 2002 1507 72.47 0.23 779 71.21 0.34 728 73.81 0.28 2003 2140 74.29 0.19 1073 71.34 0.30 1067 77.25 0.18 2004 2026 74.43 0.17 1038 72.82 0.24 988 76.12 0.23 2005 1150 77.02 0.22 658 77.70 0.29 492 76.11 0.34 2006 399 76.01 0.40 139 75.27 0.68 260 76.41 0.49 2007 398 73.45 0.37 256 72.38 0.43 142 75.39 0.64 2008 543 73.02 0.28 271 74.51 0.39 272 71.53 0.39 2009 217 75.09 0.51 4 76.00 2.16 213 75.08 0.52 2010 785 76.20 0.27 258 76.66 0.38 527 75.98 0.36 2011 447 77.12 0.49 239 74.56 0.54 208 80.07 0.81 Figure 1. Distribution of observed fishing effort for the directed shark bottom longline fishery 1993-2011.
11
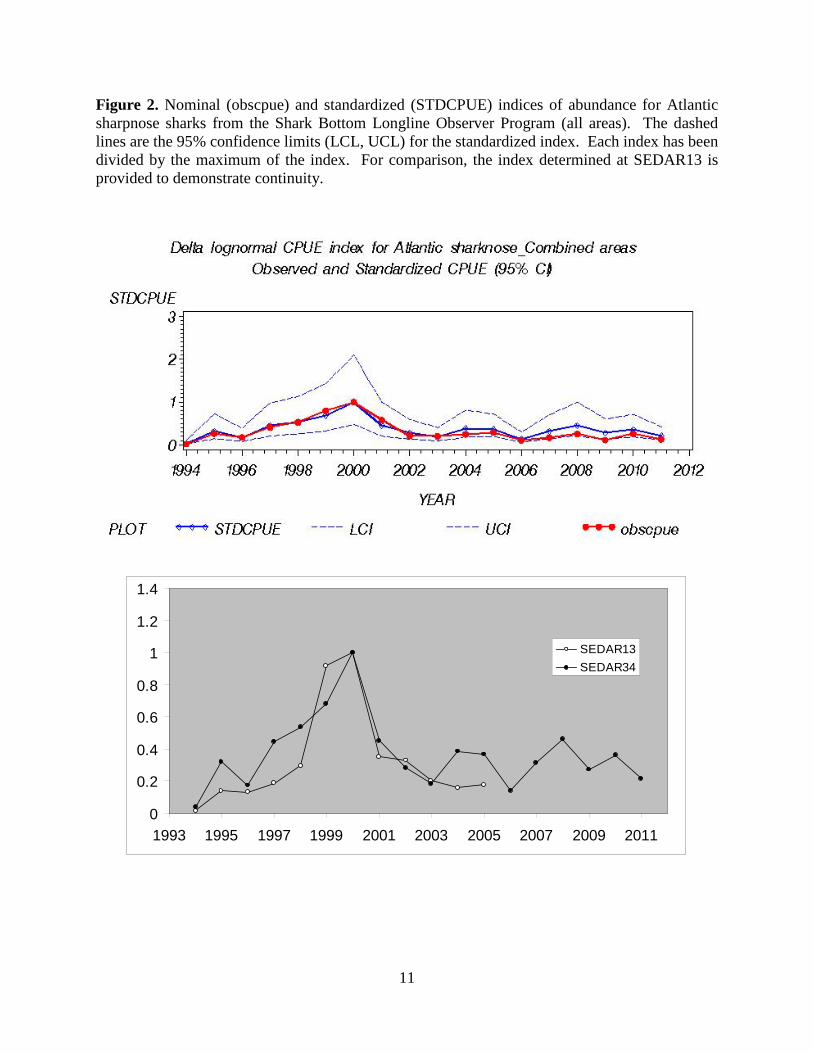
Figure 2. Nominal (obscpue) and standardized (STDCPUE) indices of abundance for Atlantic sharpnose sharks from the Shark Bottom Longline Observer Program (all areas). The dashed lines are the 95% confidence limits (LCL, UCL) for the standardized index. Each index has been divided by the maximum of the index. For comparison, the index determined at SEDAR13 is provided to demonstrate continuity.
0
0.2
0.4
0.6
0.8
1
1.2
1.4
1993 1995 1997 1999 2001 2003 2005 2007 2009 2011
SEDAR13SEDAR34
12
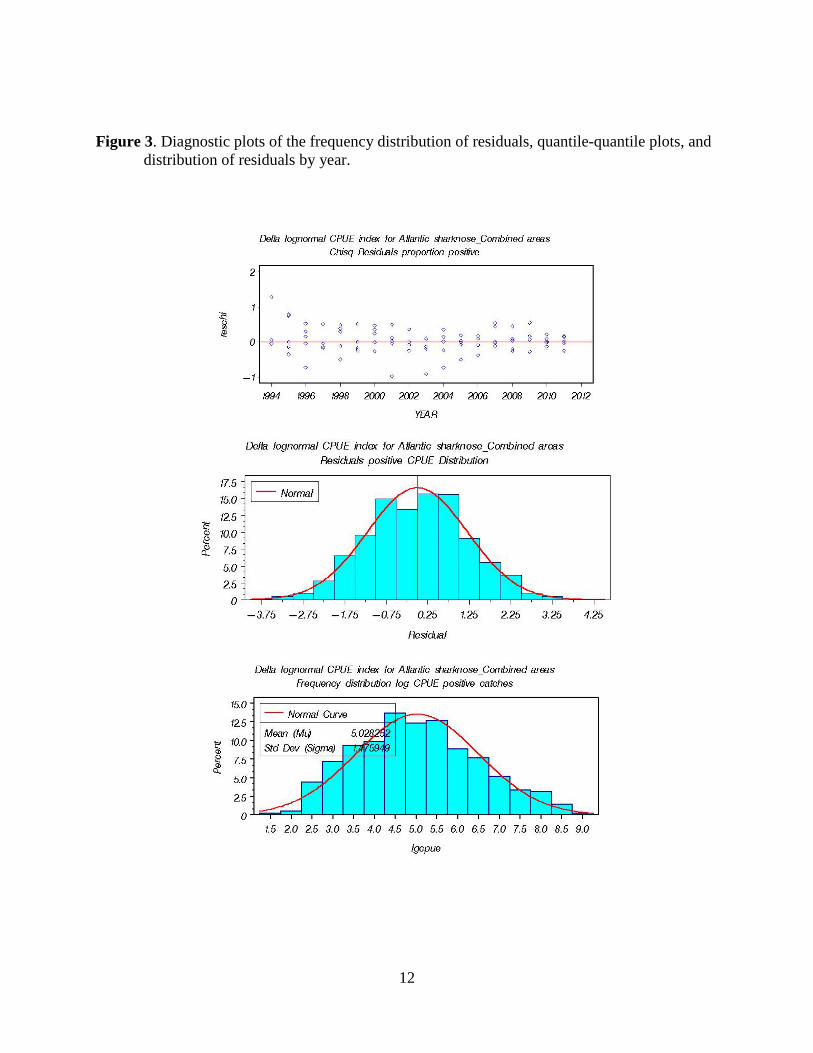
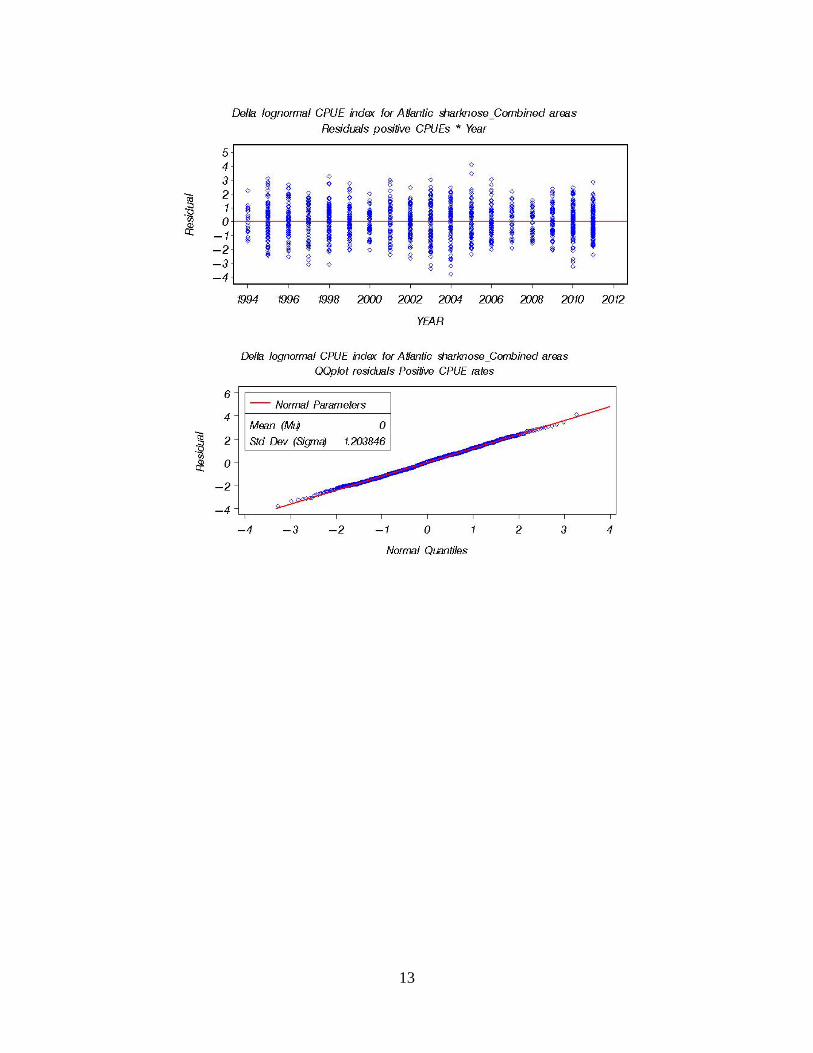
Figure 3. Diagnostic plots of the frequency distribution of residuals, quantile-quantile plots, and
distribution of residuals by year.
13

14
Figure 4. Observed fork lengths (FL) for all Atlantic sharpnose sharks captured by year for a)
South Atlantic (n=15,690), b) Gulf of Mexico (n=5,667), and c) both areas combined (n=21,357)
a)
b)
c)
15
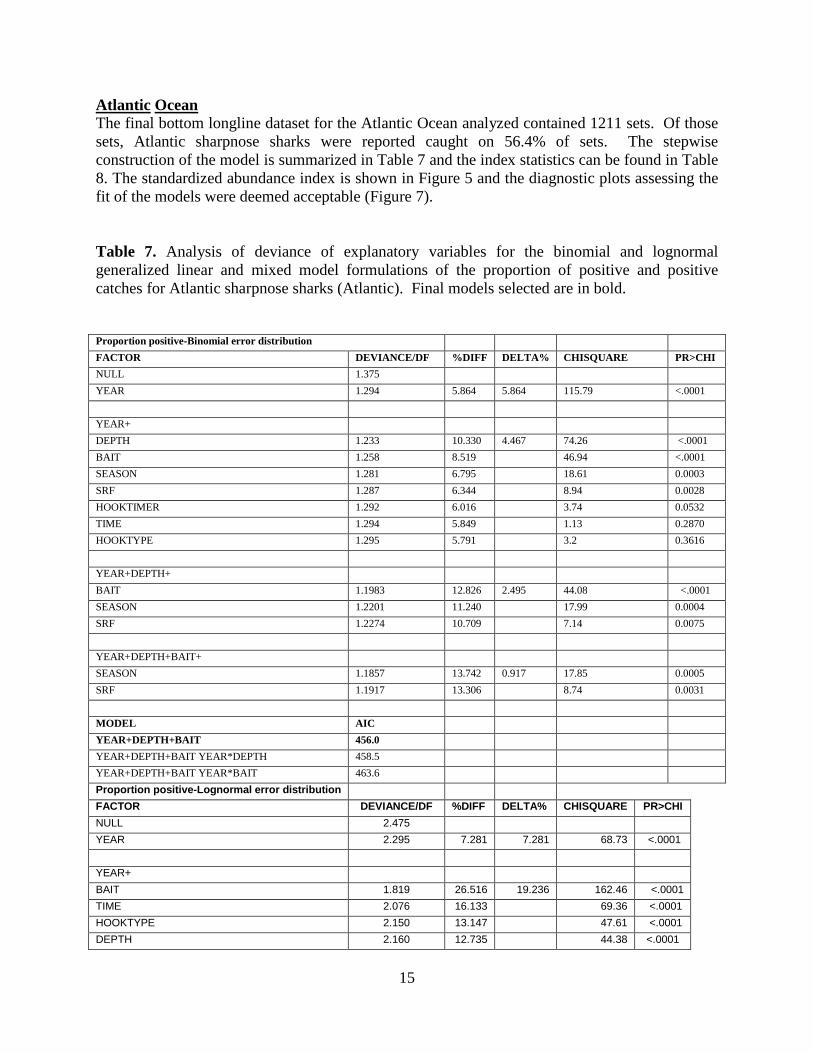
Atlantic Ocean The final bottom longline dataset for the Atlantic Ocean analyzed contained 1211 sets. Of those sets, Atlantic sharpnose sharks were reported caught on 56.4% of sets. The stepwise construction of the model is summarized in Table 7 and the index statistics can be found in Table 8. The standardized abundance index is shown in Figure 5 and the diagnostic plots assessing the fit of the models were deemed acceptable (Figure 7). Table 7. Analysis of deviance of explanatory variables for the binomial and lognormal generalized linear and mixed model formulations of the proportion of positive and positive catches for Atlantic sharpnose sharks (Atlantic). Final models selected are in bold. Proportion positive-Binomial error distribution FACTOR DEVIANCE/DF %DIFF DELTA% CHISQUARE PR>CHI NULL 1.375 YEAR 1.294 5.864 5.864 115.79 <.0001 YEAR+ DEPTH 1.233 10.330 4.467 74.26 <.0001 BAIT 1.258 8.519 46.94 <.0001 SEASON 1.281 6.795 18.61 0.0003 SRF 1.287 6.344 8.94 0.0028 HOOKTIMER 1.292 6.016 3.74 0.0532 TIME 1.294 5.849 1.13 0.2870 HOOKTYPE 1.295 5.791 3.2 0.3616 YEAR+DEPTH+ BAIT 1.1983 12.826 2.495 44.08 <.0001 SEASON 1.2201 11.240 17.99 0.0004 SRF 1.2274 10.709 7.14 0.0075 YEAR+DEPTH+BAIT+ SEASON 1.1857 13.742 0.917 17.85 0.0005 SRF 1.1917 13.306 8.74 0.0031 MODEL AIC YEAR+DEPTH+BAIT 456.0 YEAR+DEPTH+BAIT YEAR*DEPTH 458.5 YEAR+DEPTH+BAIT YEAR*BAIT 463.6 Proportion positive-Lognormal error distribution FACTOR DEVIANCE/DF %DIFF DELTA% CHISQUARE PR>CHI NULL 2.475 YEAR 2.295 7.281 7.281 68.73 <.0001 YEAR+ BAIT 1.819 26.516 19.236 162.46 <.0001 TIME 2.076 16.133 69.36 <.0001 HOOKTYPE 2.150 13.147 47.61 <.0001 DEPTH 2.160 12.735 44.38 <.0001
16
SRF 2.296 7.228 0.63 0.4271 HOOKTIMER 2.298 7.163 0.18 0.6713 SEASON 2.300 7.083 1.63 0.6534 YEAR+BAIT+ TIME 1.7328 29.991 3.475 34.04 <.0001 DEPTH 1.7486 29.352 29.93 <.0001 HOOKTYPE 1.7796 28.100 17.95 0.0005 YEAR+BAIT+TIME+ DEPTH 1.6861 31.877 1.887 21.71 <.0001 HOOKTYPE 1.6959 31.482 17.76 0.0005 MODEL AIC YEAR+BAIT+TIME+DEPTH 2308.6 YEAR+BAIT+TIME+DEPTH YEAR*BAIT 2295.3 YEAR+BAIT+TIME+DEPTH YEAR*TIME 2293.3 YEAR+BAIT+TIME+DEPTH YEAR*DEPTH 2308.4
Table 8. The standardized and nominal index (number of sharks per hook hour) of absolute abundance, and coefficients of variation (CV) for Atlantic sharpnose sharks (Atlantic). N = number of sets. YEAR N ABSOLUTE
STANDARDIZED INDEX CV ABSOLUTE
NOMINAL INDEX CV
1994 55 55.89 0.36 33.00 0.61 1995 109 199.43 0.20 346.94 0.12 1996 86 178.08 0.21 225.70 0.16 1997 54 215.22 0.28 419.46 0.14 1998 72 415.10 0.20 650.46 0.13 1999 68 379.49 0.24 961.30 0.09 2000 64 600.22 0.23 886.01 0.16 2001 54 352.50 0.23 712.37 0.12 2002 68 365.00 0.23 288.28 0.29 2003 93 218.39 0.24 184.47 0.28 2004 52 277.85 0.30 253.33 0.33 2005 52 435.15 0.23 205.14 0.49 2006 49 105.70 0.36 119.87 0.32 2007 35 168.49 0.35 166.51 0.35 2008 26 373.63 0.34 373.86 0.34 2009 38 475.71 0.43 100.26 2.03 2010 101 171.86 0.24 226.79 0.18 2011 135 79.34 0.27 90.78 0.24
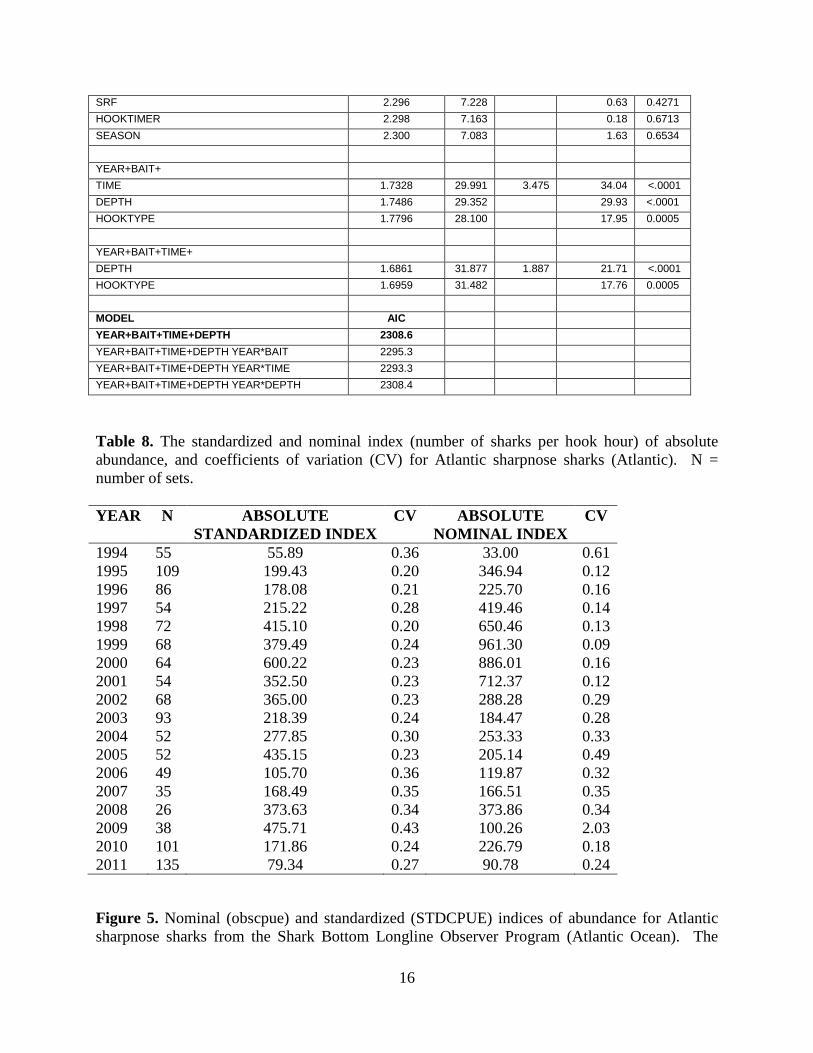
Figure 5. Nominal (obscpue) and standardized (STDCPUE) indices of abundance for Atlantic sharpnose sharks from the Shark Bottom Longline Observer Program (Atlantic Ocean). The

17
dashed lines are the 95% confidence limits (LCL, UCL) for the standardized index. Each index has been divided by the maximum of the index.
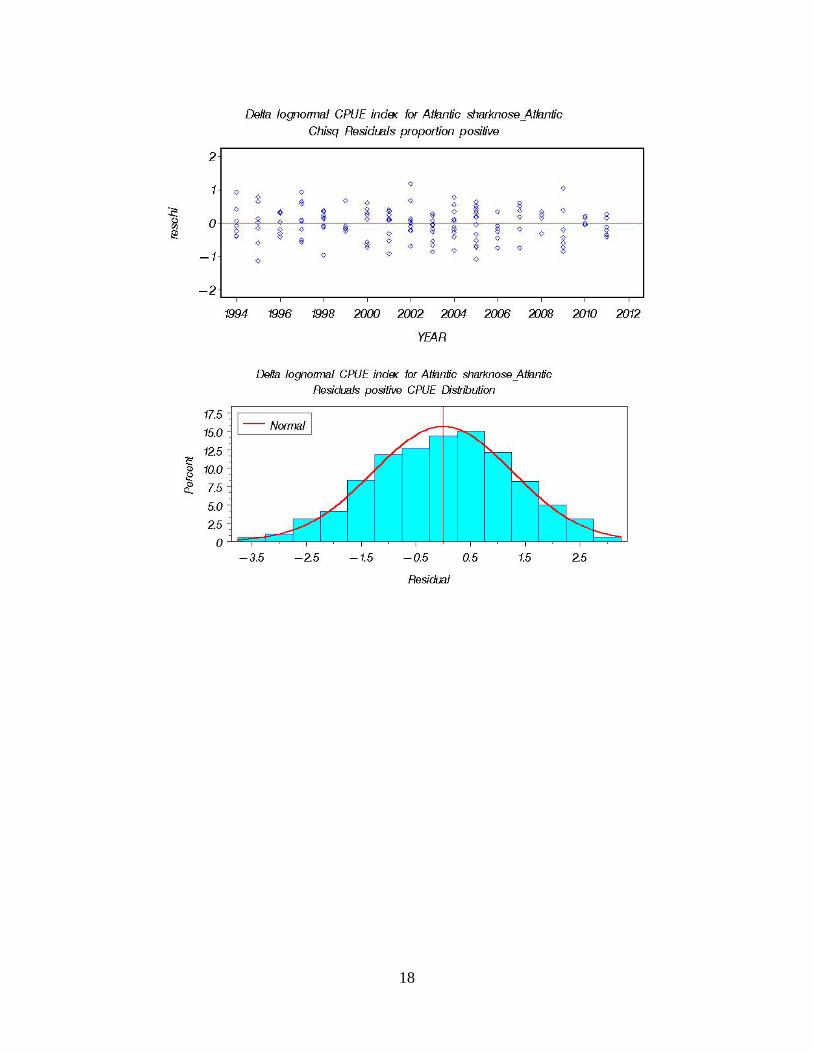
Figure 6. Diagnostic plots of the frequency distribution of residuals, quantile-quantile plots, and
distribution of residuals by year.
18
19
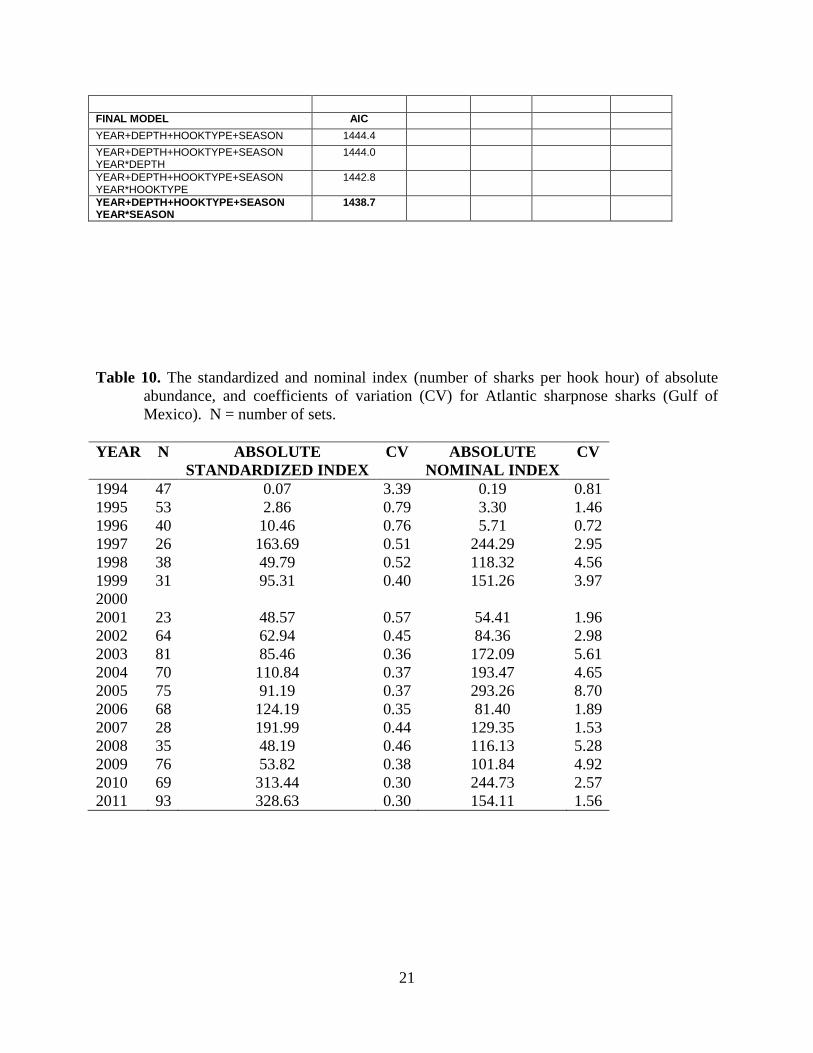
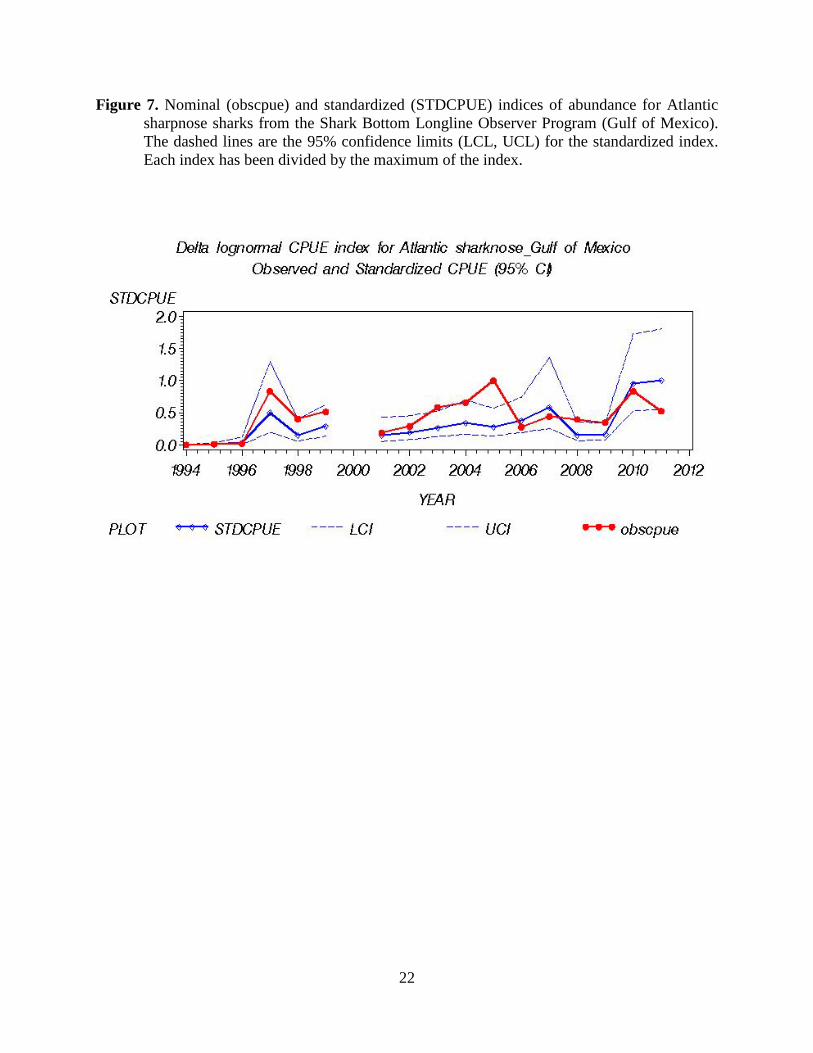
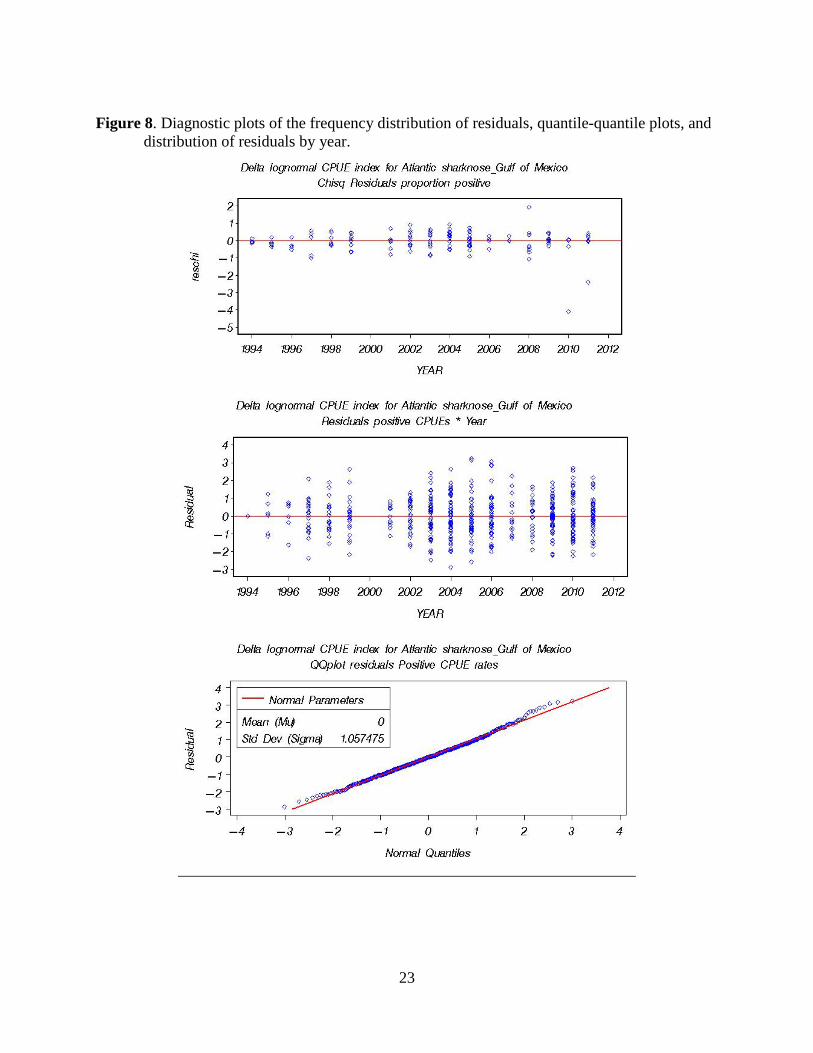
Gulf of Mexico The final bottom longline dataset for the Gulf of Mexico analyzed contained 917 sets. Of those sets, Atlantic sharpnose sharks were reported caught on 51.0% of sets. The stepwise construction of the model is summarized in Table 9 and the index statistics can be found in Table 10. The standardized abundance index is shown in Figure 7 and the diagnostic plots assessing the fit of the models were deemed acceptable (Figure 8).

20
Table 9. Analysis of deviance of explanatory variables for the binomial and lognormal generalized linear and mixed model formulations of the proportion of positive and positive catches for Atlantic sharpnose sharks (Gulf of Mexico). Final models selected are in bold. Proportion positive-Binomial error distribution FACTOR DEVIANCE/DF %DIFF DELTA% CHISQUARE PR>CHI NULL 1.424 YEAR 1.255 11.856 11.856 165.61 <.0001 YEAR+ DEPTH 1.179 17.172 5.317 67.58 <.0001 BAIT 1.241 12.874 17.26 0.0017 TIME 1.244 12.635 10.62 0.0011 SEASON 1.251 12.172 7.57 0.0557 HOOKTIMER 1.255 11.849 1.2 0.273 HOOKTYPE 1.256 11.813 3.28 0.351 SRF 1.256 11.764 0.18 0.6699 YEAR+DEPTH+ BAIT 1.1549 18.886 1.714 25.18 <.0001 TIME 1.1731 17.608 6.37 0.0116 FINAL MODEL AIC YEAR+DEPTH+BAIT 458.9 YEAR+DEPTH+BAIT YEAR*DEPTH 458.9 YEAR+DEPTH+BAIT YEAR*BAIT 458.9
Proportion positive-Lognormal error distribution
FACTOR DEVIANCE/DF %DIFF DELTA% CHISQUARE PR>CHI NULL 1.605 YEAR 1.443 10.071 10.071 66.1 <.0001 YEAR+ DEPTH 1.312 18.248 8.176 47.83 <.0001 SEASON 1.417 11.673 11.55 0.0091 HOOKTYPE 1.424 11.249 9.29 0.0257 HOOKTIMER 1.428 10.987 5.83 0.0157 SRF 1.429 10.919 5.47 0.0193 TIME 1.442 10.133 1.36 0.243 BAIT 1.447 9.853 3.02 0.5541 YEAR+DEPTH+ HOOKTYPE 1.2827 20.061 1.814 13.65 0.0034 SRF 1.2891 19.662 9.22 0.0024 SEASON 1.2907 19.563 10.73 0.0133 HOOKTIMER 1.299 19.045 5.65 0.0175 YEAR+DEPTH+HOOKTYPE+ SEASON 1.2547 21.806 1.745 13.52 0.0036 SRF 1.2596 21.501 9.58 0.002 HOOKTIMER 1.2644 21.202 7.81 0.0052
21
FINAL MODEL AIC YEAR+DEPTH+HOOKTYPE+SEASON 1444.4 YEAR+DEPTH+HOOKTYPE+SEASON YEAR*DEPTH
1444.0
YEAR+DEPTH+HOOKTYPE+SEASON YEAR*HOOKTYPE
1442.8
YEAR+DEPTH+HOOKTYPE+SEASON YEAR*SEASON
1438.7
Table 10. The standardized and nominal index (number of sharks per hook hour) of absolute
abundance, and coefficients of variation (CV) for Atlantic sharpnose sharks (Gulf of Mexico). N = number of sets.
YEAR N ABSOLUTE
STANDARDIZED INDEX CV ABSOLUTE
NOMINAL INDEX CV
1994 47 0.07 3.39 0.19 0.81 1995 53 2.86 0.79 3.30 1.46 1996 40 10.46 0.76 5.71 0.72 1997 26 163.69 0.51 244.29 2.95 1998 38 49.79 0.52 118.32 4.56 1999 31 95.31 0.40 151.26 3.97 2000 2001 23 48.57 0.57 54.41 1.96 2002 64 62.94 0.45 84.36 2.98 2003 81 85.46 0.36 172.09 5.61 2004 70 110.84 0.37 193.47 4.65 2005 75 91.19 0.37 293.26 8.70 2006 68 124.19 0.35 81.40 1.89 2007 28 191.99 0.44 129.35 1.53 2008 35 48.19 0.46 116.13 5.28 2009 76 53.82 0.38 101.84 4.92 2010 69 313.44 0.30 244.73 2.57 2011 93 328.63 0.30 154.11 1.56
22
Figure 7. Nominal (obscpue) and standardized (STDCPUE) indices of abundance for Atlantic sharpnose sharks from the Shark Bottom Longline Observer Program (Gulf of Mexico). The dashed lines are the 95% confidence limits (LCL, UCL) for the standardized index. Each index has been divided by the maximum of the index.
23
Figure 8. Diagnostic plots of the frequency distribution of residuals, quantile-quantile plots, and
distribution of residuals by year.

24
Literature Cited Hale, L.F. and J.K. Carlson. 2007. Characterization of the shark bottom longline fishery, 2005-
2006. NOAA Technical Memorandum NMFS-SEFSC-554, 28 p. Hale, L.F., L.D. Hollensead, and J.K. Carlson. 2007. Characterization of the shark bottom longline fishery, 2007. NOAA Technical Memorandum NMFS-SEFSC-564, 25 p. Hale, L.F., S.J.B. Gulak, and J.K. Carlson. 2009. Characterization of the shark bottom longline
fishery, 2008. NOAA Technical Memorandum NMFS-SEFSC-586, 23 p. Hale, L.F., S.J.B. Gulak, and J.K. Carlson. 2010. Characterization of the shark bottom longline
fishery, 2009. NOAA Technical Memorandum NMFS-SEFSC-596, 25 p. Hale, L.F., S.J.B. Gulak, A.M. Napier, and J.K. Carlson. 2011. Characterization of the shark
bottom longline fishery, 2010. NOAA Technical Memorandum NMFS-SEFSC-611, 35 p. Hale, L.F., S.J.B. Gulak, A.N. Mathers, and J.K. Carlson. 2012. Characterization of the shark
and reeffish bottom longline fishery, 2011. NOAA Technical Memorandum NMFS-SEFSC-634, 27 p.
Lo, N.C.H., L.D. Jacobson, and J.L. Squire. 1992. Indices of relative abundance from fish spotter data based on delta-lognormal models. Canadian Journal of Fisheries and Aquatic Sciences 49, 2515-1526.
Morgan, A., P. Cooper, T. Curtis, and G.H. Burgess. 2009. An overview of the United States East Coast Bottom Longline Shark Fishery, 1994-2003. Marine Fisheries Review 71(1):23-28.
Ortiz, M., and F. Arocha., 2004. Alternative error distribution models for standardization of catch rates of non-target species from a pelagic longline fishery: billfish species in the Venezuelan tuna longline fishery. Fisheries Research 70, 275–294.