Embed Size (px)
Citation preview
Standardized Sample Extraction Procedure for TCLP Testing of PV Modules
by
Raghav Krishnamurthy
A Thesis Presented in Partial Fulfillment
of the Requirements for the Degree
Master of Science
Approved July 2017 by the
Graduate Supervisory Committee:
Govindasamy Tamizhmani, Chair
Devarajan Srinivasan
Joseph Kuitche
ARIZONA STATE UNIVERSITY
August 2017

i
ABSTRACT
Solar photovoltaic (PV) deployment has grown at unprecedented rates since the early
2000s. As the global PV market increases, so will the volume of decommissioned PV
panels. Growing PV panel waste presents a new environmental challenge, but also
unprecedented opportunities to create value and pursue new economic avenues. Currently
in United Stated there are no regulations for governing the recycling of solar panels and
the recycling process varies by the manufacturer. To bring in PV specific recycling
regulations, whether the PV panels are toxic to the landfills, is to be determined. Per
existing EPA regulations, PV panels are categorized as general waste and are subjected to
a toxicity characterization leaching procedure (TCLP) to determine if it contains any toxic
metals that can possibly leach into the landfill. In this thesis, a standardized procedure is
developed for extracting samples from an end of life PV module. A literature review of the
existing regulations in Europe and other countries is done. The sample extraction procedure
is tested on a crystalline Si module to validate the method. The extracted samples are sent
to an independent TCLP testing lab and the results are obtained. Image processing
technique developed at ASU PRL is used to detect the particle size in a broken module and
the size of samples sent is confirmed to follow the regulation.

ii
To,
My parents, K.V. Krishnamurthy, and Dr. Chitra Krishnamurthy, and other friends and
family members for their constant support and love.

iii
ACKNOWLEDGMENTS
I would like to first give my thanks and appreciation to Dr. Govindasamy Tamizhmani for
accepting me into his lab and providing me all the amazing opportunities I’ve had and for
his constant support throughout my thesis work. The work I have done in his lab has
allowed for me to get hands-on-experience in almost all aspects of the PV systems and I
consider myself very fortunate to have been able to learn under him, as well as from both
current and past students in the lab. I thank my committee members, Dr. Kuitche and Dr.
Srini, for their help and support along the way. I would like to thank my fellow lab students
for their support, and I would specifically like to thank Raginee Yadav for her help in
developing the image processing algorithm. I would also like to thank Sai Tatapudi, our
technical lab manager, for his support and guidance. Last but not the least, I would like to
thank all the other students that I have had the pleasure of working with at ASU-PRL.

iv
TABLE OF CONTENTS
Page
LIST OF FIGURES……………………………………………………………………..vii
LIST OF TABLES………………………………………………………………….…… ix
CHAPTER
1. INTRODUCTION ................................................................................................................. 1
1.1 Background ................................................................................................................ 1
1.2 Problem Statement ........................................................................................................... 2
1.3 Objective .......................................................................................................................... 3
2. LITERATURE REVIEW ...................................................................................................... 5
2.1 PV Recycling ................................................................................................................... 5
2.1.1 Recycling Regulations .............................................................................................. 7
2.1.2 Recycling Technologies ........................................................................................... 9
2.1.3 Recycling Collection Systems ................................................................................ 11
2.2 PV Recycling in Europe ................................................................................................ 13
2.3 Existing PV Recycling Technologies ............................................................................ 14
2.3.1 First Solar ............................................................................................................... 14
2.3.1 PV Cycle ..................................................................................................................... 16
3. METHODOLOGY .............................................................................................................. 19
3.1 Module Specifications ................................................................................................... 19
3.2 Sample Extraction Procedure ........................................................................................ 19
v
CHAPTER Page
3.2.1 Laminate ................................................................................................................. 22
3.2.2 Frame ...................................................................................................................... 26
3.2.3 Junction box, Cables and Connectors ..................................................................... 28
3.3 Sample Extraction Setup ............................................................................................... 30
3.4 Particle Size Determination Using Image Processing ................................................... 31
3.4.1 Imaging Using Fluorescent Dyes ........................................................................... 32
3.4.2 Particle Size Distribution Determination .................................................................... 34
3.5 TCLP Testing ................................................................................................................ 35
3.5.1 Packaging of Extracted Samples ................................................................................ 36
3.5.2 TCLP Testing of Samples at Selected Labs ............................................................... 38
4. RESULTS AND DISCUSSIONS ........................................................................................ 39
4.1 TCLP Results for Individual Parts ................................................................................. 39
4.2 TCLP Results for Representative Module ..................................................................... 41
4.3 Summary Analysis on Meeting EPA 1311 Regulation ................................................. 43
5. CONCLUSION ............................................................................................................... 48
5.1 Sample Extraction Methodology .............................................................................. 48
5.2 TCLP Testing Procedure .......................................................................................... 49
5.3 Image Processing Algorithm .................................................................................... 50

vi
CHAPTER Page
5.4 Future Scope ............................................................................................................. 50
REFERENCES .................................................................................................................... 52
vii
LIST OF FIGURES
Figure Page
1 Global Solar PV Market Growth between 2005 And 2020 (Estimated). ........................ 2
2 End-of-Life PV Panel Waste Volumes for the US to 2050[1]......................................... 5
3 Cumulative PV Capacity Installed Globally[1] ............................................................... 6
4 Market Share of PV Panels by Technology Groups ........................................................ 9
5 Recycling Process of CdTe Modules at First Solar ....................................................... 15
6 Major PV Manufacturers based on Annual Manufacturing Capacity[1] ....................... 19
7 Weighing the Module using a Spring Balance .............................................................. 23
8 Coring of Samples Proportionally from Different Areas in the Laminate..................... 24
9 Diamond Coring Bit used for Extracting Samples ........................................................ 25
10 Sample Photograph of a Cored Laminate .................................................................... 25
11 A Portion (10 cm length) of Frame .............................................................................. 27
12 Samples of Frame ready for Packaging and Testing ................................................... 27
13 Connectors Removed from Cables and J-box to be Weighed ..................................... 29
14 Cables Removed from J-box to be Weighed .............................................................. 29
15 J-box of Different Modules Cored to Extract Samples ................................................ 30
16 CRL Glass Coring Machine with Diamond Coring Bit ............................................... 31
17 Applying Zyglo Purc, Penetrant on Area to be Inspected ........................................... 32
18 Module with Fluorescent Dye Inspected in UV Light ................................................. 33
19 Photograph after using a 2" x 2" Mask on the Module ................................................ 34
viii
Figure Page
20 (a) Original image (b) Image with Cracks Traced (c) Outline of Cracks (d) Image with
Distinct Areas Identified ........................................................................................... 34
21 Specialized Containers for Packaging Extracted Samples ........................................... 37
22 Flowchart Describing the Calculation of Representative Value for the Entire Module
................................................................................................................................... 42
23 Particle Size Distribution for Image 1 ......................................................................... 44
24 Particle Size Distribution for Image 2 ......................................................................... 44
25 Particle Size Distribution for Image 3 ......................................................................... 45
26 Particle Size Distribution for Image 4 ......................................................................... 45
27 Comparison of Area of Particle Sizes in 4 Images using the Image Processing
Algorithm .................................................................................................................. 46
28 Median Value of Detected Particle .............................................................................. 47
ix
LIST OF TABLES
Table Page
1 Module Dimensional Specifications .............................................................................. 19
2 Frame Weight Calculations............................................................................................ 26
3 Weight of Sample Supplied to the TCLP lab................................................................. 37
4 Weigh of Components in JCC ....................................................................................... 37
5 Sample Weights of Different Parts Supplied to Labs .................................................... 38
6 EPA Limit for Different Metals ..................................................................................... 39
7 TCLP Lab Results for Laminate .................................................................................... 40
8 TCLP Lab Results for Frame ......................................................................................... 40
9 TCLP Lab Results for J-box, cables and connectors (JCC)........................................... 41
10 TCLP Results for entire module .................................................................................. 43
11 Minimum, Maximum and Average Particle Sizes Detected by the Image Processing
Algorithm .................................................................................................................. 46
1
1. INTRODUCTION
1.1 Background
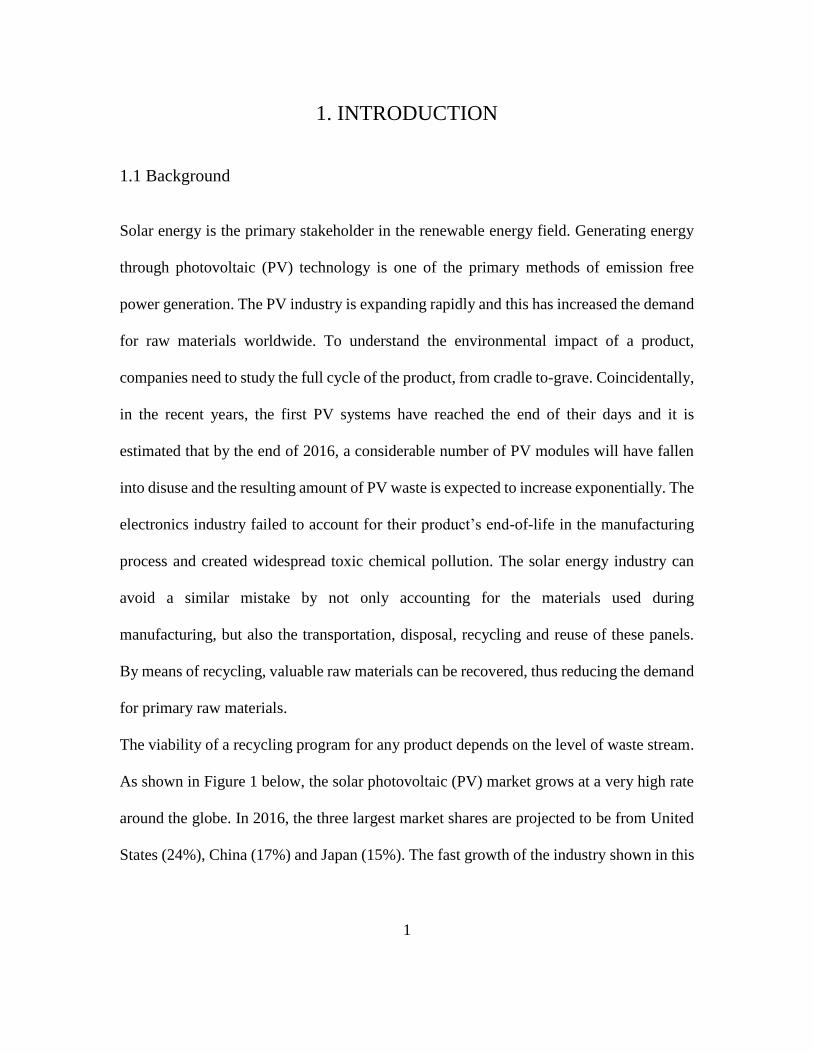
Solar energy is the primary stakeholder in the renewable energy field. Generating energy
through photovoltaic (PV) technology is one of the primary methods of emission free
power generation. The PV industry is expanding rapidly and this has increased the demand
for raw materials worldwide. To understand the environmental impact of a product,
companies need to study the full cycle of the product, from cradle to-grave. Coincidentally,
in the recent years, the first PV systems have reached the end of their days and it is
estimated that by the end of 2016, a considerable number of PV modules will have fallen
into disuse and the resulting amount of PV waste is expected to increase exponentially. The
electronics industry failed to account for their product’s end-of-life in the manufacturing
process and created widespread toxic chemical pollution. The solar energy industry can
avoid a similar mistake by not only accounting for the materials used during
manufacturing, but also the transportation, disposal, recycling and reuse of these panels.
By means of recycling, valuable raw materials can be recovered, thus reducing the demand
for primary raw materials.
The viability of a recycling program for any product depends on the level of waste stream.
As shown in Figure 1 below, the solar photovoltaic (PV) market grows at a very high rate
around the globe. In 2016, the three largest market shares are projected to be from United
States (24%), China (17%) and Japan (15%). The fast growth of the industry shown in this

2
figure clearly indicates that the PV recycling could soon become a major issue in Europe,
US, China and Japan.[1]
Figure 1 Global solar PV market growth between 2005 and 2020 (estimated).
1.2 Problem Statement
With typical PV module lifespans of 20 years, some older utility-scale PV power plants in
the US are soon facing the challenge on how to dispose of large quantities of PV modules
in an environmentally friendly way. Some PV modules may contain hazardous materials,
such as lead, PBDE (Polybrominated diphenyl ether), chromium, and cadmium. It is
estimated that more than 80% of materials from PV modules can be recycled. Unlike
Europe, in the US, there are no federal, state, or local regulations requiring PV module
recycling. Due to the current low volume of PV modules reaching end-of-life, PV recycling
research has been slow in recent years. However, with a rise in large utility-scale PV power

3
plants being deployed in the US and examples of economically and technologically feasible
recycling models that have been implemented overseas, interest in PV recycling research
has been increasing.
There is disagreement on the environmental costs of dumping PV modules in the landfill.
Independent evaluation of the toxicity of PV modules in the landfill environment is needed
to understand the different PV technologies. A PV recycling program in the US will likely
require regulation, which levels the playing field for all stakeholders in the PV industry. A
regulated recycling program will likely entail a robust collection system that gathers PV
modules from sites of waste generation and transports it to a cost-effective recycling plant.
1.3 Objective
This study will evaluate the need and feasibility of developing a robust PV recycling
program in the US by determining the hazard status of selected PV panels and by
examining the current state-of-the-art in PV recycling regulation, collection systems, and
technology. In addition, this study will collect all the technical information to develop a
PV-specific toxicity test procedure and a standardized sample extraction process.
The major objectives of the project are:
1. to provide information that will aid in the development of regulations to promote
environmentally friendly PV recycling
2. to collect the technical information needed to develop a PV module-specific sample
extraction procedure for TCLP (Toxicity Characteristic Leaching Procedure)
testing

4
3. to perform TCLP tests on the recent commercial modules retrieved from the field
and/or collected from other sources

5
2. LITERATURE REVIEW
2.1 PV Recycling
With increasing populations and increasing photovoltaic installations, there is an
associated increase in accumulated material waste from the solar modules and other
balance of system components. It is more economically favorable to discard and replace
defective modules with newer ones than to recycle them, because of the low cost of solar
modules. Thus, there is increasing environmental pollution (terrestrial toxicity, marine
toxicity, human toxicity, metal depletion, particulate matter formation etc.) Large-scale PV
deployment in the US has only occurred in the past ten years. Thus, cumulative end of life
PV waste volumes in the US are expected to remain low at the end of 2016 at 6,500-24,000
t. In 2030 cumulative waste is projected to rise to between 170,000 t and 1 million t and
then possibly increase sevenfold to 7.5-10 million t in 2050.[1]
Figure 2 End-of-life PV panel waste volumes for the US to 2050[1]
6
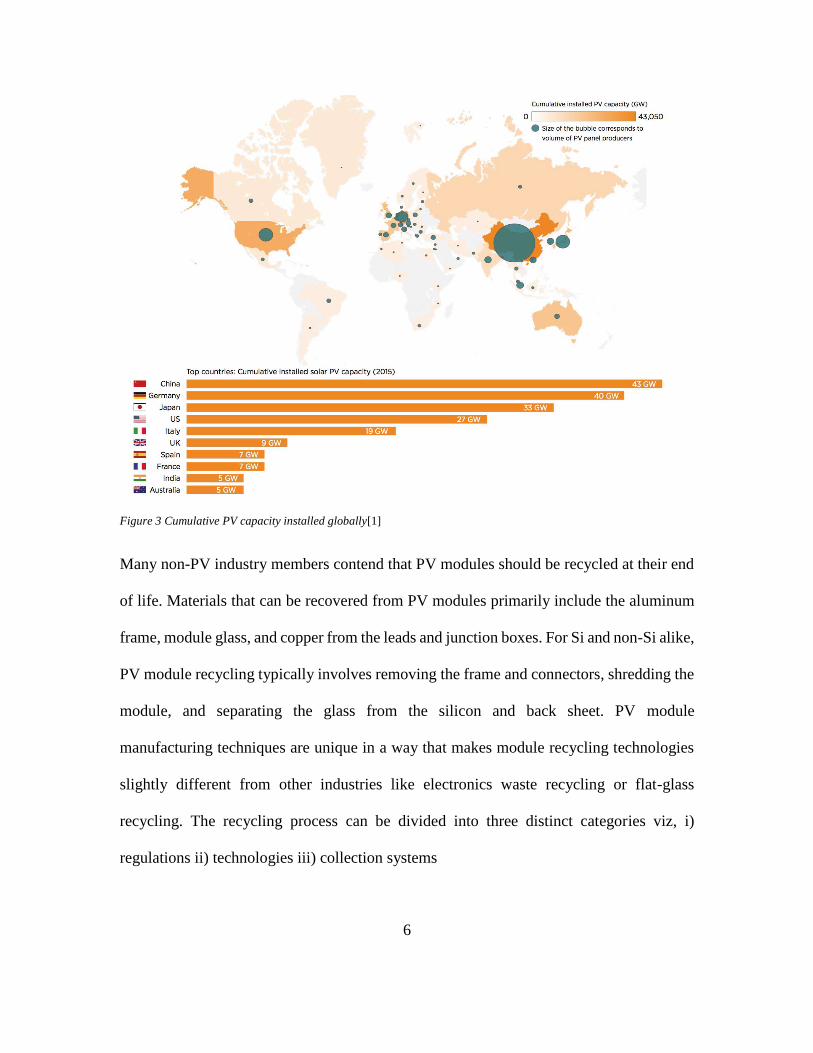
Figure 3 Cumulative PV capacity installed globally[1]
Many non-PV industry members contend that PV modules should be recycled at their end
of life. Materials that can be recovered from PV modules primarily include the aluminum
frame, module glass, and copper from the leads and junction boxes. For Si and non-Si alike,
PV module recycling typically involves removing the frame and connectors, shredding the
module, and separating the glass from the silicon and back sheet. PV module
manufacturing techniques are unique in a way that makes module recycling technologies
slightly different from other industries like electronics waste recycling or flat-glass
recycling. The recycling process can be divided into three distinct categories viz, i)
regulations ii) technologies iii) collection systems

7
2.1.1 Recycling regulations
Developing an end of life management scheme for PV not only involves recovery and
collection but also the recycling targets and the regulations to support them. The European
Union is the only jurisdiction that has developed a set of regulations and policies for the
end of life management of PV. Currently in United Stated there are no regulations for
governing the recycling of solar panels and the recycling process varies by the
manufacturer but, per the Silicon Valley Toxics Coalition (SVTC), they often fall under
regulations for waste disposal and hazardous waste. Hence, PV panels must be disposed of
in line with the Resource Conservation and Recovery Act (RCRA, 1976) that is the legal
framework for managing hazardous and non-hazardous solid waste.[2] The RCRA
regulates the disposal of all solid wastes and sets strict guidelines for record keeping,
labeling, packaging, transportation, siting, inspections, training, and emergency planning
for the generation, transport, storage and disposal of hazardous wastes. To be deemed
hazardous by regulators, decommissioned or defective solar panels must fail to meet the
US Environmental Protection Agency (EPA) Toxicity Characteristic Leaching Procedures
(TCLP) standards in accordance with the RCRA, or on applicable state policies like the
California’s Hazardous Waste Control Law (HWCL). Despite California's HWCL being
stricter than federal regulation for hazardous waste, California which has the largest PV
installations in the US, does not classify solar modules as hazardous waste.[3] This entails
that modules can be directed to landfill after end of useful life.
From a regulatory point of view, PV panel waste still largely falls under the general waste
classification. PV panel waste classification follows the basic principles of waste

8
classification. This also considers material composition by mass or volume and properties
of the components and materials used. In 2015 two-thirds of PV panels installed across the
world were c-Si panels.[1] Typically, more than 90% of their mass is composed of glass,
polymer and aluminum, which can be classified as non-hazardous waste. However, smaller
constituents of c-Si panels like tin, lead, copper, zinc etc. could be potentially hazardous to
the environment. Hazardous materials need treatment and may fall under a specific waste
classification depending on the jurisdiction. Different jurisdictions, such as Germany, the
US or Japan provide different threshold values for the allowable leachate concentrations
for a waste material to be characterized as nonhazardous waste.[4]
In a study on end-of-life management and recycling of PV modules, some long-term
environmental strategies for solar cells are discussed. An idea of recycling the solar panels
is proposed based on the current collection/recycling infrastructure and emerging recycling
technologies. The study indicates that technologies already exist for the recycling of PV
modules and the costs associated with recycling are not excessive. Cadmium is considered
carcinogenic and is extremely toxic by EPA and the US Occupational Safety and Health
Association (OSHA). The environmental codes adopted by solar industries are managed
by recognized standards such as ISO 140001 and the Eco Management and Audit System
(EMAS). Most environmental standards are Environmental Permits and Reporting,
Pollution prevention and Resource reduction, Hazardous Substances, Wastewater and
Solid Waste, Air Emissions and Product Content Restrictions.
9
2.1.2 Recycling technologies
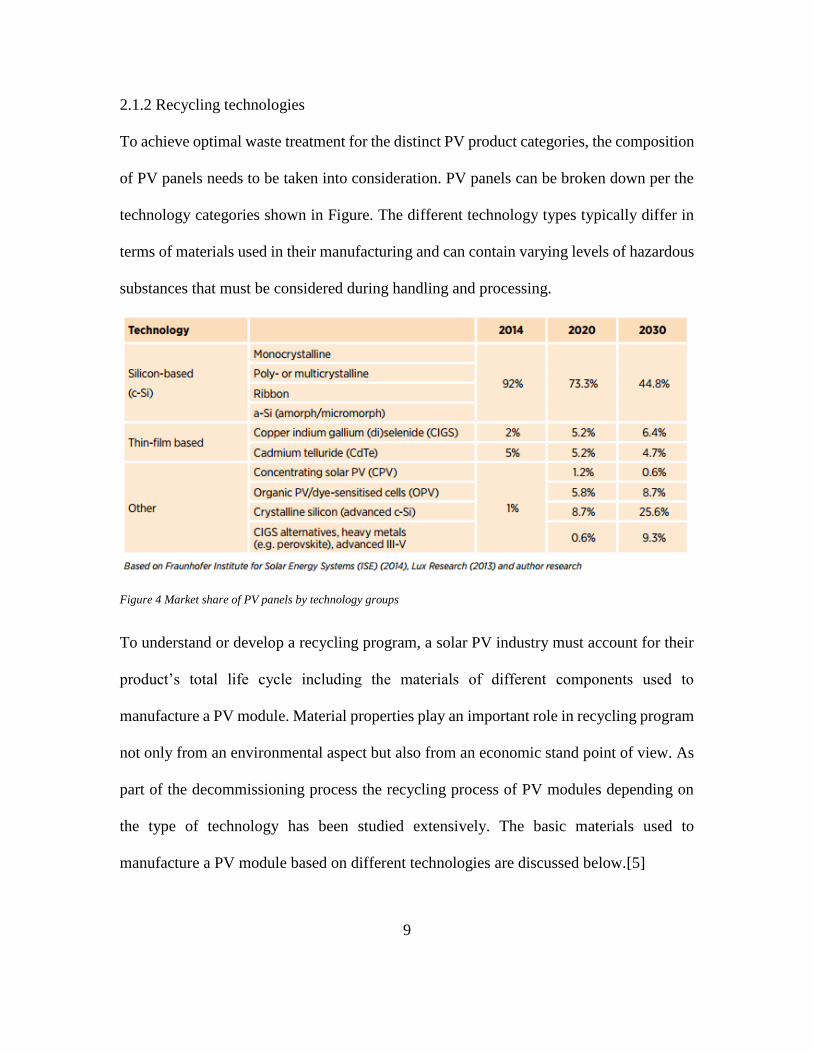
To achieve optimal waste treatment for the distinct PV product categories, the composition
of PV panels needs to be taken into consideration. PV panels can be broken down per the
technology categories shown in Figure. The different technology types typically differ in
terms of materials used in their manufacturing and can contain varying levels of hazardous
substances that must be considered during handling and processing.
Figure 4 Market share of PV panels by technology groups
To understand or develop a recycling program, a solar PV industry must account for their
product’s total life cycle including the materials of different components used to
manufacture a PV module. Material properties play an important role in recycling program
not only from an environmental aspect but also from an economic stand point of view. As
part of the decommissioning process the recycling process of PV modules depending on
the type of technology has been studied extensively. The basic materials used to
manufacture a PV module based on different technologies are discussed below.[5]

10
a) CRYSTALLINE SILICON MODULE:
A typical crystalline silicon module consists of four main components: the front cover,
encapsulant, solar cells and rear layer called tedlar. These modules also consist of a frame
along the outer edge. The front cover is commonly made of glass. Tempered, low iron
content glass is preferred as it has required properties such as high transmittance and self-
cleaning properties. Soda-lime glass or boro-silicate glass is used. Boro-silicate is a more
expensive option. An anti-reflective coating mainly layers of silicon di-oxide (SiO2) is used
on the glass to reduce the reflection. The commonly used encapsulant material is ethyl
vinyl acetate (EVA) which acts as an adhesive. In solar cells as this technology name
suggests, silicon material is used which may either be a mono-crystalline or polycrystalline
technology. The rear layer is a tedlar film which is made from polyvinyl fluoride. There
are other materials like silver, lead used in interconnects, bus bars, finger contact and
aluminum is used in the frame.
b) CADMIUM TELLURIDE MODULE (CdTe):
CdTe thin film module typically consists of five main layers: First layer is glass where
Soda-lime glass or boro-silicate glass is used. The second layer is transparent conducting
oxide (TCO) which consists of tin doped indium oxide (ITO). The third layer is an n-type
semi-conductor cadmium sulphate and it is followed by a p-type semiconductor cadmium
telluride. The last layer is back contact which is made up of different materials. Copper
gold and copper graphite combinations are used previously but Sb2Te3 and As2Te3 layers
are commonly used these days. The final step in forming the back contact is a coating of
11
molybdenum. Treating of cadmium layers with chlorine is an integral part of this
manufacturing process which is done by evaporating CdCl2.
c) COPPER INDIUM GALLIUM SELENIDE MODULE (CIGS):
Commonly known as CIGS module, it is a thin film technology. The basic structure of this
module starts with a common substrate the soda lime glass. The next layer is a transparent
front contact which is a mixture of ZnO and Al which acts as a semiconductor. Al is used
to increase the n-type doping. A heterojunction is formed between ZnO and CIGS
semiconductors which are separated by layers of intrinsic ZnO and a layer of CdS. The
next layer would be a coating of molybdenum which acts as a back cover and followed by
the glass substrate.
d) AMORPHOUS SILICON MODULE:
Amorphous silicon (A-Si) module is also a thin film module. Construction of this thin film
is like that of the other thin films with only a change in semi-conductor material. A soda
lime glass is at the top followed by transparent conducting oxide made of tin doped indium
oxide (ITO). A heterojunction is formed between p-type A-Si (hydrogenated) and n-type
C-Si which are separated by a layer of intrinsic A-Si. Then similar layers of intrinsic A-Si
and n or p-type A-Si are added followed by a layer of transparent conducting oxide.
2.1.3 Recycling collection systems
The main hindrance to PV recycling is the lack of a recycling infrastructure. This
infrastructure should have two main parts: a method of pick-up and transportation of spent
modules, and large-scale recycling centers to receive them. Due to the current widespread

12
and decentralized network of solar energy production, collection of the end-of-life modules
is the more difficult component of establishing a comprehensive PV recycling system.
However, three solutions have been proposed to address this problem.
1) Collection and recycling of PV modules could be undertaken by utility companies,
PV manufacturers, or electronic recycling centers. Utilities that own large solar
arrays for power generation would be responsible for recycling their own PV
modules or transporting them to a recycling center. Unfortunately, the number of
utility companies owning large solar arrays is low, therefore this method would
only provide for recycling of a small fraction of the total PV modules in use. Eg:
First Solar
2) Manufacturers of PV modules would undertake the task of dismantling and
transporting the end-of-life modules to a recycling center that supports other
electronic waste as well. The manufacturer or consumer could pay the
transportation costs, and the recycling center would profit from the sale of the
recovered metals and silicon. This is like the existing method used by the
electronics industry.
3) The most feasible method for private owners, though, is one like that used by the
battery industry. In this, a collection group utilizes reverse retail chains or periodic
pick-up to receive used PV modules. Consumers either bring their used PV modules
to designated drop-off sites, or call for a truck to arrive on location. The modules
would then be delivered to large recycling centers.

13
2.2 PV Recycling in Europe
Europe has recognized the need to recycle and dispose responsibly PV modules from end
of life systems. Under the WEEE Directive (Waste Electrical and Electronic Equipment)
of 2014, Europe has made collection and waste treatment of solar modules into a legal
obligation.[6] The WEEE directive, before it was revised only covered electronic waste
and batteries but since it has recognized the need for responsible recycling of solar PV
modules, it has classified PV modules as electronic waste or e-waste. A joint program
started in 2002 in Europe by the German Federal Ministry for the Environment to make
module recycling more environmental friendly and efficient. It was responsible for the
implementation of the Electrical and Electronic Equipment Act (ElektroG) for PV
modules. The highlights of the ElektroG are given below
Motivation:
1) Recycle and reuse raw materials
2) Prevent hazardous materials like Cd, Hg, Pb from entering the environment
Implications:
1) Producers are obligated to take their PV modules out of the market
2) The take-back service must be free of charge for the private users of the PV
modules
3) Recycling and reusing must be included in the manufacturer’s cost calculation
4) Prohibition of exporting materials from end of life modules out of the country
Working:
1) Private members/users deposit PV modules at municipal take back points

14
2) Manufacturer takes module to a certified recycling facility where they are
recycled free of cost
3) Recycled products are sold back to the manufacturers at subsidized prices
4) Non-reclaimable products are incinerated/disposed of accordingly
2.3 Existing PV recycling technologies
2.3.1 First Solar
First Solar is an American company that was formed in 1999, and launched production of
CdTe based PV commercial products in 2002. Currently, First Solar makes up most the
CdTe based PV market and for this project First Solar can be used as a model company in
this industry. Furthermore, it is the only U.S. based PV company that has implemented a
recycling program without it being a mandatory requirement. This collection and recycling
program involves three steps: registering each module that the company sells, collecting
these modules once they are decommissioned and recycling the modules to recover
materials. [7] The company also pays all packaging and transportation costs associated
with the collection of the decommissioned modules. This program is a useful model as it
covers the most environmentally dangerous photovoltaic-related solid waste and provides
an example for other CdTe manufacturers. However, this program is only designed to
recycle solar cells that First Solar has manufactured, so policy would need to ensure that
each company also instituted such a program. The company has recycled around 48,000
metric tons to date, and does recycling in all its manufacturing plants, scalable to
accommodate future high volumes. Roughly 95 percent of the semiconductor material in
15
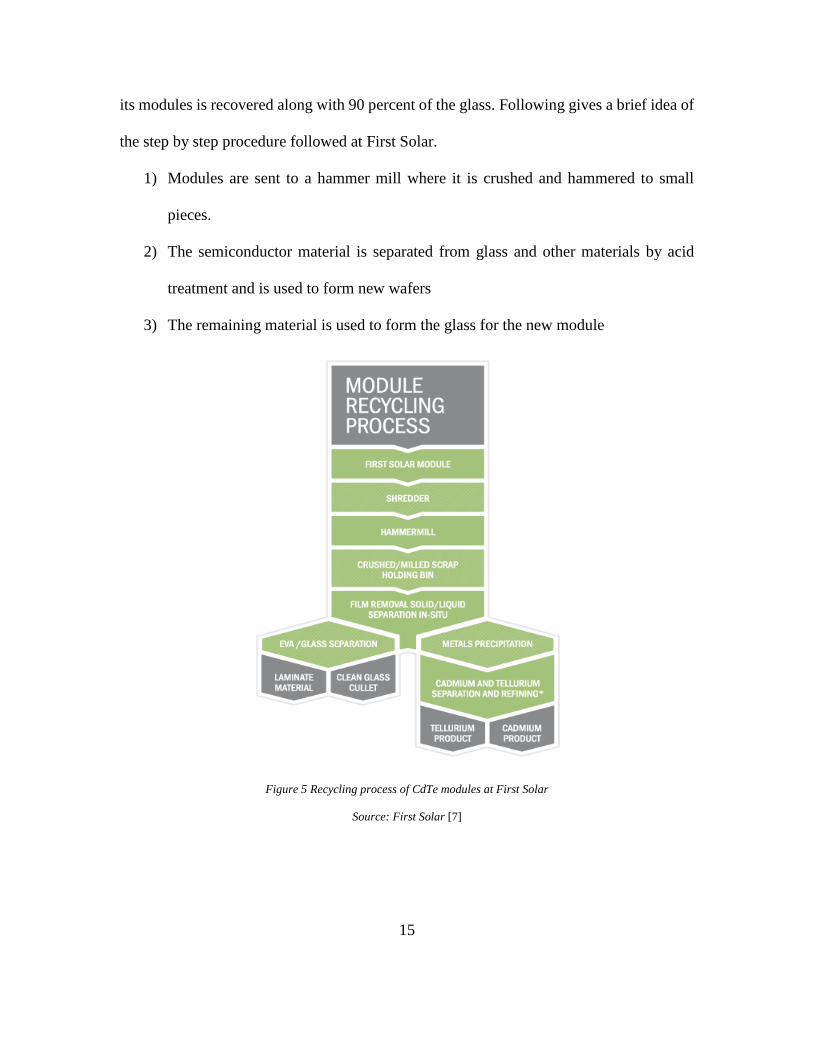
its modules is recovered along with 90 percent of the glass. Following gives a brief idea of
the step by step procedure followed at First Solar.
1) Modules are sent to a hammer mill where it is crushed and hammered to small
pieces.
2) The semiconductor material is separated from glass and other materials by acid
treatment and is used to form new wafers
3) The remaining material is used to form the glass for the new module
Figure 5 Recycling process of CdTe modules at First Solar
Source: First Solar [7]

16
2.3.1 PV Cycle
To recycle old modules optimally, a comprehensive system was essential which led to the
foundation of the joint initiative association PV Cycle. PV Cycle is a pan-European
producer scheme, offering dedicated compliance and waste management services for solar
energy system. PV Cycle was founded in 2007 as a volunteer initiative specific to PV
module waste. Several European countries are members and new countries are joining
with the WEEE directive, which is being fully revamped to include PV module. The
organization is headquartered in Brussels and with member countries like UK, Netherlands,
France, Czech Republic, Germany, Spain, Switzerland, Belgium, and, Bulgaria. [8]
PV Cycle has enabled its members to comply with local requirements in an easy and
effective way. Waste management needs to comply with EU, national and regional
legislation namely: WEEE Directive, Waste Framework Directive, Waste Shipment
Regulation, and Battery Directive. As each EU nation has its own national and local
legislation the PV cycle has enabled harmonization among these legislations to be folded
into the 2014 newly revised WEEE Directive. Currently, PV Cycle has four ongoing
projects which are listed below.[9]
a. Full Recovery End Life Photovoltaic (FRELP)
The FRELP project aims to test and develop innovative technologies for 100% recycling
of end-of-life PV panels in an economically viable way. Two main environmental solutions
are proposed the recovery of high quality extra clear glass, to be used in the hollow and flat
glass industry, thus implying very significant energy and CO2 emission savings in the glass
melting process. The recovery of (metallic) silicon, to be used as ferrosilicon in iron silicon
17
alloys or, if pure enough, transformed into amorphous silicon to produce thin films, thus
greatly reducing energy consumption and CO2 emissions associated with the production of
primary silicon.
b. Cradle-to-cradle sustainable PV modules (CU-PV)
CU-PV is a pan-European R&D project under the European Union’s FP7 Programme. With
the goal of improving the environmental profile of silicon based PV modules, the CU-PV
partners investigate the reduction of silver and lead in PV, ways to eco-design and high-
value end-of-life treatment. Bringing research, production and waste treatment partners to
this project, CU-PV covers the entire life cycle of a silicon based PV module.
c. ReSolar
Working on optimizing the performance in PV module recycling, ReSolar researches into
improved collection and recycling by improving communication and alignment between
waste recyclers and material processors. ReSolar is a joint initiative of 10 Belgium
companies, research institutes and waste officials and funded by the Flemish Government
Agency for Innovation by Science and Technology.
d. CABRISS
CABRISS stands for implementation of a CirculAr economy Based on Recycled, reused
and recovered Indium, Silicon and Silver materials for photovoltaic and other applications.
Focusing on the creation of a circular economy by using and re-using recycled waste
materials from PV modules and other products, CABRISS is a joint initiative of 16

18
European companies and research institutes and received approval by the EU’s Horizon
2020 – Research and Innovation Framework Program.
19
3. METHODOLOGY 3.1 Module Specifications
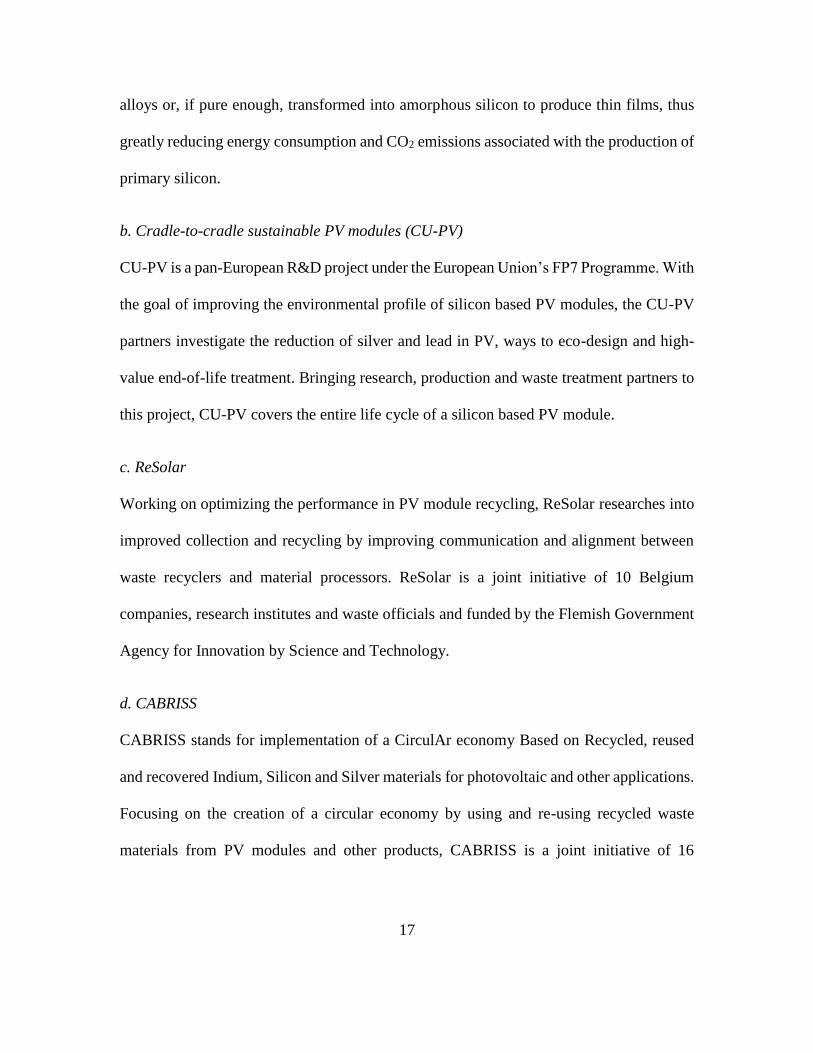
To get representative results of the photovoltaic (PV) market, a literature study was
conducted to identify the major PV module manufacturers, based on their annual
manufacturing capacity as shown in Fig. 6. Of these, one crystalline Si manufacturer was
randomly selected and a module from a vendor for this manufacturer was purchased to
develop the sample extraction procedure and to perform the TCLP testing.
Figure 6 Major PV manufacturers based on annual manufacturing capacity[1]
Table 1 Module Dimensional Specifications
Weight (kg) 19.1
Length (mm) 1650
Width (mm) 992
Number of cells (mm) 60
3.2 Sample extraction procedure
“Using the solid portion of the waste, evaluate the solid for particle size. Particle size
reduction is required, unless the solid has a surface area per gram of material equal to or
20
greater than 3.1 cm2, or is smaller than 1 cm in its 2 narrowest dimension (i.e., can pass
through a 9.5 mm (0.375 inch) standard sieve). If the surface area is smaller or the particle
size larger than described above, prepare the solid portion of the waste for extraction by
crushing, cutting, or grinding the waste to a surface area or particle size as described
above.” [10]
A systematic extraction of representative samples from various parts of the test module
that meets the EPA Method 1311 requirements is described below. Samples are extracted
from all three different parts of the module (laminate, frame and junction box with cables
& connectors) proportional to their individual weights. The extracted samples from each
part is cored and cut to meet the size requirement. To calculate number of samples to be
cored from each area of the laminate (cell, non-cell and ribbon), their individual areas are
calculated. Their proportional percentage is calculated with respect to the total area and
proportional number of samples are cored.
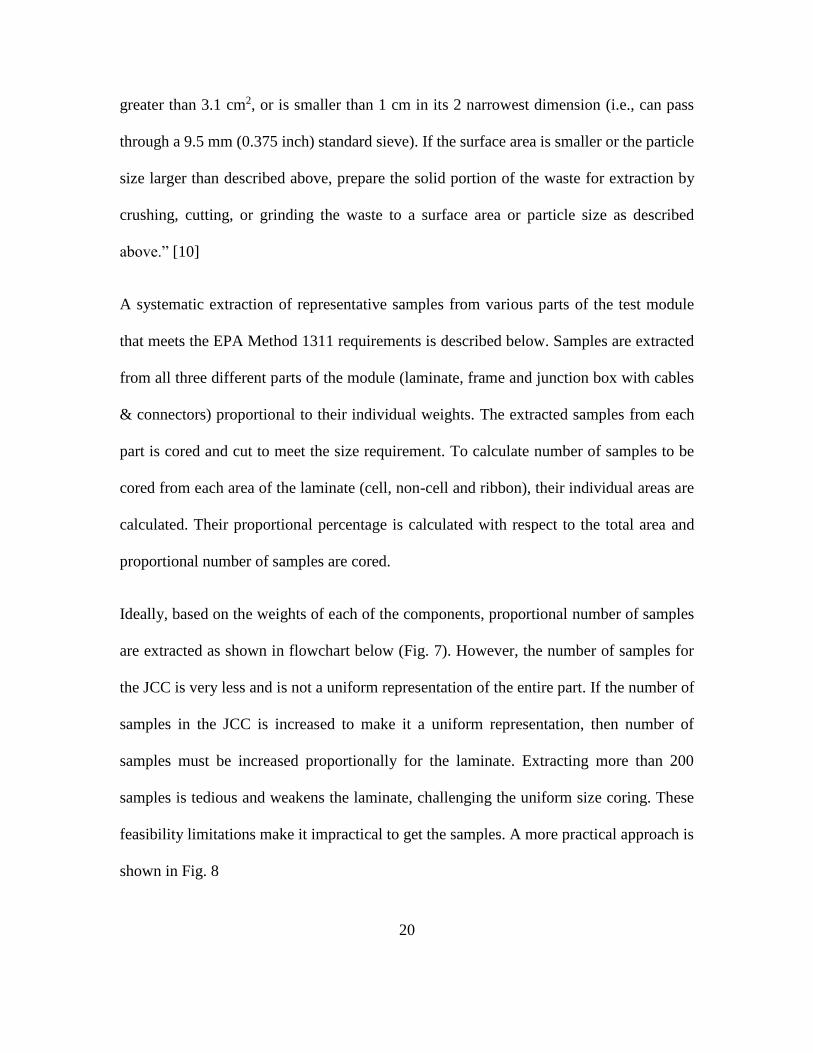
Ideally, based on the weights of each of the components, proportional number of samples
are extracted as shown in flowchart below (Fig. 7). However, the number of samples for
the JCC is very less and is not a uniform representation of the entire part. If the number of
samples in the JCC is increased to make it a uniform representation, then number of
samples must be increased proportionally for the laminate. Extracting more than 200
samples is tedious and weakens the laminate, challenging the uniform size coring. These
feasibility limitations make it impractical to get the samples. A more practical approach is
shown in Fig. 8
21
Figure 7 Ideal case approach for sample extraction
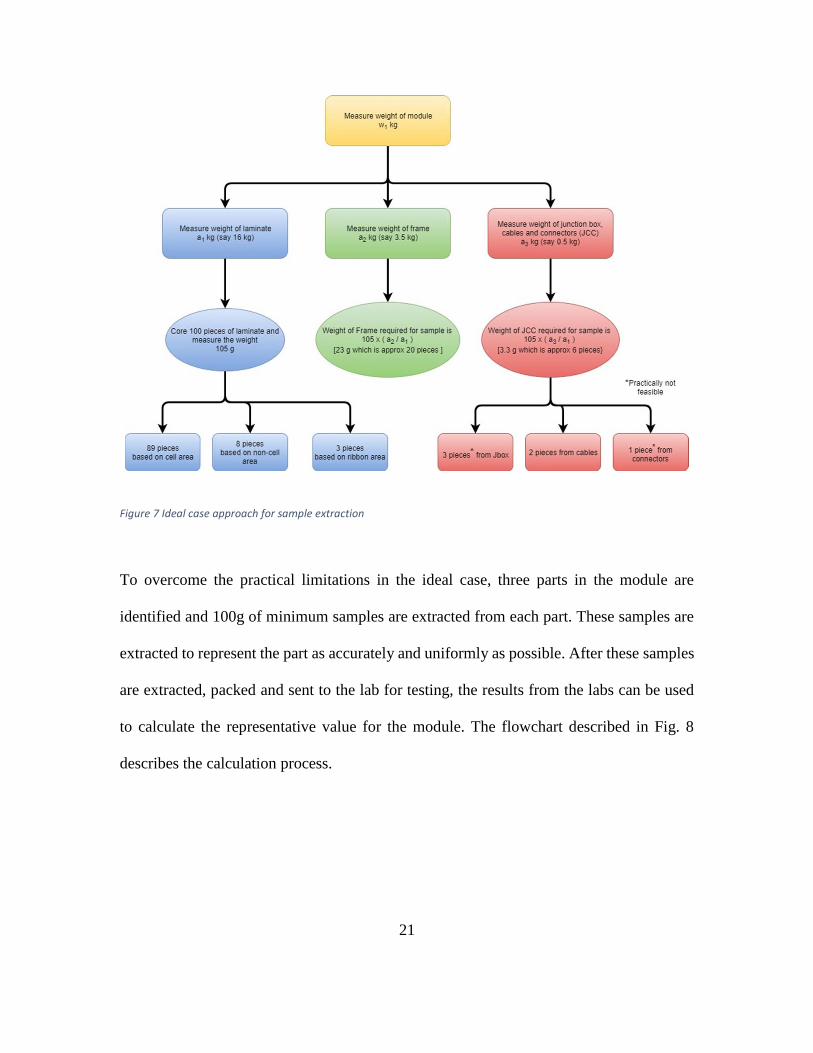
To overcome the practical limitations in the ideal case, three parts in the module are
identified and 100g of minimum samples are extracted from each part. These samples are
extracted to represent the part as accurately and uniformly as possible. After these samples
are extracted, packed and sent to the lab for testing, the results from the labs can be used
to calculate the representative value for the module. The flowchart described in Fig. 8
describes the calculation process.
22
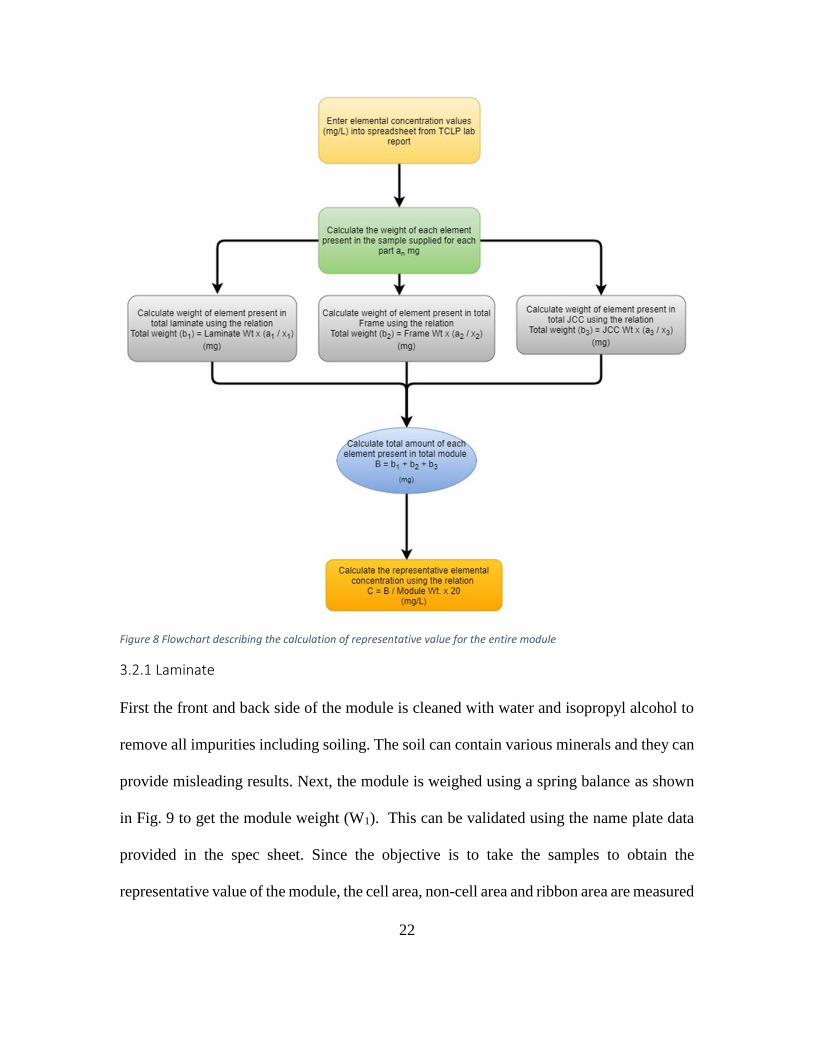
Figure 8 Flowchart describing the calculation of representative value for the entire module
3.2.1 Laminate
First the front and back side of the module is cleaned with water and isopropyl alcohol to
remove all impurities including soiling. The soil can contain various minerals and they can
provide misleading results. Next, the module is weighed using a spring balance as shown
in Fig. 9 to get the module weight (W1). This can be validated using the name plate data
provided in the spec sheet. Since the objective is to take the samples to obtain the
representative value of the module, the cell area, non-cell area and ribbon area are measured

23
and the proportional number of pieces to be cored from each area is calculated as shown in
Fig. 10.
Figure 9 Weighing the module using a spring balance
Using a ½’ coring bit with inner diameter of 9.5 mm (Fig. 11), proportional number of
samples from each of the identified areas (in Fig. 10) are cored in the laminate. A sample
photograph of a cored laminate is shown in Fig. 12. It must be ensured that the weight of
each sample from each of the cored areas is higher than 100g as required by TCLP labs.

24
Figure 10 Coring of samples proportionally from different areas in the laminate

25
Figure 11 Diamond Coring bit used for extracting samples
Figure 12 Sample photograph of a cored laminate
26
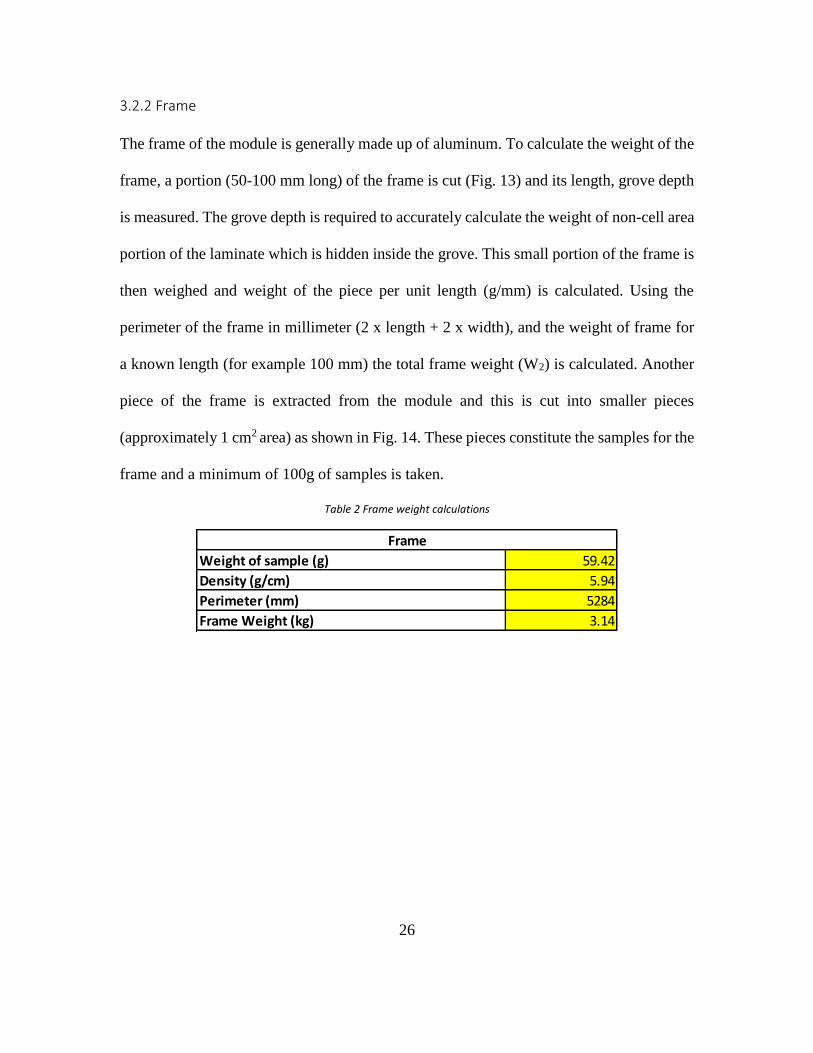
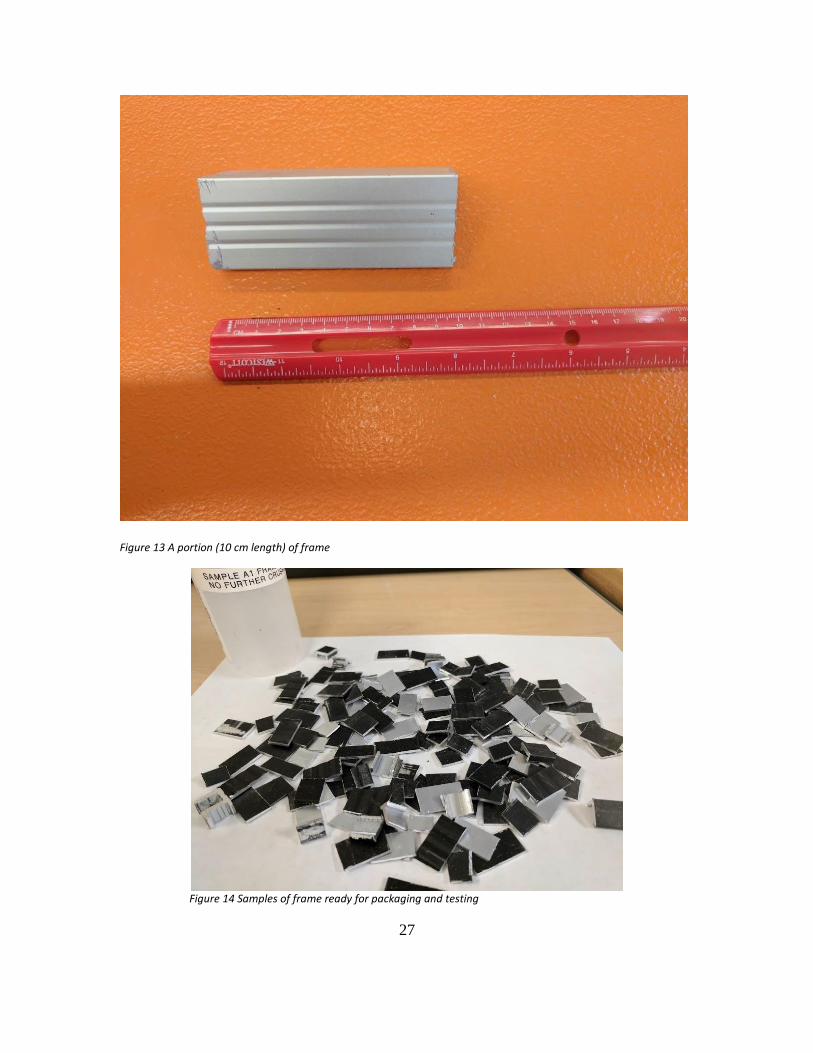
3.2.2 Frame
The frame of the module is generally made up of aluminum. To calculate the weight of the
frame, a portion (50-100 mm long) of the frame is cut (Fig. 13) and its length, grove depth
is measured. The grove depth is required to accurately calculate the weight of non-cell area
portion of the laminate which is hidden inside the grove. This small portion of the frame is
then weighed and weight of the piece per unit length (g/mm) is calculated. Using the
perimeter of the frame in millimeter (2 x length + 2 x width), and the weight of frame for
a known length (for example 100 mm) the total frame weight (W2) is calculated. Another
piece of the frame is extracted from the module and this is cut into smaller pieces
(approximately 1 cm2 area) as shown in Fig. 14. These pieces constitute the samples for the
frame and a minimum of 100g of samples is taken.
Table 2 Frame weight calculations
Weight of sample (g) 59.42
Density (g/cm) 5.94
Perimeter (mm) 5284
Frame Weight (kg) 3.14
Frame
27
Figure 13 A portion (10 cm length) of frame
Figure 14 Samples of frame ready for packaging and testing
28
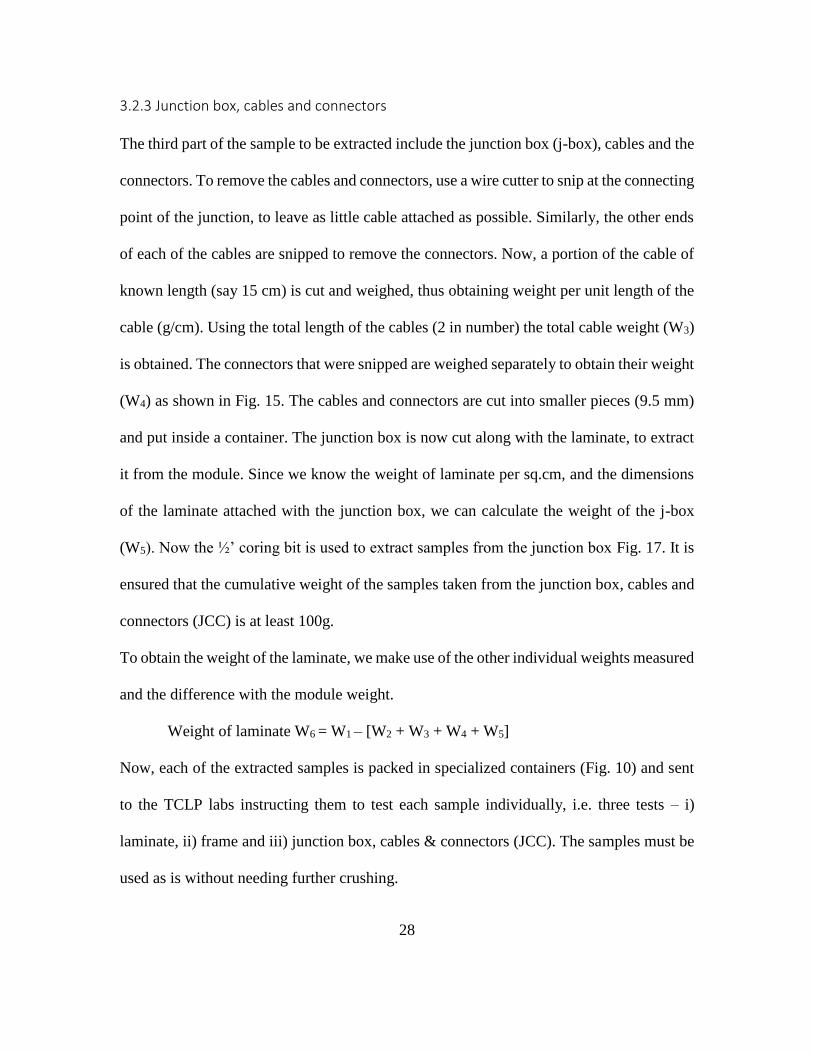
3.2.3 Junction box, cables and connectors
The third part of the sample to be extracted include the junction box (j-box), cables and the
connectors. To remove the cables and connectors, use a wire cutter to snip at the connecting
point of the junction, to leave as little cable attached as possible. Similarly, the other ends
of each of the cables are snipped to remove the connectors. Now, a portion of the cable of
known length (say 15 cm) is cut and weighed, thus obtaining weight per unit length of the
cable (g/cm). Using the total length of the cables (2 in number) the total cable weight (W3)
is obtained. The connectors that were snipped are weighed separately to obtain their weight
(W4) as shown in Fig. 15. The cables and connectors are cut into smaller pieces (9.5 mm)
and put inside a container. The junction box is now cut along with the laminate, to extract
it from the module. Since we know the weight of laminate per sq.cm, and the dimensions
of the laminate attached with the junction box, we can calculate the weight of the j-box
(W5). Now the ½’ coring bit is used to extract samples from the junction box Fig. 17. It is
ensured that the cumulative weight of the samples taken from the junction box, cables and
connectors (JCC) is at least 100g.
To obtain the weight of the laminate, we make use of the other individual weights measured
and the difference with the module weight.
Weight of laminate W6 = W1 – [W2 + W3 + W4 + W5]
Now, each of the extracted samples is packed in specialized containers (Fig. 10) and sent
to the TCLP labs instructing them to test each sample individually, i.e. three tests – i)
laminate, ii) frame and iii) junction box, cables & connectors (JCC). The samples must be
used as is without needing further crushing.

29
Figure 15 Connectors removed from cables and J-box to be weighed
Figure 16 Cables removed from J-box to be weighed
30
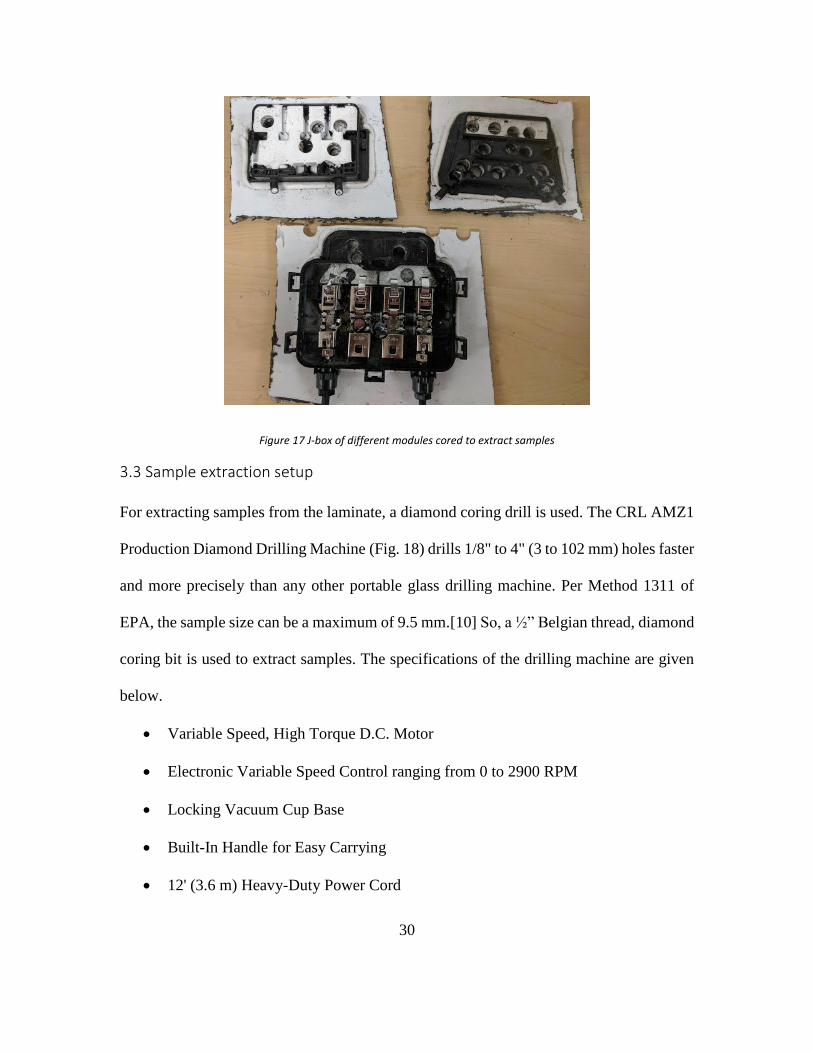
Figure 17 J-box of different modules cored to extract samples
3.3 Sample extraction setup
For extracting samples from the laminate, a diamond coring drill is used. The CRL AMZ1
Production Diamond Drilling Machine (Fig. 18) drills 1/8" to 4" (3 to 102 mm) holes faster
and more precisely than any other portable glass drilling machine. Per Method 1311 of
EPA, the sample size can be a maximum of 9.5 mm.[10] So, a ½” Belgian thread, diamond
coring bit is used to extract samples. The specifications of the drilling machine are given
below.
• Variable Speed, High Torque D.C. Motor
• Electronic Variable Speed Control ranging from 0 to 2900 RPM
• Locking Vacuum Cup Base
• Built-In Handle for Easy Carrying
• 12' (3.6 m) Heavy-Duty Power Cord
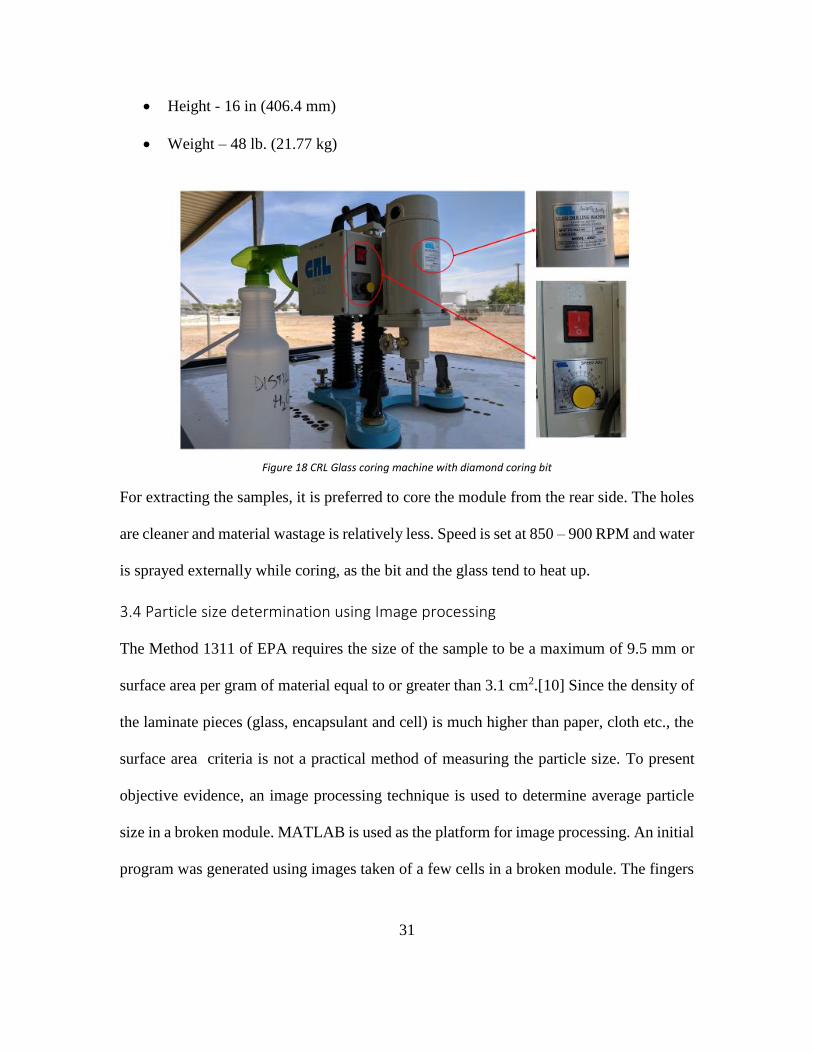
31
• Height - 16 in (406.4 mm)
• Weight – 48 lb. (21.77 kg)
Figure 18 CRL Glass coring machine with diamond coring bit
For extracting the samples, it is preferred to core the module from the rear side. The holes
are cleaner and material wastage is relatively less. Speed is set at 850 – 900 RPM and water
is sprayed externally while coring, as the bit and the glass tend to heat up.
3.4 Particle size determination using Image processing
The Method 1311 of EPA requires the size of the sample to be a maximum of 9.5 mm or
surface area per gram of material equal to or greater than 3.1 cm2.[10] Since the density of
the laminate pieces (glass, encapsulant and cell) is much higher than paper, cloth etc., the
surface area criteria is not a practical method of measuring the particle size. To present
objective evidence, an image processing technique is used to determine average particle
size in a broken module. MATLAB is used as the platform for image processing. An initial
program was generated using images taken of a few cells in a broken module. The fingers
32
in the cells were of similar intensity as the cracks and hence, the detection of the particles
was not very accurate.
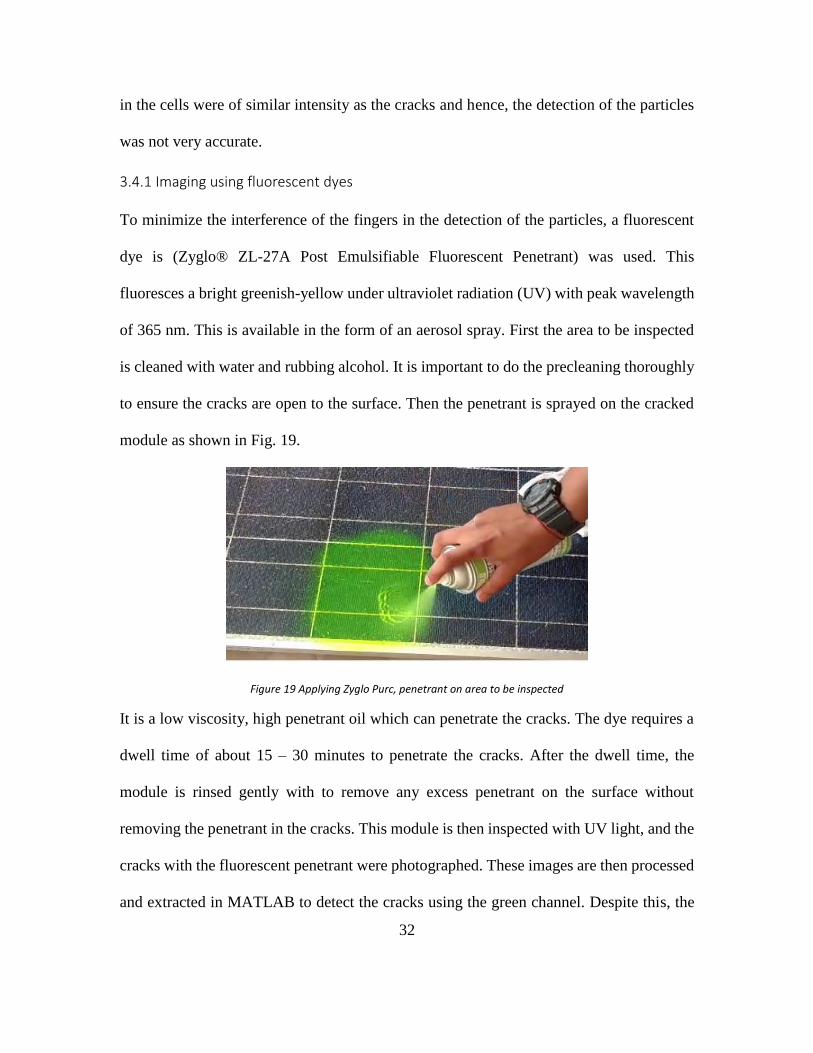
3.4.1 Imaging using fluorescent dyes
To minimize the interference of the fingers in the detection of the particles, a fluorescent
dye is (Zyglo® ZL-27A Post Emulsifiable Fluorescent Penetrant) was used. This
fluoresces a bright greenish-yellow under ultraviolet radiation (UV) with peak wavelength
of 365 nm. This is available in the form of an aerosol spray. First the area to be inspected
is cleaned with water and rubbing alcohol. It is important to do the precleaning thoroughly
to ensure the cracks are open to the surface. Then the penetrant is sprayed on the cracked
module as shown in Fig. 19.
Figure 19 Applying Zyglo Purc, penetrant on area to be inspected
It is a low viscosity, high penetrant oil which can penetrate the cracks. The dye requires a
dwell time of about 15 – 30 minutes to penetrate the cracks. After the dwell time, the
module is rinsed gently with to remove any excess penetrant on the surface without
removing the penetrant in the cracks. This module is then inspected with UV light, and the
cracks with the fluorescent penetrant were photographed. These images are then processed
and extracted in MATLAB to detect the cracks using the green channel. Despite this, the

33
fingers were bright and could not be distinguished from the cracks thereby making the
detection of cracks difficult.
Figure 20 Module with Fluorescent dye inspected in UV light
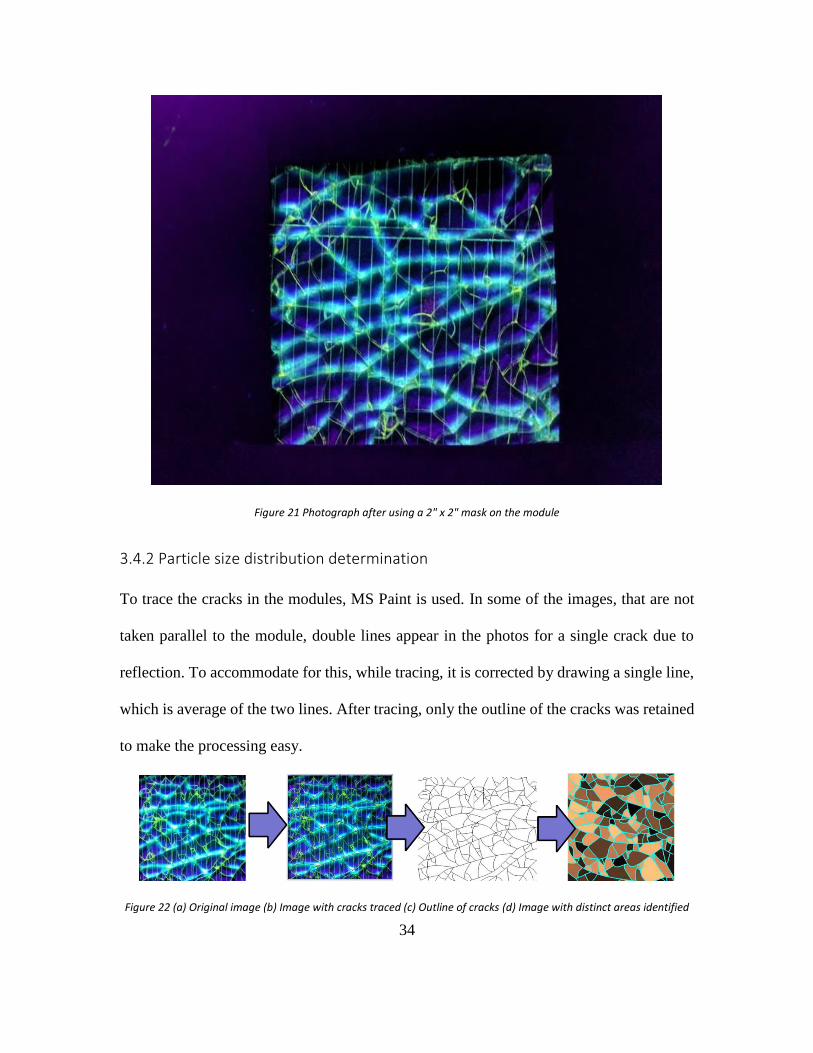
To solve this issue, the cracks are manually traced and then these modified images are
used for the image processing. To make the tracing more accurate, a mask (2 inch x 2 inch)
Fig. 21 is made and used on four random spots identified on the module and images are
taken. Tracing of this smaller known area is easier and more accurate. Then these images
are processed and the average size of the particles is calculated. Knowing the area of the
image is useful to determine the area in mm2, as MATLAB gives the result in pixels.
34
Figure 21 Photograph after using a 2" x 2" mask on the module
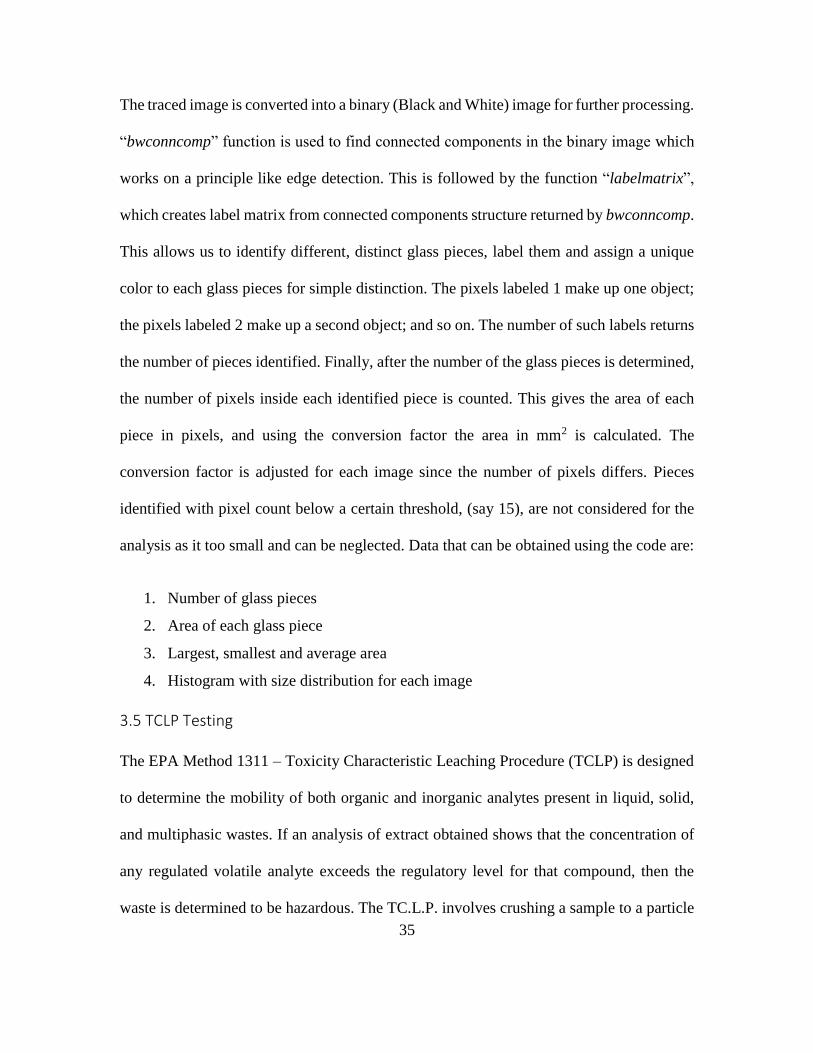
3.4.2 Particle size distribution determination
To trace the cracks in the modules, MS Paint is used. In some of the images, that are not
taken parallel to the module, double lines appear in the photos for a single crack due to
reflection. To accommodate for this, while tracing, it is corrected by drawing a single line,
which is average of the two lines. After tracing, only the outline of the cracks was retained
to make the processing easy.
Figure 22 (a) Original image (b) Image with cracks traced (c) Outline of cracks (d) Image with distinct areas identified
35
The traced image is converted into a binary (Black and White) image for further processing.
“bwconncomp” function is used to find connected components in the binary image which
works on a principle like edge detection. This is followed by the function “labelmatrix”,
which creates label matrix from connected components structure returned by bwconncomp.
This allows us to identify different, distinct glass pieces, label them and assign a unique
color to each glass pieces for simple distinction. The pixels labeled 1 make up one object;
the pixels labeled 2 make up a second object; and so on. The number of such labels returns
the number of pieces identified. Finally, after the number of the glass pieces is determined,
the number of pixels inside each identified piece is counted. This gives the area of each
piece in pixels, and using the conversion factor the area in mm2 is calculated. The
conversion factor is adjusted for each image since the number of pixels differs. Pieces
identified with pixel count below a certain threshold, (say 15), are not considered for the
analysis as it too small and can be neglected. Data that can be obtained using the code are:
1. Number of glass pieces
2. Area of each glass piece
3. Largest, smallest and average area
4. Histogram with size distribution for each image
3.5 TCLP Testing
The EPA Method 1311 – Toxicity Characteristic Leaching Procedure (TCLP) is designed
to determine the mobility of both organic and inorganic analytes present in liquid, solid,
and multiphasic wastes. If an analysis of extract obtained shows that the concentration of
any regulated volatile analyte exceeds the regulatory level for that compound, then the
waste is determined to be hazardous. The TC.L.P. involves crushing a sample to a particle
36
size of less than 9.5 mm, adding an extraction fluid at a 20-to-l fluid to-sample ratio, and
rotating the sample in extraction fluid for 18 hours. One liter of the T.C.L.P. extraction
fluid consists of 5.7 mL glacial acetic acid, 64.3 mL 1 N sodium hydroxide, and 930 mL
of reagent water. The pH of the extraction fluid is 4.93 ± 0.05. Elements regulated by the
TC.L.P. include arsenic, barium, cadmium, lead, mercury, selenium, and silver. [10] This
thesis work deals with only sample extraction from the module but not the TCLP testing.
The TCLP testing was done by an independent test lab located in the United States.
3.5.1 Packaging of extracted samples
A ½” coring bit is used to extract the samples from different areas of the module, weighed
and packed in specialized containers. The containers must be clean and free of any
impurities to avoid any contamination of the samples. These containers are labeled clearly
with instructions not to be crushed further.

37
Figure 23 Specialized containers for packaging extracted samples
Table 3 Weight of sample supplied to the TCLP lab
Table 4 Weigh of components in JCC
Laminate 0.105
Frame 0.099
JCC 0.099
Weight of sample
supplied (kg)
Junction box 58.87
Cables 34.14
Connectors 6.99
JCC Components (g)
38
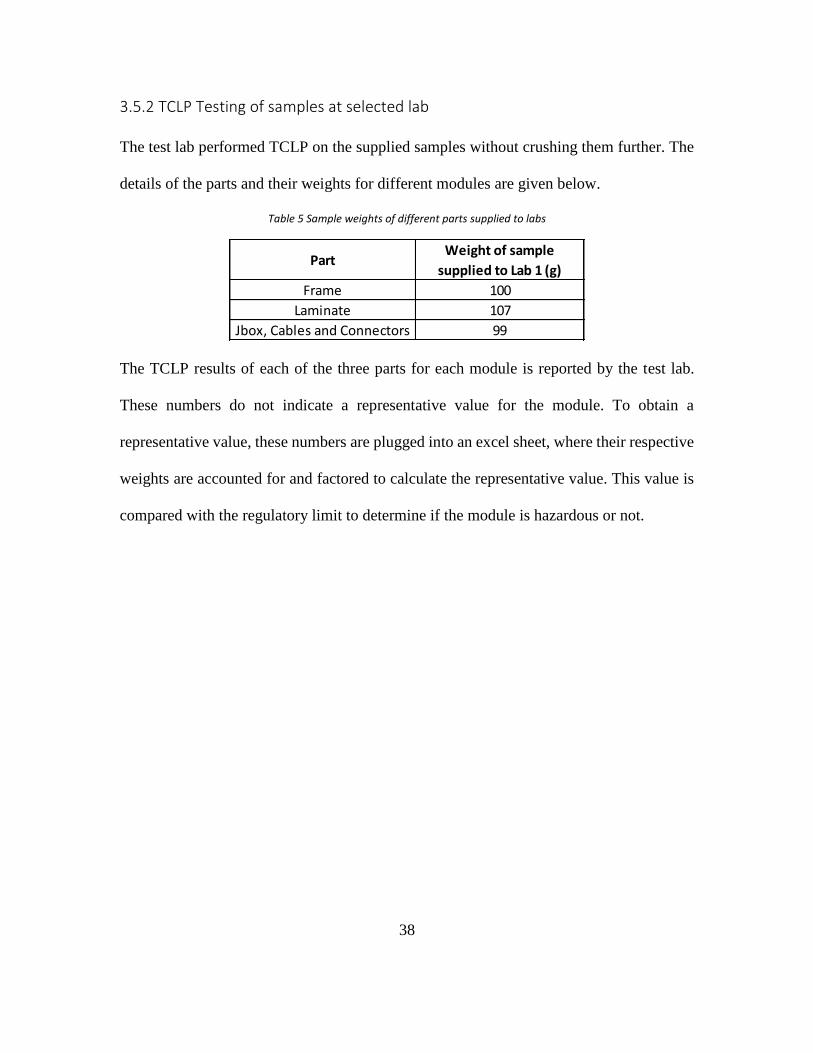
3.5.2 TCLP Testing of samples at selected lab
The test lab performed TCLP on the supplied samples without crushing them further. The
details of the parts and their weights for different modules are given below.
Table 5 Sample weights of different parts supplied to labs
The TCLP results of each of the three parts for each module is reported by the test lab.
These numbers do not indicate a representative value for the module. To obtain a
representative value, these numbers are plugged into an excel sheet, where their respective
weights are accounted for and factored to calculate the representative value. This value is
compared with the regulatory limit to determine if the module is hazardous or not.
PartWeight of sample
supplied to Lab 1 (g)
Frame 100
Laminate 107
Jbox, Cables and Connectors 99
39
4. RESULTS AND DISCUSSIONS
The calculation to determine the amount (mg/L) of toxic elements in the entire module
based on the results received from the TCLP lab, the known individual weights of the
representative samples supplied and the total weight of the module is discussed in this
section. The test results from the TCLP lab is consolidated and plugged into a spreadsheet.
The spreadsheet will consider the contribution of each of the sample, and calculate the
amount of each element in the analyte present in each individual part as well as the entire
module.
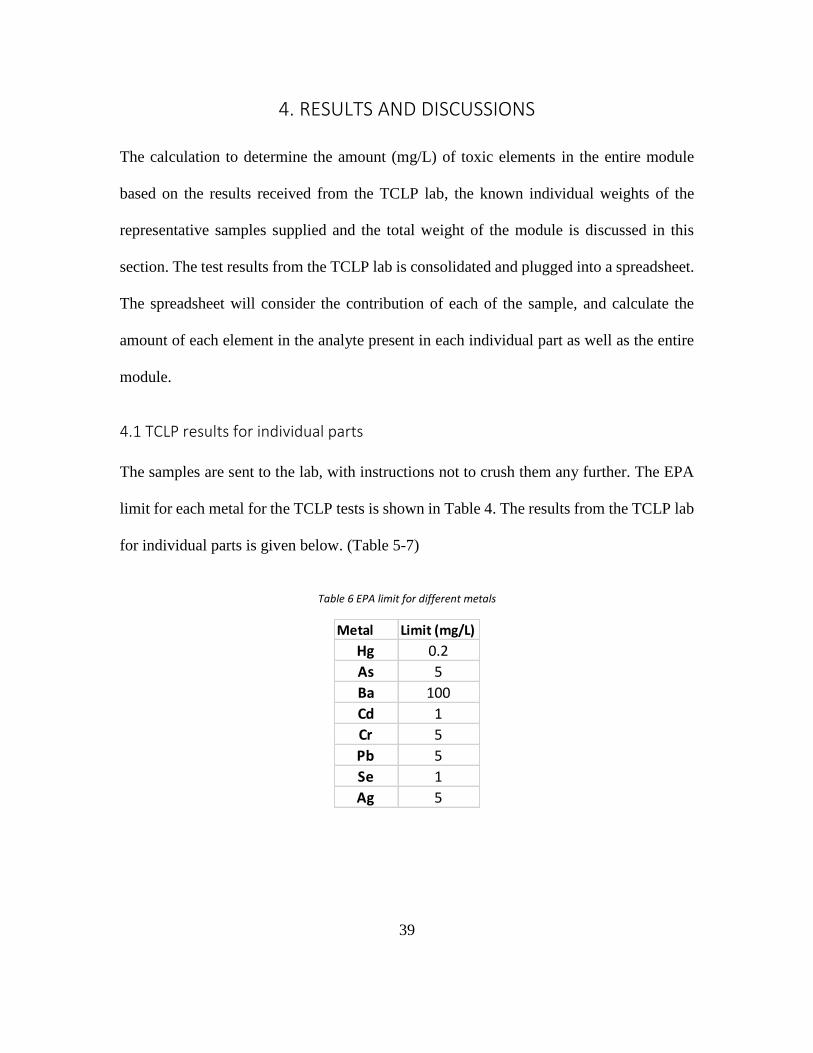
4.1 TCLP results for individual parts
The samples are sent to the lab, with instructions not to crush them any further. The EPA
limit for each metal for the TCLP tests is shown in Table 4. The results from the TCLP lab
for individual parts is given below. (Table 5-7)
Table 6 EPA limit for different metals
Metal Limit (mg/L)
Hg 0.2
As 5
Ba 100
Cd 1
Cr 5
Pb 5
Se 1
Ag 5
40
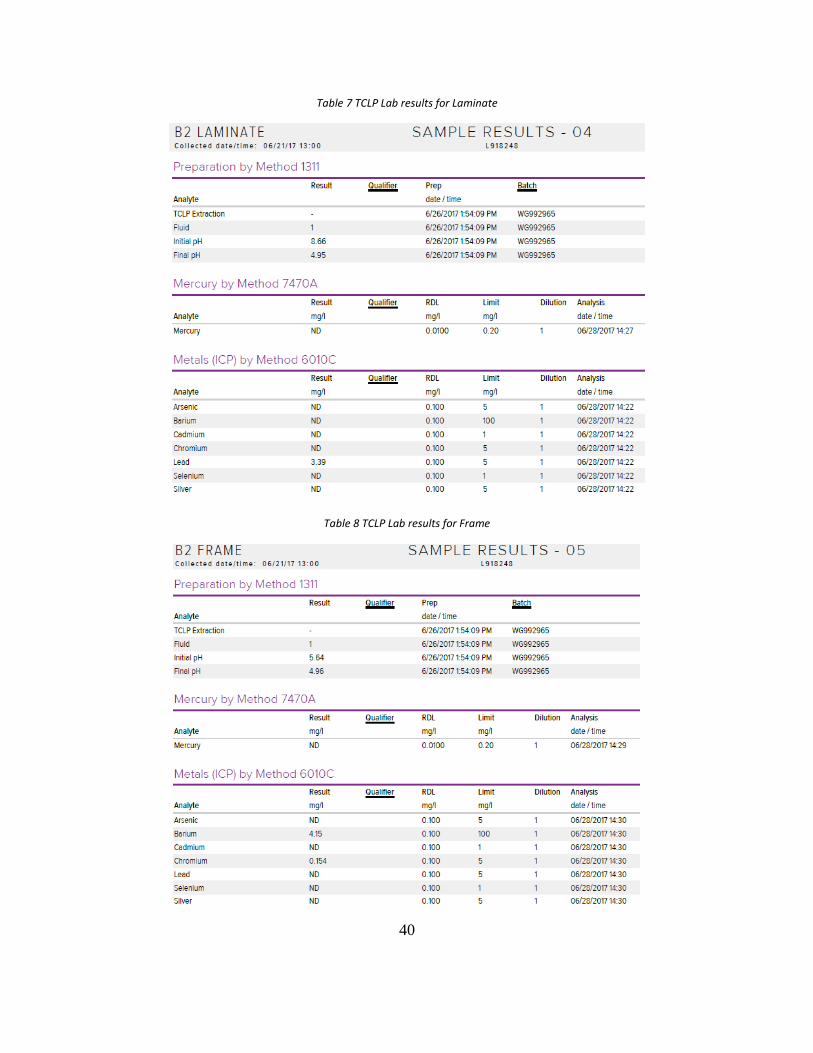
Table 7 TCLP Lab results for Laminate
Table 8 TCLP Lab results for Frame
41
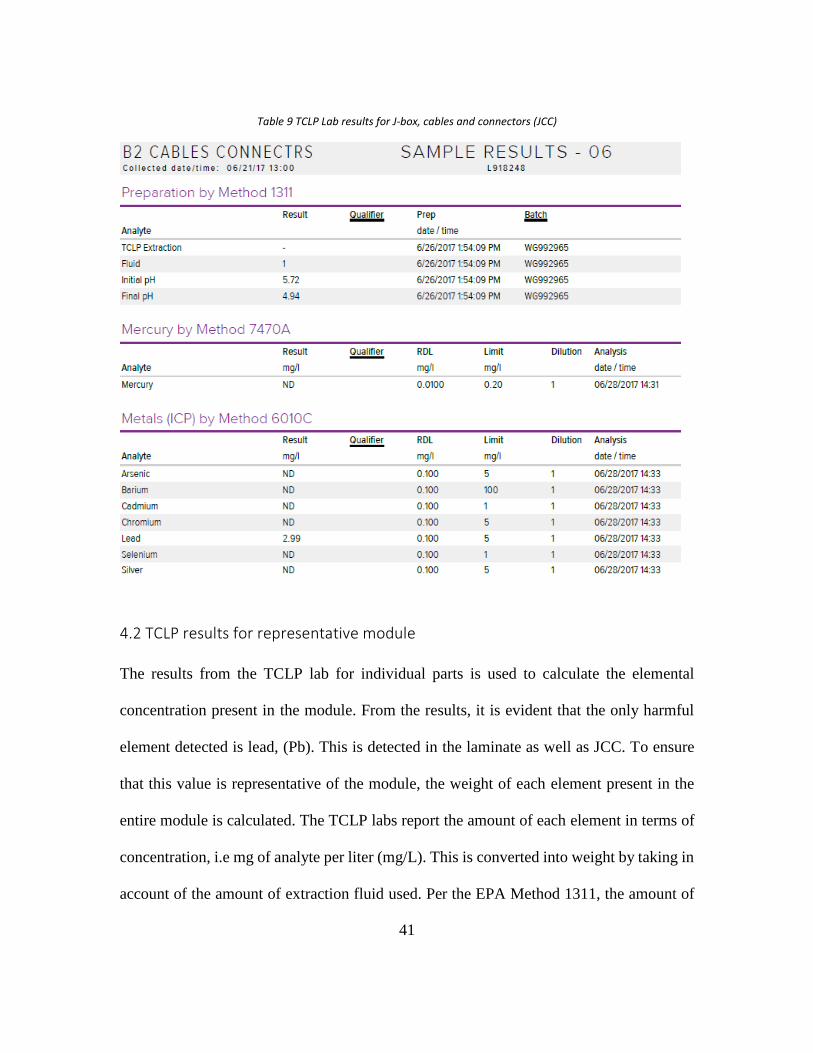
Table 9 TCLP Lab results for J-box, cables and connectors (JCC)
4.2 TCLP results for representative module
The results from the TCLP lab for individual parts is used to calculate the elemental
concentration present in the module. From the results, it is evident that the only harmful
element detected is lead, (Pb). This is detected in the laminate as well as JCC. To ensure
that this value is representative of the module, the weight of each element present in the
entire module is calculated. The TCLP labs report the amount of each element in terms of
concentration, i.e mg of analyte per liter (mg/L). This is converted into weight by taking in
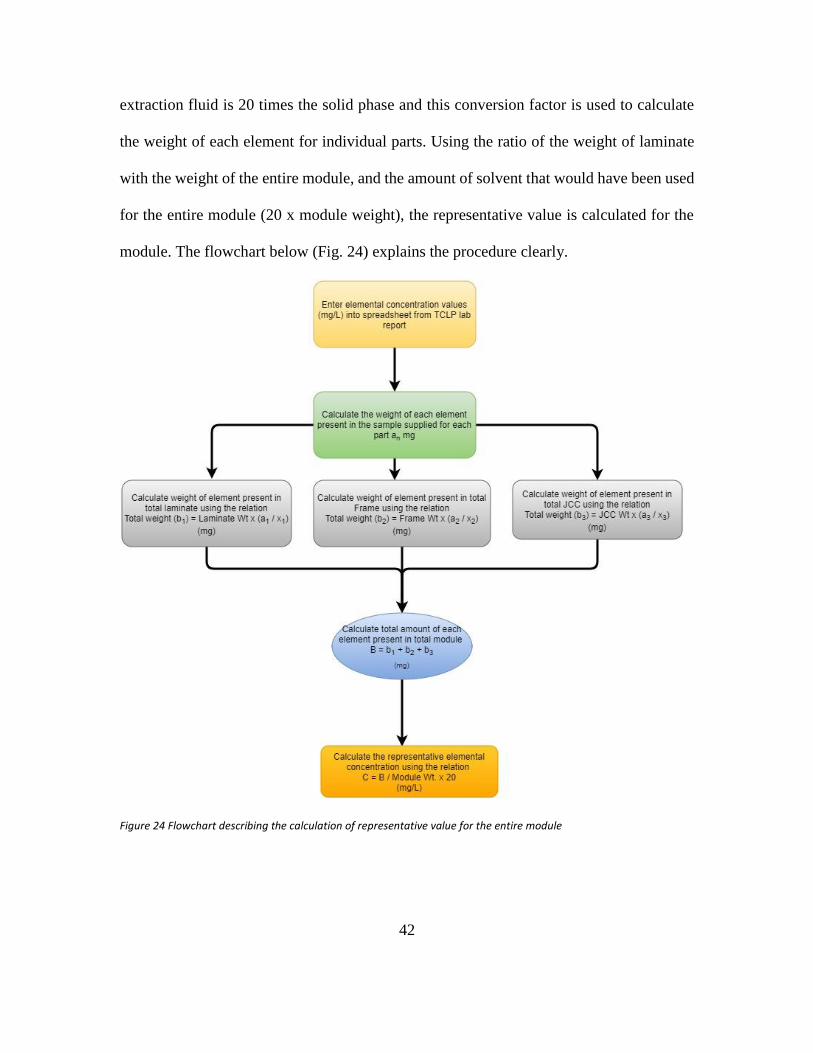
account of the amount of extraction fluid used. Per the EPA Method 1311, the amount of
42
extraction fluid is 20 times the solid phase and this conversion factor is used to calculate
the weight of each element for individual parts. Using the ratio of the weight of laminate
with the weight of the entire module, and the amount of solvent that would have been used
for the entire module (20 x module weight), the representative value is calculated for the
module. The flowchart below (Fig. 24) explains the procedure clearly.
Figure 24 Flowchart describing the calculation of representative value for the entire module
43
Table 10 TCLP results for entire module
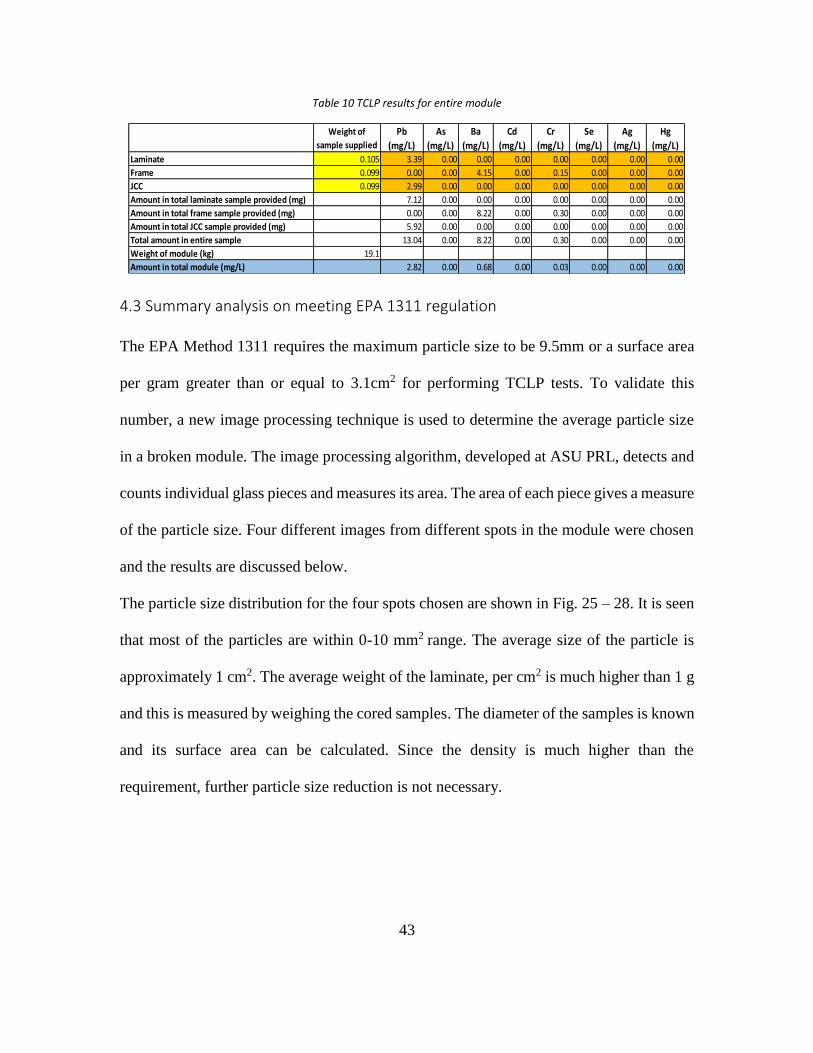
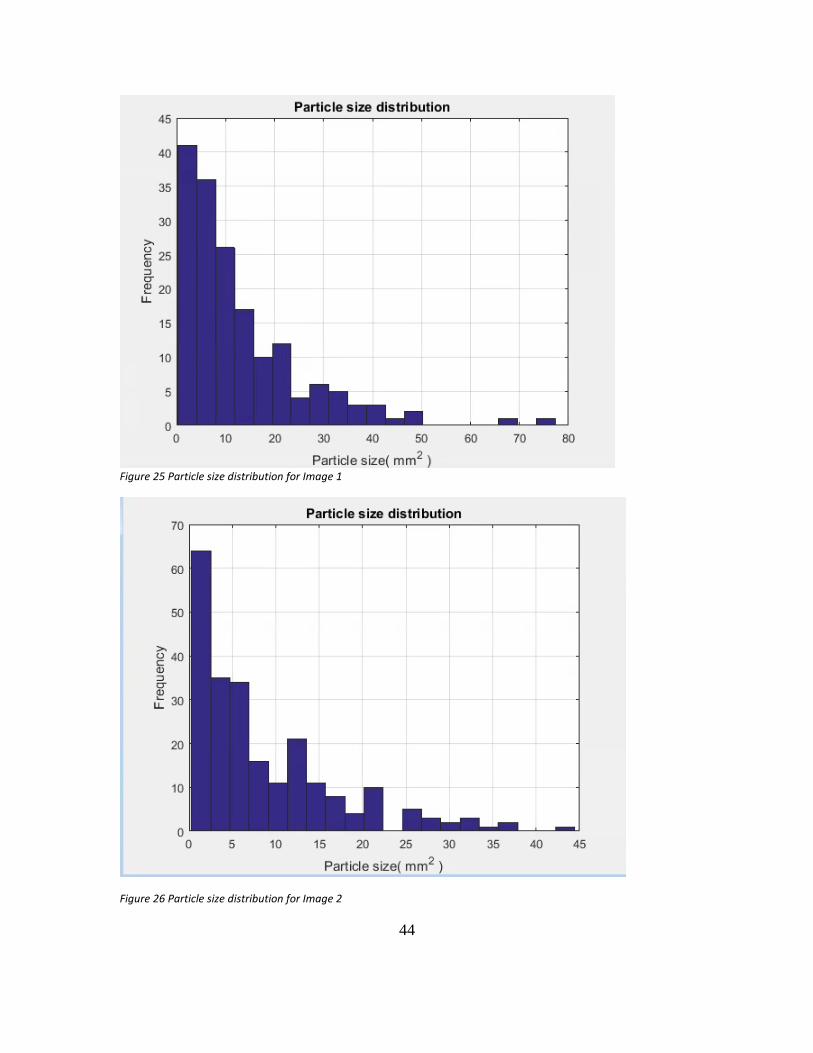
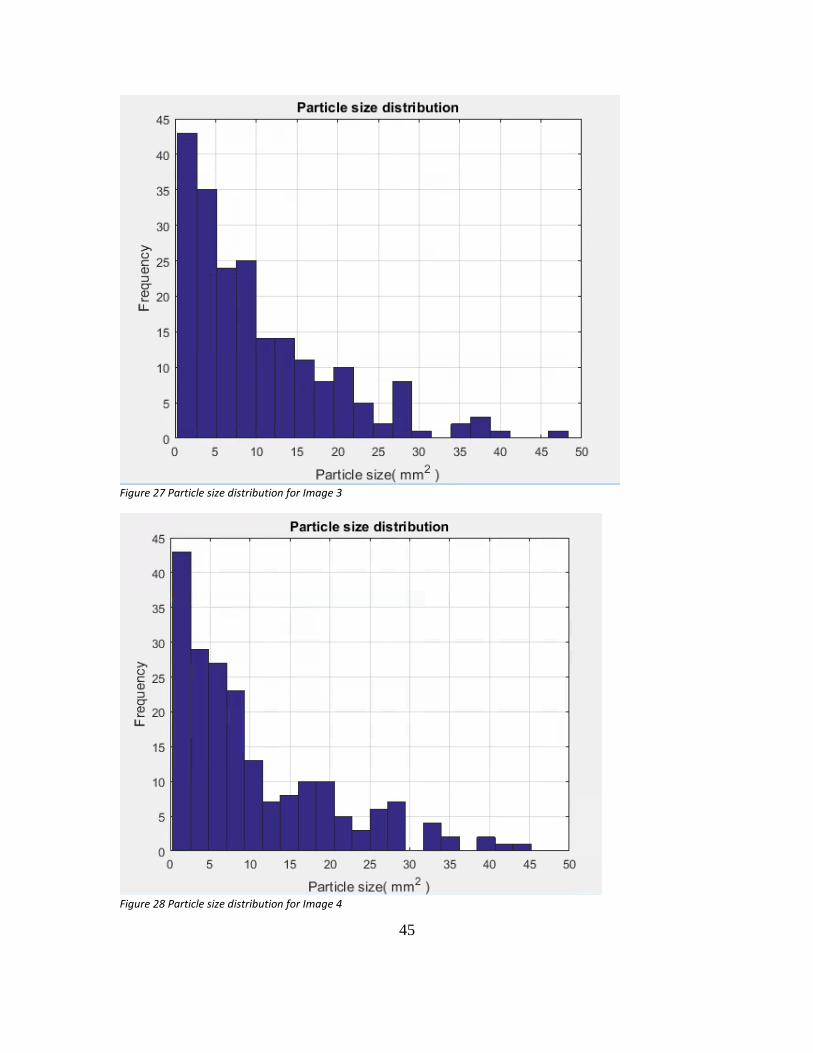
4.3 Summary analysis on meeting EPA 1311 regulation
The EPA Method 1311 requires the maximum particle size to be 9.5mm or a surface area
per gram greater than or equal to 3.1cm2 for performing TCLP tests. To validate this
number, a new image processing technique is used to determine the average particle size
in a broken module. The image processing algorithm, developed at ASU PRL, detects and
counts individual glass pieces and measures its area. The area of each piece gives a measure
of the particle size. Four different images from different spots in the module were chosen
and the results are discussed below.
The particle size distribution for the four spots chosen are shown in Fig. 25 – 28. It is seen
that most of the particles are within 0-10 mm2 range. The average size of the particle is
approximately 1 cm2. The average weight of the laminate, per cm2 is much higher than 1 g
and this is measured by weighing the cored samples. The diameter of the samples is known
and its surface area can be calculated. Since the density is much higher than the
requirement, further particle size reduction is not necessary.
Weight of
sample supplied
Pb
(mg/L)
As
(mg/L)
Ba
(mg/L)
Cd
(mg/L)
Cr
(mg/L)
Se
(mg/L)
Ag
(mg/L)
Hg
(mg/L)
Laminate 0.105 3.39 0.00 0.00 0.00 0.00 0.00 0.00 0.00
Frame 0.099 0.00 0.00 4.15 0.00 0.15 0.00 0.00 0.00
JCC 0.099 2.99 0.00 0.00 0.00 0.00 0.00 0.00 0.00
Amount in total laminate sample provided (mg) 7.12 0.00 0.00 0.00 0.00 0.00 0.00 0.00
Amount in total frame sample provided (mg) 0.00 0.00 8.22 0.00 0.30 0.00 0.00 0.00
Amount in total JCC sample provided (mg) 5.92 0.00 0.00 0.00 0.00 0.00 0.00 0.00
Total amount in entire sample 13.04 0.00 8.22 0.00 0.30 0.00 0.00 0.00
Weight of module (kg) 19.1
Amount in total module (mg/L) 2.82 0.00 0.68 0.00 0.03 0.00 0.00 0.00
44
Figure 25 Particle size distribution for Image 1
Figure 26 Particle size distribution for Image 2
45
Figure 27 Particle size distribution for Image 3
Figure 28 Particle size distribution for Image 4

46
Figure 29 Comparison of area of particle sizes in 4 images using the image processing algorithm
Table 11 Minimum, maximum and average particle sizes detected by the image processing algorithm
Min area(mm2) Max area(mm2) Average area(mm2) No. of glass pieces
Image 1 0.31114 77.2362 12.7748 168
Image 2 0.28672 44.4777 8.6599 231
Image 3 0.30269 48.3673 10.26 207
Image 4 0.33452 45.1914 10.598 201

47
Figure 30 Median value of detected particle
48
5. CONCLUSION
With the rising cost of electricity and advancement in solar PV technology, there will be
an increase for the demand of solar PV technology within the residential and commercial
markets. In 20 to 25 years these panels will reach their end-of-life and the cumulative
amount of PV waste will force the solar industry to be more conscious about developing
an environmentally sustainable and cost effective method of disposing this industrial waste.
Nonetheless, some solar manufacturing companies have begun to voluntarily recycle solar
modules, but such initiatives are driven by environmental responsibility rather than
economic benefit. Therefore, as PV waste appears 25-30 years after the module is created
and the PV industry is experiencing explosive growth, there will be increased need to
recycle the large amount of decommissioned solar modules. Because recycling is currently
economically unfavorable, this will ultimately lead to economic stress on voluntary
initiatives. Consequently, unless recycling of solar modules is regulated in the future, it is
likely that these types of voluntary initiatives will not be sustainable and hazardous
materials may begin entering local waste streams.
5.1 Sample extraction methodology
The sample extraction may seem to be a very straightforward and simple procedure. After
experimenting with a lot of different coring techniques and different machines, the CRL
AMZ1 diamond drilling machine is chosen. It produces high precision and clean cuts with
minimal material wastage. This is validated by the fact that 142 sample pieces extracted in
a previous experiment weighed 110 g while 89 pieces extracted with the CRL drilling
machine, weighed 94 g as expected. The other advantage of this machine is, it has an inbuilt
49
water cooling system that can work if attached with an external motor. With multiple trial
and error experiments with the orientation of the module, coring from the back side gives
cleaner samples when compared to the front side. This is mainly because the glass does not
get stuck inside the coring bit as compared to the rear side. To simplify the approach, the
junction box along with the laminate piece can be cut and sent to the TCLP labs as such
for their crushing and testing. Since the junction box and the laminate above the junction
box typically contain the large amount of interconnect ribbons, this piece can be considered
the worst-case scenario. If the worst-case scenario is determined to be complying with the
requirement of the standard, then it can be concluded that there is no further testing needed
for the individual components of the module. It is cautioned that the test results obtained
by this approach cannot be used for the pass/fail determination if the piece contains any
toxic element exceeding the required limit.
The module that was tested did not exceed the EPA limit for any of the elements for the
TCLP test. However, this cannot be used to make any decisive conclusions for the entire
PV industry. More modules from different manufacturers need to be tested to obtain any
objective evidence to make necessary conclusions.
5.2 TCLP testing procedure
The TCLP procedure has a few minimum requirements like, the particle size reduction. Per
EPA Method 1311, “particle size reduction is required, unless the solid has a surface area
per gram of material equal to or greater than 3.1 cm2, or is smaller than 1 cm in its 2
narrowest dimension (i.e., is capable of passing through a 9.5 mm (0.375 inch) standard

50
sieve. Surface area criteria are meant for filamentous (e.g., paper, cloth, and similar) waste
materials.” More data is needed in the image processing algorithm to determine the particle
size in a broken module. Since the module was broken because of coring and it does not
represent a field breakage. To get more accurate results, the module must be broken in a
way similar to field breakage.
To make the process repeatable and reproducible, it is recommended to core four sets of
identical samples and send two TCLP labs, two sets each. This is to identify any
discrepancies in the coring procedure and to ensure that all the TCLP labs produce identical
end results.
5.3 Image processing algorithm
The image processing was done with normal image as well as in UV fluorescence. The
images in UV were more brighter and the cracks were more clearly distinguishable from
the background. Since the cracks had to be traced manually to get more accurate results,
four 2” x 2” areas are chosen at random and used for the image processing. By using
artificial neural networks (ANN) bigger areas can be covered and more accurate results can
be obtained.
5.4 Future Scope
The primary objective of the present work is to develop a sampling procedure to
appropriately extract the samples from various parts of the module. The extracted samples
are then sent to TCLP labs for testing and the test results are obtained. In this work, based
on the test results obtained from the TCLP labs, we also demonstrate how to calculate the

51
end results to determine the pass/fail requirements of the standard. In future, the results
from additional modules can be obtained and stored in the form of a database. This database
will be helpful in generating more reliable data to form the framework of a PV specific
recycling regulation in the United States. Electronics product takeback legislation has been
proposed in several European countries and the issue is discussed in several Asian countries
(e.g., Japan, South Korea, Taiwan and Singapore). Environmental disposal and waste
handling regulations, logistics and economics of product recycling and waste disposal
affect the reasoning and practicality of recycling. With the right policies and enabling
frameworks in place, the spawning of new industries that recycle and repurpose old solar
PV panels will drive considerable economic value creation. This will be an essential
element in the world’s transition to a sustainable energy future.

52
References
[1] S. Weckend, A. Wade, and G. Heath, End-of-life management: Solar photovoltaic
panels. 2016.
[2] C. Eberspacher, C. F. Gay, and P. D. Moskowitz, “Strategies for recycling CdTe
photovoltaic modules,” Conf. Rec. IEEE Photovolt. Spec. Conf., vol. 1, no. Piscataway,
NJ, United States, pp. 962–965, 1994.
[3] C. Eberspacher and V. M. Fthenakis, “Disposal and recycling of end-of-life PV
modules,” Conf. Rec. Twenty Sixth IEEE Photovolt. Spec. Conf. - 1997, pp. 1067–1072,
1997.
[4] B. Bo and K. Yamamoto, “Characteristics of E-waste Recycling Systems in Japan
and China,” World Acad. Sci. Eng. Technol. Int. J. Environ. Chem. Ecol. Geol. Geophys.
Eng., vol. 4, no. 2, pp. 89–95, 2010.
[5] C. Honsberg and and S. Bowden, “PV CDROM.” [Online]. Available:
http://pveducation.org/pvcdrom/modules/module-materials.
[6] D. de Rooij and N. D. Weimar, Comprehensive Guide to Solar PV Module
Certifications. Sino Voltaics, 2016.
[7] First Solar, “First Solar CdTe Photovoltaic Technology : Environmental , Health
and Safety Assessment,” pp. 1–50, 2013.
[8] PV Cycle Association, “Annual Report PV CYCLE 2015,” 2015.
[9] “PV Cycle R&D Projects.” [Online]. Available:
http://www.pvcycle.org/organisation/our-rd-projects/.
[10] “EPA Method 1311 - Toxicity Characteristic Leaching Procedure” no. July 1992,
pp. 1–35.