Embed Size (px)
Citation preview

Physics 1021Experiment 21
Standing Waves

Physics 1021Experiment 22 Standing Waves
Introduction
In this experiment you will determine the mass per unit length of a piece of string. To do this, you will produce standing waves on a string and measure the wavelength as a function of tension for a given frequency. You will then analyze your data to determine the mass per unit length of the string.
Finally, you will be asked to compare this value with an accepted value for the mass per unit length of your string and determine if they agree with each other or not.

Physics 1021Experiment 23 Standing Waves
Introduction
l Waves on strings are transverse waves. When a string is vibrating at its fundamental frequency, the wave pattern looks like the one shown below.
l There is an antinode at the middle where the displacement of the string is at a maximum.
l There are nodes at the fixed ends of the strings where there is no displacement of the string.
l Knowing the frequency of the oscillation 𝑓 and the wavelength of the standing wave l, allows the calculation of the speed of the wave v on the string using the relationship 𝑣 = 𝑓𝜆 .
l The wave velocity is also given by 𝑣 = %&
� where 𝑇 is the tension in the string and
µ is the mass per unit length or linear density.
!
!

Physics 1021Experiment 24 Standing Waves
Apparatus
– Fixed frequency vibrator (either blue or black: both are shown at right)
– String– Hooked masses– Pulley with clamp– Paper– Tape– Orange triangular rulers– Meter stick
You will use the following apparatus in your experiment:

Physics 1021Experiment 25 Standing Waves
Choosing your Masses
To provide the tension in the string, masses are hung over a pulley. If we assume that the pulley is massless and frictionless, than the tension in the string will be equal to the weight 𝑊 of the hanging mass.
l If you have the blue metal type vibrator with black string:– your frequency is 120 Hz– you need to use masses of 100, 90, 80, 70 ,60, 50, 40, and 30 grams
for your experiment.
l If you have the black plastic type vibrator with yellow string:– your frequency is 60 Hz– you need to use masses of 200, 180, 160, 140, 120, 100, 80, and 60
grams.
Indicate your frequency and string colour in your lab workbook.
!
!
LW

Physics 1021Experiment 26 Standing Waves
l Assemble your apparatus as shown:– Clamp the pulley to the desktop.– Hang the string over the pulley.– Hang your largest mass, from the list on the previous slide, from the
string. Make sure the pulley wheel turns freely.– Make sure your string is level to avoid a systematic uncertainty!– Plug in the vibrator.
Experimental Setup
!

Physics 1021Experiment 27 Standing Waves
l To observe a standing wave you will need to adjust the position of the string vibrator from the pulley so the wave resonates.
l Hold the string vibrator’s position when you see a standing wave with well defined nodes and antinodes. Use as much string as possible.
QUESTION 1: Draw the standing wave you observe in your experimental setup. Clearly label the nodes and antinodes.
Data Collection
!
Q
Physics 1021Experiment 28 Standing Waves
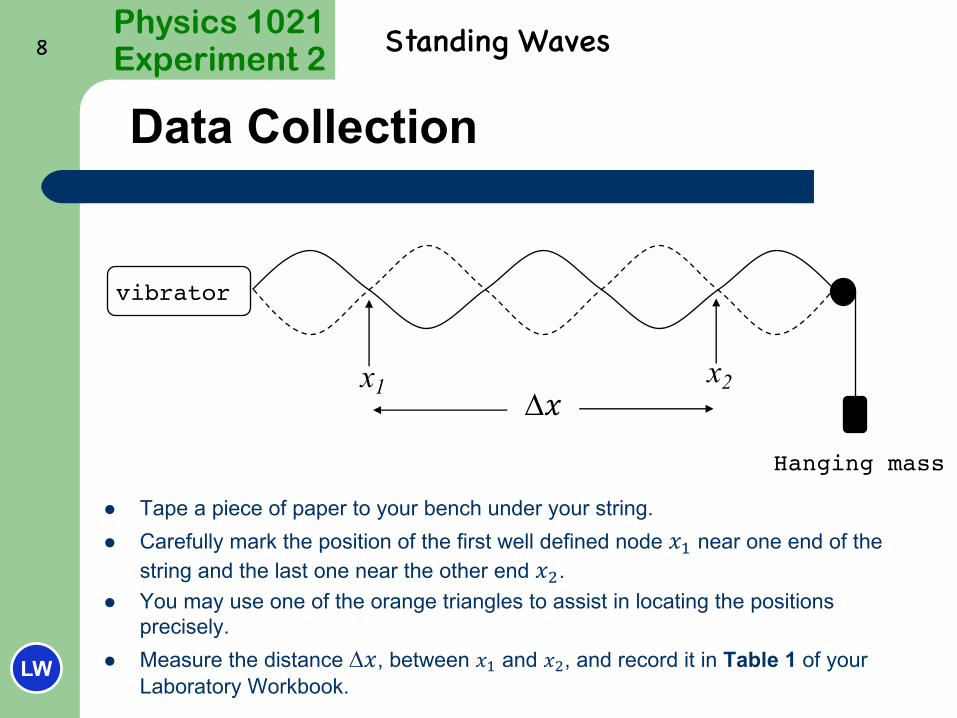
Data Collection
l Tape a piece of paper to your bench under your string.l Carefully mark the position of the first well defined node 𝑥+ near one end of the
string and the last one near the other end 𝑥,. l You may use one of the orange triangles to assist in locating the positions
precisely.l Measure the distance D𝑥, between 𝑥+ and 𝑥,, and record it in Table 1 of your
Laboratory Workbook.
Hanging mass
x1 x2
vibrator
D𝑥
LW

Physics 1021Experiment 29 Standing Waves
Data Collection
l Count the number full wavelengths between the marked nodes and record this value in Table 1.
l Use this information to determine the wavelength lof your standing wave and record your result in Table 1.
l Also record wavelength squared (l𝟐).
l Calculate the weight 𝑾, in newtons, of the hanging mass and record it in Table 1.
In the example above, there are 3/2 or 1.5 wavelengths between the indicated nodes. This shows the distance between the indicated nodes, D𝑥, equals 3/2l.
x1 x2
!
𝜆/2 𝜆/2 𝜆/2
3𝜆/2
LW
LW
LW

Physics 1021Experiment 210 Standing Waves
Data Collection
Have an instructor come check your work and initial your lab report.
l Decrease the hanging mass to the next lower value.
l Readjust the position of the vibrator to produce a standing wave.
l Repeat the previous procedure to determine the wavelength of your standing wave, recording your results in Table 1.
l Decrease the mass at the correct increments and repeat, recording your results in Table 1, until you have completed the table.
The fixed frequency vibrator may get very hot! Unplug while not in use.!
CP
LW
LW

Physics 1021Experiment 211 Standing Waves
QUESTION 2: With the string vibrator at a resonance point, determine the wavelength. You may choose any previous mass value to provide the tension. Now move the vibrator towards or away from the pulley by half of the wavelength. Explain the result.
QUESTION 3: Given the equation below, determine the expression for the slope of a graph of tension vs wavelength squared. Start by squaring both sides. Include a sketch of the expected graph.
𝜆 = +3
%&
�
This is a derivation, so symbols only, no numbers.
Expectations
!
Q
Q

Physics 1021Experiment 212 Standing Waves
Data Analysis
l Click on the icon below to launch Graphical Analysis.
l Plot Tension in the string as a function of the wavelength squared.l Click Analyze then Linear fit to obtain a regression line.l Double click the fit box which appears and click on “Show Uncertainties”.l Record your results for slope and intercept in Table 2 of your Laboratory
workbook.
Print your graph and attach it to your Laboratory workbook.
CLICK HERE CLICK HERE
!LW
P

Physics 1021Experiment 213 Standing Waves
Data Analysis
QUESTION 4: Using the slope of your graph and your results from Question 3, determine the mass per unit length of your string and its uncertainty. Write your answer in the form 𝜇 ± 𝛿𝜇.
You may assume d𝑓 = 0.
QUESTION 5: Is your answer in Question 4 equal to the expected value of mass per unit length (provided below) within the uncertainties? Comment.
𝜇89:;< = 1.42×10AB𝑘𝑔/𝑚 𝜇FG99HI = 1.50×10AK𝑘𝑔/𝑚
𝛿𝜇𝜇 = 0.03
!
Q
Q
Physics 1021Experiment 214 Standing Waves
Summary
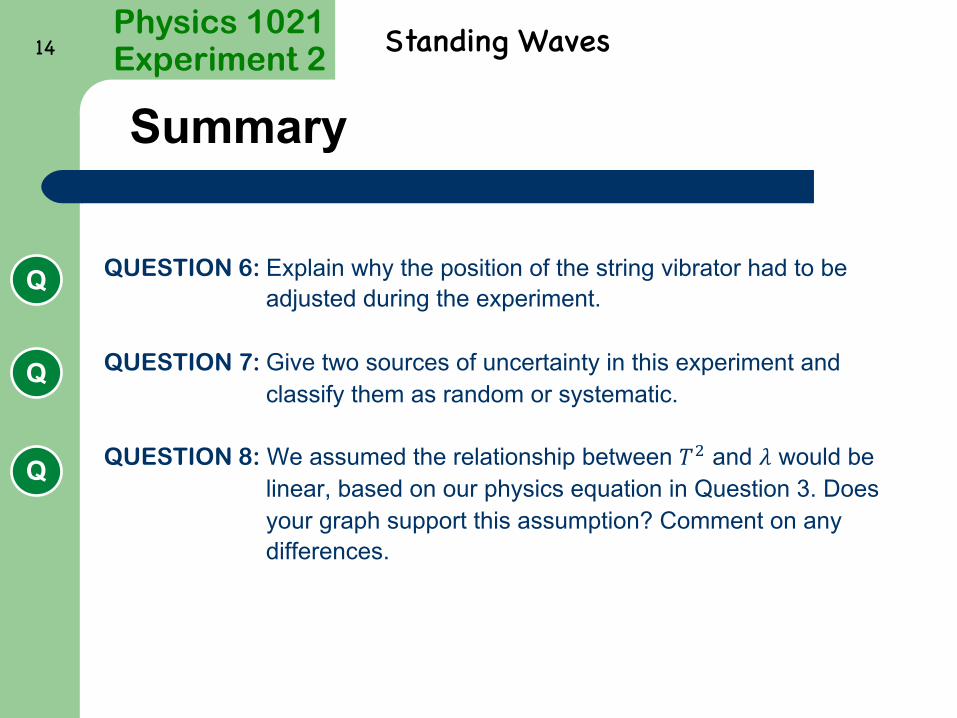
QUESTION 6: Explain why the position of the string vibrator had to be adjusted during the experiment.
QUESTION 7: Give two sources of uncertainty in this experiment and classify them as random or systematic.
QUESTION 8: We assumed the relationship between 𝑇, and 𝜆 would be linear, based on our physics equation in Question 3. Does your graph support this assumption? Comment on any differences.
Q
Q
Q

Physics 1021Experiment 215 Standing Waves
Wrap it up!
l Check that you have completed all the Tables of your Laboratory workbook.
l Make sure that you have answered all the Questions completely.
l Attach the tension vs wavelength squared graph (from Graphical Analysis) to your Laboratory workbook in the appropriate space. !