Embed Size (px)
Citation preview
Stanford Survey of Adolescent School Experiences Report Boston Latin School
7th and 8th Grades Winter 2017
*Data analysis and report writing for School Experiences Survey is a collaborative effort among members of the Challenge Success research team, including Denise Pope, Sarah Miles, Margaret Dunlap, Gail Shen, and Jerusha Conner.
© 2017 Challenge Success 2
Glossary of Terms Mean: The average Standard Deviation (“SD”): The amount of variability/spread in students’ answers; the larger the deviation, the greater the spread Minimum: The lowest response given by student participants Maximum: The highest response given by student participants Analysis of Variance (ANOVA): Analysis to determine whether groups of students have different mean scores. Grouping variables here included gender, grade-level, and ethnicity. Significant Group Difference: A difference among two or more groups that cannot be accounted for by chance (i.e., very high likelihood that two or more group means actually differ from each other). Correlation (“r”): The relationship between 2 variables; a correlation will always fall between -1 and 1. A negative “r” indicates a negative relationship (e.g., students’ perception of high teacher support is related to their decreased cheating); A positive “r” indicates a positive relationship (e.g., students’ perception of high teacher support is related to their increased enjoyment of schoolwork). The larger the absolute value of “r”, the stronger the relationship Cheating Behavior: This scale includes a total of 13 items and measures whether students have engaged in various forms of cheating behavior. Sample items include: Since coming to this school, how often have you gotten answers or questions from someone who has already taken the test?; Since coming to this school, how often have you copied material almost word for word from any source and turned it in as your own? The students rated all 13 items from 1=Never to 4=More than three times. Note: With the exception of the physical health scale, the cheating scale and all of the remaining scales below were created by calculating a mean score for each participant on the scale’s items. For example, for the cheating scale, each student has a cheating behavior score, which is the mean of the 13 cheating items. Academic Engagement: Eleven items were used to measure academic engagement. These items asked how often students enjoyed schoolwork, gave effort in school, and found value and meaning in their work. The rating scale for these items was 1=Never to 5=Always. Academic Worries: The academic worries scale asked students to report how much they worry about academic-related issues. For example: How often do you worry about taking tests? How much pressure do you feel to do well in school?; How much do you
© 2017 Challenge Success 3
worry that if you do not do well in school, your friends will not accept you?; How much do you worry about the possibility of not getting into a good college. There were a total of 9 items on this scale, rated from 1=None to 5=A lot. Physical Health: We asked students to report whether they had or had not experienced a set of stress-related physical symptoms in the 30 days prior to the survey including: headaches, exhaustion, weight loss, weight gain, sweating, difficulty sleeping, and stomach problems. We then summed each student’s responses to get a total physical health score. Teacher Care and Support: This scale included 9 items to measure students’ perceptions of teacher care and support. Sample items include: How many of your teachers value and listen to students’ ideas? How many of your teachers are willing to help you on homework? Students selected an answer from 1= None to 5=All. Parent Expectations: This scale included 2 items, which asked students to share the extent to which they feel they can meet their parents’ academic expectations of them. Students responded from 1= not at all able to meet their expectations to 5= are able to meet their expectations. Parent Mastery and Performance Goals: These scales included 6 items, which asked students to share how important it is to their parents that they give maximum effort, challenge themselves and deeply learn material (all mastery goals). And, how important it is to their parents that they are the best at everything, do well compared to others, and worry about getting bad grades (all performance goals). Students responded from 1=not at all important to 5=very important.
© 2017 Challenge Success 4
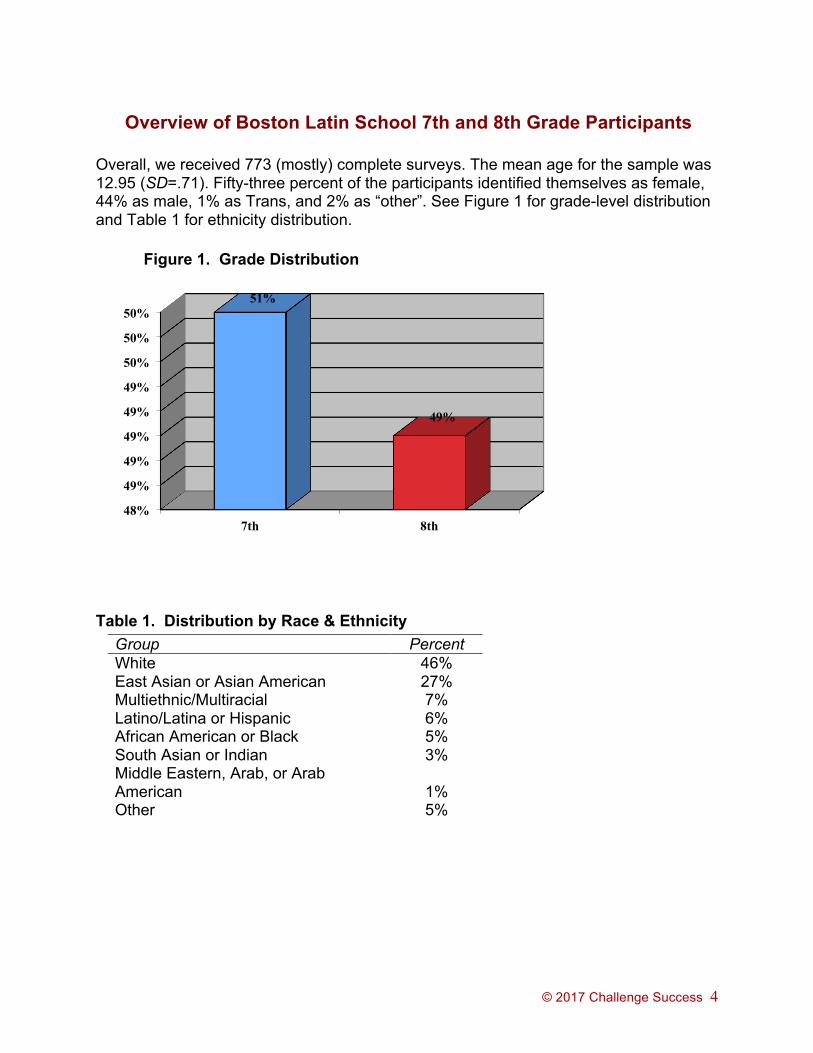
Overview of Boston Latin School 7th and 8th Grade Participants Overall, we received 773 (mostly) complete surveys. The mean age for the sample was 12.95 (SD=.71). Fifty-three percent of the participants identified themselves as female, 44% as male, 1% as Trans, and 2% as “other”. See Figure 1 for grade-level distribution and Table 1 for ethnicity distribution.
Figure 1. Grade Distribution
Table 1. Distribution by Race & Ethnicity
48%
49%
49%
49%
49%
49%
50%
50%
50%
7th 8th
51%
49%
Group Percent White 46% East Asian or Asian American 27% Multiethnic/Multiracial 7% Latino/Latina or Hispanic 6% African American or Black 5% South Asian or Indian 3% Middle Eastern, Arab, or Arab American
1%
Other 5%

© 2017 Challenge Success 5
How Students Spend Their Time We asked students how much time during weekdays and weekends they spent in various activities, including time spent on school-assigned and non-school-assigned homework (e.g. language or religious school homework, tutoring homework), extracurricular activities, and using the computer/cell phone for recreational purposes (Instagram, email, Snapchat, etc.) We asked how they perceived the level of homework they had and how and why they participated in certain activities.
Time Spent on Homework On average, students reported doing between 0 and 7 hours of school-assigned homework per weekday night (mean =2.85, median = 2.85, SD =1.44) and between 0 and 7 hours of school-assigned homework on a typical Saturday or Sunday (mean =2.71, median = 2.50, SD =1.61). On average, students reported doing between 0 and 7 hours of non-school-assigned homework per weekday night (mean=.76, median = .25, SD = 1.30) and 0 to 7 hours of non-school-assigned homework on a typical Saturday or Sunday (mean=1.36, median = .25, SD=2.14). Grade-level differences are shown in Table 2 below. Table 2. Average Time (in hours) Spent on HW during School Week and Weekend
7th 8th
Weekday school-assigned homework
2.95
(1.47)
2.72
(1.37) Weekend school-assigned homework
2.72 (1.56)
2.67 (1.65)
Weekday NON-school-assigned homework
.65
(1.11)
.87
(1.46)
Weekend NON-school-assigned homework
1.27
(2.07)
1.41
(2.18) *The numbers in parentheses are standard deviations
© 2017 Challenge Success 6
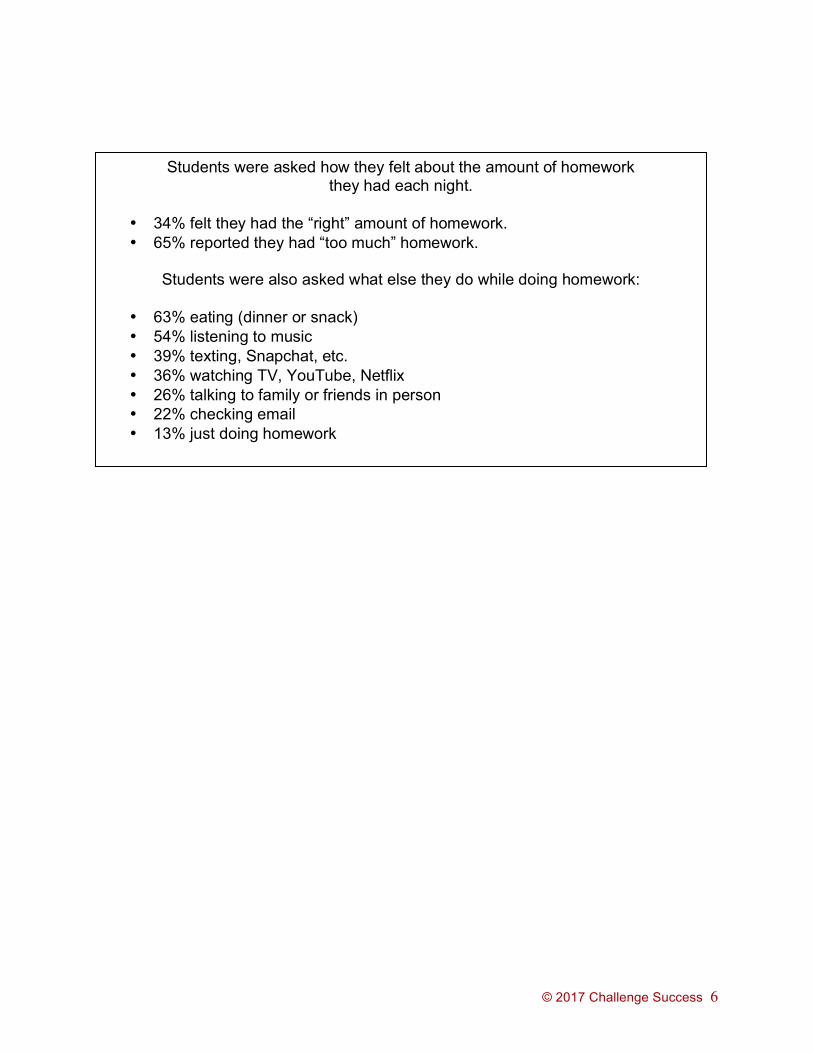
Students were asked how they felt about the amount of homework they had each night.
• 34% felt they had the “right” amount of homework. • 65% reported they had “too much” homework.
Students were also asked what else they do while doing homework:
• 63% eating (dinner or snack) • 54% listening to music • 39% texting, Snapchat, etc. • 36% watching TV, YouTube, Netflix • 26% talking to family or friends in person • 22% checking email • 13% just doing homework
© 2017 Challenge Success 7
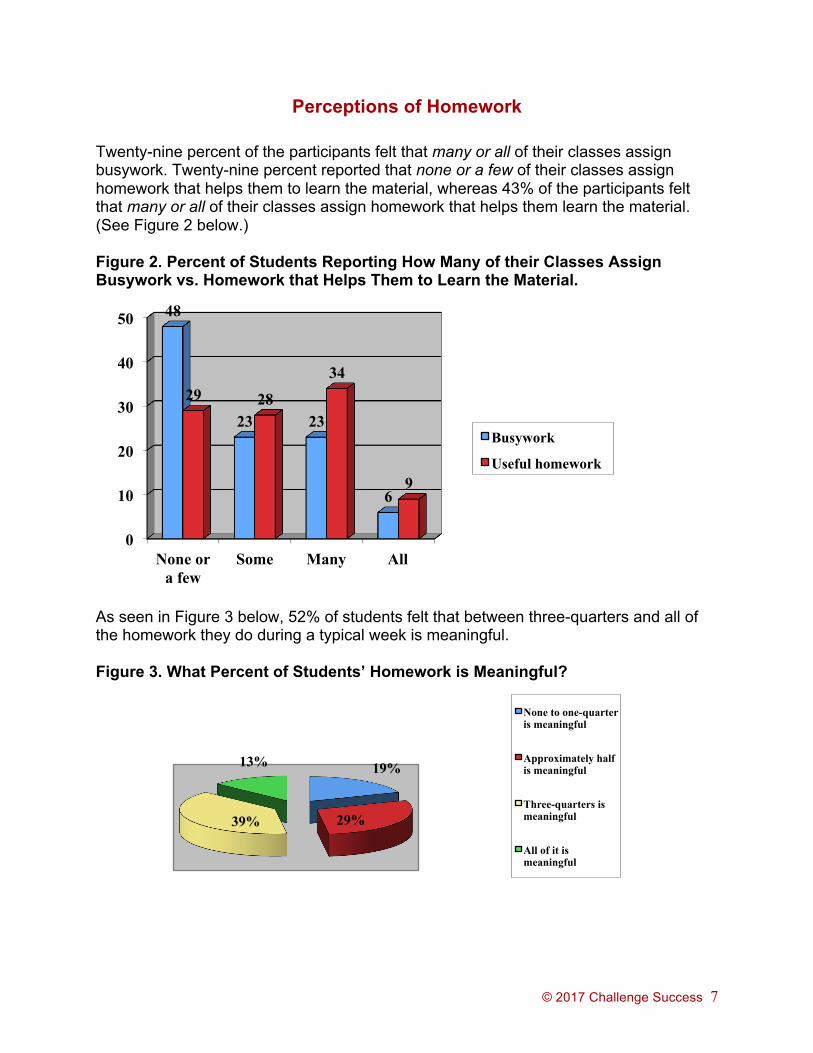
Perceptions of Homework Twenty-nine percent of the participants felt that many or all of their classes assign busywork. Twenty-nine percent reported that none or a few of their classes assign homework that helps them to learn the material, whereas 43% of the participants felt that many or all of their classes assign homework that helps them learn the material. (See Figure 2 below.) Figure 2. Percent of Students Reporting How Many of their Classes Assign Busywork vs. Homework that Helps Them to Learn the Material.
As seen in Figure 3 below, 52% of students felt that between three-quarters and all of the homework they do during a typical week is meaningful. Figure 3. What Percent of Students’ Homework is Meaningful?
0
10
20
30
40
50
None or a few
Some Many All
48
23 23
6
29 28
34
9
Busywork
Useful homework
19%
29% 39%
13%
None to one-quarter is meaningful
Approximately half is meaningful
Three-quarters is meaningful
All of it is meaningful
© 2017 Challenge Success 8
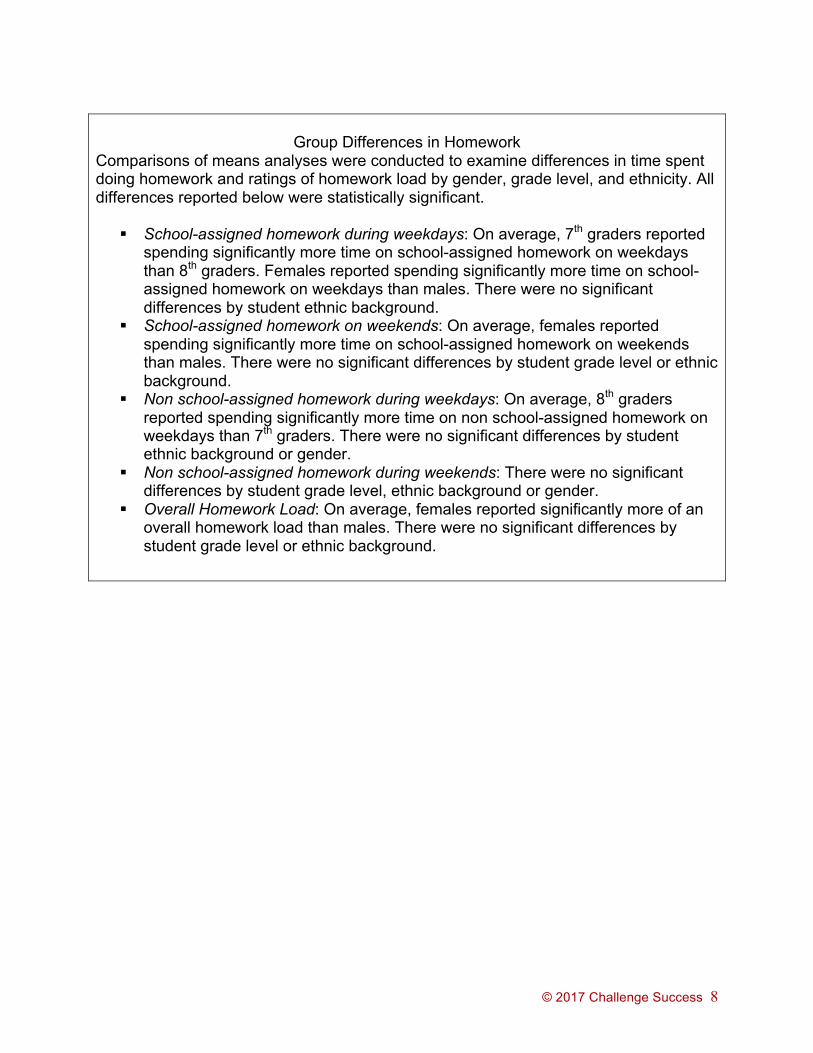
Group Differences in Homework Comparisons of means analyses were conducted to examine differences in time spent doing homework and ratings of homework load by gender, grade level, and ethnicity. All differences reported below were statistically significant.
§ School-assigned homework during weekdays: On average, 7th graders reported spending significantly more time on school-assigned homework on weekdays than 8th graders. Females reported spending significantly more time on school-assigned homework on weekdays than males. There were no significant differences by student ethnic background.
§ School-assigned homework on weekends: On average, females reported spending significantly more time on school-assigned homework on weekends than males. There were no significant differences by student grade level or ethnic background.
§ Non school-assigned homework during weekdays: On average, 8th graders reported spending significantly more time on non school-assigned homework on weekdays than 7th graders. There were no significant differences by student ethnic background or gender.
§ Non school-assigned homework during weekends: There were no significant differences by student grade level, ethnic background or gender.
§ Overall Homework Load: On average, females reported significantly more of an overall homework load than males. There were no significant differences by student grade level or ethnic background.
© 2017 Challenge Success 9
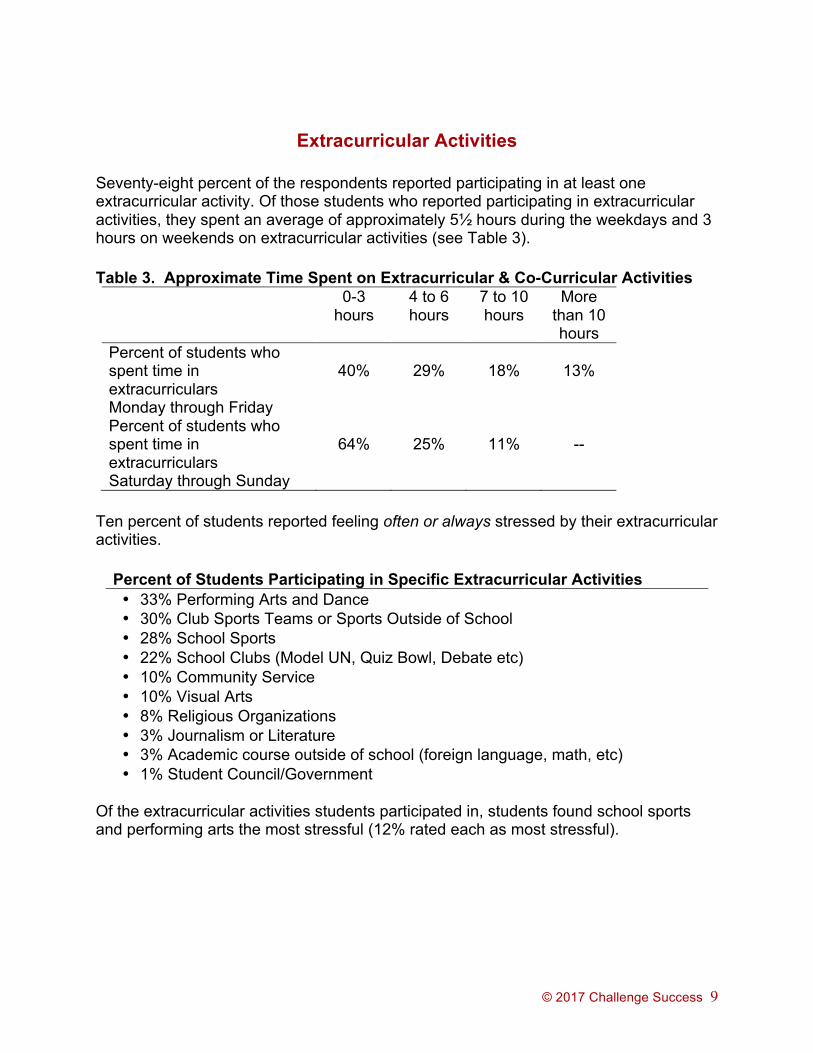
Extracurricular Activities Seventy-eight percent of the respondents reported participating in at least one extracurricular activity. Of those students who reported participating in extracurricular activities, they spent an average of approximately 5½ hours during the weekdays and 3 hours on weekends on extracurricular activities (see Table 3). Table 3. Approximate Time Spent on Extracurricular & Co-Curricular Activities
0-3 hours
4 to 6 hours
7 to 10 hours
More than 10 hours
Percent of students who spent time in extracurriculars Monday through Friday
40%
29%
18%
13%
Percent of students who spent time in extracurriculars Saturday through Sunday
64%
25%
11%
--
Ten percent of students reported feeling often or always stressed by their extracurricular activities.
Percent of Students Participating in Specific Extracurricular Activities • 33% Performing Arts and Dance • 30% Club Sports Teams or Sports Outside of School • 28% School Sports • 22% School Clubs (Model UN, Quiz Bowl, Debate etc) • 10% Community Service • 10% Visual Arts • 8% Religious Organizations • 3% Journalism or Literature • 3% Academic course outside of school (foreign language, math, etc) • 1% Student Council/Government
Of the extracurricular activities students participated in, students found school sports and performing arts the most stressful (12% rated each as most stressful).

© 2017 Challenge Success 10
Why Students are Participating in Extracurricular Activities
• 70% chose enjoyment as the primary reason for participating in an
extracurricular activity. • 9% chose resume-building (“looks good on high school or college
applications”) as the primary reason for participating in an extracurricular activity.
• 7% chose that their “parents/guardians want them to” as the primary reason for participating in extracurricular activities.
• 5% chose that “I can hang out with my friends” as the primary reason for participating in an extracurricular activity.
• 3% chose learning new things as the primary reason for participating in an extracurricular activity.
27% report that it is quite or extremely important to their parents that they
are successful in their extracurricular activities.
Group Differences in Extracurricular Activities
Comparisons of means group differences in time spent doing extracurricular activities during the weekdays and weekends were analyzed.
• On average, 8th graders reported spending significantly more time participating in extracurriculars on weekdays than 7th graders. There were no significant differences in time spent participating in extracurriculars on weekends by student grade level.
• There were no significant differences by student ethnic background or gender.
© 2017 Challenge Success 11
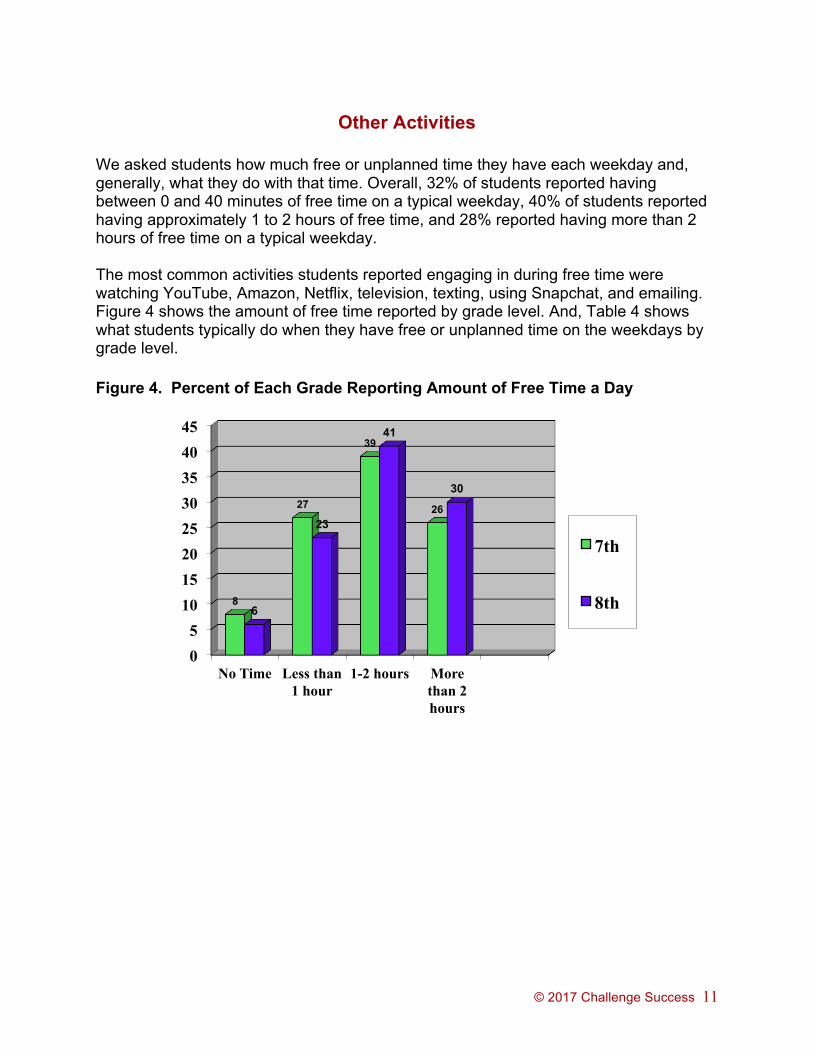
Other Activities We asked students how much free or unplanned time they have each weekday and, generally, what they do with that time. Overall, 32% of students reported having between 0 and 40 minutes of free time on a typical weekday, 40% of students reported having approximately 1 to 2 hours of free time, and 28% reported having more than 2 hours of free time on a typical weekday. The most common activities students reported engaging in during free time were watching YouTube, Amazon, Netflix, television, texting, using Snapchat, and emailing. Figure 4 shows the amount of free time reported by grade level. And, Table 4 shows what students typically do when they have free or unplanned time on the weekdays by grade level. Figure 4. Percent of Each Grade Reporting Amount of Free Time a Day
0 5
10 15 20 25 30 35 40 45
No Time Less than 1 hour
1-2 hours More than 2 hours
8
27
39
26
6
23
41
30
7th
8th
© 2017 Challenge Success 12
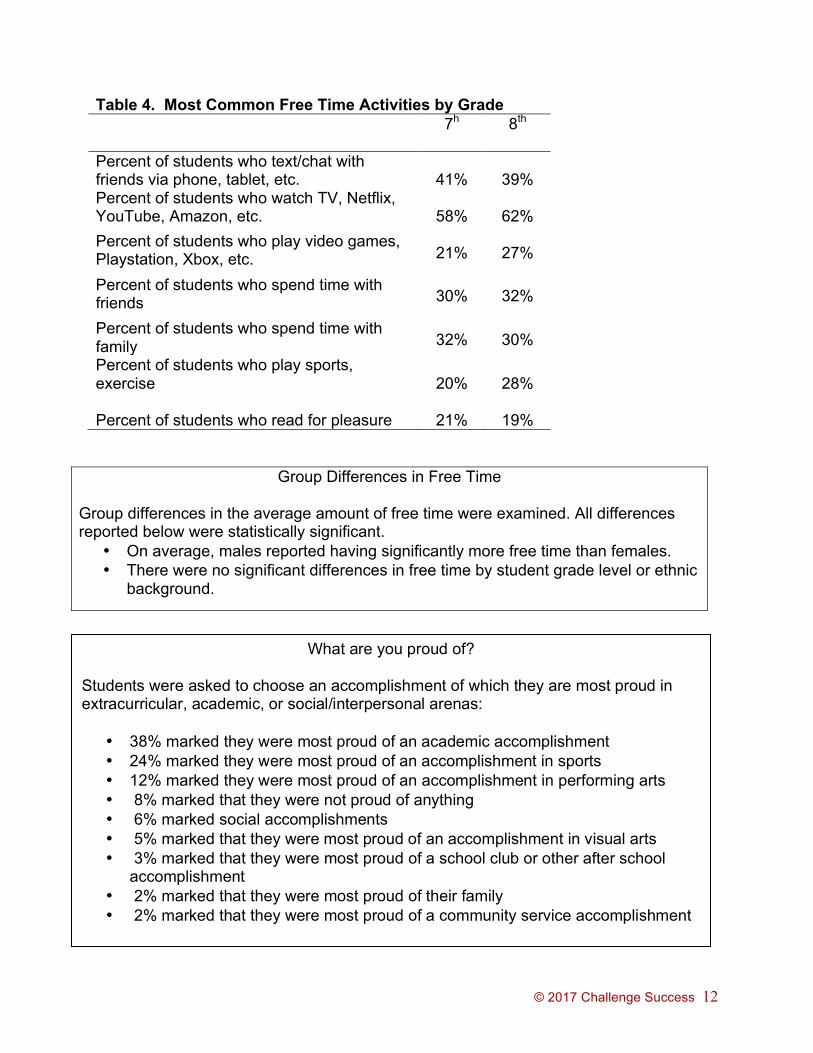
Table 4. Most Common Free Time Activities by Grade
7h 8th
Percent of students who text/chat with friends via phone, tablet, etc.
41%
39%
Percent of students who watch TV, Netflix, YouTube, Amazon, etc.
58%
62%
Percent of students who play video games, Playstation, Xbox, etc.
21%
27%
Percent of students who spend time with friends
30%
32%
Percent of students who spend time with family
32%
30%
Percent of students who play sports, exercise
20%
28%
Percent of students who read for pleasure
21%
19%
Group Differences in Free Time
Group differences in the average amount of free time were examined. All differences reported below were statistically significant.
• On average, males reported having significantly more free time than females. • There were no significant differences in free time by student grade level or ethnic
background.
What are you proud of? Students were asked to choose an accomplishment of which they are most proud in extracurricular, academic, or social/interpersonal arenas:
• 38% marked they were most proud of an academic accomplishment • 24% marked they were most proud of an accomplishment in sports • 12% marked they were most proud of an accomplishment in performing arts • 8% marked that they were not proud of anything • 6% marked social accomplishments • 5% marked that they were most proud of an accomplishment in visual arts • 3% marked that they were most proud of a school club or other after school
accomplishment • 2% marked that they were most proud of their family • 2% marked that they were most proud of a community service accomplishment
© 2017 Challenge Success 13
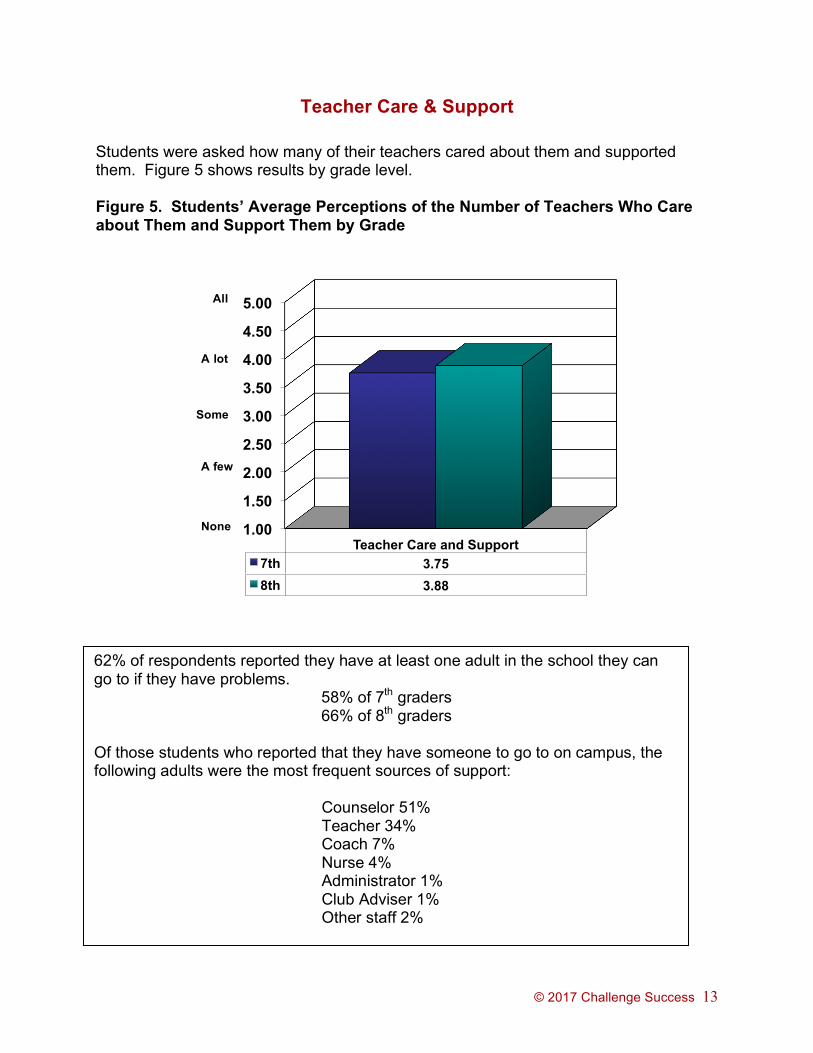
Teacher Care & Support
Students were asked how many of their teachers cared about them and supported them. Figure 5 shows results by grade level. Figure 5. Students’ Average Perceptions of the Number of Teachers Who Care about Them and Support Them by Grade
1.00
1.50
2.00
2.50
3.00
3.50
4.00
4.50
5.00
Teacher Care and Support 7th 3.75 8th 3.88
62% of respondents reported they have at least one adult in the school they can go to if they have problems.
58% of 7th graders 66% of 8th graders
Of those students who reported that they have someone to go to on campus, the following adults were the most frequent sources of support:
Counselor 51% Teacher 34% Coach 7% Nurse 4% Administrator 1% Club Adviser 1% Other staff 2%
All
A lot
Some
A few
None

© 2017 Challenge Success 14
Group differences in Teacher Care and Support Group differences in the mean amount of teacher support were examined.
• On average, 8th graders reported significantly more teachers supported them than 7th graders.
• On average, males reported significantly more teachers supported them than females.
• There were no significant differences in teacher support by student ethnic background.
© 2017 Challenge Success 15
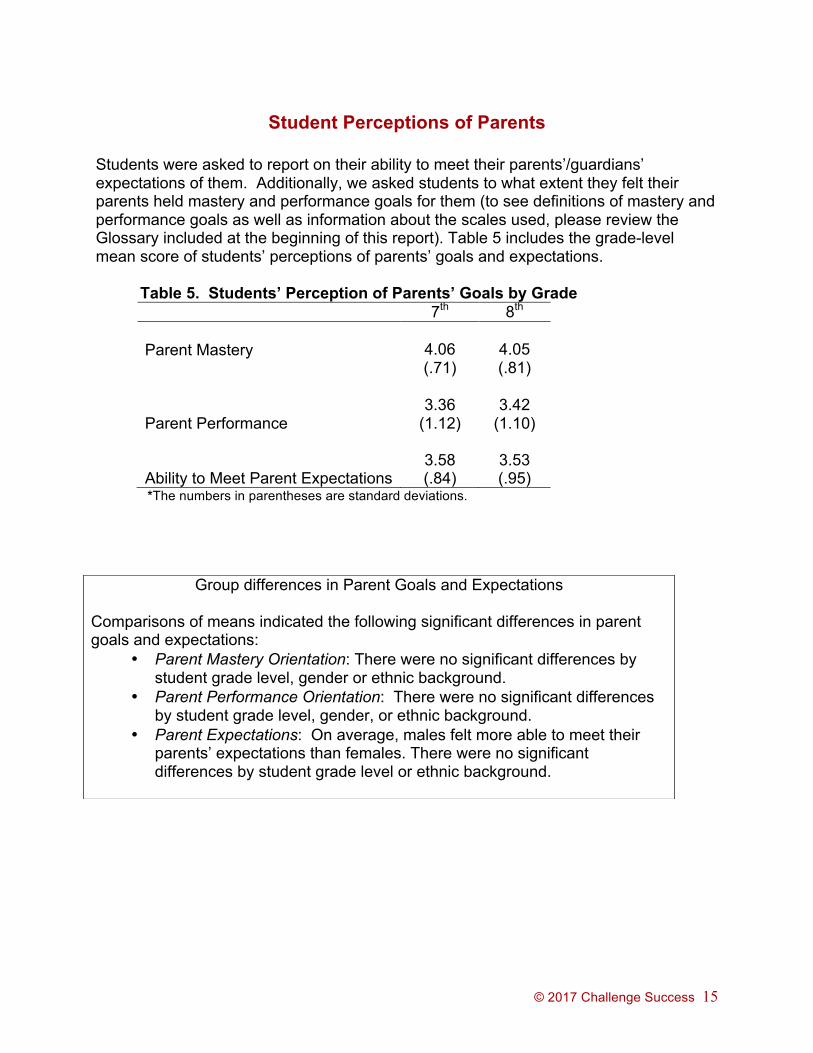
Student Perceptions of Parents Students were asked to report on their ability to meet their parents’/guardians’ expectations of them. Additionally, we asked students to what extent they felt their parents held mastery and performance goals for them (to see definitions of mastery and performance goals as well as information about the scales used, please review the Glossary included at the beginning of this report). Table 5 includes the grade-level mean score of students’ perceptions of parents’ goals and expectations. Table 5. Students’ Perception of Parents’ Goals by Grade
7th 8th Parent Mastery
4.06 (.71)
4.05 (.81)
Parent Performance
3.36
(1.12)
3.42
(1.10)
Ability to Meet Parent Expectations
3.58 (.84)
3.53 (.95)
*The numbers in parentheses are standard deviations.
Group differences in Parent Goals and Expectations
Comparisons of means indicated the following significant differences in parent goals and expectations:
• Parent Mastery Orientation: There were no significant differences by student grade level, gender or ethnic background.
• Parent Performance Orientation: There were no significant differences by student grade level, gender, or ethnic background.
• Parent Expectations: On average, males felt more able to meet their parents’ expectations than females. There were no significant differences by student grade level or ethnic background.

© 2017 Challenge Success 16
Sleep Research recommends that adolescents 13 years or older get between 9 and 9 ½ hours of sleep per night and adolescents younger than 13 years get at least 10 hours of sleep per night in order to maintain health. On average, students reported getting a little less than 7 hours of sleep per night (minimum hours reported= less than 3 hours, maximum= 12 hours, median=7 hours, SD=1.38). See Figure 6. 40% of students reported going to bed at 11:00 pm or later.
Figure 6. Average Hours of Sleep by Grade Level on a Typical School Night
6.76
6.97
9.25
10.00
0 2 4 6 8 10 12
Mean hours
Recommended for <13 years
Recommended for ≥ 13 years
7th
8th

© 2017 Challenge Success 17
Group Differences in Student Sleep In comparisons of means, the following significant group differences were found:
• On average, 7th graders reported getting significantly more sleep than 8th graders.
• On average, males reported getting significantly more sleep than females. • There were no significant differences in the amount of sleep by student ethnic
background.
© 2017 Challenge Success 18
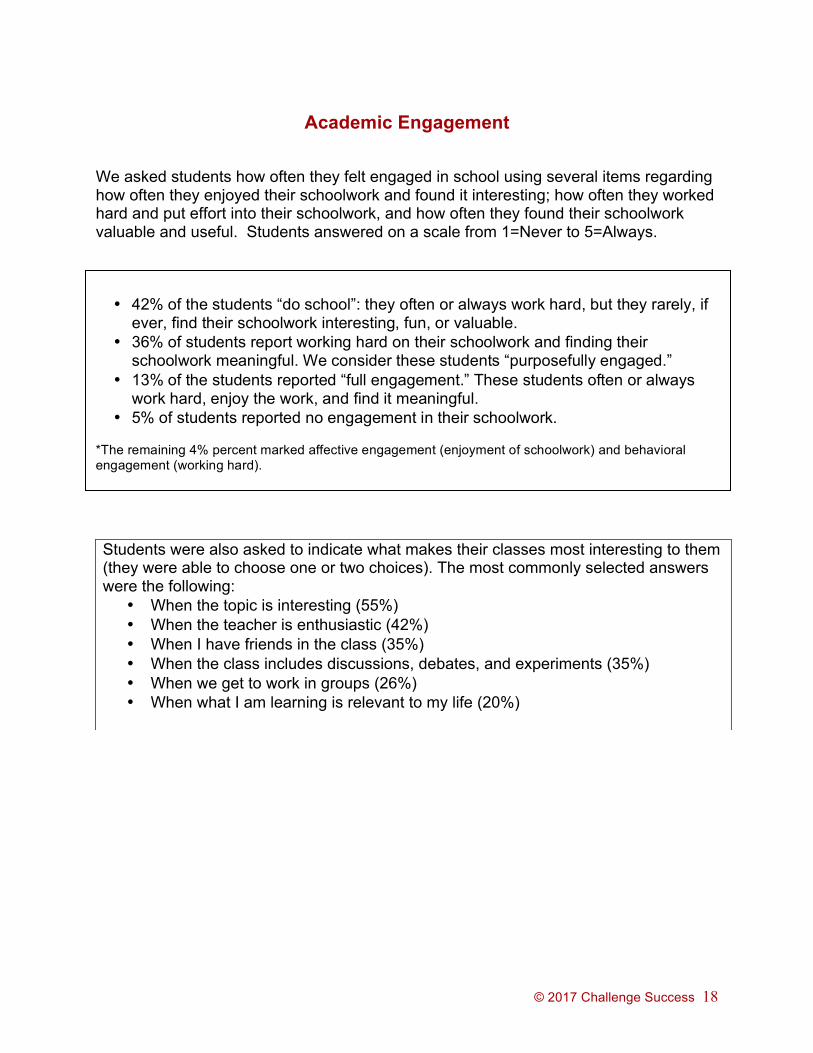
Academic Engagement
We asked students how often they felt engaged in school using several items regarding how often they enjoyed their schoolwork and found it interesting; how often they worked hard and put effort into their schoolwork, and how often they found their schoolwork valuable and useful. Students answered on a scale from 1=Never to 5=Always.
Students were also asked to indicate what makes their classes most interesting to them (they were able to choose one or two choices). The most commonly selected answers were the following:
• When the topic is interesting (55%) • When the teacher is enthusiastic (42%) • When I have friends in the class (35%) • When the class includes discussions, debates, and experiments (35%) • When we get to work in groups (26%) • When what I am learning is relevant to my life (20%)
• 42% of the students “do school”: they often or always work hard, but they rarely, if
ever, find their schoolwork interesting, fun, or valuable. • 36% of students report working hard on their schoolwork and finding their
schoolwork meaningful. We consider these students “purposefully engaged.” • 13% of the students reported “full engagement.” These students often or always
work hard, enjoy the work, and find it meaningful. • 5% of students reported no engagement in their schoolwork.
*The remaining 4% percent marked affective engagement (enjoyment of schoolwork) and behavioral engagement (working hard).
© 2017 Challenge Success 19
Group differences in Student Academic Engagement In a comparison of mean differences the following results were indicated:
• Behavioral Engagement: On average, 7th graders reported significantly more behavioral engagement than 8th graders. Females reported significantly more behavioral engagement than males. There were no significant differences by student ethnic background.
• Affective Engagement: On average, males reported significantly more affective engagement than females. There were no significant differences by student grade level or ethnic background.
• Cognitive Engagement: On average, males reported significantly more cognitive engagement than females. There were no significant differences by student grade level or ethnic background.
What factors are associated with student engagement?
We found that all three dimensions of student engagement are significantly correlated with the following factors:
• Physical stress symptoms: the more engaged students are, the less likely they are
to report physical stress symptoms. • Teacher support: the more teacher support students report, the more fully
engaged they are likely to be in school. • Sleep: the more sleep students get, the more likely they are to be fully engaged in
school. • Parent mastery: the more likely students are to report their parents as mastery
oriented, the more likely they are to be fully engaged in school. • Parent expectations: the more students feel they are able to meet their parents’
expectations, the more likely they are fully engaged in school. • Cheating: the more engaged students are, the less likely they are to report
cheating.
© 2017 Challenge Success 20
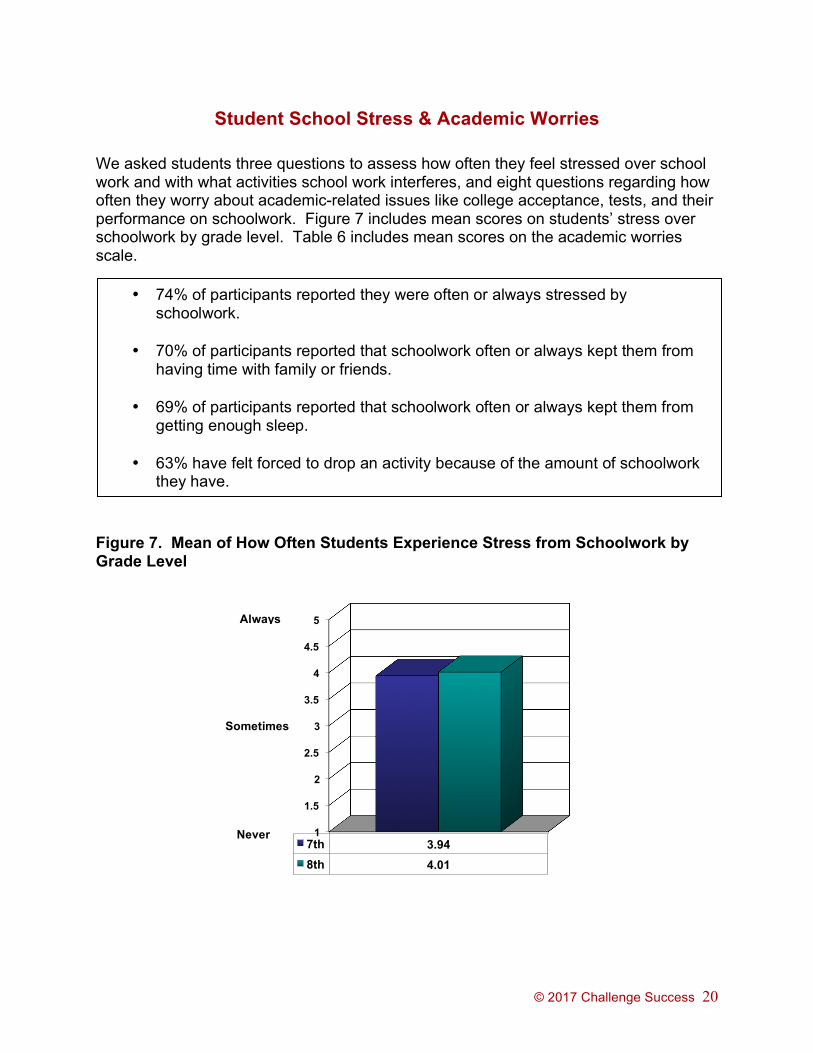
Student School Stress & Academic Worries We asked students three questions to assess how often they feel stressed over school work and with what activities school work interferes, and eight questions regarding how often they worry about academic-related issues like college acceptance, tests, and their performance on schoolwork. Figure 7 includes mean scores on students’ stress over schoolwork by grade level. Table 6 includes mean scores on the academic worries scale.
Figure 7. Mean of How Often Students Experience Stress from Schoolwork by Grade Level
• 74% of participants reported they were often or always stressed by schoolwork.
• 70% of participants reported that schoolwork often or always kept them from
having time with family or friends.
• 69% of participants reported that schoolwork often or always kept them from getting enough sleep.
• 63% have felt forced to drop an activity because of the amount of schoolwork
they have.
1
1.5
2
2.5
3
3.5
4
4.5
5
7th 3.94 8th 4.01
Sometimes
Never
Always
© 2017 Challenge Success 21
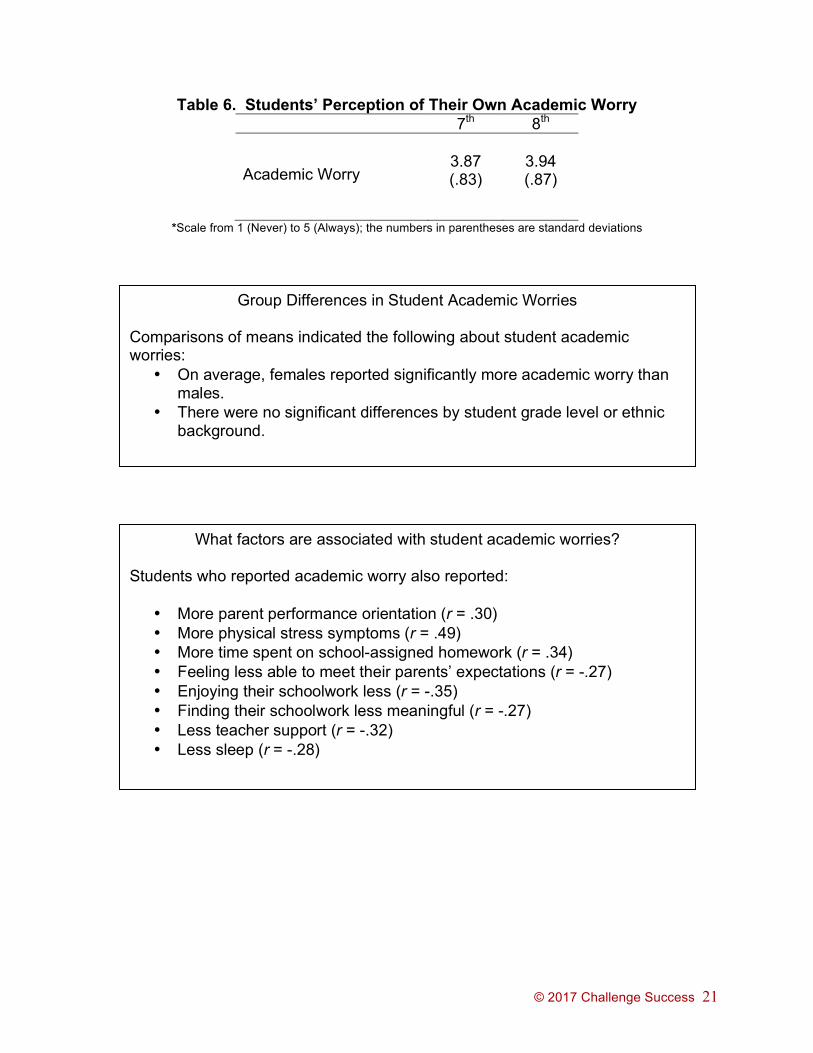
Table 6. Students’ Perception of Their Own Academic Worry 7th 8th
Academic Worry
3.87 (.83)
3.94 (.87)
*Scale from 1 (Never) to 5 (Always); the numbers in parentheses are standard deviations
What factors are associated with student academic worries? Students who reported academic worry also reported:
• More parent performance orientation (r = .30) • More physical stress symptoms (r = .49) • More time spent on school-assigned homework (r = .34) • Feeling less able to meet their parents’ expectations (r = -.27) • Enjoying their schoolwork less (r = -.35) • Finding their schoolwork less meaningful (r = -.27) • Less teacher support (r = -.32) • Less sleep (r = -.28)
Group Differences in Student Academic Worries Comparisons of means indicated the following about student academic worries:
• On average, females reported significantly more academic worry than males.
• There were no significant differences by student grade level or ethnic background.
© 2017 Challenge Success 22
Student Health & Well-Being
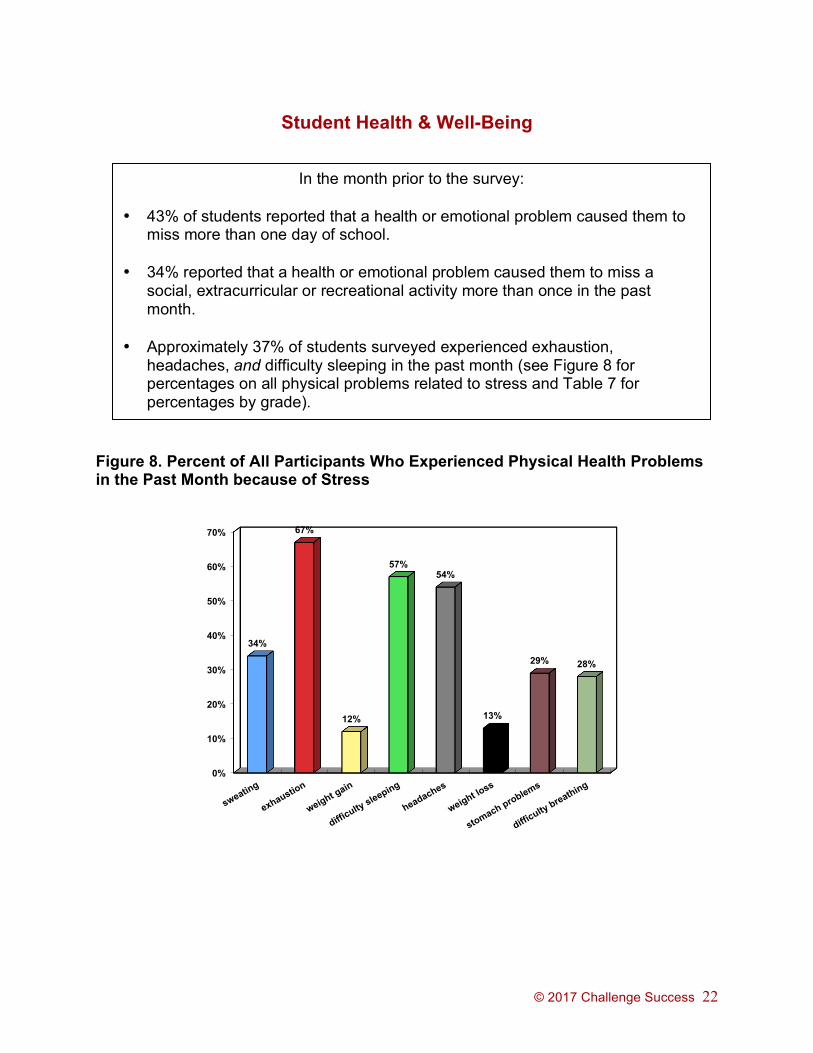
Figure 8. Percent of All Participants Who Experienced Physical Health Problems in the Past Month because of Stress
0%
10%
20%
30%
40%
50%
60%
70%
34%
67%
12%
57% 54%
13%
29% 28%
In the month prior to the survey: • 43% of students reported that a health or emotional problem caused them to
miss more than one day of school. • 34% reported that a health or emotional problem caused them to miss a
social, extracurricular or recreational activity more than once in the past month.
• Approximately 37% of students surveyed experienced exhaustion,
headaches, and difficulty sleeping in the past month (see Figure 8 for percentages on all physical problems related to stress and Table 7 for percentages by grade).
© 2017 Challenge Success 23
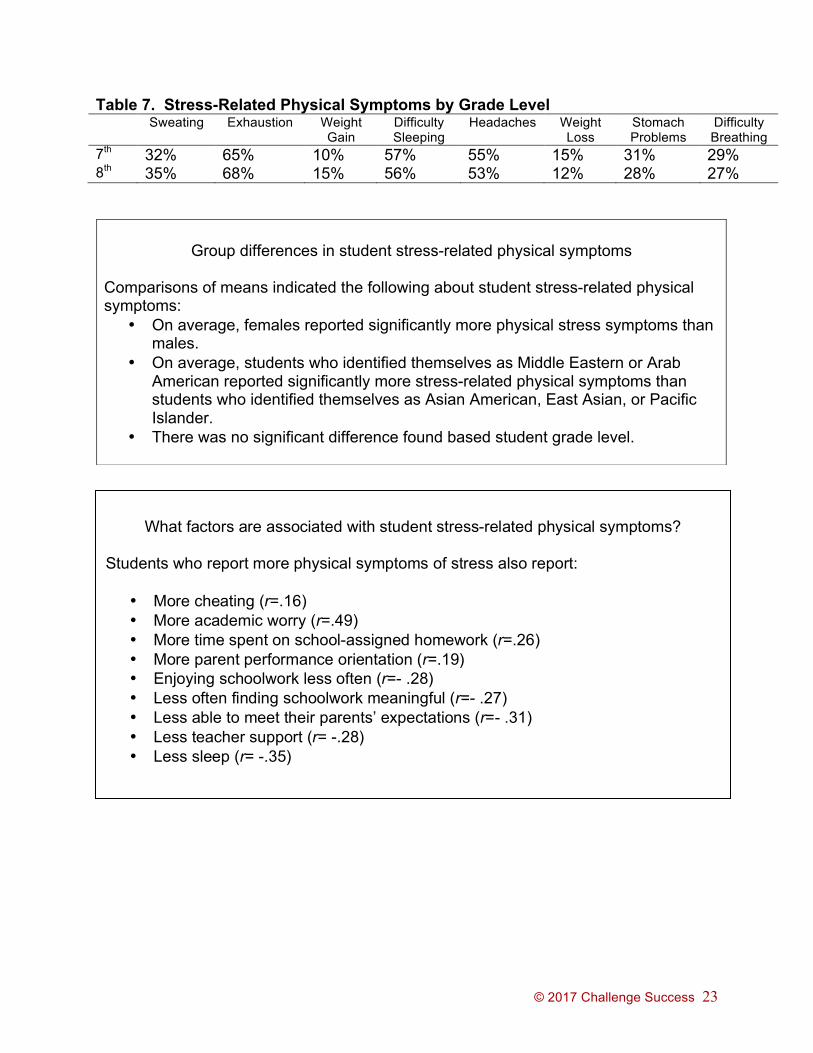
Table 7. Stress-Related Physical Symptoms by Grade Level Sweating Exhaustion Weight
Gain Difficulty Sleeping
Headaches Weight Loss
Stomach Problems
Difficulty Breathing
7th 32% 65% 10% 57% 55% 15% 31% 29% 8th 35% 68% 15% 56% 53% 12% 28% 27%
Group differences in student stress-related physical symptoms
Comparisons of means indicated the following about student stress-related physical symptoms:
• On average, females reported significantly more physical stress symptoms than males.
• On average, students who identified themselves as Middle Eastern or Arab American reported significantly more stress-related physical symptoms than students who identified themselves as Asian American, East Asian, or Pacific Islander.
• There was no significant difference found based student grade level.
What factors are associated with student stress-related physical symptoms?
Students who report more physical symptoms of stress also report:
• More cheating (r=.16) • More academic worry (r=.49) • More time spent on school-assigned homework (r=.26) • More parent performance orientation (r=.19) • Enjoying schoolwork less often (r=- .28) • Less often finding schoolwork meaningful (r=- .27) • Less able to meet their parents’ expectations (r=- .31) • Less teacher support (r= -.28) • Less sleep (r= -.35)
© 2017 Challenge Success 24
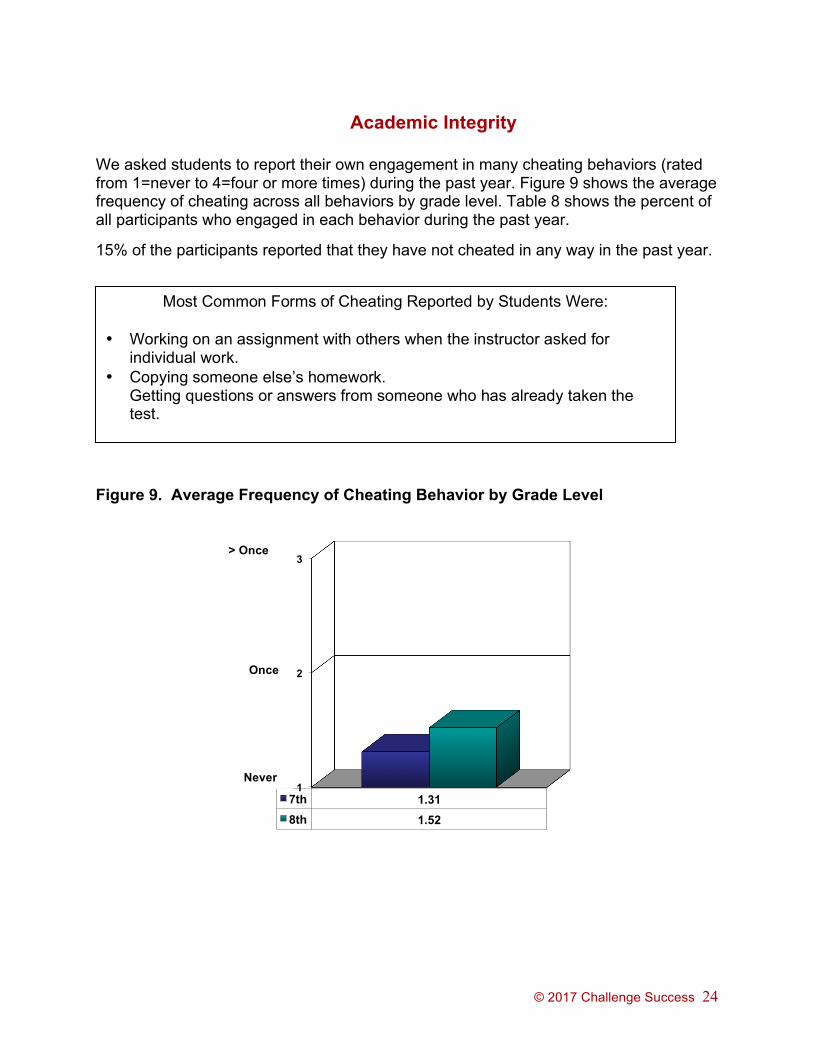
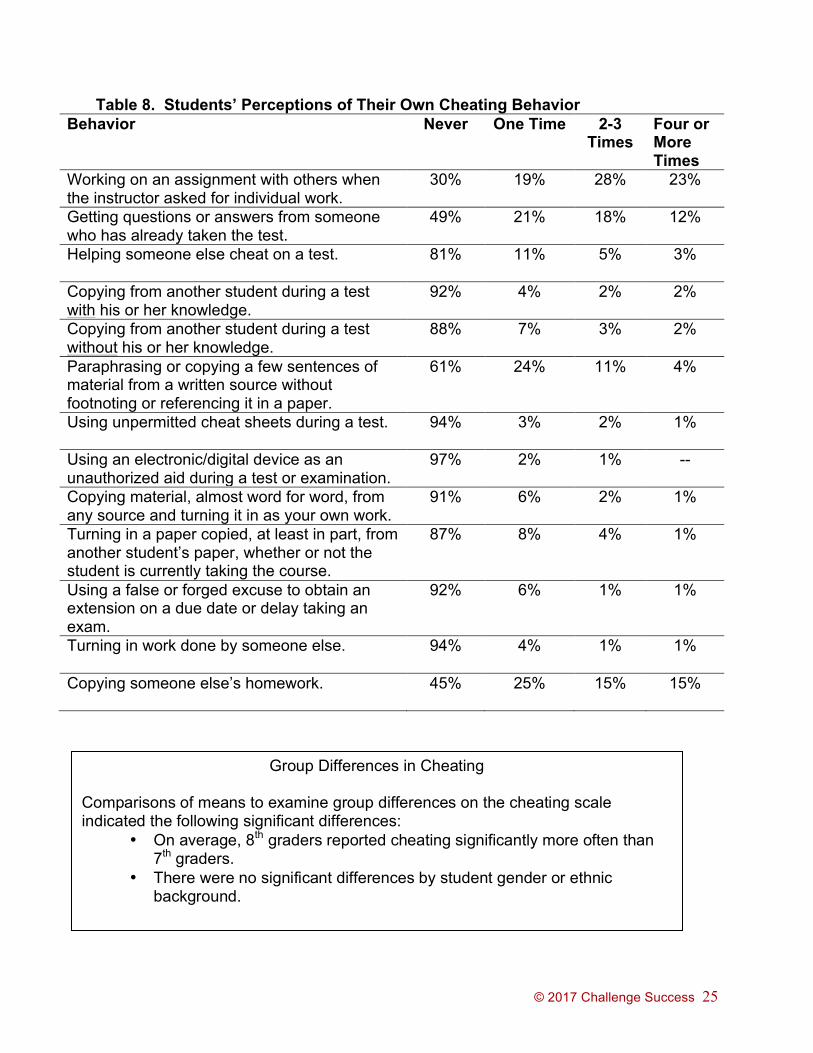
Academic Integrity We asked students to report their own engagement in many cheating behaviors (rated from 1=never to 4=four or more times) during the past year. Figure 9 shows the average frequency of cheating across all behaviors by grade level. Table 8 shows the percent of all participants who engaged in each behavior during the past year.
15% of the participants reported that they have not cheated in any way in the past year. Figure 9. Average Frequency of Cheating Behavior by Grade Level
1
2
3
7th 1.31 8th 1.52
Most Common Forms of Cheating Reported by Students Were:
• Working on an assignment with others when the instructor asked for individual work.
• Copying someone else’s homework. Getting questions or answers from someone who has already taken the test.
Once
> Once
Never
© 2017 Challenge Success 25
Table 8. Students’ Perceptions of Their Own Cheating Behavior Behavior Never One Time 2-3
Times Four or More Times
Working on an assignment with others when the instructor asked for individual work.
30% 19% 28% 23%
Getting questions or answers from someone who has already taken the test.
49% 21% 18% 12%
Helping someone else cheat on a test.
81% 11% 5% 3%
Copying from another student during a test with his or her knowledge.
92% 4% 2% 2%
Copying from another student during a test without his or her knowledge.
88% 7% 3% 2%
Paraphrasing or copying a few sentences of material from a written source without footnoting or referencing it in a paper.
61% 24% 11% 4%
Using unpermitted cheat sheets during a test. 94% 3% 2% 1%
Using an electronic/digital device as an unauthorized aid during a test or examination.
97% 2% 1% --
Copying material, almost word for word, from any source and turning it in as your own work.
91% 6% 2% 1%
Turning in a paper copied, at least in part, from another student’s paper, whether or not the student is currently taking the course.
87% 8% 4% 1%
Using a false or forged excuse to obtain an extension on a due date or delay taking an exam.
92% 6% 1% 1%
Turning in work done by someone else.
94% 4% 1% 1%
Copying someone else’s homework.
45% 25% 15% 15%
Group Differences in Cheating
Comparisons of means to examine group differences on the cheating scale indicated the following significant differences:
• On average, 8th graders reported cheating significantly more often than 7th graders.
• There were no significant differences by student gender or ethnic background.

© 2017 Challenge Success 26
What factors are associated with cheating behavior?
We found the following factors are significantly correlated with cheating behavior: Students who report cheating more often also report:
• Less able to meet their parents’ expectations (r = -.19) • Fewer teachers support them (r = -.17) • Working less hard on schoolwork (r = -.40) • Finding schoolwork less meaningful (r = -.19) • Finding schoolwork less enjoyable (r = -.23) • More physical symptoms of stress (r = .16)
© 2017 Challenge Success 27
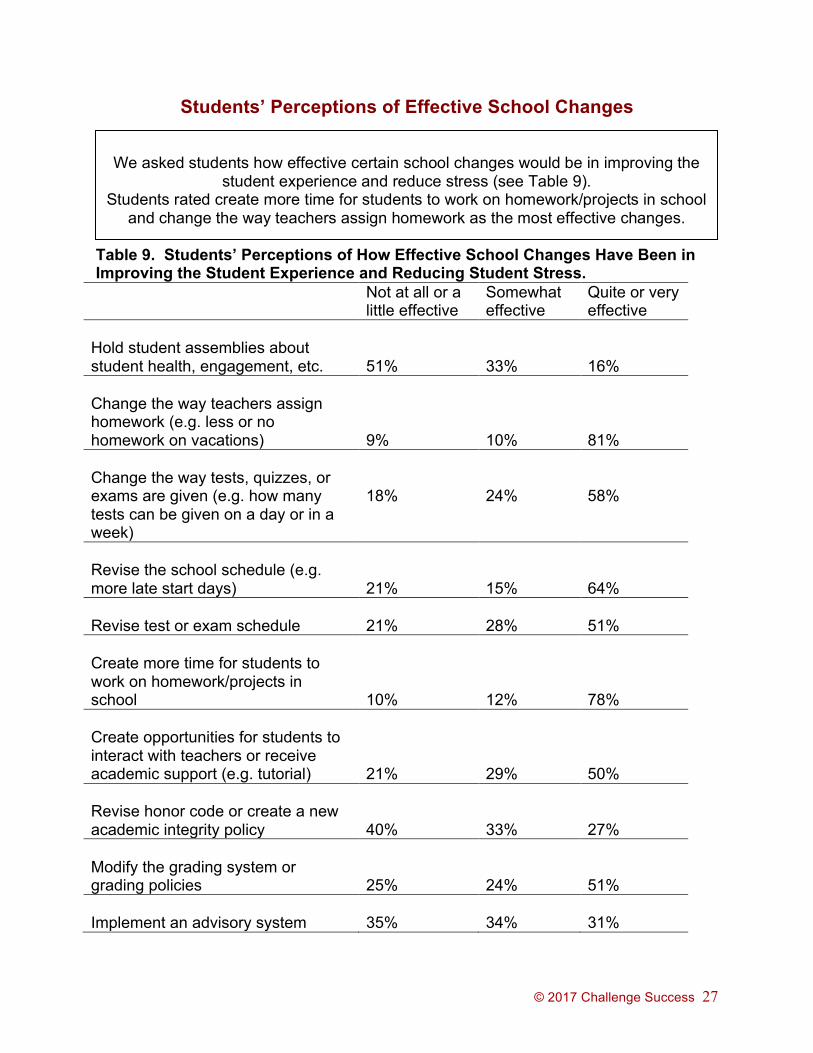
Students’ Perceptions of Effective School Changes
Table 9. Students’ Perceptions of How Effective School Changes Have Been in Improving the Student Experience and Reducing Student Stress.
Not at all or a little effective
Somewhat effective
Quite or very effective
Hold student assemblies about student health, engagement, etc.
51%
33%
16%
Change the way teachers assign homework (e.g. less or no homework on vacations)
9%
10%
81%
Change the way tests, quizzes, or exams are given (e.g. how many tests can be given on a day or in a week)
18%
24%
58%
Revise the school schedule (e.g. more late start days)
21%
15%
64%
Revise test or exam schedule
21%
28%
51%
Create more time for students to work on homework/projects in school
10%
12%
78%
Create opportunities for students to interact with teachers or receive academic support (e.g. tutorial)
21%
29%
50%
Revise honor code or create a new academic integrity policy
40%
33%
27%
Modify the grading system or grading policies
25%
24%
51%
Implement an advisory system
35%
34%
31%
We asked students how effective certain school changes would be in improving the
student experience and reduce stress (see Table 9). Students rated create more time for students to work on homework/projects in school
and change the way teachers assign homework as the most effective changes.