Embed Size (px)
Citation preview
STAR Conference 2015, Milan 25th March 2015
1
IRCE GroupIRCE Group
FYFY 20142014 Financial Results PresentationFinancial Results Presentation

STAR Conference 2015, Milan 25th March 2015
2
IRCE Group – Contents
Company Profile•Highlights
•The Businesses
•Production Plants
•Commercial Offices
Financial Results•Copper and Aluminium Price Trend
•Profit and Loss Statement
•Balance Sheet
•Business Performance
•Market Performance

STAR Conference 2015, Milan 25th March 2015
3
IRCE Group – Highlights
IRCE is a leading European Group operating in the industries of magnet wires and cables
1947
History
IRCE began its activity in Imola (Italy) with the production of magnet wires
1961 The company launched the production of PVC insulated low voltage cables
1996
1998
2001
2001
2007
2007
2010
2012
The Group was listed on the Italian Stock Exchange
Acquisition of Smit Draad Nijmegen BV (The Netherlands)
Acquisition of FD Sims Ltd (UK)
The Group was listed on the Star Market Segment
Construction of Brazil Plant
Acquisition of Stable Magnet Wire P. Ltd (India)
Acquisition of ISODRA GmbH (Germany)
New sales office in Turkey
IRCE Group TodayFY 2014FY 2014
Consolidated sales 350.6 (€/million)
Number of employees 768 (n.)
Magnet wires production 55,000 (tons)
Cables production 10,000 (tons)
STAR Conference 2015, Milan 25th March 2015
4
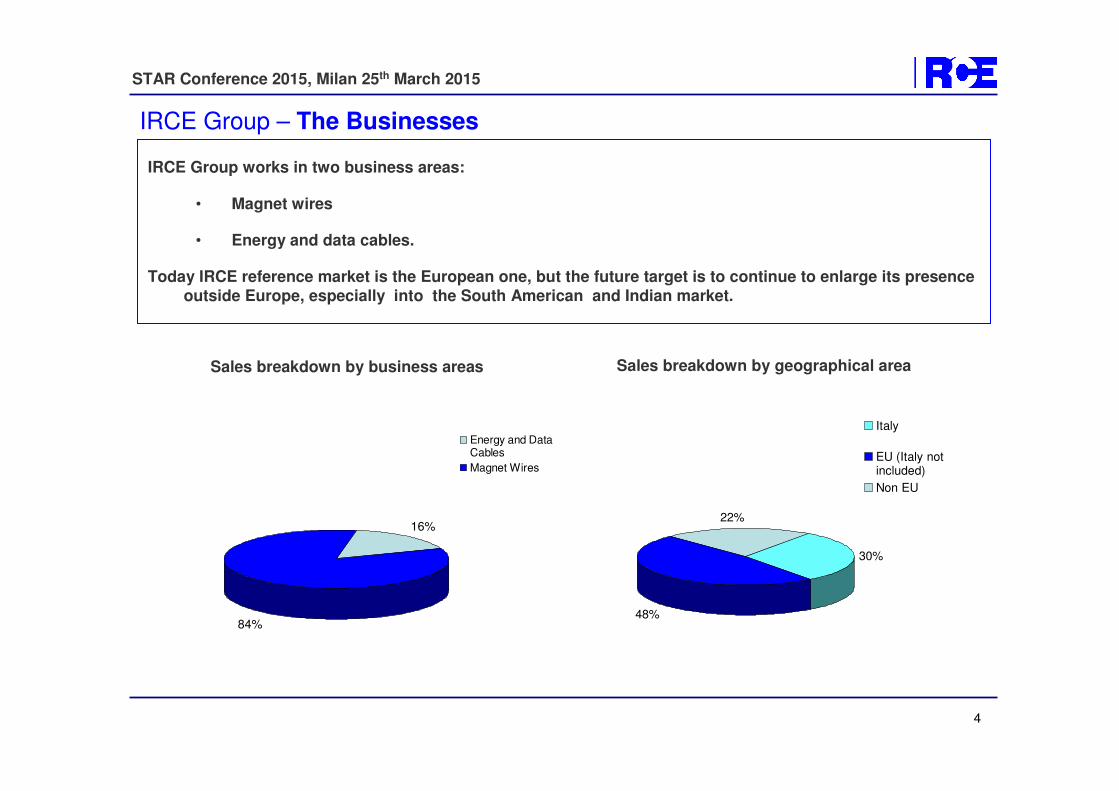
30%
48%
22%
Italy
EU (Italy notincluded)
Non EU
16%
84%
Energy and DataCables
Magnet Wires
Sales breakdown by business areas Sales breakdown by geographical area
IRCE Group works in two business areas:
• Magnet wires
• Energy and data cables.
Today IRCE reference market is the European one, but the future target is to continue to enlarge its presenceoutside Europe, especially into the South American and Indian market.
IRCE Group – The Businesses

STAR Conference 2015, Milan 25th March 2015
5
Magnet Wires
Magnet wires, also known as winding wires or enamelled wires, have multiple applications such as electric motors, generators, transformers, compressors, inductors,
relays, solenoid valves, etc. The wire is insulated through the application of many
layers of enamels by means of highly sophisticated processes and machines, which demand high levels of investments and large scale of productions.
Energy and Data Cables
Cables produced by the Group encompass the complete range of Low Voltage and
Medium Voltage building and industrial cables, data cables (copper cables for LANs) and Power Cords with plugs. Cables can be insulated with PVC, rubber,
polyethylene, etc. They are used for the construction of electricity plants in residential
and industrial buildings and for the wiring and cabling of electrical appliances. The
principal final industry sectors are the construction industry, housing and industrial applications, and consumer durables industries (vehicles, domestic appliances and
other electrical appliances).
IRCE Group – The Businesses
STAR Conference 2015, Milan 25th March 2015
6
Magnet wires can be segmented pursuant to the raw material used, their shape, the wire gauge, and the characteristics
of the insulating materials.
- Raw material: magnet wire can be distinguished between copper wires and aluminium wires.
Copper wires form the greater part of the market. Aluminium wires offer less conductibility. They are, however used in products for which it is
important to minimise the weight.
- Shape: the wires may be round or rectangular.
- Wire gauge: pursuant to their gauge, magnet wires are classified into:
- ultra-fine (diameter < 0.05mm);
- fine (0.05mm < diameter < 0.15mm);
- medium (0.15mm < diameter <2mm);- big (diameter > 2mm).
Fine and ultra fine wires finds their most frequent applications in the electronic sectors.
The medium size wires are mostly destined to the industries of White Goods, Automotive, Lighting, Mechanical Tools, etc.
Big wires are mainly used by the industries of the transport and of the generation of
energy.
- Insulating materials: the main characteristics of these materials (polyurethanes, polyesterimide, polyimide) are
connected to the degree of their heat resistance that may vary from 130 to 220 degrees
centigrade.
Geographically the market is divided in major areas: Europe, South America, North America, Far East, etc; with
limited trade among the areas.
IRCE Group – The Businesses > Magnet Wires
STAR Conference 2015, Milan 25th March 2015
7
IRCE Group – The Businesses > Magnet Wires
> Market share
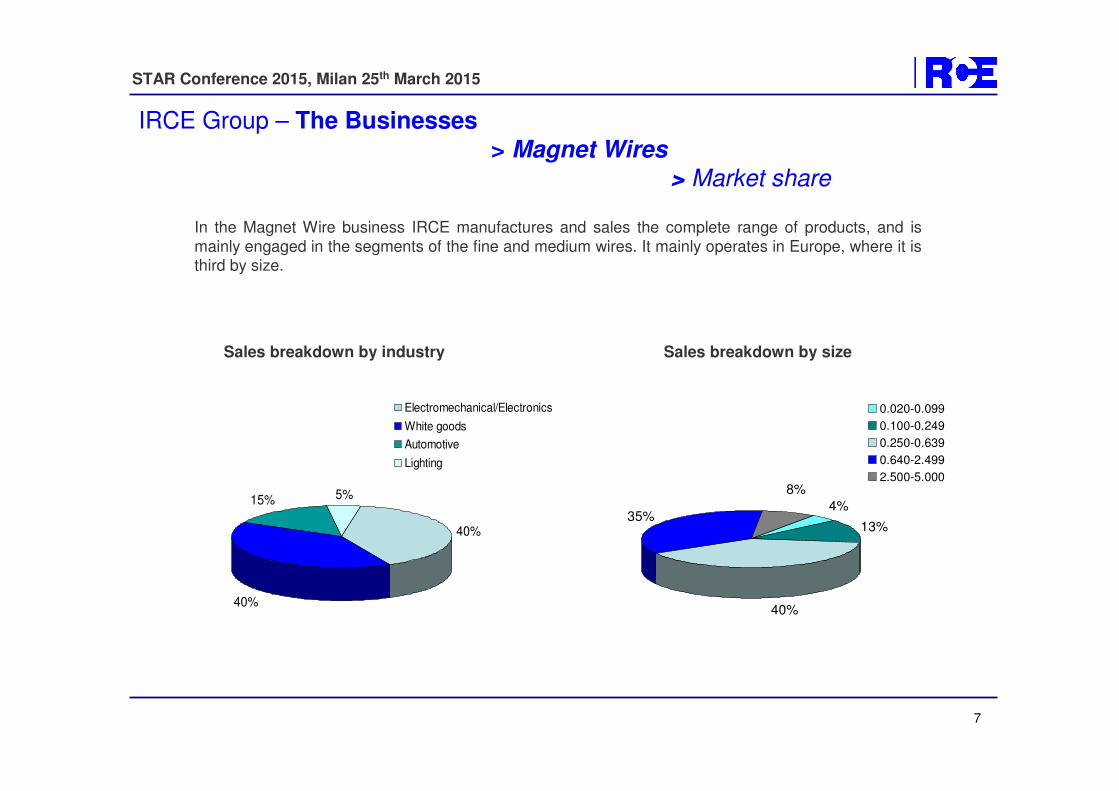
In the Magnet Wire business IRCE manufactures and sales the complete range of products, and is
mainly engaged in the segments of the fine and medium wires. It mainly operates in Europe, where it is third by size.
4%
13%
40%
35%
8%
0.020-0.099
0.100-0.249
0.250-0.639
0.640-2.499
2.500-5.000
40%
40%
15% 5%
Electromechanical/Electronics
White goods
Automotive
Lighting
Sales breakdown by industry Sales breakdown by size
STAR Conference 2015, Milan 25th March 2015
8
IRCE Group – The Businesses > Magnet Wires
> Major customers by sectors
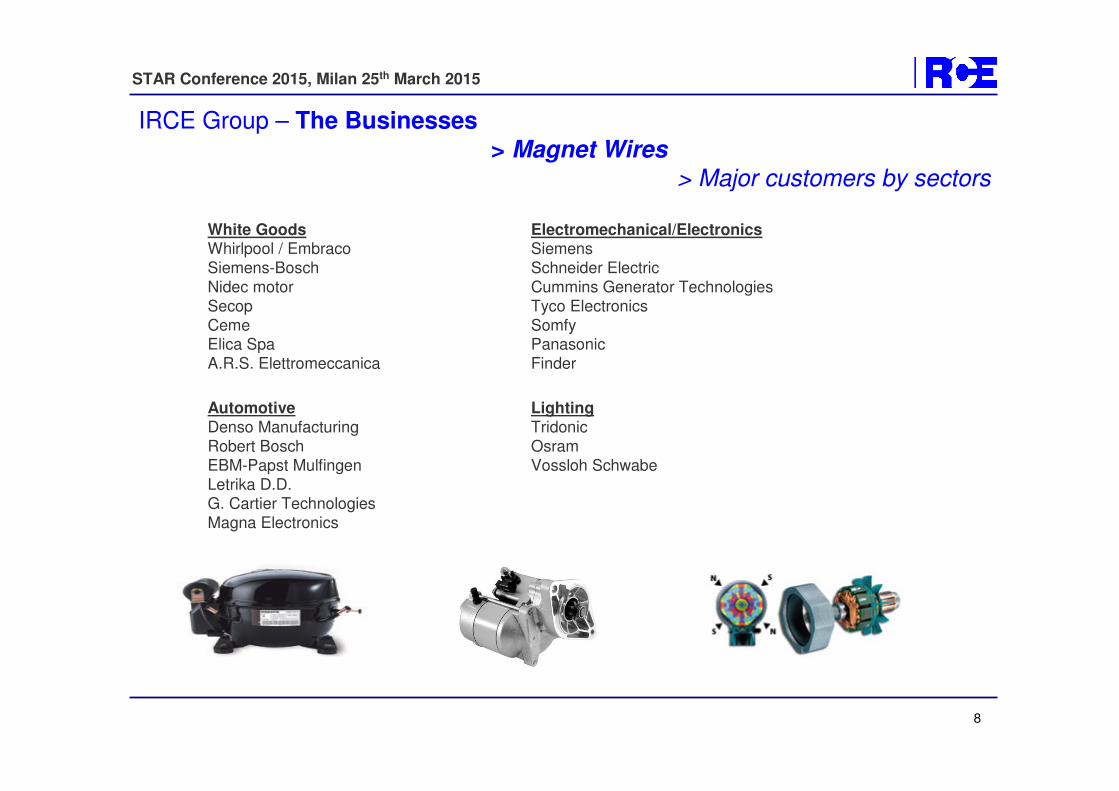
White GoodsWhirlpool / Embraco
Siemens-Bosch
Nidec motor
Secop
CemeElica Spa
A.R.S. Elettromeccanica
Electromechanical/ElectronicsSiemens
Schneider Electric
Cummins Generator Technologies
Tyco Electronics
SomfyPanasonic
Finder
AutomotiveDenso Manufacturing
Robert Bosch
EBM-Papst Mulfingen
Letrika D.D.G. Cartier Technologies
Magna Electronics
LightingTridonic
Osram
Vossloh Schwabe
STAR Conference 2015, Milan 25th March 2015
9
IRCE Group – The Businesses > Energy and Data Cables
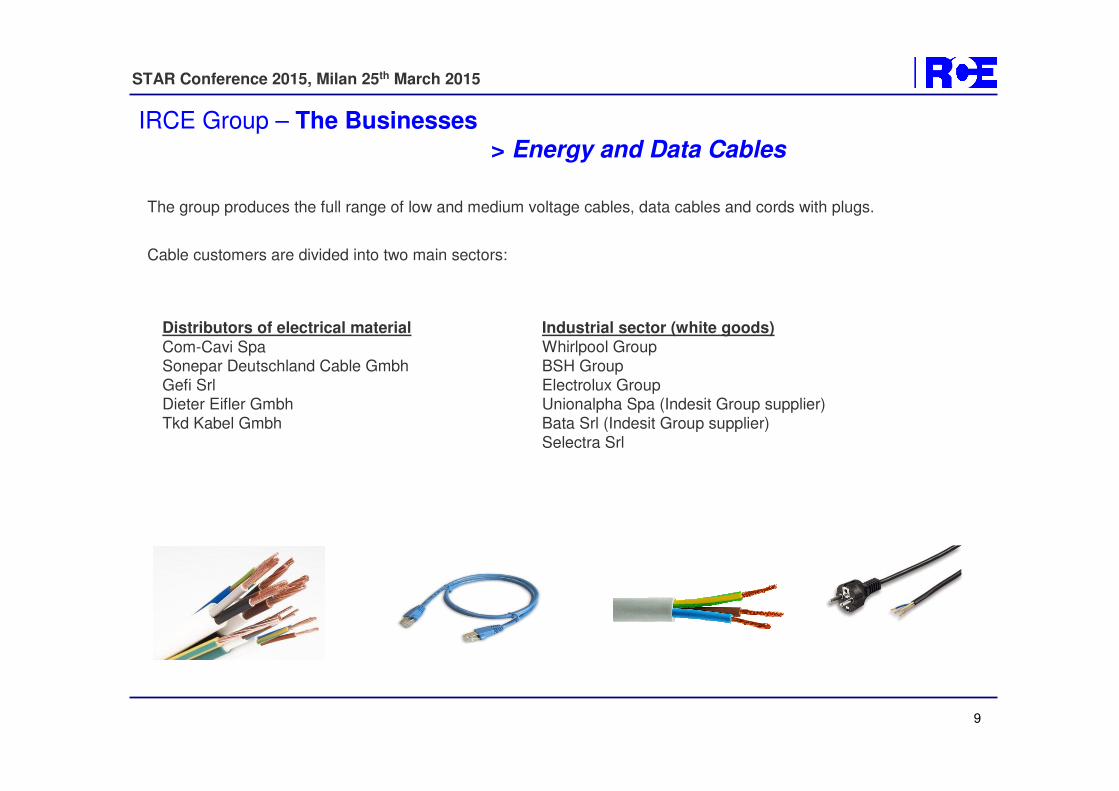
Distributors of electrical materialCom-Cavi SpaSonepar Deutschland Cable Gmbh
Gefi SrlDieter Eifler Gmbh
Tkd Kabel Gmbh
Industrial sector (white goods)Whirlpool Group
BSH Group
Electrolux GroupUnionalpha Spa (Indesit Group supplier)
Bata Srl (Indesit Group supplier)
Selectra Srl
The group produces the full range of low and medium voltage cables, data cables and cords with plugs.
Cable customers are divided into two main sectors:
STAR Conference 2015, Milan 25th March 2015
10
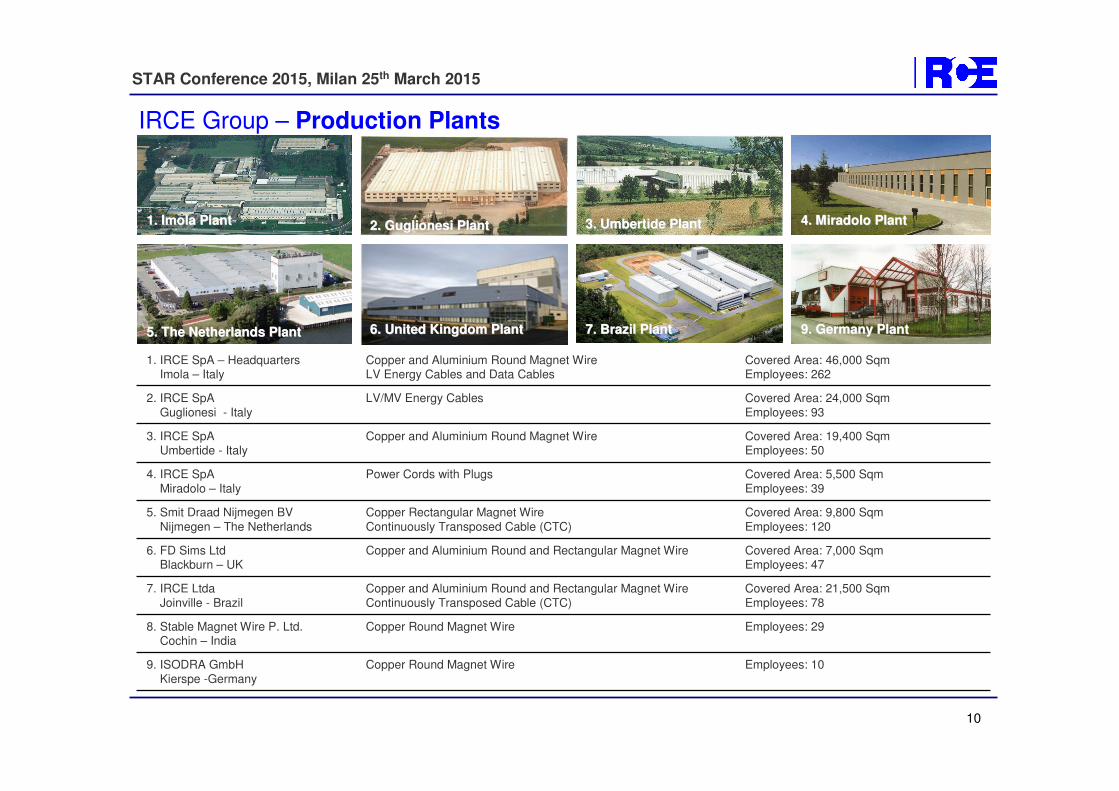
1. IRCE SpA – HeadquartersImola – Italy
Copper and Aluminium Round Magnet Wire LV Energy Cables and Data Cables
Covered Area: 46,000 SqmEmployees: 262
2. IRCE SpA
Guglionesi - Italy
LV/MV Energy Cables Covered Area: 24,000 Sqm
Employees: 93
3. IRCE SpAUmbertide - Italy
Copper and Aluminium Round Magnet Wire Covered Area: 19,400 SqmEmployees: 50
4. IRCE SpA
Miradolo – Italy
Power Cords with Plugs Covered Area: 5,500 Sqm
Employees: 39
5. Smit Draad Nijmegen BV
Nijmegen – The Netherlands
Copper Rectangular Magnet Wire
Continuously Transposed Cable (CTC)
Covered Area: 9,800 Sqm
Employees: 120
6. FD Sims LtdBlackburn – UK
Copper and Aluminium Round and Rectangular Magnet Wire Covered Area: 7,000 SqmEmployees: 47
7. IRCE Ltda
Joinville - Brazil
Copper and Aluminium Round and Rectangular Magnet Wire
Continuously Transposed Cable (CTC)
Covered Area: 21,500 Sqm
Employees: 78
8. Stable Magnet Wire P. Ltd.Cochin – India
Copper Round Magnet Wire Employees: 29
9. ISODRA GmbH
Kierspe -Germany
Copper Round Magnet Wire Employees: 10
IRCE Group – Production Plants
2. 2. GuglionesiGuglionesi PlantPlant 3. 3. UmbertideUmbertide PlantPlant
6. United Kingdom Plant6. United Kingdom Plant
1. 1. ImolaImola PlantPlant 4. 4. MiradoloMiradolo PlantPlant
5. The Netherlands Plant5. The Netherlands Plant 7. Brazil Plant7. Brazil Plant 9. Germany Plant9. Germany Plant
STAR Conference 2015, Milan 25th March 2015
11
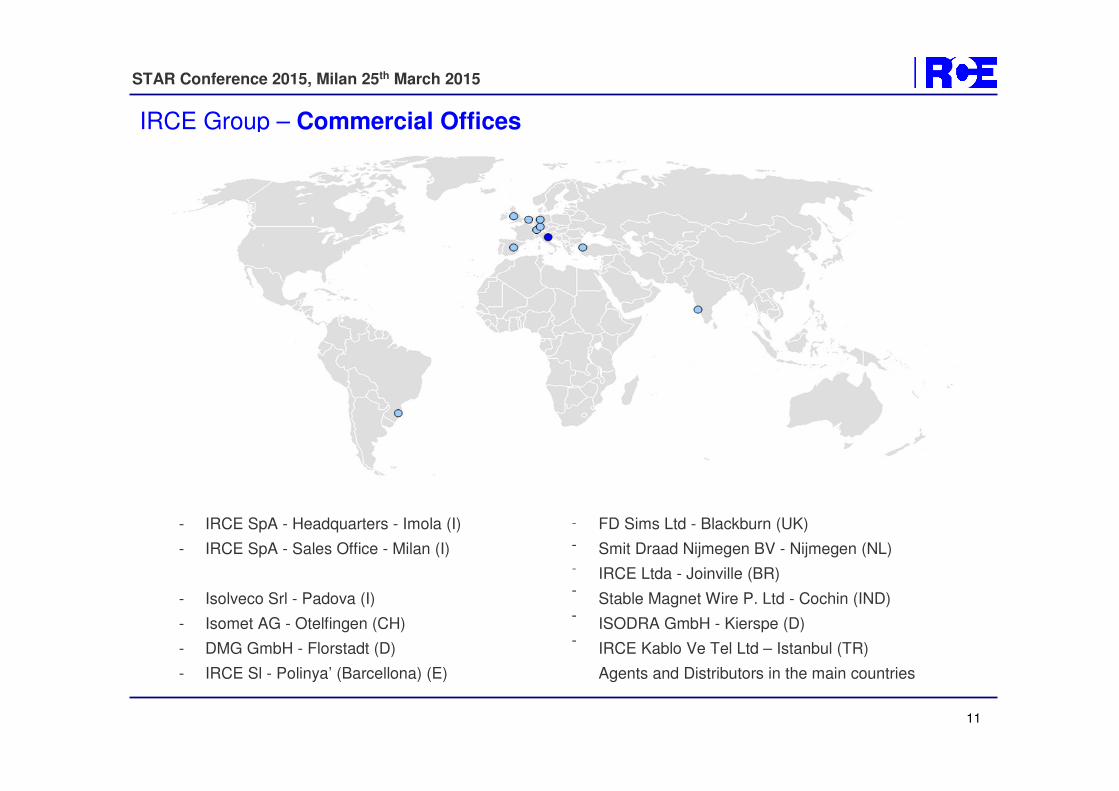
IRCE Group – Commercial Offices
-
-
-
-
-
-
IRCE SpA - Headquarters - Imola (I)
IRCE SpA - Sales Office - Milan (I)
Isolveco Srl - Padova (I)
Isomet AG - Otelfingen (CH)
DMG GmbH - Florstadt (D)
IRCE Sl - Polinya’ (Barcellona) (E)
-
-
-
-
-
-
FD Sims Ltd - Blackburn (UK)
Smit Draad Nijmegen BV - Nijmegen (NL)
IRCE Ltda - Joinville (BR)
Stable Magnet Wire P. Ltd - Cochin (IND)
ISODRA GmbH - Kierspe (D)
IRCE Kablo Ve Tel Ltd – Istanbul (TR)
Agents and Distributors in the main countries
STAR Conference 2015, Milan 25th March 2015
12
Company Profile•Highlights
•The Businesses
•Production Plants
•Commercial Offices
Financial Results•Copper and Aluminium Price Trend
•Profit and Loss Statement
•Balance Sheet
•Business Performance
•Market Performance
IRCE Group – Contents
STAR Conference 2015, Milan 25th March 2015
13
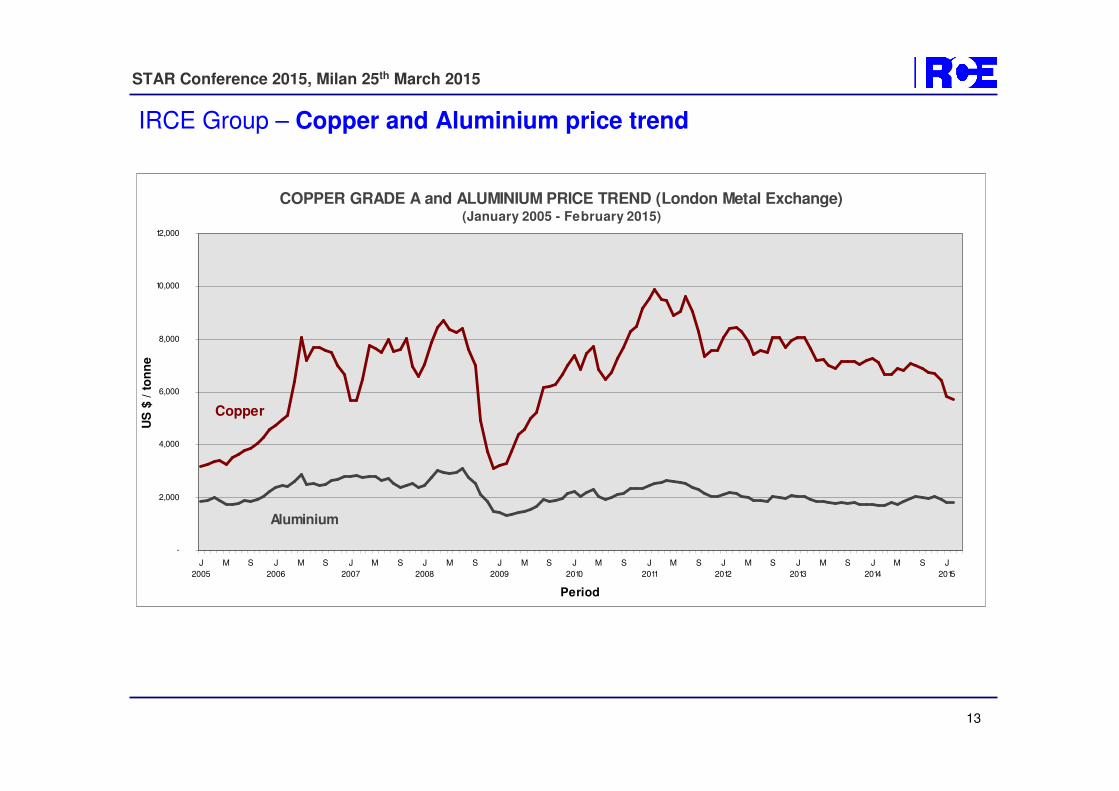
IRCE Group – Copper and Aluminium price trend
COPPER GRADE A and ALUMINIUM PRICE TREND (London Metal Exchange)(January 2005 - February 2015)
-
2,000
4,000
6,000
8,000
10,000
12,000
J
2005
M S J
2006
M S J
2007
M S J
2008
M S J
2009
M S J
2010
M S J
2011
M S J
2012
M S J
2013
M S J
2014
M S J
2015
Period
US
$ /
to
nn
e
Aluminium
Copper
STAR Conference 2015, Milan 25th March 2015
14
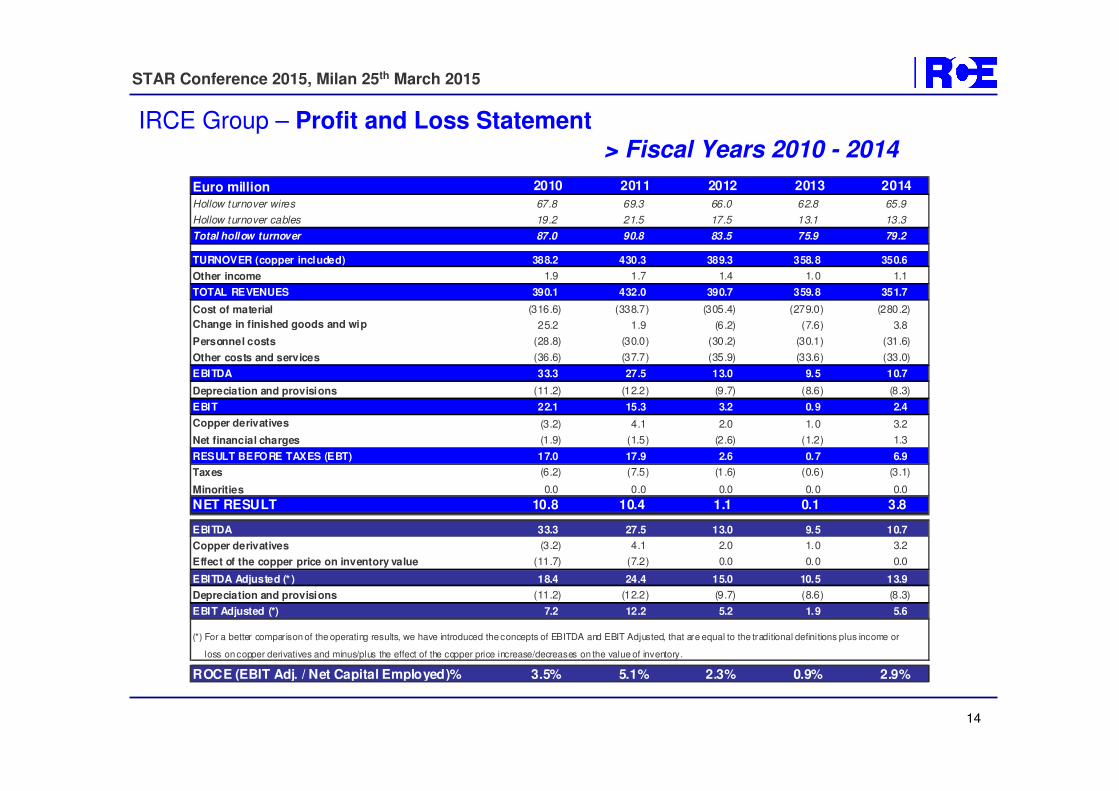
IRCE Group – Profit and Loss Statement > Fiscal Years 2010 - 2014
Euro million 2010 2011 2012 2013 2014
Hollow turnover wires 67.8 69.3 66.0 62.8 65.9
Hollow turnover cables 19.2 21.5 17.5 13.1 13.3
Total hollow turnover 87.0 90.8 83.5 75.9 79.2
TURNOVER (copper included) 388.2 430.3 389.3 358.8 350.6
Other income 1.9 1.7 1.4 1.0 1.1
TOTAL REVENUES 390.1 432.0 390.7 359.8 351.7
Cost of material (316.6) (338.7) (305.4) (279.0) (280.2)
Change in finished goods and wip 25.2 1.9 (6.2) (7.6) 3.8
Personnel costs (28.8) (30.0) (30.2) (30.1) (31.6)
Other costs and services (36.6) (37.7) (35.9) (33.6) (33.0)
EBITDA 33.3 27.5 13.0 9.5 10.7
Depreciation and provisions (11.2) (12.2) (9.7) (8.6) (8.3)
EBIT 22.1 15.3 3.2 0.9 2.4
Copper derivatives (3.2) 4.1 2.0 1.0 3.2
Net financial charges (1.9) (1.5) (2.6) (1.2) 1.3
RESULT BEFORE TAXES (EBT) 17.0 17.9 2.6 0.7 6.9
Taxes (6.2) (7.5) (1.6) (0.6) (3.1)
Minorities 0.0 0.0 0.0 0.0 0.0
NET RESULT 10.8 10.4 1.1 0.1 3.8
EBITDA 33.3 27.5 13.0 9.5 10.7
Copper derivatives (3.2) 4.1 2.0 1.0 3.2
Effect of the copper price on inventory value (11.7) (7.2) 0.0 0.0 0.0
EBITDA Adjusted (* ) 18.4 24.4 15.0 10.5 13.9
Depreciation and provisions (11.2) (12.2) (9.7) (8.6) (8.3)
EBIT Adjusted (*) 7.2 12.2 5.2 1.9 5.6
ROCE (EBIT Adj. / Net Capital Employed)% 3.5% 5.1% 2.3% 0.9% 2.9%
(*) For a better comparison of the operating results, we have introduced the concepts of EBITDA and EBIT Adjusted, that are equal to the traditional definitions plus income or
loss on copper derivatives and minus/plus the effect of the copper price increase/decreases on the value of inventory.
STAR Conference 2015, Milan 25th March 2015
15
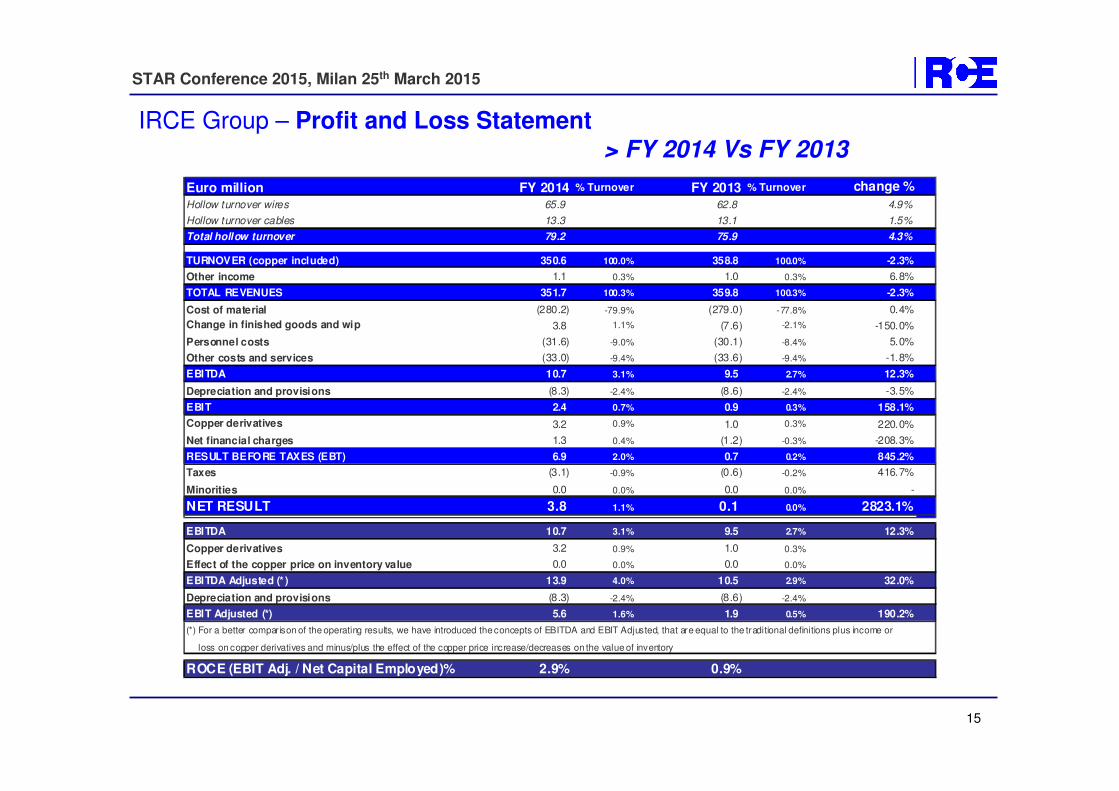
IRCE Group – Profit and Loss Statement > FY 2014 Vs FY 2013
Euro million FY 2014 % Turnover FY 2013 % Turnover change %
Hollow turnover wires 65.9 62.8 4.9%
Hollow turnover cables 13.3 13.1 1.5%
Total hollow turnover 79.2 75.9 4.3%
TURNOVER (copper included) 350.6 100.0% 358.8 100.0% -2.3%
Other income 1.1 0.3% 1.0 0.3% 6.8%
TOTAL REVENUES 351.7 100.3% 359.8 100.3% -2.3%
Cost of material (280.2) -79.9% (279.0) -77.8% 0.4%
Change in finished goods and wip 3.8 1.1% (7.6) -2.1% -150.0%
Personnel costs (31.6) -9.0% (30.1) -8.4% 5.0%
Other costs and services (33.0) -9.4% (33.6) -9.4% -1.8%
EBITDA 10.7 3.1% 9.5 2.7% 12.3%
Depreciation and provisions (8.3) -2.4% (8.6) -2.4% -3.5%
EBIT 2.4 0.7% 0.9 0.3% 158.1%
Copper derivatives 3.2 0.9% 1.0 0.3% 220.0%
Net financial charges 1.3 0.4% (1.2) -0.3% -208.3%
RESULT BEFORE TAXES (EBT) 6.9 2.0% 0.7 0.2% 845.2%
Taxes (3.1) -0.9% (0.6) -0.2% 416.7%
Minorities 0.0 0.0% 0.0 0.0% -
NET RESULT 3.8 1.1% 0.1 0.0% 2823.1%
EBITDA 10.7 3.1% 9.5 2.7% 12.3%
Copper derivatives 3.2 0.9% 1.0 0.3%
Effect of the copper price on inventory value 0.0 0.0% 0.0 0.0%
EBITDA Adjusted (* ) 13.9 4.0% 10.5 2.9% 32.0%
Depreciation and provisions (8.3) -2.4% (8.6) -2.4%
EBIT Adjusted (*) 5.6 1.6% 1.9 0.5% 190.2%
ROCE (EBIT Adj. / Net Capital Employed)% 2.9% 0.9%
(*) For a better comparison of the operating results, we have introduced the concepts of EBITDA and EBIT Adjusted, that are equal to the traditional definitions plus income or
loss on copper derivatives and minus/plus the effect of the copper price increase/decreases on the value of inventory
STAR Conference 2015, Milan 25th March 2015
16
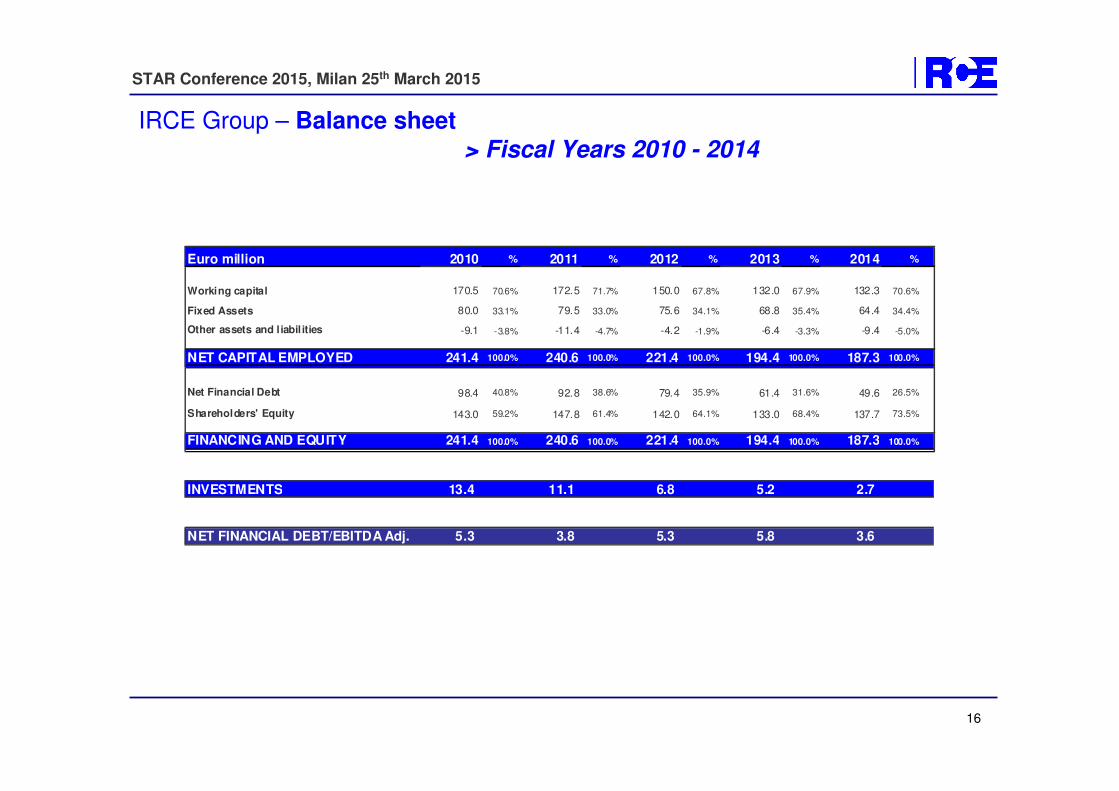
IRCE Group – Balance sheet> Fiscal Years 2010 - 2014
Euro million 2010 % 2011 % 2012 % 2013 % 2014 %
Working capital 170.5 70.6% 172.5 71.7% 150.0 67.8% 132.0 67.9% 132.3 70.6%
Fixed Assets 80.0 33.1% 79.5 33.0% 75.6 34.1% 68.8 35.4% 64.4 34.4%
Other assets and l iabil ities -9.1 -3.8% -11.4 -4.7% -4.2 -1.9% -6.4 -3.3% -9.4 -5.0%
NET CAPITAL EMPLOYED 241.4 100.0% 240.6 100.0% 221.4 100.0% 194.4 100.0% 187.3 100.0%
Net Financial Debt 98.4 40.8% 92.8 38.6% 79.4 35.9% 61.4 31.6% 49.6 26.5%
Shareholders' Equity 143.0 59.2% 147.8 61.4% 142.0 64.1% 133.0 68.4% 137.7 73.5%
FINANCING AND EQUITY 241.4 100.0% 240.6 100.0% 221.4 100.0% 194.4 100.0% 187.3 100.0%
INVESTMENTS 13.4 11.1 6.8 5.2 2.7
NET FINANCIAL DEBT/EBITDA Adj. 5.3 3.8 5.3 5.8 3.6
STAR Conference 2015, Milan 25th March 2015
17
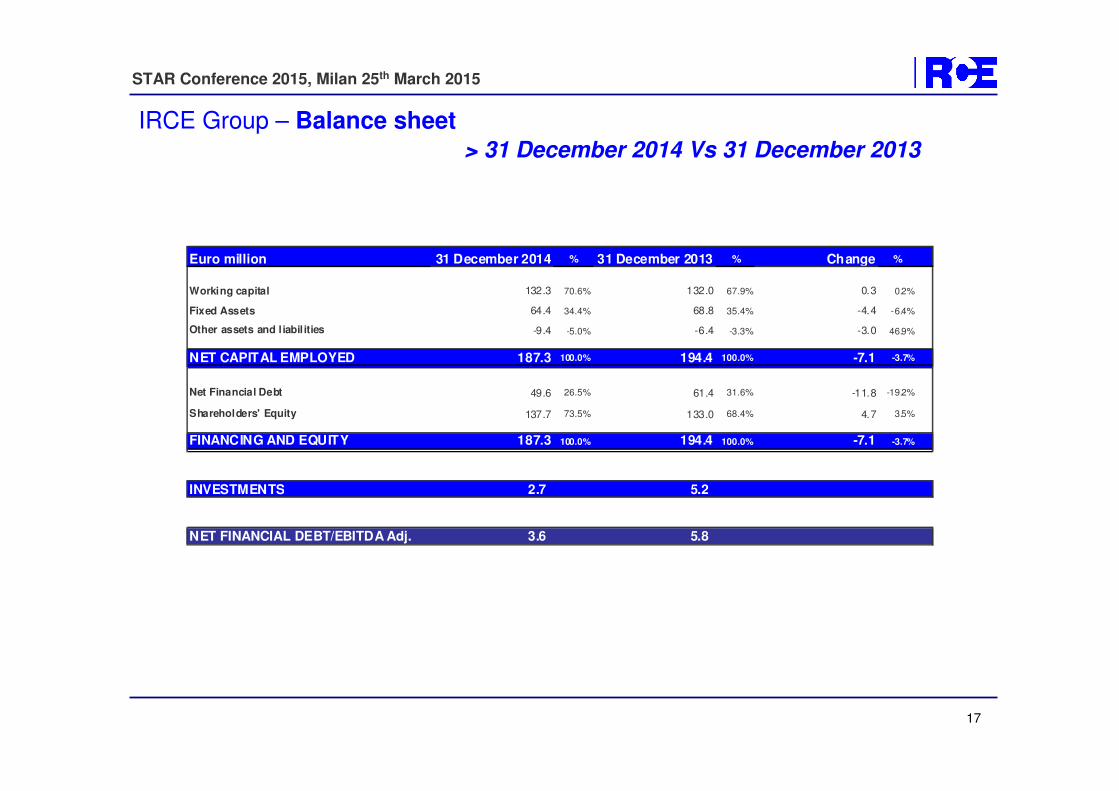
IRCE Group – Balance sheet> 31 December 2014 Vs 31 December 2013
Euro million 31 December 2014 % 31 December 2013 % Change %
Working capital 132.3 70.6% 132.0 67.9% 0.3 0.2%
Fixed Assets 64.4 34.4% 68.8 35.4% -4.4 -6.4%
Other assets and l iabil ities -9.4 -5.0% -6.4 -3.3% -3.0 46.9%
NET CAPITAL EMPLOYED 187.3 100.0% 194.4 100.0% -7.1 -3.7%
Net Financial Debt 49.6 26.5% 61.4 31.6% -11.8 -19.2%
Shareholders' Equity 137.7 73.5% 133.0 68.4% 4.7 3.5%
FINANCING AND EQUITY 187.3 100.0% 194.4 100.0% -7.1 -3.7%
INVESTMENTS 2.7 5.2
NET FINANCIAL DEBT/EBITDA Adj. 3.6 5.8

STAR Conference 2015, Milan 25th March 2015
IRCE Group – Business Performance
TURNOVER and HOLLOW TURNOVER
358.8 350.6
87.0 90.8 83.5 75.9 79.2
389.3
430.3388.2
-
50.0
100.0
150.0
200.0
250.0
300.0
350.0
400.0
450.0
500.0
2010 2011 2012 2013 2014
Euro
mill
ion
Total Turnover Hollow Turnover
EBITDA Adjusted and EBIT Adjusted
18.4
24.4
15.0
10.5
13.9
7.2
12.2
5.6
1.9
5.2
-
5.0
10.0
15.0
20.0
25.0
30.0
2010 2011 2012 2013 2014
Euro
mill
ion
EBITDA Adj EBIT Adj
NET CAPITAL EMPLOYED and NET FINANCIAL DEBT
241.4
194.4 187.3
98.4 92.879.4
61.449.6
221.4
240.6
35.9%40.8% 38.6%
31.6%
26.5%
0
50
100
150
200
250
300
2010 2011 2012 2013 2014
Euro
mill
ion
0.0%
10.0%
20.0%
30.0%
40.0%
50.0%
60.0%
Net Capital Employed Net Financial Debt
Financial Debt Ratio
WORKING CAPITAL
170.5 172.5
150.0
132.0 132.3
0
20
40
60
80
100
120
140
160
180
200
2010 2011 2012 2013 2014
Euro
mill
ion
18
STAR Conference 2015, Milan 25th March 2015
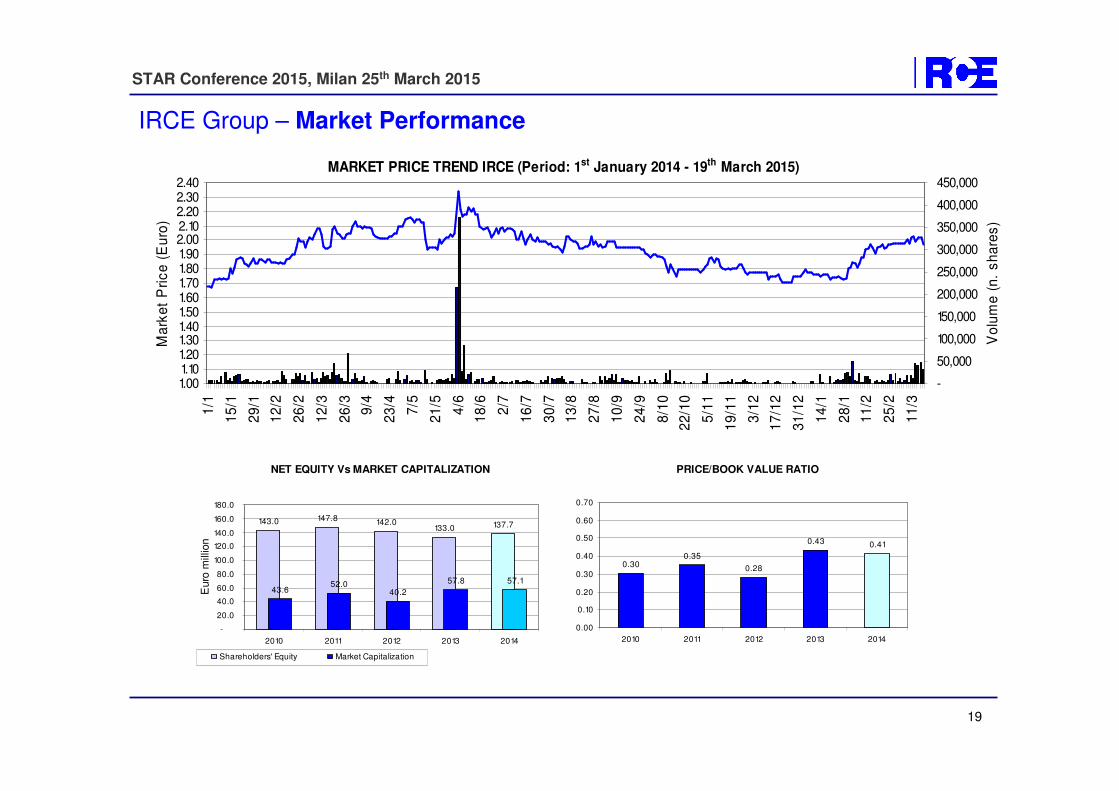
IRCE Group – Market Performance
MARKET PRICE TREND IRCE (Period: 1st January 2014 - 19th March 2015)
1.001.101.201.301.401.501.601.701.801.902.002.102.202.302.40
1/1
15
/1
29
/1
12
/2
26
/2
12
/3
26
/3
9/4
23
/4
7/5
21
/5
4/6
18
/6
2/7
16
/7
30
/7
13
/8
27
/8
10
/9
24
/9
8/1
0
22
/10
5/1
1
19
/11
3/1
2
17
/12
31
/12
14
/1
28
/1
11
/2
25
/2
11
/3
Ma
rke
t P
ric
e (
Eu
ro)
-
50,000
100,000
150,000
200,000
250,000
300,000
350,000
400,000
450,000
Vo
lum
e (
n.
sh
are
s)
NET EQUITY Vs MARKET CAPITALIZATION
143.0 147.8142.0
133.0 137.7
43.652.0
40.2
57.8 57.1
-
20.0
40.0
60.0
80.0
100.0
120.0
140.0
160.0
180.0
2010 2011 2012 2013 2014
Euro
mill
ion
Shareholders' Equity Market Capitalization
PRICE/BOOK VALUE RATIO
0.300.35
0.28
0.43 0.41
0.00
0.10
0.20
0.30
0.40
0.50
0.60
0.70
2010 2011 2012 2013 2014
19