Embed Size (px)
Citation preview

Staring at a decade of budget gaps: How can states finance policy drive
productivity gains in education?
Presented by:
Marguerite Roza
Research Associate Professor
Georgetown University
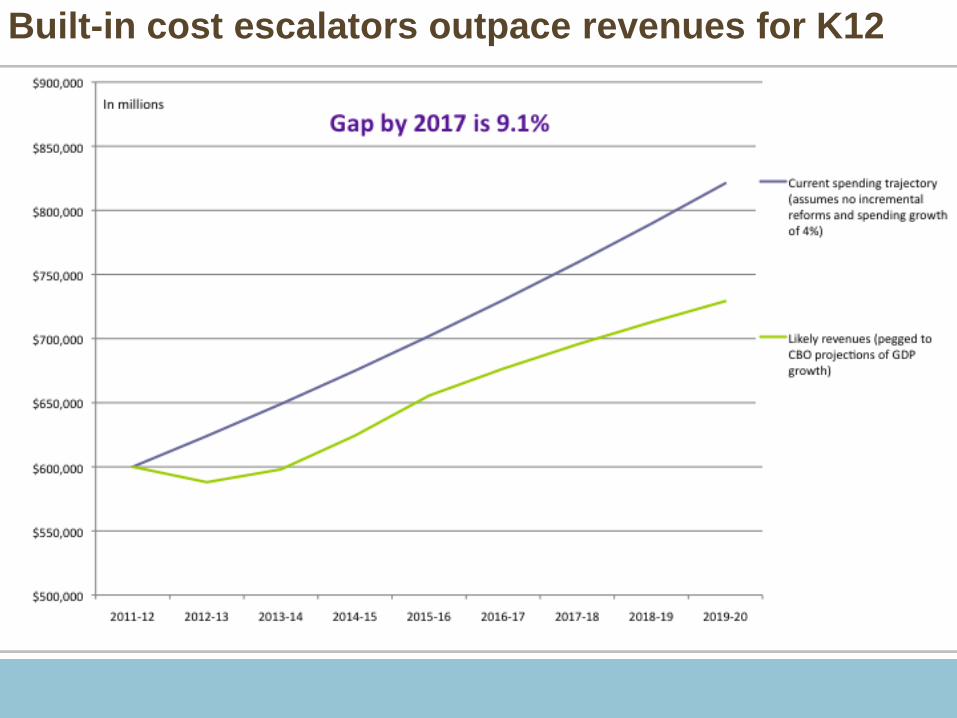
Built-in cost escalators outpace revenues for K12

Scenario #1: Slow cuts that work to erode public education
Scenario #2: Tinker around the edges, trying to protect students and learning
Scenario #3: Redesign schooling to improve processes and outcomes, and sustainability
Three Paths Forward

Public education staffing had been growing through recessions and is only now starting to fall
# Adults
Total Comp
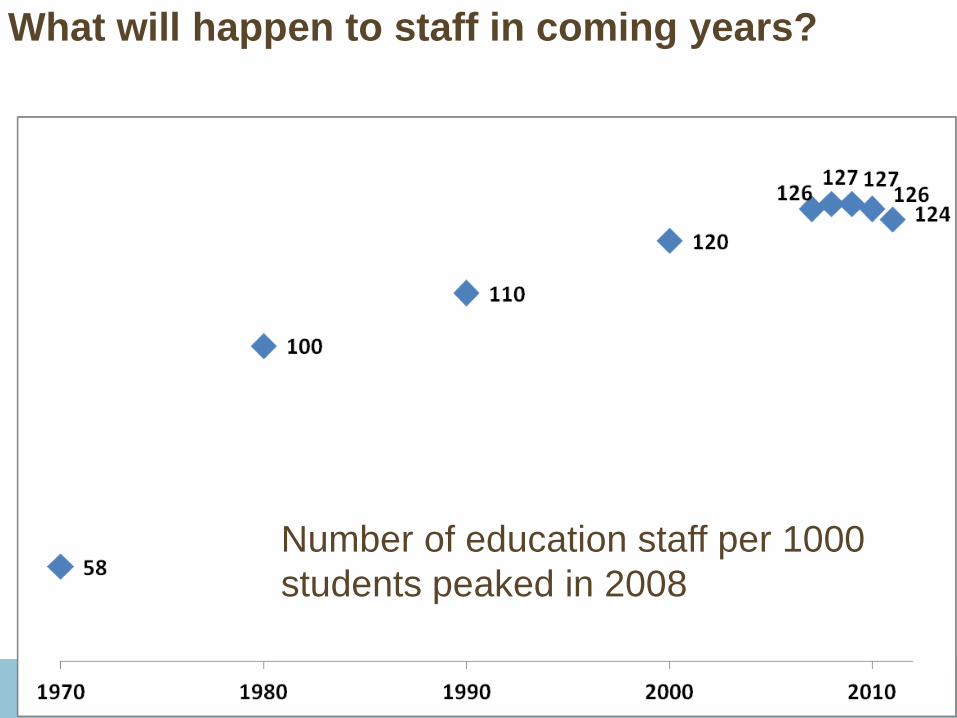
What will happen to staff in coming years?
Number of education staff per 1000
students peaked in 2008

Structural deficit: Benefits consume an increasing share of expenditures
Author’s analysis on NCES reported
data 6

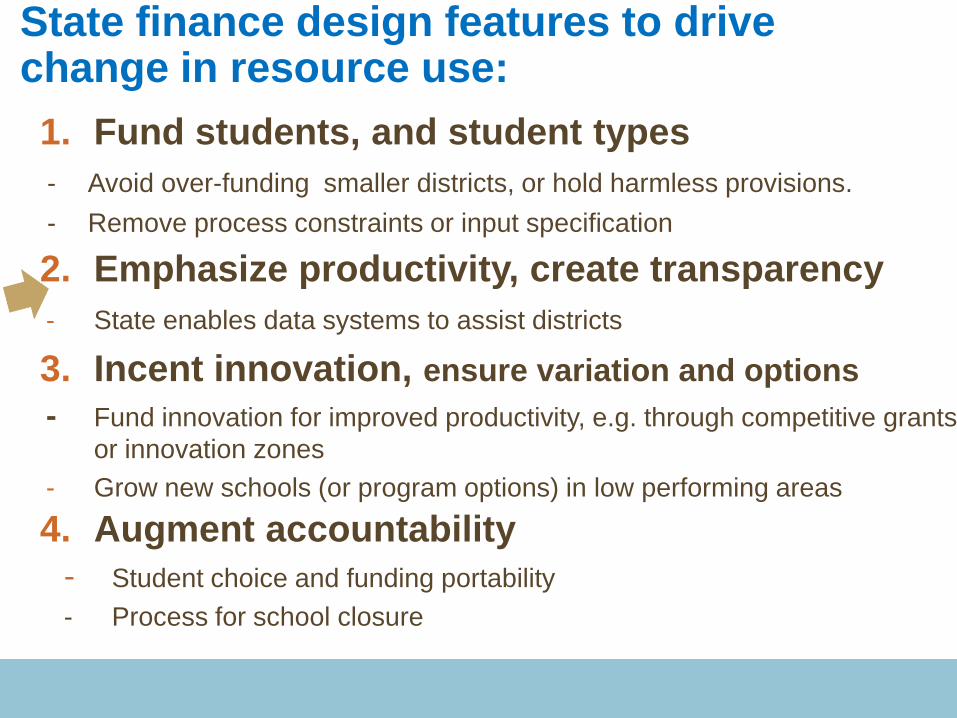
State finance design features to drive change in resource use:
1. Fund students, and student types
- Avoid over-funding smaller districts, or hold harmless provisions.
- Remove process constraints or input specification
2. Emphasize productivity, create transparency
- State enables data systems to assist districts
3. Incent innovation, ensure variation and options
- Fund innovation for improved productivity, e.g. through competitive grants
or innovation zones
- Grow new schools (or program options) in low performing areas
4. Augment accountability
- Student choice and funding portability
- Process for school closure

Source: CRPE analysis of 2008 data from an urban district
$58,443 $61,630
$65,292
$69,451
$30,000
$40,000
$50,000
$60,000
$70,000
$80,000
Highest poverty (most poor)
Quartile 2 Qaurtile 3 Lowest poverty (wealthiest)
Avera
ge t
each
er
sala
ry
Schools arranged into quartiles based on % FRL
Within districts, teacher salaries, benefits, pensions disproportionately benefit wealthier students
Quartile 3

Math/Science teachers earn less than other teachers

-10% -5% 0% 5% 10% 15% 20% 25% 30%
NY
NJ
ND
MO
IN
OH
MI
IL
IA
SD
MN
WI
AR
NE
CO
OK
MA
KS
KY
PA
ME
WA
ID
WY
OR
TX
MS
VA
NH
NM
AZ
GA
CA
Overfunding percentage for small* districts
Funding percentage
provides a weighted
comparison against all
other districts in the given
state for small districts in
states with a minimum of
10 small districts.
* Small districts are
defined as having 250-
1200 students)
Small district
subsidies vary by
state
State finance design features to drive change in resource use:
1. Fund students, and student types
- Avoid over-funding smaller districts, or hold harmless provisions.
- Remove process constraints or input specification
2. Emphasize productivity, create transparency
- State enables data systems to assist districts
3. Incent innovation, ensure variation and options
- Fund innovation for improved productivity, e.g. through competitive grants
or innovation zones
- Grow new schools (or program options) in low performing areas
4. Augment accountability
- Student choice and funding portability
- Process for school closure

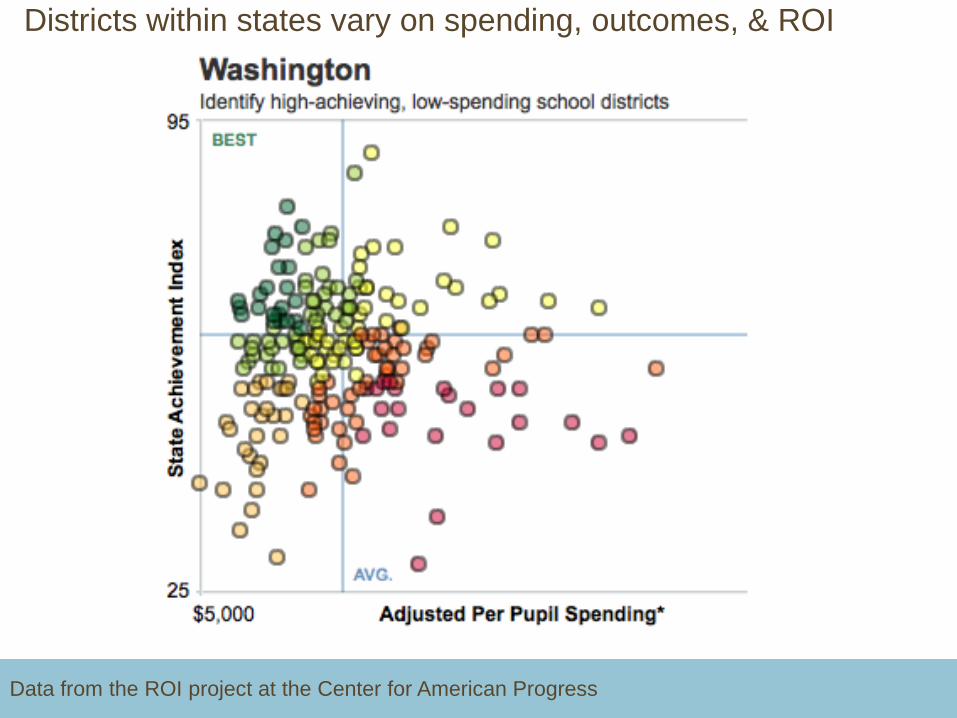
Districts within states vary on spending, outcomes, & ROI
Data from the ROI project at the Center for American Progress

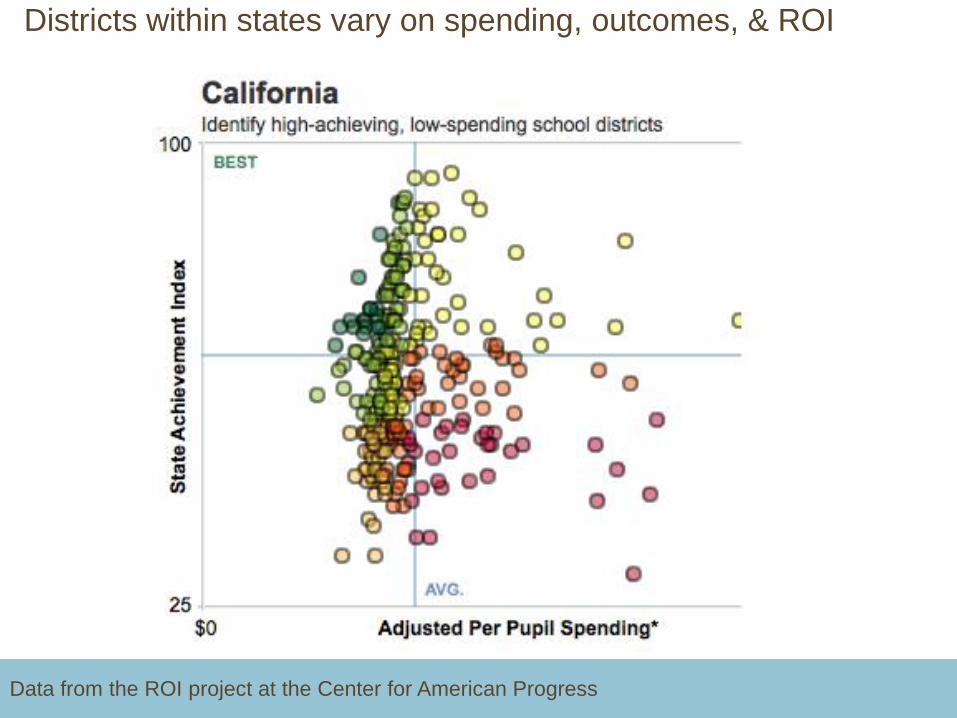
Districts within states vary on spending, outcomes, & ROI
Data from the ROI project at the Center for American Progress

Districts within states vary on spending, outcomes, & ROI
Data from the ROI project at the Center for American Progress

Districts within states vary on spending, outcomes, & ROI
Data from the ROI project at the Center for American Progress
Districts within states vary on spending, outcomes, & ROI
Data from the ROI project at the Center for American Progress
Districts within states vary on spending, outcomes, & ROI
Data from the ROI project at the Center for American Progress
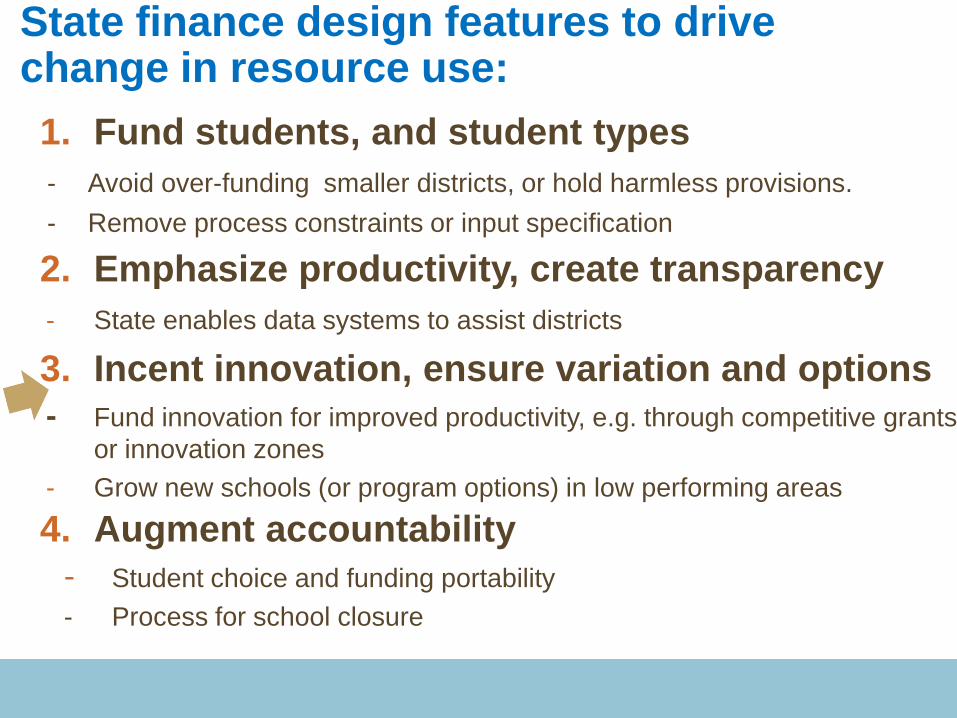
State finance design features to drive change in resource use:
1. Fund students, and student types
- Avoid over-funding smaller districts, or hold harmless provisions.
- Remove process constraints or input specification
2. Emphasize productivity, create transparency
- State enables data systems to assist districts
3. Incent innovation, ensure variation and options
- Fund innovation for improved productivity, e.g. through competitive grants
or innovation zones
- Grow new schools (or program options) in low performing areas
4. Augment accountability
- Student choice and funding portability
- Process for school closure

Per year
$22,080
$12,743
$11,463
$0
$10,000
$20,000
$30,000
$40,000
$50,000
$60,000
$70,000
$80,000
$90,000
$100,000
Teachers Computer Programmers
Accountants
Benefits
Wages
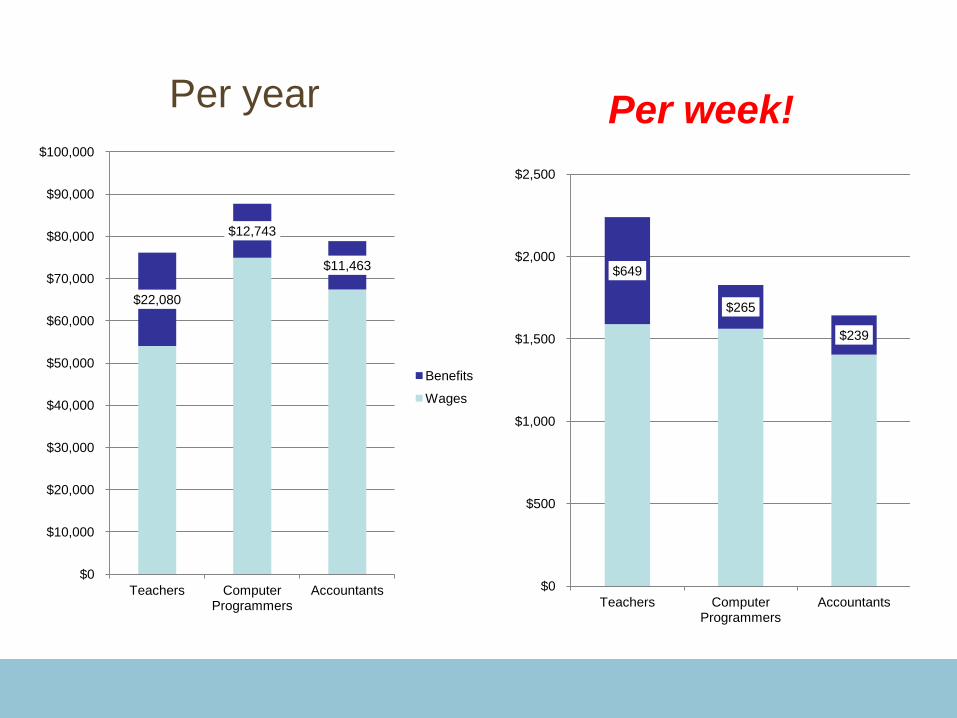
$649
$265
$239
$0
$500
$1,000
$1,500
$2,000
$2,500
Teachers Computer Programmers
Accountants
Per year Per week!
$22,080
$12,743
$11,463
$0
$10,000
$20,000
$30,000
$40,000
$50,000
$60,000
$70,000
$80,000
$90,000
$100,000
Teachers Computer Programmers
Accountants
Benefits
Wages

Innovations provide insight into productivity improvements: Rocketship
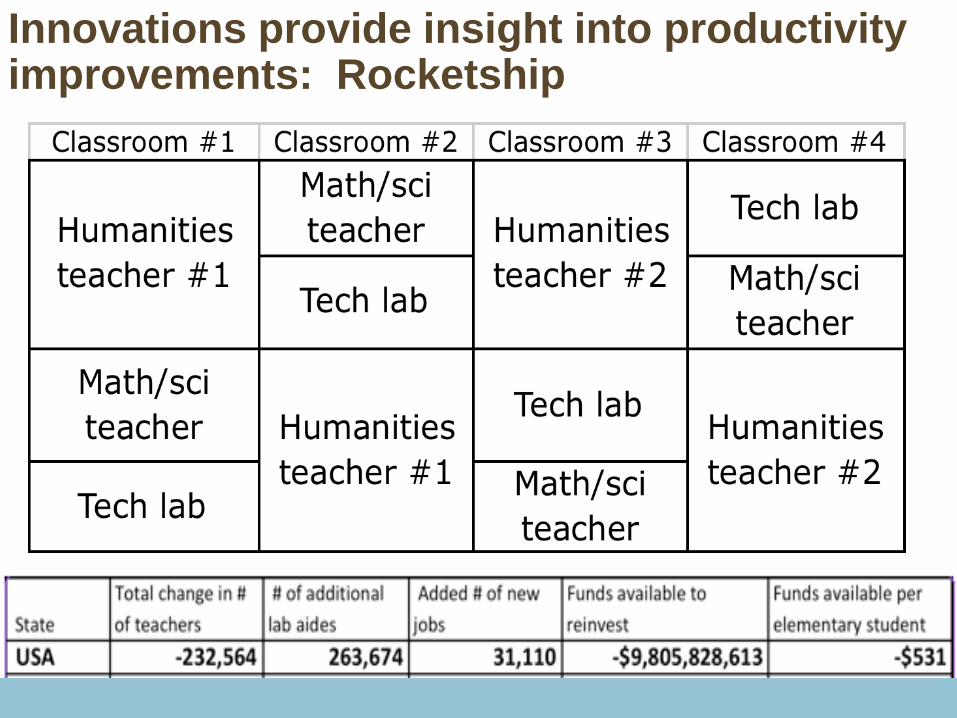
Innovations provide insight into productivity improvements: Rocketship

What do you prefer? (survey by Goldhaber & DeArmond)
$5K bonus or 2 fewer students in
each class you
teach
$5K bonus or 1/5 of an aide
$5K bonus or 3.5 hours more prep
time per week
83%
88%
69%

State finance design features to drive change in resource use:
1. Fund students, and student types
- Avoid over-funding smaller districts, or hold harmless provisions.
- Remove process constraints or input specification
2. Emphasize productivity, create transparency
- State enables data systems to assist districts
3. Incent innovation, ensure variation and options
- Fund innovation for improved productivity, e.g. through competitive grants
or innovation zones
- Grow new schools (or program options) in low performing areas
4. Augment accountability
- Student choice and funding portability
- Process for school closure

Districts within states vary on spending, outcomes, & ROI
Data from the ROI project at the Center for American Progress

Factors that affect pension liabilities
Wage growth (particularly in years just prior to retirement). (Better to give level $ raises not % raises. Also, eliminate policies that enable spikes
in pay to late career staff).
Pension COLAs (Generally not in the contract and can be altered to reflect
economic conditions).
Employee contributions (Increasing employee contributions to pensions
lowers liability).
Retiree health benefits (and retiree contributions to those). (Also
generally not included in contractual obligations).
What counts as a vesting “year”? (Pension accrual should be tied to
actual days worked, vs furlough days, etc.)
Arrangements for new entrants