Embed Size (px)
Citation preview
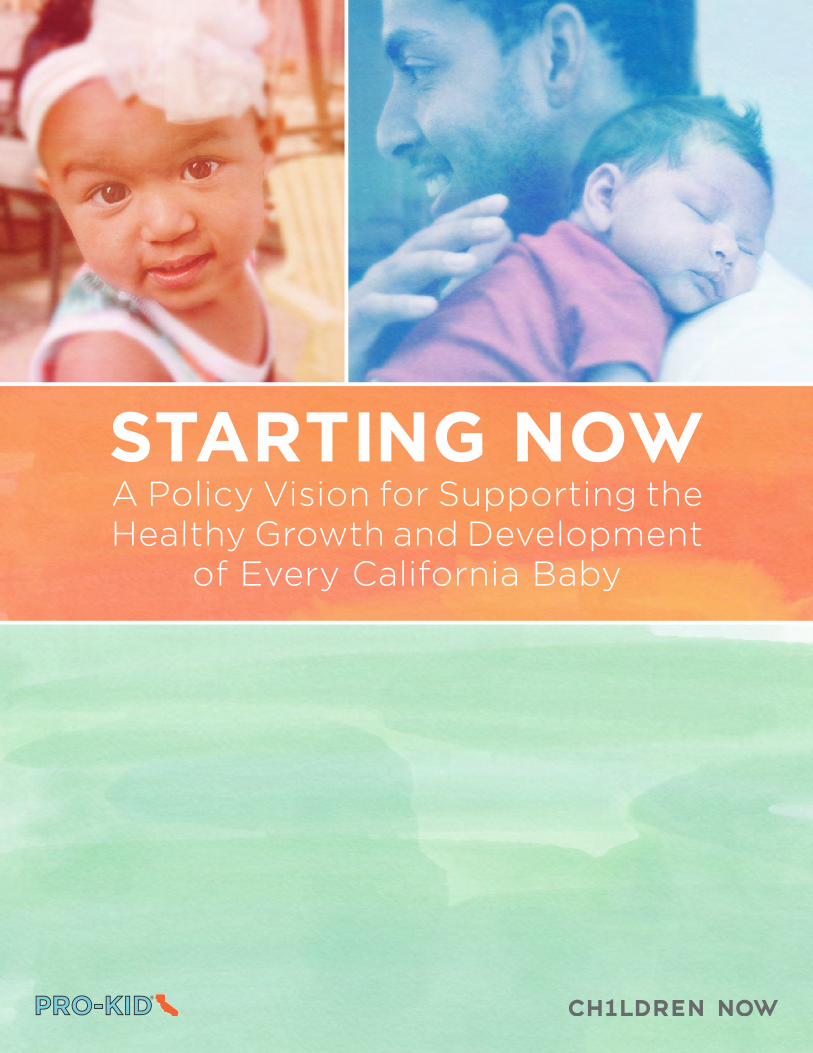
A Policy Vision for Supporting the Healthy Growth and Development
of Every California Baby

2
IntroductionIn the first three years of a child’s life, foundational brain architecture is established, making children’s earliest experiences the most important. The creation of healthy brain architecture is dependent on good health, positive and nurturing relationships with adults, exposure to enriching learning opportunities and safe neighborhoods.
Yet too often in California, children—especially children of color, foster youth, and those growing up in poverty—lack the components critical for a healthy early life. For example:
As few as 3% of families that might benefit
from voluntary home visiting have access to
home visiting programs.1
32% of children entering foster care are
under the age of three.2
Only 9% of eligible infants and toddlers have
subsidized child care.3
California’s policymakers are failing our state’s youngest children, paying far too little attention—and allocating far too few resources—to the critical and formative early years. Research by Nobel Laureate Professor James Heckman from the University of Chicago shows us that investing in high-quality early childhood programs can yield up to 13 percent savings per year, and cost-effective programs can also yield savings across multiple systems including reductions in
Starting Now: A Policy Vision for Supporting the Healthy Growth and Development of Every California Baby
3
later spending on education, health, sociability, economic mobility, and criminal justice.4 By underinvesting in early childhood programs, California’s policymakers are missing opportunities to address achievement disparities before they even develop. As a result, the state spends more later on less effective programs and more costly solutions.
Investments that support children during early childhood are an essential long-term investment in California’s future. Heckman’s research shows that investing in kids early on is critical to preventing achievement gaps. Disparities in achievement and opportunity open early in children’s lives and, once present, are more difficult to resolve and more likely to persist throughout childhood and adulthood. While high-income families are spending tens of thousands of dollars annually on support systems for their youngest children, most of California’s infants and toddlers receive stunningly little. This inequity threatens California’s ability to ensure a well-prepared workforce and a stable society.
Additionally, California’s future workforce will be smaller than its current workforce. Research conducted by Professor Dowell Myers of the University of Southern California tells us that now, more than ever, it is crucial to ensure that every single child is prepared to succeed. In 1970, children made up 33 percent of California’s population; by 2030 that figure is expected to decline to 21 percent.5 Coupled with a projected shift in the ratio of seniors to working-age adults, soon there will be insufficient children prepared to fill roles as employees and adult consumers. California’s policymakers must help ensure that all babies born today, and those who immigrate or move here, succeed.
For a strong California future, policymakers must commit to a big goal: establish a child-centered, comprehensive and sustainable network of quality services and supports, starting before birth, to ensure all kids have equitable opportunities to reach their full potential.
It is a complicated challenge. It will require a focus on multiple programs and policy areas that address the diverse needs of California’s children across regions, race and income levels. It will also require an approach that makes services and systems of support interconnected, efficient and sensible for families.
In a state known for innovation, California’s leaders must make sure that every California baby has the opportunity to reach his or her full potential—starting now.
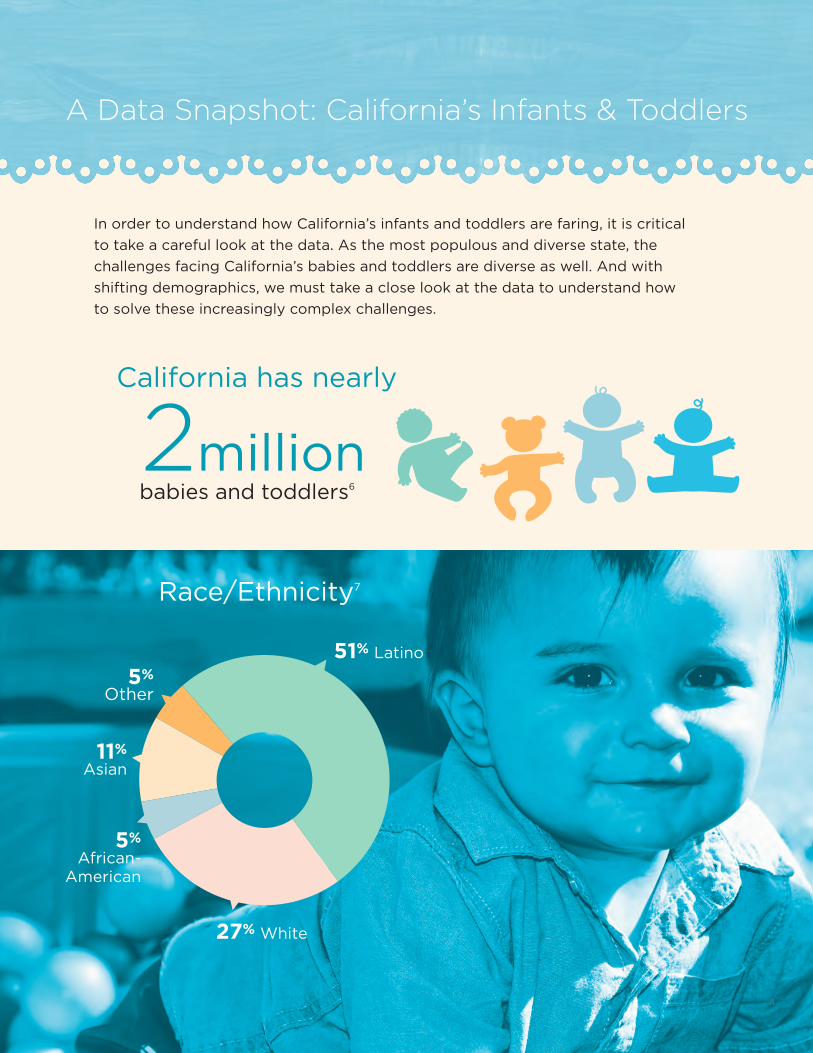
In order to understand how California’s infants and toddlers are faring, it is critical
to take a careful look at the data. As the most populous and diverse state, the
challenges facing California’s babies and toddlers are diverse as well. And with
shifting demographics, we must take a close look at the data to understand how
to solve these increasingly complex challenges.
4
5%
Other
5%
African-American
11% Asian
51% Latino
27% White
A Data Snapshot: California’s Infants & Toddlers
California has nearly
babies and toddlers6
2million
Race/Ethnicity7

Infants and toddlers in California are vulnerable to neglect, trauma and health or developmental delays due to familial economic hardship, housing insecurity and immigration status.
5
62%
of babies are born into low-income households12 (200% of federal poverty
level or below)
Insecure housing:
Children under age three who experience residential mobility14
Homeless or did not have a place to sleep (during pregnancy)15
24%
2.9%
Households
A Data Snapshot: California’s Infants & Toddlers
13%
of infants and toddlers live in families with parents who are unemployed13
49.5%
of children live in immigrant families (one or more parent was born outside the U.S.)16
For infants and toddlers in California, child care with licensed, quality providers is largely unavailable and often prohibitively expensive.
This is more than 70% of the salary of a single, minimum wage earner ($18,720) or more than 20% of state median income for a two-parent family ($64,828) in California.11
Average annual cost of child care:10
$13,327
child care center
$8,462
family child care home (2014)
25%
availability of child care for potential demand8
Availability of child care by type of facility: 9
2% child care center
39% family child care
Child Care

A Data Snapshot: California’s Infants & Toddlers
Race/Ethnicity 49.2% Latino
29.3% White
15.3% Asian/Pacific Islander 5.7% African-American
6
30.1%
of moms speak a
non-English language
at home
37.9%
of moms were born
outside the U.S.
5.6%
age 15–19
Age of mother at time of birth
74.5%
age 20–34
19.9%
age 35+
In order to understand the challenges facing California’s infants and toddlers, it is
important to understand the challenges faced by their mothers. Research shows a
clear connection between maternal education, income and access to support, and their
children’s healthy development and learning in infancy and beyond.
Maternal Demographics17
57%
of women with infants
are in the labor
force
39.7%
of new moms are unmarried, up 7% in the last decade
1 in every 6babies are born to a mom who did not complete high school
38.9%
of new moms live in high-poverty neighborhoods

A Data Snapshot: California’s Infants & Toddlers
Many of California’s babies are vulnerable to poor health outcomes, neglect and
abuse from a very young age.
Health & Welfare
7
25,000
50%
of children who die from abuse or neglect are under age one and 75% are 0–322
8.6%
of infants are born preterm18 (all live births less than 37 weeks of gestation)
6.8%
of infants are born at low birthweight19 (less than 5 lbs., 8 oz.)
32%
of kids entering foster care are age 0–320
2.9 Asian/Pacific Islander
4.0 White
4.9 Latino
5.7 American Indian/
Alaska Native
10.2 Multi-racial
10.2 African-American
Infant Mortality by Race/Ethnicity21 per 1000 live births
approximate number of babies under age one reported as maltreated each year23

8
The following pages include high-level policy
goals and solutions to better serve California’s
infants and toddlers. The strategies presented
are organized into four categories:
Promote Healthy Children
Enrich Early Learning
Strengthen Communities
Foster Strong Families
9
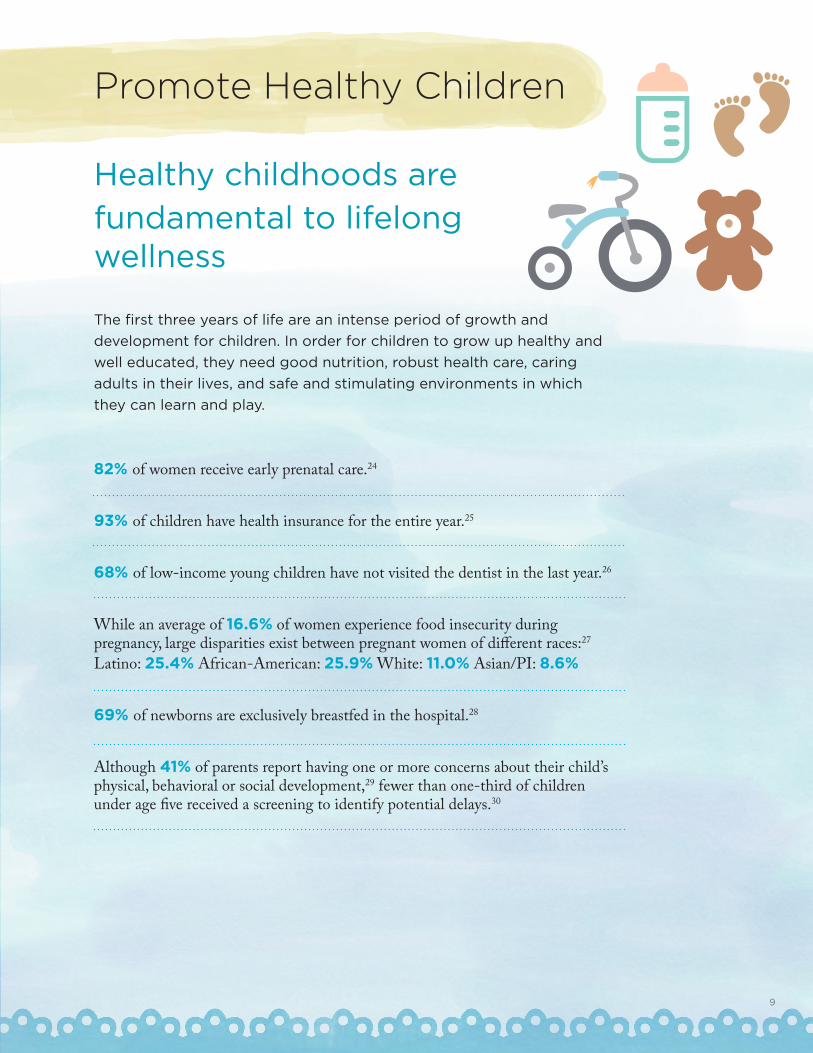
Promote Healthy Children
Healthy childhoods are
fundamental to lifelong wellness
The first three years of life are an intense period of growth and
development for children. In order for children to grow up healthy and
well educated, they need good nutrition, robust health care, caring
adults in their lives, and safe and stimulating environments in which
they can learn and play.
82% of women receive early prenatal care.24
93% of children have health insurance for the entire year.25
68% of low-income young children have not visited the dentist in the last year.26
While an average of 16.6% of women experience food insecurity during pregnancy, large disparities exist between pregnant women of different races:27
Latino: 25.4% African-American: 25.9% White: 11.0% Asian/PI: 8.6%
69% of newborns are exclusively breastfed in the hospital.28
Although 41% of parents report having one or more concerns about their child’s physical, behavioral or social development,29 fewer than one-third of children under age five received a screening to identify potential delays.30

Promote Healthy Children
10
Goals & Policy Opportunities
Goal: Children and their parents and caregivers have robust, continuous and affordable health coverage and health care services.
Policy Opportunities:Maximize enrollment in health coverage programs like Medi-Cal, and ensure a comprehensive scope of benefits and access to medical, dental, vision, mental health, and substance abuse services.
Prioritize and incentivize health care system innovation and quality improvement initiatives aimed at improving health outcomes for pregnant women and young children.
Goal: Children grow up healthy and stay on track developmentally.
Policy Opportunities: Ensure that all children receive regular, routine developmental screenings in health care settings, and are linked to needed supports as appropriate.
At the state level, incentivize the development of county and regional mechanisms such as Help Me Grow that seamlessly link children with supports and intervention as needed.
Goal: Pregnant women, children and their families are nourished and healthy.
Policy Opportunities:Assess progress, and identify barriers and any additional resources necessary to achieve statewide adoption of the Ten Steps to Successful Breastfeeding in hospitals.
Maximize enrollment in WIC and CalFresh for eligible families and individuals.

Promote Healthy Children
*All quoted text pulled from the Help Me Grow website.
11
Goal: Young children are not abused or neglected, and receive robust services to heal from maltreatment.
Policy Opportunities: Develop policies and encourage state entities to enter into agreements to share real-time electronic information between agencies engaged in protecting children and preventing abuse (e.g. law enforcement, Child Protective Services, public health agencies, hospitals and doctors, schools, and early childhood centers).
Ensure that all professionals working with young children and families complete coursework or training on trauma-informed practices, and the identification and reporting of child abuse and neglect.
Expand access to timely, high-quality services that reduce the impact of trauma on young children.
Program Highlight
Help Me Grow
Families often become overwhelmed with the burden of identifying and navigating the multiple systems and services they may need, resulting in missed opportunities to address important issues facing the child or family. Improving service coordination makes it easier for providers to refer their clients and patients to appropriate resources, increasing the likelihood of screenings and referrals. One example of a promising approach to improving service navigation for families and providers has been the development of Help Me Grow systems across California counties. “Help Me Grow is a system that builds collaboration across sectors, including child health care, early care and education, and family support. Through comprehensive physician and community outreach and centralized information and referral centers, families are linked with needed programs and services. Ongoing data collection and analysis helps identify gaps in and barriers to the system.”*
Fourteen California counties are affiliates of Help Me Grow, with an additional 17 exploring implementing Help Me Grow in their counties. For more information, visit: www.helpmegrownational.org.

12
Foster Strong Families
Babies need supported parents
Children succeed when parents and caregivers feel competent and
confident in their roles, and empowered to foster and sustain their
child’s health and learning. Regardless of whether a child lives with one or
both parents, a relative caregiver or a foster family, it is critical that his or her basic
needs for food, housing and income are met. It is also critical that caregivers
have access to resources and support to foster healthy child development and
bonding.
38% of families receiving CalWORKS have at least one child under age three.31
54.1% of mothers participated in WIC during pregnancy.32 24.9% of mothers received CalFresh during pregnancy.33
65% of California children from birth to age three live in poverty or other circumstances with potential to jeopardize their learning, health and well-being.34
1 in 7 women experience postpartum depression, the most common complication from child birth. Postpartum depression can negatively affect the health and safe development of the infant.35
46.7% of California’s parents and caregivers experienced trauma as children. Adverse Childhood Experiences (ACEs)—including abuse, neglect and experiencing or witnessing violence—can have lifelong influence on a parent or caregiver’s health, behavior and well-being, including how they negotiate the demands of caring for a young child.36
13
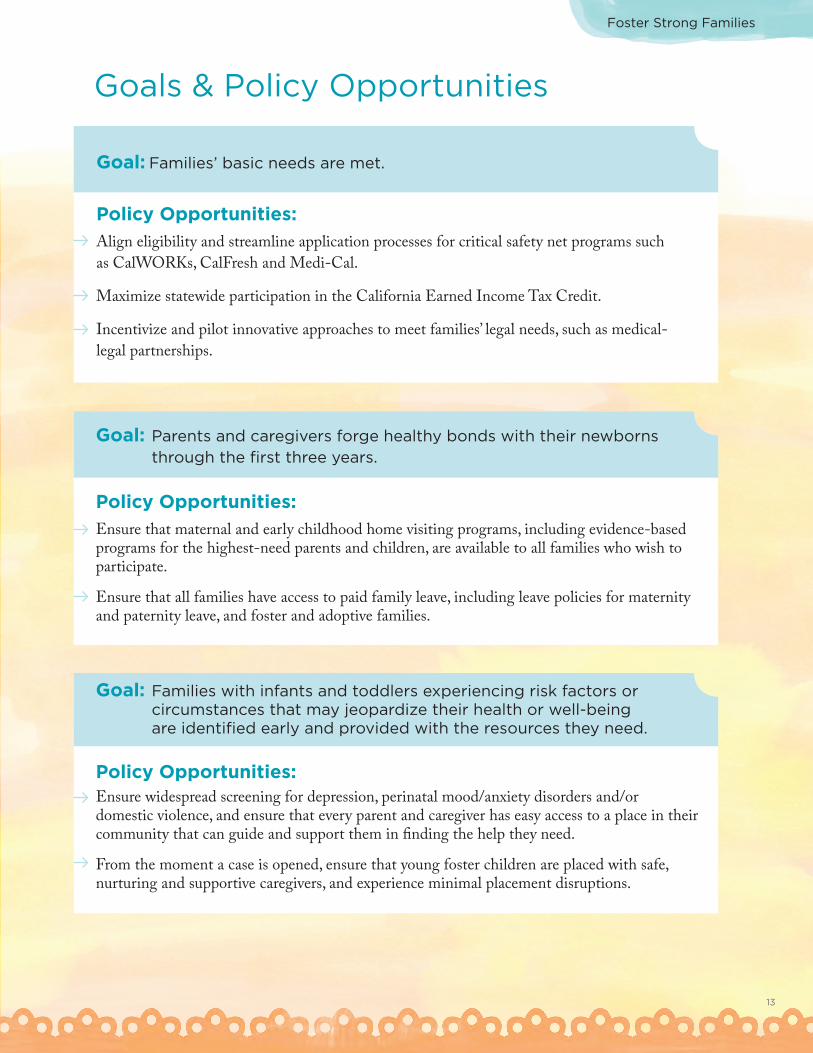
Goal: Families’ basic needs are met.
Policy Opportunities:
Align eligibility and streamline application processes for critical safety net programs such as CalWORKs, CalFresh and Medi-Cal.
Maximize statewide participation in the California Earned Income Tax Credit.
Incentivize and pilot innovative approaches to meet families’ legal needs, such as medical- legal partnerships.
Goal: Parents and caregivers forge healthy bonds with their newborns through the first three years.
Policy Opportunities:
Ensure that maternal and early childhood home visiting programs, including evidence-based programs for the highest-need parents and children, are available to all families who wish to participate.
Ensure that all families have access to paid family leave, including leave policies for maternity and paternity leave, and foster and adoptive families.
Goal: Families with infants and toddlers experiencing risk factors or circumstances that may jeopardize their health or well-being are identified early and provided with the resources they need.
Policy Opportunities: Ensure widespread screening for depression, perinatal mood/anxiety disorders and/or domestic violence, and ensure that every parent and caregiver has easy access to a place in their community that can guide and support them in finding the help they need.
From the moment a case is opened, ensure that young foster children are placed with safe, nurturing and supportive caregivers, and experience minimal placement disruptions.
Goals & Policy Opportunities
Foster Strong Families
14
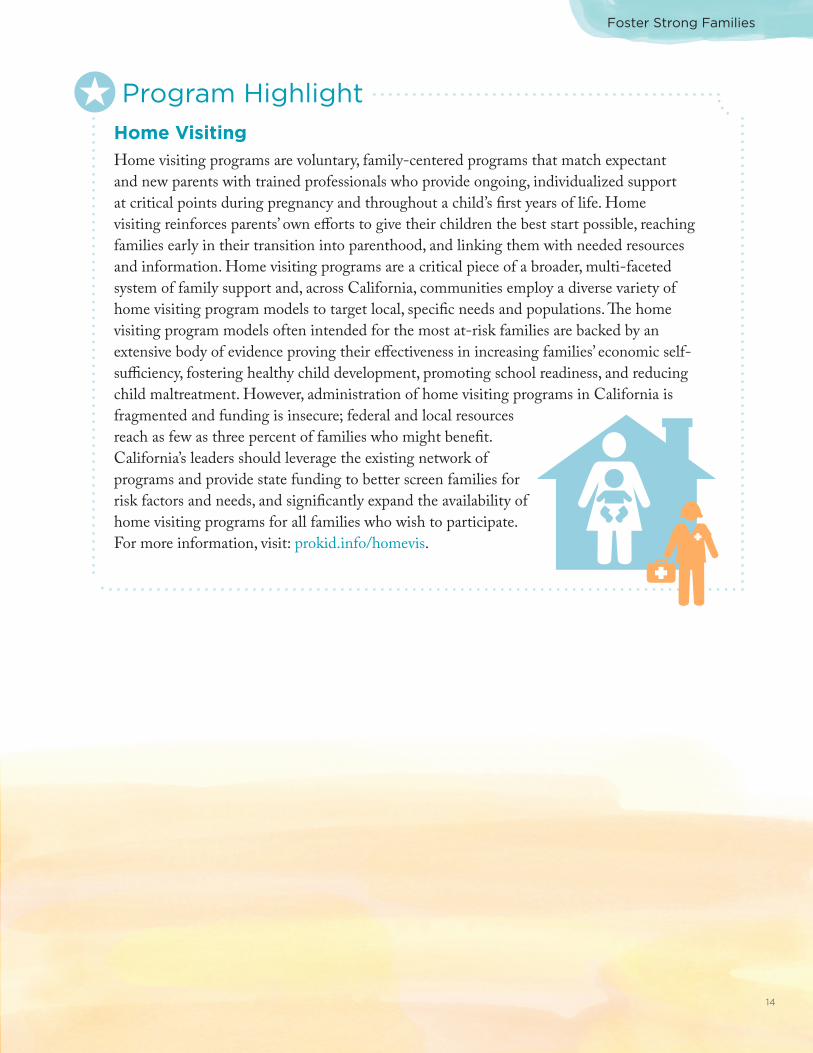
Program Highlight
Home Visiting
Home visiting programs are voluntary, family-centered programs that match expectant and new parents with trained professionals who provide ongoing, individualized support at critical points during pregnancy and throughout a child’s first years of life. Home visiting reinforces parents’ own efforts to give their children the best start possible, reaching families early in their transition into parenthood, and linking them with needed resources and information. Home visiting programs are a critical piece of a broader, multi-faceted system of family support and, across California, communities employ a diverse variety of home visiting program models to target local, specific needs and populations. The home visiting program models often intended for the most at-risk families are backed by an extensive body of evidence proving their effectiveness in increasing families’ economic self-sufficiency, fostering healthy child development, promoting school readiness, and reducing child maltreatment. However, administration of home visiting programs in California is fragmented and funding is insecure; federal and local resources reach as few as three percent of families who might benefit. California’s leaders should leverage the existing network of programs and provide state funding to better screen families for risk factors and needs, and significantly expand the availability of home visiting programs for all families who wish to participate. For more information, visit: prokid.info/homevis.
Foster Strong Families
15
Enrich Early Learning
Enriching early learning experiences help children grow and thrive High-quality early learning programs and developmentally appropriate
enrichment activities in the infant/toddler years help children succeed in
school and in life. Every family needs equitable access to affordable, culturally
relevant and quality early learning settings for their youngest children.
Early Head Start provides infants and toddlers early childhood development support and resources, but only 4% of eligible families are served in California.37
57% of mothers with infants are in the labor force.38
Statewide, licensed child care capacity is only enough to serve 20% of all infants and toddlers age zero to two.39
Child care subsidies serve only 5% of California’s infants and toddlers, although roughly half could be eligible according to income criteria.40
Only 62% of kids under age six are read to every day:41
Latino: 54%; White: 77%; African-American: 64%; Asian: 62%
Nearly 43% of K–12 students (English Language Learners and Fluent English Proficient) speak a language other than English in their homes. 73% of ELL students are in elementary grades, 17% of ELL students read at grade level in third grade.42
16
Goal: Adults have the information, skills and support they need to help children learn.
Policy Opportunities: Ensure every community has access to formal education programs that offer parents and caregivers tools, information and guidance (such as the Positive Parenting Program, Baby College and the Incredible Years).
Ensure every community offers opportunities for caregivers to learn about early social/emotional and cognitive development, and that caregiver-ready tools to promote healthy attachment, early language, numeracy and problem-solving skills are available.
Goal: Child care and development programs for infants and toddlers are affordable, accessible and meet the needs of families.
Policy Opportunities: Ensure that all families with infants and toddlers have access to stable, high-quality child care, including sufficient subsidies for low-income families, foster children and families experiencing circumstances of need or risk.
Ensure that the most vulnerable families have access to dual-generation, comprehensive programs, such as Early Head Start.
Expand programs, like the Family Child Care Home Education Network, to increase the quality of available care for infants and toddlers.
Goals & Policy Opportunities
Enrich Early Learning
Goal: Child care for infants and toddlers is high quality.
Policy Opportunities: Institute annual health and safety visits and coordinate oversight for licensed child care settings, raise and unify program standards to reduce caregiver-child ratios, promote continuity of care, ensure developmentally appropriate practices, and effectively support dual language learners.
Fully invest in a statewide, locally-driven Quality Rating and Improvement System (QRIS) to assist all licensed child care programs and early childhood educators with training, tools and resources to improve their practice and establish a tiered reimbursement rate system that covers the cost of quality care.
17
Program Highlight
Early Head Start
Early Head Start (EHS) is a federal-to-local grant program designed to serve infants and toddlers under the age of three, and pregnant women. Early Head Start provides early, continuous, intensive, and comprehensive child development and family support services to low-income pregnant women, infants, toddlers, and their families. All EHS programs serve families through a full day, full year program option that best meets the needs of their families. Program options are determined through the data collected from community needs assessments and conversations with families, which allows EHS to comprehensively and flexibly meet the needs of families. Early Head Start programs are offered in a variety of settings including home-based, center-based, family child care, combined care, and programs for seasonal/migrant families. Only four percent of eligible children are served by Early Head Start. The federal government recently created the Early Head Start Child Care Partnerships grant program, which leverages the knowledge, training and quality standards present within Early Head Start programs to partner with local child care providers to enrich their programs and staff training. California’s leaders should incentivize and promote such partnerships to help strengthen the quality of existing programs, in addition to funding the expansion of EHS directly. For more information, visit: https://eclkc.ohs.acf.hhs.gov/hslc/hs.
Enrich Early Learning

18
Strengthen Communities
Safe, supportive communities
make for successful kids
The neighborhoods and communities in which kids grow up have an enormous
bearing on children’s future success. Ensuring that all children get a healthy,
equitable start requires that families, community members and local and state
policy leaders work together on behalf of kids to create safe communities.
It is imperative that we support, grow and, where necessary, implement
programs and policies that promote parent and caregiver civic engagement,
expand opportunities for safe play, increase connections between parents
and caregivers, and promote the healthy development of young children in
California’s diverse communities.
Percent of children who live in neighborhoods with the following four features: a park, sidewalks, library, and community center :43 Latino: 59.7%; White (non-Latino): 73.2%; African-American (non-Latino): 86.8%; Other (non-Latino): 70.9%
38.9% of women live in high-poverty neighborhoods at the time they give birth. 44
6.3% of California’s children 0–4 have active asthma.45 Nearly 5,000 children 0–4 were hospitalized due to asthma in 2014.46
18.3% of California’s children live in communities their parents consider unsafe.47
Many of California’s children live in neighborhoods in disrepair: 13.6% live in neighborhoods with poorly kept/rundown housing; 18.8% live in neighborhoods with vandalism/broken windows/graffiti.48
Nationally, 48.7% of children ages 2–5 are exposed to physical assault and 21% witness violence each year.49
Children who grow up with domestic violence are 6X more likely to commit suicide and are 50% more likely to abuse drugs and alcohol.50
19
Goal: Neighborhoods are safe and foster kids’ healthy growth and development.
Policy Opportunities: Support policies that increase healthy air quality and safe water, and minimize exposure to toxins.
Increase number and safety of publicly-managed parks, open spaces, walking paths, and trails in low-income communities, including special play zones for toddlers.
Goal: Families are connected with one another and to their communities.
Policy Opportunities: Sustain and scale efforts of local First 5 Commissions, libraries, hospitals and community-based organizations to provide family-friendly, informal opportunities and space for parents and caregivers to gather.
Support policies and programs that address the physical and emotional harm to pregnant women, children, families, and communities caused by historic, structural racism and segregation.
Goal: Children are healthy and thrive, regardless of where they live.
Policy Opportunities: Coordinate efforts of public and private stakeholders to invest state and philanthropic resources to reduce persistent place-based health and educational disparities.
Foster community engagement in local and state government decision-making, such as parent and caregiver councils in early learning programs and representation on public service system boards.
Goals & Policy Opportunities
Strengthen Community
*All quoted text pulled from The Magnolia Community Initiative website.
20
Program Highlight
The Magnolia Community Initiative
The Magnolia Community Initiative (MCI), established by The Children’s Bureau in Los Angeles, California, is an “effort to transform an entire community by uniting the residents, public and private organizations to change how both residents and organizations think and act, and to change how parents behave, with the ultimate goal of improving outcomes for an entire community of vulnerable, low-income children in Los Angeles.”* The MCI focuses on a neighborhood catchment of a 500 square block area near downtown Los Angeles, which consists of about a dozen neighborhoods that are home to 110,000 residents, including 35,000 vulnerable children and youth. The Children’s Bureau conceived of the MCI after engaging in an analysis of what it would take to best ensure children were raised in “safe and supportive environments in which children achieve the best results and live free of abuse and neglect (Shonkoff & Phillips, 2000). These four goal areas anchor the Initiative: educational success, good health, economic stability and safe and nurturing parenting.”* California’s leaders should incentivize and support local, place-based initiatives that encourage community engagement, and coordinated services that promote child and family well-being. For more information, visit: magnoliaplacela.org.
Strengthen Community
21
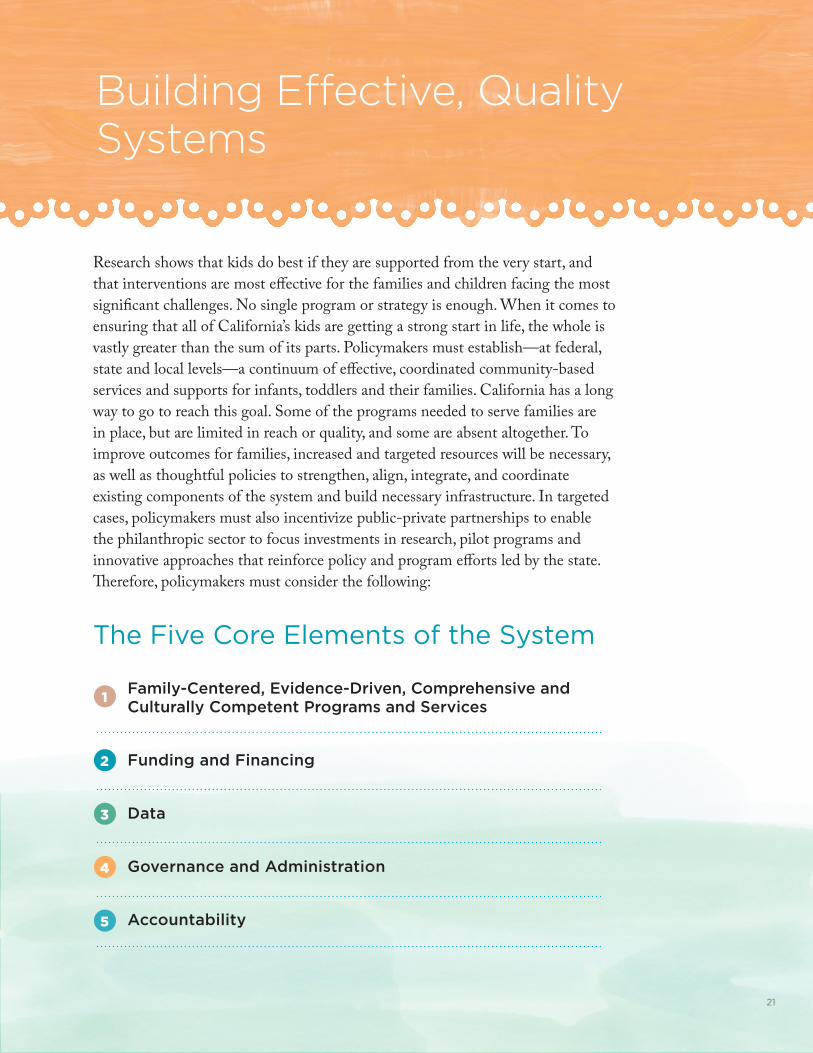
Research shows that kids do best if they are supported from the very start, and that interventions are most effective for the families and children facing the most significant challenges. No single program or strategy is enough. When it comes to ensuring that all of California’s kids are getting a strong start in life, the whole is vastly greater than the sum of its parts. Policymakers must establish—at federal, state and local levels—a continuum of effective, coordinated community-based services and supports for infants, toddlers and their families. California has a long way to go to reach this goal. Some of the programs needed to serve families are in place, but are limited in reach or quality, and some are absent altogether. To improve outcomes for families, increased and targeted resources will be necessary, as well as thoughtful policies to strengthen, align, integrate, and coordinate existing components of the system and build necessary infrastructure. In targeted cases, policymakers must also incentivize public-private partnerships to enable the philanthropic sector to focus investments in research, pilot programs and innovative approaches that reinforce policy and program efforts led by the state. Therefore, policymakers must consider the following:
The Five Core Elements of the System
Family-Centered, Evidence-Driven, Comprehensive and Culturally Competent Programs and Services
Funding and Financing
Data
Governance and Administration
Accountability
Building Effective, Quality Systems
1
2
3
4
5

22
The Five Core Elements of the System
Family-Centered, Evidence-Driven, Comprehensive and Culturally Competent Programs and Services
• Identify and evaluate promising programs and scale what works.• Ensure that services and programs serving families are responsive to diverse
cultural and linguistic needs. • Consider parent and child health and mental health to be foundational to kids’
healthy growth and development.
Building Effective Systems
Funding and Financing
• Target new resources to the most vulnerable children and families, and augment investments so that ultimately all public systems serving kids have the resources they need to effectively care for children.
• Align county, state and federal funding to maximize current investments in services for pregnant women and very young children.
• While preserving entitlements, facilitate layering and braiding across funding streams to maximize resources available for high-need families and reduce bureaucratic challenges for providers.
• Explore additional financial incentives that can be leveraged by programs and professionals serving families, such as Professional Development stipends, tax credit packages or property tax exemptions for early childhood programs.
Data
• At birth, assign unique identifiers to each and every child in California to track services and impacts across multiple systems, and strengthen data collection to inform policy and investments.
• Recognizing the importance of client privacy, identify opportunities to link and measure data across state systems to support understanding of program reach, effectiveness, gaps, and opportunities for improvement.
• Establish shared state and local goals, tied to measurable indicators, and commit to using data to understand how conditions for children change over time.
1
2
3

23
Governance and Administration
• To increase stability, maximize utilization and reduce administrative burdens, connect learning, health and family support service providers to one another at the local level through strategic infrastructure development, including shared data systems, seamless referral pathways, aligned eligibility guidelines, and integrated services in community settings.
• Assess gaps in access and services statewide.• Leverage and build upon existing local infrastructure, knowledge, and
partnerships established by local First 5 Commissions, county departments and philanthropic initiatives.
Building Effective Systems
Accountability
• Utilize kindergarten entry as a checkpoint to measure young children’s growth and development in order to assess how well systems are serving children, families and caregivers, from pregnancy to kindergarten entry. This will enable policymakers to better understand where investments should be made.
• Develop a statewide dashboard of children’s opportunities and outcomes that articulates California’s vision for all children, starting at birth. Require publicly funded entities to work together in order to be held accountable for—and supported in—continuous improvement strategies, thereby raising service quality and reducing health and educational disparities among children.
4
5
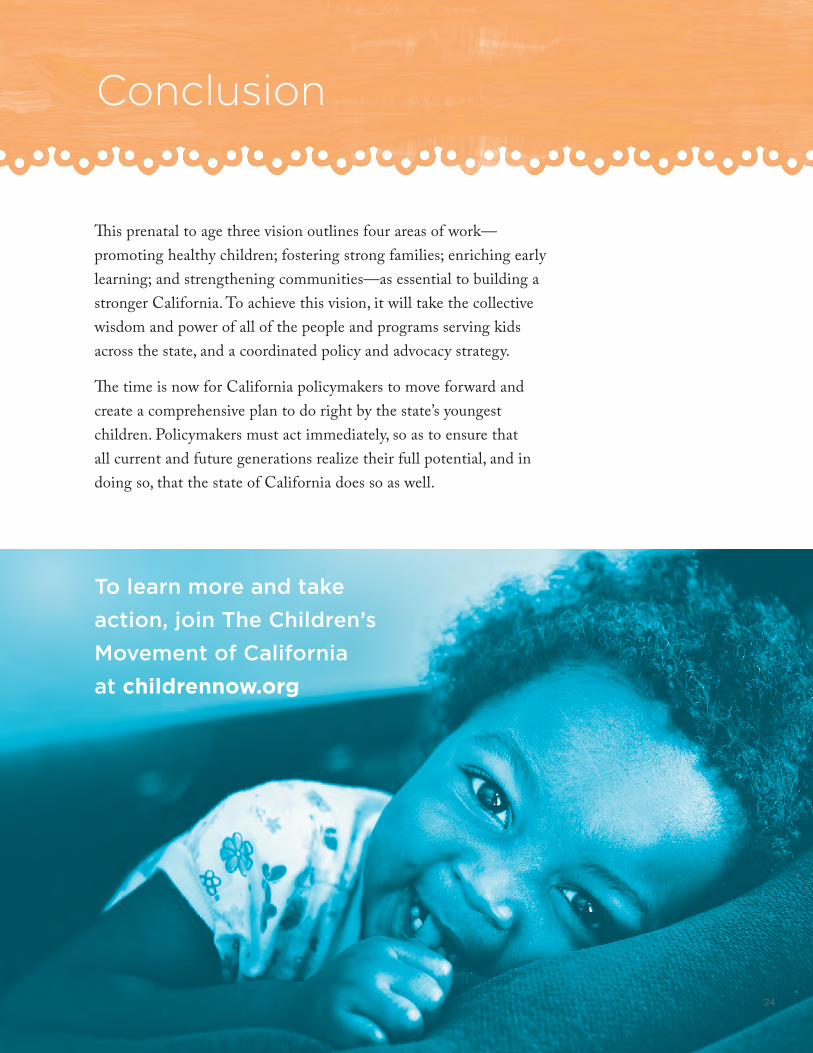
This prenatal to age three vision outlines four areas of work—promoting healthy children; fostering strong families; enriching early learning; and strengthening communities—as essential to building a stronger California. To achieve this vision, it will take the collective wisdom and power of all of the people and programs serving kids across the state, and a coordinated policy and advocacy strategy.
The time is now for California policymakers to move forward and create a comprehensive plan to do right by the state’s youngest children. Policymakers must act immediately, so as to ensure that all current and future generations realize their full potential, and in doing so, that the state of California does so as well.
To learn more and take
action, join The Children’s
Movement of California
at childrennow.org
Conclusion
24
25
CreditsStarting Now: A Policy Vision for Supporting the Healthy Growth and Development of Every California Baby reflects the collective effort of staff throughout the organization.
Writing, research and editorial review provided by: Adrienne Bell, Isabel French, Stacy Lee, Ted Lempert, Kendra Rogers, Angela Rothermel and Amy Silva.
Policy analysis provided by: Kelly Hardy, Jessica Haspel, Susanna Kniffen, Kate Miller, Mike Odeh, Kendra Rogers, Angela Rothermel and Samantha Tran.
Design by: Jennifer Hoffecker
Acknowledgments We would like to thank the Chan Zuckerberg Initiative and The David and Lucile Packard Foundation for their generous support for the development of this report. This report reflects the opinions of the authors alone and does not necessarily reflect those of the funders.
Special thanks to all of Children Now’s generous individual supporters who help make our work possible.

26
Endnotes
1. Children Now calculation based on the total birth to age three population in California (1,382,275) and the total number of children receiving home visiting in California (41,381).
2. “Child Maltreatment Data: Age of Child Victims.” U.S. Department of Health and Human Services, 2013, http://cwoutcomes.acf.hhs.gov/data/overview. Web Jan. 2017. As cited in <https://www.zerotothree.org/resources/1133-california-state-baby-facts>
3. “2016 California Children’s Report Card,” Children Now, Jan. 2016 <https://www.childrennow.org/files/6214/5192/8816/CN-2016CAChildrensReportCard.pdf>
4. Heckman, James, Garcia, Jorge Luis et al. “The Life-cycle Benefits of an Influential Early Childhood Program.” The University of Chicago Department of Economics, 2016. Web Jan 2017 <https://heckmanequation.org/assets/2017/01/abc_comprehensivecba_2016-12-05a_jld.pdf>
5. Myers Ph.D, Dowell “California’s Diminishing Resource: Children” 2013, USC Price Sol Price School of Public Policy, Web Jan. 2017 <http://popdynamics.usc.edu/pdf/2013_Myers_Californias-Diminishing-Children.pdf>C12
6. Children Now calculation based on total child population by age under 1, age 2 and age 3. “Child Population By Single Age” Kids Count Data Center, 2015. Web Dec. 2016 <http://datacenter.kidscount.org/data/tables/100-child-population-by-single-age?loc=1&loct=2#detailed/2/2-52/false/573,869,36,868,867/42,43,44,45,46,47,48,49,50,51,52,53,54,55,56,57,58,59,60,61/418>
7. “Infants, Spotlight on Key Indicators: Demographics” Kidsdata.org, 2013. Web Dec. 2016. <http://www.kidsdata.org/demographic/3/infants/summary#17/demographics>
8. “Availability of Child Care for Potential Demand” Kidsdata.org, 2014. Web Dec. 2016. <http://www.kidsdata.org/demographic/3/infants/results#ind=&grp=17,15&say=>
9. “All Data: Infants” kidsdata.org 2013. Web Dec. 2016. <http://www.kidsdata.org/demographic/3/infants/results#ind=&grp=17,15&say=>
10. “All Data: Infants” kidsdata.org 2013. Web Dec. 2016. <http://www.kidsdata.org/demographic/3/infants/results#ind=&grp=17,15&say=>
11. “2015 California Child Care Portfolio” California Child Care Resource and Referral Network, 2015. Web Jan. 2017 <https://d3n8a8pro7vhmx.cloudfront.net/rrnetwork/pages/204/attachments/original/1447951101/California_11-18-15_FINAL.pdf?1447951101>
12. “Maternity Care in California: Delivering the Data,” California Health Care Almanac, June 2016. Web Jan. 2017 <http://www.chcf.org/~/media/MEDIA%20LIBRARY%20Files/PDF/ PDF%20M/ PDF%20MaternityCareCalifornia2016.pdf>
13. “Young Child Risk Calculator.” National Center for Children in Poverty, 2015. Web Jan. 2017 As cited in <https://www.zerotothree.org/resources/1133-california-state-baby-facts>
14. “Young Child Risk Calculator.” National Center for Children in Poverty, 2015, www.nccp.org. Web Jan 2017. As cited in <https://www.zerotothree.org/resources/1133-california-state-baby-facts>
15. “MIHA Data Snapshot, California by Total Live Births” Maternal Infant Health Assessment Survey, California Department of Public Health 2013-14. Web Jan. 2017. <http://www.cdph.ca.gov/data/surveys/MIHA/MIHASnapshots/SnapshotbyTotalLiveBirths2013-2014.pdf>
16. “Children living with foreign born parents” Kidsdata.org 2014. Web Jan.2017 <http://www.kidsdata.org/demographic/23/children-living-with-foreign-born-parents/summary#133/demographics>
17. “MIHA Data Snapshot, California by Total Live Births” Maternal Infant Health Assessment Survey, California Department of Public Health 2013-14. Web Jan. 2017. <http://www.cdph.ca.gov/data/surveys/MIHA/MIHASnapshots/SnapshotbyTotalLiveBirths2013-2014.pdf>
18. “Preterm and Very Preterm Births by County 2010-2013.” California Health and Human Services Open Data Portal, Updated 2016. Web Dec. 2016. <https://chhs.data.ca.gov/Diseases-and-Conditions/Preterm-and-Very-Preterm-Births-by-County-2010-201/gnv5-2vzx >
19. “Infants, Spotlight on Key Indicators: Infants Born at Low Birthweight and Preterm Births” Kidsdata.org, 2013. Web Dec 2016. <http://www.kidsdata.org/topic/56/low-birthweight-and-preterm-births/summary>
20. “Child Maltreatment Data: Age of Child Victims.” U.S. Department of Health and Human Services, 2013, http://cwoutcomes.acf.hhs.gov/data/overview. Web Jan, 2017. As cited in <https://www.zerotothree.org/resources/1133-california-state-baby-facts>
21. “Infant Mortality, Deaths Per 1,000 Live Births (LGHC Indicator 01)” California Health and Human Services Open Data Portal, Updated 2016. Web Dec. 2016. <https://chhs.data.ca.gov/Diseases-and-Conditions/Infant-Mortality-Deaths-Per-1-000-Live-Births-LGHC/brqa-f9iz>
22. “Within Our Reach: A National Strategy to Eliminate Child Abuse and Neglect Fatalities” Commission to Eliminate Child Abuse and Neglect Fatalities, 2016. Web Jan. 2017. <https://www.acf.hhs.gov/cb/resource/cecanf-final-report>
23. Putnam-Hornstein, Emily, Mitchell, Michael N. “Cumulative Risk of Child Protective Service Involvement before Age 5: A Population-Based Examination” 2014, University of Southern California, Children’s Data Network, Web Jan. 2017.
24. California County Scorecard - Indicator: Prenatal, Children Now December 2016. Web Jan. 2017 <http://pub.childrennow.org/2016/indicator/prenatal/>
25. California County Scorecard - Indicator: Insurance, Children Now December 2016. Web Jan. 2017 <http://pub.childrennow.org/2016/indicator/insurance/>
26. California County Scorecard - Indicator: Dentist, Children Now December 2016. Web Jan. 2017 <http://pub.childrennow.org/2016/indicator/dentist/>
27. “MIHA Data Snapshot, California by Total Live Births” Maternal Infant Health Assessment Survey, California Department of Public Health 2013-14. Web Jan. 2017. <http://www.cdph.ca.gov/data/surveys/MIHA/MIHASnapshots/SnapshotbyTotalLiveBirths2013-2014.pdf>
28. California County Scorecard - Indicator: Breastfed, Children Now December 2016. Web Jan. 2017 <http://pub.childrennow.org/2016/indicator/breastfed/>
29. “How many children have parents with one or more concerns about child’s physical, behavioral or social development?”, National Survey of Children’s Health, NSCH 2011/12. Data query from the Child and Adolescent Health Measurement Initiative, Data Resource Center for Child and Adolescent Health website. Web Apr. 2015 <http://www.childhealthdata.org>
30. Indicator 4.16: Developmental screening during health care visit, age 10 months-5 years, National Survey of Children’s Health, NSCH 2011/12. Data query from the Child and Adolescent Health Measurement Initiative, Data Resource Center for Child and Adolescent Health website. Web Feb. 2015 <www.childhealthdata.org>
31. “Table 34: Temporary Assistance for Needy Families –Active Cases Percent Distribution of TANF Youngest Recipient Child by Age, FY 2012.” U.S. Department of Health and Human Services, 2014, www.acf.hhs.gov. Web Jan. 2017. As cited in <https://www.zerotothree.org/resources/1133-california-state-baby-facts>
32. “MIHA Data Snapshot, California by Total Live Births” Maternal Infant Health Assessment Survey, California Department of Public Health 2013-14. Web Jan. 2017. <http://www.cdph.ca.gov/data/surveys/MIHA/MIHASnapshots/SnapshotbyTotalLiveBirths2013-2014.pdf>

27
33. “MIHA Data Snapshot, California by Race/Ethnicity, 2012” California Department of Public Health, 2012. Web Dec. 2016 <http://www.cdph.ca.gov/data/surveys/MIHA/MIHASnapshots/SnapshotbyTotalLiveBirths2013-2014.pdf>
34. Risk factors include poor, single parent, teen mother, low parental education, non-employed parents, residential mobility, households without English speakers, and large family size. American Community Survey 2009-2011, as cited in National Center for Children in Poverty, Young Child Risk Calculator, http:// www.nccp.org/tools/risk/, accessed August 2014.
35. MIHA Data Snapshot, California by Total Live Births Maternal Infant Health Assessment Survey, California Department of Public Health 2013-14. Web Jan. 2017. <http://www.cdph.ca.gov/data/surveys/MIHA/MIHASnapshots/SnapshotbyTotalLiveBirths2013-2014.pdf>
36. Rodriguez, D., et al. (2016). Prevalence of adverse childhood experiences by county, California Behavioral Risk Factor Surveillance System 2008, 2009, 2011, and 2013. Public Health Institute, Survey Research Group. As cited at http://www.kidsdata.org/topic/1969/aces-brfss/table#fmt=2486&loc=2&tf=91&ch=89,90,1273,1256,1274,1259&sortColumnId=0&sortType=asc
37. Blaire, Julie. “Only 42 percent of Eligible Children Participate in Head Start” November, 2013. Web Jan. 2017. <http://blogs.edweek.org/edweek/early_years/2013/11/only_42_percent_of_eligible_children_participate_in_head_start.html>
38. “State Baby Facts, California 2015” ZERO TO THREE 2015. Web Dec. 2016. <https://www.zerotothree.org/resources/1133-california-state-baby-facts#downloads>
39. “California’s Infants and Toddlers; Future Promise, or Missed Opportunities” Child Trends 2015. Web Jan. 2017 <http://www.childtrends.org/wp-content/uploads/2015/06/2015-19CAInfantsandToddlers.pdf>
40. “California’s Infants and Toddlers; Future Promise, or Missed Opportunities” Child Trends 2015. Web Jan. 2017 <http://www.childtrends.org/wp-content/uploads/2015/06/2015-19CAInfantsandToddlers.pdf>
41. “California County Scorecard - Indicator: Young children, ages 0-5, who are read to everyday,” Prenatal, Children Now December 2016. Web Jan. 2017 <http://pub.childrennow.org/2016/indicator/read/>
42. “Facts on English Language Learners - CalEdFacts” California Department of Education 2016. Web Jan. 2017 <http://www.cde.ca.gov/ds/sd/cb/cefelfacts.asp>
43. “Neighborhood Safety Report, Indicator 7.4: Presence of neighborhood amenities, CA vs National” 2011-12 National Survey of Children’s Health. Data Resource Center for Child and Adolescent Health Web Jan. 2017. <http://childhealthdata.org/browse/survey/results?q=2526&r=6&r2=1>
44. “MIHA Data Snapshot, California by Total Live Births” Maternal Infant Health Assessment Survey, California Department of Public Health 2013-14. Web Jan. 2017. <http://www.cdph.ca.gov/data/surveys/MIHA/MIHASnapshots/SnapshotbyTotalLiveBirths2013-2014.pdf>
45. Office of Statewide Health Planning and Development (OSHPD), 2014 Percent with Active Asthma, Ages 0-4. Web Jan. 2017 <http://www.californiabreathing.org/asthma-data/county-asthma-profiles/los-angeles-county-asthma-profile#hospitalizations>
46. Office of Statewide Health Planning and Development (OSHPD), 2014 Asthma hospitalization is a discharge from a licensed acute care hospital in California with the primary diagnosis of asthma, Ages 0-4. Web Jan. 2017 <http://www.californiabreathing.org/asthma-data/county-asthma-profiles/los-angeles-county-asthma-profile#hospitalizations>
47. 2011/12 National Survey of Children’s Health: Neighborhood Safety and Support, California data children age 0-17 Web Jan. 2017. <http://childhealthdata.org/browse/survey/results?q=2524&r=6>
48. 2011/12 National Survey of Children’s Health: Neighborhood Safety and Support, California data children age 0-17 Web Jan. 2017. <http://childhealthdata.org/browse/survey/results?q=2524&r=6>
49. Finkelhor, D., Turner, H. A., Shattuck, A., & Hamby, S. L. (2015). Prevalence of childhood exposure to violence, crime, and abuse: Results from the national survey of children’s exposure to violence. JAMA Pediatrics, 169(8), 746-754. As used here, violence includes assaults, sexual victimization, child maltreatment by an adult, and witnessed and indirect victimization. As cited: <http://www.childtrends.org/indicators/childrens-exposure-to-violence/#_edn1>
50. “10 Startling Statistics About Domestic Violence” Child Domestic Violence Association, 2014. Web Jan. 2017. <http://cdv.org/2014/02/10-startling-domestic-violence-statistics-for-children/>