Embed Size (px)
Citation preview

Starting out in low-skill jobs TOM KARMELTHAM LUDAMIAN OLIVER
LONGITUDINAL SURVEYS OF AUSTRALIAN YOUTHR E S E A R C H R E P O R T 6 4

Starting out in low-skill jobs
Tom Karmel Tham Lu Damian Oliver
NCVER
The views and opinions expressed in this document are those of the author/
project team and do not necessarily reflect the views of the Australian Government
or state and territory governments.
Any interpretation of data is the responsibility of the author/project team.
LONGITUDINAL SURVEYS OF AUSTRALIAN YOUTH
RESEARCH REPORT 64

Acknowledgment
The authors would like to thank the anonymous reviewer and Patrick Lim for their contribution and input to this paper.
© Commonwealth of Australia, 2013
With the exception of the Commonwealth Coat of Arms, the Department’s logo, any material protected
by a trade mark and where otherwise noted all material presented in this document is provided under a
Creative Commons Attribution 3.0 Australia <creativecommons.org/licenses/by/3.0/au> licence.
The details of the relevant licence conditions are available on the Creative Commons website
(accessible using the links provided) as is the full legal code for the CC BY 3.0 AU licence
<creativecommons.org/licenses/by/3.0/legalcode>.
The Creative Commons licence conditions do not apply to all logos, graphic design, artwork and
photographs. Requests and enquiries concerning other reproduction and rights should be directed to the
National Centre for Vocational Education Research (NCVER).
This document should be attributed as Karmel, T, Lu, T & Oliver, D 2013, Starting out in low-skill jobs,
NCVER, Adelaide.
This work has been produced by NCVER through the Longitudinal Surveys of Australian Youth (LSAY)
Program, on behalf of the Australian Government and state and territory governments, with funding
provided through the Australian Department of Education (formerly the Department of Education,
Employment and Workplace Relations).
The views and opinions expressed in this document are those of NCVER and do not necessarily reflect the
views of the Australian Government or state and territory governments.
COVER IMAGE: GETTY IMAGES/THINKSTOCK
ISBN 978 1 922056 62 7
TD/TNC 113.03
Published by NCVER, ABN 87 007 967 311
Level 11, 33 King William Street, Adelaide SA 5000
PO Box 8288 Station Arcade, Adelaide SA 5000, Australia
P +61 8 8230 8400 F +61 8 8212 3436 E [email protected] W <www.ncver.edu.au>
About the research
Starting out in low-skill jobs
Tom Karmel, Tham Lu and Damian Oliver, National Centre for Vocational
Education Research
Many young people start their working lives in low-skill jobs. This report examines whether, for those
who have left full-time education, a low-skill job provides them with a good start to their working
lives, or whether starting out in a low-skill job can have a ‘scarring’ effect on the individual. Here we
define low-skill jobs using levels 4 and 5 of the skill levels allocated by the Australian Bureau of
Statistics (ABS) to each occupation.
Key messages
� As expected, starting out in a low-skill job yields lower wages than starting out in a higher-skilled
job. Five years after leaving full-time education, the wage penalty (conditioning on education and
other characteristics) still exists, but this scarring diminishes over time. However, any job is better
than no job, given that the wage penalty after five years of having no job a year after leaving
full-time education is worse than taking a low-skill job.
� Not surprisingly, young people who possess high human capital (education, ability, and experience)
have more opportunities to move to a high-skill job. Males are more likely to make the transition
to high-skill jobs than females. Young people who are part-time workers are likely to remain in
low-skill jobs, although part-time or casual low-skill jobs can be a positive pathway for young
people to progress into full-time or permanent positions.
� There is no evidence to suggest that young people choose to stay in low-skill jobs for positive
reasons such as high job satisfaction or relatively high wages.
The research underlines the importance of good career guidance, by recognition of labour market
opportunities, for young people as they make their way through senior schooling and post-school
education and training.
Rod Camm
Managing Director, NCVER

NCVER 5
Contents
Tables 6
Executive summary 8
Introduction 10
Background 12
What is meant by low-skill jobs? 12
The Longitudinal Surveys of Australian Youth 13
Attributes of low-skill employment 15
Low-skill employment transition 16
Impact of starting out in low-skill jobs on wages 21
Model 21
Results 22
Leaving low-skill jobs 23
Models 23
Results 24
Final comments 26
References 27
Appendix 28
6 Starting out in low-skill jobs
Tables
1 ABS skill level descriptions 12
2 Records in the LSAY 1998 dataset 14
3 Impact of attrition and censored values 14
4 Characteristics of respondents starting out in low-skill jobs after
leaving full-time education 15
5 Transition between employment and study status of those starting out
in low-skill jobs after leaving full-time education 17
6 Employment and study status of those starting out in low-skill jobs in
each year of five years after leaving full-time education 17
7 Transitions from low-skill employment to return to full-time education
or to not working 18
8 Transition between working hours of those in low-skill employment 18
9 Transition between employment status of those in low-skill
employment 19
10 Wage and occupational status of those starting out in low-skill jobs
across five years after leaving full-time education 19
11 Selective characteristics of those starting out in low-skill jobs and
working in low-skill jobs in the fifth year after leaving full-time
education 20
12 Overall impacts of starting out in low-skill jobs or not working on
the log hourly wage in each of five years after leaving full-time
education, relative to starting out in high-skill jobs 22
13 Likelihood of leaving a low-skill job for a high-skill job: pooled logit
and random effects logit models 25
14 Likelihood of leaving a low-skill job for a high-skill job: pooled logit
and random effects logit models 25
A1 Variables included in the wage models 28
A2 The impact of starting out in low-skill jobs on the hourly wage:
pooled OLS 29
A3 The impact of starting out in low-skill jobs on the hourly wage:
random effects model 30
A4 The impact of starting out in low-skill jobs on the hourly wage:
random effects model with Mundlak corrections 31
A5 Variables included in the logit model estimating the probability of
working in low-skill jobs 32

NCVER 7
A6 The likelihood of working in low-skill jobs by pooled logit and random
effects logit models 33
A7 The likelihood of working in low-skill jobs by pooled logit and random
effects logit models with log (wage) residual 34
A8 The likelihood of working in low-skill jobs by pooled logit and random
effects logit models with log (wage) 35
8 Starting out in low-skill jobs
Executive summary
While governments have initiated policies to encourage higher educational attainment and enhanced
skills in young people to enable labour demand to be met, low-skill jobs are not disappearing. Working
in low-skill jobs is a fact of life for many young people after leaving full-time education, with many of
their jobs not matching their career aspirations or qualifications. The purpose of this research is to
explore the characteristics of young people starting out in low-skill jobs after leaving full-time
education, examine the short- and long-run impact of starting out in low-skill jobs on wage level, and
study the factors that influence young people’s decisions to remain in low-skill jobs or move to high-
skill jobs. The primary issue is whether a low-skill job for a young person is a ‘stepping stone’ or a
‘low-skill trap’.
The definitions of low-skill jobs and high-skill jobs used in this paper are based on the five skill levels
allocated for each occupation in the Australian and New Zealand Standard Classification of
Occupations (ANZSCO). Occupations at skill levels 1, 2 and 3 are classified as high-skill jobs, whereas
those at skill levels 4 and 5 do not typically require post-school qualifications and are categorised as
low-skill jobs. In addition, the term ‘not working’ is used here in the broad sense to refer to young
people who are unemployed or not in the labour force. This study used data from the 1998 base year
cohort of the Longitudinal Surveys of Australian Youth (LSAY Y98) to address the research questions.
The sample used for this analysis is restricted to 5228 young people who completed their full-time
education, who continued to contribute information to the survey, and who had their employment
status known up to five years after leaving full-time education.
The majority of young people who choose low-skill jobs as their career starting point have no post-
school qualifications. There is little evidence of ‘churning’ between low-skill jobs and not working.
Those who transition from low-skill employment to not working are mainly young respondents who are
aged 20 years and under, or those with no post-school qualification. Across five years after leaving
full-time education, many young people starting out in low-skill jobs experience increases in wages
and occupational status and a shift from part-time to full-time employment and from casual to
permanent jobs. After five years around one-third have moved to a high-skill job.
Regression methods are applied to determine the association between starting out in low-skill jobs
and their hourly earnings from one to five years after leaving full-time education. The focus is on the
wage differential in the earnings of young people starting out in low-skill jobs or not working in the
year after leaving full-time education compared with those starting out in high-skill jobs in each of
the five years after leaving full-time education. Importantly, panel estimation techniques are used to
account for individuals having different, but unobserved, attributes that might affect wages (such as
low motivation).
It was found that starting out in low-skill jobs does produce a significantly negative impact on wage
levels and results in a long-term penalty, although the negative impact diminishes over time.
However, the findings also indicate that starting out in low-skill jobs gives better wage outcomes than
having no job at all. Thus there is evidence of scarring, but having a low-skill job is better than no job
at all. This puts a young person facing the offer of a low-skill job in a quandary: take it or wait in
hope for a better offer?
Taking a job involves a choice, and there is the possibility that young people choose or remain in a
low-skill job for good reasons. For example, despite it being a low-skill job, some young people may

NCVER 9
achieve high satisfaction from it or a relatively high wage. To understand the extent to which young
people choose to remain in low-skill jobs or move to high-skill jobs, logit models (again accounting for
unobserved attributes) are fitted.
It was found that males in general have a higher probability of leaving a low-skill job for a high-skill
job than females. Young people who have high human capital such as high qualifications, high ability,
more experience, or work in low-skill jobs with high occupational status are more likely to move to
high-skill jobs. Young people who are part-time workers are likely to remain in low-skill jobs. No
evidence was found to suggest that young people stay in low-skill jobs because of the positive
features of those jobs such as high job satisfaction or high wages.
10 Starting out in low-skill jobs
Introduction
Governments have adopted policies to increase the qualification levels of young people, in particular,
to better equip them for a workforce characterised by less demand for low-skill workers. The
government push for skills implicitly assumes that qualified individuals will end up in jobs where their
skills will be used and is consistent with long-term trends, where employment growth is favouring the
more highly skilled occupations (Aungles et al. 1993; Cully 1999; Bradley et al. 2008, p. 15). However,
low-skill jobs are not disappearing (Cully 2002) and are a natural starting point for many young
people. The primary issue we are interested in is whether low-skill jobs are a useful component of
labour market transitions or whether they can be a low-skill trap for those whose qualifications should
equip them for a more skilled job.
The paper sets out to answer three questions:
� Do low-skill jobs provide a stable employment pathway?
� What is the impact of starting out in low-skill jobs on earnings? That is, is there a long-lasting wage
penalty for taking a low-skill job?
� What factors may influence young people to remain in low-skill employment or progress into high-
skill jobs? Is it possible that some young people stay in low-skill jobs because of positive job
attributes such as relatively high wages or job satisfaction?
Our approach is to focus on young people who have completed their education and who begin their
post-school working lives in a low-skill job. We are not looking here at students with part-time jobs
(see Polidano & Zakirova 2011 for an examination of that issue). To answer these questions, we use
data from the 1998 cohort of the Longitudinal Surveys of Australian Youth (LSAY).
Following this introduction, we provide some background: we define low-skill jobs and identify the
LSAY sample used for this report. The analysis then examines the characteristics of young people who
start out in low-skill jobs after completing their full-time education. The next section considers
whether low-skill jobs provide a stable employment pathway for young people. The issue is addressed
by looking at how young people starting out in these jobs make transitions to other pathways in the
labour market, including progressing into high-skill jobs, returning to full-time education, remaining
in low-skill employment, or exiting the labour market. Starting out in low-skill jobs as a part-time or
casual worker could be an entry point for young people who seek full-time jobs or permanent
positions in the long term. There is little evidence of ‘churning’ between low-skill jobs and not
working, with those moving from low-skill employment to not working being mainly young respondents
who are aged 20 years and under, or those with no post-school qualifications.
The third section of the report examines the relationship between the hourly wages and initial
employment status (after young people complete their full-time study). The main interest is to
determine whether young people who begin in low-skill jobs suffer a wage penalty over time. Panel
estimation methods are employed in this section to address this relationship. The results from wage
equations show that young people starting out in low-skill jobs suffer lower payoffs than those starting
out in high-skill jobs in the first year after leaving full-time education. Five years after leaving full-
time education, the scarring effect still exists but the penalty has diminished. Not working in any job
also impacts negatively on wages and results in a vastly inferior wage outcome than starting out in a

NCVER 11
low-skill job. It indicates that working in any job as a starting point after leaving full-time education
is still a better option than having no job.
The fourth section investigates the impacts of individual characteristics and job attributes on young
people’s choices of staying in low-skill jobs or moving to high-skill jobs. Our interest is whether young
people stay in low-skill jobs for ‘good’ reasons, such as high job satisfaction or better than expected
wages. Panel estimation methods are again used to measure these influences.
We find no evidence to support the idea that there are positive reasons for staying in a low-skill job.
Rather, those who are more likely to leave a low-skill job are those who are older than 20 years, have
high academic ability, or hold a university qualification.
The final part contains some comments on the findings of the study.
12 Starting out in low-skill jobs
Background
This chapter begins with a definition of low-skill jobs and a description of the LSAY data used in the
report. It then examines the characteristics of young people who start out in low-skill jobs after
leaving full-time education.
What is meant by low-skill jobs?
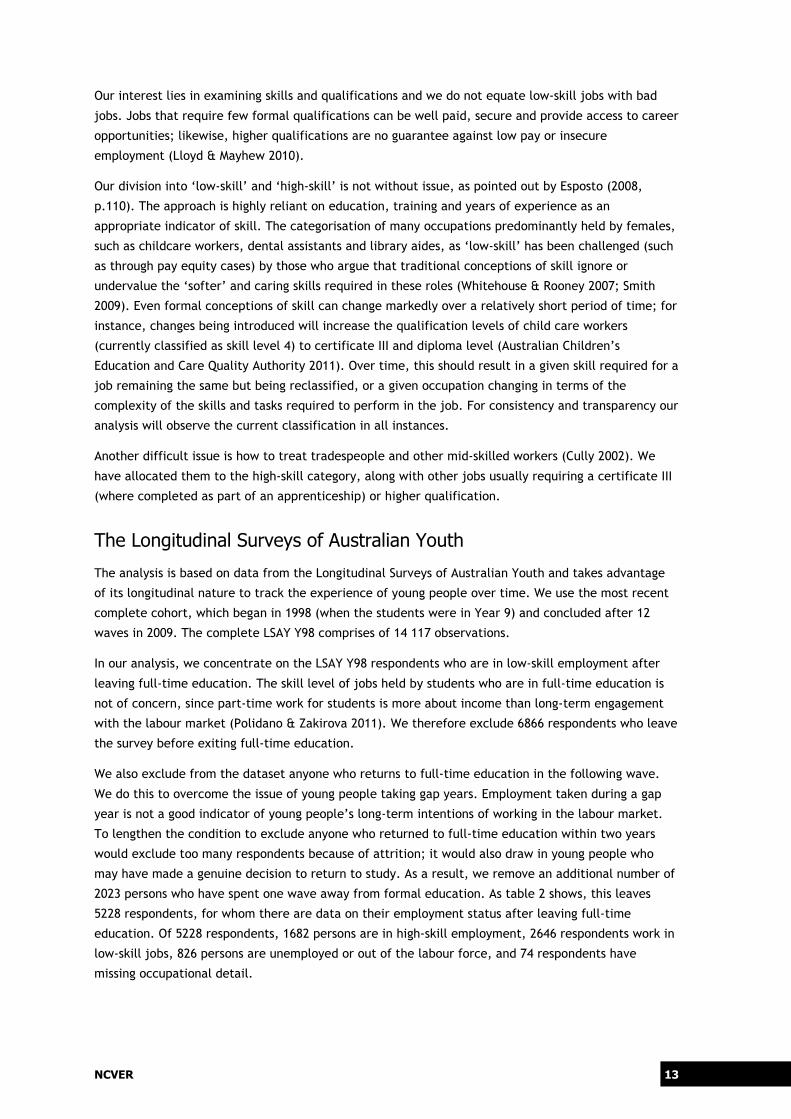
We have defined low-skill jobs using the skill levels as defined in the Australian and New Zealand
Standard Classification of Occupations (ANZSCO). The Australian Bureau of Statistics (ABS) has
allocated each occupation, down to the unit group (4-digit) level of detail, to one of five skill levels.
The ABS is careful to emphasise that this reflects the typical skill level required for an occupation
rather than being a measure of the skills held by people working in an occupation:
ANZSCO does not measure the skill level of an individual, rather it refers to the level of skill that
is typically required to competently perform the tasks of a particular occupation. Skill level is an
attribute of occupations, not of individuals in the labour force or of particular jobs (2006, p.14).
We have chosen to divide occupations into high-skill (those at skill levels 1, 2 and 3) and low-skill (4
and 5). The logic behind this division is that high-skill jobs are those occupations typically requiring
some kind of post-school qualification (at least a certificate IV or a certificate III accompanied by at
least two years of on-the-job training). The high-skill category comprises all managers, professionals,
technical occupations and trades; some community and personal service occupations; and a few
clerical and sales occupations. Among the low-skill occupations are labourers and machinery operators
and drivers, most sales workers and remaining clerical and community and personal service
occupations. The skill levels are summarised in table 1.
Table 1 ABS skill level descriptions
Skill level
Brief descriptions
1 Level of skill commensurate with a bachelor degree or higher qualification. At least five years of relevant experience may substitute for the formal qualification. In some instances relevant experience and/or on-the-job training may be required in addition to the formal qualification.
2 Level of skill commensurate with AQF associate degree, advanced diploma or diploma. At least three years of relevant experience may substitute for the formal qualifications. In some instances relevant experience and/or on-the-job training may be required in addition to the formal qualification.
3 Level of skill commensurate with AQF certificate IV or AQF certificate III including at least two years of on-the-job training. At least three years of relevant experience may substitute for the formal qualifications. In some instances relevant experience and/or on-the-job training may be required in addition to the formal qualification.
4 Level of skill commensurate with AQF certificate II or AQF certificate III. At least one year of relevant experience may substitute for the formal qualifications. In some instances relevant experience may be required in addition to the formal qualification.
5 Level of skill commensurate with AQF certificate I or compulsory secondary education.
Source: ABS (2006, p.14).
NCVER 13
Our interest lies in examining skills and qualifications and we do not equate low-skill jobs with bad
jobs. Jobs that require few formal qualifications can be well paid, secure and provide access to career
opportunities; likewise, higher qualifications are no guarantee against low pay or insecure
employment (Lloyd & Mayhew 2010).
Our division into ‘low-skill’ and ‘high-skill’ is not without issue, as pointed out by Esposto (2008,
p.110). The approach is highly reliant on education, training and years of experience as an
appropriate indicator of skill. The categorisation of many occupations predominantly held by females,
such as childcare workers, dental assistants and library aides, as ‘low-skill’ has been challenged (such
as through pay equity cases) by those who argue that traditional conceptions of skill ignore or
undervalue the ‘softer’ and caring skills required in these roles (Whitehouse & Rooney 2007; Smith
2009). Even formal conceptions of skill can change markedly over a relatively short period of time; for
instance, changes being introduced will increase the qualification levels of child care workers
(currently classified as skill level 4) to certificate III and diploma level (Australian Children’s
Education and Care Quality Authority 2011). Over time, this should result in a given skill required for a
job remaining the same but being reclassified, or a given occupation changing in terms of the
complexity of the skills and tasks required to perform in the job. For consistency and transparency our
analysis will observe the current classification in all instances.
Another difficult issue is how to treat tradespeople and other mid-skilled workers (Cully 2002). We
have allocated them to the high-skill category, along with other jobs usually requiring a certificate III
(where completed as part of an apprenticeship) or higher qualification.
The Longitudinal Surveys of Australian Youth
The analysis is based on data from the Longitudinal Surveys of Australian Youth and takes advantage
of its longitudinal nature to track the experience of young people over time. We use the most recent
complete cohort, which began in 1998 (when the students were in Year 9) and concluded after 12
waves in 2009. The complete LSAY Y98 comprises of 14 117 observations.
In our analysis, we concentrate on the LSAY Y98 respondents who are in low-skill employment after
leaving full-time education. The skill level of jobs held by students who are in full-time education is
not of concern, since part-time work for students is more about income than long-term engagement
with the labour market (Polidano & Zakirova 2011). We therefore exclude 6866 respondents who leave
the survey before exiting full-time education.
We also exclude from the dataset anyone who returns to full-time education in the following wave.
We do this to overcome the issue of young people taking gap years. Employment taken during a gap
year is not a good indicator of young people’s long-term intentions of working in the labour market.
To lengthen the condition to exclude anyone who returned to full-time education within two years
would exclude too many respondents because of attrition; it would also draw in young people who
may have made a genuine decision to return to study. As a result, we remove an additional number of
2023 persons who have spent one wave away from formal education. As table 2 shows, this leaves
5228 respondents, for whom there are data on their employment status after leaving full-time
education. Of 5228 respondents, 1682 persons are in high-skill employment, 2646 respondents work in
low-skill jobs, 826 persons are unemployed or out of the labour force, and 74 respondents have
missing occupational detail.

14 Starting out in low-skill jobs
Table 2 Records in the LSAY 1998 dataset
Steps Observations
Complete LSAY Y98 dataset 14 117
Left survey (attrition) before leaving full-time education for the first time 6866
Censored (did not spend at least two waves after leaving full-time education before survey ends) 2023
Remaining observations 5228
Labour market status in the first wave after leaving full-time education:
High-skill employment 1682
Low-skill employment 2646
Not working 826
Missing occupational detail 74
Notes: Five respondents who were in full-time education for all 12 waves of the survey are excluded. Source: LSAY 1998 cohort.
The focus of the analysis is the years after young people left full-time education. Depending on the
wave during which a respondent left full-time education, there are potentially up to 11 periods to
examine.
The use of longitudinal data has some drawbacks. For the LSAY, data are collected through a
telephone interview with respondents selected from the cohort and therefore the information is self-
reported. The second issue is survey attrition, which occurs when some respondents fail to answer the
survey in subsequent years of interviewing. In addition, very few respondents left full-time education
in the second wave of the survey and most respondents had left full-time education by the fifth, sixth
or seventh wave of the survey. This means that in most instances data can only be available up to
five, six or seven periods after leaving full-time education. Values for subsequent periods are
therefore not available. Table 3 shows the attrition and censored effects on the available sample. Up
to the sixth year, fewer than half of the respondents have their information available for analysis and
the number of observations in the study scope drops substantially in succeeding years.
Table 3 Impact of attrition and censored values
Years after leaving full-time education
1 2 3 4 5 6 7 8 9 10 11
Total in scope (n) 5228 5228 4333 3589 2762 2118 1454 977 229 81 5
Attrition - - 739 1199 1509 1633 1519 1328 523 301 29
Censored - - 156 440 957 1477 2255 2923 4476 4846 5194
Total 5228 5228 5228 5228 5228 5228 5228 5228 5228 5228 5228
Source: LSAY 1998 cohort.
This paper focuses on analysing only the first five years after respondents completed their full-time
education, of which more than half of the sample is still retained in the fifth year. Thus the sample of
5228 observations used in this paper is restricted to young people who completed their full-time
education, continued to contribute information to the survey, and had their employment status known
up to five years after leaving full-time education. Weights have been utilised in the regression models
NCVER 15
to attempt to account for the impact of differential attrition.1 Further details on how weights are
created in the LSAY dataset can be found in Lim (2011).
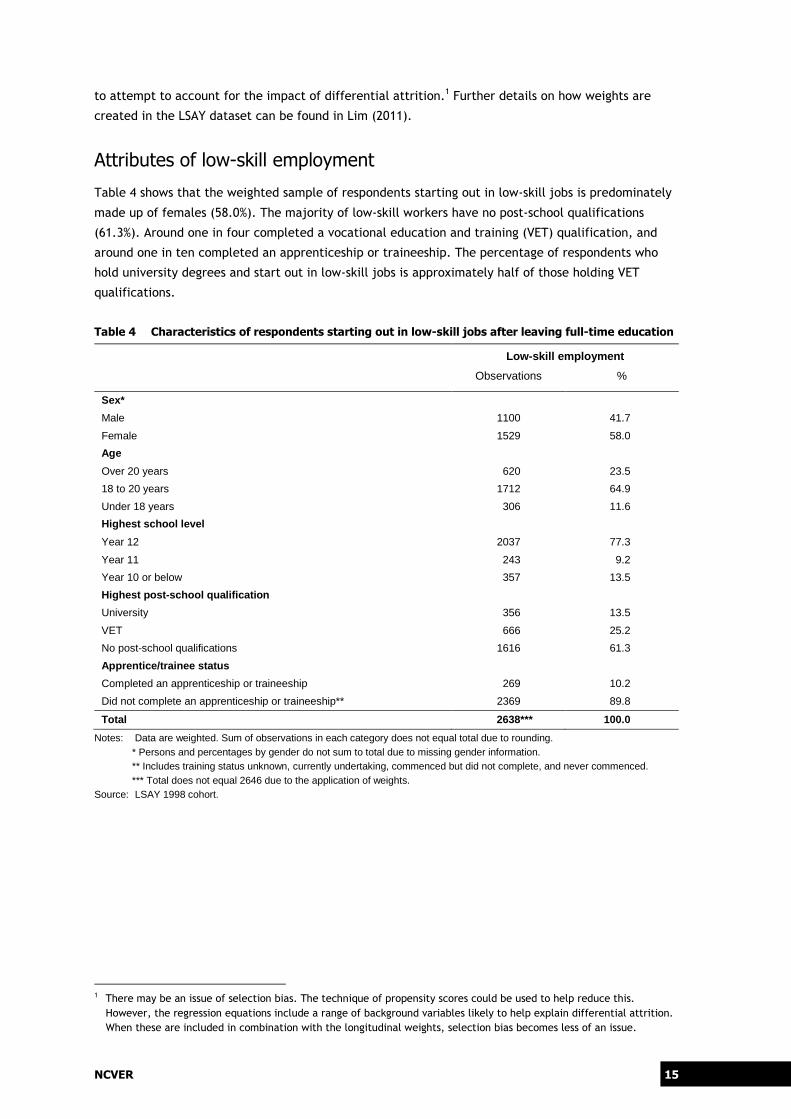
Attributes of low-skill employment
Table 4 shows that the weighted sample of respondents starting out in low-skill jobs is predominately
made up of females (58.0%). The majority of low-skill workers have no post-school qualifications
(61.3%). Around one in four completed a vocational education and training (VET) qualification, and
around one in ten completed an apprenticeship or traineeship. The percentage of respondents who
hold university degrees and start out in low-skill jobs is approximately half of those holding VET
qualifications.
Table 4 Characteristics of respondents starting out in low-skill jobs after leaving full-time education
Low-skill employment
Observations %
Sex*
Male 1100 41.7
Female 1529 58.0
Age
Over 20 years 620 23.5
18 to 20 years 1712 64.9
Under 18 years 306 11.6
Highest school level
Year 12 2037 77.3
Year 11 243 9.2
Year 10 or below 357 13.5
Highest post-school qualification
University 356 13.5
VET 666 25.2
No post-school qualifications 1616 61.3
Apprentice/trainee status
Completed an apprenticeship or traineeship 269 10.2
Did not complete an apprenticeship or traineeship** 2369 89.8
Total 2638*** 100.0
Notes: Data are weighted. Sum of observations in each category does not equal total due to rounding. * Persons and percentages by gender do not sum to total due to missing gender information. ** Includes training status unknown, currently undertaking, commenced but did not complete, and never commenced. *** Total does not equal 2646 due to the application of weights.
Source: LSAY 1998 cohort.
1 There may be an issue of selection bias. The technique of propensity scores could be used to help reduce this.
However, the regression equations include a range of background variables likely to help explain differential attrition.
When these are included in combination with the longitudinal weights, selection bias becomes less of an issue.
16 Starting out in low-skill jobs
Low-skill employment transition
We now look at the labour market mobility of young people across the five years following their
starting point as low-skill workers. Table 5 shows the percentage of transitions between years after
leaving full-time education. The percentage of flows from low-skill employment in the previous year
to the next year is: 37.9% remain in low-skill jobs; 12.9% move to high-skill jobs; 4.3% are not
working; and 3.3% return to full-time education. Flows between years demonstrate that there is little
evidence of churning between low-skill employment and not working. Transitions from low-skill to
high-skill (12.9%) are close to three times the transitions from low-skill to not working (4.3%). More
importantly, flows from not working to low-skill employment (1.7%) are almost as large as the
proportion remaining out of the workforce between years (2.0%).
Table 6 shows how young people’s employment and study status settle in each year after they start
out in low-skill jobs. By the second year, almost a quarter (22.2%) move into high-skill employment
and another one in ten (9.8%) is no longer working. In the third year, 52.4% remain in low-skill
employment, while 11.1% return to full-time education. The proportion of young people in high-skill
employment steadily increases from the second year to the fifth year. By contrast, the proportions of
young people working in low-skill jobs and not working fall across the same period. By the fifth year,
around a third of respondents who begin in low-skill jobs after leaving full-time education work in
high-skill jobs, while 44.0% remain in low-skill jobs. The proportion of young people returning to full-
time education is 13.5%, while a smaller proportion (7.5%) is not working.
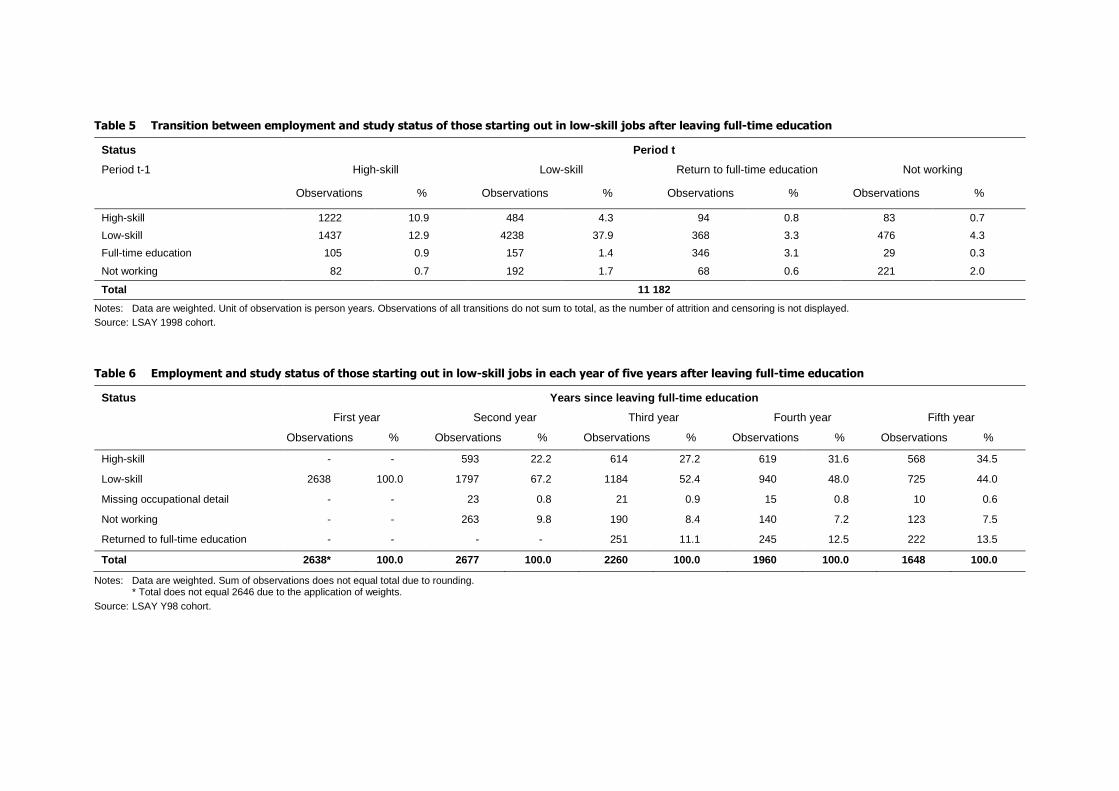
Table 5 Transition between employment and study status of those starting out in low-skill jobs after leaving full-time education
Status Period t
Period t-1 High-skill Low-skill Return to full-time education Not working
Observations % Observations % Observations % Observations %
High-skill 1222 10.9 484 4.3 94 0.8 83 0.7
Low-skill 1437 12.9 4238 37.9 368 3.3 476 4.3
Full-time education 105 0.9 157 1.4 346 3.1 29 0.3
Not working 82 0.7 192 1.7 68 0.6 221 2.0
Total 11 182
Notes: Data are weighted. Unit of observation is person years. Observations of all transitions do not sum to total, as the number of attrition and censoring is not displayed. Source: LSAY 1998 cohort.
Table 6 Employment and study status of those starting out in low-skill jobs in each year of five years after leaving full-time education
Status Years since leaving full-time education
First year Second year Third year Fourth year Fifth year
Observations % Observations % Observations % Observations % Observations %
High-skill - - 593 22.2 614 27.2 619 31.6 568 34.5
Low-skill 2638 100.0 1797 67.2 1184 52.4 940 48.0 725 44.0
Missing occupational detail - - 23 0.8 21 0.9 15 0.8 10 0.6
Not working - - 263 9.8 190 8.4 140 7.2 123 7.5
Returned to full-time education - - - - 251 11.1 245 12.5 222 13.5
Total 2638* 100.0 2677 100.0 2260 100.0 1960 100.0 1648 100.0
Notes: Data are weighted. Sum of observations does not equal total due to rounding. * Total does not equal 2646 due to the application of weights.
Source: LSAY Y98 cohort.
18 Starting out in low-skill jobs
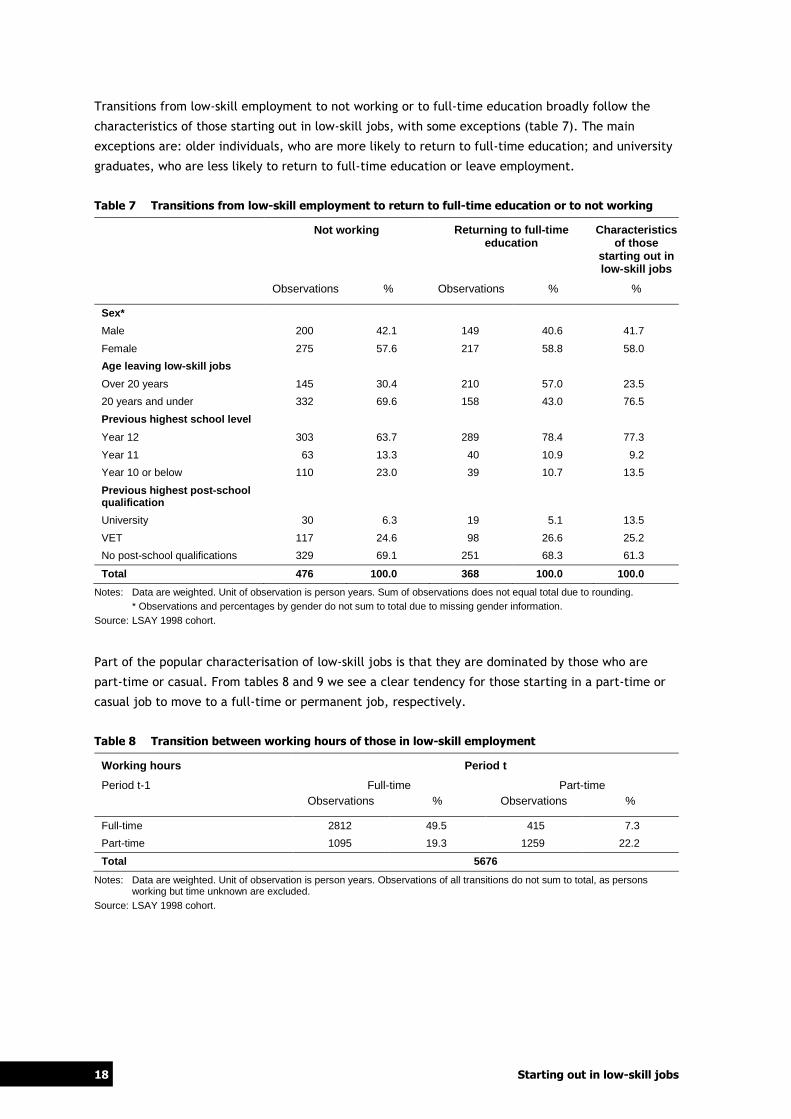
Transitions from low-skill employment to not working or to full-time education broadly follow the
characteristics of those starting out in low-skill jobs, with some exceptions (table 7). The main
exceptions are: older individuals, who are more likely to return to full-time education; and university
graduates, who are less likely to return to full-time education or leave employment.
Table 7 Transitions from low-skill employment to return to full-time education or to not working
Not working Returning to full-time education
Characteristics of those
starting out in low-skill jobs
Observations % Observations % %
Sex*
Male 200 42.1 149 40.6 41.7
Female 275 57.6 217 58.8 58.0
Age leaving low-skill jobs
Over 20 years 145 30.4 210 57.0 23.5
20 years and under 332 69.6 158 43.0 76.5
Previous highest school level
Year 12 303 63.7 289 78.4 77.3
Year 11 63 13.3 40 10.9 9.2
Year 10 or below 110 23.0 39 10.7 13.5
Previous highest post-school qualification
University 30 6.3 19 5.1 13.5
VET 117 24.6 98 26.6 25.2
No post-school qualifications 329 69.1 251 68.3 61.3
Total 476 100.0 368 100.0 100.0
Notes: Data are weighted. Unit of observation is person years. Sum of observations does not equal total due to rounding. * Observations and percentages by gender do not sum to total due to missing gender information.
Source: LSAY 1998 cohort.
Part of the popular characterisation of low-skill jobs is that they are dominated by those who are
part-time or casual. From tables 8 and 9 we see a clear tendency for those starting in a part-time or
casual job to move to a full-time or permanent job, respectively.
Table 8 Transition between working hours of those in low-skill employment
Working hours Period t
Period t-1 Full-time Part-time Observations % Observations %
Full-time 2812 49.5 415 7.3
Part-time 1095 19.3 1259 22.2
Total 5676
Notes: Data are weighted. Unit of observation is person years. Observations of all transitions do not sum to total, as persons working but time unknown are excluded.
Source: LSAY 1998 cohort.
NCVER 19
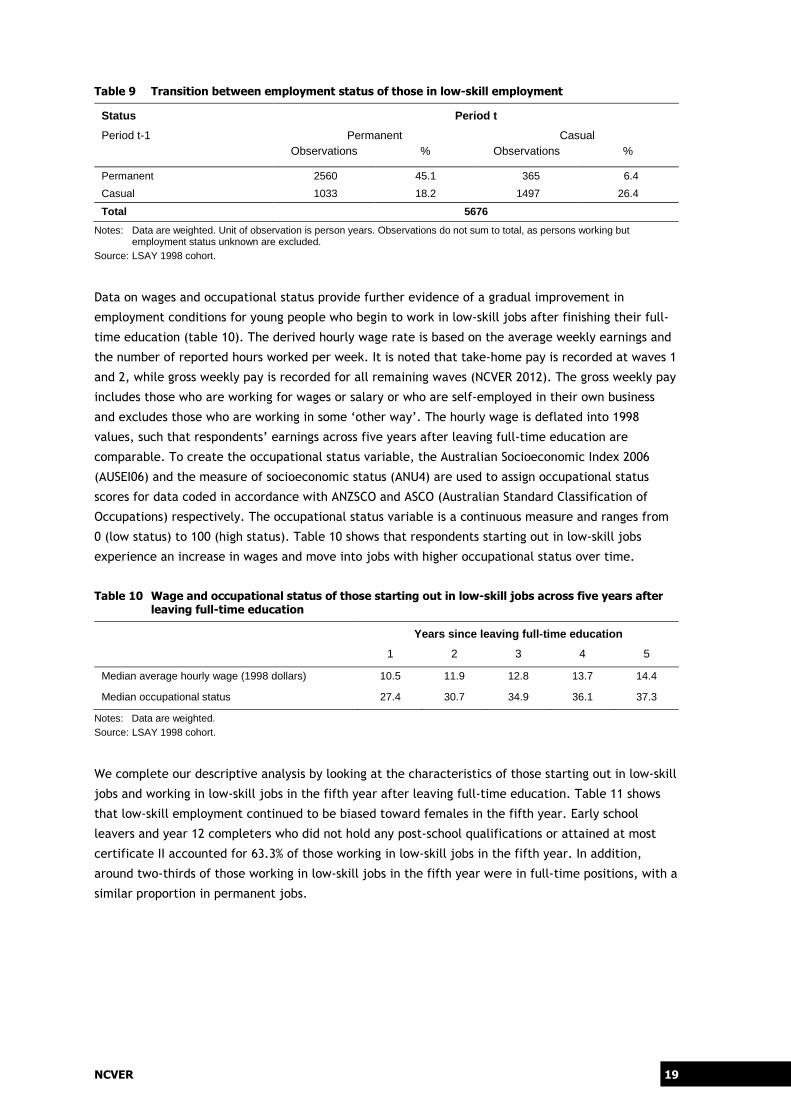
Table 9 Transition between employment status of those in low-skill employment
Status Period t
Period t-1 Permanent Casual Observations % Observations %
Permanent 2560 45.1 365 6.4
Casual 1033 18.2 1497 26.4
Total 5676
Notes: Data are weighted. Unit of observation is person years. Observations do not sum to total, as persons working but employment status unknown are excluded.
Source: LSAY 1998 cohort.
Data on wages and occupational status provide further evidence of a gradual improvement in
employment conditions for young people who begin to work in low-skill jobs after finishing their full-
time education (table 10). The derived hourly wage rate is based on the average weekly earnings and
the number of reported hours worked per week. It is noted that take-home pay is recorded at waves 1
and 2, while gross weekly pay is recorded for all remaining waves (NCVER 2012). The gross weekly pay
includes those who are working for wages or salary or who are self-employed in their own business
and excludes those who are working in some ‘other way’. The hourly wage is deflated into 1998
values, such that respondents’ earnings across five years after leaving full-time education are
comparable. To create the occupational status variable, the Australian Socioeconomic Index 2006
(AUSEI06) and the measure of socioeconomic status (ANU4) are used to assign occupational status
scores for data coded in accordance with ANZSCO and ASCO (Australian Standard Classification of
Occupations) respectively. The occupational status variable is a continuous measure and ranges from
0 (low status) to 100 (high status). Table 10 shows that respondents starting out in low-skill jobs
experience an increase in wages and move into jobs with higher occupational status over time.
Table 10 Wage and occupational status of those starting out in low-skill jobs across five years after leaving full-time education
Years since leaving full-time education
1 2 3 4 5
Median average hourly wage (1998 dollars) 10.5 11.9 12.8 13.7 14.4
Median occupational status 27.4 30.7 34.9 36.1 37.3
Notes: Data are weighted. Source: LSAY 1998 cohort.
We complete our descriptive analysis by looking at the characteristics of those starting out in low-skill
jobs and working in low-skill jobs in the fifth year after leaving full-time education. Table 11 shows
that low-skill employment continued to be biased toward females in the fifth year. Early school
leavers and year 12 completers who did not hold any post-school qualifications or attained at most
certificate II accounted for 63.3% of those working in low-skill jobs in the fifth year. In addition,
around two-thirds of those working in low-skill jobs in the fifth year were in full-time positions, with a
similar proportion in permanent jobs.

20 Starting out in low-skill jobs
Table 11 Selective characteristics of those starting out in low-skill jobs and working in low-skill jobs in the fifth year after leaving full-time education
Selective characteristics Per cent
Female 56.7
Bachelor degree and above 5.4
Diploma or advanced diploma 11.3
Certificate III and IV 20.0
Year 12 and at most certificate II* 39.8
Early school leavers and at most certificate II* 23.5
Full-time employment 69.1
Permanent employment 65.1
Total observations (n) 725
Notes: Data are weighted. * Includes certificate level unknown. Source: LSAY 1998 cohort.
Overall, the descriptive data present a positive picture for young people starting out in low-skill jobs
in the five-year period after completing full-time education. There is little evidence of ‘churning’
between low-skill jobs and unemployment or out of the labour force. The two most popular
transitions these young people undertake are: progressing from low-skill jobs to high-skill jobs or
remaining in low-skill jobs (tables 5 and 6). Some young people starting out in low-skill jobs with part-
time or casual positions would eventually move into full-time or permanent work (19.3% of transitions
are from part-time to full-time work, and 18.2% are from casual to permanent positions). Over the
five-year period, young people starting out in low-skill jobs also experience an increase in real wages
and occupational status (table 10).
A further question, which is explored in the next section, is whether or not young people who start
out in low-skill jobs experience a wage penalty relative to those who begin their post-education
career in high-skill jobs.
NCVER 21
Impact of starting out in low-skill jobs on wages
Our goal is to investigate how the labour market rewards young respondents who begin their post-school
education career in low-skill jobs (once we control for their individual characteristics). The issue is
whether they suffer a wage penalty relative to those who start out in high-skill jobs or, conversely, to
those not working. In other words, do young people continue to earn less than they could expect to,
once they have had more time to find a job that is a better fit for their ability and qualifications?
Model
We first estimate the association between a respondent’s hourly wages (deflated to 1998 levels) with
a range of individual characteristics by using the pooled OLS (ordinary least squares) method. The
model is specified as follows:
log ������ ���� � ��� � ��� (1)
where log ������ is the log of hourly wage for individual i in time period t. ��� is a matrix of time
varying characteristics for individual i in time period t. The variables include educational attainment,
apprenticeship or traineeship status, and time interacted with the status of the first job after leaving
full-time education.
�� represents the time-invariant variables that do not vary over the five-year periods such as gender,
initial employment status after leaving full-time education, and an individual’s academic ability
measured in Year 9. The coefficients of the interaction term and the initial employment status allow
us to determine whether there is a scarring effect from beginning in a low-skill job. The academic
ability is the average score of mathematics and reading scores. ��� is the composite error, which is
assumed to be uncorrelated with the explanatory variables in all time periods.
One of the issues that bedevil this type of analysis is that of the unobserved variables that impact on
wages. For example, an individual with good educational qualifications who ends up in a low-skill job
might have an unobserved attribute such as low motivation. The panel nature of the dataset allows
us to control for this ‘unobserved heterogeneity’ through the use of a random effects model, specified
as follows:
log ������ ���� � ��� � �� � ��� (2)
�� is a random variable and an unobserved heterogeneity that represents the unobserved
characteristics of individuals that are stable over time and do not account for ��. ��� is the time-
varying error that represents unobserved factors that change over time. It is assumed that �� is
uncorrelated with each explanatory variable in all time periods.
22 Starting out in low-skill jobs
Details of all variables included in the regression are summarised in appendix (table A1).2
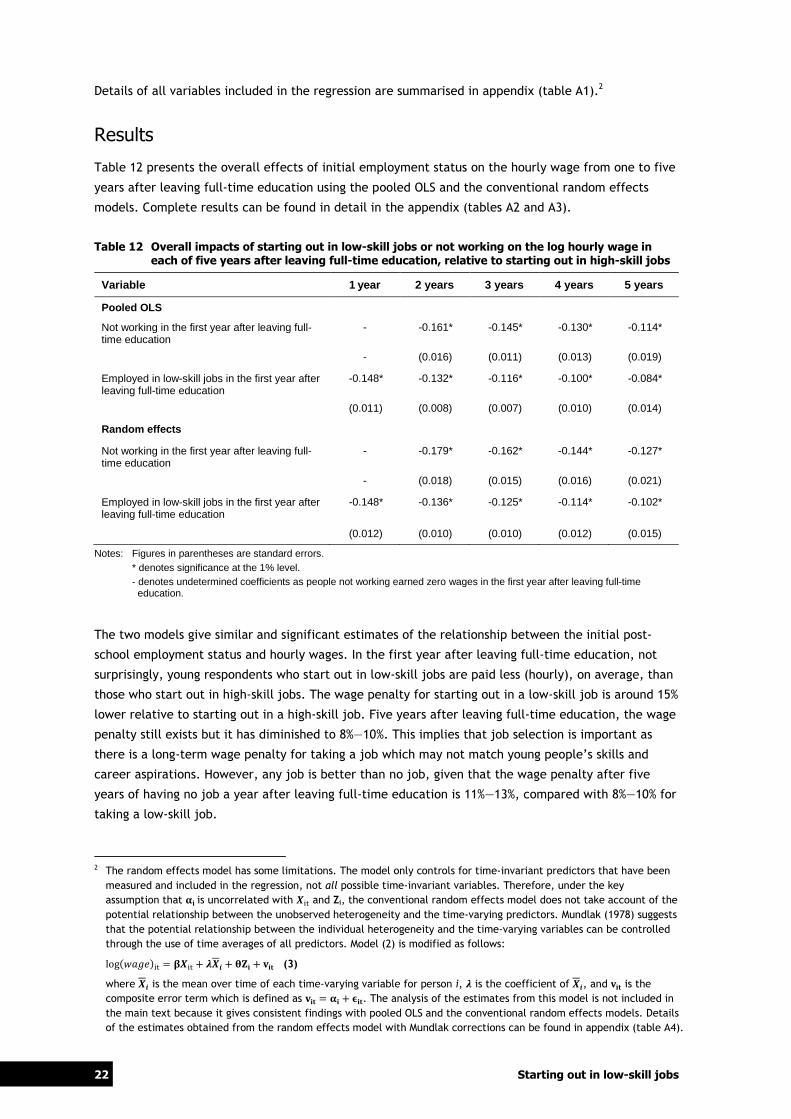
Results
Table 12 presents the overall effects of initial employment status on the hourly wage from one to five
years after leaving full-time education using the pooled OLS and the conventional random effects
models. Complete results can be found in detail in the appendix (tables A2 and A3).
Table 12 Overall impacts of starting out in low-skill jobs or not working on the log hourly wage in each of five years after leaving full-time education, relative to starting out in high-skill jobs
Variable 1 year 2 years 3 years 4 years 5 years
Pooled OLS
Not working in the first year after leaving full-time education
- -0.161* -0.145* -0.130* -0.114*
- (0.016) (0.011) (0.013) (0.019)
Employed in low-skill jobs in the first year after leaving full-time education
-0.148* -0.132* -0.116* -0.100* -0.084*
(0.011) (0.008) (0.007) (0.010) (0.014)
Random effects
Not working in the first year after leaving full-time education
- -0.179* -0.162* -0.144* -0.127*
- (0.018) (0.015) (0.016) (0.021)
Employed in low-skill jobs in the first year after leaving full-time education
-0.148* -0.136* -0.125* -0.114* -0.102*
(0.012) (0.010) (0.010) (0.012) (0.015)
Notes: Figures in parentheses are standard errors. * denotes significance at the 1% level. - denotes undetermined coefficients as people not working earned zero wages in the first year after leaving full-time education.
The two models give similar and significant estimates of the relationship between the initial post-
school employment status and hourly wages. In the first year after leaving full-time education, not
surprisingly, young respondents who start out in low-skill jobs are paid less (hourly), on average, than
those who start out in high-skill jobs. The wage penalty for starting out in a low-skill job is around 15%
lower relative to starting out in a high-skill job. Five years after leaving full-time education, the wage
penalty still exists but it has diminished to 8%—10%. This implies that job selection is important as
there is a long-term wage penalty for taking a job which may not match young people’s skills and
career aspirations. However, any job is better than no job, given that the wage penalty after five
years of having no job a year after leaving full-time education is 11%—13%, compared with 8%—10% for
taking a low-skill job.
2 The random effects model has some limitations. The model only controls for time-invariant predictors that have been
measured and included in the regression, not all possible time-invariant variables. Therefore, under the key
assumption that �� is uncorrelated with ��� and Zi, the conventional random effects model does not take account of the
potential relationship between the unobserved heterogeneity and the time-varying predictors. Mundlak (1978) suggests
that the potential relationship between the individual heterogeneity and the time-varying variables can be controlled
through the use of time averages of all predictors. Model (2) is modified as follows:
log������ ���� � ��� � ��� � ��� (3)
where �� is the mean over time of each time-varying variable for person i, � is the coefficient of ��, and ��� is the
composite error term which is defined as ��� �� � ���. The analysis of the estimates from this model is not included in
the main text because it gives consistent findings with pooled OLS and the conventional random effects models. Details
of the estimates obtained from the random effects model with Mundlak corrections can be found in appendix (table A4).
NCVER 23
Leaving low-skill jobs
Taking a job involves a choice, and there is a possibility that young people choose to stay in a low-skill
job for good reasons. For example, they may get high satisfaction from it or the wage is relatively
high. Preferences for part-time employment may work either way: young people may want to remain
in part-time employment and therefore choose to stay in their low-skill job or they may seek full-time
employment and find this is best achieved by initially taking a part-time job. Our goal is to determine
the factors that influence young people’s decisions to remain in a low-skill job or make that transition
to a high-skill job. We are specifically interested in whether wages or job satisfaction play a role.
Models
The best way to estimate this relationship is to include in the model a set of control variables relating
to the characteristics of low-skill jobs and individual attributes in the previous period t. In
determining the likelihood of leaving a low-skill job for a high-skill job in the period t+1, a logistic
model is fitted. The model is specified as follows:
logit ������ � � !"�� � ��� � �� � ��� (4)
The outcome variable yit+1 is represented by a binary variable (progressing from low-skill jobs to high-
skill jobs or remaining in low-skill jobs in year t+1). Our sample is respondents who start out in low-
skill jobs in the first year after leaving full-time education. "�� includes the characteristics of
individuals and low-skill jobs that vary with time, while Zi represents individual and job characteristics
that are time-invariant. Table A5 in the appendix summarises all the independent variables that will
be included in the model.
We run three different models and continue the same approach as used in the wage model. That is,
within each model, we apply both pooled logit and random effects logit estimations. Firstly, we run a
standard model that examines the likelihood of moving from low-skill jobs to high-skill jobs on the
foundation of individual characteristics and several attributes of low-skill jobs. The characteristics of
these jobs are occupational status, full-time or part-time employment, permanent or casual
employment, and job satisfaction.
LSAY asks how satisfied or dissatisfied individuals are with different aspects of their jobs. Responses
are recorded on a 6-point scale: 1 for very satisfied, 2 for satisfied, 3 for dissatisfied, 4 for very
dissatisfied, 5 for cannot say or do not know, and 6 for not applicable. A factor analysis is applied to
obtain an underlying latent variable that relates to job satisfaction, constructed according to the
observable level of satisfaction on a number of variables. These measured variables include: the
nature of work itself; opportunities to use skills and experiences; work with colleagues and
supervisors; payment; opportunities for training promotion; the assigned tasks; and recognition of
good performance. These items are coded such that a higher score in the job satisfaction variable
reflects higher satisfaction. The job satisfaction variable is normalised.
An additional explanatory variable is then added to the second model: the log wage residual obtained
from the wage model in the previous section. The residual wage variable is a measure of how the
actual wages of an individual differ from their modelled expected wages. That is, if an individual is
doing better than their background characteristics suggest, then they will have a positive residual.
24 Starting out in low-skill jobs
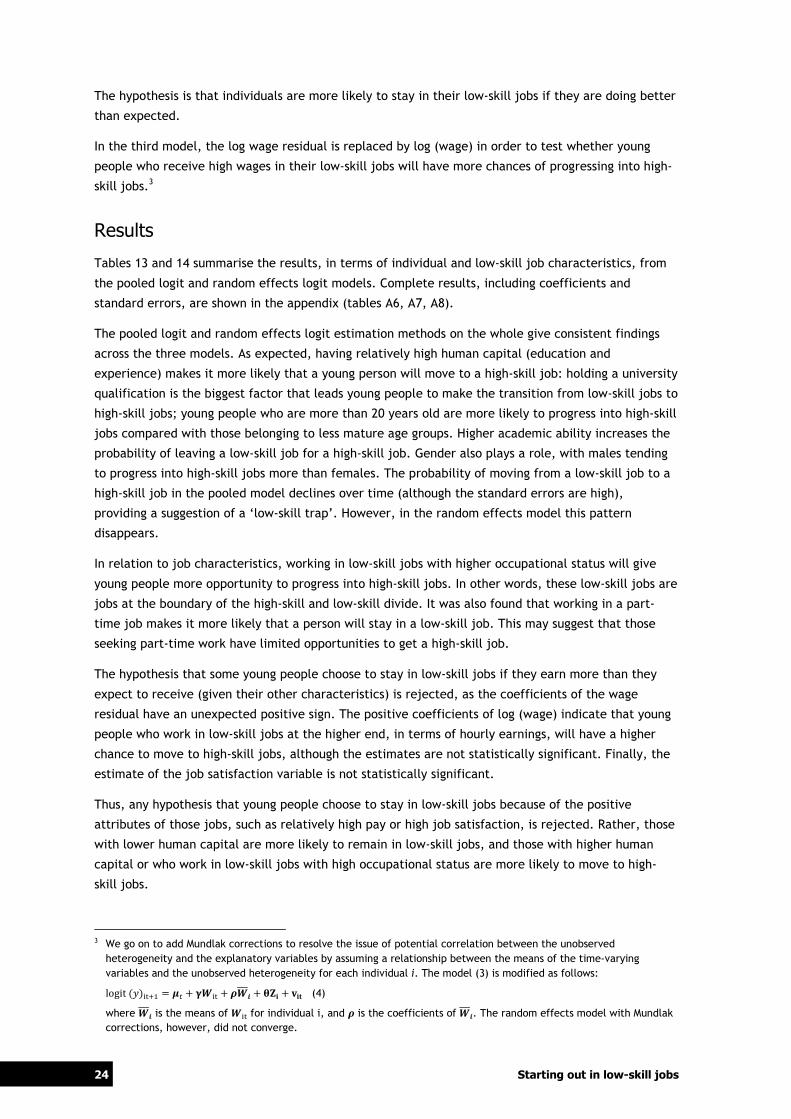
The hypothesis is that individuals are more likely to stay in their low-skill jobs if they are doing better
than expected.
In the third model, the log wage residual is replaced by log (wage) in order to test whether young
people who receive high wages in their low-skill jobs will have more chances of progressing into high-
skill jobs.3
Results
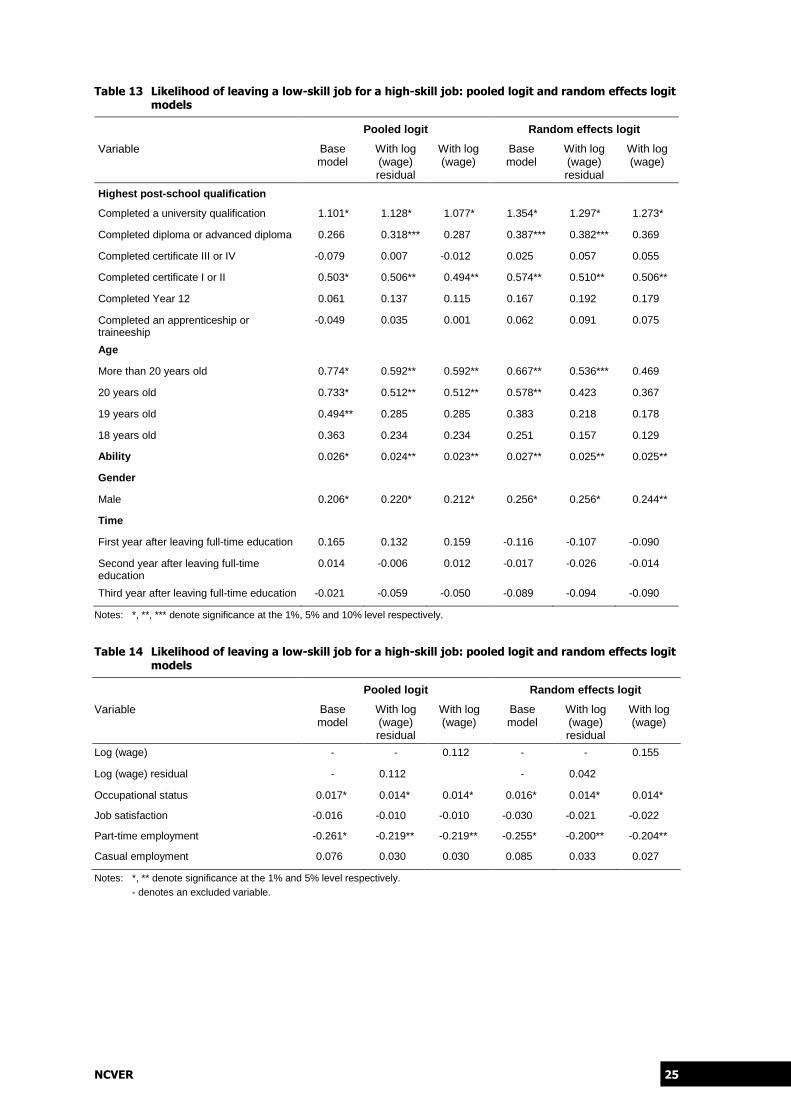
Tables 13 and 14 summarise the results, in terms of individual and low-skill job characteristics, from
the pooled logit and random effects logit models. Complete results, including coefficients and
standard errors, are shown in the appendix (tables A6, A7, A8).
The pooled logit and random effects logit estimation methods on the whole give consistent findings
across the three models. As expected, having relatively high human capital (education and
experience) makes it more likely that a young person will move to a high-skill job: holding a university
qualification is the biggest factor that leads young people to make the transition from low-skill jobs to
high-skill jobs; young people who are more than 20 years old are more likely to progress into high-skill
jobs compared with those belonging to less mature age groups. Higher academic ability increases the
probability of leaving a low-skill job for a high-skill job. Gender also plays a role, with males tending
to progress into high-skill jobs more than females. The probability of moving from a low-skill job to a
high-skill job in the pooled model declines over time (although the standard errors are high),
providing a suggestion of a ‘low-skill trap’. However, in the random effects model this pattern
disappears.
In relation to job characteristics, working in low-skill jobs with higher occupational status will give
young people more opportunity to progress into high-skill jobs. In other words, these low-skill jobs are
jobs at the boundary of the high-skill and low-skill divide. It was also found that working in a part-
time job makes it more likely that a person will stay in a low-skill job. This may suggest that those
seeking part-time work have limited opportunities to get a high-skill job.
The hypothesis that some young people choose to stay in low-skill jobs if they earn more than they
expect to receive (given their other characteristics) is rejected, as the coefficients of the wage
residual have an unexpected positive sign. The positive coefficients of log (wage) indicate that young
people who work in low-skill jobs at the higher end, in terms of hourly earnings, will have a higher
chance to move to high-skill jobs, although the estimates are not statistically significant. Finally, the
estimate of the job satisfaction variable is not statistically significant.
Thus, any hypothesis that young people choose to stay in low-skill jobs because of the positive
attributes of those jobs, such as relatively high pay or high job satisfaction, is rejected. Rather, those
with lower human capital are more likely to remain in low-skill jobs, and those with higher human
capital or who work in low-skill jobs with high occupational status are more likely to move to high-
skill jobs.
3 We go on to add Mundlak corrections to resolve the issue of potential correlation between the unobserved
heterogeneity and the explanatory variables by assuming a relationship between the means of the time-varying
variables and the unobserved heterogeneity for each individual i. The model (3) is modified as follows:
logit ������ � � !"�� � #"� � ��� � ��� (4)
where "� is the means of "�� for individual i, and # is the coefficients of "�. The random effects model with Mundlak
corrections, however, did not converge.
NCVER 25
Table 13 Likelihood of leaving a low-skill job for a high-skill job: pooled logit and random effects logit models
Pooled logit Random effects logit
Variable Base model
With log (wage) residual
With log (wage)
Base model
With log (wage) residual
With log (wage)
Highest post-school qualification
Completed a university qualification 1.101* 1.128* 1.077* 1.354* 1.297* 1.273*
Completed diploma or advanced diploma 0.266 0.318*** 0.287 0.387*** 0.382*** 0.369
Completed certificate III or IV -0.079 0.007 -0.012 0.025 0.057 0.055
Completed certificate I or II 0.503* 0.506** 0.494** 0.574** 0.510** 0.506**
Completed Year 12 0.061 0.137 0.115 0.167 0.192 0.179
Completed an apprenticeship or traineeship
-0.049 0.035 0.001 0.062 0.091 0.075
Age
More than 20 years old 0.774* 0.592** 0.592** 0.667** 0.536*** 0.469
20 years old 0.733* 0.512** 0.512** 0.578** 0.423 0.367
19 years old 0.494** 0.285 0.285 0.383 0.218 0.178
18 years old 0.363 0.234 0.234 0.251 0.157 0.129
Ability 0.026* 0.024** 0.023** 0.027** 0.025** 0.025**
Gender
Male 0.206* 0.220* 0.212* 0.256* 0.256* 0.244**
Time
First year after leaving full-time education 0.165 0.132 0.159 -0.116 -0.107 -0.090
Second year after leaving full-time education
0.014 -0.006 0.012 -0.017 -0.026 -0.014
Third year after leaving full-time education -0.021 -0.059 -0.050 -0.089 -0.094 -0.090
Notes: *, **, *** denote significance at the 1%, 5% and 10% level respectively.
Table 14 Likelihood of leaving a low-skill job for a high-skill job: pooled logit and random effects logit models
Pooled logit Random effects logit
Variable Base model
With log (wage) residual
With log (wage)
Base model
With log (wage) residual
With log (wage)
Log (wage) - - 0.112 - - 0.155
Log (wage) residual - 0.112 - 0.042
Occupational status 0.017* 0.014* 0.014* 0.016* 0.014* 0.014*
Job satisfaction -0.016 -0.010 -0.010 -0.030 -0.021 -0.022
Part-time employment -0.261* -0.219** -0.219** -0.255* -0.200** -0.204**
Casual employment 0.076 0.030 0.030 0.085 0.033 0.027
Notes: *, ** denote significance at the 1% and 5% level respectively. - denotes an excluded variable.
26 Starting out in low-skill jobs
Final comments
The motivation behind this paper was to see whether the low-skill jobs taken by young people on
completion of their full-time education should be seen as a stepping stone on one hand or a low-skill
trap on the other. On the positive side, those starting in a low-skill job see, on average,
improvements in wages and occupational status and a shift from part-time to full-time, or from casual
to permanent jobs. There is also a clear shift from low-skill to higher-skill jobs for a significant
proportion of individuals. A sizeable proportion of individuals in low-skill jobs return to education.
While this is all positive — a ‘stepping stone’ view of the world — starting out in a low-skill job has a
negative impact on wages, even after five years. This indicates scarring and shows the importance of
beginning work in a job commensurate with qualifications. On the other hand, the scarring associated
with starting work in a low-skill job is not as severe as not working in the year after leaving education
full-time. This poses a quandary for young people: when is any job better than none? A young person
must balance an offer of a low-skill job against an unknown probability of a better job coming along.
Another aspect of starting out in low-skill jobs is that the structure of the labour market does matter.
Being a male makes it more likely that the person will move to a high-skill job. In addition, young
people who work in low-skill jobs but who have high qualifications, high ability, or experience are
more likely to move to high-skill jobs. By contrast, some young people are more likely to stay in a
low-skill job if they work in a part-time job, which could alternatively suggest that high-skill jobs
offer limited opportunities for young people who only seek part-time work. Finally, there is no
evidence to show that people choose to stay in low-skill jobs because of positive job attributes such
as relatively high wages or high job satisfaction or to suggest that young people get trapped in low-
skill jobs.
NCVER 27
References ABS (Australian Bureau of Statistics) 2006, Australia & New Zealand Classification of Occupations, ABS,
Canberra.
Australian Children’s Education and Care Quality Authority 2011 Guide to the education and care services national law and the education and care services national regulations 2011, Australian Government, Canberra.
Aungles, P, Dearden, L, Karmel, T & Ryan, C 1993, ‘Through a rear-view mirror darkly: occupational change, 1971—1986’, Australian Bulletin of Labour, vol.19, no.2, pp.97—113.
Bradley, D, Noonan, P, Nugent, H & Scales, W 2008, Review of Australian higher education: final report, Department of Education, Employment and Workplace Relations, Canberra.
Council of Australian Governments (COAG) 2009, ‘Communiqué 30 April 2009’, viewed July 2009, <http://www.coag.gov.au/coag_meeting_outcomes/2009-04-30/index.cfm>.
Cully, M 1999, ‘A more or less skilled workforce? Changes in the composition of employment, 1993 to 1999’, Australian Bulletin of Labour, vol.25, no.2, pp.98—104.
——2002, ‘The cleaner, the waiter, the computer operator: job change, 1986—2001’, Australian Bulletin of Labour, vol.28, no.3, pp.141—62.
Esposto, A, 2008, ‘Skill: an elusive and ambiguous concept in labour market studies’, Australian Bulletin of Labour, vol.34, no.1, pp.100—24.
Lim, P 2011, Weighting the LSAY Programme of International Student Assessment cohorts, NCVER, Adelaide.
Lloyd, C & Mayhew, K 2010, ‘Skill: the solution to low wage work?’, Industrial Relations Journal, vol.41, no.5, pp.429—45.
Mundlak, Y 1978, ‘On the pooling of time series and cross section data’, Econometrica, vol.46, pp.69—85.
NCVER (National Centre for Vocational Education Research) 2012, Longitudinal Surveys of Australian Youth (LSAY) 1998 cohort derived variables, NCVER, Adelaide.
Polidano, C & Zakirova, R 2011, Outcomes from combining work and tertiary study, NCVER, Adelaide.
Ryan, C 2011, Year 12 completion and youth transitions, NCVER, Adelaide.
Smith, M 2009, ‘Gender pay equity reform in Australia: what is the way forward?’, Australian Bulletin of Labour, vol.35, no.4, pp.652—70.
Whitehouse, G & Rooney, T 2007, ‘The Queensland dental assistants’ equal remuneration case: advancing gender pay equity at state level?’, Labour and Industry, vol.18, no.2, pp.85—104.
28 Starting out in low-skill jobs
Appendix Table A1 Variables included in the wage models
Variable
Log (wage) (dependent variable)
Highest post-school qualification
Completed a university qualification
Completed diploma or advanced diploma (including associate degrees)
Completed certificate III or IV
Completed certificate I or II*
Completed Year 12
Completed an apprenticeship or traineeship**
Did not complete school and post-school qualification (reference category)
Job status in first year after leaving full-time education
Not working in the first year after leaving full-time education
Employed in low-skill jobs in the first year after leaving full-time education
Employed in high-skill jobs in the first year after leaving full-time education (reference category)
Academic ability
Gender
Male
Female (reference category)
Time
Note: * Includes those who have certificate level unknown as their highest post-school qualification and the apprentice and traineeship status as not complete.
** Includes those who have certificate level unknown as their highest post-school qualification and the apprentice and traineeship status as complete.
NCVER 29
Table A2 The impact of starting out in low-skill jobs on the hourly wage: pooled OLS
Variable Pooled OLS
Estimate Standard error
t
Intercept 2.123* 0.017 125.89
Highest post-school qualification
Completed a university qualification 0.455* 0.012 38.62
Completed diploma or advanced diploma 0.280* 0.014 19.5
Completed certificate III or IV 0.164* 0.015 11.01
Completed certificate I or II 0.107* 0.017 6.15
Completed Year 12 0.196* 0.010 18.68
Completed an apprenticeship or traineeship 0.300* 0.012 24.44
Did not complete school and post-school qualification . . .
Job status in first year after leaving full-time education
Not working in the first year after leaving full-time education -0.193* 0.031 -6.16
Employed in low-skill jobs in the first year after leaving full-time education
-0.164* 0.015 -10.89
Employed in high-skill jobs in the first year after leaving full-time education
. . .
Academic ability 0.006* 0.001 7.7
Gender
Male 0.072* 0.006 11.42
Female . . .
Time 0.066* 0.004 16.33
Job status in first year after leaving full-time education x time
Not working in the first year after leaving full-time education x time 0.016*** 0.009 1.74
Employed in low-skill jobs in the first year after leaving full-time education x time
0.016* 0.005 3.19
Employed in high-skill jobs in the first year after leaving full-time education x time
. . .
Notes: *, *** denote significance at the 1% and 10% level respectively. . denotes the reference category.
30 Starting out in low-skill jobs
Table A3 The impact of starting out in low-skill jobs on the hourly wage: random effects model
Variable Random effects
Estimate Standard error
t
Intercept 2.093* 0.021 101.82
Highest post-school qualification
Completed a university qualification 0.450* 0.016 27.84
Completed diploma or advanced diploma 0.266* 0.020 13.47
Completed certificate III or IV 0.166* 0.020 8.34
Completed certificate I or II 0.121* 0.023 5.32
Completed Year 12 0.214* 0.015 14.75
Completed an apprenticeship or traineeship 0.303* 0.017 17.92
Did not complete school and post-school qualification . . .
Job status in first year after leaving full-time education
Not working in the first year after leaving full-time education -0.215* 0.029 -7.35
Employed in low-skill jobs in the first year after leaving full-time education
-0.159* 0.015 -10.74
Employed in high-skill jobs in the first year after leaving full-time education
. . .
Academic ability 0.008* 0.001 6.8
Gender
Male 0.061* 0.009 6.78
Female . . .
Time 0.071* 0.003 20.45
Job status in first year after leaving full-time education x time
Not working in the first year after leaving full-time education x time 0.018** 0.008 2.22
Employed in low-skill jobs in the first year after leaving full-time education x time
0.011* 0.004 2.69
Employed in high-skill jobs in the first year after leaving full-time education x time
. . .
Notes: *, ** denote significance at the 1% and 5% level respectively. . denotes the reference category.
NCVER 31
Table A4 The impact of starting out in low-skill jobs on the hourly wage: random effects model with Mundlak corrections
Variable Random effects model with Mundlak corrections
Estimate Standard error
t
Intercept 2.018* 0.022 90.31
Highest post-school qualification
Completed a university qualification 0.206* 0.033 6.23
Completed diploma or advanced diploma 0.080* 0.030 2.7
Completed certificate III or IV 0.020 0.026 0.76
Completed certificate I or II 0.014 0.026 0.54
Completed Year 12 0.122* 0.018 6.7
Completed an apprenticeship or traineeship 0.256* 0.018 14.41
Did not complete school and post-school qualification . . .
Job status in first year after leaving full-time education
Not working in the first year after leaving full-time education -0.200* 0.029 -6.85
Employed in low-skill jobs in the first year after leaving full-time education
-0.150* 0.015 -10.13
Employed in high-skill jobs in the first year after leaving full-time education
. . .
Academic ability 0.007* 0.001 6.31
Gender
Male 0.066* 0.009 7.4
Female . . .
Time 0.075* 0.004 21.55
Job status in first year after leaving full-time education x time
Not working in the first year after leaving full-time education x time 0.014*** 0.008 1.8
Employed in low-skill jobs in the first year after leaving full-time education x time
0.010** 0.004 2.41
Employed in high-skill jobs in the first year after leaving full-time education x time
. . .
Notes: *, **, *** denote significance at the 1%, 5% and 10% level respectively. . denotes the reference category.
32 Starting out in low-skill jobs
Table A5 Variables included in the logit model estimating the probability of working in low-skill jobs
Variable
Low-skill job characteristics
Wage residual
Log (wage)
Occupational status
Job satisfaction
Working hours
Part-time
Full-time (reference category)
Employment status
Casual employment
Permanent employment (reference category)
Highest post-school qualification
Completed a university qualification
Completed diploma or advanced diploma (including associate degrees)
Completed certificate III or IV
Completed certificate I or II*
Completed Year 12
Completed an apprenticeship or traineeship**
Did not complete school and post-school qualification (reference category)
Age
More than 20 years old
20 years old
19 years old
18 years old
Under 18 years old (reference category)
Gender
Male
Female (reference category)
Time
First year after leaving full-time education
Second year after leaving full-time education
Third year after leaving full-time education
Fourth year after leaving full-time education
Note: * includes those who have certificate level unknown as their highest post-school qualification and the apprentice and traineeship status as not complete.
** includes those who have certificate level unknown as their highest post-school qualification and the apprentice and traineeship status as complete.
NCVER 33
Table A6 The likelihood of working in low-skill jobs by pooled logit and random effects logit models
Variable Pooled logit Random effects logit
Estimate Standard error
Chi-square Estimate Standard error
t
Intercept -2.773* 0.274 102.171 -2.596* 0.311 -8.35
Jobs characteristics
Occupational status 0.017* 0.004 16.049 0.016* 0.005 3.32
Job satisfaction -0.016 0.039 0.170 -0.030 0.045 -0.66
Part-time employment -0.261* 0.085 9.351 -0.255* 0.097 -2.62
Full-time employment . . . . . .
Casual employment 0.076 0.083 0.842 0.085 0.096 0.89
Permanent employment . . . . . .
Highest post-school qualification
Completed a university qualification 1.101* 0.179 37.780 1.354* 0.218 6.21
Completed diploma or advanced diploma 0.266 0.179 2.210 0.387*** 0.222 1.74
Completed certificate III or IV -0.079 0.185 0.184 0.025 0.224 0.11
Completed certificate I or II 0.503* 0.195 6.666 0.574** 0.245 2.34
Completed Year 12 0.061 0.136 0.198 0.167 0.166 1
Completed an apprenticeship or traineeship
-0.049 0.166 0.088 0.062 0.202 0.31
Did not complete school and post-school qualification
. . . . . .
Age
More than 20 years old 0.774* 0.250 9.583 0.667** 0.279 2.39
20 years old 0.733* 0.242 9.131 0.578** 0.266 2.17
19 years old 0.494** 0.239 4.286 0.383 0.260 1.47
18 years old 0.363 0.241 2.280 0.251 0.259 0.97
Under 18 years old . . . . . .
Ability 0.026* 0.010 7.083 0.027** 0.012 2.22
Gender
Male 0.206* 0.077 7.097 0.256* 0.095 2.7
Female . . . . . .
Time
First year after leaving full-time education 0.165 0.133 1.528 -0.116 0.149 -0.78
Second year after leaving full-time education
0.014 0.130 0.012 -0.017 0.142 -0.12
Third year after leaving full-time education -0.021 0.129 0.025 -0.089 0.140 -0.64
Fourth year after leaving full-time education
. . . . . .
Notes: *, **, *** denote significance at the 1%, 5% and 10% level respectively. . denotes the reference category.
34 Starting out in low-skill jobs
Table A7 The likelihood of working in low-skill jobs by pooled logit and random effects logit models with log (wage) residual
Variable Pooled logit Random effects logit
Estimate Standard error
Chi-square
Estimate Standard error
t
Intercept -2.509* 0.286 76.702 -2.392* 0.322 -7.43
Jobs characteristics
Log (wage) residual 0.112 0.111 1.010 0.042 0.155 0.27
Occupational status 0.014* 0.004 9.787 0.014* 0.005 2.76
Job satisfaction -0.010 0.042 0.061 -0.021 0.047 -0.46
Part-time employment -0.219** 0.088 6.221 -0.200** 0.100 -2.01
Full-time employment . . . . . .
Casual employment 0.030 0.086 0.122 0.033 0.099 0.33
Permanent employment . . . . . .
Highest post-school qualification
Completed a university qualification 1.128* 0.191 35.018 1.297* 0.226 5.74
Completed diploma or advanced diploma 0.318*** 0.189 2.846 0.382*** 0.230 1.66
Completed certificate III or IV 0.007 0.193 0.001 0.057 0.229 0.25
Completed certificate I or II 0.506** 0.205 6.106 0.510** 0.255 2
Completed Year 12 0.137 0.144 0.907 0.192 0.172 1.12
Completed an apprenticeship or traineeship
0.035 0.175 0.040 0.091 0.208 0.44
Did not complete school and post-school qualification
. . . . . .
Age
More than 20 years old 0.592** 0.264 5.041 0.536*** 0.290 1.85
20 years old 0.512** 0.255 4.039 0.423 0.278 1.52
19 years old 0.285 0.248 1.320 0.218 0.269 0.81
18 years old 0.234 0.249 0.885 0.157 0.267 0.59
Under 18 years old . . . . . .
Ability 0.024** 0.010 5.546 0.025** 0.012 2.07
Gender
Male 0.220* 0.080 7.621 0.256* 0.097 2.65
Female . . . . . .
Time
First year after leaving full-time education 0.132 0.139 0.903 -0.107 0.154 -0.7
Second year after leaving full-time education
-0.006 0.135 0.002 -0.026 0.146 -0.17
Third year after leaving full-time education
-0.059 0.135 0.190 -0.094 0.145 -0.65
Fourth year after leaving full-time education
. . . . . .
Notes: *, **, *** denote significance at the 1%, 5% and 10% level respectively. . denotes the reference category.
NCVER 35
Table A8 The likelihood of working in low-skill jobs by pooled logit and random effects logit models with log (wage)
Variable Pooled logit Random effects logit
Estimate Standard error
Chi-square
Estimate Standard error
t
Intercept -2.764* 0.351 62.085 -2.691* 0.397 -6.78
Jobs characteristics
Log (wage) 0.112 0.111 1.010 0.155 0.126 1.23
Occupational status 0.014* 0.004 9.787 0.014* 0.005 2.68
Job satisfaction -0.010 0.042 0.061 -0.022 0.047 -0.48
Part-time employment -0.219** 0.088 6.221 -0.204** 0.100 -2.04
Full-time employment . . . . . .
Casual employment 0.030 0.086 0.122 0.027 0.099 0.27
Permanent employment . . . . . .
Highest post-school qualification
Completed a university qualification 1.077* 0.188 33.007 1.273* 0.225 5.66
Completed diploma or advanced diploma 0.287 0.187 2.348 0.369 0.229 1.61
Completed certificate III or IV -0.012 0.192 0.004 0.055 0.228 0.24
Completed certificate I or II 0.494** 0.205 5.834 0.506** 0.255 1.98
Completed Year 12 0.115 0.144 0.643 0.179 0.172 1.04
Completed an apprenticeship or traineeship
0.001 0.174 0.000 0.075 0.208 0.36
Did not complete school and post-school qualification
. . . . . .
Age
More than 20 years old 0.592** 0.264 5.041 0.469 0.294 1.6
20 years old 0.512** 0.255 4.039 0.367 0.280 1.31
19 years old 0.285 0.248 1.320 0.178 0.271 0.66
18 years old 0.234 0.249 0.885 0.129 0.268 0.48
Under 18 years old . . . . . .
Ability 0.023** 0.010 5.233 0.025** 0.012 2.03
Gender
Male 0.212* 0.080 6.974 0.244** 0.097 2.51
Female . . . . . .
Time
First year after leaving full-time education 0.159 0.138 1.329 -0.090 0.154 -0.58
Second year after leaving full-time education
0.012 0.134 0.008 -0.014 0.146 -0.1
Third year after leaving full-time education
-0.050 0.134 0.136 -0.090 0.145 -0.62
Fourth year after leaving full-time education
. . . . . .
Notes: *, ** denote significance at the 1% and 5% level respectively. . denotes the reference category.


National Centre for Vocational Education Research Ltd
Level 11, 33 King William Street, Adelaide, South Australia
PO Box 8288, Station Arcade, SA 5000 Australia
Telephone +61 8 8230 8400 Facsimile +61 8 8212 3436
Website www.ncver.edu.au Email [email protected]