Embed Size (px)
Citation preview

Sta$s$csforGenomics(140.688)
Instructor: Jeff Leek
Slide Credits: Alan Dabney (TAMU), Nathan Edwards (UMD), Course Notes from Protein Bioinformatics (260.841).
5/14/10 – Rough draft of project due. Please send with subject line: [project rough draft]

BasicProblem
Abunchofproteins
(1) Whattypeofproteinsareinthesample?
(2) Whatfrac$onoftheproteinsareeachtype?

Whynotjustlookatgeneexpression?
hHp://www.biostat.jhsph.edu/~iruczins/teaching/260.841/notes/c5.2.pdf

ProteinStructure

ProteinandGeneExpressionCorrela$on
hHp://www.biostat.jhsph.edu/~iruczins/teaching/260.841/notes/c5.2.pdf

Post‐transla$onalmodifica$ons
• Theproteomeofthecellischanging
• Variousextra‐cellular,andothersignalsac$vatepathwaysofproteins.
• Akeymechanismofproteinac$va$onispost‐transla*onalmodifica*on(PTM)
• Thesepathwaysmayleadtoothergenesbeingswitchedonoroff
• Massspectrometryiskeytoprobingtheproteomeanddetec$ngPTMs
bix.ucsd.edu/bioalgorithms/presenta$ons/Ch08_MassSpec.ppt

ExamplesofPTM
Post‐transla$onalmodifica$onsincreasethenumberof“leHers”inaminoacidalphabetandleadtoacombinatorialexplosioninbothdatabasesearchanddenovoapproaches.
bix.ucsd.edu/bioalgorithms/presenta$ons/Ch08_MassSpec.ppt

ProteinMicrorrays
MacbeathG(2002)NatureGene$cs32:526‐532

Poten$alDrawbacks?
MacbeathG(2002)NatureGene$cs32:526‐532
Plusyouneedspecifican$bodiesforeveryprotein.
Withthesandwichapproachyouneed2!
Buts$llalotofcoolresearchbeingdone,includinghereatHopkins(HengZhu).

MassSpectrometry
hHp://www.biostat.jhsph.edu/~iruczins/teaching/260.841/notes/c4.2.pdf

LocalResourcesAkhileshPandey
RobertCoHer

BoHomUpVs.TopDown
hHp://en.wikipedia.org/wiki/File:BoHom‐up_vs_top_down.svg
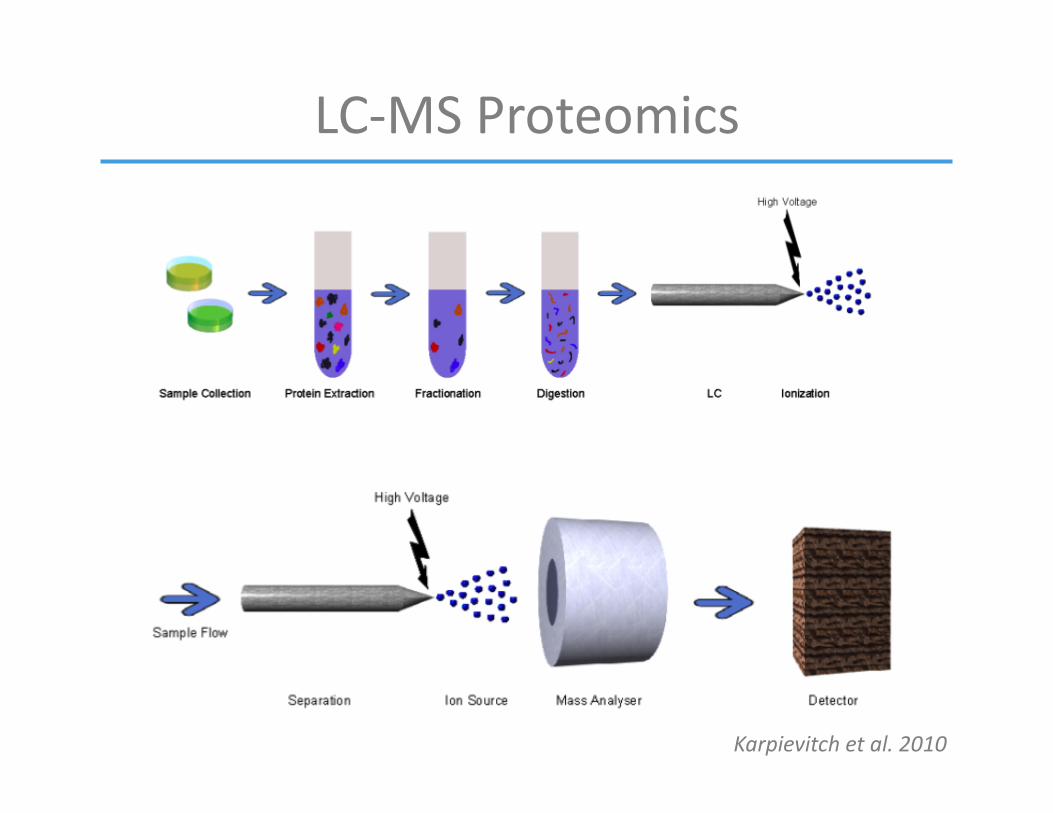
LC‐MSProteomics
Karpievitchetal.2010

2002NobelPrizeInChemistry“...fortheirdevelopmentsofsoidesorp$onionisa$onmethodsformassspectrometricanalysisofbiologicalmacromolecules”.
1/4toJohnB.Fenn(USA)
VirginiaCommonwealthUniversity
1/4toKoichiTanaka(Japan)
Shimadzu.Corp.Kyoto
Electrospray LaserIoniza$on
www.seas.gwu.edu/~simhaweb/cs177/fall2003/lecture6b.ppt
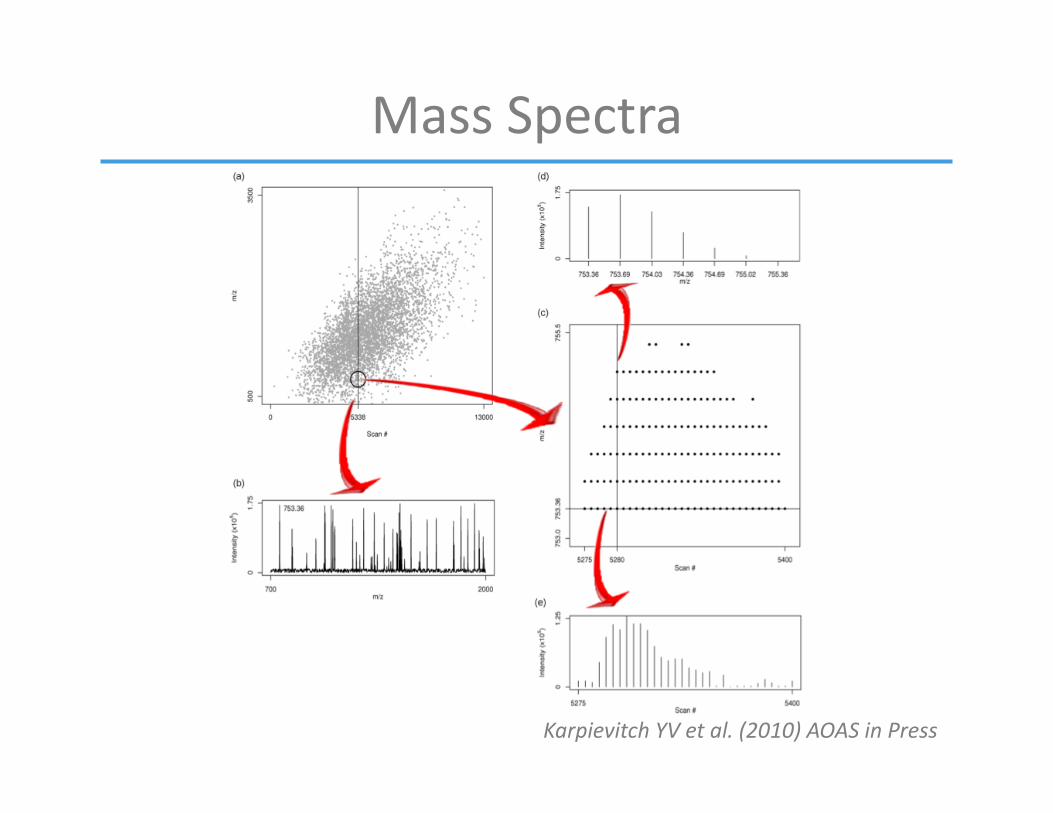
MassSpectra
KarpievitchYVetal.(2010)AOASinPress

Pep$deMassFingerprint
Cutout2D‐GelSpot
hHp://www.umiacs.umd.edu/~nedwards/documents/GWUIntroToBioinf.ppt

Pep$deMassFingerprint
TrypsinDigest
hHp://www.umiacs.umd.edu/~nedwards/documents/GWUIntroToBioinf.ppt

Pep$deMassFingerprint
MS
hHp://www.umiacs.umd.edu/~nedwards/documents/GWUIntroToBioinf.ppt

19
ProteinSequence
• Myoglobin - Plains zebra
GLSDGEWQQV LNVWGKVEAD IAGHGQEVLI RLFTGHPETL EKFDKFKHLK TEAEMKASED LKKHGTVVLT ALGGILKKKG HHEAELKPLA QSHATKHKIP IKYLEFISDA IIHVLHSKHP GDFGADAQGA MTKALELFRN DIAAKYKELG FQG
hHp://www.umiacs.umd.edu/~nedwards/documents/GWUIntroToBioinf.ppt

20
ProteinSequence
• Myoglobin - Plains zebra
GLSDGEWQQV LNVWGKVEAD IAGHGQEVLI RLFTGHPETL EKFDKFKHLK TEAEMKASED LKKHGTVVLT ALGGILKKKG HHEAELKPLA QSHATKHKIP IKYLEFISDA IIHVLHSKHP GDFGADAQGA MTKALELFRN DIAAKYKELG FQG
hHp://www.umiacs.umd.edu/~nedwards/documents/GWUIntroToBioinf.ppt

21
Pep$deMasses
1811.90 GLSDGEWQQVLNVWGK 1606.85 VEADIAGHGQEVLIR 1271.66 LFTGHPETLEK 1378.83 HGTVVLTALGGILK 1982.05 KGHHEAELKPLAQSHATK 1853.95 GHHEAELKPLAQSHATK 1884.01 YLEFISDAIIHVLHSK 1502.66 HPGDFGADAQGAMTK 748.43 ALELFR
hHp://www.umiacs.umd.edu/~nedwards/documents/GWUIntroToBioinf.ppt

22
Pep$deMassFingerprint
GLSDGEW
QQVLN
VWGK
VEA
DIAGHGQEV
LIR
LFTG
HPE
TLEK
HGTV
VLTALG
GILK
KGHHEA
ELKP
LAQSH
ATK
GHHEA
ELKP
LAQSH
ATK
YLEFISDAIIH
VLH
SK
HPG
DFG
ADAQGAMTK
ALELFR
hHp://www.umiacs.umd.edu/~nedwards/documents/GWUIntroToBioinf.ppt

23
MassSpectrometry
• Strengths – Precise molecular weight – Fragmentation – Automated
• Weaknesses – Best for a few molecules at a time – Best for small molecules – Mass-to-charge ratio, not mass – Intensity ≠ Abundance
hHp://www.umiacs.umd.edu/~nedwards/documents/GWUIntroToBioinf.ppt
24
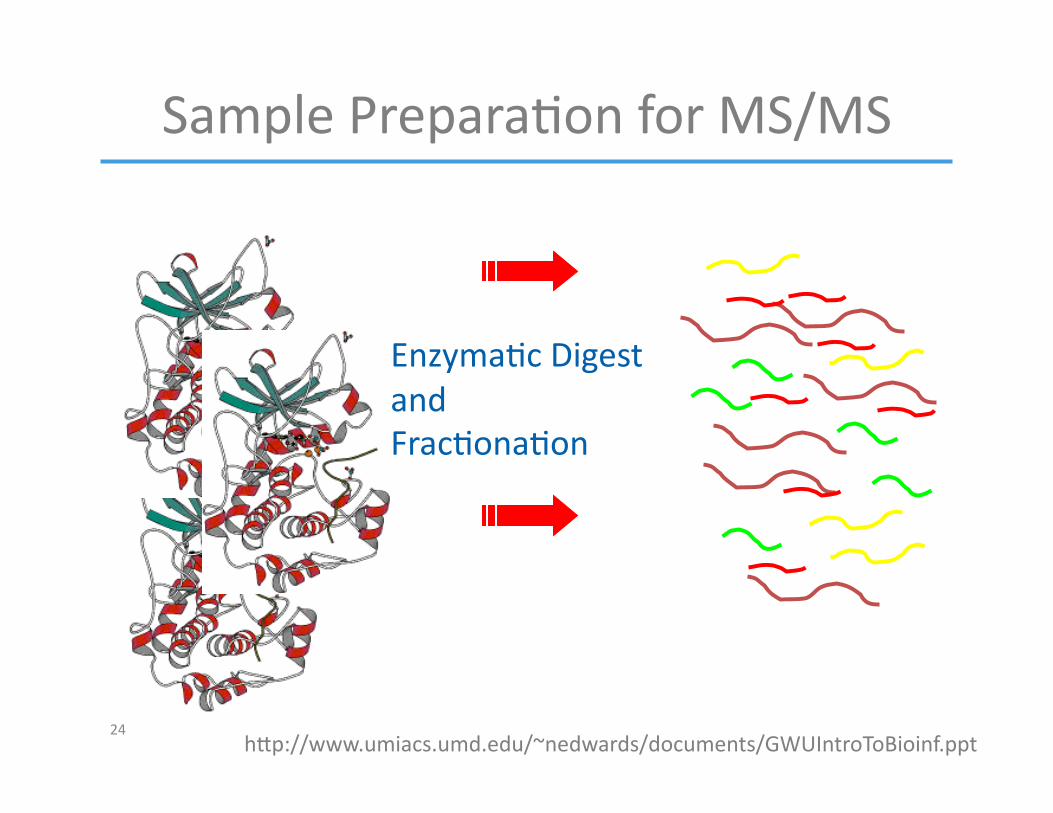
SamplePrepara$onforMS/MS
Enzyma$cDigestandFrac$ona$on
hHp://www.umiacs.umd.edu/~nedwards/documents/GWUIntroToBioinf.ppt

25
SingleStageMS
MS
hHp://www.umiacs.umd.edu/~nedwards/documents/GWUIntroToBioinf.ppt

26
TandemMassSpectrometry(MS/MS)
Precursorselec$on
hHp://www.umiacs.umd.edu/~nedwards/documents/GWUIntroToBioinf.ppt

27
Precursorselec$on+collisioninduceddissocia$on(CID)
MS/MS
hHp://www.umiacs.umd.edu/~nedwards/documents/GWUIntroToBioinf.ppt
TandemMassSpectrometry(MS/MS)

iTRAQ
hHp://www.cbs.umn.edu/msp/services/itraq.pdf

MassSpectrometryApplica$onsProteinInterac$ons:Hoetal.(2002)Nature415:123‐4
StemCellSystemsBiology:Luetal.(2009)Nature462:358‐62

MassSpectrometryApplica$ons
ClinicalDiagnos$cs:GraveIetal.(2004)JAMA292:462‐469

NextFewSlidesCourtesyWilliamNoble
hHp://noble.gs.washington.edu/~wnoble/genome541/lectures/Protein%20iden$fica$on%20from%20tandem%20mass%20spectra.ppt

Iden$fica$on
Whatpep$degeneratedthisspectrum?

Twoapproaches
Franketal.JPR.2006.

Inferringthepep$de
IYEVEGMR

Thespectrumgraph
Franketal.JPR.2006.

Thedatabasesearchapproach
Nesvizhskiietal.NatureMethods.2007.

SEQUESTcross‐correla$onscore
• Define Ri as the scalar product of the two spectra, with one offset by i.
• The score is R0 minus the average Ri for i in -75, …, 75.
E EA EAM EAMP
K PK MPK AMPK EAMPK

Xcorrcumula$vedistribu$on

Decoydatabase
• Search the observed spectra against a database of shuffled peptides.
• Use the resulting score distribution as an empirical null model.
• Estimate the FDR using this null.
Decoyproteindatabase
Targetproteindatabase
shuffleeachproteinsequence
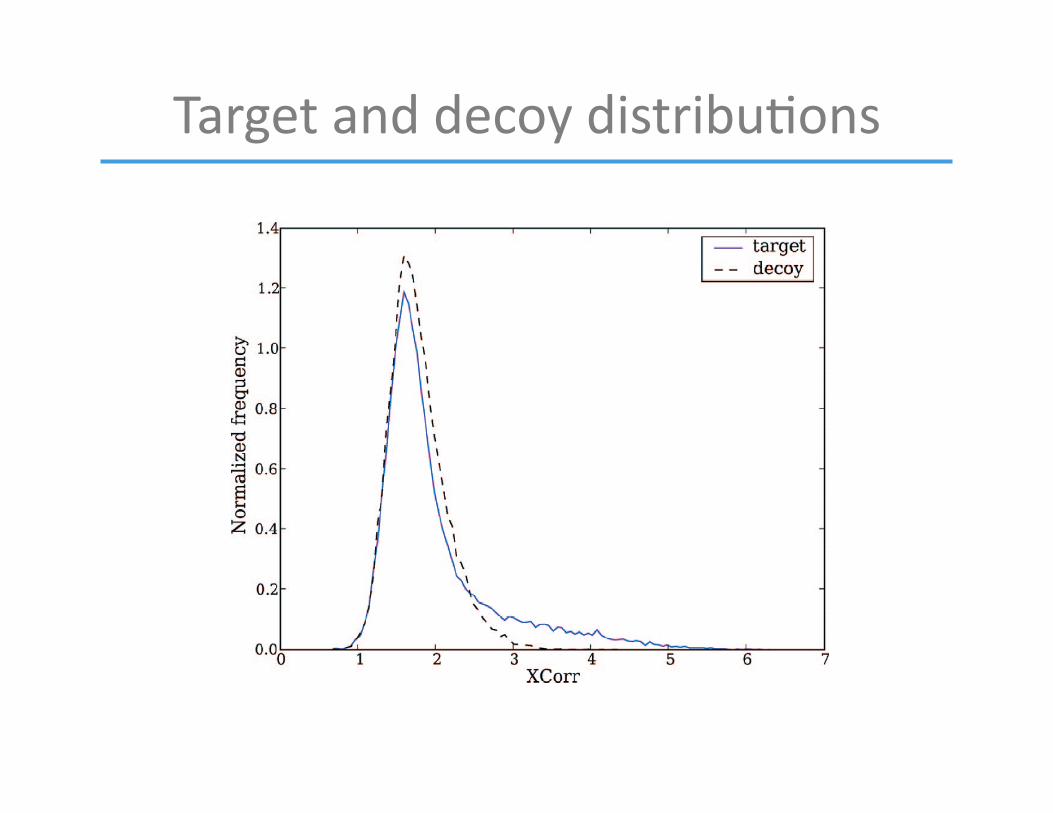
Targetanddecoydistribu$ons

Es$ma$ngfalsediscoveryratePSMssortedbyXCorr
FDR=0/5=0%
FDR=1/7=14%
FDR=2/10=20%
SpectraPep$dedatabase
Shuffledpep$dedatabase
SEQUEST
Realpep$de‐spectrummatches
Decoypep$de‐spectrummatches
FDR=2/9=22%

Q‐value

Q‐value
• The q-value associated with a score X is defined as the minimal false discovery rate threshold at which that score is deemed significant.
• The q-value is analogous to a p-value, but incorporates FDR-based multiple testing correction.

Normaliza$onBySVD
KarpievitchYVetal.(2009)BioinformaQcs25:2573‐2580

Quan$fica$on
KarpievitchYVetal.(2010)AOASinPress

BasicQuan$fica$onModel
KarpievitchYVetal.(2009)BioinformaQcs25:2028‐2034