Embed Size (px)
Citation preview
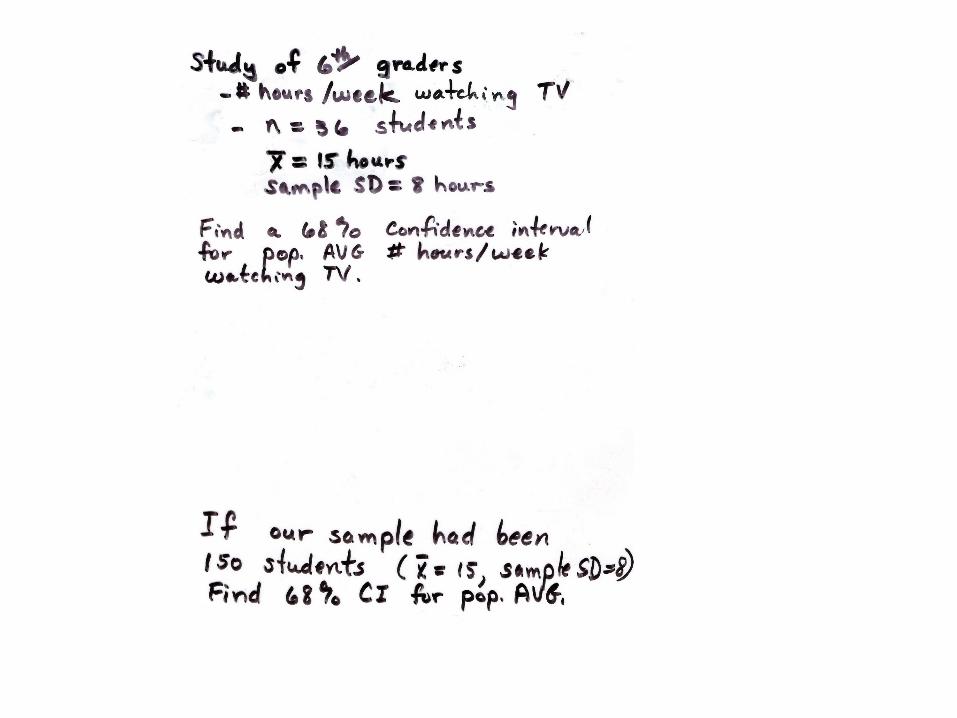
STAT 1301
Confidence Intervals
for
Averages
we usually DON’T KNOW the population AVG we take simple random sample of size n find sample AVG
- this is our “best guess” at pop. AVG
- “sample statistic”
QUESTION: How far is pop. AVG likely to be from sample AVG ?
Realistic Situation
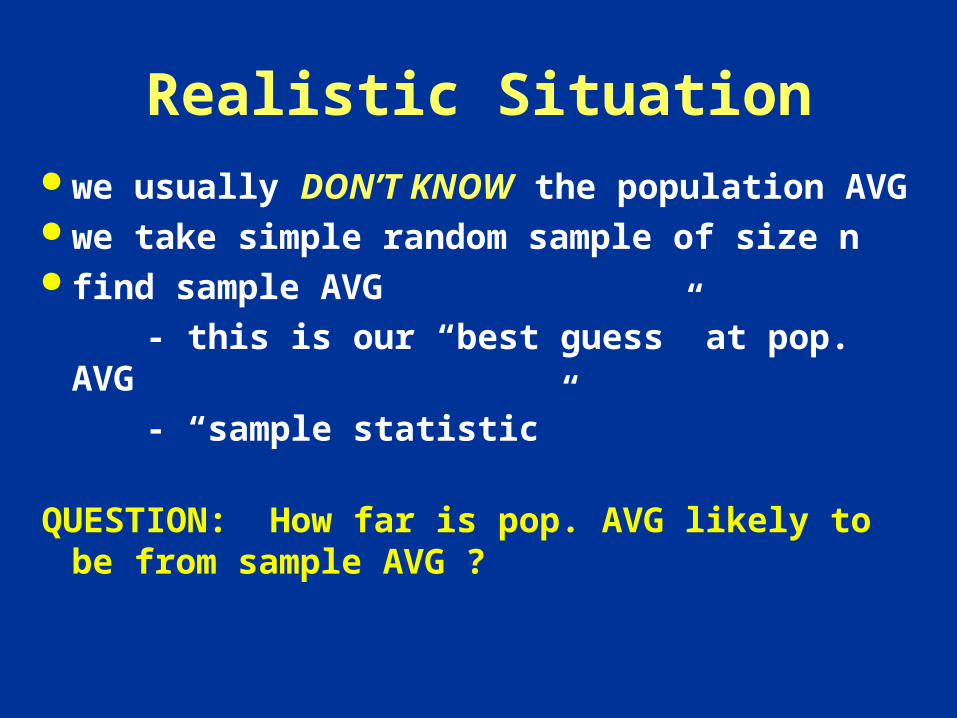
Huge population, can’t get exact average Take SRS of 100 stations. Results of sample:
AVG(sample) = $2.15 SD(sample) = $0.08 So, we estimate the average price for all
stations in Texas to be about $2.15. How close is this likely to be to the true Texas average ?
Example: Consumer reporter wants to know average price of unleaded gasoline in Texas on a certain day.
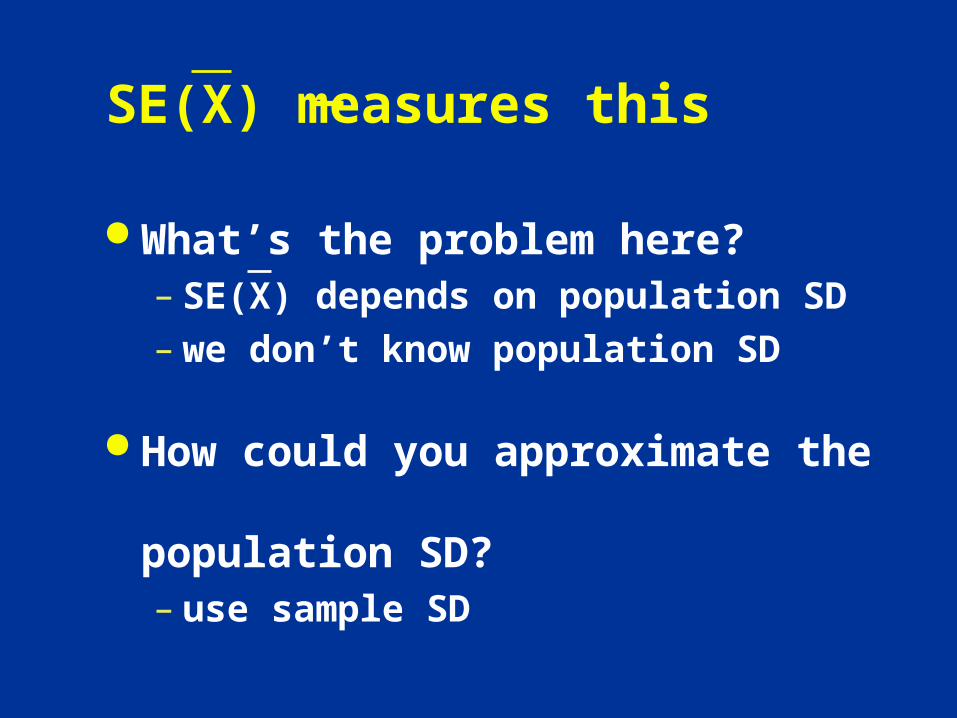
SE(X) measures this
What’s the problem here?– SE(X) depends on population SD– we don’t know population SD
How could you approximate the population SD?– use sample SD
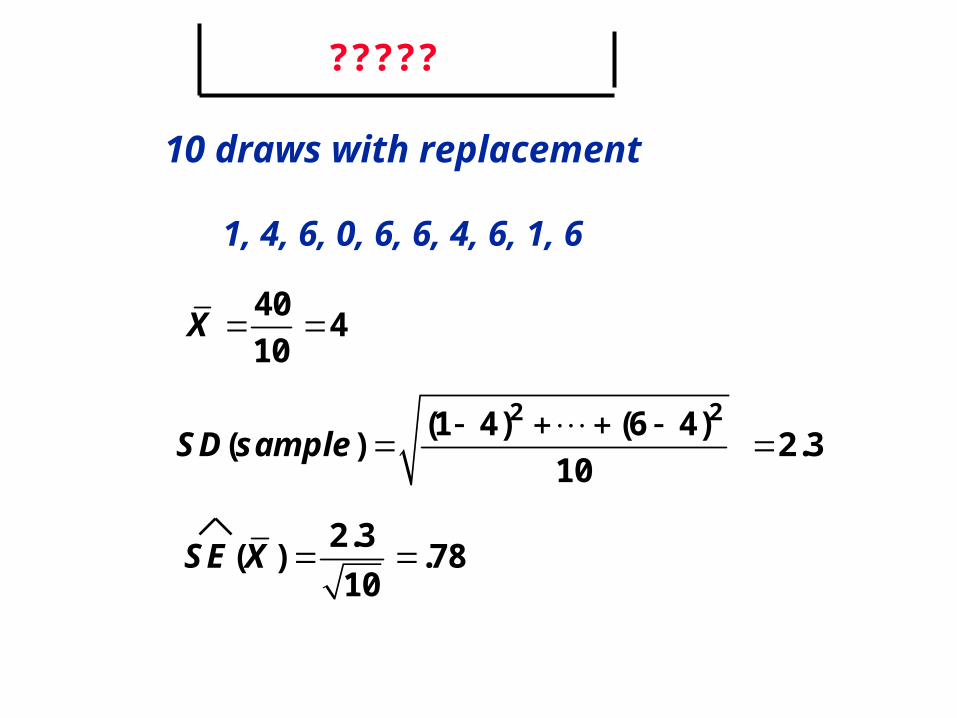
SE X2.3
( ) .7810
X40
410
SD sample
2 2(1 4) (6 4)( ) 2.3
10
10 draws with replacement
1, 4, 6, 0, 6, 6, 4, 6, 1, 6
?????
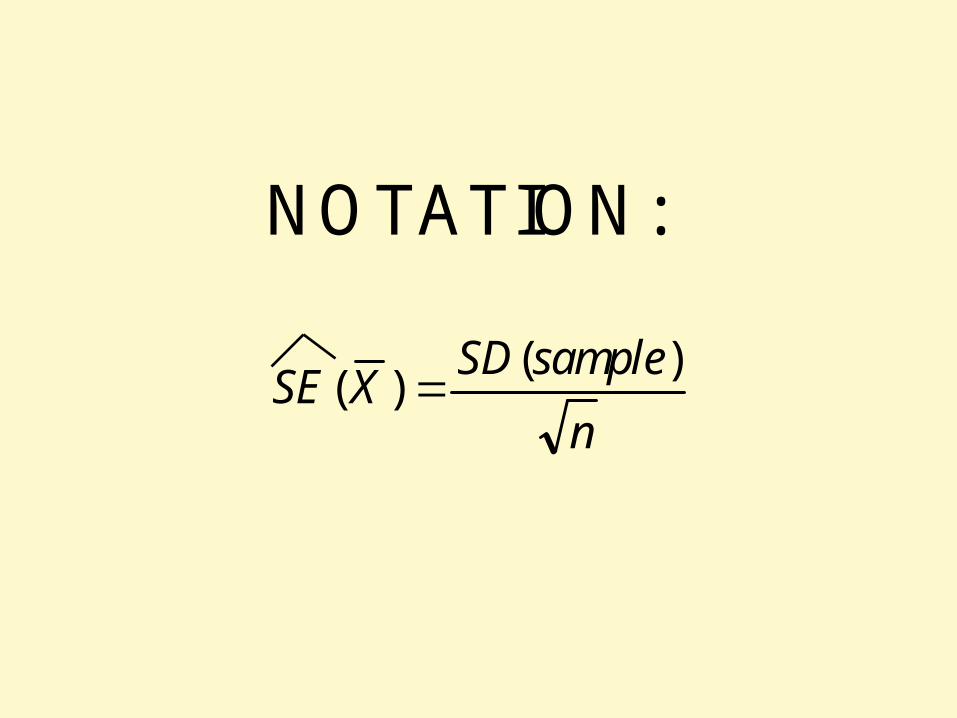
NOTATION:
SE XSD sample
n( )
( )
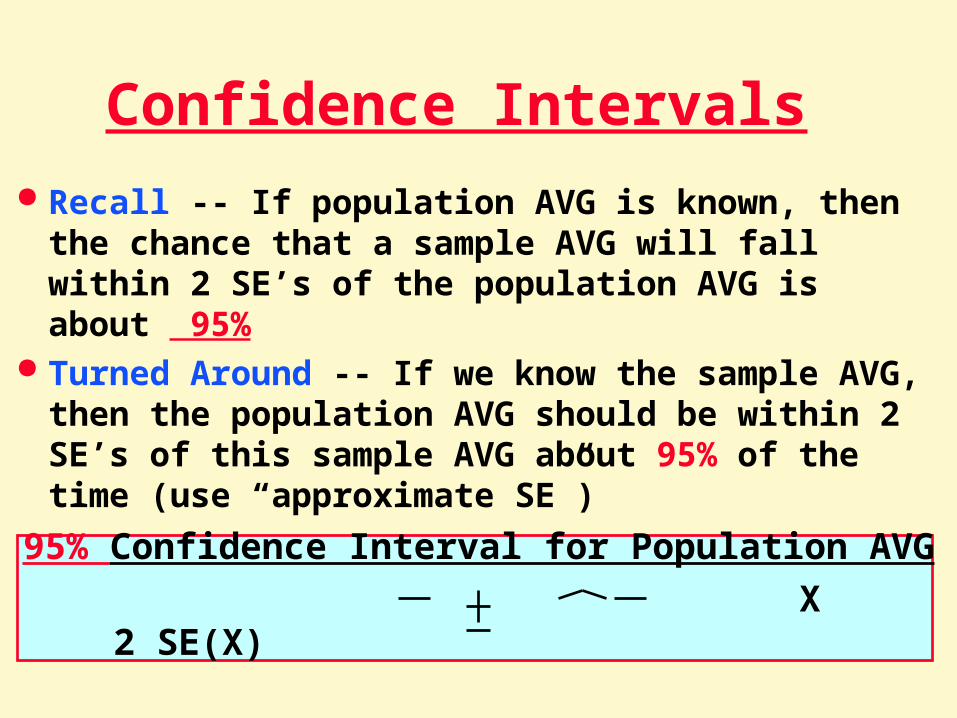
Recall -- If population AVG is known, then the chance that a sample AVG will fall within 2 SE’s of the population AVG is about 95%
Turned Around -- If we know the sample AVG, then the population AVG should be within 2 SE’s of this sample AVG about 95% of the time (use “approximate SE”)
95% Confidence Interval for Population AVG
X 2 SE(X)
Confidence Intervals
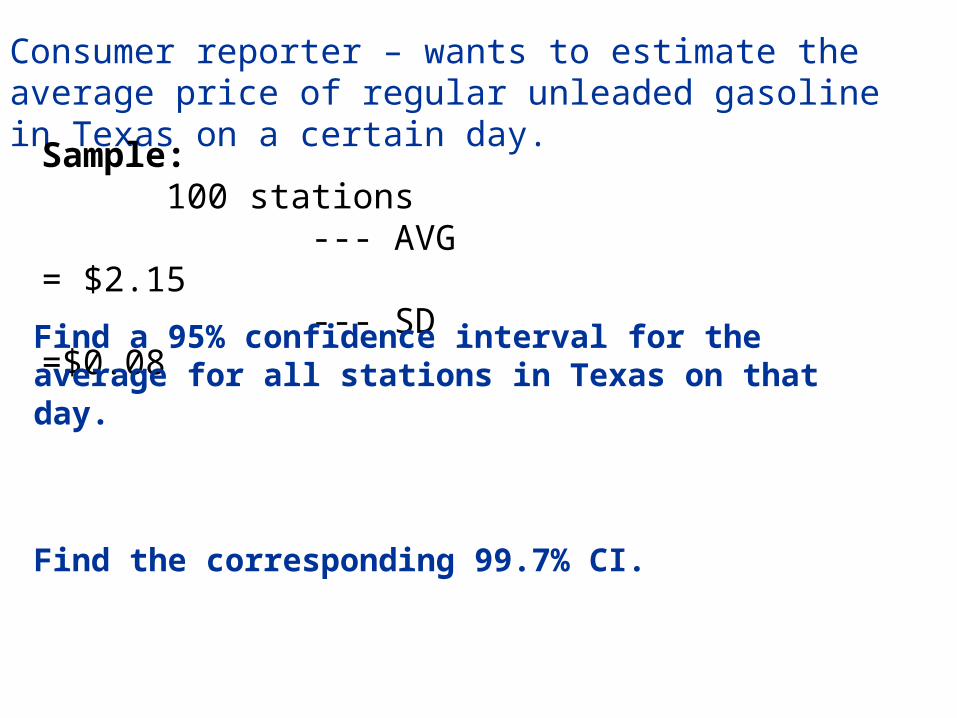
Consumer reporter – wants to estimate the average price of regular unleaded gasoline in Texas on a certain day.
Sample: 100 stations --- AVG = $2.15 --- SD =$0.08
Find a 95% confidence interval for the average for all stations in Texas on that day.
Find the corresponding 99.7% CI.
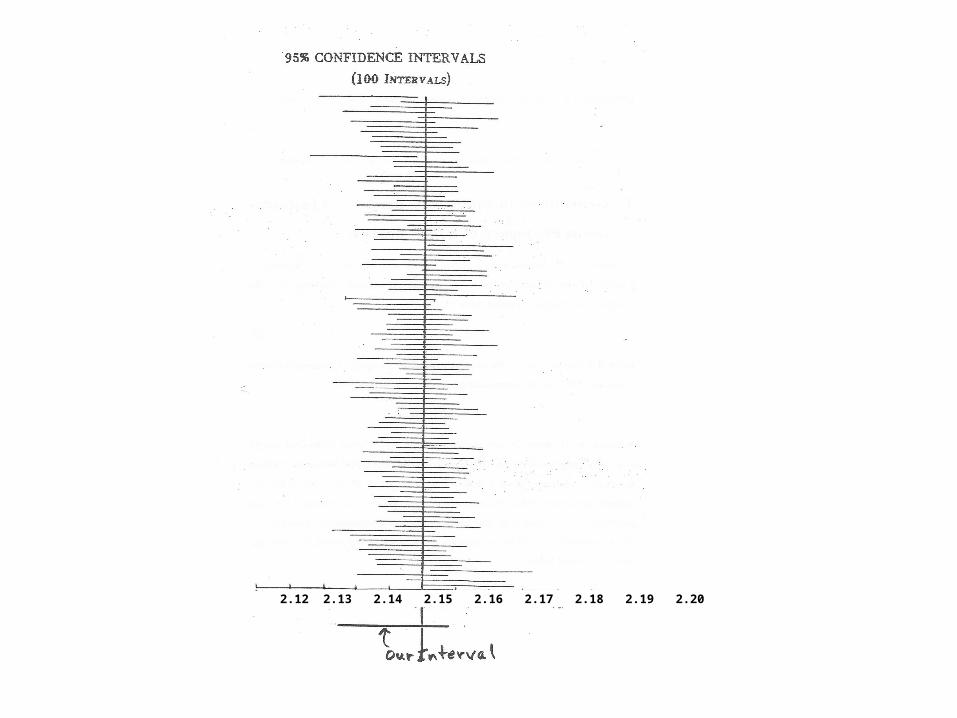
2.12 2.13 2.14 2.15 2.16 2.17 2.18 2.19 2.20
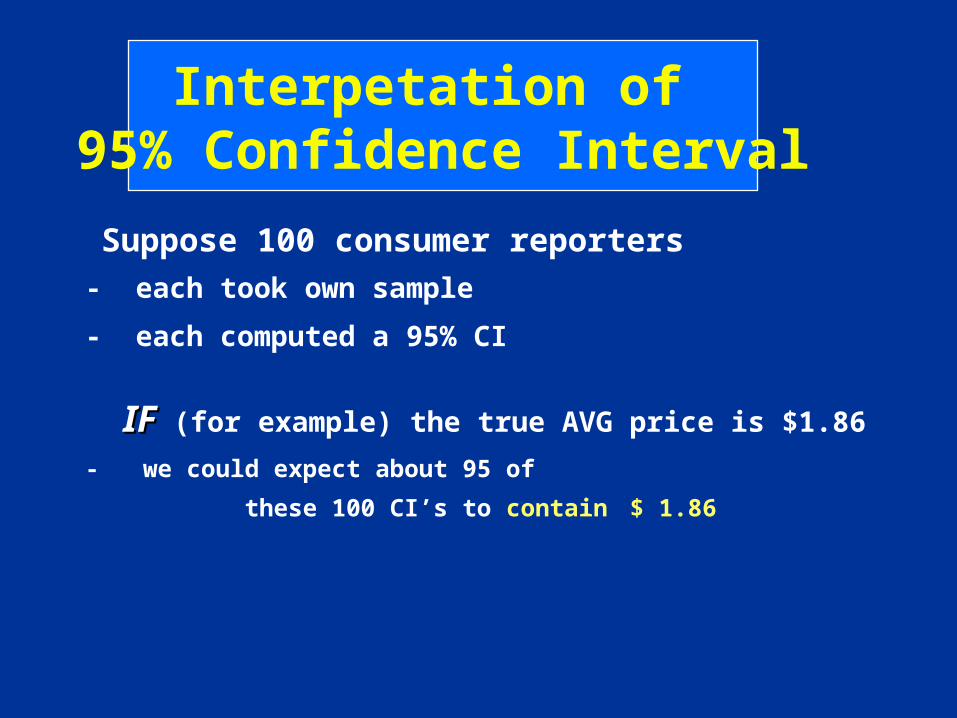
Suppose 100 consumer reporters - each took own sample
- each computed a 95% CI
IFIF (for example) the true AVG price is $1.86
- we could expect about 95 of
these 100 CI’s to contain $ 1.86
Interpetation of 95% Confidence Interval
Note:
For a given sample size n, – if you want higher confidence level, this
requires a longer interval
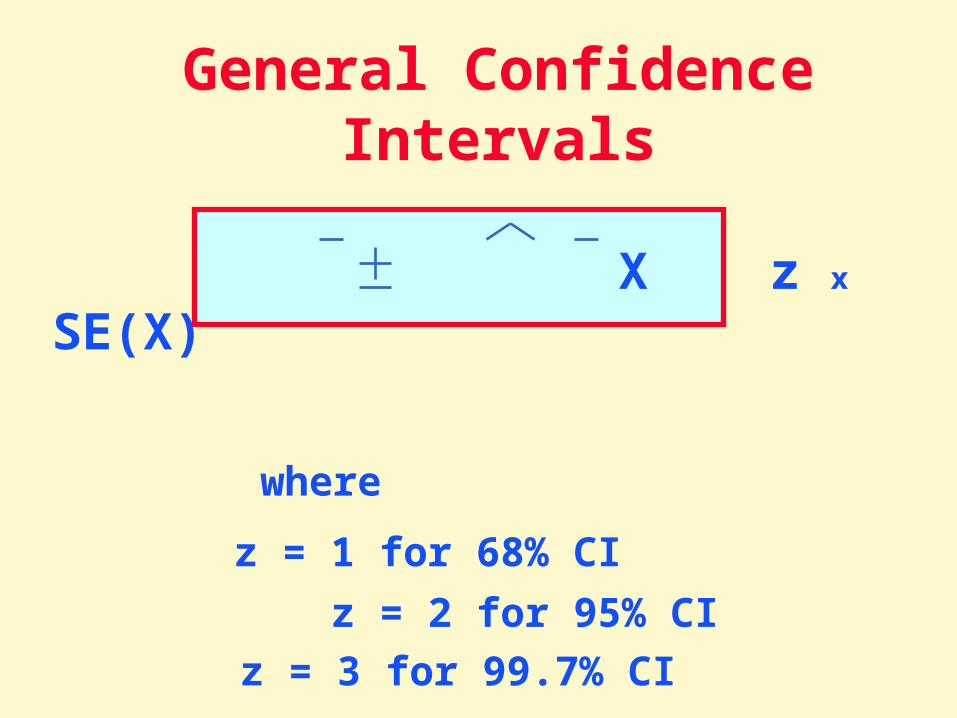
General Confidence Intervals
X z x SE(X)
where
z = 1 for 68% CI
z = 2 for 95% CI
z = 3 for 99.7% CI