Embed Size (px)
Citation preview
10/01/09 Lecture 9 1
STOR 155 Introductory Statistics
Lecture 9: Cautions about Regression
and Correlation, Causation
The UNIVERSITY of NORTH CAROLINA
at CHAPEL HILL
10/01/09 Lecture 9 2
Review
• Least-Squares Regression Lines
• Equation and interpretation of the line
• Prediction using the line
• Correlation and Regression
• Coefficient of Determination
10/01/09 Lecture 9 3
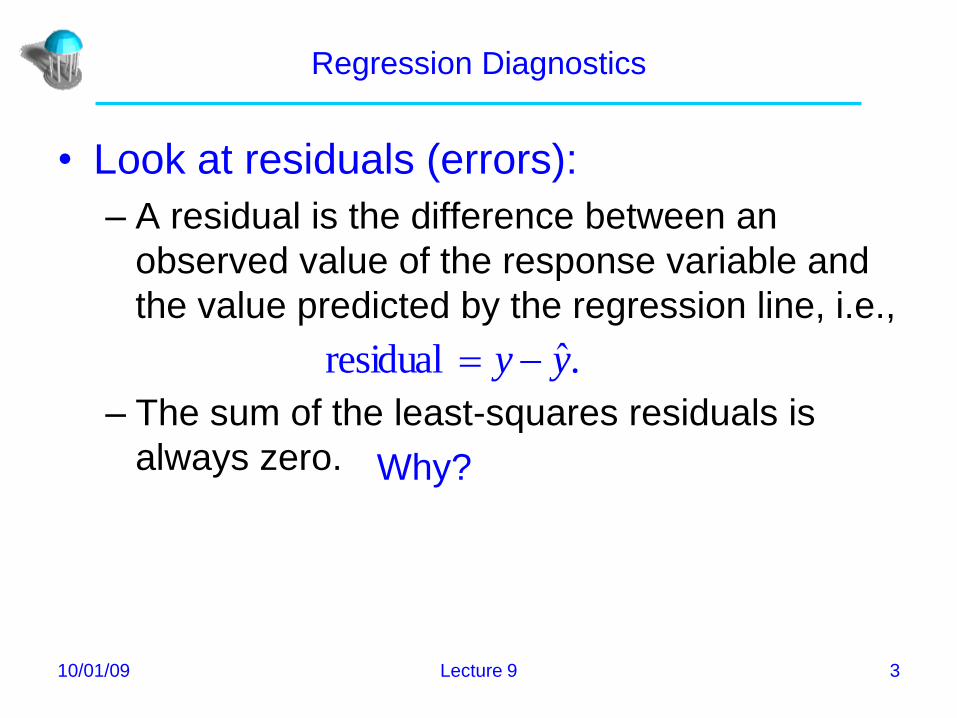
Regression Diagnostics
• Look at residuals (errors):
– A residual is the difference between an
observed value of the response variable and
the value predicted by the regression line, i.e.,
– The sum of the least-squares residuals is
always zero.
.ˆresidual yy
Why?

10/01/09 Lecture 9 4
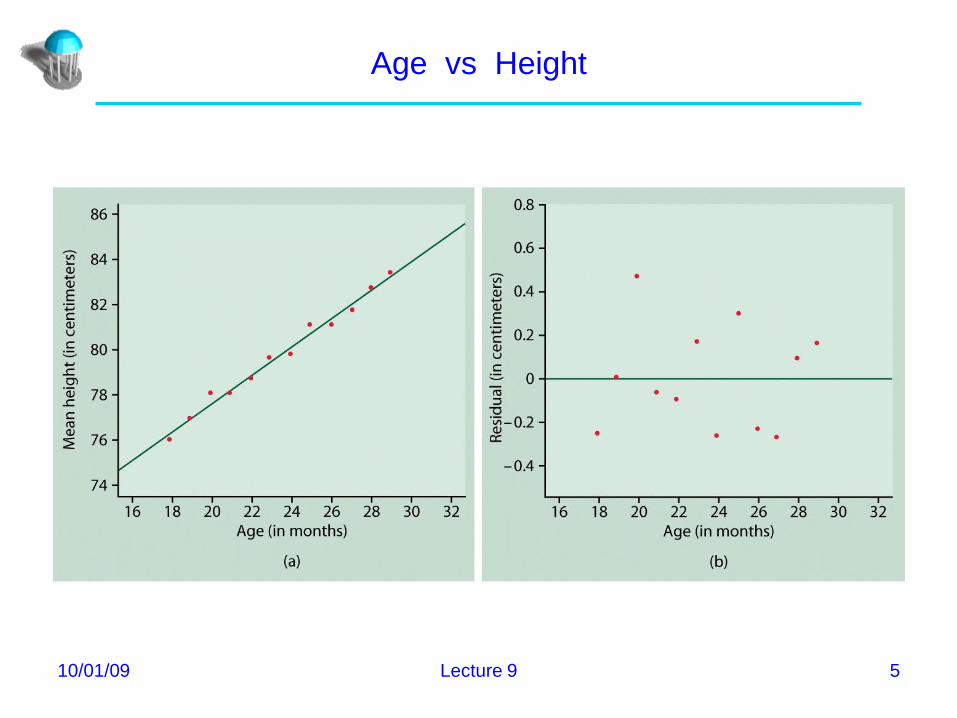
Residual Plots
• A residual plot is a scatterplot of the
regression residuals against the
explanatory variable.
• Residual plots help us assess the fit of a
regression line.
10/01/09 Lecture 9 5
Age vs Height
10/01/09 Lecture 9 6
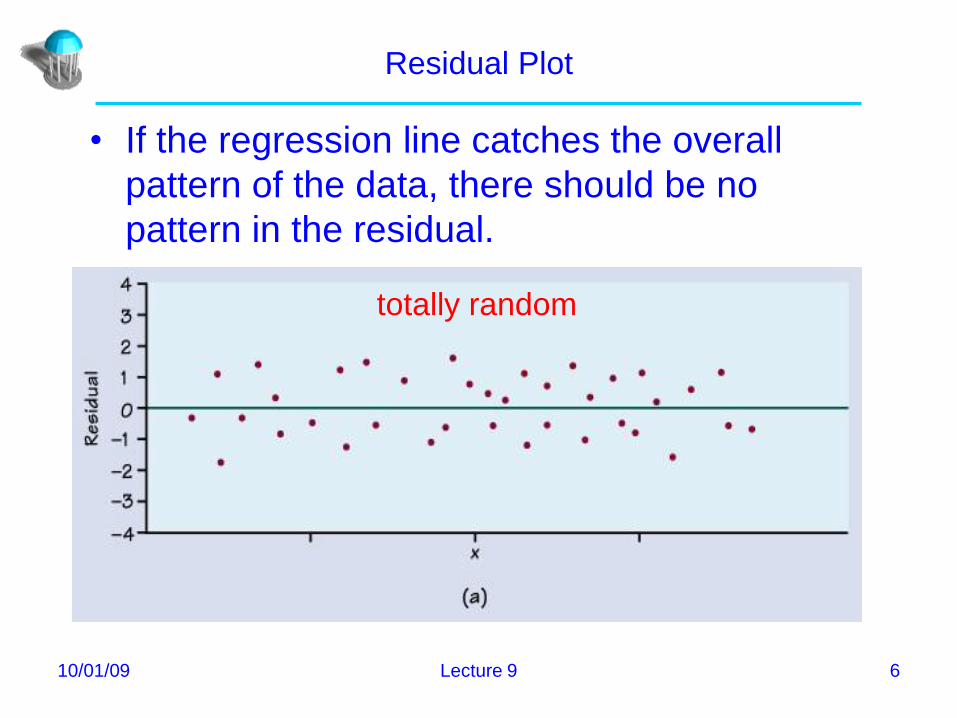
Residual Plot
• If the regression line catches the overall
pattern of the data, there should be no
pattern in the residual.
totally random
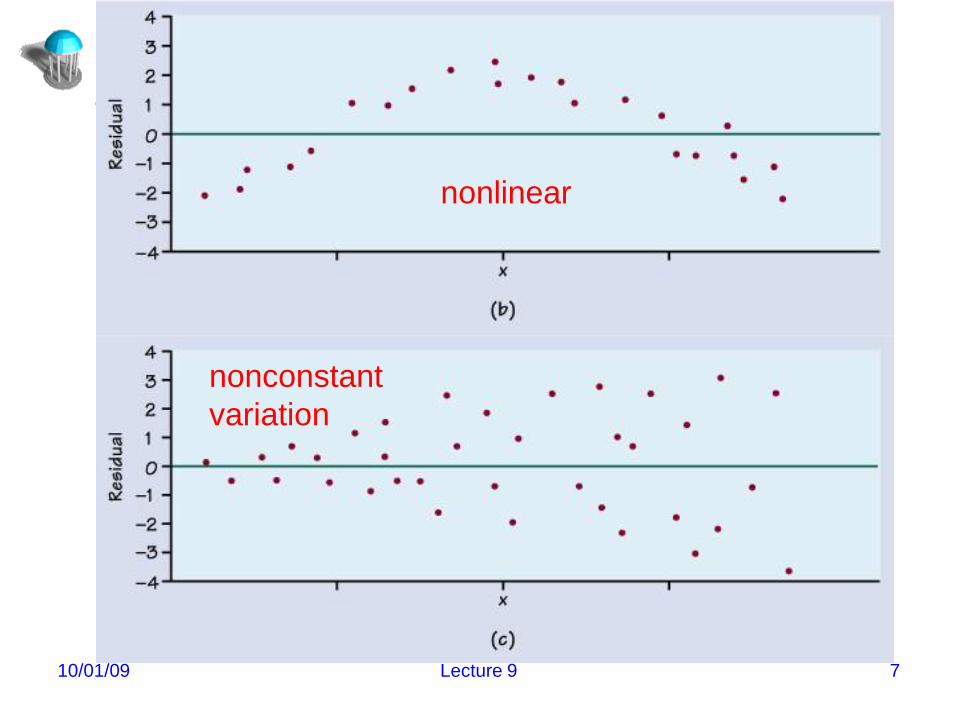
10/01/09 Lecture 9 7
nonlinear
nonconstant
variation
10/01/09 Lecture 9 8
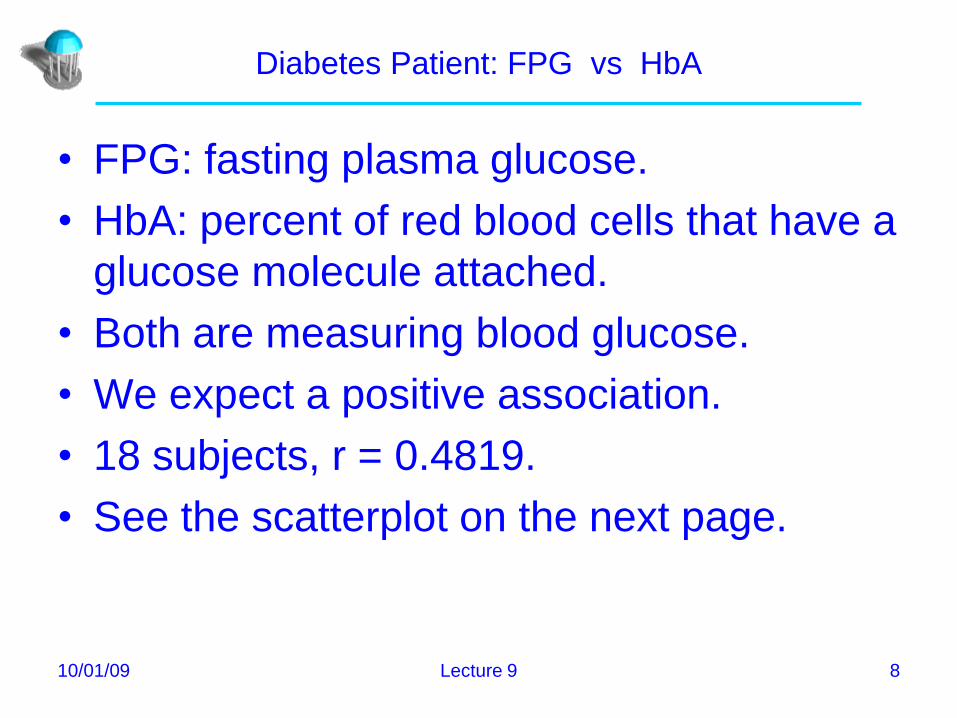
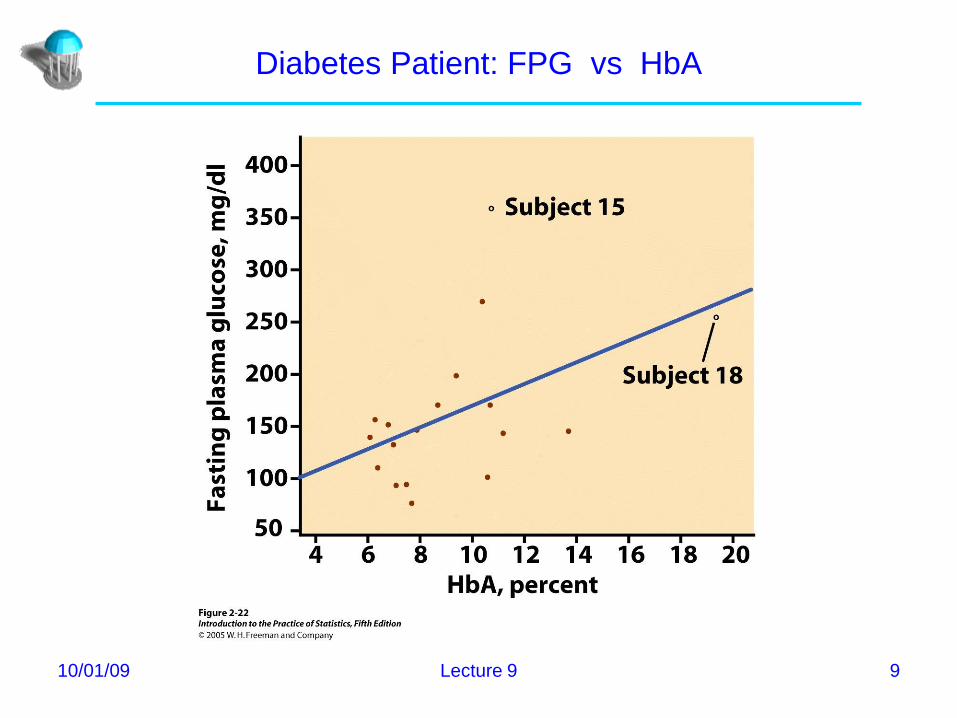
Diabetes Patient: FPG vs HbA
• FPG: fasting plasma glucose.
• HbA: percent of red blood cells that have a
glucose molecule attached.
• Both are measuring blood glucose.
• We expect a positive association.
• 18 subjects, r = 0.4819.
• See the scatterplot on the next page.
10/01/09 Lecture 9 9
Diabetes Patient: FPG vs HbA
10/01/09 Lecture 9 10
Outliers and Influential Observations
• An outlier is a point that lies outside the overall
pattern of the other points.
– Outliers in the y direction have large residuals, but
other outliers may not.
• An influential obs. is a point that the regression
line would be significantly changed with or
without it.
– Outliers in the x direction are often influential
points.
– But not always…

10/01/09 Lecture 9 11
Diabetes Patient: FPG vs HbA
10/01/09 Lecture 9 12
• Outliers in the y direction can be spotted
from the residual plot.
• Influential points can be identified by
fitting regression lines with/without those
points. More serious.
– Can not be identified via residual plot.
– Scatterplot gives us some hint.
Outliers & Influential Obs.
10/01/09 Lecture 9 13
Cautions about correlation and regression
• Linear only
• DO NOT extrapolate
• Not resistant
• Beware lurking variables
• Beware correlations based on averaged
data
• The restricted-range problem
10/01/09 Lecture 9 14
Lurking Variable
• A lurking (hidden) variable is a variable that has an
important effect on the relationship among the variables
in a study, but is not included among the variables being
studied.
• Examples:
– SAT scores and college grades
• Lurking variable: IQ
10/01/09 Lecture 9 15
Lurking variables can create nonsense correlations.
• For the world’s nations, let x be the number of TVs/person and y be the average life expectancy;
• A high positive correlation – nations with more TV sets have higher life expectancies.
– Could we lengthen the lives of people in Rwanda by shipping them more TVs?
• Lurking variable: wealth of the nation– Rich nations: more TV sets.
– Rich nations: longer life expectancies because of better nutrition, clean water, and better health care.
• There is no cause-and-effect tie between TV sets and length of life.
• Association vs causation.

10/01/09 Lecture 9 16
Misleading correlation (two clusters)
10/01/09 Lecture 9 17
Beware correlations based on averaged data
• A correlation based on averages over
many individuals is usually higher than the
correlation between the same variables
based on data for individuals.
• Age vs Height
• (Basketball) score % vs practice time
10/01/09 Lecture 9 18
The restricted-range problem
• A restricted-range problem occurs when
one does not get to observe the full range
of the variables.
• When data suffer from restricted range, r
and r2 are lower than they would be if the
full range could be observed.
• SAT scores vs College GPA
– Princeton vs Generic State College (Ex 2.26)
10/01/09 Lecture 9 19
Causation vs Association
• Some studies want to find the existence of causation.
• Example of causation: – Increased drinking of alcohol causes a decrease in
coordination.
– Smoking and Lung Cancer.
• Example of association: – The above two examples.
– SAT scores and Freshman year GPA.
10/01/09 Lecture 9 20
Association does not imply causation.
• An association between two variables x and y
can reflect many types of relationship among x,
y, and one or more lurking variables.
• An association between a predictor x and a
response y, even if it is very strong, is not by
itself good evidence that changes in x actually
cause changes in y.
10/01/09 Lecture 9 21
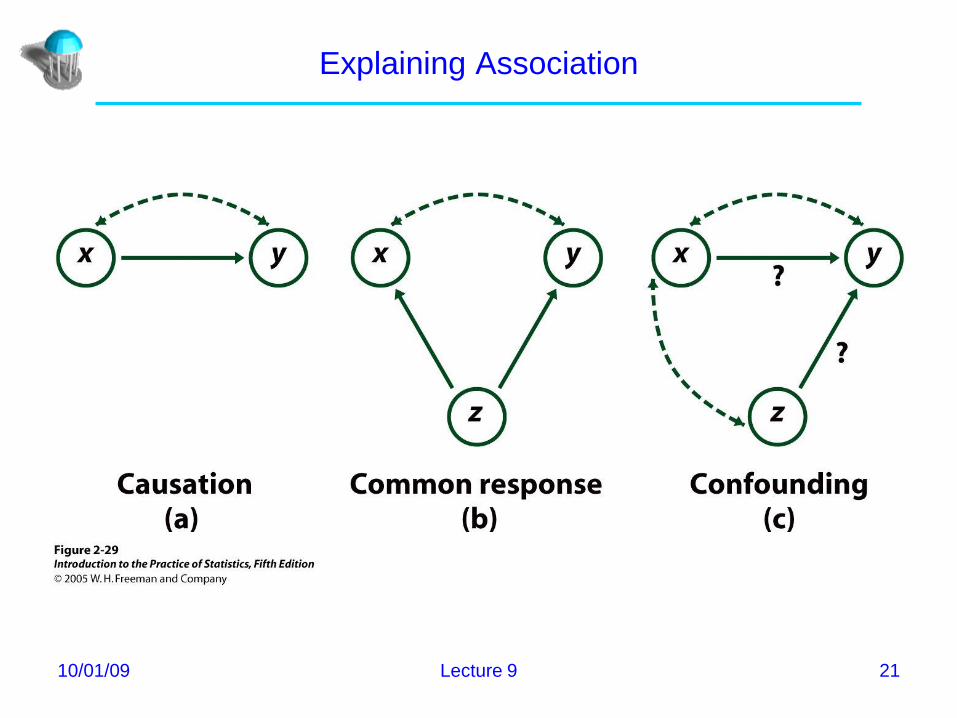
Explaining Association
10/01/09 Lecture 9 22
Explaining Association: Causation
• Cause-and-effect
• Examples– Amount of fertilizer and yield of corn
– Weight of a car and its MPG
– Dosage of a drug and the survival rate of the mice
10/01/09 Lecture 9 23
Explaining Association: Common Response
• Lurking variables
• Both x and y change in response to changes in z, the lurking variable
• There may not be direct causal link between x and y.
• Examples:
– SAT scores vs College GPA (IQ, Attitude)
– Monthly flow of money into stock mutual funds vs rate of return for the stock market (Market Condition, Investor Attitude)
10/01/09 Lecture 9 24
Explaining Association: Confounding
• Two variables are confounded when their effects
on a response variable are mixed together.
• One explanatory variable may be confounded
with other explanatory variables or lurking
variables.
• Examples:
– More education leads to higher income.
• Family background…
– Religious people live longer.
• Life style…
10/01/09 Lecture 9 25
Establishing causation
• The only compelling method: Designed
experiment (More in Chapter 3)
• Hot disputes:
– Does gun control reduce violent crime?
– Does meat consumption in your diet cause
heart diseases?
– Does smoking cause lung cancer?
10/01/09 Lecture 9 26
Does smoking CAUSE lung cancer?
• causation: smoking causes lung cancer.
• common response: people who have a
genetic predisposition to lung cancer also
have a genetic predisposition to smoking.
• confounding: people who drink too much,
don't exercise, eat unhealthy foods, etc.
are more likely to get lung cancer as a
result of their lifestyle. Such people may
be more likely to be smokers as well.
10/01/09 Lecture 9 27
Some guidelines when designed experiment is impossible:
• strong association
• association consistent across various
studies
• higher dose associated with stronger
responses
• the cause precedes the effect in time
• plausibility
10/01/09 Lecture 9 28
Take Home Message
• Residual Plots
• Outliers and Influential Observations
• Lurking Variables
• Cautions about Correlation and Regression
• Explaining associations:
– Causation
– Common response
– Confounding
• How to establish causation?