Embed Size (px)
Citation preview
AERC STUDY No. 30
STATE AGRICULTURAL PROFILE – PUNJAB
Jasdev Singh
D.K. Grover
Tejinder K. Dhaliwal
Agro-Economic Research Centre
Department of Economics and Sociology
Punjab Agricultural University

Ludhiana
September, 2012
TABLE OF CONTENTS
Sr.
No Chapter Page No.
1 Population Demography and Economy 1-11
1.1 Introduction 1
1.2 Population 2
1.3 Work force structure 4
1.4 Overview of state economy 5
2 Structure and Performance of Punjab Agriculture 12-27
2.1 Agrarian structure 12
2.1.1 Operational holdings 12
2.1.2 Cropping pattern 13
2.1.3 Relative share of different agricultural activities in primary sector 14
2.2 Growth performance of Punjab agriculture 16
2.3 Drivers of agricultural growth 20
2.4 Marketing and warehouse facilities 21
2.5 Emerging demand-supply mechanics 24
3 Natural Resources Management 28-38
3.1 Land use 28
3.2 Soil management 30
3.3 Cropping 1intensity 31
3.4 Land ceiling limit 32
3.5 Water management 33
3.6 Weather and climate 36
4 Farm Input Management 39-53
4.1 Seeds 39
4.2 Fertilizers and manures 40
4.3 Pesticides/weedicides 42
4.4 Farm machinery and equipments 44
4.5 Irrigation 45
4.6 Labour and agricultural Wages 47
4.7 Credit 49
5 Major Crops: Area, Production and Yield 54-58
6 Agricultural Research, Education and Extension 59-62
7 Animal Husbandry, Dairying and Fisheries 63-67
8 Post harvest Management and Value Addition 68-73
References 74

LIST OF TABLES
Table No. Title Page
No.
1.1 Population statistics of Punjab state 3
1.2 Description of rural and urban population in Punjab 4
1.3 Distribution of work force in Punjab 5
1.4 Gross state domestic product at factor cost by sectors in Punjab at
constant (2004-05) prices 6
1.5 Percentage distribution of gross state domestic product at factor cost
by sectors in Punjab at constant (2004-05) prices 8
1.6 Gross state domestic product at factor cost by sectors in Punjab at
current prices 9
1.7 Percentage distribution of gross state domestic product at factor cost
by sector in Punjab at current prices 10
1.8 Per capita income in Punjab 11
2.1 Distribution of operational holdings in Punjab 13
2.2 Shift in cropping pattern in Punjab (1970-71 to 2010-11) 14
2.3 Share of different primary sub-sectors in total primary sector (at
constant prices), Punjab 15
2.4 Share of different primary sub-sectors in total primary sector (at
current prices), Punjab 16
2.5 Area, production and yield of different crops and milk production,
1971-72 to 2010-11, Punjab 17
2.6 Decade wise compound growth rates (CGR) of major crops and milk
production in Punjab 19
2.7 Growth drivers in Punjab agriculture 22
2.8 Market and warehouse infrastructure in Punjab 23
2.9 Agency-wise state owned storage capacity in Punjab 24
2.10 Market arrivals of major crops in Punjab 25
2.11 Contribution of Punjab towards the central pool of food grains 25
2.12 Procurement of paddy and wheat by different agencies in Punjab 26
2.13 Purchase of cotton by cotton corporation of India 27
2.14 Area under different crops under contract farming scheme in Punjab 27
3.1 Land use pattern in Punjab 29
3.2 Land reclaimed through gypsum application, Punjab 30
3.3 Cropping intensity in Punjab State 30
3.4 Permissible land ceiling limit under Punjab Land Reforms Act, 1972 31
3.5 Source-wise net area irrigated in Punjab 34
3.6 Pre and post monsoon ground water level in Punjab 34
3.7 Distribution of blocks in different categories on basis of underground
water resources in Punjab 35
3.8 Annual average rainfalls in Punjab, 2007-2011 36
3.9 Important characteristics of agro-eco sub-regions of Punjab 37
4.1 Use of seed for major crops in Punjab 40
4.2 Seed prices of important crops in Punjab 40
4.3 Consumption fertilizers in Punjab 41
4.4 Fertilizer prices in Punjab 41
4.5 Consumption of insecticides/pesticides in Punjab 42
4.6 Prices of important insecticides/weedicides/fungicides inPunjab 43
4.7 Agricultural machinery and implements in Punjab 44
4.8 Prices of selected agricultural machinery in Punjab 45
4.9 Gross cropped and irrigated area in Punjab 46
4.10 Status of water resources on Punjab 46
4.11 Crop wise gross irrigated area in Punjab 47
4.12 Labour use (per ha) for major crops in Punjab 49
4.13 Wages paid to agricultural and skilled labour in Punjab 49

4.14 Institutional agricultural credits in Punjab 50
4.15 Number of kisan credit cards and amount sanctioned, distributed
under KCC scheme 51
4.16 Loan advanced and outstanding of Cooperative Credit Institutions (As
on 31st March)
52
4.17 Long term and short term credit provided by cooperative credit
institutions 52
4.18 Purpose-wise loan advanced by primary cooperative agricultural land
development banks (PADB) 53
4.19 Tractors and tube wells financed by state land development banks 53
5.1 Area, production and yield (plan-wise) of major crops, Punjab 56
5.2 Plan-wise compound annual growth rates of major crops in Punjab 58
6.1 List of crop varieties/hybrids released by Punjab Agricultural
University
59
6.2 Major agricultural extension activities by Punjab Agricultural
University 61
7.1 Number of livestock, Punjab, 1990 - 2007 64
7.2 Production of important livestock products in Punjab 65
7.3 Fisheries statistics in Punjab 65
7.4 Average no. of livestock units, area and units served per veterinary
institution and per veterinarian in Punjab 66
7.5 Livestock and artificial insemination development centers and frozen
semen straw produced in Punjab 66
8.1 Number of rice mills in Punjab 69
8.2 District wise number of modern rice mills, 2009-10, Punjab 70
8.3 Cane crushed and sugar produced by sugar mills in Punjab 70
8.4 Cotton textile mills, spindles and looms in Punjab 71
8.5 Production of yarn, cloth in cotton textile mills and production of
traditional khadi in Punjab 71
8.6 Numbers of milk plants and milk processing capacity in Punjab 72
PREFACE
The present report has been prepared by Agro Economic Research Centre, Ludhiana to
update the information on various performance related indicators of agricultural sector in Punjab,
encompassing state population, demography, structure, performance, natural resources
management, farm input management, area, production and yield of major crops, status of
agricultural research, education and extension, animal husbandry, dairying, fisheries, post
harvest management and value addition etc. The Uniqueness of this report is that it contains
recent updated trends based on time series data on various socio-economic parameters in the
state. This document would serves as a ready - reckener as well as an effective quantitative tool
for reaching to logical conclusions in the context of planning and public policy making.
We express our gratitude to the Directorate of Economics and Statistics, Ministry of
Agriculture, Government of India, New Delhi for their financial support for preparation of this
document.
Authors

1
Chapter 1
Population Demography and Economy
1.1 Introduction
Punjab holds place of pride among the Indian States for its outstanding achievements in
agricultural development. The state has witnessed tremendous increase in the agricultural
production during the Green Revolution period, mainly due to healthy mix of institutional and
technological factors. Agrarian economy, consolidation of landholdings, reclamation of new
agricultural lands, development of irrigation, use of biochemical inputs comprising high yielding
variety seeds, chemical fertilizers, insecticides and mechanical inputs were among the important
factors which helped Punjab agriculture in making rapid strides. Dominating rural based political
power with agricultural background provided favorable environment through thrust on rural and
agricultural development. In this context, extension of irrigation network, rural link roads, rural
electrification, establishment of focal points and agricultural market centers, efficient delivery
system of credit and other agricultural inputs along with effective implementation of agricultural
price policy for wheat and paddy played significant role in agriculture and rural development of
state. Consequently, the Punjab state comprising only 1.54 per cent of the total geographical area
of country now contributes 13-14 per cent towards the total food grain production of the country.
State has earned a name of granary of India through contributing 35-40 per cent of rice and 40 to
75 per cent of wheat to the central pool in the past two decades.
Green Revolution sustained till the eighties, after which the agricultural production in the
state showed the signs of stagnation. In nineties, the exalting cost of cultivation of major crops
further aggravated the situation through squeezing the profitability of agriculture adversely
affecting the socio-economic condition of farmers in the state. Thus, the agriculture in state has
reached a plateau making it very hard to make further progress under available technologies and
natural resource base. Its relative contribution in central pool of food grains both for wheat and
paddy has also been declining during last few years, though, still being the largest contributor of
wheat and second largest of paddy after Andhra Pradesh to central pool of the country.
The emerging scene of Punjab agriculture is not free from some serious concerns. The
state cropping pattern dominated by wheat-rice rotation is causing a serious damage to the state’s

2
natural resource base. Paddy in particular, a water-intensive crop is blamed for water-table
depletion in tube-well irrigated areas and water-logging in canal irrigated areas. Increasing
incidence of nutrient deficiency in the soils, including micronutrients and insect-pest attacks on
the crops are also posing major threats to productivity, food grain production and sustainability
of agriculture in the long run. Diversification of cropping pattern towards environment friendly
high value crops with emphasis on quality output and promotion of agro-processing industry is
the need of hour.
The present study has been an attempt to update the information of the agricultural sector
in Punjab state. For this available recent secondary data have been taken from various sources
and interpreted.
1.2 Population
Total population of Punjab as per 2011 census is 27,704,236 of which male and female
are 14,634,819 and 13,069,417 respectively (Table 1.1). In 2001, total population was
24,358,999 in which males were 12,985,045 while females were 11,373,954. The total
population growth in this decade was 13.73 percent while in previous decade it was 20.10 per
cent. The population of Punjab forms 2.29 percent of India in 2011. In 2001, the figure was 2.37
per cent. Literacy rate in Punjab has seen upward trend and is 76.68 percent as per 2011
population census. Of that, male literacy stands at 81.48 percent while female literacy is at 71.34
percent. In 2001, literacy rate in Punjab stood at 69.65 percent of which male and female were
75.23 percent and 63.36 percent literate, respectively. With total geographical area of Punjab at
50,362 sq. km the population density of Punjab is 550 per sq km which is higher than national
average of 382 per sq km. In 2001, density of Punjab was 484 per sq km, while national average
at that time was 324 per sq km. Sex Ratio of Punjab is 893 i.e. for each 1000 male, which is
below national average of 940. In 2001, the sex ratio of female was 876 per 1000 males in
Punjab. From 2001 to 2011, the share of rural population in the total population of state declined
from 66.08 per cent to 62.51 per cent where as that of urban population increased from 33.92 per
cent to 37.49 per cent (Table 1.2). During this time period the rural literacy rate increased from
64.7 per cent to 72.45 per cent and that of urban literacy from 79.1 per cent to 83.70 per cent
(Population census, 2011).

3
Table 1.1: Population statistics of Punjab state
(Number)
Population 2001 2011
Total state population 24358999 27704236
Male population 12985045
(53.31)
14634819
(52.83)
Female population 11373954
(46.69)
13069417
(47.17)
Decennial population growth (%) 20.10 13.73
Percentage to the total population of India 2.37 2.29
Sex ratio 876 893
Population density/sq. km 484 550
Total child population (0-6 age) 3171829 2941570
Male child population 1763801 1593262
Female child population 1408028 1348308
Child sex ratio 798 846
Total literates 14756970 18988611
Male literates 8442293 10626788
Female literates 6314677 8361823
Literacy rate (%) 69.65 76.68
Male literacy rate (%) 75.23 81.48
Female literacy rate (%) 63.36 71.34
Source: Statistical Abstract, Punjab
*Literacy has been calculated after excluding 0-6 age group
Figures in the parenthesis are percentages to the total population
4
Table 1.2: Description of rural and urban population in Punjab
(Number)
Population 2001 2011
Rural Urban Rural Urban
Percentage to total population
of the state 66.08 33.92 62.51 37.49
Rural/urban population 16096488 8262511 17316800 10387436
Male population 8516596 4468449 9086466 5548353
Female population 7579592 3794062 8230334 4839083
Sex ratio 890 849 906 872
Child population (0-6 age) 2176726 995103 1864484 1077086
Percentage child population 13.52 12.04 10.77 10.37
Child sex ratio 799 796 843 851
Total literates 9008631 5748239 11195395 7793216
Literacy rate of the state (%) 64.7 79.1 72.45 83.70
Male literacy rate (%) 71.0 83.0 77.92 87.28
Female literacy rate (%) 57.5 75.5 66.47 79.62
Source: Statistical Abstract, Punjab
1.3 Work force structure
With the advent of Green Revolution, Punjab has emerged as the most advanced state in
agricultural development. Overtime, though agricultural sector experienced a decline in the
importance in terms of its share in GSDP and work force, yet it remains the single most
important sector of the state economy. As per 2001 census data, total workforce of state was
9127474, out of which 3554928 were dependent on agriculture and allied activities (Table 1.3).
Cultivators and agricultural labours directly dependent on agriculture accounted for about 40 per
cent of the total workforce of state. Out of the total agricultural work force cultivators and
agricultural labours accounted for 58.09 and 41.91 per cent, respectively. Agriculture being the
backbone of state economy, other major activities like agro-processing, transportation, trade,
storage, etc. are directly or indirectly dependent on it. Thus, performance of agriculture sector
5
determines the scope and rate of development and employment in other sectors as well as overall
state economy.
Table 1.3: Distribution of work force in Punjab
(Number)
Particulars 1961 1971 1981 1991 2001
Total cultivators 1602666 1665153 1767286 1917210 2099330
Total agri. Labour 334610 786705 1092225 1452828 1498976
Total agri. work force 1937276 2451858 2859511 3370038 3598306
Total work force 3466269 3912592 4927759 6098374 9141760
Share of workers
engaged in agri. in total
work force
55.89 62.67 58.03 55.26 39.36
Share of agri. labour in
total agri. work force 17.27 32.09 38.20 43.11 41.66
Share of cultivators in
total agri. work force 82.73 67.91 61.80 56.89 58.34
Share of agri. labour in
total work force 9.65 20.11 22.16 23.82 16.40
Share of cultivators in
total work force 46.24 42.56 35.86 31.44 22.96
Source: Statistical Abstract, Punjab
1.4 Overview of state economy
Economic activities in state are showing structural changes over a period of time and
primary sector is experiencing a decline in terms of share in State Domestic Product (SDP).
Sectoral distribution GSDP of Punjab state at current prices and constant prices (2004-05) along
with percent distribution is presented through Tables 1.4 to 1.7. Table 1.4 revealed that GSDP of
Punjab at constant prices (2004-05) has increased from Rs 123223 crore in 2007-08 to Rs
148069 crore in 2010-11. Overall economy of Punjab state has witnessed a growth rate of 5.85,
6.29 and 6.81 percent during 2008-09, 2009-10 and 2010-11, respectively. At constant prices
(2004-05), the contribution of primary sector consisting of agricultural and allied activities
towards GSDP has increased from Rs 34107 crore in 2007-08 to Rs 35740 crore in 2010-11.
This sector had shown growth of 2.05 and 3.01 percent during 2008-09 and 2010-11,
respectively. However, its growth was recorded marginally negative during year 2009-10.

6
Table 1.4: Gross state domestic product at factor cost by sectors in Punjab at constant
(2004-05) prices
(Rs. Crore)
Sector 2007-08 2008-09 2009-10 2010-11
Agriculture and livestock 32498.88 33113.53 32924.59 33907.71
Agriculture 21575.44 22155.18 22085.01 22905.55
Livestock 10923.44 10958.35 10839.58 11002.16
Forestry and logging 1298.49 1349.44 1402.55 1451.5
Fishing 282.12 308.89 338.96 350.32
Agriculture & allied 34079.49 34771.86 34666.1 35709.53
Mining and quarrying 27.27 33.32 28.31 30.1
Sub- total (Primary) 34106.8
34805.2
(2.05)
34694.41
(-0.32)
35739.63
(3.01)
Manufacturing 24121.68 24882.89 27878.64 30067.03
Registered 12920.46 13676.38 16009.5 17844.19
Un-registered 11201.22 11206.51 11869.14 12222.84
Construction 9550.01 10284.66 10720.47 11329.68
Electricity, Gas & water supply 4039.51 4135.73 4158.86 4324.44
Sub- total (Secondary) 37711.2
39303.3
(4.22)
42757.97
(8.79)
45721.55
(6.93)
Total industry 37738.47 39336.6 42786.28 45751.25
Transport, storage &
communication 8122.16 8740.52 9389.6 10219.1
Railways 1434.23 1420.85 1428.5 1535.45
Transport & other means 3907.05 4130.02 4441.4 4751.29
Storage 410.35 414.88 419.37 429.41
Communication 2370.53 2774.77 3100.33 3502.95
Trade, Hotel & restaurants 13660.29 1495.69 15552.13 16225.54
Banking & insurance 7265.47 8249.06 9549.93 11421.31
Real estate, ownership of dwelling
& business services 6311.49 6626.74 6891.63 7180.87
Public administration 5335.81 6167.65 6769.77 7311.35
Other services 10710.05 11583.64 13023.52 14249.95
Sub- total (Tertiary) 51405.3
56322.3
(9.57)
61176.58
(8.62)
66608.13
(8.88)
Gross state domestic product 123223.2
130430.8
(5.85)
138628.96
(6.29)
148068.9
(6.81)
Source: Statistical Abstract, Punjab
Figures in parenthesis are percent change over the previous year
7
Secondary sector mainly consisting of manufacturing, construction and power sectors has
increased at rate of 4.22, 8.79 and 6.93 per cent during 2008-09, 2009-10 and 2010-11,
respectively. In absolute terms, contribution of this sector in GSDP increased from Rs 37711
crore in 2007-08 to Rs 45722 crore in 2010-11. The contribution of tertiary sector of state
comprising trade, transport, banking, insurance and public administration towards GSDP had
increased from Rs 51405 crore in 2007-08 to Rs 66608 crore in 2010-11. Per annum increase in
this sector was recorded at 9.57, 8.62 and 8.88 percent during 2008-09, 2009-10 and 2010-11,
respectively.
The share of agriculture in GSDP at constant prices (2004-05), which was 17.51 percent
during 2007-08 declined to 15.47 percent during 2010-11. During the same period, the share of
overall primary sector including livestock, forestry, and allied agricultural activities along with
agriculture declined from 27.66 percent to 24.12 percent. On the other hand, over this period
while the share of secondary sector in GSDP remained almost constant at 31 per cent; that of
tertiary sector increased from 41.72 per cent to 44.98 percent. At current prices the Per Capita
Income in Punjab state increased from Rs 49380 in 2007-08 to Rs 68998 in 2010-11. At constant
prices (2004-05) the Per Capita Income which was Rs 39567 during 2007-08 increased by 13.44
per cent to Rs 44885 in 2010-11 (Table 1.8).

8
Table 1.5: Percentage distribution of gross state domestic product at factor cost by sectors
in Punjab at constant (2004-05) prices
Sector 2007-08 2008-09 2009-10 2010-11
Agriculture and livestock 26.37 25.39 23.75 22.90
Agriculture 17.51 16.99 15.93 15.47
Livestock 8.86 8.40 7.82 7.43
Forestry and logging 1.05 1.03 1.01 0.98
Fishing 0.23 0.24 0.24 0.24
Agriculture & allied 27.66 26.66 25.01 24.12
Mining and quarrying 0.02 0.03 0.02 0.02
Sub- total (Primary) 27.68 26.68 25.03 24.14
Manufacturing 19.58 19.08 20.11 20.31
Registered 10.49 10.49 11.55 12.05
Un-registered 9.09 8.59 8.56 8.25
Construction 7.75 7.89 7.73 7.65
Electricity, Gas & water
supply 3.28 3.17 3.00 2.92
Sub- total (Secondary) 30.60 30.13 30.84 30.88
Total industry 30.63 30.16 30.86 30.90
Transport, storage &
communication 6.59 6.70 6.77 6.90
Railways 1.16 1.09 1.03 1.04
Transport & other means 3.17 3.17 3.20 3.21
Storage 0.33 0.32 0.30 0.29
Communication 1.92 2.13 2.24 2.37
Trade, Hotel & restaurants 11.09 1.15 11.22 10.96
Banking & insurance 5.90 6.32 6.89 7.71
Real estate, ownership of
dwelling & business services 5.12 5.08 4.97 4.85
Public administration 4.33 4.73 4.88 4.94
Other services 8.69 8.88 9.39 9.62
Sub- total (Tertiary) 41.72 43.18 44.13 44.98
Gross state domestic
product 100.00 100.00 100.00 100.00
Source: Statistical Abstract, Punjab

9
Table 1.6: Gross state domestic product at factor cost by sectors in Punjab at current
prices
(Rs. Crore)
Sector 2007-08 2008-09 2009-10 2010-11
Agriculture and livestock 45625.84 52430.76 57429.55 63572.88
Agriculture 32041.47 37399.67 40658.06 44762.87
Livestock 13616.37 15031.09 16771.49 18810.01
Forestry and logging 1834.7 2731.02 4053.14 5547.12
Fishing 338.54 379.5 484.23 537.06
Agriculture & allied 47831.08 55541.28 61966.92 69657.06
Mining and quarrying 28.65 53.86 30.08 32.95
Sub- total (Primary) 47859.7 55595.1
(16.16)
61997.00
(11.52)
69690
(12.41)
Manufacturing 28336.15 29394.12 34383.97 37956.02
Registered 15559.96 16446.96 19702.12 22214.14
Un-registered 12776.19 13447.16 14681.85 15741.88
Construction 11615.61 13239.76 15208.15 16305.78
Electricity, Gas & water supply 3105.34 3562 4087.42 4313.05
Sub- total (Secondary) 43057.1 46695.9
(8.45)
53679.54
(14.96)
58574.9
(9.12)
Total industry 43085.8 46749.7 53709.62 58607.8
Transport, storage &
communication 8846.25 9848.58 11629.19 13061.25
Railways 1635.81 1638.94 1846.56 1894.89
Transport & other means 4852.83 5513.6 6586.01 7567.79
Storage 422.1 430.27 512.86 534.64
Communication 1635.07 2265.77 2683.76 3063.93
Trade, Hotel & restaurants 18238.24 21315.25 23014.73 24797.01
Banking & insurance 6542.85 7753.36 8950.32 11607.75
Real estate, ownership of dwelling
& business services 7968.16 9342.45 10907.23 12862.68
Public administration 6479.46 8146.47 9004.66 10538.33
Other services 13253.53 15342 19209.89 23842.94
Sub- total (Tertiary) 61328.5 71748.1
(16.99)
82716.02
(15.29)
96710
(16.92)
Gross state domestic product 152245.3 174039.1
(14.31)
198392.56
(13.99)
224974.8
(13.40)
Source: Statistical Abstract, Punjab
Figures in parenthesis are percent change over the previous year

10
Table 1.7: Percentage distribution of gross state domestic product at factor cost by sectors
in Punjab at current Prices
Sector 2007-08 2008-09 2009-10 2010-11
Agriculture and livestock 29.97 30.13 28.95 28.26
Agriculture 21.05 21.49 20.49 19.89
Livestock 8.94 8.64 8.45 8.36
Forestry and logging 1.21 1.57 2.04 2.47
Fishing 0.22 0.22 0.24 0.24
Agriculture & allied 31.42 31.91 31.23 30.96
Mining and quarrying 0.02 0.03 0.02 0.01
Sub- total (Primary) 31.44 31.94 31.25 30.98
Manufacturing 18.61 16.89 17.33 16.87
Registered 10.22 9.45 9.93 9.87
Un-registered 8.39 7.73 7.40 7.00
Construction 7.63 7.61 7.67 7.25
Electricity, Gas & water supply 2.04 2.05 2.06 1.92
Sub- total (Secondary) 28.28 26.83 27.06 26.04
Total industry 28.30 26.86 27.07 26.05
Transport, storage & communication 5.81 5.66 5.86 5.81
Railways 1.07 0.94 0.93 0.84
Transport & other means 3.19 3.17 3.32 3.36
Storage 0.28 0.25 0.26 0.24
Communication 1.07 1.30 1.35 1.36
Trade, Hotel & restaurants 11.98 12.25 11.60 11.02
Banking & insurance 4.30 4.45 4.51 5.16
Real estate, ownership of dwelling &
business services 5.23 5.37 5.50 5.72
Public administration 4.26 4.68 4.54 4.68
Other services 8.71 8.82 9.68 10.60
Sub- total (Tertiary) 40.28 41.23 41.69 42.99
Gross state domestic product 100.00 100.00 100.00 100.00
Source: Statistical Abstract, Punjab
11
Table 1.8: Per capita income in Punjab
(Rs/annum)
Year At current prices At constant prices (Base 2004-05)
2007-08 49380 39567
2008-09 55315 41003
2009-10 (P) 61894 42752
2010-11 (Q) 68998 44885
Source: Statistical Abstract, Punjab
P: Provisional, Q: Quick estimates
12
Chapter 2
Structure and Performance of Punjab Agriculture
In the wake of new technology, Punjab agriculture made rapid progress since mid sixties.
This progress has been made possible by speedy adoption of improved seeds, irrigation and
increased use of non-conventional inputs like fertilizers, machinery and pesticides supported by
the natural resource base of state. The progress was spectacular in early phase due to rising
agricultural productivity and expansion in gross cropped area. However, of late the progress in
agricultural production has slowed down and signs of stagnation are visible. The changes in
agrarian structure and agricultural growth performance of state are presented in this chapter.
2.1 Agrarian structure
Distribution of operational holdings, cropping patterns and proportionate share of each
sub-sector in primary sector’s contribution in Gross State Domestic Product (GSDP) determines
the agrarian structure. The agrarian structure of Punjab state revealed by above said factors is
discussed in this section as follows:
2.1.1 Operational holdings
The information on distribution of operational holdings in state of Punjab at two points of time
viz. 2005-06 and 2010-11 is depicted in Table 2.1. The figure shows that the total operational
holdings in state during the last five years period increased by 55 thousands from 10.03 lakh to
10.58 lakh. Point worth noting is the marginalization of holdings with proportionate increase in
marginal and small farmers. The proportion of marginal and small holdings which was 13.36 and
18.25 per cent in 2005-06 increased to 15.50 and 18.53 per cent, respectively. On the other hand,
the proportion of holdings in all other categories viz. semi-medium, medium and large had been
declined during this period. Over this period the average holding size in state also went down
from 3.95 ha to 3.78 ha.
13
Table 2.1: Distribution of operational holdings in Punjab
Size category
2005-06 2010-11(P)
Number
(000)
Area
(000,ha)
Average
size of
holding
Number
(000)
Area
(000,ha)
Average
size of
holding
Marginal
(Below 1 ha)
134
(13.36)
83
(2.09) 0.62
164
(15.50)
101
(2.53) 0.62
Small (1-2 ha) 183
(18.25)
258
(6.51) 1.41
196
(18.53)
270
(6.76) 1.38
Semi-medium
(2-4 ha)
319
(31.80)
855
(21.57) 2.68
327
(30.91)
862
(21.57) 2.64
Medium (4-10
ha)
296
(29.51)
1701
(42.91) 5.75
301
(28.45)
1728
(43.24) 5.74
Large (10 ha
and above)
71
(7.08)
1067
(26.92) 15.03
70
(6.62)
1035
(25.90) 14.79
All holdings 1003
(100.00)
3964
(100.00) 3.95
1058
(100.00)
3996
(100.00) 3.78
Source: Statistical Abstract, Punjab; Figures in parentheses indicate percentage of total
2.1.2 Cropping pattern
The green revolution brought significant changes in the cropping pattern of Punjab. The
cropping pattern in Punjab state at selected points over time is given in Table 2.2. The Table
show that in 1970-71, about 40.49 per cent of the gross cropped area (GCA) was under wheat
which increased to 44.31 per cent in 2007-08 and since then hovered around 44.50 per cent.
Rice, which occupied around 6.87 per cent of the gross cropped area in 1970-71, increased to
over 33.15 per cent in 2007-08, and then rose further to around 35.85 per cent in 2010-11. The
increase in wheat cultivation has been at the cost of gram, rapeseed and mustard, while that of
rice has been obtained by shifting the area from maize, groundnut, millets and cotton. The
proportionate area under cotton in 1970-71 was 7 per cent of gross cropped area and increased to
9.34 per cent in 1990-91. After mid 1990s the area under cotton has been adversely affected due
to inclement weather and pest attack, its share in GCA went down to 5.97 per cent in 2000-01.
With introduction of Bt varieties area under cotton started increasing and rose to 7.69 per cent in
2007-08. In 2010-11, it accounted for 6.13 per cent of the GCA in state. Areas under sugarcane
and potato have not remained stable. Respective share of pulses and oilseeds in GCA has
recorded a sharp decline from 7.29 and 5.20 per cent in 1970-71 to 0.25 and 0.71 per cent in
2010-11. It can be concluded that imbalance in favour of two main cereals viz. rice and wheat in
the cropping pattern has further sharpened despite all efforts on diversification of state
14
agriculture. This happened because of better relative profitability of these crops with minimum
production and marketing risk as compared to other crops.
Table 2.2: Shift in cropping pattern in Punjab (1970-71 to 2010-11)
(Percent)
Crop 1970-71 1980-81 1990-91 2000-01 2007-08 2008-09 2009-10 2010-11
Rice 6.87 17.49 26.86 32.89 33.15 34.57 35.58 35.85
Wheat 40.49 41.58 43.63 42.92 44.31 44.57 44.72 44.53
Cotton 6.99 9.60 9.34 5.97 7.69 6.66 6.49 6.13
Maize 9.77 5.65 2.51 2.08 1.96 1.91 1.76 1.69
Sugarcane 2.25 1.05 1.35 1.52 1.37 1.02 0.76 0.89
Potato 0.30 0.59 0.31 0.75 1.14 1.04 1.05 0.81
Pulses 7.29 5.04 1.91 0.68 0.34 0.28 0.24 0.25
Total
foodgrains 69.18 68.82 75.55 79.05 80.03 81.58 82.52 82.52
Total
oilseeds 5.20 3.52 1.32 1.01 0.76 0.76 0.79 0.71
Source: Statistical Abstract, Punjab
2.1.3 Relative share of different agricultural activities in primary sector
Sub-sectoral distribution GSDP from primary sector of state at current prices and
constant prices (2004-05) along with percent contribution of each component from year 2007-08
onwards is presented through Tables 2.3 and 2.4. Table 2.3 reveals that during 2007-08, at
constant prices, out of total share of primary sector in GSDP at Rs 34107 crore agriculture,
livestock, forestry & lodging and fishing accounted for about Rs 21575, Rs 10923, Rs 1298 and
Rs 282 crore, respectively. During 2010-11, out of total primary sector’s contribution of GSDP
at Rs 35739 crore, the respective share of above sub-sectors were at Rs 22906, Rs 11002, Rs
1452 and Rs 350 crore.
The collective per cent share of agriculture and livestock sub-sector in GSDP from
primary sector at constant prices (2004-05), which was 95.29 percent during 2007-08 declined
marginally to 94.87 percent during 2010-11. During this period while the contribution of
agriculture in primary sector increased marginally from 63.26 per cent to 64.09 percent, the
contribution of livestock decreased marginally from 32.03 per cent to 30.78 per cent. Over this

15
period, the respective contribution of forestry and fishing sub-sectors in overall primary sector of
state went up marginally from 3.81 to 4.06 per cent and 0.83 to 0.98 per cent. Thus, while the
from 2007-08 to 2010-11, the contribution of agriculture and allied activities in GSDP went
down by almost 3 per cent, within agriculture sector there were only marginal changes in
respective share of different components over this time period.
Table 2.3: Share of different primary sub-sectors in total primary sector (at constant
prices), Punjab
(Rs. Crore)
Sector 2007-08 2008-09 2009-10 2010-11
Agriculture and
livestock
32498.88
(95.29)
33113.53
(95.14)
32924.59
(94.90)
33907.71
(94.87)
Agriculture 21575.44
(63.26)
22155.18
(63.65)
22085.01
(63.66)
22905.55
(64.09)
Livestock 10923.44
(32.03)
10958.35
31.48
10839.58
31.24
11002.16
30.78
Forestry and
logging
1298.49
(3.81)
1349.44
(3.88)
1402.55
(4.04)
1451.5
(4.06)
Fishing 282.12
(0.83)
308.89
(0.89)
338.96
(0.98)
350.32
(0.98)
Agriculture &
allied
34079.49
(99.92)
34771.86
(99.90)
34666.1
(99.92)
35709.53
(99.92)
Mining and
quarrying
27.27
(0.08)
33.32
(0.10)
28.31
(0.08)
30.1
(0.08)
Total primary 34106.76
(100.00)
34805.18
(100.00)
34694.41
(100.00)
35739.63
(100.00)
Source: Statistical Abstract, Punjab
Figures in parentheses indicates per cent share in total primary sector
16
Table 2.4: Share of different primary sub-sectors in total primary sector (at current
prices), Punjab
(Rs. Crore)
Sector 2007-08 2008-09 2009-10 2010-11
Agriculture and
livestock
45625.84
(95.33)
52430.76
(94.31)
57429.55
(92.63)
63572.88
(91.22)
Agriculture 32041.47
(66.95)
37399.67
(67.27)
40658.06
(65.58)
44762.87
(64.23)
Livestock 13616.37
(28.45)
15031.09
(27.04)
16771.49
(27.05)
18810.01
(26.99)
Forestry and logging 1834.7
(3.83)
2731.02
(4.91)
4053.14
(6.54)
5547.12
(7.96)
Fishing 338.54
(0.71)
379.5
(0.68)
484.23
(0.78)
537.06
(0.77)
Agriculture & allied 47831.08
(99.94)
55541.28
(99.90)
61966.92
(99.95)
69657.06
(99.95)
Mining and
quarrying
28.65
(0.06)
53.86
(0.10)
30.08
(0.05)
32.95
(0.05)
Total primary 47859.73
(100.00)
55595.14
(100.00)
61997
(100.00)
69690.01
(100.00) Source: Statistical Abstract, Punjab
Figures in parentheses indicates per cent share in total primary sector
2.2 Growth performance of Punjab agriculture
The progress made by agriculture in Punjab state is unparalleled in the history of world
agriculture. The state which was deficit in food at the time of independence had made rapid
strides in agricultural development. Dominating agrarian structure, consolidation of holdings,
development of irrigation infrastructure and hard working peasantry led to the early progress.
With adoption of new agricultural technology in mid sixties backed with adequate agricultural
policies, the state turned surplus in food grains and became a model of India’s successful green
revolution strategy. Punjab state with only 1.5 per cent geographical area of the country besides
feeding its growing population has been contributing 35-40 per cent of rice and 45-70 per cent
wheat to the central pool since last two decades. Selected agricultural growth indicators of state
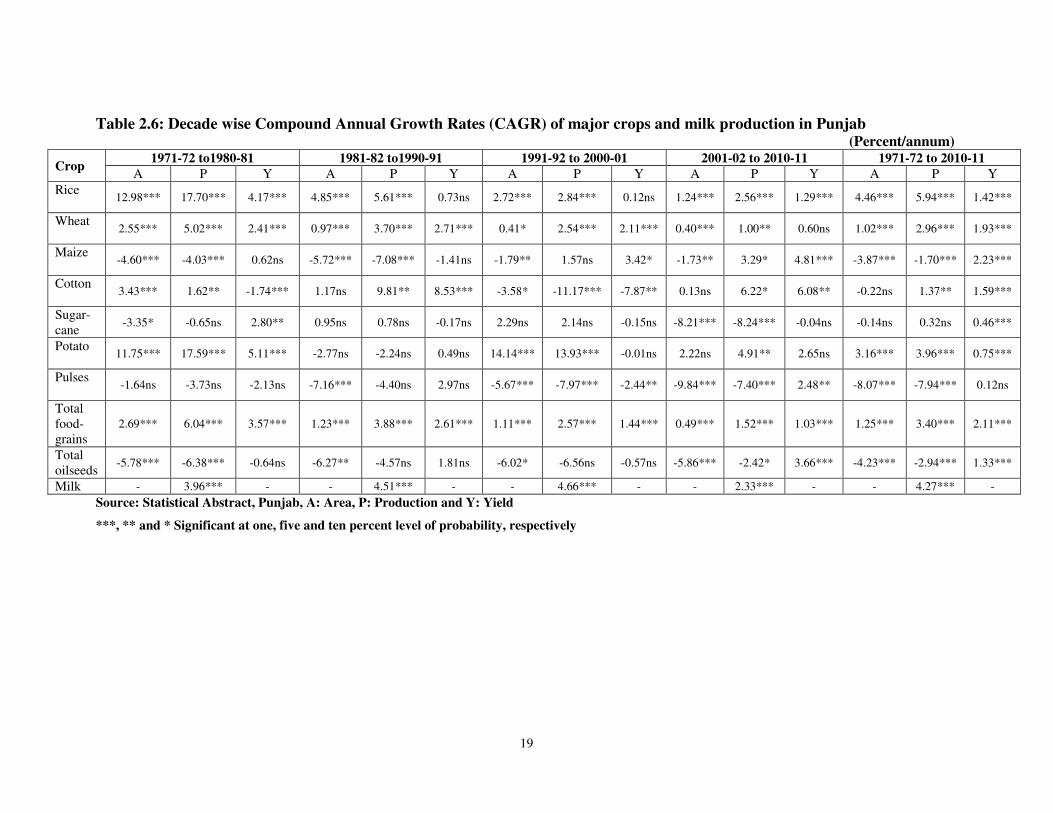
are presented in Table 2.5 and 2.6. Table 2.5 reveals that between 1971-72 and 2010-11 the
production of wheat in state has gone up by about three times from 5.62 million tonnes to 16.5
million tonnes. Similarly, production of rice another major crop of state, during this period

17
Table 2.5: Area, production and yield of different crops and milk production, 1971-72 to
2010-11, Punjab Area: 000, ha.
Production: 000, metric tonnes
Yield: Kg/ha
Crop
1971-72 1981-82 1991-92 2001-02 2009-10 2010-11
Rice
Area 450 1269 2069 2487 2802 2826
Production 920 3750 6739 8816 11236 10819
Yield 2044 2955 3257 3545 4010 3828
Wheat
Area 2336 2914 3237 3420 3522 3510
Production 5618 8544 12309 15499 15169 16472
Yield 2405 2932 3803 4532 4307 4693
Maize
Area 548 340 176 165 139 133
Production 857 625 345 449 475 491
Yield 1564 1838 1962 2722 3414 3693
Cotton
Area 475 686 719 606 511 483
Production 1030 1275 2505 1305 2006 1822
Yield 369 316 592 366 667 641
Sugar cane
Area 103 104 109 142 60 70
Production 403 601 693 925 370 417
Yield 3913 5779 6358 6514 6167 5952
Potato
Area 17 33 31 57 74 64
Production 222 635 617 1147 1918 1609
Yield 13430 19419 19981 20054 25919 25141
Pulses
Area 384 325 90 49 18 20
Production 302 161 75 30 16 17
Yield 786 495 833 612 842 850
Total food
Grains
Area 3915 4999 5638 6152 6498 6504
Production 7925 13156 19632 23878 26947 27846
Yield 2024 2632 3482 3881 4146 4281
Total
oilseed
Area 319 225 141 83 62 56
Production 272 173 127 84 84 73
Yield 853 769 901 1012 1355 1304
Milk
(Lakh
tonnes)
Production 21.04 34.94 53.82 79.30 93.89 94.12
Source: Statistical Abstract, Punjab
Note: Production of sugarcane is in terms of gur
Cotton production is cleaned cotton and is in terms of thousand bales of 170 kgs each, Yield (lint
kg/ha) Oilseeds does not include figure relating to non-edible oil seed e.g. Castor seeds

18
increased by about twelve times from 0.92 million tonnes to 10.8 million tonnes. Total food
grain production over this period increased by more than three and half times. Yields of wheat,
paddy and total food grains nearly doubled over this period of time. Besides, production of
cotton, potato and milk during this period has been gone up by 1.76, 7.24 and 4.47 times,
respectively. On the other hand, the production of pulses and oilseeds went down drastically over
this period and that of sugarcane with some variations remained almost same. The reason of
decline of production of these crops was the drastic decline of area under these crops due to
encroachment by paddy and wheat. However, except pulses yields of these crops increased
significantly during this time period (Table 2.6).
19
Table 2.6: Decade wise Compound Annual Growth Rates (CAGR) of major crops and milk production in Punjab
(Percent/annum)
Crop 1971-72 to1980-81 1981-82 to1990-91 1991-92 to 2000-01 2001-02 to 2010-11 1971-72 to 2010-11
A P Y A P Y A P Y A P Y A P Y
Rice
12.98*** 17.70*** 4.17*** 4.85*** 5.61*** 0.73ns 2.72*** 2.84*** 0.12ns 1.24*** 2.56*** 1.29*** 4.46*** 5.94*** 1.42***
Wheat
2.55*** 5.02*** 2.41*** 0.97*** 3.70*** 2.71*** 0.41* 2.54*** 2.11*** 0.40*** 1.00** 0.60ns 1.02*** 2.96*** 1.93***
Maize
-4.60*** -4.03*** 0.62ns -5.72*** -7.08*** -1.41ns -1.79** 1.57ns 3.42* -1.73** 3.29* 4.81*** -3.87*** -1.70*** 2.23***
Cotton
3.43*** 1.62** -1.74*** 1.17ns 9.81** 8.53*** -3.58* -11.17*** -7.87** 0.13ns 6.22* 6.08** -0.22ns 1.37** 1.59***
Sugar-
cane -3.35* -0.65ns 2.80** 0.95ns 0.78ns -0.17ns 2.29ns 2.14ns -0.15ns -8.21*** -8.24*** -0.04ns -0.14ns 0.32ns 0.46***
Potato
11.75*** 17.59*** 5.11*** -2.77ns -2.24ns 0.49ns 14.14*** 13.93*** -0.01ns 2.22ns 4.91** 2.65ns 3.16*** 3.96*** 0.75***
Pulses
-1.64ns -3.73ns -2.13ns -7.16*** -4.40ns 2.97ns -5.67*** -7.97*** -2.44** -9.84*** -7.40*** 2.48** -8.07*** -7.94*** 0.12ns
Total
food-
grains
2.69*** 6.04*** 3.57*** 1.23*** 3.88*** 2.61*** 1.11*** 2.57*** 1.44*** 0.49*** 1.52*** 1.03*** 1.25*** 3.40*** 2.11***
Total
oilseeds -5.78*** -6.38*** -0.64ns -6.27** -4.57ns 1.81ns -6.02* -6.56ns -0.57ns -5.86*** -2.42* 3.66*** -4.23*** -2.94*** 1.33***
Milk - 3.96*** - - 4.51*** - - 4.66*** - - 2.33*** - - 4.27*** -
Source: Statistical Abstract, Punjab, A: Area, P: Production and Y: Yield
***, ** and * Significant at one, five and ten percent level of probability, respectively
20
2.3 Drivers of agricultural growth
Punjab state had made remarkable progress in agriculture through taking a big leap
forward in terms of irrigation facilities, use of chemical fertilizer, pesticide, high yielding
varieties, mechanization etc. Backed with effective agricultural policies, the farmers of state
tended their crops according to the advice of experts through well established agricultural
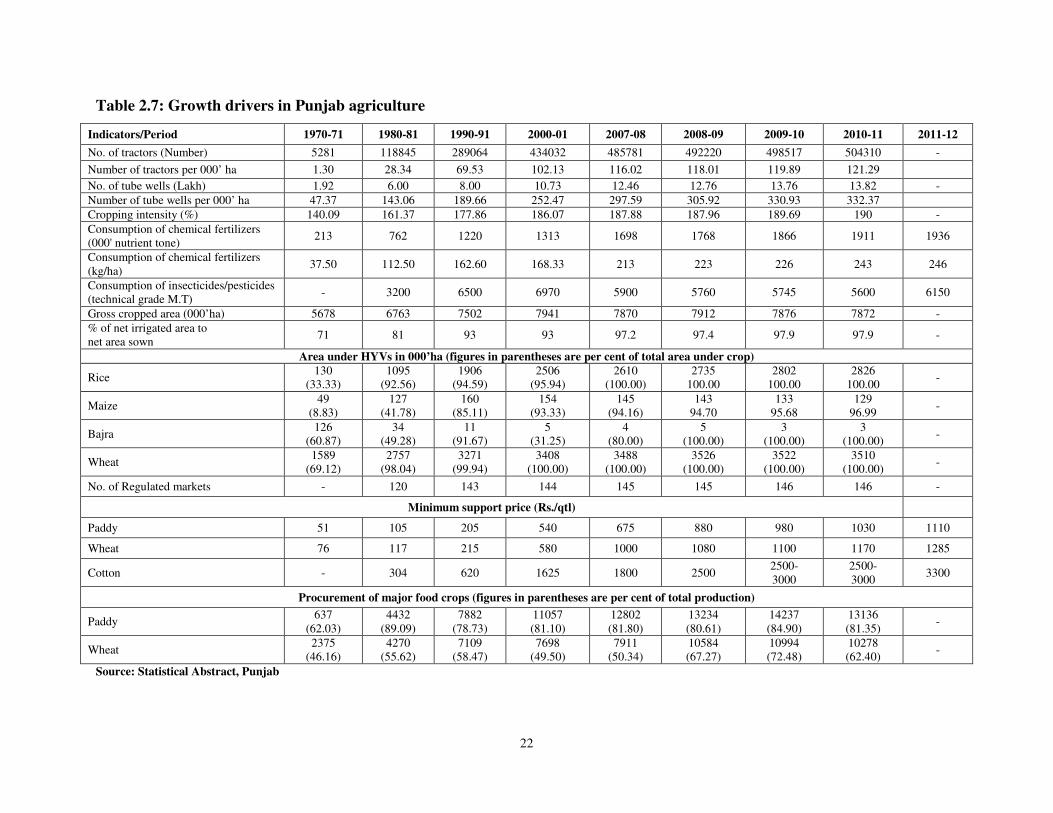
extension network and achieved the record productivity levels. Major drivers of state agricultural
growth are provided in Table 2.7. The irrigated area, which was merely 71 per cent to the net
area sown in 1970-71, has reached to a level of about 98 percent by the year 2010-11. The
number of tube wells has gone up from 1.92 lakh in 1970-71 to 13.82 lakh in 2010-11. The
proportion of area under HYVs to gross cropped area has increased tremendously. Hundred per
cent of the area of wheat and rice is under HYVs and that of maize is nearly 98 per cent. The
adoption of HYVs in Punjab raised the consumption of chemical fertilizers and plant protection
materials tremendously in the state. The per hectare consumption of chemical fertilizers (NPK)
which was merely 37.50 kg in 1970-71 has achieved the levels of 246 kg in 2011-12. Total
consumption of chemical fertilizers (nutrient) in state which was only 213 thousand tons in 1970-
71 had been gone up to 1936 thousand tons in 2011-12. Consumption of insecticides and
pesticides (Technical Grade) had been increased from 3200 MT in 1980-81 to 6150 MT in 2011-
12. The rapid adoption of the green revolution technology in Punjab has led to the sharp increase
in farm mechanization. The number of tractors in state was only 5281 in 1970-71, which
increased to more than 5 lakh in 2010-11. The Punjab state is one of the leading states for
number of tractors tillers in terms of density per 1000 hectare of net sown area. Development of
irrigation infrastructure along with large scale mechanization of state agriculture helped in
increasing the gross copped area from 5678 thousand ha in 1970-71 to 7872 thousand ha in
2010-11. Consequently, over this period the intensity of cropping jumped from 140 per cent to
190 per cent. Effective price policy through significant increase in Minimum Support Prices
(MSP), assured procurement and development of market infrastructure particularly for wheat and
paddy coupled with relatively better production technology available has driven the state
agriculture at remarkable rate and resulted into the emergence of paddy and wheat crops as the
most secure and profitable ones in the state.
Thus, rapid dissemination and adoption of new technologies and modern inputs viz.
HYVs, fertilizers and pesticides, irrigation, agricultural credit, development of necessary

21
infrastructure and setting up of institutional mechanisms for the supply of agricultural inputs and
procurement of agricultural produce created an enabling environment for enhancing agricultural
production in state.
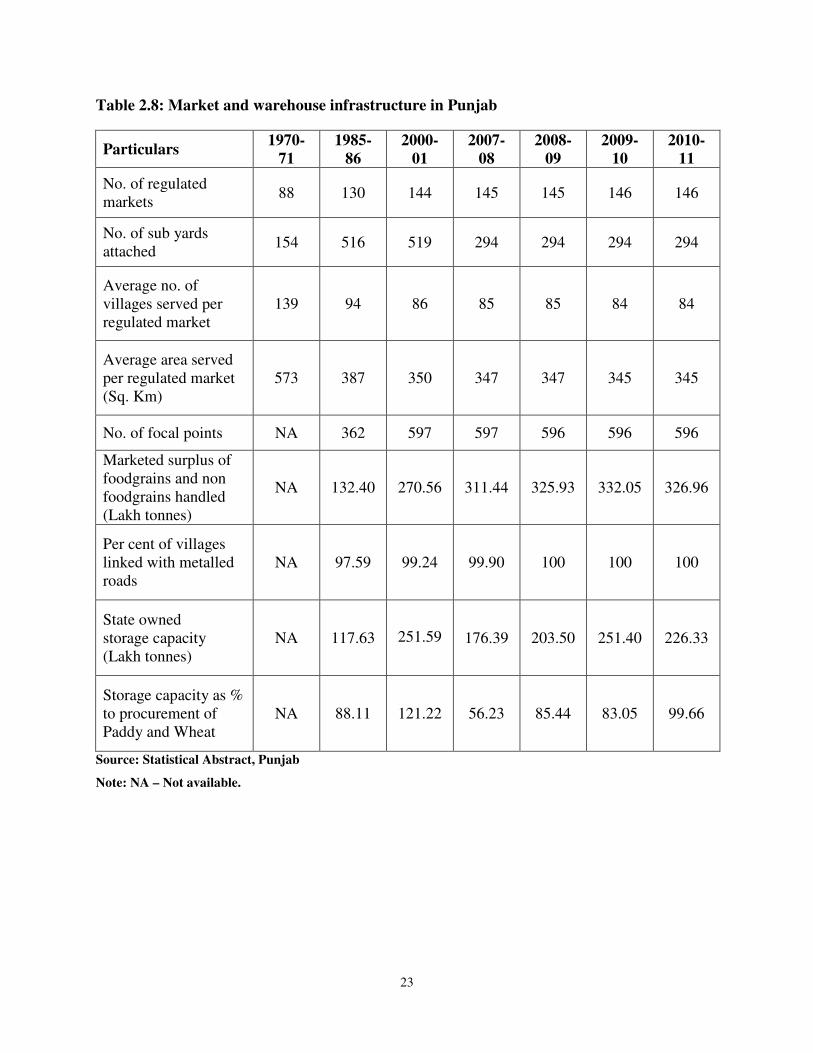
2.4 Marketing and warehouse facilities
Besides advancement in farm technology agricultural development also depends upon the
improvement in market infrastructure through ensuring better returns to farmers. Under
Agricultural Produce Markets Act, 1961 the market charges in Punjab have been regularized and
transactions are conducted by open auction in the regulated markets. Under this act at market
level there is a market committee represented by farmers, traders, labourers and officials of
agriculture and cooperative departments. The weights and measurement act provides for
standardization of weights and measures used in the markets.
Punjab Mandi Board the coordinating body for market committees played the lead role in
developing the village approach roads and market yards on priority to facilitate the efficient
marketing of farm produce and agricultural input delivery system in state. Indicators of
marketing infrastructure presented in Table 2.8 revealed that the number of regulated market in
Punjab has increased from 88 in 1970-71 to 146 in the year 2010-11. Likewise, the number of
sub-yards attached with these regulated market has increased from 154 to 294 during the same
period. Over this period, the geographical area and average number of villages served per
regulated market in Punjab decreased from 573 to 345 sq. km and from 139 to 84, respectively.
With large scale state procurement of food grains which takes time to be dispatched to
the deficit states; state owned storage capacity remained a major issue. In the recent years many
steps has been taken in this regard and total state owned storage capacity increased from 176.39
lakh tons in 2007-2008 to 226.33 lakh tones in 2010-11 (Table 2.9).
The Punjab Mandi Board provided all weather metalled roads to all the villages so that
the farmers could sell their output throughout the year. It is very encouraging that hundred per
cent villages of Punjab are linked with the all weather metalled roads which helped in efficient
marketing of farm output in state.
22
Table 2.7: Growth drivers in Punjab agriculture
Indicators/Period 1970-71 1980-81 1990-91 2000-01 2007-08 2008-09 2009-10 2010-11 2011-12
No. of tractors (Number) 5281 118845 289064 434032 485781 492220 498517 504310 -
Number of tractors per 000’ ha 1.30 28.34 69.53 102.13 116.02 118.01 119.89 121.29
No. of tube wells (Lakh) 1.92 6.00 8.00 10.73 12.46 12.76 13.76 13.82 -
Number of tube wells per 000’ ha 47.37 143.06 189.66 252.47 297.59 305.92 330.93 332.37
Cropping intensity (%) 140.09 161.37 177.86 186.07 187.88 187.96 189.69 190 -
Consumption of chemical fertilizers
(000' nutrient tone) 213 762 1220 1313 1698 1768 1866 1911 1936
Consumption of chemical fertilizers
(kg/ha) 37.50 112.50 162.60 168.33 213 223 226 243 246
Consumption of insecticides/pesticides
(technical grade M.T) - 3200 6500 6970 5900 5760 5745 5600 6150
Gross cropped area (000’ha) 5678 6763 7502 7941 7870 7912 7876 7872 -
% of net irrigated area to
net area sown 71 81 93 93 97.2 97.4 97.9 97.9 -
Area under HYVs in 000’ha (figures in parentheses are per cent of total area under crop)
Rice 130
(33.33)
1095
(92.56)
1906
(94.59)
2506
(95.94)
2610
(100.00)
2735
100.00
2802
100.00
2826
100.00 -
Maize 49
(8.83)
127
(41.78)
160
(85.11)
154
(93.33)
145
(94.16)
143
94.70
133
95.68
129
96.99 -
Bajra 126
(60.87)
34
(49.28)
11
(91.67)
5
(31.25)
4
(80.00)
5
(100.00)
3
(100.00)
3
(100.00) -
Wheat 1589
(69.12)
2757
(98.04)
3271
(99.94)
3408
(100.00)
3488
(100.00)
3526
(100.00)
3522
(100.00)
3510
(100.00) -
No. of Regulated markets - 120 143 144 145 145 146 146 -
Minimum support price (Rs./qtl)
Paddy 51 105 205 540 675 880 980 1030 1110
Wheat 76 117 215 580 1000 1080 1100 1170 1285
Cotton - 304 620 1625 1800 2500 2500-
3000
2500-
3000 3300
Procurement of major food crops (figures in parentheses are per cent of total production)
Paddy 637
(62.03)
4432
(89.09)
7882
(78.73)
11057
(81.10)
12802
(81.80)
13234
(80.61)
14237
(84.90)
13136
(81.35) -
Wheat 2375
(46.16)
4270
(55.62)
7109
(58.47)
7698
(49.50)
7911
(50.34)
10584
(67.27)
10994
(72.48)
10278
(62.40) -
Source: Statistical Abstract, Punjab
23
Table 2.8: Market and warehouse infrastructure in Punjab
Particulars 1970-
71
1985-
86
2000-
01
2007-
08
2008-
09
2009-
10
2010-
11
No. of regulated
markets 88 130 144 145 145 146 146
No. of sub yards
attached 154 516 519 294 294 294 294
Average no. of
villages served per
regulated market
139 94 86 85 85 84 84
Average area served
per regulated market
(Sq. Km)
573 387 350 347 347 345 345
No. of focal points NA 362 597 597 596 596 596
Marketed surplus of
foodgrains and non
foodgrains handled
(Lakh tonnes)
NA 132.40 270.56 311.44 325.93 332.05 326.96
Per cent of villages
linked with metalled
roads
NA 97.59 99.24 99.90 100 100 100
State owned
storage capacity
(Lakh tonnes)
NA 117.63 251.59 176.39 203.50 251.40 226.33
Storage capacity as %
to procurement of
Paddy and Wheat
NA 88.11 121.22 56.23 85.44 83.05 99.66
Source: Statistical Abstract, Punjab
Note: NA – Not available.

24
Table 2.9: Agency-wise state owned storage capacity in Punjab
(Lakh tonnes)
Agency/Year 2007-08 2008-09 2009-10 2010-11
FCI 63.57
(36.04)
63.18
(31.05)
76.30
(30.35)
83.22
(36.77)
Food supply department 6.90
(3.91)
11.79
(5.79)
18.70
(7.44)
18.38
(8.12)
Markfed 19.14
(10.85)
30.15
(14.82)
41.52
(16.52)
44.34
(19.59)
State warehousing corporation 51.45
(29.17)
52.74
(25.92)
19.54
(7.77)
16.57
(7.32)
Central warehousing
corporation
7.00
(3.97)
7.09
(3.48)
2.28
(0.91)
1.29
(0.57)
Punjab state civil supply
corporation
18.48
(10.48)
23.02
(11.31)
31.59
(12.57)
32.37
(14.30)
Marketing board 0.54
(0.31)
0.33
(0.16)
0.12
(0.05)
0.24
(0.11)
Punjab agro industries
corporation
9.31
( 5.28)
15.20
(7.47)
19.50
(7.76)
29.92
(13.22)
Total state owned storage
capacity
176.39
(100.00)
203.50
(100.00)
251.40
(100.00)
226.33
(100.00) Source: Statistical Abstract, Punjab
Figures in parentheses are percentages to total
Storage capacity includes hired and open storage capacity.
Information relates to 31st March
2.5 Emerging demand-supply mechanics
To meet the increasing demand of food grains, country is heavily dependent on the availability of
adequate local supplies particularly from the Punjab state. The government of India wanted to
maintain the tempo of production of food grains production, thus it provides production incentive
oriented procurement prices to the farmers. As a result of the assured market at remunerative
prices coupled with market infrastructure and available production technology, the Punjab
farmers has pushed up the paddy and wheat production remarkably. Thus, Punjab farmers has
responded to the country’s demand for wheat and paddy and now near about 80 per cent of the
gross cropped area in state is under these two crops. Table 2.10 indicates that market arrivals for
paddy and wheat in state during year 2010-11 were at 131.36 and 102.78 lakh tones,
respectively. Due to decentralization of procurement, although the share of state in central pool
of food grains has been declining since last few years; still Punjab is the largest contributor.

25
During 2010-11, state contributed about 25 per cent of rice and 45 per cent of wheat
towards central pool (Table 2.11). Looking at agency-wise procurement, it can be seen from
Table 2.12 that since 2007-08 the role of government agencies in procurement has been
increased in a major way which pushed the private traders out of paddy and wheat trade in state.
During 2010-11, 98.41 and 99.41 per cent of total market arrivals of paddy and wheat,
respectively were procured by the government agencies. As the government is the major player
in rice and wheat trade in state, private traders are reluctant to enter the market for same. For
cotton, the third most important crop of state, demand mainly comes from private mills and
traders. However in some years significant quantities were purchased by state owned Cotton
Corporation of India also (Table 2.13).
Under contract farming scheme, some companies had entered the Punjab market to buy
the farm output. For this, these companies make the contract with farmers to purchase the
specific quantity of specific quality produce at some pre decided price. Basmati, maize, hyola
and malting barley are the main crops grown under this scheme (Table 2.14).
Table 2.10: Market arrivals of major crops in Punjab
(000, tonnes)
Year Paddy Wheat
2007-08 12802 7911
2008-09 13234 10584
2009-10 14237 10994
2010-11 13136 10278
Source: Statistical Abstract, Punjab
Table 2.11: Contribution of Punjab towards the central pool of food grains
(Lakh tonnes)
Year Rice Wheat
2007-08 79.8 (27.8) 67.8 (60.9)
2008-09 85.5 (25.1) 99.4 (43.8)
2009-10 92.8 (28.9) 107.3 (42.2)
2010-11 86.3 (25.3) 102.1 (45.4) Source: Statistical Abstract, Punjab
Figures in parentheses are percentage contribution in central pool

26
Table 2.12: Procurement of paddy and wheat by different agencies in Punjab
(000, tonnes)
Agency 2007-08 2008-09 2009-10 2010-11
Paddy
State government 2674
(20.89)
3627
(27.41)
4155
(29.18)
4073
(31.01)
FCI 132
(1.03)
205
(1.55)
671
(4.71)
517
(3.94)
Markfed 2426
(18.95)
2775
(20.97)
2864
(20.12)
2707
(20.61)
PUNSUP 2611
(20.40)
2714
(20.51)
3171
(22.27)
3021
(23.00)
PSWC 1356
(10.59)
1502
(11.350
1687
(1.85)
1488
(11.33)
Traders 2470
(19.29)
1133
(8.56)
371
(2.61)
209
(1.59)
Punjab Agro Industries
Corporation (PAIC)
1133
(8.85)
127
(89.66)
1318
(9.26)
1121
(8.53)
Total 12802
(100.00)
13234
(100.00)
14237
(100.00)
13136
(100.00)
Wheat
State government 1279
(16.17)
1847
(17.45)
1682
(15.30)
1707
(16.61)
FCI 726
(9.18)
1074
(10.15)
1716
(15.61)
1654
(16.09)
Markfed 1886
(23.84)
2481
(23.44)
2557
(23.26)
2382
(23.18)
PUNSUP 1781
(22.51)
2369
(22.38)
2392
(21.76)
2301
(22.39)
PSWC 771
(9.75)
1279
(12.08)
1403
(12.76)
1122
(10.92)
Traders 704
(8.90)
334
(3.16)
22
(0.20)
61
(0.59)
Punjab Agro Industries
Corporation (PAIC)
764
(9.66)
1200
(11.34)
1222
(11.12)
1051
(10.23)
Total 7911
(100.00)
10584
(100.00)
10994
(100.00)
10278
(100.00) Source: Statistical Abstract, Punjab
Figures in parentheses are percentage to the total

27
Table 2.13: Purchase of cotton by cotton cooperation of India
(000’ bales of 170 kg each)
Year MSP Commercial Total
2007-08 0 78.98 78.98
2008-09 1043.81 1.60 1045.42
2009-10 86.60 9.73 96.33
2010-11
(As on 3/5/2011) 0 100.78 100.78
Source: Agricultural Statistics at a Glance
Table 2.14: Area under different crops under contract farming scheme in Punjab
(Hectares)
Year Hyola
Malting
Barley
Basmati
Pure Maize
Green
Pea
Potato
Seed Total
2007-08 13273 3020 33614 45405 - - 95312
2008-09 14216 2488 33606 32827 448 - 66887
2009-10 7254 3277 31966 33028 449 1625 77599
2010-11 - 3051 28322 - 254 1671 33899
Source: Statistical Abstract, Punjab

28
Chapter 3
Natural Resources Management
Due to ever increasing demands from increasing population of country, the main
emphasis in Punjab state remained on increasing the food production with little attention on
managing its natural resource base. There has been continuous increase in the net sown area in
the state and currently the proportion of net sown area to total geographical area is the highest in
the country. Punjab state has recorded remarkable growth in agriculture sector as more than 97
per cent of the cultivated area is under assured irrigation which is the major reason for higher
productivity and input use in agriculture. The intensive agriculture, particularly monoculture of
wheat and paddy is now imposing intense pressure on the available natural resources which
requires new vision and holistic approach for their management. Now there is need to promote
the optimum management of soil and water resources so as to conserve these and improve the
productivity. The government policies, availability of resources, appropriate agro-technologies,
social and economic factors influence the way in which vital resources are used and managed.
Present scenario on use of land and management of soil and water is discussed in this chapter.
3.1 Land use
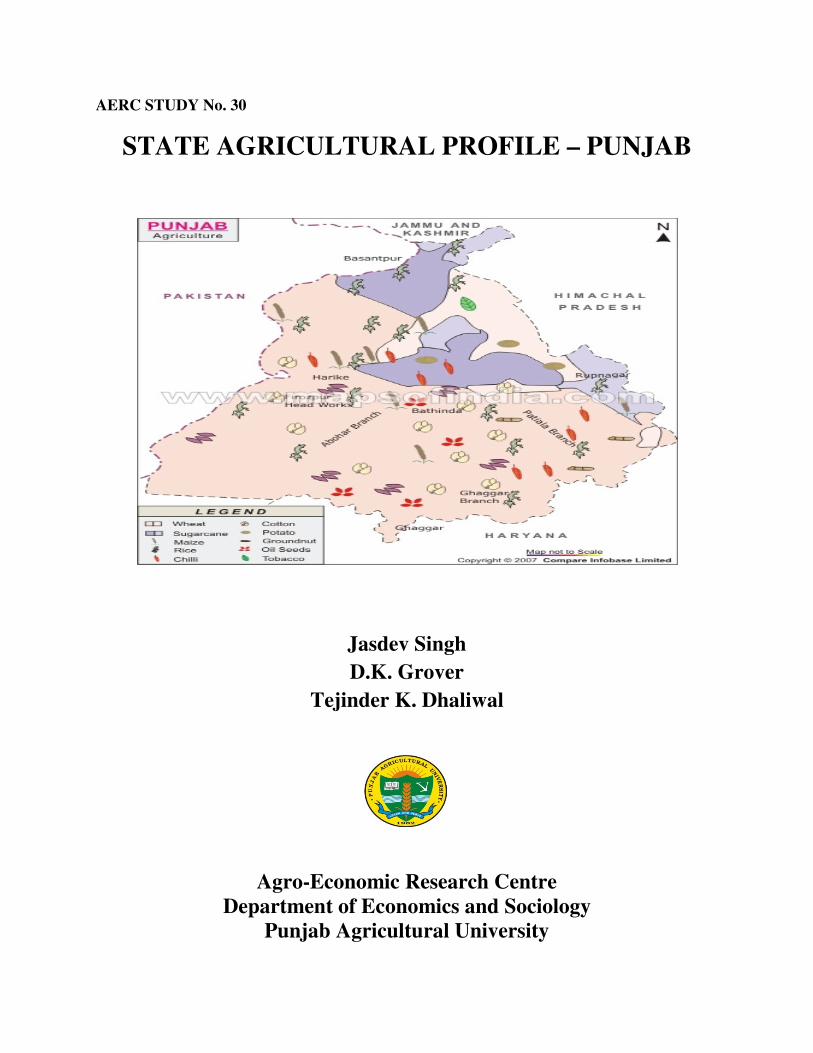
The Punjab state lies between the 29o33'-32°3'N latitude and 73°53'- 76°55'E longitude
and is bounded on the, west by Pakistan, on the north by Jammu and Kashmir, on the north -east
by Himachal Pradesh and on the south by Haryana and Rajasthan. The land use classification of
state for years 2007-08 to 2010-11 is presented in Table 3.1. The total geographical area of the
state is 50.36 lakh ha. During 2010-11, the net sown area was at 41.58 lakh ha which indicated
that about 83 per cent of the area in state is already under cultivation. This is the highest in
country and the state is virtually comparable to a farmstead where most of the area is under the
cultivation leaving little land for other activities. Further, there is virtually no land left for
bringing under cultivation and due to recent spurt in urbanization the net sown area declined
from 41.87 lakh ha in 2007-08 to 41.58 lakh ha in 2010-11. However, during this period the
increase in cropping intensity from 187.9 per cent to 190 per cent led to increase in gross
cropped area in state from 78.70 lakh ha to 78.82 lakh ha. The forest wealth of state is very poor
with only 5.84 per cent of the total area under the forest cover. The area under permanent barren
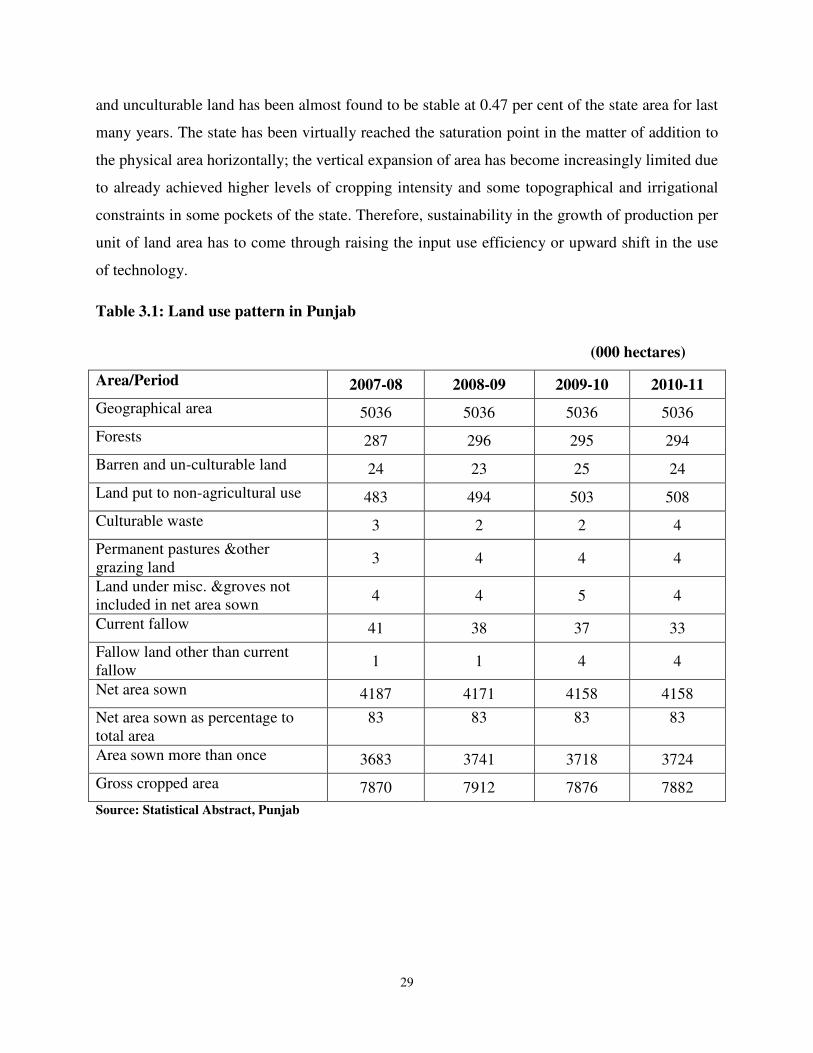
29
and unculturable land has been almost found to be stable at 0.47 per cent of the state area for last
many years. The state has been virtually reached the saturation point in the matter of addition to
the physical area horizontally; the vertical expansion of area has become increasingly limited due
to already achieved higher levels of cropping intensity and some topographical and irrigational
constraints in some pockets of the state. Therefore, sustainability in the growth of production per
unit of land area has to come through raising the input use efficiency or upward shift in the use
of technology.
Table 3.1: Land use pattern in Punjab
(000 hectares)
Area/Period 2007-08 2008-09 2009-10 2010-11
Geographical area 5036 5036 5036 5036
Forests 287 296 295 294
Barren and un-culturable land 24 23 25 24
Land put to non-agricultural use 483 494 503 508
Culturable waste 3 2 2 4
Permanent pastures &other
grazing land 3 4 4 4
Land under misc. &groves not
included in net area sown 4 4 5 4
Current fallow 41 38 37 33
Fallow land other than current
fallow 1 1 4 4
Net area sown 4187 4171 4158 4158
Net area sown as percentage to
total area
83
83
83
83
Area sown more than once 3683 3741 3718 3724
Gross cropped area 7870 7912 7876 7882
Source: Statistical Abstract, Punjab
30
3.2 Soil management
Most of the soils of Punjab are alluvial and deep, varying from sandy to silty clay. The
soils of Punjab, having developed on alluvium are at initial to medium stage of profile
development. They are generally very deep porous sandy loam in texture, and show weak to
moderately developed soil structures with good soil-air-water relationship. The soils have great
potential for agricultural production in view of their high reserves of weather able minerals. With
present state of intensive agriculture surface crusts, sub-soil compaction, soil erosion,
development of hard pan, development of fine textured sodic soils, water logging, free
percolation in coarse soils and poor permeability in fine textured soils, salinity/sodicity and
pollution from agro-chemicals, sewerage and industrial effluent, depletion of organic matter,
multi-nutrient deficiencies, nutrient imbalance, decline in quality and quantity of soil biomass,
low-biological oxidation and slow rate of decomposition of crop residues are the major problems
being faced by the Punjab soils.
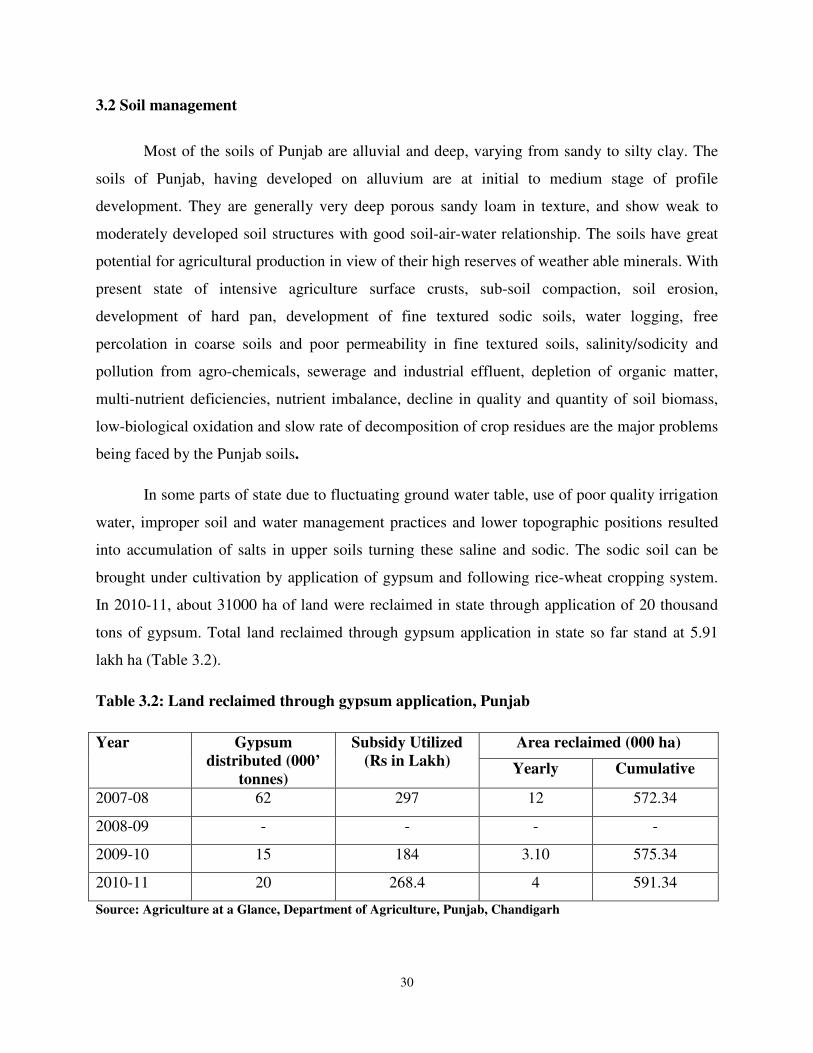
In some parts of state due to fluctuating ground water table, use of poor quality irrigation
water, improper soil and water management practices and lower topographic positions resulted
into accumulation of salts in upper soils turning these saline and sodic. The sodic soil can be
brought under cultivation by application of gypsum and following rice-wheat cropping system.
In 2010-11, about 31000 ha of land were reclaimed in state through application of 20 thousand
tons of gypsum. Total land reclaimed through gypsum application in state so far stand at 5.91
lakh ha (Table 3.2).
Table 3.2: Land reclaimed through gypsum application, Punjab
Year Gypsum
distributed (000’
tonnes)
Subsidy Utilized
(Rs in Lakh)
Area reclaimed (000 ha)
Yearly Cumulative
2007-08 62 297 12 572.34
2008-09 - - - -
2009-10 15 184 3.10 575.34
2010-11 20 268.4 4 591.34
Source: Agriculture at a Glance, Department of Agriculture, Punjab, Chandigarh
31
Water erosion is the major problem in Kandi area located in the shivalik foot-hills. The
south-western parts of the state face the problem of wind erosion in months of May and June.
During the last decades considerable efforts have been made to reduce the wind eroded areas by
following land-development (leveling and or clearing of sand dunes) and crop management
practices and by bringing more areas under irrigated agriculture. The problem of water logging is
particularly acute in south-western districts (Ferozepur, Fazilika, Muktsar and Faridkot) of the
state occupying lower topographic positions. Introduction of salt resistant crops and good
drainage system may overcome this problem to some extent.
As per expert views, the high nutritional requirement of paddy and wheat has exhausted
the Punjab soils of vital nutrients. Thus, higher and higher doses of major nutrients, especially
nitrogen, have to be applied for sustaining adequate production levels. Low fertility status
obviously implies that the amount of plant nutrient that the soil itself is capable of making
available to the growing crop is far less than that needed for getting high yields. The most of
state soils test low to medium in available nitrogen and available phosphorus. The soils in
general are medium to high in available potassium. Micronutrient deficiencies in large areas
have also been noticed adversely affecting crop yield. The soils contain sufficient calcium and
magnesium. However, their deficiencies can be observed in local pockets supporting sodic soils.
Recently sulphur deficiency has been recorded in some soils, especially in coarse-textured soils,
receiving high-analysis fertilizers. In recent years, widespread deficiency of one or more micro-
nutrients has been observed, resulting in significant decrease in crop yield especially of high-
yielding varieties. Deficiency of zinc is of widespread occurrence, particularly in the central and
south-western districts. Deficiencies of iron and manganese have been observed in coarse-
textured soils recently brought under rice-wheat cropping system.
Thus, it is more important to preserve existing cultivated areas in state from degradation
due to water logging, soil salinity and sodicity, besides soil erosion due to intensive cropping and
its attended manifestations. Repeated paddy cultivation in the long run will make the soils fine
textured, impervious and unfit for cultivation. Corrective measures through intensive R & D
have to be undertaken to conserve soil resources. Speedy soil-testing facilities, followed by
appropriate advice about fertilizers use, can effectively help save the soils from exhaustion.

32
3.3 Cropping Intensity
Cropping intensity is a measure of the extent of multiple cropping. In Punjab state there
has been progressive increase in intensity of cropping over the years and now intensive copping
i.e. getting two crops from the same field is a common feature. The statistics on cropping
intensity of state for recent years is presented in Table 3.3. The data shows that cropping
intensity in state increased marginally from 188 per cent in 2007-08 to 190 per cent in 2010-11.
This, already higher level of cropping intensity indicates that in Punjab state the vertical
expansion of area in future has become increasingly limited.
Table 3.3: Cropping Intensity in Punjab State
Year Percent
2007-08 187.96
2008-09 189.69
2009-10 189.00
2010-11 190.00
Source: Statistical Abstract, Punjab
3.4 Land ceiling limit
In state the ceiling on land is as per the Punjab Land Reforms Act, 1972. Subject to the
provisions of section 5 of this act, no person shall own or hold as landowner or mortgagee with
the possession or tenant or partly in one capacity and partly in another in excess of the
permissible area. Limits of the permissible area are described in Table 3.4.
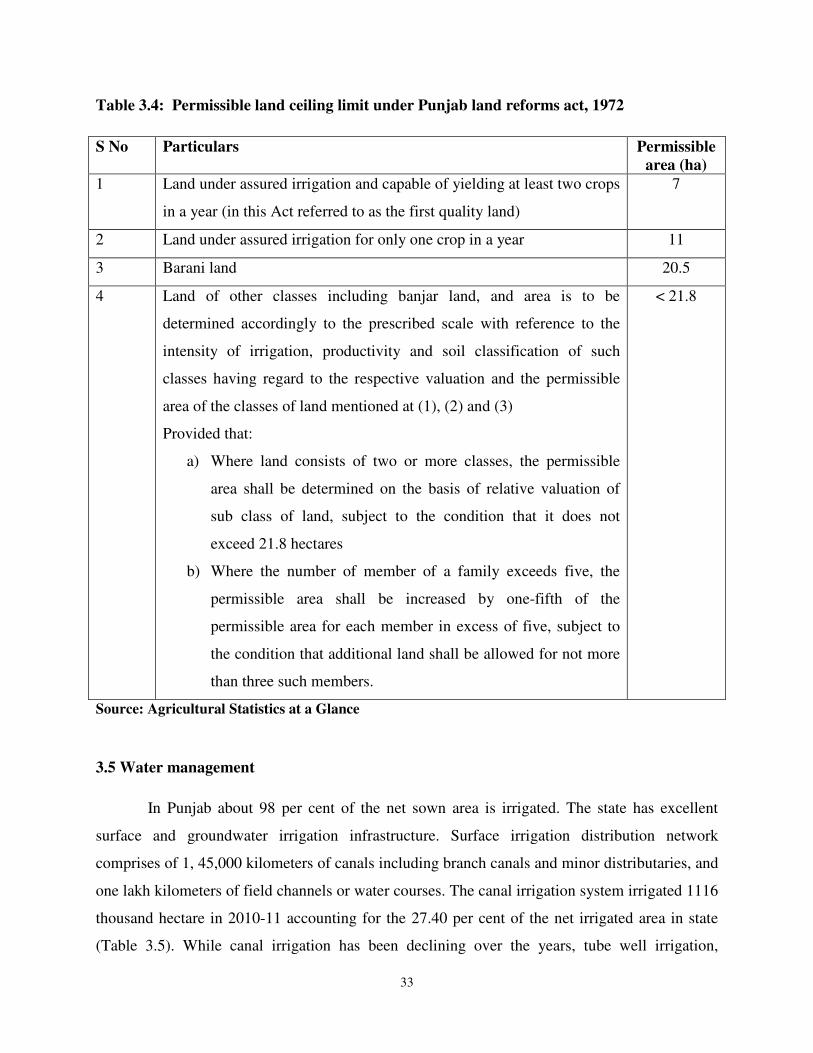
33
Table 3.4: Permissible land ceiling limit under Punjab land reforms act, 1972
S No Particulars Permissible
area (ha)
1 Land under assured irrigation and capable of yielding at least two crops
in a year (in this Act referred to as the first quality land)
7
2 Land under assured irrigation for only one crop in a year 11
3 Barani land 20.5
4 Land of other classes including banjar land, and area is to be
determined accordingly to the prescribed scale with reference to the
intensity of irrigation, productivity and soil classification of such
classes having regard to the respective valuation and the permissible
area of the classes of land mentioned at (1), (2) and (3)
Provided that:
a) Where land consists of two or more classes, the permissible
area shall be determined on the basis of relative valuation of
sub class of land, subject to the condition that it does not
exceed 21.8 hectares
b) Where the number of member of a family exceeds five, the
permissible area shall be increased by one-fifth of the
permissible area for each member in excess of five, subject to
the condition that additional land shall be allowed for not more
than three such members.
< 21.8
Source: Agricultural Statistics at a Glance
3.5 Water management
In Punjab about 98 per cent of the net sown area is irrigated. The state has excellent
surface and groundwater irrigation infrastructure. Surface irrigation distribution network
comprises of 1, 45,000 kilometers of canals including branch canals and minor distributaries, and
one lakh kilometers of field channels or water courses. The canal irrigation system irrigated 1116
thousand hectare in 2010-11 accounting for the 27.40 per cent of the net irrigated area in state
(Table 3.5). While canal irrigation has been declining over the years, tube well irrigation,

34
particularly in the central and northern region of Punjab has been on the increase and during
2010-11, there were about 13.82 tube wells providing irrigation to about 2954 thousand hectares
of land accounting for nearly 73 per cent of the net irrigated area in state.
Table 3.5: Source-wise net area irrigated in Punjab (000, ha)
Year Govt.
canals
Private
canals
Tube well
& wells
Other
sources Total
% of net irrigated area
to net area sown
2007-08 1142 - 2922 4 4068 97.2
2008-09 1110 3 2950 1 4064 97.4
2009-10 1111 3 2955 2 4071 97.9
2010-11 1113 3 2954 - 4070 97.9
Source: Statistical Abstract, Punjab
Table 3.6: Pre and post monsoon ground water level in Punjab
Period Season Level Meters
June 2007 Pre monsoon Minimum 5.22
Max 25.06
October 2007 Post monsoon Minimum 5.13
Max 25.24
June 2008 Pre monsoon Minimum 5.92
Max 23.53
October 2008 Post monsoon Minimum 6.93
Max 22.92
June 2009 Pre monsoon Minimum 5.52
Max 22.59
October 2009 Post monsoon Minimum 5.41
Max 22.28
June 2010 Pre monsoon Minimum 6.23
Max 23.57
October 2010 Post monsoon Minimum 5.53
Max 23.01
June 2011 Pre monsoon Minimum 5.78
Max 21.93
October 2011 Post monsoon Minimum 5.24
Max 22.06 Source: Statistical Abstract, Punjab
35
According to estimates the total annual demand for irrigation water in the state is 4.76
million hectare meters (mhm) against a total annual supply of 3.48 mhm from both canal and
ground-water resources. This excessive demand leaves an annual net deficit of 1.28 mhm (Jain,
A K) which is met from over-exploitation of groundwater reserves through tube wells. In many
areas, excessive exploitation has pushed the groundwater table below the critical depth of 10
meters. Deep tube wells are being used even in the southern region, where the underground
water is brackish. Existing cropping pattern, cheap credit and free supply of electricity are the
main factors behind steep increase in the use of tube wells for irrigation in the state. The data on
per monsoon and post monsoon water table in state for recent years is presented in Table 3.6.
Extensive use of groundwater through tube wells have led to lowering of the ground-
water table in most parts of state. The water table in the central districts of Punjab has been going
down whereas in south western parts it is going up resulting into the problem of water logging.
Most of the centrifugal pumps have been replaced by the submersible pumps leading to
additional expenditure along with tremendous increase in energy consumption.
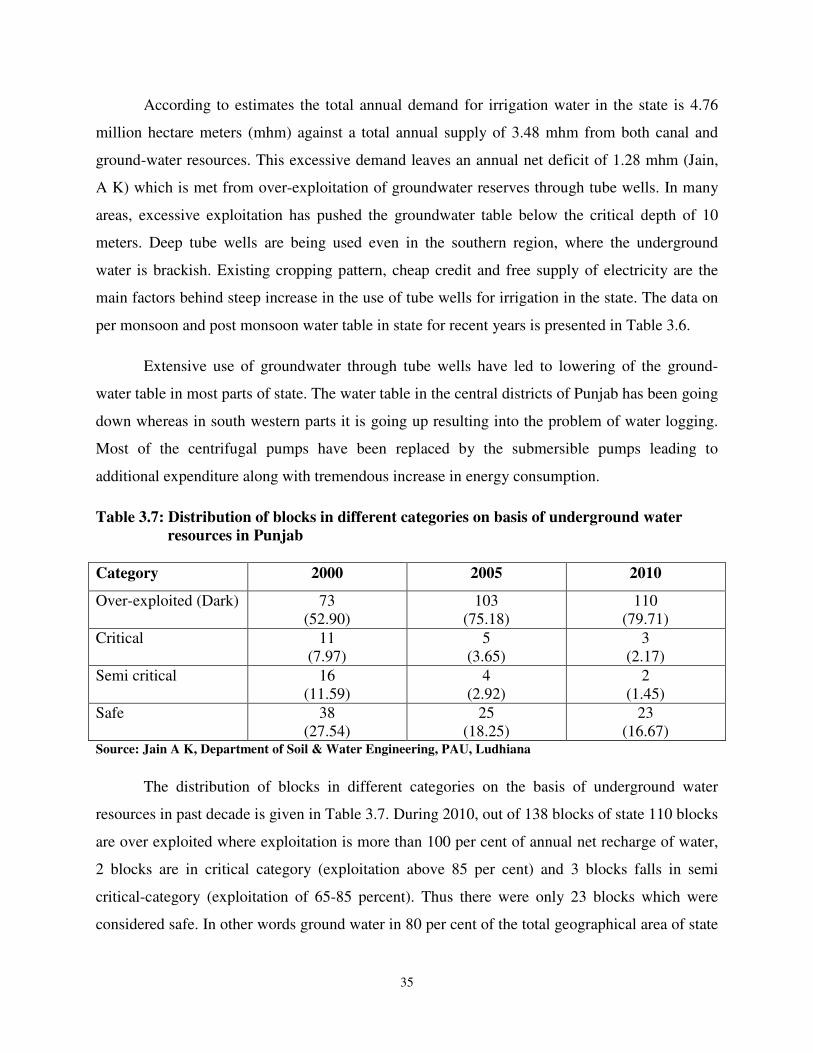
Table 3.7: Distribution of blocks in different categories on basis of underground water
resources in Punjab
Category 2000 2005 2010
Over-exploited (Dark) 73
(52.90)
103
(75.18)
110
(79.71)
Critical 11
(7.97)
5
(3.65)
3
(2.17)
Semi critical 16
(11.59)
4
(2.92)
2
(1.45)
Safe 38
(27.54)
25
(18.25)
23
(16.67) Source: Jain A K, Department of Soil & Water Engineering, PAU, Ludhiana
The distribution of blocks in different categories on the basis of underground water
resources in past decade is given in Table 3.7. During 2010, out of 138 blocks of state 110 blocks
are over exploited where exploitation is more than 100 per cent of annual net recharge of water,
2 blocks are in critical category (exploitation above 85 per cent) and 3 blocks falls in semi
critical-category (exploitation of 65-85 percent). Thus there were only 23 blocks which were
considered safe. In other words ground water in 80 per cent of the total geographical area of state

36
has been over exploited, with another 4 per cent in critical or semi-critical category. Part of about
16 per cent geographical area which is considered to be safe for ground water development falls
in kandi area where as rest of it falls in south-western parts of state where ground water is
brackish and unfit for irrigation use.
Various steps have taken to work out methods for optimum water-use efficiency for
different crops in different regions. Implementation of Punjab preservation of sub-soil water act,
2009 is a major breakthrough in managing dwindling ground water resources of state. Promotion
of adoption of tensiometers, laser leveling of fields, ridge planting and emphasis on growing
water saving crops are some of the other steps taken in this regard. Time has come to use
rainwater harvesting technologies for conserving water and for recharging the underground
water, both in rural and urban areas.
3.6 Weather and climate
The land use pattern and crop production depends on the climate to a much greater extent
than any other factor of production. The effects of weather on agriculture are far reaching,
affecting the crop plants right from germination till maturity. The effects of weather continue to
affect the agricultural output in the markets and during storage. Important factors that make
environment are the temperature, moisture/rainfall, solar radiation and wind. Plants do best under
certain inter-related conditions of these factors and there are also extremes beyond which
significant losses to vegetation occurs. The climate of Punjab is mainly influenced be the
Himalayas in the North and the 'thar' desert of Rajasthan in the south and south west.
Table: 3.8 Annual average rainfalls in Punjab
Year Rainfall (Millimeters)
2007 438
2008 529.2
2009 384.9
2010 472.1
Source: Statistical Abstract, Punjab
37
The mean annual rainfall varies from less than 300 mm to about 1400 mm. A major portion of
the rainfall (70%) is received during monsoon season (July to September). The information on
annual average rainfall from year 2007-08 onwards is presented in Table 3.8.
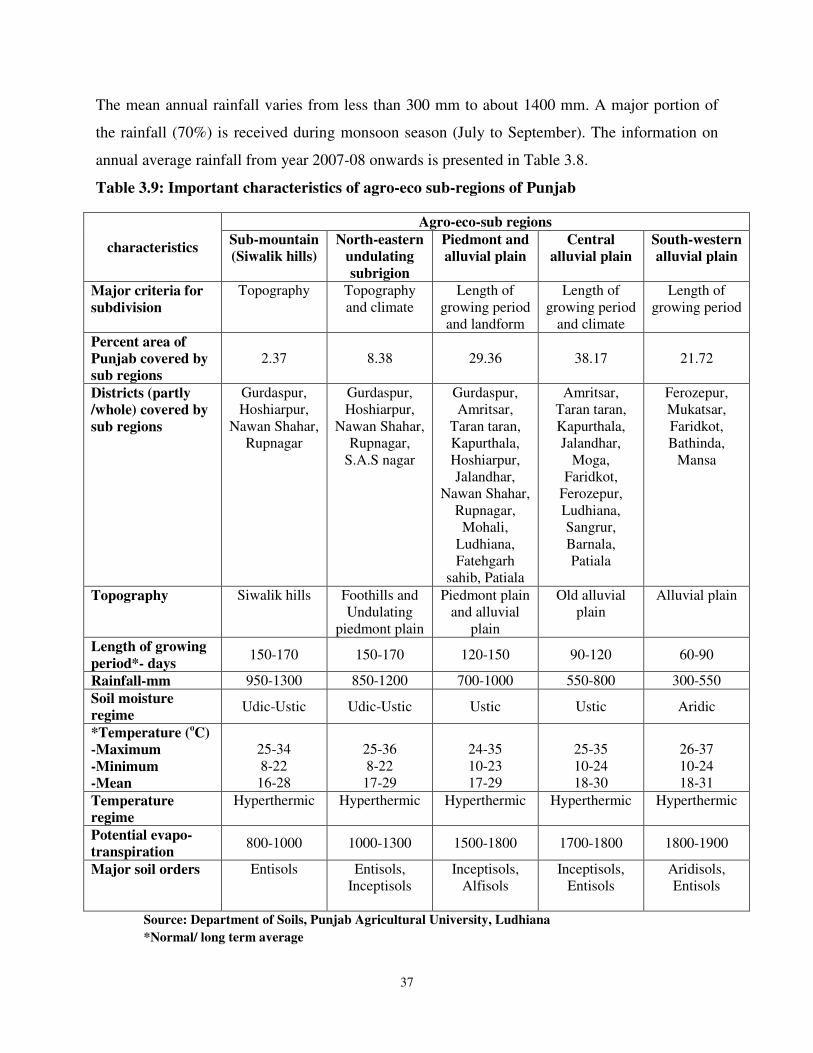
Table 3.9: Important characteristics of agro-eco sub-regions of Punjab
characteristics
Agro-eco-sub regions
Sub-mountain
(Siwalik hills)
North-eastern
undulating
subrigion
Piedmont and
alluvial plain
Central
alluvial plain
South-western
alluvial plain
Major criteria for
subdivision
Topography Topography
and climate
Length of
growing period
and landform
Length of
growing period
and climate
Length of
growing period
Percent area of
Punjab covered by
sub regions
2.37 8.38 29.36 38.17 21.72
Districts (partly
/whole) covered by
sub regions
Gurdaspur,
Hoshiarpur,
Nawan Shahar,
Rupnagar
Gurdaspur,
Hoshiarpur,
Nawan Shahar,
Rupnagar,
S.A.S nagar
Gurdaspur,
Amritsar,
Taran taran,
Kapurthala,
Hoshiarpur,
Jalandhar,
Nawan Shahar,
Rupnagar,
Mohali,
Ludhiana,
Fatehgarh
sahib, Patiala
Amritsar,
Taran taran,
Kapurthala,
Jalandhar,
Moga,
Faridkot,
Ferozepur,
Ludhiana,
Sangrur,
Barnala,
Patiala
Ferozepur,
Mukatsar,
Faridkot,
Bathinda,
Mansa
Topography Siwalik hills Foothills and
Undulating
piedmont plain
Piedmont plain
and alluvial
plain
Old alluvial
plain
Alluvial plain
Length of growing
period*- days 150-170 150-170 120-150 90-120 60-90
Rainfall-mm 950-1300 850-1200 700-1000 550-800 300-550
Soil moisture
regime Udic-Ustic Udic-Ustic Ustic Ustic Aridic
*Temperature (oC)
-Maximum
-Minimum
-Mean
25-34
8-22
16-28
25-36
8-22
17-29
24-35
10-23
17-29
25-35
10-24
18-30
26-37
10-24
18-31
Temperature
regime
Hyperthermic Hyperthermic Hyperthermic Hyperthermic Hyperthermic
Potential evapo-
transpiration 800-1000 1000-1300 1500-1800 1700-1800 1800-1900
Major soil orders Entisols Entisols,
Inceptisols
Inceptisols,
Alfisols
Inceptisols,
Entisols
Aridisols,
Entisols
Source: Department of Soils, Punjab Agricultural University, Ludhiana
*Normal/ long term average

38
In Punjab state the Mean Annual Temperature (MAT) varies from 23.3°C (Pathankot) to
25.8° C (Abohar). The mean monthly minimum temperature (January) is as low as 4.7°C and the
mean monthly maximum temperature in June is as high as 42° C. Information on agro-eco sub
regions of state along with important environmental/climatic characteristics is provided in Table
3.9.

39
Chapter 4
Farm Input Management
The remarkable progress of Punjab agriculture is credited to the use of inputs like
fertilizers, improved seeds, irrigation, plant protection chemicals; machinery, credit and
technology back up. In state the use of fertilizer (nutrients) increased from 37 kg/ha in 1970-71
to 243 kg/ha in 2010-11. During this period net irrigated area as proportion to net cultivated area
increased from 71 per cent to about 98 per cent. Almost hundred per cent area under major crops
is covered by the high yielding verities. The farm credit market in Punjab is very extensive and
about 90 per cent farmers use credit to finance the farm production operations (Shergill, 2011).
Punjab is the leading state in ensuring the timely availability and efficient delivery system of
these vital inputs required for agriculture. This chapter deals with the recent trends in
use/requirement of important farm inputs and their prices in Punjab.
4.1 Seeds
Good quality seed of high yielding varieties has played the most important role in increasing
agricultural production in Punjab. Foundation seed of HYVs is supplied by the Agricultural
Universities for its further multiplication. Various Seed Corporations, Punjab Agricultural
University and State Department of Agriculture distribute the certified seeds to farmers. Without
realizing the yield losses, many farmers are tempted to keep their own seeds particularly of
cereals in which the seed rate is quite high and the crops are self pollinating. Government had
made efforts to increase the agricultural production through total replacement of seed of the self
pollinated crops every three years and hybrids every year. Extension campaigns, subsidies and
ensuring timely supply of seeds are some of steps taken in this regard. Due to sincere efforts of
concerned state departments and PAU, the state farmers did not faced the shortage of seed of
principal crops of state in recent years. Seed requirement of important crops in Punjab and seed
prices for recent years is provided in Table 4.1 and Table 4.2, respectively.

40
Table 4.1: Use of seed for major crops in Punjab
(Tonnes)
Crop
Seed require-
ment/ hectare
(Kg)
Total seed requirement*
2007-08 2008-09 2009-10 2010-11
Wheat 100 348700 352600 352200 351000
Gram 40 80 120 120 120
Sarson 3.8 112.7 108.9 116.4 120.2
Summer -
mash 37.5 150.0 112.5 112.5 112.5
Sunflower 5 100 100 110 75
Paddy 20 52180 54700 56040 56520
Maize 20 3080 3020 2780 2660
Sugarcane 87.5 9450 7087.5 5250 6125
Cotton 1.5 906.3 789.4 765.5 723.5
* Calculated by multiplying per hectare requirement of seed with area under respective crops
Table 4.2: Seed prices of important crops in Punjab
Crop Price of seed (Rs/kg)
2008 2009 2010 2011 2012
Wheat 16.25 17.50 17.50 20 -
Gram 50 50 50 50 -
Sarson 46.67 46.67 66.67 66.67 -
Summer mash 60 60 60 100 -
Sunflower 200 200 200 200 -
Paddy 18.75 18.75 18.75 25 25
Maize 50 50 70 70 150
Sugarcane 1.75 1.75 1.80 2.50 2.75
Cotton 2000 2000 2000 2000 2000 Source: Department of Economics & Sociology, Punjab Agricultural University, Ludhiana
4.2 Fertilizers and manures
Intensive agriculture, with high use of synthetic fertilizers was introduced in India in the
1960s as part of the Green Revolution. The quick adoption of synthetic fertilizers and fertilizer
responsive varieties along with irrigation did help in a remarkable increase in agricultural
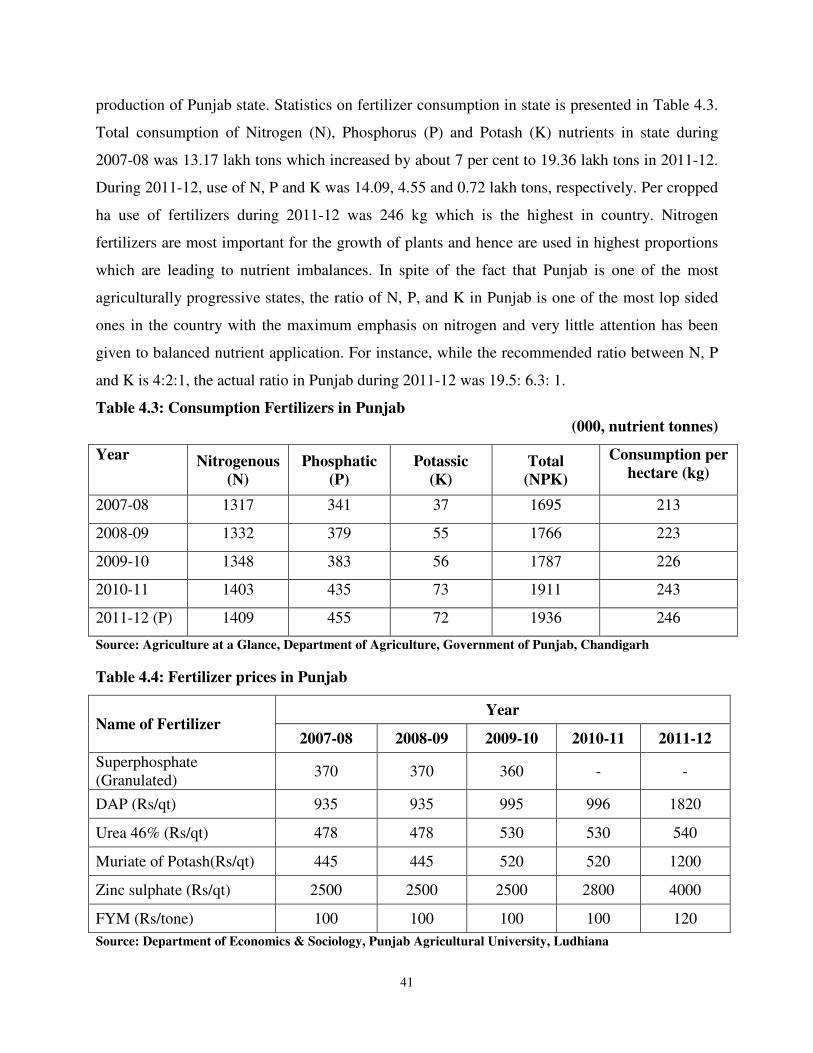
41
production of Punjab state. Statistics on fertilizer consumption in state is presented in Table 4.3.
Total consumption of Nitrogen (N), Phosphorus (P) and Potash (K) nutrients in state during
2007-08 was 13.17 lakh tons which increased by about 7 per cent to 19.36 lakh tons in 2011-12.
During 2011-12, use of N, P and K was 14.09, 4.55 and 0.72 lakh tons, respectively. Per cropped
ha use of fertilizers during 2011-12 was 246 kg which is the highest in country. Nitrogen
fertilizers are most important for the growth of plants and hence are used in highest proportions
which are leading to nutrient imbalances. In spite of the fact that Punjab is one of the most
agriculturally progressive states, the ratio of N, P, and K in Punjab is one of the most lop sided
ones in the country with the maximum emphasis on nitrogen and very little attention has been
given to balanced nutrient application. For instance, while the recommended ratio between N, P
and K is 4:2:1, the actual ratio in Punjab during 2011-12 was 19.5: 6.3: 1.
Table 4.3: Consumption Fertilizers in Punjab
(000, nutrient tonnes)
Year Nitrogenous
(N)
Phosphatic
(P)
Potassic
(K)
Total
(NPK)
Consumption per
hectare (kg)
2007-08 1317 341 37 1695 213
2008-09 1332 379 55 1766 223
2009-10 1348 383 56 1787 226
2010-11 1403 435 73 1911 243
2011-12 (P) 1409 455 72 1936 246
Source: Agriculture at a Glance, Department of Agriculture, Government of Punjab, Chandigarh
Table 4.4: Fertilizer prices in Punjab
Name of Fertilizer Year
2007-08 2008-09 2009-10 2010-11 2011-12
Superphosphate
(Granulated) 370 370 360 - -
DAP (Rs/qt) 935 935 995 996 1820
Urea 46% (Rs/qt) 478 478 530 530 540
Muriate of Potash(Rs/qt) 445 445 520 520 1200
Zinc sulphate (Rs/qt) 2500 2500 2500 2800 4000
FYM (Rs/tone) 100 100 100 100 120
Source: Department of Economics & Sociology, Punjab Agricultural University, Ludhiana
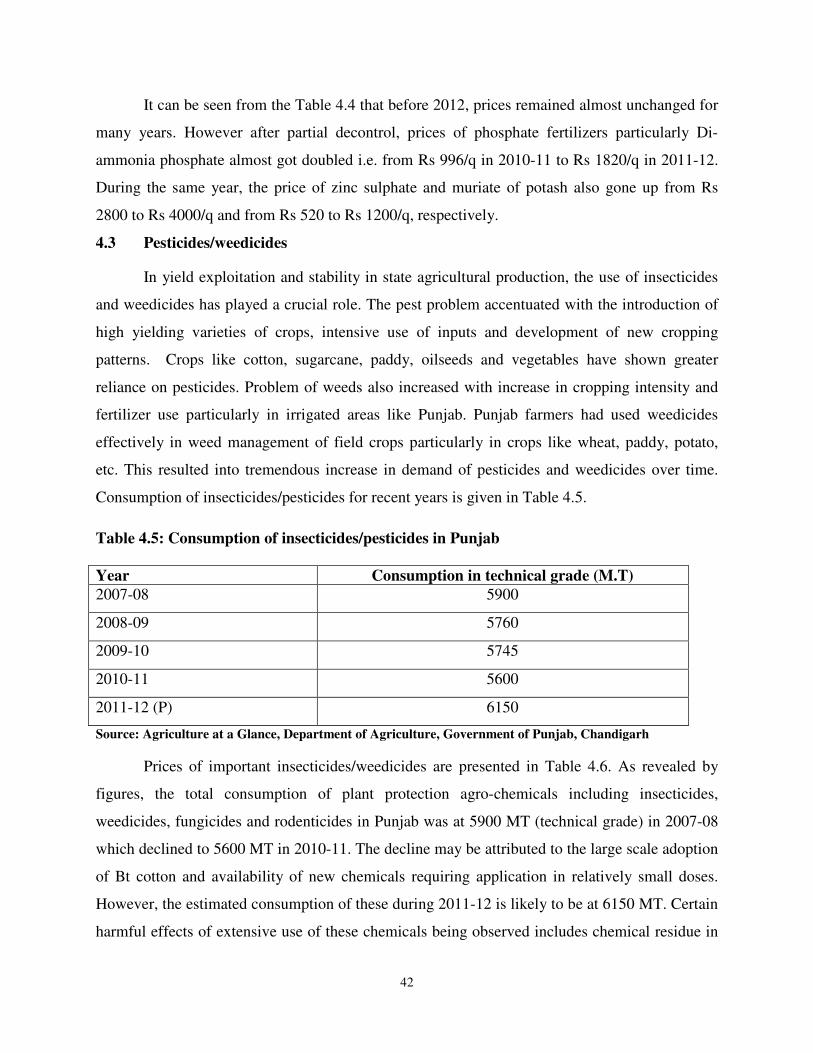
42
It can be seen from the Table 4.4 that before 2012, prices remained almost unchanged for
many years. However after partial decontrol, prices of phosphate fertilizers particularly Di-
ammonia phosphate almost got doubled i.e. from Rs 996/q in 2010-11 to Rs 1820/q in 2011-12.
During the same year, the price of zinc sulphate and muriate of potash also gone up from Rs
2800 to Rs 4000/q and from Rs 520 to Rs 1200/q, respectively.
4.3 Pesticides/weedicides
In yield exploitation and stability in state agricultural production, the use of insecticides
and weedicides has played a crucial role. The pest problem accentuated with the introduction of
high yielding varieties of crops, intensive use of inputs and development of new cropping
patterns. Crops like cotton, sugarcane, paddy, oilseeds and vegetables have shown greater
reliance on pesticides. Problem of weeds also increased with increase in cropping intensity and
fertilizer use particularly in irrigated areas like Punjab. Punjab farmers had used weedicides
effectively in weed management of field crops particularly in crops like wheat, paddy, potato,
etc. This resulted into tremendous increase in demand of pesticides and weedicides over time.
Consumption of insecticides/pesticides for recent years is given in Table 4.5.
Table 4.5: Consumption of insecticides/pesticides in Punjab
Year Consumption in technical grade (M.T)
2007-08 5900
2008-09 5760
2009-10 5745
2010-11 5600
2011-12 (P) 6150
Source: Agriculture at a Glance, Department of Agriculture, Government of Punjab, Chandigarh
Prices of important insecticides/weedicides are presented in Table 4.6. As revealed by
figures, the total consumption of plant protection agro-chemicals including insecticides,
weedicides, fungicides and rodenticides in Punjab was at 5900 MT (technical grade) in 2007-08
which declined to 5600 MT in 2010-11. The decline may be attributed to the large scale adoption
of Bt cotton and availability of new chemicals requiring application in relatively small doses.
However, the estimated consumption of these during 2011-12 is likely to be at 6150 MT. Certain
harmful effects of extensive use of these chemicals being observed includes chemical residue in

43
agricultural output, development of strains of resistance, undesirable side effects on non target
flora and fauna and resurgence of certain insect and weed species along with appearance of
secondary pests/weeds. Regular monitoring and surveillance of these problems in state is the
need of hour.
Table 4.6: Prices of important insecticides/weedicides /fungicides in Punjab
(Rs)
Name of
Chemical/Year
Year
2008 2009 2010 2011 2012
Weedicide
Arelon (per 500 gm) 160 150 160 170 210
Leader (per 13 gm) 325 340 320 325 400
Topik (per 160 gm) - - 350 350 400
2,4 D (per 500 gm) 100 300 200 220 220
Atrazine (per 500 gm) 140 150 150 150 150
Butachlor (per Litre) 160 200 180 180 180
Insecticide
Chlorpyriphos
(per Litre)
180e 250 220 220 250
Malathion 50EC
(per Litre)
180 180 250 240 240
Rogor 30EC (per Litre) 230. 240 350 290 300
Cofidor (per Litre) 1800 1500 1600 1800 1800
Thiodan 35 EC
(per Litre)
260 250 250 260 260
Dithane M-45
(per 500 gm)
115 200 170 180 250
Indofil M-45
(per 500 gm)
130 145 170 180 250
Stomp (per Litre) 430 390 450 450 450
Fungicide
Blitox (per kg) 200 200 250 280 360
Streptocycline
(per 6 gm)
35 32 30 35 40
Emisan-6 (per 100 gm) 40 50 60 55 65
Source: Department of Economics & Sociology, Punjab Agricultural University, Ludhiana
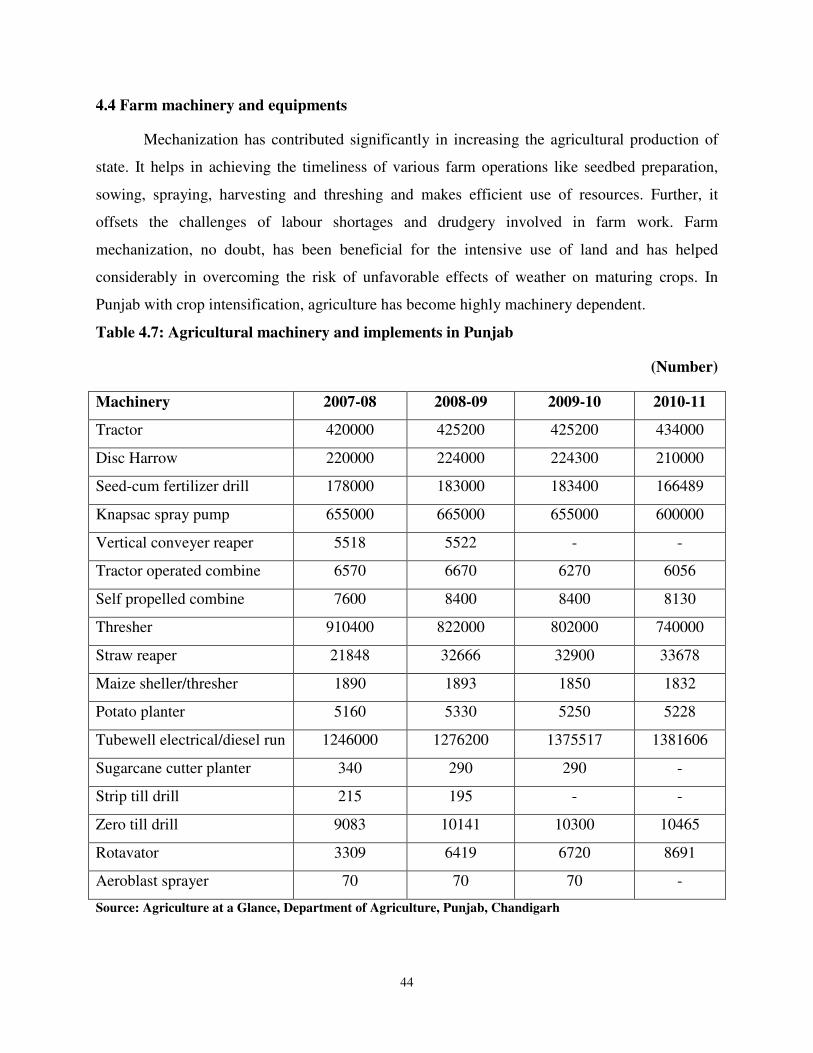
44
4.4 Farm machinery and equipments
Mechanization has contributed significantly in increasing the agricultural production of
state. It helps in achieving the timeliness of various farm operations like seedbed preparation,
sowing, spraying, harvesting and threshing and makes efficient use of resources. Further, it
offsets the challenges of labour shortages and drudgery involved in farm work. Farm
mechanization, no doubt, has been beneficial for the intensive use of land and has helped
considerably in overcoming the risk of unfavorable effects of weather on maturing crops. In
Punjab with crop intensification, agriculture has become highly machinery dependent.
Table 4.7: Agricultural machinery and implements in Punjab
(Number)
Machinery 2007-08 2008-09 2009-10 2010-11
Tractor 420000 425200 425200 434000
Disc Harrow 220000 224000 224300 210000
Seed-cum fertilizer drill 178000 183000 183400 166489
Knapsac spray pump 655000 665000 655000 600000
Vertical conveyer reaper 5518 5522 - -
Tractor operated combine 6570 6670 6270 6056
Self propelled combine 7600 8400 8400 8130
Thresher 910400 822000 802000 740000
Straw reaper 21848 32666 32900 33678
Maize sheller/thresher 1890 1893 1850 1832
Potato planter 5160 5330 5250 5228
Tubewell electrical/diesel run 1246000 1276200 1375517 1381606
Sugarcane cutter planter 340 290 290 -
Strip till drill 215 195 - -
Zero till drill 9083 10141 10300 10465
Rotavator 3309 6419 6720 8691
Aeroblast sprayer 70 70 70 -
Source: Agriculture at a Glance, Department of Agriculture, Punjab, Chandigarh

45
The data on different types of farm machinery being utilized in Punjab agriculture is
presented in Table 4.7. As being indicated by marginal increase in number of various machines
(except tube wells) during the recent years, the mechanization of state agricultural has now
almost reached a saturation point. As per estimates of Punjab State Farmers Commission, the
state has double the number of tractors it requires. The average use of tractors per annum in the
state is barely 450 hours, which is much below the minimum 1,000 hours of productive use in
agriculture. This over capitalization in farm mechanization and it’s under utilization leads to
higher cost of production and lower net income to farmers, making it economically unviable. The
indicative price of selected machinery like tractor, electric motor and diesel engine is provided in
Table 4.8.
Table 4.8: Prices of selected agricultural machinery in Punjab
(Rs/ unit)
Machinery 2007-08 2008-09 2009-10 2010-11
Tractor (35 HP) 370000 375000 450000 480000
Electrical motor 23000 23000 23500 28500
Diesel engine 23000 23000 23000 23500
Source: Department of Economics & Sociology, Punjab Agricultural University, Ludhiana
Prices are approximate only
4.5 Irrigation
Agriculture in Punjab has a heavy requirement of water for irrigation and there is an
excellent network of irrigation facilities both surface and ground is serving this purpose. About
98 per cent of net sown area in state is irrigated (Table 4.9). Punjab has an excellent irrigation
distribution network of canals, branch canals and minor distributaries and field channels or water
courses. Overtime, canal irrigation has been declining whereas tube well irrigation has been on
an increase and about 73 per cent of the total irrigated area is being irrigated by underground
water pumped out by about 13.80 lakh tube wells. This is mainly due to availability of cheap
credit and free supply of electricity in the state. Rice and wheat, being the major crops of the
state, account for the 81.33 per cent of the gross cropped irrigated area in state (Table 4.11).
The cultivation of high water demanding crops particularly paddy is an important factor
contributing towards decline of underground water levels in Punjab. Annual availability of

46
surface and ground water in state is 3.48 million hectare meters (mhm). However, the annual
demand for state agriculture is 4.76 mhm (Table 4.10). The annual deficit to the tune of 1.28
mhm every year is met through the overexploitation of underground water by tube wells leading
to serious problem of deteriorating underground water resources.
Table 4.9: Gross cropped and irrigated area in Punjab (000, ha)
Year Gross cropped
area
Irrigated area % of gross irrigated area to
gross cropped area
2007-08 7870 7689.3 97.7
2008-09 7912 7723.6 97.6
2009-10 7876 7714.2 97.9
2010-11 7882 7723.8 98.0
Source: Statistical Abstract, Punjab
Table 4.10: Status of water resources on Punjab
Annual canal water available at H/w 1.79 M ha-m
Annual canal water available at outlets 1.45 M ha-m
Annual canal water available 2.03 M ha-m
Total annual available water resources 3.48 M ha-m
Annual water demand 4.76 M ha-m
Annual water deficit 1.28 M ha-m
Source: Jain A K, Department of Soil & Water Engineering, PAU, Ludhiana

47
Table 4.11: Crop wise gross irrigated area in Punjab
(000, ha)
Crop/Year 2007-08 2008-09 2009-10 2010-11
Rice 2592.4
(33.71)
2721.8
(35.24)
2783.5
(36.08)
2814.2
(36.44)
Jowar - 0.1
(0.00)
0.1
(0.00) (a)
Bajra 4.4
(0.06)
4.9
(0.06)
3.4
(0.04)
2.5
(0.03)
Wheat 3437.1
(44.70)
3474.8
(44.99)
3474
(45.03)
3466.9
(44.89)
Barley 15.3
(0.20)
16.0
(0.21)
13.7
(0.18)
11.7
(0.15)
Maize 99.3
(1.29)
98.0
(1.27)
99.9
(1.30)
94.1
(1.22)
Gram 1.7
(0.02)
2.2
(0.03)
2.3
(0.03)
2.2
(0.03)
Other pulses 21.8
(0.28)
16.1
(0.21)
16.3
(0.21)
14.7
(0.19)
Sugarcane 104.4
(1.36)
75.2
(0.97)
58.3
(0.76)
67.6
(0.88)
Other food crops (including
condiments & spices
208.5
(2.71)
178.1
(2.31)
165.8
(2.15)
174.3
(2.26)
Cotton 604.8
(7.87)
527.3
(6.83)
508.8
(6.60)
482.8
(6.25)
Other non-food crops 599.6
(7.80)
609.1
(7.89)
588.1
(7.62)
592.8
(7.67)
Total 7689.3
(100.00)
7723.6
(100.00)
7714.2
(100.00)
7723.8
(100.00) Source: Statistical Abstract, Punjab
Figures in parentheses are percentages to total
(a): less than 500 hectares
Since last many years, the supply of electricity to tube wells as well as canal water to the
state farmers is being supplied to agriculture sector of free of cost.
4.6 Labour and agricultural Wages
Punjab State is predominantly an agricultural state with two-third of its population directly or
indirectly dependent on agriculture. With introduction of new agricultural technology in sixties,
crop rotations experienced significant changes along with the increase in cropping intensity, which
resulted in increased aggregate labour employment in agriculture. However, due to fast pace of
agriculture mechanization during eighties, the complementary relationship between the agricultural
development, mechanization and demand for labour weakened. During nineties, the Punjab
48
agriculture reached a stage where increased mechanization particularly for harvesting of wheat and
paddy and use of labour substituting inputs like weedicides and herbicides along with decrease in
area under labour intensive crops, started competing with labour force and resulted in substantial
labour displacement. The recent stagnation in productivity of major crops along with
imperceptible movement of labour out of agriculture sector raised concern about its potential to
increase the income and labour productivity. There is clear evidence that overtime the capacity of
agriculture sector to absorb labour has been declining significantly. The employment elasticity
with respect to aggregate output come down from 0.54 during 1970's to 0.36 during 1980's and
presently even less than 0.20 (Sidhu, 2002). In addition, the experience of the last decade brings
out that, the growth in agricultural sector has been generating more casualization of employment.
There is increase in casualization of labour as overtime the proportions of family labour and
permanent hired labour is declining (Deshapande et al, 2007).
The slow growth of agriculture employment in recent years could be largely attributed to
imbalanced growth of mechanization that substitutes the machine labour for human and animal
labour. The level of mechanization is already higher in Punjab, where man days employed in
production of crops are low as compared to other parts of the country and negative growth in
agricultural employment was experienced against a positive growth rate of real agricultural
output in the nineties (Haque and Sharma, 2004). In a labour surplus economy like ours, the
primary concern still centers on human labour employment. As the siphoning off mechanism of
agricultural labour to other sectors has remained rather ineffective in Punjab state, the solution to
problems of rural unemployment and under employment depends upon the potential of crop
production sector in absorbing the labour.
The per hectare labour use in cultivation of wheat, paddy and cotton collectively accounting
for more than 85 per cent of the gross cropped area in Punjab state is presented in Table 4.12.
During 2008-09, per hectare labour use in cultivation of wheat, paddy and cotton was 184.87,
417.19 and 717.78 man hours, respectively. Wages are equally important in indicating the
importance of a particular sector along with socio-economic status of the people employed. The
data with respect to the wage rates of major agricultural operations in Punjab is presented in
Table 4.13. It was observed from the figures that wage rates for various agricultural operations in
state have been almost doubled in the period from 2007 to 2011. This clearly points towards
shortage of labour for agricultural sector is experiencing in past few years.

49
Table 4.12: Labour use (per ha) for major crops in Punjab
(Hours/ ha)
Crop/Year 2007-08 2008-09 2009-10
Rice 402.54 417.19 NA
Wheat 188.01 184.87 177.94
Cotton 803.30 717.78 NA
Source: Estimates of cost of cultivation scheme, NA: Not Available
Table: 4.13 Wages paid to agricultural and skilled labour in Punjab
(Rs/ man day)
Crop/Year 2007 2008 2009 2010 2011**
Agricultural labour: for
Ploughing 106.24 128.22 143.92 151.82 205.50
Sowing 106.96 130.88 141.18 145.80 204.50
Weeding 105.21 123.10 129.75 149.47 197.25
Harvesting 114.08 127.62 186.00 189.61 203.00
Picking cotton* 107.80 - - 141.88 190.00
Other agricultural
operations
106.48 137.41 144.25 144.43 215.00
Skilled labour:
Black smith 195.86 218.44 224.65 226.88 270.00
Car penter 198.32 216.69 227.37 230.54 267.00 Source: Statistical Abstract, Punjab
*For female labour, ** Information is prepared July 2011 to Nov. 2011
4.7 Credit
Credit is an important input which has played significant role in development of Punjab
agriculture. The formal credit institutions such as Cooperative Credit Institutions, Regional Rural
Banks and Commercial Banks are supposed to meet the agricultural credit requirement in the
state. Besides institutional credit, informal sources particularly the commission agents/arthytias
provide a significant amount of credit to the farmers. About 2095 rural/semi-urban branches of
all Commercial Banks and 4755 retail outlets of Cooperative Credit Set-up are operating in the
farm credit market. Out of total retail outlets of Cooperative Credit set-up 3990 are Primary
Agricultural Cooperative Societies, Primary Agricultural Cooperative Banks and 676 rural/semi-
urban branches of Central Cooperative Banks (Shergill, 2011). The extent formal credit to
agriculture in state is provided in Table 4.14. During 2011-12, against the target of Rs 41832
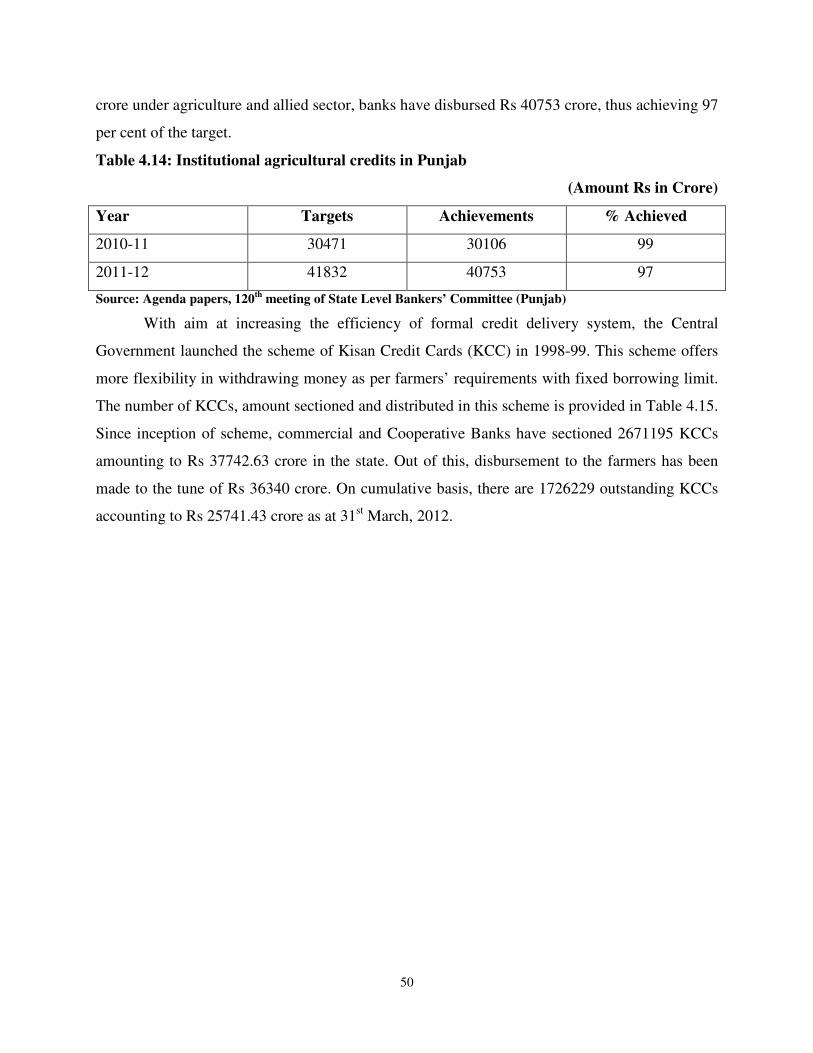
50
crore under agriculture and allied sector, banks have disbursed Rs 40753 crore, thus achieving 97
per cent of the target.
Table 4.14: Institutional agricultural credits in Punjab
(Amount Rs in Crore)
Year Targets Achievements % Achieved
2010-11 30471 30106 99
2011-12 41832 40753 97
Source: Agenda papers, 120th
meeting of State Level Bankers’ Committee (Punjab)
With aim at increasing the efficiency of formal credit delivery system, the Central
Government launched the scheme of Kisan Credit Cards (KCC) in 1998-99. This scheme offers
more flexibility in withdrawing money as per farmers’ requirements with fixed borrowing limit.
The number of KCCs, amount sectioned and distributed in this scheme is provided in Table 4.15.
Since inception of scheme, commercial and Cooperative Banks have sectioned 2671195 KCCs
amounting to Rs 37742.63 crore in the state. Out of this, disbursement to the farmers has been
made to the tune of Rs 36340 crore. On cumulative basis, there are 1726229 outstanding KCCs
accounting to Rs 25741.43 crore as at 31st March, 2012.
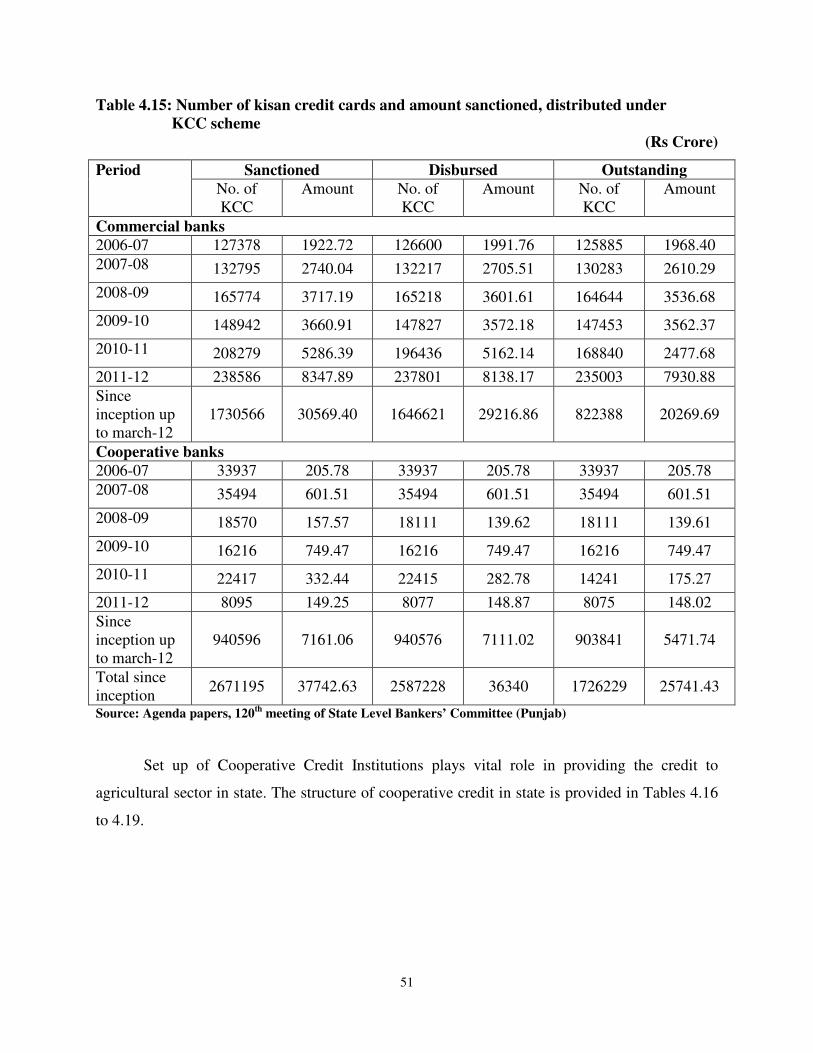
51
Table 4.15: Number of kisan credit cards and amount sanctioned, distributed under
KCC scheme
(Rs Crore)
Period Sanctioned Disbursed Outstanding
No. of
KCC
Amount No. of
KCC
Amount No. of
KCC
Amount
Commercial banks
2006-07 127378 1922.72 126600 1991.76 125885 1968.40
2007-08 132795 2740.04 132217 2705.51 130283 2610.29
2008-09 165774 3717.19 165218 3601.61 164644 3536.68
2009-10 148942 3660.91 147827 3572.18 147453 3562.37
2010-11 208279 5286.39 196436 5162.14 168840 2477.68
2011-12 238586 8347.89 237801 8138.17 235003 7930.88
Since
inception up
to march-12
1730566 30569.40 1646621 29216.86 822388 20269.69
Cooperative banks
2006-07 33937 205.78 33937 205.78 33937 205.78
2007-08 35494 601.51 35494 601.51 35494 601.51
2008-09 18570 157.57 18111 139.62 18111 139.61
2009-10 16216 749.47 16216 749.47 16216 749.47
2010-11 22417 332.44 22415 282.78 14241 175.27
2011-12 8095 149.25 8077 148.87 8075 148.02
Since
inception up
to march-12
940596 7161.06 940576 7111.02 903841 5471.74
Total since
inception 2671195 37742.63 2587228 36340 1726229 25741.43
Source: Agenda papers, 120th
meeting of State Level Bankers’ Committee (Punjab)
Set up of Cooperative Credit Institutions plays vital role in providing the credit to
agricultural sector in state. The structure of cooperative credit in state is provided in Tables 4.16
to 4.19.

52
Table 4.16: Loan advanced and outstanding of Cooperative Credit Institutions (as on
31st March)
(Rs. Lakh)
Institution Loan advanced Loan outstanding
2007-08 2008-09 2007-08 2008-09
Primary
agricultural
cooperative credit
societies
613011.49
647572.08
411485.26
457138.36
Primary
cooperative
agricultural land
development
banks (PADB)
45887.64
78769.76
205928.91
224321.54
Central
cooperative banks 992818.54
1646566.56
716604.28
743320.31
State agricultural
development
banks (SADB) 25345.94
32292.53
198269.8
198711.45
State cooperative
banks 568101.81
848680.73
413836.79
472936.28
Source: Statistical Abstract, Punjab
Figures in parentheses are percentages to total
Table 4.17: Long term and short term credit provided by Primary Agricultural Credit
Societies and Primary Cooperative Agricultural Land Development Banks (Rs. Lakh)
Year Outstanding loan
Long term Medium
term
Short term Total
2007-08 205928.91
(33.35)
24698.42
(4.00)
386786.84
(62.65)
617414.17
(100.00)
2008-09 224321.54
(32.92)
36017.51
(5.29)
421121.05
(61.80)
681460.10
(100.00) Source: Statistical Abstract, Punjab
Figures in parentheses are percentages to total
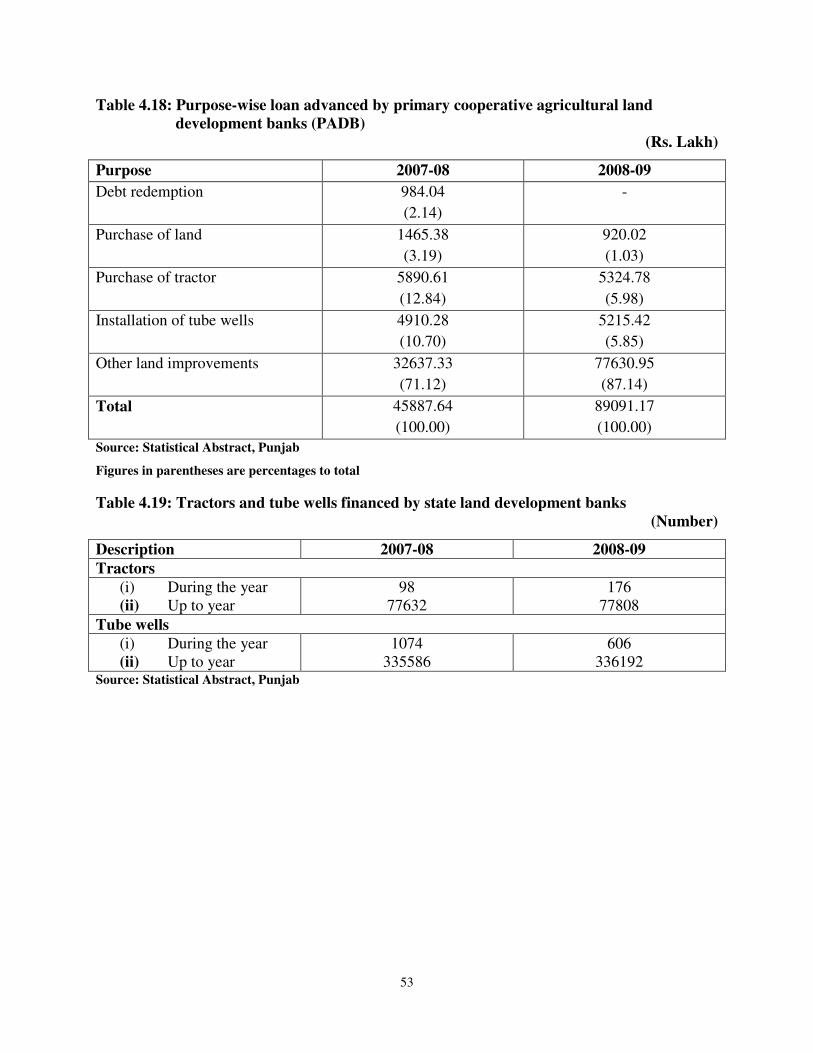
53
Table 4.18: Purpose-wise loan advanced by primary cooperative agricultural land
development banks (PADB)
(Rs. Lakh)
Purpose 2007-08 2008-09
Debt redemption 984.04
(2.14)
-
Purchase of land 1465.38
(3.19)
920.02
(1.03)
Purchase of tractor 5890.61
(12.84)
5324.78
(5.98)
Installation of tube wells 4910.28
(10.70)
5215.42
(5.85)
Other land improvements 32637.33
(71.12)
77630.95
(87.14)
Total 45887.64
(100.00)
89091.17
(100.00)
Source: Statistical Abstract, Punjab
Figures in parentheses are percentages to total
Table 4.19: Tractors and tube wells financed by state land development banks
(Number)
Description 2007-08 2008-09
Tractors
(i) During the year
(ii) Up to year
98
77632
176
77808
Tube wells
(i) During the year
(ii) Up to year
1074
335586
606
336192 Source: Statistical Abstract, Punjab
54
Chapter 5
Major Crops: Area, Production and Yield
Punjab agriculture has shown sign of stagnation in the nineties. The changes in the area,
production and productivity of major crops in the Punjab state over a period from 1992-93 to
2010-11 are presented in Table 5.1. These changes were also observed plan-wise for the plan
periods viz. 8th
plan (1992-93 to 1996-97); 9th
plan (1997-98 to 2001-02); 10th
plan (2002-03 to
2006-07) and initial four years of 11th
plan (2007-08 to 2010-11). The plan wise Compound
Annual Growth Rates (CAGR) of major crops with respect area, production and yield were also
worked out.
The area, production and yield of rice over the study period (1992-93 to 2010-11) went
up tremendously by 35.23, 59.92 and 18.25 per cent, respectively. This tremendous increase in
rice production happened despite the Punjab was not traditional rice growing state. Plan-wise the
area expansion under rice was largest during 9th
plan (9.03 %) and lowest during 10th
plan (3.60
%). Production and yield increase was observed to be highest in 9th
plan by 14.17 and 10.20 per
cent, respectively. While lowest increase in rice production (4.38 %) was observed in 8th
plan, its
yield went down by 0.22 per cent during the period of 11th
plan. Wheat also showed the same
trend but the increase was at lesser pace than for the rice as its area, production and yield during
the study period went up by 7.28, 22.34 and 14.03 per cent, respectively. Plan-wise largest
(3.64%) area increase under wheat was observed during 9th
plan, where as it went down by 1.64
per cent during 8th
plan. While the highest increase in wheat production (21.90%) and
productivity (17.62%) was observed during 9th
plan, these went down in period of 11th
plan by
3.48 and 4.44 per cent, respectively. The reason being the Increase in area and productivity of
both of these crops are the main movers for this increase in production of these crops in the state.
Except potato, all other crops showed either decrease in area during this period.
The area under cotton, the third most important crop of state went down drastically
during the 9th
plan, reason being the uncontrollable pest problems in late nineties. However, with
introduction of Bt cotton its yield and production picked up remarkably during the 10th
plan.
Despite the area under maize crop went down by 26.84 per cent over the study period, due to
tremendous increase (48.63%) in its productivity, its production in state increased by 8.94 per
cent. It clearly reveals that the paddy and wheat crop rotation became predominant at the cost of
55
maize, other cereals, oilseed and pulses in the state. A cursory glance on the table revealed that
during the study period, the productivity of these crops went up significantly with the exception
of sugarcane.
Compound Annual Growth Rates (CAGR) for major crops of state in 8th
to 11th
five year
plans and for overall study period are presented in Table 5.2. The figures revealed that rice area,
production and productivity over the period of about two decades increased significantly at the
CAGR of 1.56, 2.79 and 1.20 per cent, respectively. Thus, over the study period the increase in
area under rice contributed relatively more towards production increase as compared to the
contribution of yield increase during this period. Plan-wise while the significant increase in area
and yield was observed during 11th
plan and 10th
plan, respectively, production of rice increased
significantly during 9th
and 10th
plan periods. The production of wheat during the study period
increased at CAGR of 1.16 per cent while area under it and yield increased at CAGR of 0.47 and
0.69 per cent, respectively. Thus major contributor towards wheat production over this period
was the increase in yield. Plan-wise major increase in wheat area, production and yield was
observed during 9th
plan. With the exception of potato CAGR of area of all other major crops in
state viz. cotton, maize, pulses, oilseeds and sugarcane during this period were found to be
negative.

56
Table 5.1: Area, production and yield (plan-wise) of major crops, Punjab
Crops
8Th Plan 9Th Plan 10Th Plan 11Th Plan* Overall
1992-
93
1996-
97
Change
over
1992.93
1997-
98
2001-
02
Change
over
1997-98
2002-03 2006-
07
Change
over
2002-03
2007-
08
2010-
11
Change
over 2007-
08
1992-
93
2010-
11
Change
Over
1992-93
Rice
A 2072 2159 87
(4.20) 2281 2487
206
(9.03) 2530 2621
91
(3.60) 2609 2802
193
(7.40) 2072 2802
730
(35.23)
P 7026 7334 308
(4.38) 7904 8816
912
(11.54) 8880 10138
1258
(14.17) 10486 11236
750
(7.15) 7026 11236
4210
(59.92)
Y 3391 3397 6
(0.18) 3465 3545
80
(2.31) 3510 3868
358
(10.20) 4019 4010
-9
(-0.22) 3391 4010
619
(18.25)
Wheat
A 3283 3229 -54
-1.64 3300 3420
120
(3.64) 3375 3467
92
(2.73) 3487 3522
35
(1.00) 3283 3522
239
(7.28)
P 12399 13672 1273
(10.27) 12715 15499
2784
(21.90) 14175 14596
421
(2.97) 15716 15169
-547
(-3.48) 12399 15169
2770
(22.34)
Y 3777 4234 457
(12.10) 3853 4532
679
(17.62) 4200 4210
10
(0.24) 4507 4307
-200
(-4.44) 3777 4307
530
(14.03)
Maize
A 190 166 -24
(-12.63) 165 165
0
(0.00) 153 154
1
(0.65) 154 139
-15
(-9.74) 190 139
-51
(-26.84)
P 436 352 -84
(-19.27) 345 449
104
(30.14) 312 481
169
(54.17) 525 475
-50
(-9.52) 436 475
39
(8.94)
Y 2297 2118 -179
(-7.79) 2091 2722
631
(30.18) 2040 3123
1083
(53.09) 3408 3414
6
(0.18) 2297 3414
1117
(48.63)
Gram
A 26 16 -10
(-38.46) 13 7
-6
(-46.15) 7 4
-3
(-42.86) 2 3
1
(50.00) 26 3
-23
(-88.46)
P 17 15 -2
(-11.76) 11 6
-5
(-45.45) 7 4
-3
(-42.86) 2.1 3.4
1.3
(61.90) 17 3.4
-13.6
(-80.00)
Y 672 915 243
(36.16) 824 873
49
(5.95) 953 1010
57
5.98 1046 1129
83
(7.93) 672 1129
457
(68.01)
Rapeseed
&
Mustard
A 73 92 19
(26.03) 72 51
-21
(-29.17) 65 41
-24
(-36.92) 30 30
0
(0.00) 73 30
-43
(-58.90)
Y 947 1256 309
(32.63) 872 1191
319
(36.58) 912 1119
207
(22.70) 1182 1284
102
(8.63) 947 1284
337
(35.59)
Sugarcane
A 112 173 61
(54.46) 126 142
16
(12.70) 153 99
-54
(-35.29) 108 60
-48
(-44.44) 112 60
-52
(-46.43)
P 688 1022 334
948.55) 715 925
210
(29.37) 902 602
-300
(-33.26) 657 370
-287
(-43.68) 688 370
-318
(-46.22)
Y 6141 5905 -236
(-3.84) 5678 6512
834
(14.69) 5894 6083
189
(3.21) 6086 6172
86
(1.41) 6141 6172
31
(0.50)
Total
cereals
A 5597 5593 -4
(-0.07) 5791 6103
312
(5.390 6243 6268
25
(0.40) 6271 6480
209
(3.33) 5597 6480
883
(15.78)
P 19982 21471 1489 21083 23848 2765 24459 25286 827 26789 26931 142 19982 26931 6949

57
(7.45) (13.11) (3.38) (0.53) (34.78)
Y 3570 3839 269
(7.54) 3641 3908
267
(7.33) 3918 4034
116
(2.96) 4272 4156
-116
(-2.72) 3570 4156
586
(16.41)
Coarse
cereals
A 242 212 -30
(-12.40) 208 184
-24
(-11.54) 338 180
-158
(-46.75) 175 156
-19
(-10.86) 242 156
-86
(-35.54)
P 557 481 -76
(-13.64) 486 143
-343
(-70.58) 1634 552
-1082
(-66.22) 587 526
-61
(-10.39) 557 526
-31
(-5.57)
Y 2302 2269 -33
(-1.43) 2337 777
-1560
(-66.75) 4834 3067
-1767
(-36.55) 3354 3372
18
(0.54) 2302 3372
1070
(46.48)
Pulses
A 99 91 -8
(-8.08) 84 49
-35
(-41.67) 44 29
-15
(-34.09) 27 19
-8
(-29.63) 99 19
-80
(-80.81)
P 74 75 1
(1.35) 56 30
-26
(-46.43) 35 24
-11
(-31.43) 20 16
-4
(-20.00) 74 16
-58
(-78.38)
Y 747 824 77
(10.31) 667 612
-55
(-8.25) 795 828
33
(4.15) 741 842
101
(13.63) 747 842
95
(12.72)
Total
foodgrains
A 5696 5684 -12
(-0.21) 5875 6152
277
(4.71) 6288 6297
9
(0.14) 6298 6499
201
(3.19) 5696 6499
803
(14.10)
P 20056 21546 1490
(7.43) 21139 23878
2739
(12.96) 24727 25310
583
(2.36) 26809 26947
138
(0.51) 20056 26947
6891
(34.36)
Y 3521 3791 270
(7.67) 3598 3881
283
(7.87) 3932 4019
87
(2.21) 4257 4146
-111
(-2.61) 3521 4146
625
(17.75)
Total
oilseeds
A 194 208 14
(7.22) 150 83
-67
(-44.67) 98 70
-28
(-28.57) 60 62
2
(3.33) 194 62
-132
(-68.04)
P 236 277 41
(17.37) 156 84
-72
(-46.15) 85 78
-7
(-8.24) 78 84
6
(7.69) 236 84
-152
(-64.41)
Y 1216 1332 116
(9.54) 1040 1012
-28
(-2.69) 867 1114
247
(28.49) 1300 1355
55
(4.23) 1216 1355
139
(11.43)
Cotton#
A 702 741 39
(5.56) 724 606
-118
(-16.30) 450 607
157
(34.89) 605 511
-94
(-15.54) 702 511
-191
(-27.21)
P 2353 1920 -433
(-18.40) 937 1305
368
(39.27) 1085 2678
1593
(146.82) 2359 2006
-353
(-14.96) 2353 2006
-347
(-14.75)
Y 570 440 -130
(-22.81) 220 366
146
(66.36) 410 750
340
(82.93) 663 641
-22
(-3.32) 570 641
71
(12.46)
Potato
A 28 48 20
(71.43) 55 57
2
(3.64) 68 76
8
(11.76) 90 83
-7
(-7.78) 28 83
55
(196.43)
P 498 838 340
(68.27) 827 1147
320
(38.69) 1395 1353
-42
(-3.01) 1714 2116
402
(23.45) 498 2116
1618
(324.90)
Y 17518 17463 -55
(-0.31) 15122 20054
4932
(32.61) 20515 17803
-2712
(-13.22) 19044 25494
6450
(33.87) 17518 25494
7976
(45.53)
* Constitutes initial four year of plan. Figures in parentheses indicate percentage change.
A : Area (000 ha), P: Production (000 metric tonnes) and Y: Yield (Kg/ha)
# Production of cotton in 000 bales (cleaned lint)
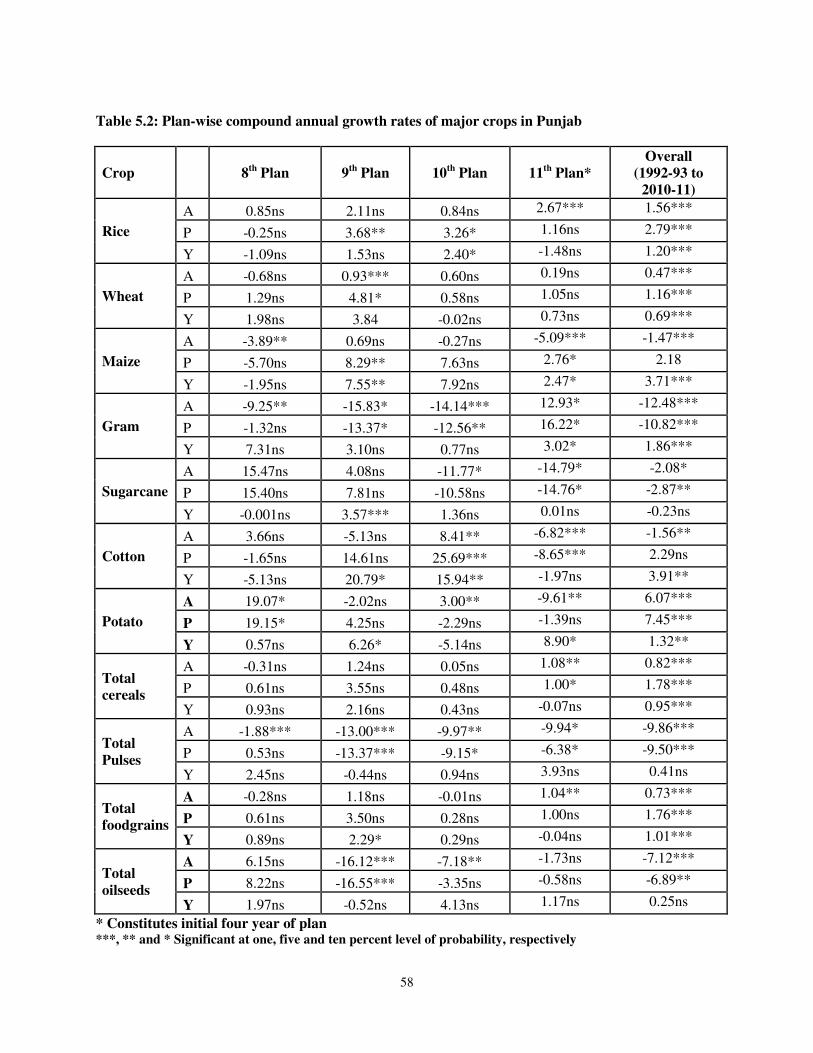
58
Table 5.2: Plan-wise compound annual growth rates of major crops in Punjab
Crop 8th
Plan
9th
Plan
10th
Plan
11th
Plan*
Overall
(1992-93 to
2010-11)
Rice
A 0.85ns 2.11ns 0.84ns 2.67*** 1.56***
P -0.25ns 3.68** 3.26* 1.16ns 2.79***
Y -1.09ns 1.53ns 2.40* -1.48ns 1.20***
Wheat
A -0.68ns 0.93*** 0.60ns 0.19ns 0.47***
P 1.29ns 4.81* 0.58ns 1.05ns 1.16***
Y 1.98ns 3.84 -0.02ns 0.73ns 0.69***
Maize
A -3.89** 0.69ns -0.27ns -5.09*** -1.47***
P -5.70ns 8.29** 7.63ns 2.76* 2.18
Y -1.95ns 7.55** 7.92ns 2.47* 3.71***
Gram
A -9.25** -15.83* -14.14*** 12.93* -12.48***
P -1.32ns -13.37* -12.56** 16.22* -10.82***
Y 7.31ns 3.10ns 0.77ns 3.02* 1.86***
Sugarcane
A 15.47ns 4.08ns -11.77* -14.79* -2.08*
P 15.40ns 7.81ns -10.58ns -14.76* -2.87**
Y -0.001ns 3.57*** 1.36ns 0.01ns -0.23ns
Cotton
A 3.66ns -5.13ns 8.41** -6.82*** -1.56**
P -1.65ns 14.61ns 25.69*** -8.65*** 2.29ns
Y -5.13ns 20.79* 15.94** -1.97ns 3.91**
Potato
A 19.07* -2.02ns 3.00** -9.61** 6.07***
P 19.15* 4.25ns -2.29ns -1.39ns 7.45***
Y 0.57ns 6.26* -5.14ns 8.90* 1.32**
Total
cereals
A -0.31ns 1.24ns 0.05ns 1.08** 0.82***
P 0.61ns 3.55ns 0.48ns 1.00* 1.78***
Y 0.93ns 2.16ns 0.43ns -0.07ns 0.95***
Total
Pulses
A -1.88*** -13.00*** -9.97** -9.94* -9.86***
P 0.53ns -13.37*** -9.15* -6.38* -9.50***
Y 2.45ns -0.44ns 0.94ns 3.93ns 0.41ns
Total
foodgrains
A -0.28ns 1.18ns -0.01ns 1.04** 0.73***
P 0.61ns 3.50ns 0.28ns 1.00ns 1.76***
Y 0.89ns 2.29* 0.29ns -0.04ns 1.01***
Total
oilseeds
A 6.15ns -16.12*** -7.18** -1.73ns -7.12***
P 8.22ns -16.55*** -3.35ns -0.58ns -6.89**
Y 1.97ns -0.52ns 4.13ns 1.17ns 0.25ns
* Constitutes initial four year of plan ***, ** and * Significant at one, five and ten percent level of probability, respectively

59
Chapter 6
Agricultural Research, Education and Extension
Agricultural research is a vital input for planned growth and sustainable development of
agriculture in the country. With Indian Council of Agricultural Research (ICAR) being an apex
scientific organization at national level, at state level Punjab has an excellent infrastructure for
agricultural research and education at Punjab Agricultural University. It played a crucial role in
promoting and accelerating the use of science and technology programmes relating to
agricultural research and education. It also provides assistance and support in demonstrating the
use of new technologies in agriculture. Punjab Agricultural University did a commendable job in
adapting/developing wheat and rice varieties to suit the regional conditions leading to manifold
increase in productivity. It has also made notable contributions in increasing livestock and
poultry production. In 2006 the College of Veterinary Science of PAU, Ludhiana was upgraded
to become Guru Angad Dev Veterinary and Animal Science University (GADVASU) which is
now looking after the research, teaching and extension regarding livestock and veterinary
sciences.
Table 6.1: List of crop varieties/hybrids released by Punjab Agricultural University
S. No. Name of crop Number of varieties
1 Wheat 56
2 Barley 11
3 Rice 33
4 Maize 31
5 Cotton 37
6 Pulses 54
7 Soybean 8
8 Oilseeds 53
9 Pearl millet 14
10 Fodder 39
11 Sugarcane 21
12 Vegetables 158
13 Fruits 132
14 Flowers 30
15 Mushrooms 9
16 Forest crops 11
17 New crops 3
18 Green manuring crops 3
Total 703 Source: Directorate of Research, Punjab Agricultural University, Ludhiana
60
In PAU, research is a major arena and it is engaged in carrying out research in
Agriculture, Agricultural Engineering, Basic Sciences and Home Science. Since its inception,
PAU has evolved a strong crop improvement programme and released 703 crop varieties and
hybrids. Number of varieties/hybrids released at national level is 115. Among these several have
gained national and international acceptability. List of crop varieties/hybrids released by PAU is
given in Table 6.1. PAU introduced cultivation of many new crops and developed/recommended
resource conservation/crop production technologies like;
- technology for reclamation of problem soils (saline and water logged)
- zero tillage/minimum tillage
- bed planting/ridge planting
- leaf colour charts
- integrated nutrient management
- soil testing based fertilizer application
- net-house cultivation of vegetables
- direct seeding of paddy
- laser leveling of fields
- tensiometer (for optimum irrigation)
- crop residue management technologies
PAU also worked out crop disease/fungus management and integrated pest
management/insect resistance management technologies. Besides, it has strong farm machinery
development and testing programme. Italian honeybee was introduced in Punjab and
technologies in honey production, extraction and processing were developed.
The State Department of Agriculture as well as extension services of PAU and
GADVASU play lead role in dissemination of research findings and recommendations among
the farming community of Punjab, who quickly respond through adoption of the same. The State
Department of Agriculture has district level training centres which are instrumental in imparting
training to the farmers and farm-women in day to day agricultural technological developments
with regard to crop production and allied activities. District level camps are organized both in
Kharif and Rabi season by department where experts/scientists educate the field staff as well as
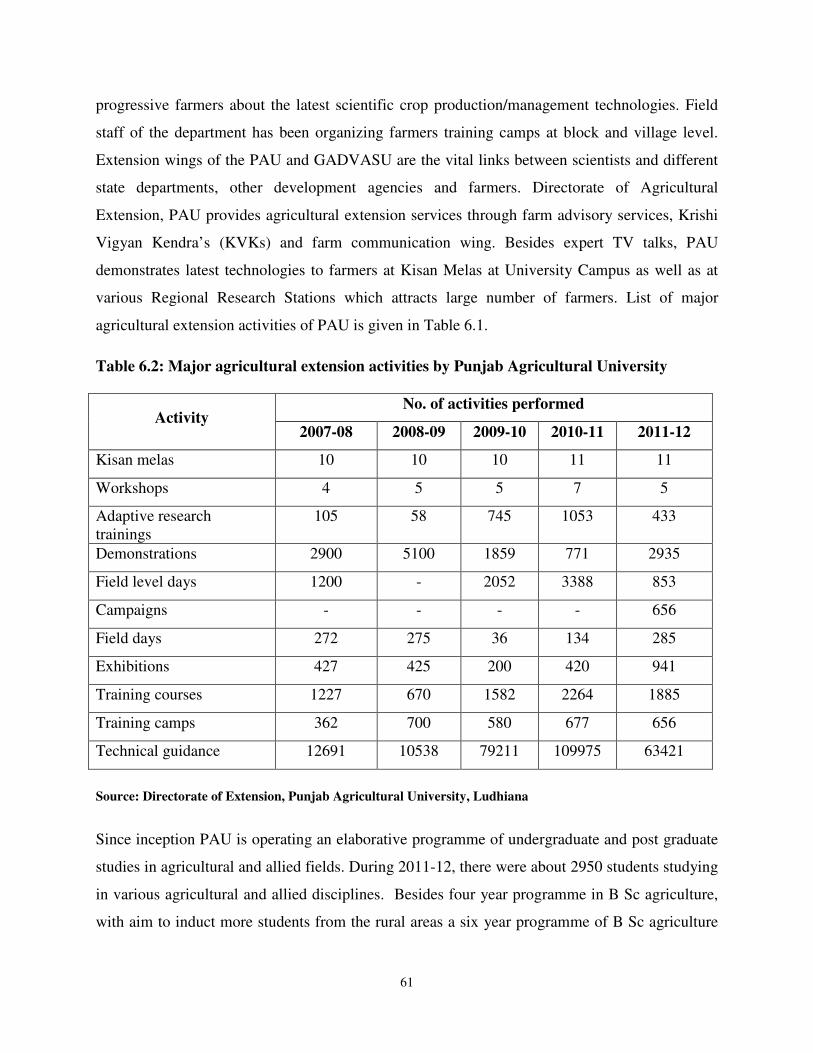
61
progressive farmers about the latest scientific crop production/management technologies. Field
staff of the department has been organizing farmers training camps at block and village level.
Extension wings of the PAU and GADVASU are the vital links between scientists and different
state departments, other development agencies and farmers. Directorate of Agricultural
Extension, PAU provides agricultural extension services through farm advisory services, Krishi
Vigyan Kendra’s (KVKs) and farm communication wing. Besides expert TV talks, PAU
demonstrates latest technologies to farmers at Kisan Melas at University Campus as well as at
various Regional Research Stations which attracts large number of farmers. List of major
agricultural extension activities of PAU is given in Table 6.1.
Table 6.2: Major agricultural extension activities by Punjab Agricultural University
Activity No. of activities performed
2007-08 2008-09 2009-10 2010-11 2011-12
Kisan melas 10 10 10 11 11
Workshops 4 5 5 7 5
Adaptive research
trainings
105 58 745 1053 433
Demonstrations 2900 5100 1859 771 2935
Field level days 1200 - 2052 3388 853
Campaigns - - - - 656
Field days 272 275 36 134 285
Exhibitions 427 425 200 420 941
Training courses 1227 670 1582 2264 1885
Training camps 362 700 580 677 656
Technical guidance 12691 10538 79211 109975 63421
Source: Directorate of Extension, Punjab Agricultural University, Ludhiana
Since inception PAU is operating an elaborative programme of undergraduate and post graduate
studies in agricultural and allied fields. During 2011-12, there were about 2950 students studying
in various agricultural and allied disciplines. Besides four year programme in B Sc agriculture,
with aim to induct more students from the rural areas a six year programme of B Sc agriculture
62
was started in 2008-09. Certificate courses for farmers to train in application of recent
agricultural technologies are being also run in the University. With a view to meet the emerging
challenges in agricultural economy these programmes are regularly being updated. Besides, in
recent years a number of private colleges and universities in state have also started graduate
programmes in agriculture.

63
Chapter 7
Animal Husbandry, Dairying and Fisheries
In Punjab, animal husbandry is closely interwoven with agriculture and plays an
important role in rural economy. But it received relatively less attention in comparison to crop
production till recently. After achieving self sufficiency in food grain production, government
initiated various steps to usher the white revolution in the country. Livestock is one of the
important components of the primary sector of the economy; contributing about 8.36 per cent of
the Gross State Domestic Product (GSDP) and about 27 percent share in agriculture and allied
activities in 2010-11.
Most of the farm families in Punjab maintain milk animals to produce milk major part of
which is consumed at home. The per capita availability of milk in Punjab is 944 grams per day,
which is quite higher than the national average of 263 grams. The yield of milch animals, though
higher than national average, is not in consonance with the levels attained in developed
countries. The dairy sector in the state is facing problems due to less productivity of animals,
higher cost of production and marketing of the produce. About 5.98 lakh hectare area in the state
is under fodder cultivation, which comes out to be about 7 per cent of gross cropped area of the
state. The fodder crops occupied about 2.91 lakh hectare area in the rabi season, about 2.82 lakh
hectare during kharif season and about 0.15 lakh hectare area cultivated during summer season.
However, daily fodder availability in the state comes to be 10-12 kg per animal, which is quite
lower as compared to the optimum requirement of 40 to 50 kg per animal. Hence, the milch
animals are under nourished and it affects their productivity level (Grover and Kumar, 2011).
The data on livestock population in Punjab is presented in Table 7.1. The figures revealed
that people of state are losing interest in livestock enterprise as livestock population in Punjab
has been decreasing continuously since 1997. It declined tremendously by about 25 per cent per
about 98.57 lakh in 1997 to only 73.65 lakh during 2007. The number has decreased for all the
livestock animals. Due to consumers’ preference towards buffalo milk reason being its high fat
content, Punjab is dominated by buffalo population. While at national level cattle outnumber the
buffaloes, in Punjab buffaloes outnumber the cattle. Share of buffaloes in total livestock
population of state was found out to be about 68 per cent during 2007. The buffalo population
showed decline in number from 61.70 lakh in 1997 to 50.37 lakh in 2007. Similarly, cattle
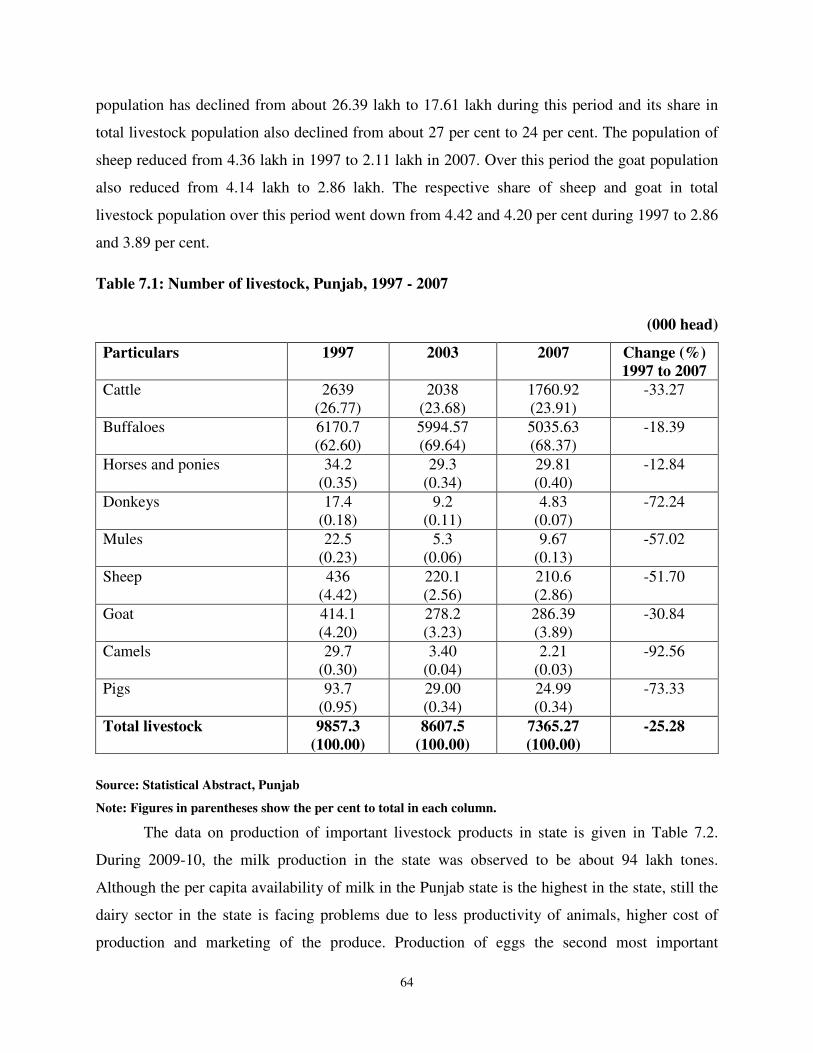
64
population has declined from about 26.39 lakh to 17.61 lakh during this period and its share in
total livestock population also declined from about 27 per cent to 24 per cent. The population of
sheep reduced from 4.36 lakh in 1997 to 2.11 lakh in 2007. Over this period the goat population
also reduced from 4.14 lakh to 2.86 lakh. The respective share of sheep and goat in total
livestock population over this period went down from 4.42 and 4.20 per cent during 1997 to 2.86
and 3.89 per cent.
Table 7.1: Number of livestock, Punjab, 1997 - 2007
(000 head)
Particulars 1997 2003 2007 Change (%)
1997 to 2007
Cattle 2639
(26.77)
2038
(23.68)
1760.92
(23.91)
-33.27
Buffaloes 6170.7
(62.60)
5994.57
(69.64)
5035.63
(68.37)
-18.39
Horses and ponies 34.2
(0.35)
29.3
(0.34)
29.81
(0.40)
-12.84
Donkeys
17.4
(0.18)
9.2
(0.11)
4.83
(0.07)
-72.24
Mules
22.5
(0.23)
5.3
(0.06)
9.67
(0.13)
-57.02
Sheep
436
(4.42)
220.1
(2.56)
210.6
(2.86)
-51.70
Goat
414.1
(4.20)
278.2
(3.23)
286.39
(3.89)
-30.84
Camels
29.7
(0.30)
3.40
(0.04)
2.21
(0.03)
-92.56
Pigs
93.7
(0.95)
29.00
(0.34)
24.99
(0.34)
-73.33
Total livestock 9857.3
(100.00)
8607.5
(100.00)
7365.27
(100.00)
-25.28
Source: Statistical Abstract, Punjab
Note: Figures in parentheses show the per cent to total in each column.
The data on production of important livestock products in state is given in Table 7.2.
During 2009-10, the milk production in the state was observed to be about 94 lakh tones.
Although the per capita availability of milk in the Punjab state is the highest in the state, still the
dairy sector in the state is facing problems due to less productivity of animals, higher cost of
production and marketing of the produce. Production of eggs the second most important
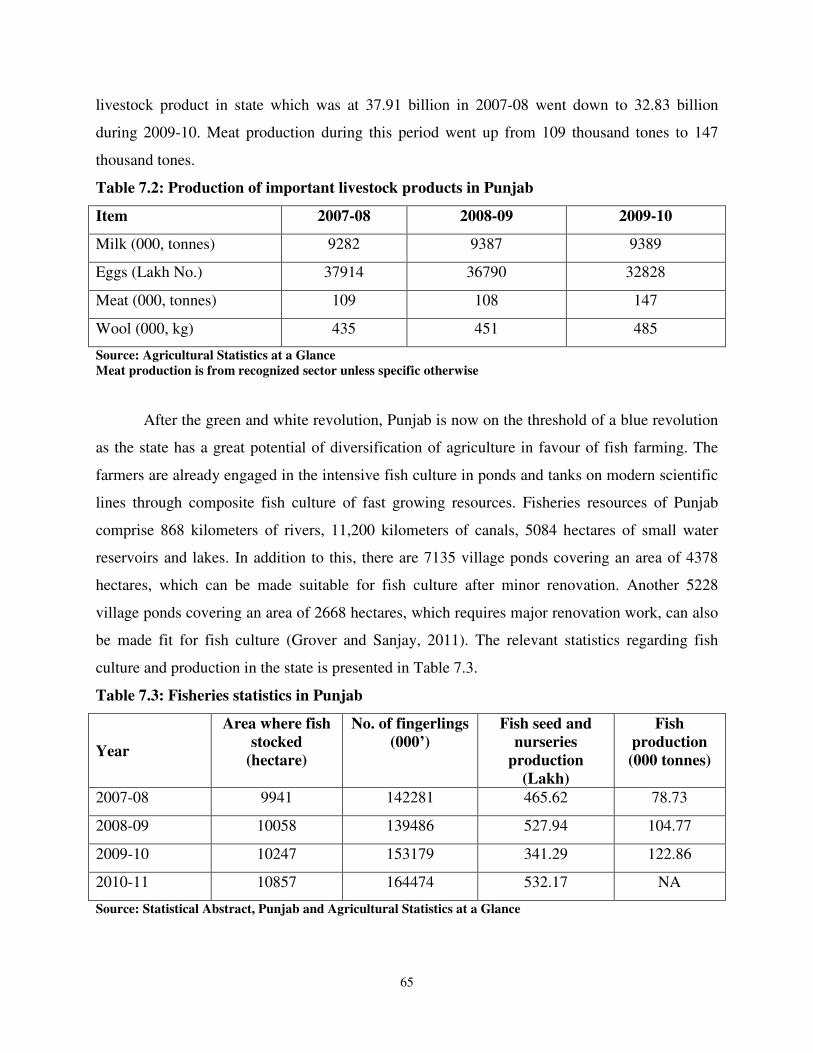
65
livestock product in state which was at 37.91 billion in 2007-08 went down to 32.83 billion
during 2009-10. Meat production during this period went up from 109 thousand tones to 147
thousand tones.
Table 7.2: Production of important livestock products in Punjab
Item 2007-08 2008-09 2009-10
Milk (000, tonnes) 9282 9387 9389
Eggs (Lakh No.) 37914 36790 32828
Meat (000, tonnes) 109 108 147
Wool (000, kg) 435 451 485
Source: Agricultural Statistics at a Glance
Meat production is from recognized sector unless specific otherwise
After the green and white revolution, Punjab is now on the threshold of a blue revolution
as the state has a great potential of diversification of agriculture in favour of fish farming. The
farmers are already engaged in the intensive fish culture in ponds and tanks on modern scientific
lines through composite fish culture of fast growing resources. Fisheries resources of Punjab
comprise 868 kilometers of rivers, 11,200 kilometers of canals, 5084 hectares of small water
reservoirs and lakes. In addition to this, there are 7135 village ponds covering an area of 4378
hectares, which can be made suitable for fish culture after minor renovation. Another 5228
village ponds covering an area of 2668 hectares, which requires major renovation work, can also
be made fit for fish culture (Grover and Sanjay, 2011). The relevant statistics regarding fish
culture and production in the state is presented in Table 7.3.
Table 7.3: Fisheries statistics in Punjab
Year
Area where fish
stocked
(hectare)
No. of fingerlings
(000’)
Fish seed and
nurseries
production
(Lakh)
Fish
production
(000 tonnes)
2007-08 9941 142281 465.62 78.73
2008-09 10058 139486 527.94 104.77
2009-10 10247 153179 341.29 122.86
2010-11 10857 164474 532.17 NA
Source: Statistical Abstract, Punjab and Agricultural Statistics at a Glance
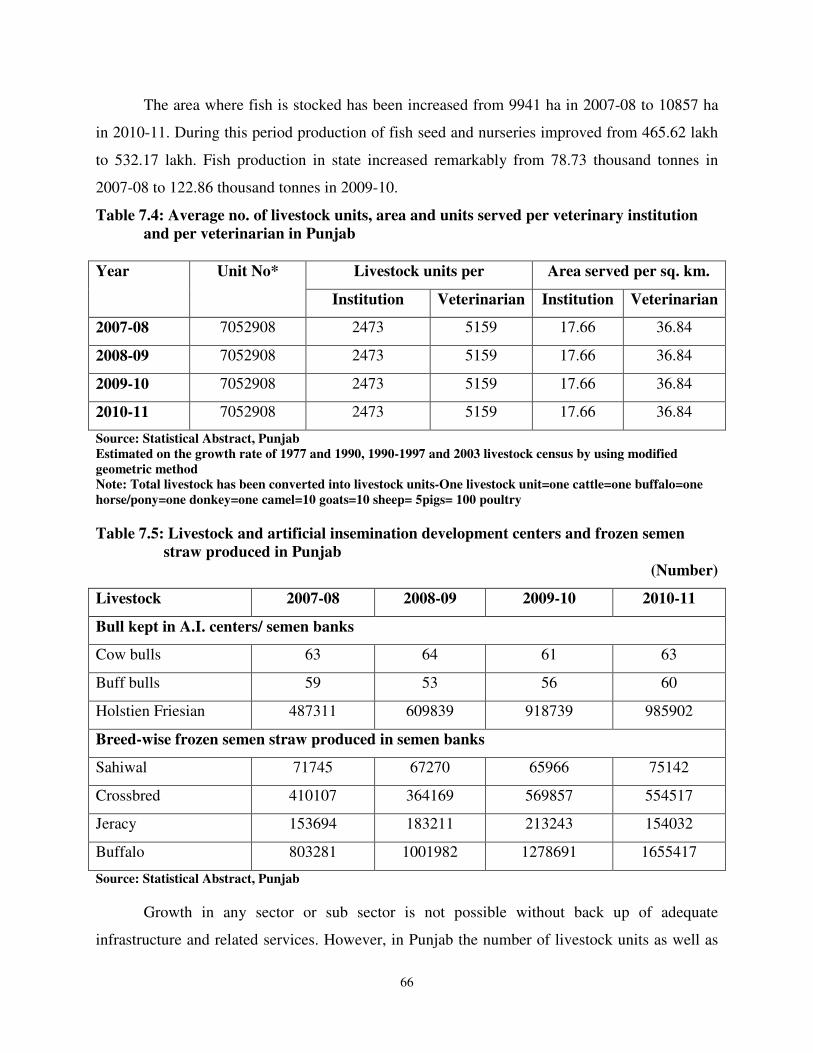
66
The area where fish is stocked has been increased from 9941 ha in 2007-08 to 10857 ha
in 2010-11. During this period production of fish seed and nurseries improved from 465.62 lakh
to 532.17 lakh. Fish production in state increased remarkably from 78.73 thousand tonnes in
2007-08 to 122.86 thousand tonnes in 2009-10.
Table 7.4: Average no. of livestock units, area and units served per veterinary institution
and per veterinarian in Punjab
Year Unit No* Livestock units per Area served per sq. km.
Institution Veterinarian Institution Veterinarian
2007-08 7052908 2473 5159 17.66 36.84
2008-09 7052908 2473 5159 17.66 36.84
2009-10 7052908 2473 5159 17.66 36.84
2010-11 7052908 2473 5159 17.66 36.84
Source: Statistical Abstract, Punjab
Estimated on the growth rate of 1977 and 1990, 1990-1997 and 2003 livestock census by using modified
geometric method
Note: Total livestock has been converted into livestock units-One livestock unit=one cattle=one buffalo=one
horse/pony=one donkey=one camel=10 goats=10 sheep= 5pigs= 100 poultry
Table 7.5: Livestock and artificial insemination development centers and frozen semen
straw produced in Punjab
(Number)
Livestock 2007-08 2008-09 2009-10 2010-11
Bull kept in A.I. centers/ semen banks
Cow bulls 63 64 61 63
Buff bulls 59 53 56 60
Holstien Friesian 487311 609839 918739 985902
Breed-wise frozen semen straw produced in semen banks
Sahiwal 71745 67270 65966 75142
Crossbred 410107 364169 569857 554517
Jeracy 153694 183211 213243 154032
Buffalo 803281 1001982 1278691 1655417
Source: Statistical Abstract, Punjab
Growth in any sector or sub sector is not possible without back up of adequate
infrastructure and related services. However, in Punjab the number of livestock units as well as

67
area served per institution and veterinarian has not been improved since 2007-08 (Table 7.4).
Information on breed-wise frozen semen straw produced in semen banks also reveals that except
for buffalo there is no significant improvement for other breeds (Table 7.5).
68
Chapter 8
Post harvest Management and Value Addition
Developing countries have long promoted post harvest management and value added
processing of agricultural output as a path of industrialization. With increase in per capita
income and urbanization leading to increase in demand for high quality processed and packaged
foods the process of value adding to agricultural production and fostering of farm non-farm
linkages starts gathering momentum which in turn generates higher income and employment for
the farm families, besides making agriculture a more effective contributor to industrial growth
(Sarkar, 1997). Agro based industry refers to the subset of manufacturing that processes raw
materials obtained from agriculture and its allied sectors such as animal husbandry, forestry and
logging and intermediate products derived from other industries such as semi processed hides
and skins for manufacturing leather and leather products and edible oils for manufacturing
hydrogenated oil. The value adding processes ranges from simple preservation like drying,
grading and storage of output to production of high value products such as manufacturing of
textiles, paper, rubber etc., through modern capital intensive methods (Chadha and Sahu, 2003).
Punjab, despite being the leading producer of food grains is way behind in value addition
industry to agricultural output. The state government has taken many steps to diversify the
Punjab agriculture toward the production of high value crops. However, the high value crops like
fruits and vegetables are highly perishable in nature and the farmers have to decide immediately
at the time of harvest to dispose of the produce. Due to lack of adequate facilities for post harvest
handling of high value crops like grading and packing houses, cold storages etc. diversification
initiates in state met with limited success. The processing plants established in the area procure
the produce from a few contract farmers only and the majority has to depend upon the markets
where the prices are highly volatile in nature whenever there is glut in the market and a slight
delay in disposal may lead to serious post harvest losses to the produce. Both quantitative and
qualitative losses of extremely variable magnitude occur at all stages in the post harvest system
from harvesting, through handling, storage, processing and marketing to final delivery to the
consumer. The principal causes of these losses are physiological deterioration due to high
temperature, low atmospheric humidity and damage due to physical injury, diseases and pests.
Post harvest losses range between 15-35 per cent for different types of agricultural
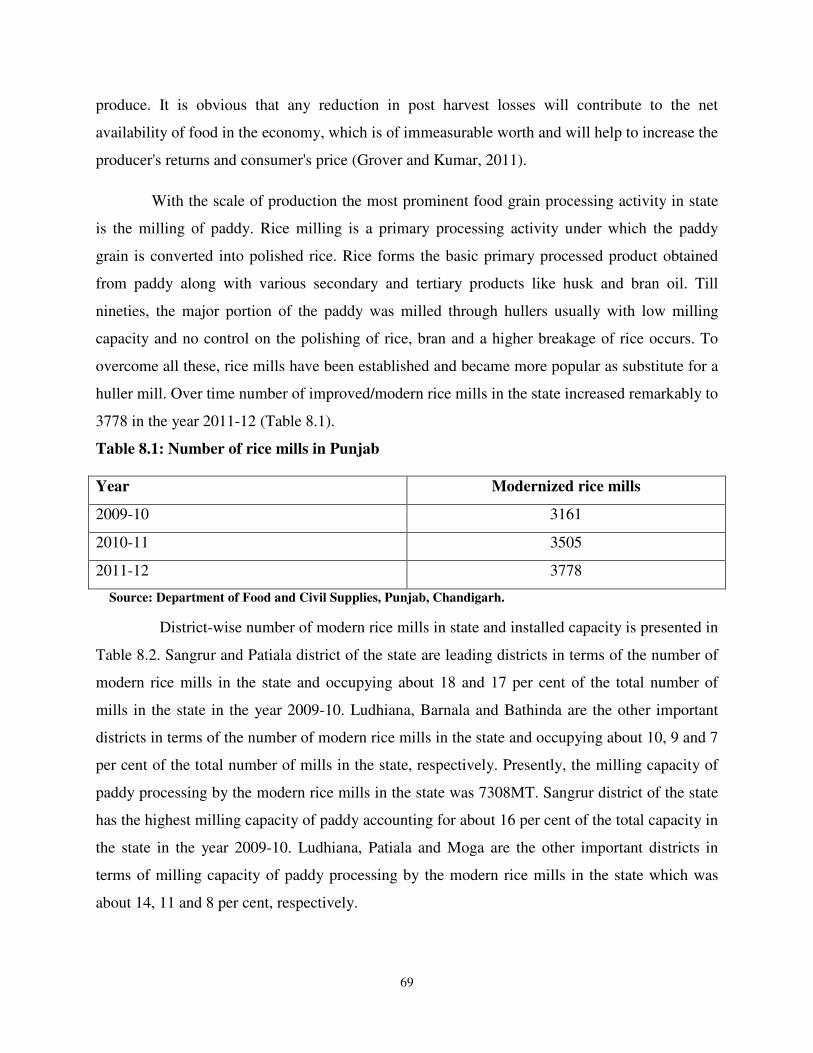
69
produce. It is obvious that any reduction in post harvest losses will contribute to the net
availability of food in the economy, which is of immeasurable worth and will help to increase the
producer's returns and consumer's price (Grover and Kumar, 2011).
With the scale of production the most prominent food grain processing activity in state
is the milling of paddy. Rice milling is a primary processing activity under which the paddy
grain is converted into polished rice. Rice forms the basic primary processed product obtained
from paddy along with various secondary and tertiary products like husk and bran oil. Till
nineties, the major portion of the paddy was milled through hullers usually with low milling
capacity and no control on the polishing of rice, bran and a higher breakage of rice occurs. To
overcome all these, rice mills have been established and became more popular as substitute for a
huller mill. Over time number of improved/modern rice mills in the state increased remarkably to
3778 in the year 2011-12 (Table 8.1).
Table 8.1: Number of rice mills in Punjab
Year Modernized rice mills
2009-10 3161
2010-11 3505
2011-12 3778
Source: Department of Food and Civil Supplies, Punjab, Chandigarh.
District-wise number of modern rice mills in state and installed capacity is presented in
Table 8.2. Sangrur and Patiala district of the state are leading districts in terms of the number of
modern rice mills in the state and occupying about 18 and 17 per cent of the total number of
mills in the state in the year 2009-10. Ludhiana, Barnala and Bathinda are the other important
districts in terms of the number of modern rice mills in the state and occupying about 10, 9 and 7
per cent of the total number of mills in the state, respectively. Presently, the milling capacity of
paddy processing by the modern rice mills in the state was 7308MT. Sangrur district of the state
has the highest milling capacity of paddy accounting for about 16 per cent of the total capacity in
the state in the year 2009-10. Ludhiana, Patiala and Moga are the other important districts in
terms of milling capacity of paddy processing by the modern rice mills in the state which was
about 14, 11 and 8 per cent, respectively.

70
Table 8.2: District wise number of modern rice mills, 2009-10, Punjab
District Number %age Capacity
(tonnes)
%age
Gurdaspur 77 2.40 206.90 2.8
Amritsar 33 1.00 61.00 0.8
Tarntaran 33 1.00 83.00 1.1
Kapurthala 74 2.30 263.00 3.5
Jalandhar 63 2.00 376.00 5.0
SBS Nagar 37 1.20 133.50 1.8
Hoshiarpur 40 1.30 101.25 1.4
Ropar 32 1.00 112.00 1.5
SAS Nagar 21 0.70 44.50 0.6
Ludhiana 306 9.70 1025.69 13.7
Ferozepur 140 4.40 391.00 5.2
Faridkot 100 3.20 411.00 5.5
Muktsar 136 4.30 217.00 2.9
Moga 166 5.30 628.50 8.4
Bathinda 231 7.30 411.00 5.5
Mansa 192 6.10 274.50 3.7
Sangrur 563 17.80 1161.25 15.5
Barnala 268 8.50 546.00 7.3
Patiala 526 16.60 801.25 10.7
Fatehgarh 123 3.90 232.00 3.1
Punjab\ 3161 100.00 7308.84 100.0
Source: Department of Food and Civil Supplies, Punjab, Chandigarh
Table 8.3: Cane crushed and sugar produced by sugar mills in Punjab
(000, tonnes)
Year Daily Crushing capacity Cane crushed
(Supply)
% of capacity
utilization
2007-08 9377.40 5760.5 61.42
2008-09 9377.40 2603.5 27.76
2009-10 9377.40 2112.0 22.52
2010-11 10502.40 3433.2 32.69
Source: Statistical Abstract, Punjab
Note: Number of working days of sugar mills assumed to be 150 in a year

71
Sugar is also one of the largest agro industries in state with daily crushing capacity of
105.02 lakh tones during 2010-11 (Table 8.3). However, due to declined interest of farmers in
sugarcane cultivation and hence decline in cane supply, per cent capacity utilization is decreasing
day by day. The per cent capacity utilization in state sugar industry has been gone down from
about 60 per cent in 2007-08 to only about 33 per cent in 2010-11.
Cotton is the first largest agro based manufacturing industry in India with value addition
of at least 100 per cent in successive stages of processing. Cotton after spinning to yarn is woven
to fabrics, processed and converted to made ups or readymade garments. The value addition by
converting cotton to readymade garments is impressive through export of cotton products
(Chengappa, 2004). The number of spinning mills, composite mills, spindles, roster and looms
installed in textile industry of Punjab is given in 8.4. Production of yarn, cloth in Cotton Textile
Mills and production of traditional Khadi in Punjab is given in Table 8.5.
Table 8.4: Cotton textile mills, spindles and looms in Punjab
(Number)
Particulars 2007-08 2008-09 2009-10 2010-11 2011-12
(April-Nov.)
Spinning mills 109 119 119 127 127
Composite mills 4 4 4 6 8
Spindles installed (000) 1950 2199 2353 3116 3113
Roters installed 54412 61024 61024 72996 75016
Looms installed 1241 1090 1090 1269 1359
Source: Statistical Abstract, Punjab
The data includes small scale industries
Table 8.5: Production of yarn, cloth in cotton textile mills and production of traditional khadi in
Punjab
Year
Total yarn
(000 kg.)*
Total cloth/
M.sq.mtr
Production of traditional
khadi
(000’ metre)**
2007-08 489617 206.51 913
2008-09 545482 220.30 740
2009-10 - - 627
Source: Statistical Abstract, Punjab
Total cloth includes cloth production by mill sector and exclusive wearing units
Includes production of yarn by SSI units
Includes khadi sewa sangh Jalandhar also
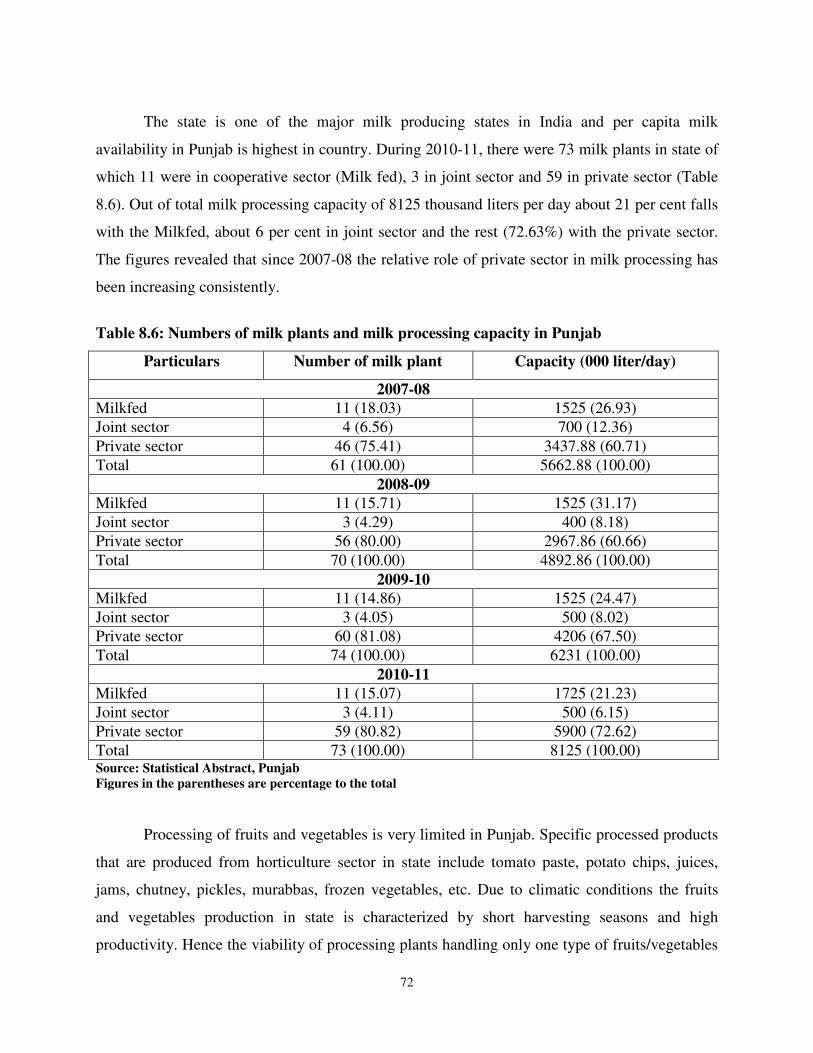
72
The state is one of the major milk producing states in India and per capita milk
availability in Punjab is highest in country. During 2010-11, there were 73 milk plants in state of
which 11 were in cooperative sector (Milk fed), 3 in joint sector and 59 in private sector (Table
8.6). Out of total milk processing capacity of 8125 thousand liters per day about 21 per cent falls
with the Milkfed, about 6 per cent in joint sector and the rest (72.63%) with the private sector.
The figures revealed that since 2007-08 the relative role of private sector in milk processing has
been increasing consistently.
Table 8.6: Numbers of milk plants and milk processing capacity in Punjab
Particulars Number of milk plant Capacity (000 liter/day)
2007-08
Milkfed 11 (18.03) 1525 (26.93)
Joint sector 4 (6.56) 700 (12.36)
Private sector 46 (75.41) 3437.88 (60.71)
Total 61 (100.00) 5662.88 (100.00)
2008-09
Milkfed 11 (15.71) 1525 (31.17)
Joint sector 3 (4.29) 400 (8.18)
Private sector 56 (80.00) 2967.86 (60.66)
Total 70 (100.00) 4892.86 (100.00)
2009-10
Milkfed 11 (14.86) 1525 (24.47)
Joint sector 3 (4.05) 500 (8.02)
Private sector 60 (81.08) 4206 (67.50)
Total 74 (100.00) 6231 (100.00)
2010-11
Milkfed 11 (15.07) 1725 (21.23)
Joint sector 3 (4.11) 500 (6.15)
Private sector 59 (80.82) 5900 (72.62)
Total 73 (100.00) 8125 (100.00) Source: Statistical Abstract, Punjab
Figures in the parentheses are percentage to the total
Processing of fruits and vegetables is very limited in Punjab. Specific processed products
that are produced from horticulture sector in state include tomato paste, potato chips, juices,
jams, chutney, pickles, murabbas, frozen vegetables, etc. Due to climatic conditions the fruits
and vegetables production in state is characterized by short harvesting seasons and high
productivity. Hence the viability of processing plants handling only one type of fruits/vegetables

73
becomes limited and ultimately becomes uneconomical. Punjab Agro Juices Limited (PAJL) was
established in 2006 with aim to add value to horticultural crops and provide opportunity to
farmers for selling their produce at competitive basis. Two major plants (Hoshiarpur and
Abohar) which can handle processing of various fruits and vegetables, commissioned by PAJL
had started commercial production during 2008. These processing plants can handle pulp as well
as store all the concentrates and single strength juices at the facility. In addition both of the plants
are equipped with facilities of normal cold storage and deep freezer. Other notable high tech
agro/food industries involved in value addition to agricultural production in state are Glaxo
Smithkleim at Nabha (Patiala), Nestle at Moga, Nijjar Agro Foods at Jandiala and Pepsico agro
Foods at Zahoora (Hoshiarpur).
Overall despite being the leading agrarian state of country, Punjab is way behind in food
processing/value addition industry. The agro industry in state is limited to grain processing like
rice milling, flour mills, oil mills and cotton ginning.
74
REFERENCES
Chadha G K and Sahu P P (2003) Small scale agro-industry in India: Low productivity is its
Achilles heel. Indian Journal of Agricultural Economics 58(3):518-543.
Chengappa P G (2004) Emerging trends in agro-processing sector, Indian Journal of
Agricultural Economics. 59(1):55-74.
Deshpande R S, Mehta P and Shah K (2007) Crop diversification and agricultural labour in
India. Indian Journal of Labour Economics 50(4):597-610.
Government of India, Agricultural Statistics at a Glance, Various Issues. Ministry of
Agriculture, New Delhi.
Government of Punjab, Statistical Abstract, Various Issues. Economic Advisor to Government,
Punjab, Chandigarh.
Government of Punjab, Agriculture at a Glance, Various Issues. Department of Agriculture,
Chandigarh.
Grover D K and Kumar S (2011) State of Punjab Agriculture. Agro Economic Research Centre,
PAU, Ludhiana.
Grover D K and Kumar S (2011) Economics of Production, Processing and Marketing of Fodder
Crops in Punjab. Agro Economic Research Centre, PAU, Ludhiana.
Haque T and Sharma S (2004) Trends in crop output and employment in India. Agricultural
Situation in India 39(5):273-280.
Sarkar S (1997) Growth of agro-industry in India and its inter-relationship with agriculture.
Artha Vijana 39(2).
Shergill H S (2011) Role of cooperative institutions in agricultural credit in Punjab: Present
position and strategy for further improvement. Institute for Development and
Communication (IDC), Chandigarh.
Sidhu H S (2002) Crisis in agrarian economy in Punjab-some urgent steps. Economic and
Political Weekly 37(30): 3132-38.