Embed Size (px)
Citation preview

Bureau of Justice Statistics
U.S. Department of Justice Office of Justice Programs
State Court Sentencingof Convicted Felons, 1992
In State courts:
Felony sentencing
Felons convicted
Felons sentenced to probation
Felony case processing
Regional variation in adjudication and sentencing
Trends in drug trafficking
U.S. Department of JusticeOffice of Justice ProgramsBureau of Justice Statistics
State Court Sentencingof Convicted Felons, 1992
By Patrick A. Langan, Ph.D.Statistician, Bureau of Justice Statistics
and
Robyn L. CohenStatistician, Bureau of Justice Statistics
May 1996, NCJ-152696
U.S. Department of JusticeBureau of Justice Statistics
Jan M. Chaiken, Ph.D.Director
This report was prepared by Patrick A. Langan and Robyn L. Cohen, with assistance from Jodi M. Brown, of the Bureau of Justice Statistics. IdaHines and Dorothea Proctor assistedwith verification. Tom Hester and Priscilla Middleton edited the report.Priscilla Middleton, Ida Hines, andJayne E. Robinson produced the re-port. Marilyn Marbrook, assisted byYvonne Boston, supervised publicationof this report.
Data collection and processing weredone by Mark Cunniff and RobertCushman of the National Associationof Criminal Justice Planners and bythe staff of the U.S. Bureau of theCensus. That staff included LatriceBrogsdale-Davis, Charlene Sebold,Martha Greene, Henrietta Herrin, andVictoria Campbell, under the supervi-sion of Stephanie Brown, of the Gov-ernments Division; Denise Turner ofthe Field Division; and Carma Hogueof the Economic Statistical Methodsand Procedures Division.
Data utilized in this report are availablefrom the National Archive of CriminalJustice Data at the University of Michi-gan, 1-800-999-0960. The data setsare archived as the National JudicialReporting Program, 1992 ICPSR#6509.
The data and the report, as well as others from the Bureau of Justice Statistics, are available through theInternet
http://www.ojp.usdoj.gov/bjs/
ii State Court Sentencing of Convicted Felons, 1992

Trends in felony sentencing in the United States
From 1988 to 1992 the volume of fel-ony convictions rose 34%. The great-est increases in the number of con-victions were for aggravated assault(up 57%) and drug trafficking (up53%). The number of convictions formurder, rape, and robbery each roseabout 39% (page 2).
Despite the relatively large increase inconvictions, processing was not slowerin 1992 than in 1988. In both yearsaverage elapsed time from arrest tosentencing was around 7 months(page 2).
The proportions of felons sentenced to incarceration or probation in 1992were generally unchanged from 1988.Prison sentences accounted for 44% of felony sentences in both years (page 2).
Trends in drug trafficking
In 1986 drug traffickers accountedfor 11% of all entries to State prisons. In 1988 that number grew to 16% andin 1990 to 22%. In 1992 it stayed at about that level, 21% (table 6.2).
In 1986 drug traffickers were 1 inevery 8 persons entering prison and in1992, 1 in every 5 (table 6.2).
From 1986 to 1990 a growing percent-age of convicted drug traffickers re-ceived a prison sentence. Since then,the percentage has risen only slightly.
Felony sentences in State courts
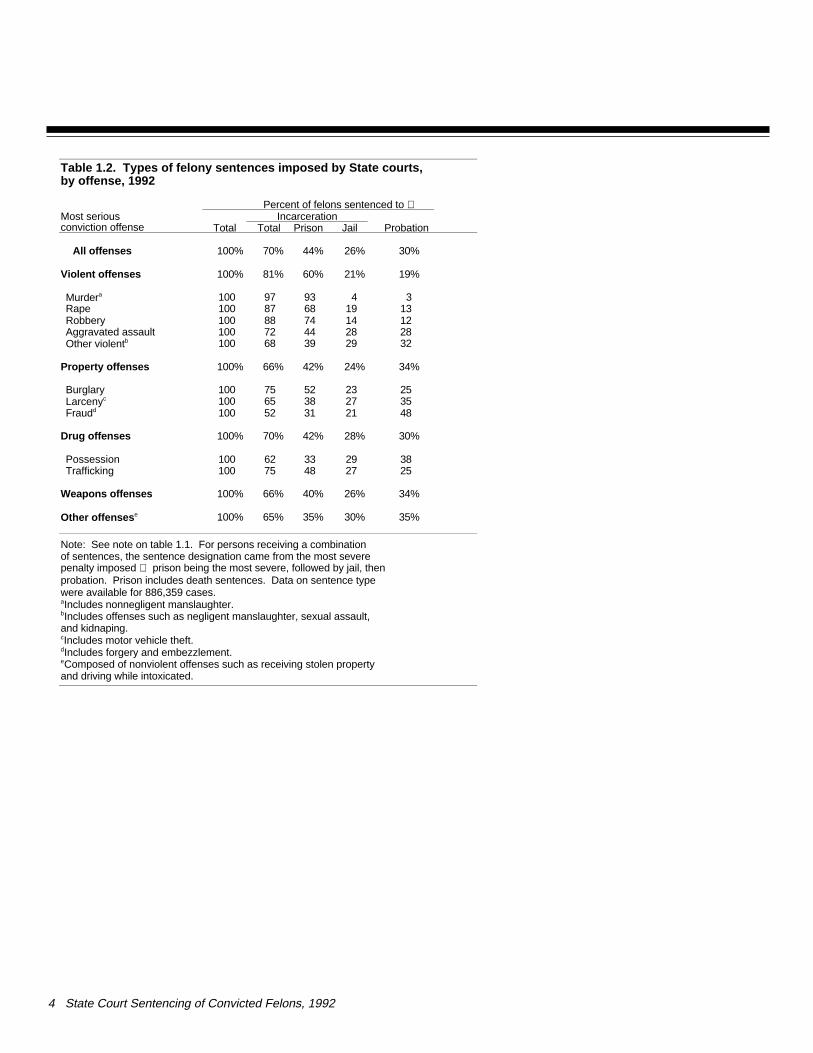
In 1992 State courts convicted894,000 persons of murder, rape, rob-bery, drug trafficking, and other felonyoffenses (table 1.1). Courts sentenced44% of them to prison, 26% to jail(usually for a year or less), and 30% to probation (table 1.2).
Drug traffickers (19%) and drug pos-sessors (12%) together made up 31%of felons convicted in State courts in 1992. Violent offenders murder-ers (1%), rapists (2%), robbers (6%),assaulters (7%), and others convictedof a violent crime (2%) togethermade up 18%. Burglars (13%) andlarcenists (13%) made up most ofthe rest (table 1.1).
State courts sentenced to Stateprison 60% of the felons convicted of a violent offense, 42% convicted of a property offense, 42% convicted of a drug offense, and 40% of thosefelons convicted of a weapons offensein 1992 (table 1.2).
Regional variation in adjudicationand sentencing
State courts in the South sentencedto a State prison 57% of the felonsthey convicted in 1992. That com-pares to 41% in State courts else-where (table 5.2).
Felony prison sentences were longeron average in the South than else-where. The average State prison sen-tence in the South in 1992 was 94months (about 8 years), compared to57 months (about 5 years) outside theSouth (table 5.3).
Felons sentenced to probation
State courts sentenced to probationan estimated 494,000 convicted felons(table 3.1).
Nationwide, probation sentences hadan average length of about 3¾ years(table 3.3).
Profile of felons convicted
The average age of felons convicted in 1992 was 30 years (table 2.3).
Of the approximately 894,000 felonsconvicted in State courts nationwide,777,000 (87%) were men, and116,000 (13%) were women (table2.2). Approximately 20% of the menand 10% of the women were convictedof a violent felony that year (table 2.2).
Among all felons convicted nation-wide, about 465,000 (52%) were white,420,000 (47%) were black, and an es-timated 9,000 (1%) were of otherraces (American Indian, Alaska Na-tive, Asian, or Pacific Islander) (table2.1).
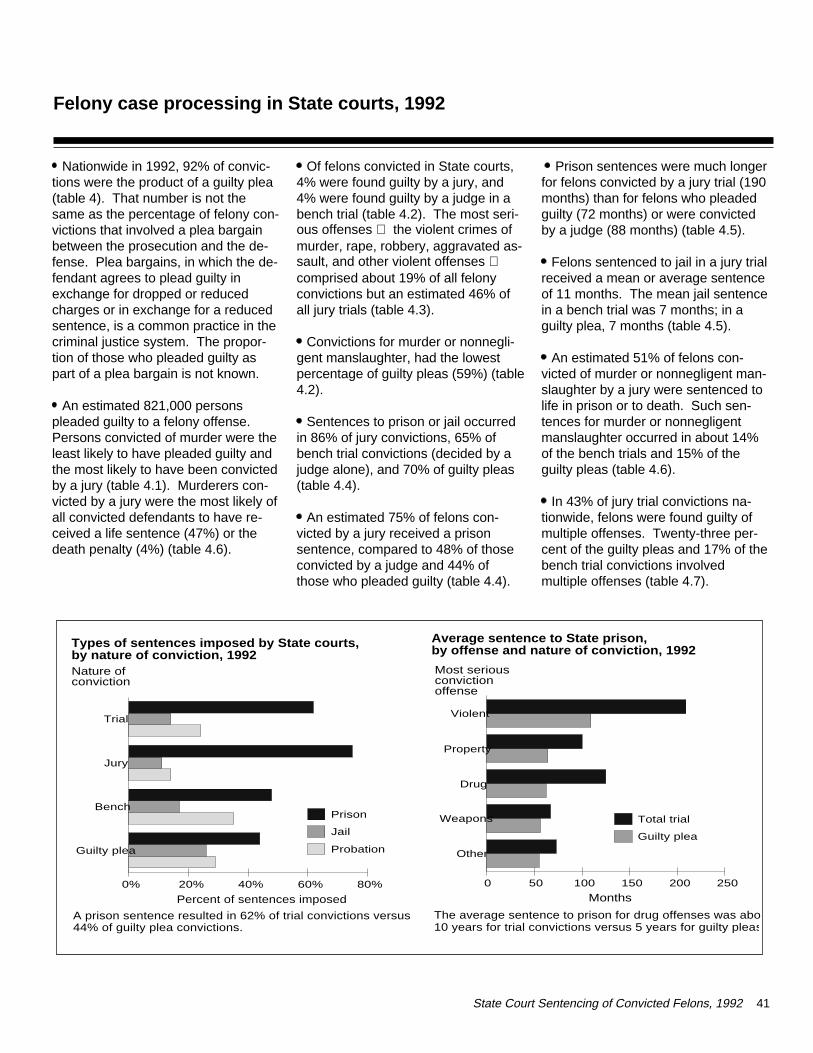
Felony case processing
An estimated 75% of felons con-victed by a jury received a prison sen-tence, compared to 48% of thoseconvicted by a judge and 44% of thosewho pleaded guilty (table 4.4). Prison sentences were much longer
for felons convicted by a jury trial (190months) than for felons who pleadedguilty (72 months) or were convicted by a judge (88 months) (table 4.5).
In 43% of jury trial convictions na-tionwide, felons were found guilty ofmultiple offenses. Twenty-three per-cent of the guilty pleas and 17% of thebench trial convictions involved multi-ple offenses (table 4.7).
The average time from arrest to con-viction was less than 6 months. Thelongest average time was for murder or nonnegligent manslaughter, about10½ months, and the shortest, almost 5 months, for burglary and larceny (table 4.9).
Cases decided by juries had a meanelapsed time of about 10 months;those disposed by guilty plea or abench trial, a mean of 6¾ months (table 4.11).
State Court Sentencing of Convicted Felons, 1992 iii
Highlights
The National Judicial Reporting Program 1
Felony sentences in State courts, 1992 2
Profile of felons convicted in State courts, 1992 13
Felons sentenced to probation in State courts, 1992 29
Felony case processing in State courts, 1992 41
Regional variation in adjudication and sentencing, 1992 55
Trends in drug trafficking, 1986-94 59
Methodology 62
Figures
Average sentence to Stateprison and estimated timeto be served for a felony, 1992 2
Offense distribution of personsconvicted of a felony in State courts, by race, 1992 13
Average sentence to Stateprison for a felony imposedby State courts, by offenseand race, 1992 13
Average probation sentence for felons convicted in State courts, 1992 29
Offenses of felons sentenced to probation, by sex, 1992 29
Types of sentences imposedby State courts, by natureof conviction, 1992 41
Average sentence to Stateprison, by offense and nature of conviction, 1992 41
Tables
Felony sentences in State courts, 1992
1.1 Estimated numberof felony convictions 3
1.2 Types of felonysentences imposed 4
1.3 Mean and median sentence lengths for felony sentences imposed 5
1.4 Estimated percent offelons sentenced to life 6
1.5 Estimated time to beserved in State prison 7
1.6 Number of offenses for which convicted andand sentenced in 1992 8
1.7 Percent sentenced to prisonby number of offenses for which convicted and sentenced in 1992 9
1.8 Mean sentence lengths for felony sentences imposed, bynumber of conviction offenses 10
1.9 Felons sentencedto additional penalty 11
Profile of felons convicted in State courts, 1992
2.1 Sex, race, and age of persons convicted of felonies, by offense 15
2.2 Offenses of felons convicted, by sex, race, and age 16
2.3 Average age of convicted felons 17
2.4 Types of sentences imposed, by sex of felons 18
2.5 Types of sentences imposed, by race of felons 19
2.6 Mean sentence lengths for felony sentences imposed, by sex of felons 20
2.7 Mean sentence lengths for felony sentences imposed, by race of felons 21
State Court Sentencing of Convicted Felons, 1992 v
Contents
2.8 Offenses of felons sentenced to incarceration or prison, by sex and race 22
2.9 Offenses of felons sentenced to jail or probation, by sex and race 23
2.10 Percent of all convicted felonssentenced to incarceration or prison, by sex and race 24
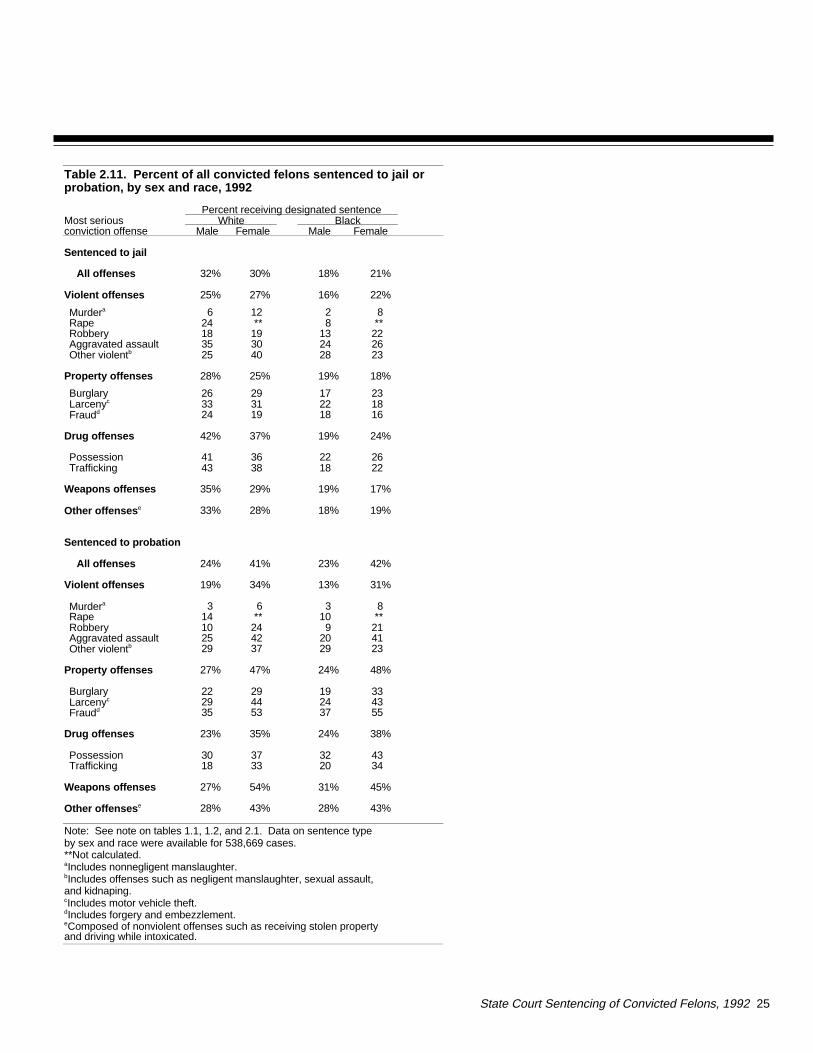
2.11 Percent of all convicted felons sentenced to jail orprobation, by sex and race 25
2.12 Mean State felony sentence lengths, by sex, race, and type of felony sentences 26
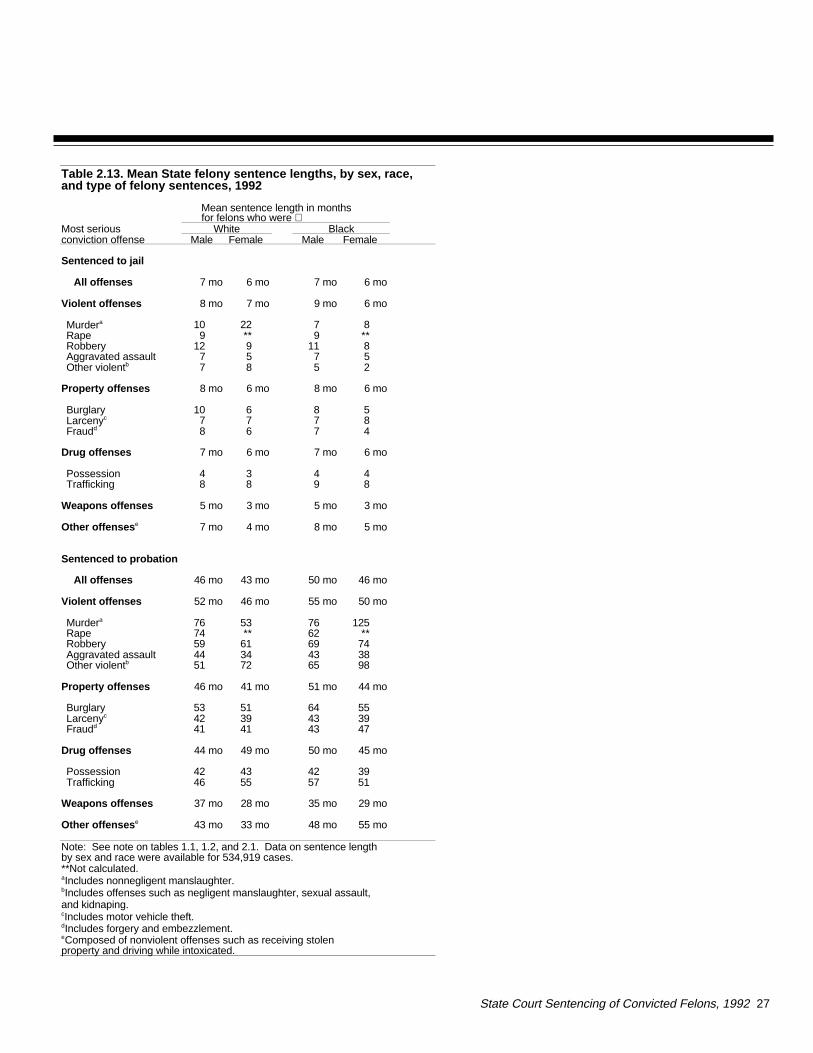
2.13 Mean State felony sentence lengths, by sex, race, and type of felony sentences 27
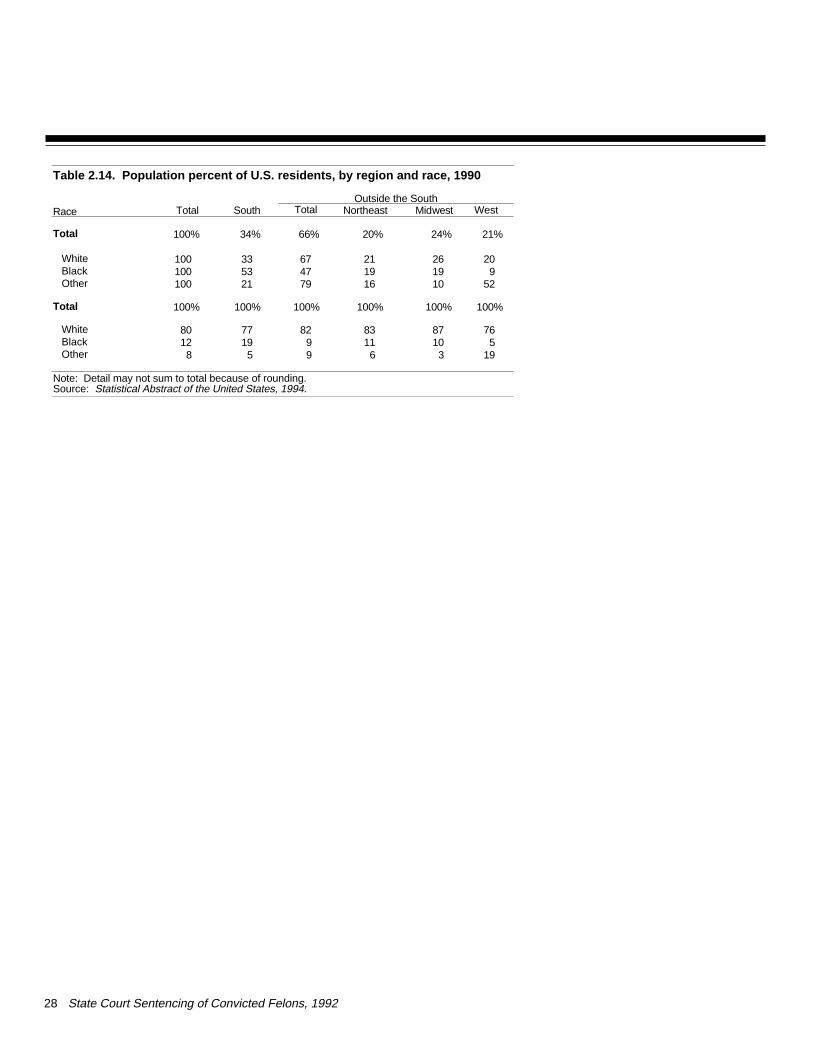
2.14 Population percent of U.S. residents, by region and race 1990 28
Felons sentenced to probationin State courts, 1992
3.1 Estimated number of felony convictions, by type of sentence 30
3.2 Felony convictions, by type ofsentence to probation or incarceration 31
3.3 Average probation sentencefor felons convicted 32
3.4 Average State court sentence to incarceration for felony probationers and nonprobationers 33
3.5 Number of conviction offenses of felons sentenced to probation, by most serious conviction offense 34
3.6 Sex of felons sentenced to probation or nonprobation,by most serious conviction offense 35
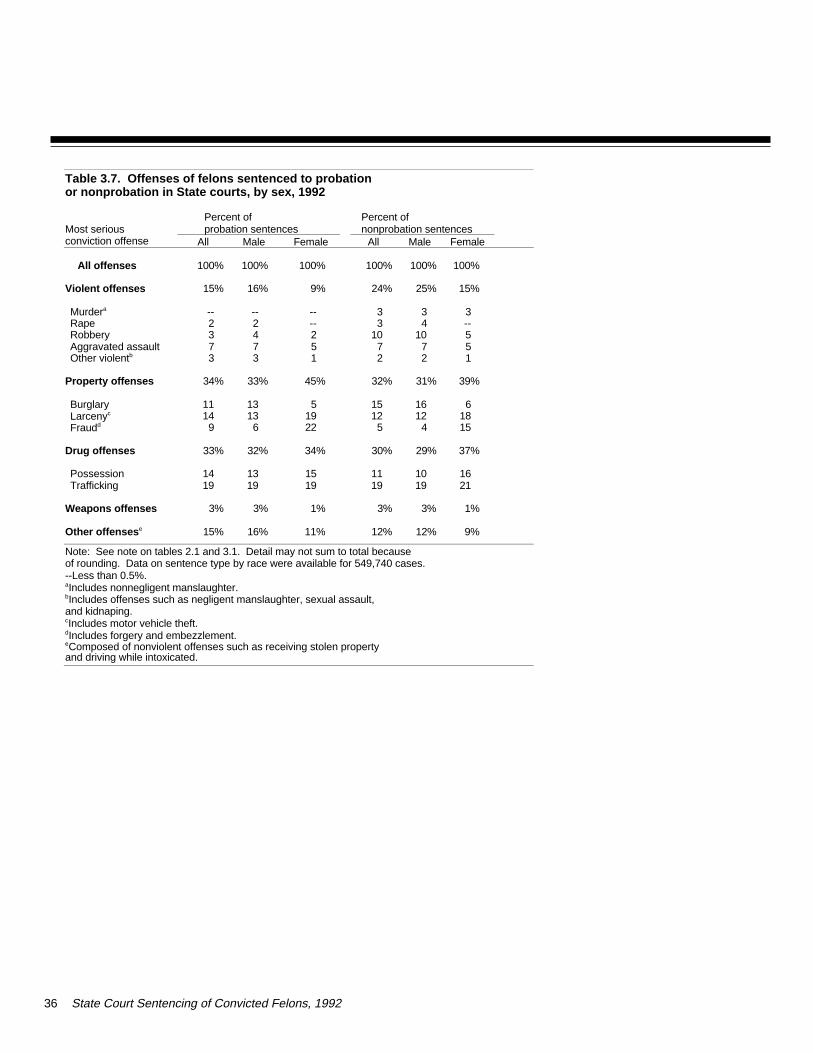
3.7 Offenses of felons sentenced to probation or nonprobation, by sex 36
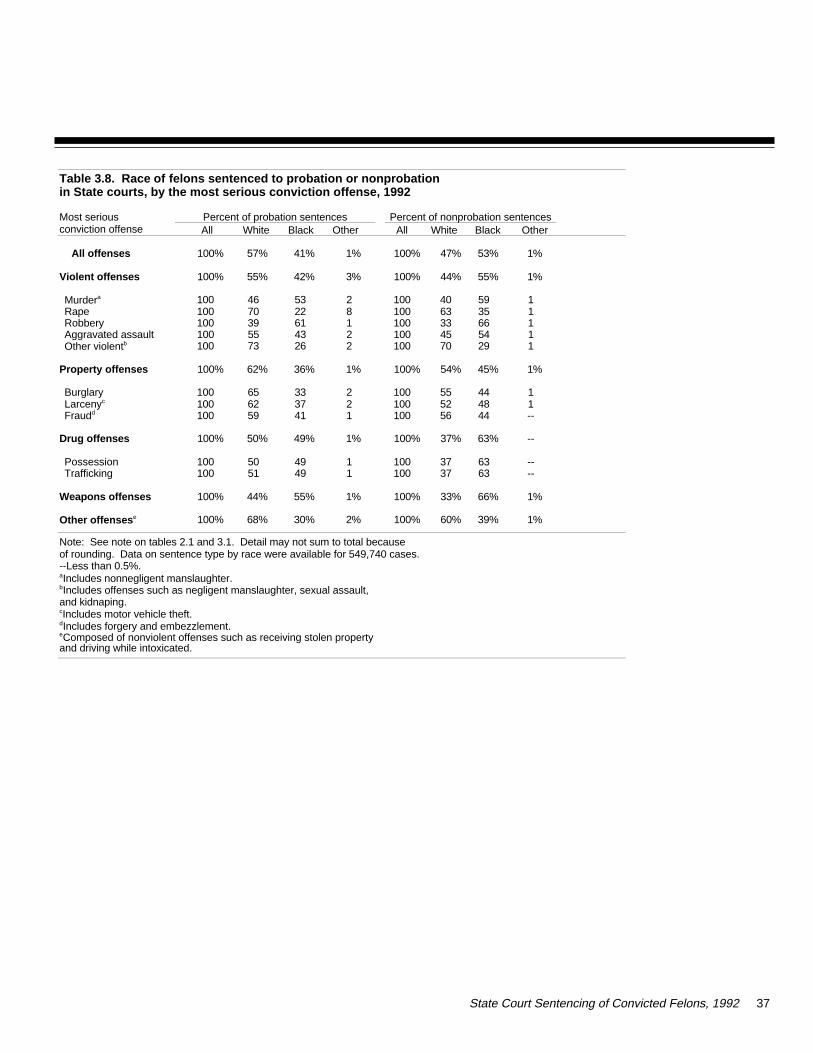
3.8 Race of felons sentenced to probation or nonprobation,by most serious conviction offense 37
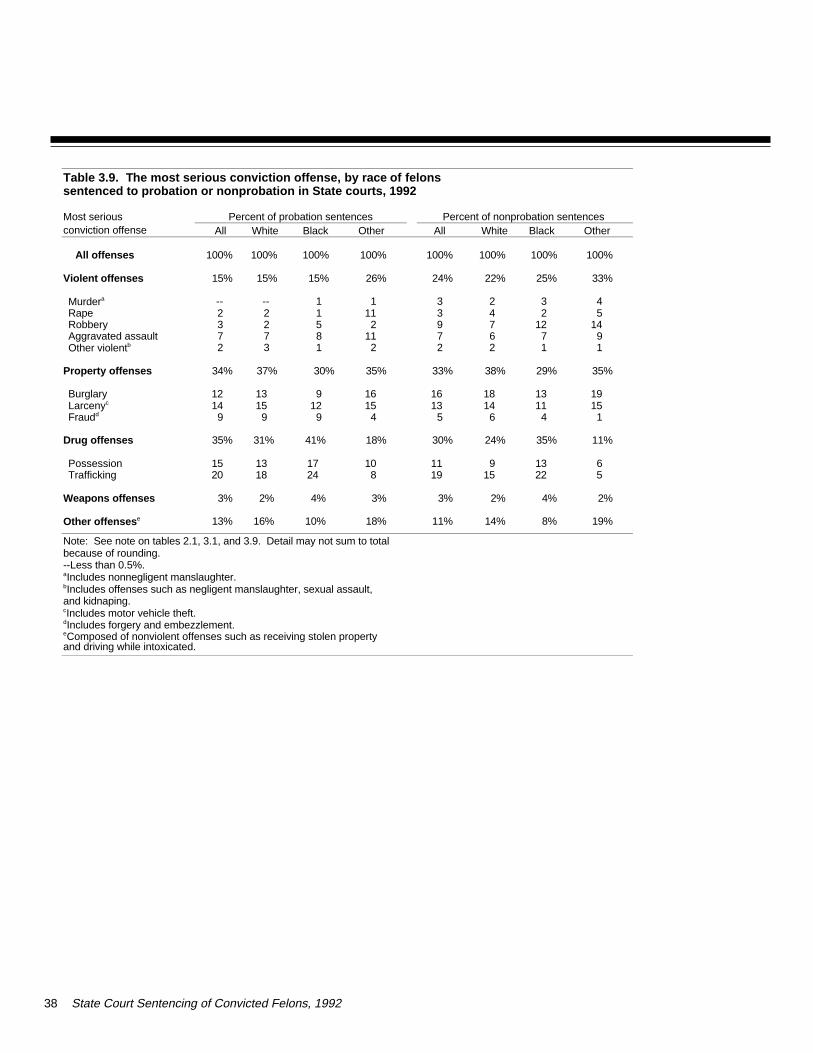
3.9 The most serious conviction offense, by race of felons sentenced to probation or nonprobation 38
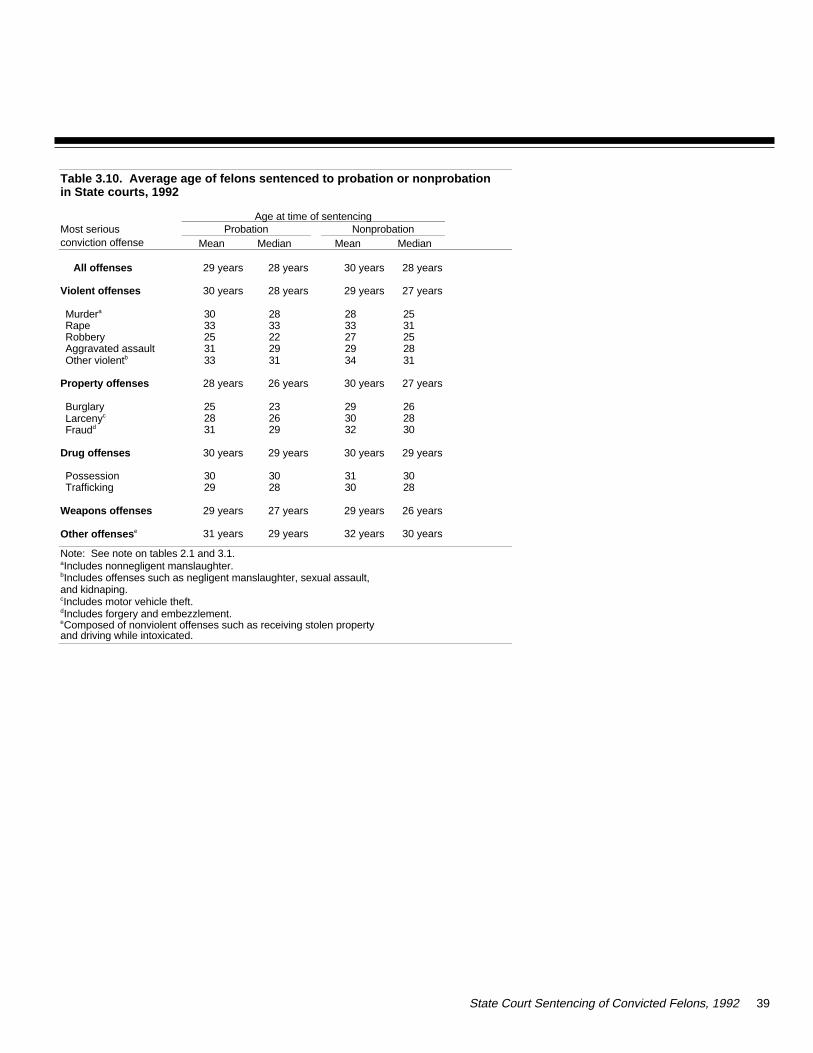
3.10 Average age of felons sentenced to probation or nonprobation 39
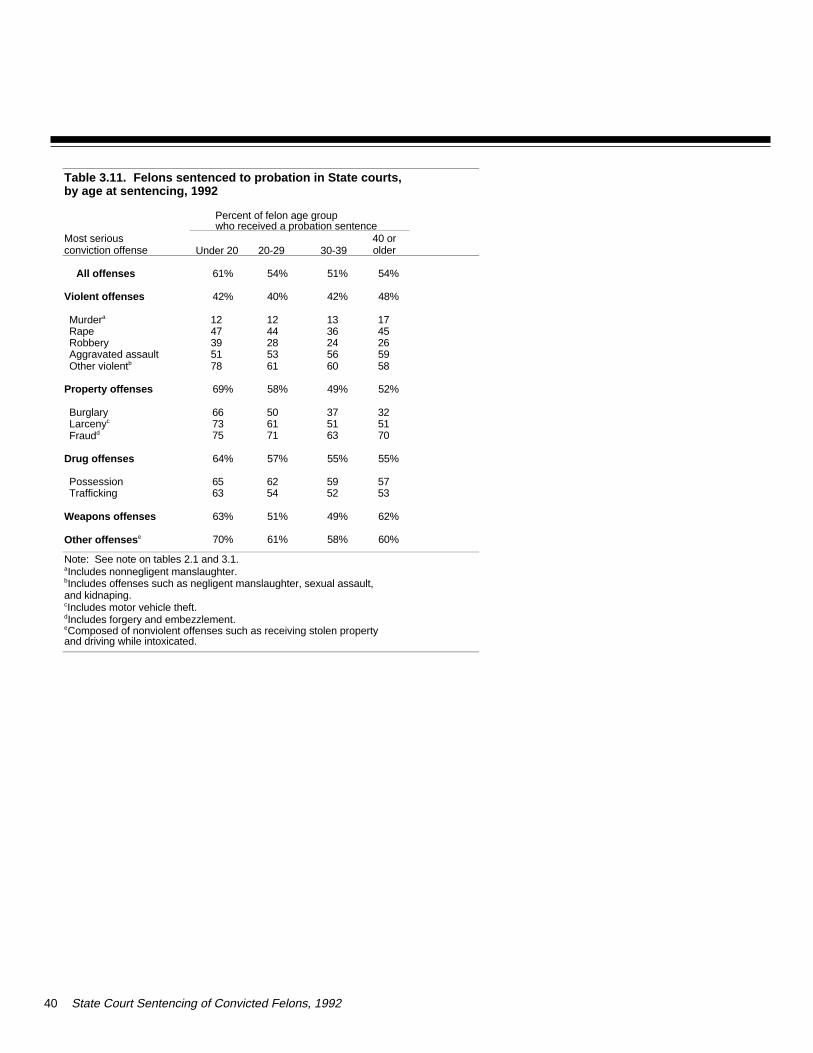
3.11 Felons sentenced to probation, by age at sentencing 40
Felony case processing in State courts, 1992
4.1 Number of felony convictions,by type of conviction, 43
4.2 Offenses of felons convicted, by type of conviction 44
4.3 Offenses of felons convicted, by nature of conviction 45
4.4 Types of sentences imposed, by nature of conviction 46
4.5 Average felony sentence lengths, by nature of conviction 48
4.6 Sentences for felons convicted of murder or nonnegligent manslaughter, by nature of conviction 50
4.7 Number of felony offenses for which convicted, by nature of conviction 50
4.8 Types of sentences imposed, by number of conviction offenses and nature of offenses 51
Average number of days for felony cases,by nature of conviction, between
4.9 Arrest and conviction 524.10 Conviction and sentencing 534.11 Arrest and sentencing 54
Regional variation in adjudication and sentencing, 1992
5.1 Number of felony convictionsin State courts per 100 adult arrests 56
5.2 Convicted felons sentencedto prison, by region 57
5.3 Mean prison sentence lengths imposed, by region 58
Trends in drug trafficking, 1986-94
6.1 Trends in drug trafficking arrests, convictions, andsentences 61
6.2 Convicted drug traffickers as percent of all State courtfelony convictions and sentenced drug traffickersas percent of all convictedfelons sentenced toState prison 61
vi State Court Sentencing of Convicted Felons, 1992
The National Judicial Reporting Pro-gram (NJRP), a biennial sample sur-vey, compiles information on thesentences that felons receive in Statecourts nationwide and on the charac-teristics of the felons. Surveys of fel-ony sentencing in State courts werepreviously conducted in 1986 (see Fel-ony Sentences in State Courts, 1986,BJS Bulletin, NCJ-115210, February1989), 1988 (see Felony Sentences inState Courts, 1988, BJS Bulletin,NCJ-126923, December 1990), 1990(see Felony Sentences in StateCourts, 1990, BJS Bulletin,NCJ-140186, March 1993), and in1992 (see Felony Sentences in StateCourts, 1992, BJS Bulletin,NCJ-151167, January 1995).
The 1992 survey was based on a sam-ple of 300 counties selected to be na-tionally representative. The sampleconsisted of the same jurisdictions asin the 1990 survey and included theDistrict of Columbia and at least onecounty from every State except, bychance, Vermont. Among sampledcounties, two sentenced no felons dur-ing 1992. The 1992 survey excludedFederal courts and those State or localcourts that did not adjudicate felonycases. Federal courts convicted41,673 persons of a felony offense in1992. That number represents about5% of the combined State and Federaltotal number of felony convictions dur-ing 1992.
The 1992 survey included only of-fenses that State penal codes definedas felonies. Felony offenses arewidely defined as crimes that have thepotential of being punished by morethan 1 year in prison. States usuallydesignate specific courts to try felonyoffenses, although in some countiesmore than one court may handle suchcases.
The term "felony" is not uniform in ei-ther its usage or definition in theUnited States. Two jurisdictions(Maine and New Jersey) do not usethe term to classify their criminal of-fenses, and six others offer no explicitdefinition of the term, even thoughthey use it as a criminal designation.In the 43 States that use and definefelony, common elements do exist.With few exceptions, criminal codesdefine felonies by reference to place ofimprisonment. Most often, felony defi-nitions identify the place of imprison-ment but not the duration, as
in Idaho, where a felony is a "crimepunishable by death or by imprison-ment in the State prison." Nearly asfrequent is a definition that specifiesthe duration of imprisonment but notthe place, as in Georgia, where a fel-ony is a "crime punishable by death,by imprisonment for life, or by impris-onment for more than 12 months."
This publication summarizes resultsfrom the 1992 survey. Each of thesections addresses a different aspectof felony convictions in State courtsduring 1992.
State Court Sentencing of Convicted Felons, 1992 1
The National Judicial Reporting Program
In 1992 State courts convicted894,000 persons of murder, rape, rob-bery, drug trafficking, and other felonyoffenses. Courts sentenced 44% ofthem to prison, 26% to jail (usually fora year or less), and the remaining 30%to probation (table 1.2).
Other results include the following:
Drug traffickers (19%) and drug pos-sessors (12%) together made up 31%of felons convicted in State courts in 1992. Violent offenders, consistingof murderers (1%), rapists (2%), rob-bers (6%), assaulters (7%), and othersconvicted of a violent crime (2%) to-gether made up 18%. Burglars (13%)and larcenists (13%) made up most ofthe rest (table 1.1).
The average sentence to local jailwas 7 months. The average probationsentence was nearly 4 years (table1.3).
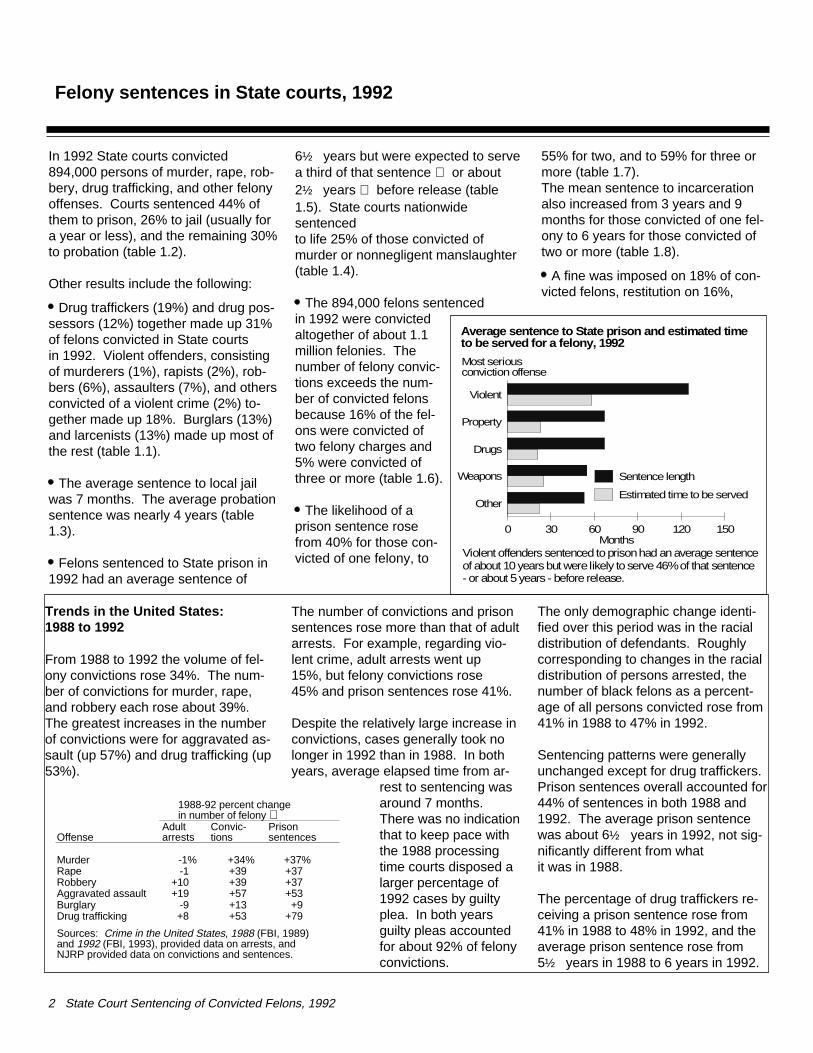
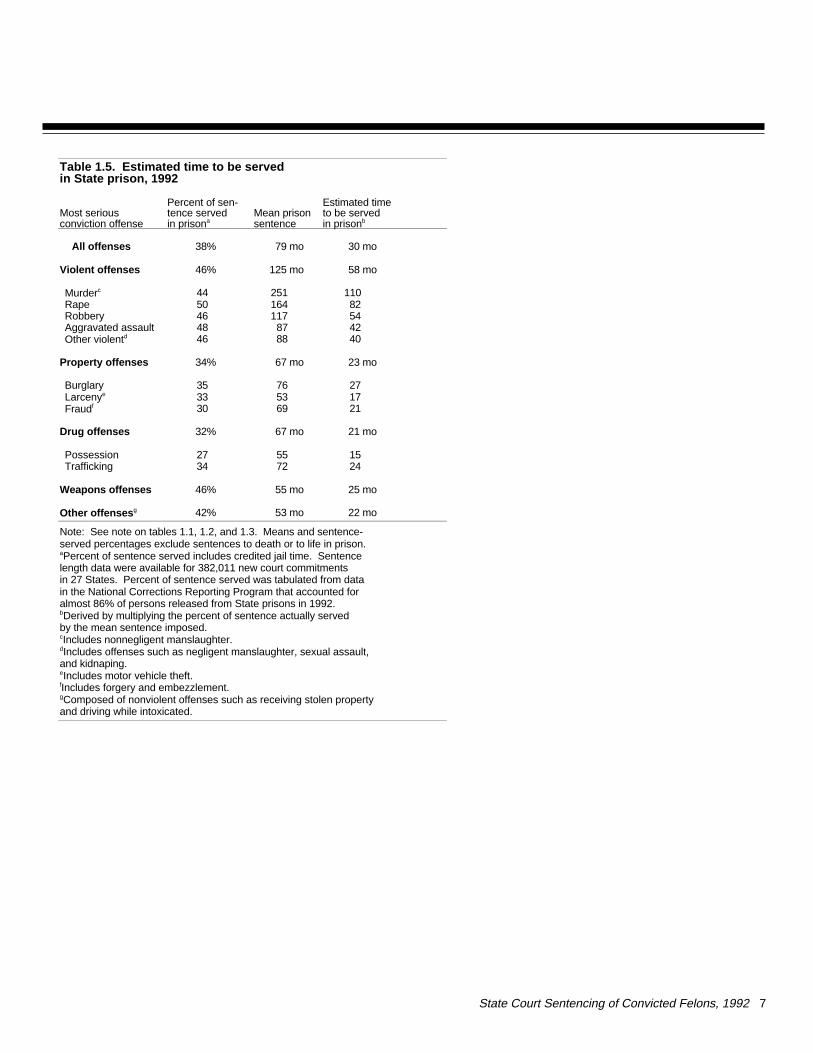
Felons sentenced to State prison in1992 had an average sentence of
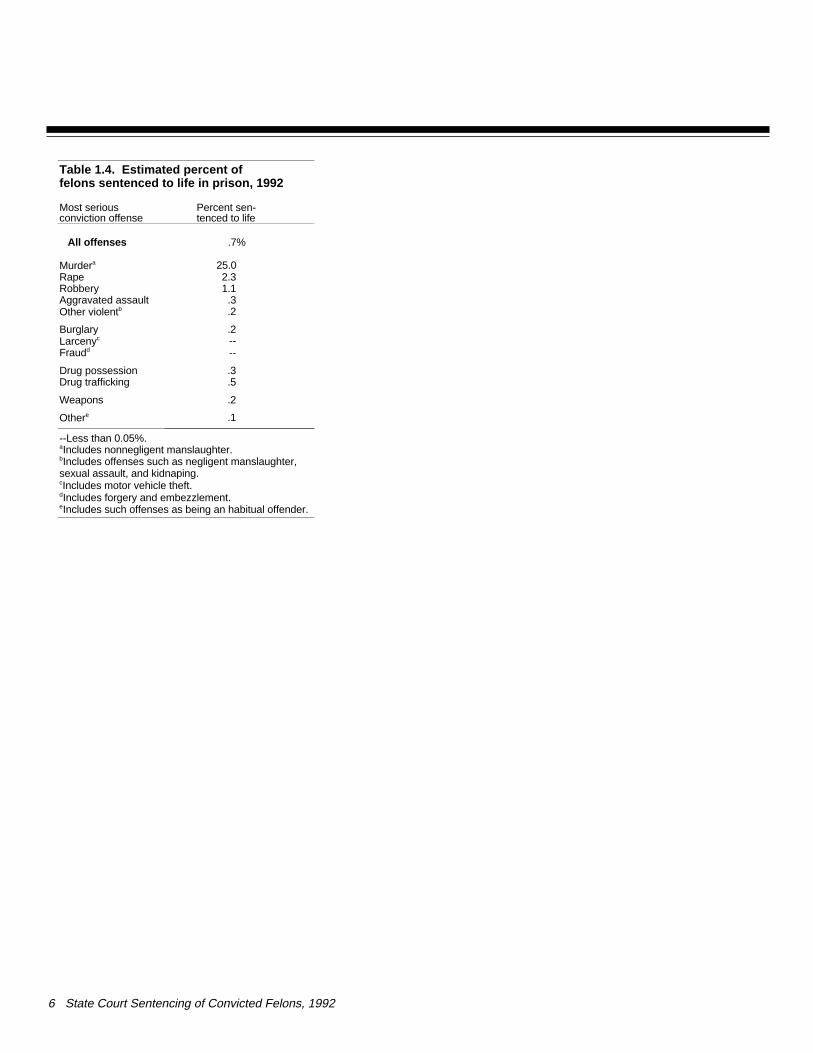
6½ years but were expected to serve a third of that sentence or about 2½ years before release (table1.5). State courts nationwidesentenced to life 25% of those convicted of murder or nonnegligent manslaughter(table 1.4).
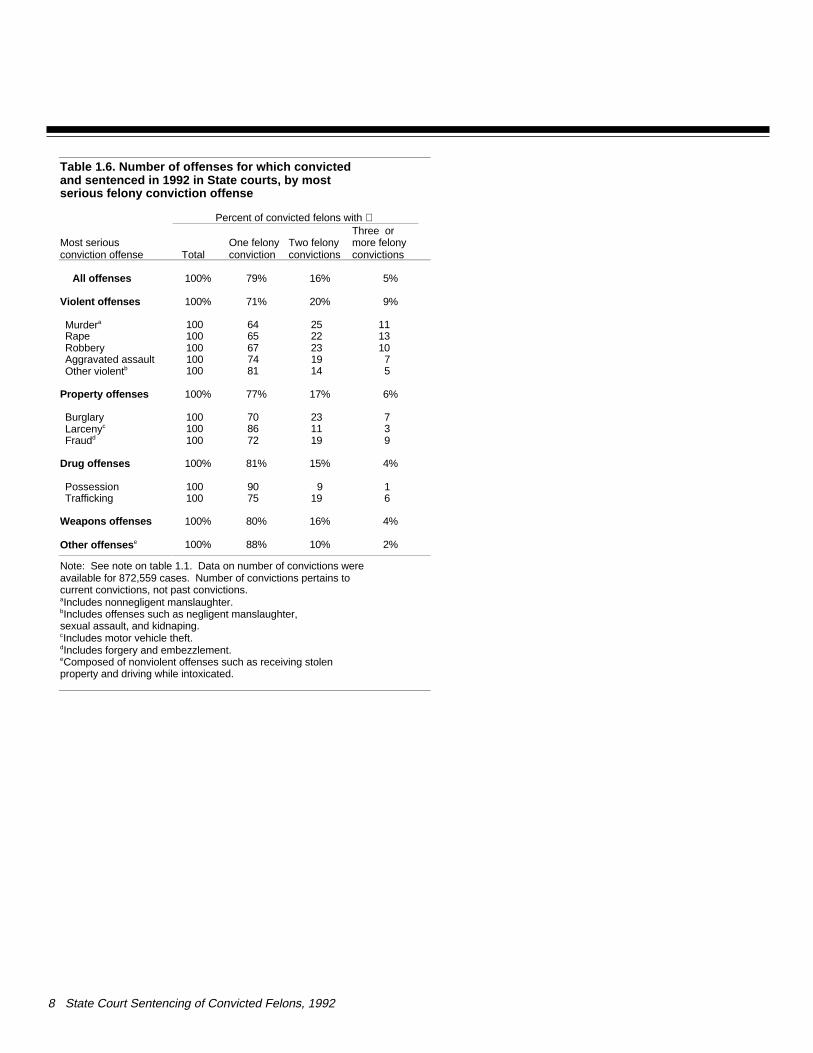
The 894,000 felons sentenced in 1992 were convictedaltogether of about 1.1million felonies. Thenumber of felony convic-tions exceeds the num-ber of convicted felonsbecause 16% of the fel-ons were convicted oftwo felony charges and5% were convicted ofthree or more (table 1.6).
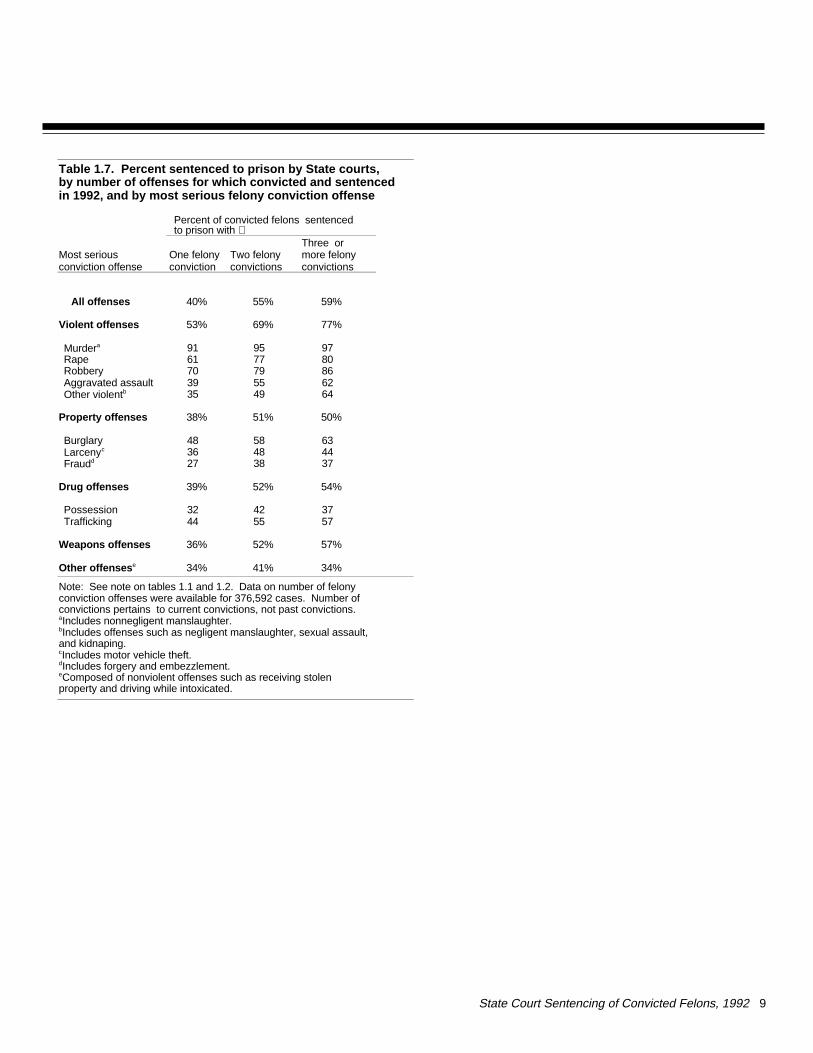
The likelihood of aprison sentence rosefrom 40% for those con-victed of one felony, to
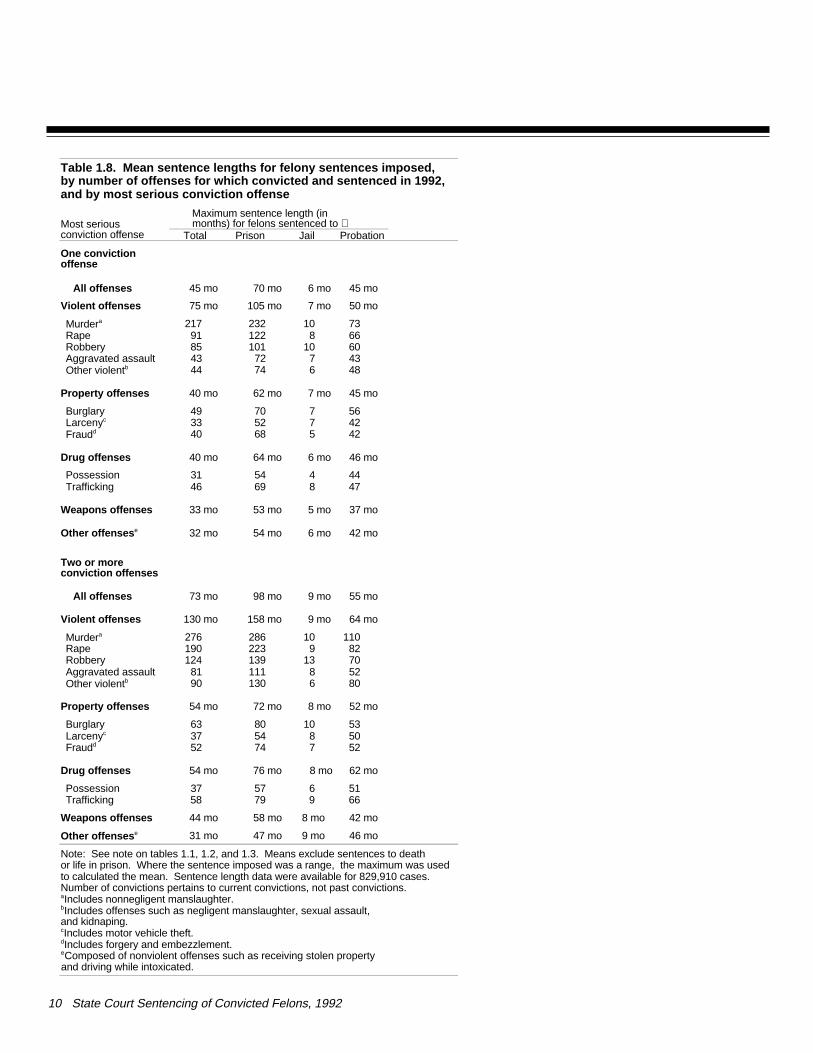
55% for two, and to 59% for three ormore (table 1.7). The mean sentence to incarcerationalso increased from 3 years and 9months for those convicted of one fel-ony to 6 years for those convicted oftwo or more (table 1.8).
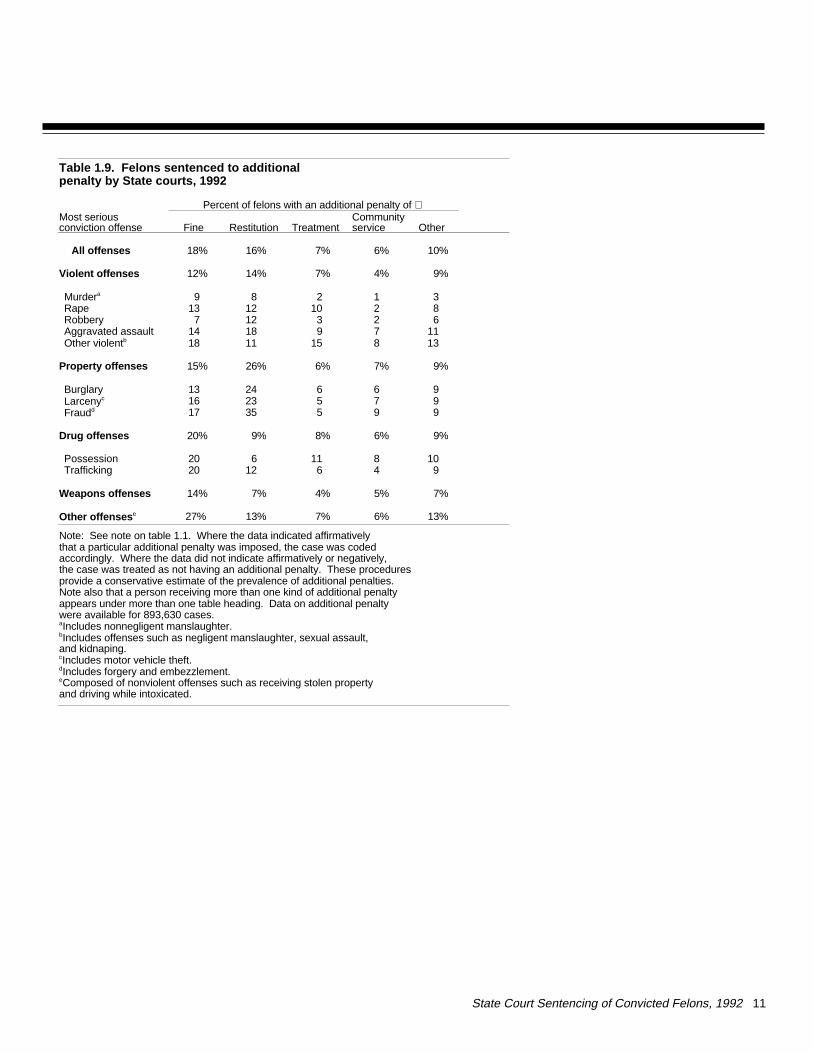
A fine was imposed on 18% of con-victed felons, restitution on 16%,
2 State Court Sentencing of Convicted Felons, 1992
Felony sentences in State courts, 1992
Violent
Property
Drugs
Weapons
Other
0 30 60 90 120 150
Sentence length
Estimated time to be served
Months
Average sentence to State prison and estimated time to be served for a felony, 1992
Most serious conviction offense
Violent offenders sentenced to prison had an average sentence of about 10 years but were likely to serve 46% of that sentence - or about 5 years - before release.
Trends in the United States: 1988 to 1992
From 1988 to 1992 the volume of fel-ony convictions rose 34%. The num-ber of convictions for murder, rape,and robbery each rose about 39%.The greatest increases in the numberof convictions were for aggravated as-sault (up 57%) and drug trafficking (up53%).
The number of convictions and prisonsentences rose more than that of adultarrests. For example, regarding vio-lent crime, adult arrests went up 15%, but felony convictions rose 45% and prison sentences rose 41%.
Despite the relatively large increase inconvictions, cases generally took nolonger in 1992 than in 1988. In bothyears, average elapsed time from ar-
rest to sentencing wasaround 7 months.There was no indicationthat to keep pace withthe 1988 processingtime courts disposed alarger percentage of1992 cases by guiltyplea. In both yearsguilty pleas accountedfor about 92% of felonyconvictions.
The only demographic change identi-fied over this period was in the racialdistribution of defendants. Roughlycorresponding to changes in the racialdistribution of persons arrested, thenumber of black felons as a percent-age of all persons convicted rose from41% in 1988 to 47% in 1992.
Sentencing patterns were generallyunchanged except for drug traffickers.Prison sentences overall accounted for44% of sentences in both 1988 and1992. The average prison sentencewas about 6½ years in 1992, not sig-nificantly different from whatit was in 1988.
The percentage of drug traffickers re-ceiving a prison sentence rose from41% in 1988 to 48% in 1992, and theaverage prison sentence rose from5½ years in 1988 to 6 years in 1992.
1988-92 percent change in number of felony
OffenseAdult arrests
Convic-tions
Prisonsentences
Murder -1% +34% +37%Rape -1 +39 +37Robbery +10 +39 +37Aggravated assault +19 +57 +53Burglary -9 +13 +9Drug trafficking +8 +53 +79
Sources: Crime in the United States, 1988 (FBI, 1989) and 1992 (FBI, 1993), provided data on arrests, and NJRP provided data on convictions and sentences.
community service on 6%, and treat-ment was ordered for 7% (table 1.9).
State Court Sentencing of Convicted Felons, 1992 3
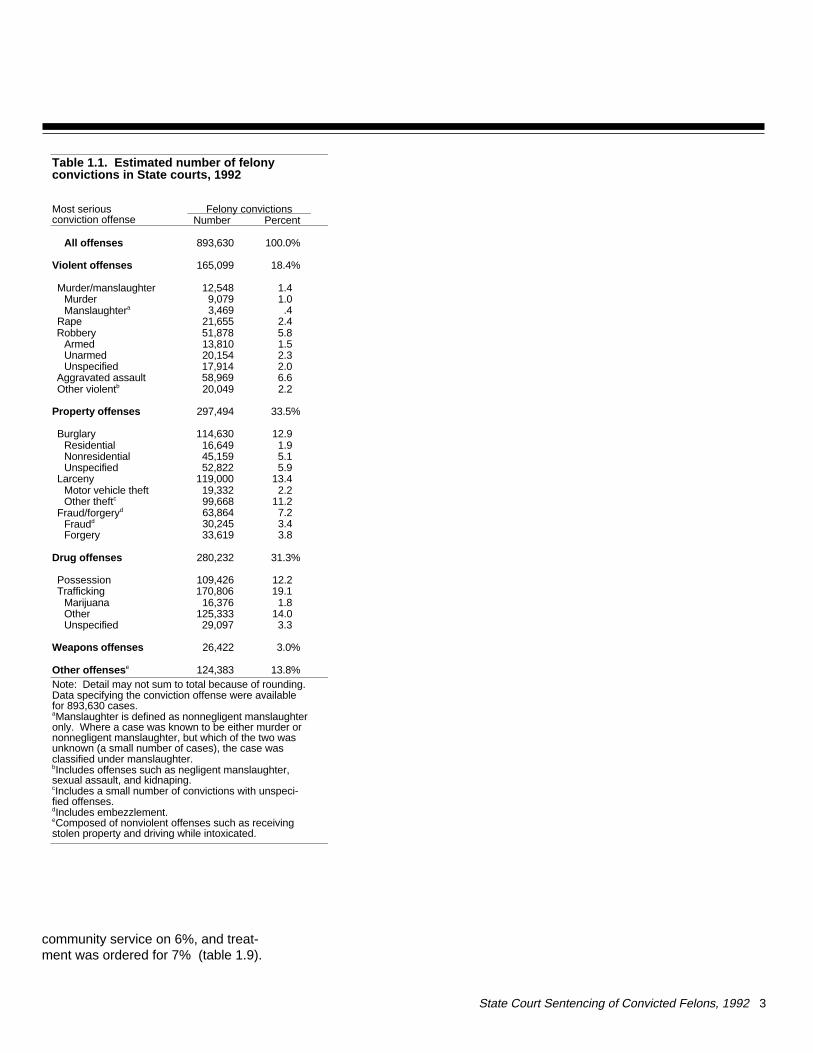
Table 1.1. Estimated number of felonyconvictions in State courts, 1992
Most seriousconviction offense
Felony convictionsNumber Percent
All offenses 893,630 100.0%
Violent offenses 165,099 18.4%
Murder/manslaughter 12,548 1.4Murder 9,079 1.0Manslaughtera 3,469 .4
Rape 21,655 2.4Robbery 51,878 5.8
Armed 13,810 1.5Unarmed 20,154 2.3Unspecified 17,914 2.0
Aggravated assault 58,969 6.6Other violentb 20,049 2.2
Property offenses 297,494 33.5%
Burglary 114,630 12.9Residential 16,649 1.9Nonresidential 45,159 5.1Unspecified 52,822 5.9
Larceny 119,000 13.4Motor vehicle theft 19,332 2.2Other theftc 99,668 11.2
Fraud/forgeryd 63,864 7.2Fraudd 30,245 3.4Forgery 33,619 3.8
Drug offenses 280,232 31.3%
Possession 109,426 12.2Trafficking 170,806 19.1
Marijuana 16,376 1.8Other 125,333 14.0Unspecified 29,097 3.3
Weapons offenses 26,422 3.0%
Other offenses e 124,383 13.8%Note: Detail may not sum to total because of rounding.Data specifying the conviction offense were availablefor 893,630 cases. aManslaughter is defined as nonnegligent manslaughteronly. Where a case was known to be either murder ornonnegligent manslaughter, but which of the two wasunknown (a small number of cases), the case wasclassified under manslaughter. bIncludes offenses such as negligent manslaughter, sexual assault, and kidnaping. cIncludes a small number of convictions with unspeci-fied offenses.dIncludes embezzlement.eComposed of nonviolent offenses such as receivingstolen property and driving while intoxicated.
4 State Court Sentencing of Convicted Felons, 1992
Table 1.2. Types of felony sentences imposed by State courts, by offense, 1992
Percent of felons sentenced to Most serious conviction offense
IncarcerationTotal Total Prison Jail Probation
All offenses 100% 70% 44% 26% 30%
Violent offenses 100% 81% 60% 21% 19%
Murdera 100 97 93 4 3Rape 100 87 68 19 13Robbery 100 88 74 14 12Aggravated assault 100 72 44 28 28Other violentb 100 68 39 29 32
Property offenses 100% 66% 42% 24% 34%
Burglary 100 75 52 23 25Larcenyc 100 65 38 27 35Fraudd 100 52 31 21 48
Drug offenses 100% 70% 42% 28% 30%
Possession 100 62 33 29 38Trafficking 100 75 48 27 25
Weapons offenses 100% 66% 40% 26% 34%
Other offenses e 100% 65% 35% 30% 35%
Note: See note on table 1.1. For persons receiving a combination of sentences, the sentence designation came from the most severe penalty imposed prison being the most severe, followed by jail, then probation. Prison includes death sentences. Data on sentence type were available for 886,359 cases.aIncludes nonnegligent manslaughter.bIncludes offenses such as negligent manslaughter, sexual assault, and kidnaping.cIncludes motor vehicle theft.dIncludes forgery and embezzlement.eComposed of nonviolent offenses such as receiving stolen propertyand driving while intoxicated.
State Court Sentencing of Convicted Felons, 1992 5
Table 1.3. Mean and median sentence lengths for felony sentences imposed by State courts, 1992
Maximum sentence length (in months) for felons sentenced to
Most serious conviction offense
IncarcerationTotal Prison Jail Probation
Mean sentence
All offenses 53 mo 79 mo 7 mo 47 mo
Violent offenses 95 mo 125 mo 8 mo 52 mo
Murdera 238 251 10 78Rape 130 164 8 71Robbery 101 117 11 62Aggravated assault 56 87 7 45Other violentb 55 88 6 52
Property offenses 45 mo 67 mo 7 mo 47 mo
Burglary 56 76 8 55Larcenyc 34 53 7 43Fraudd 44 69 6 44
Drug offenses 43 mo 67 mo 6 mo 48 mo
Possession 32 55 4 45Trafficking 50 72 8 51
Weapons offenses 36 mo 55 mo 6 mo 38 mo
Other offenses e 32 mo 53 mo 6 mo 42 mo
Median sentence
All offenses 24 mo 48 mo 5 mo 36 mo
Violent offenses 60 mo 84 mo 6 mo 36 mo
Murdera 252 288 10 60Rape 72 108 6 60Robbery 66 84 9 60Aggravated assault 24 60 6 36Other violentb 24 60 4 36
Property offenses 24 mo 42 mo 5 mo 36 mo
Burglary 36 48 6 36Larcenyc 18 36 4 36Fraudd 24 36 3 36
Drug offenses 24 mo 48 mo 5 mo 36 mo
Possession 12 36 3 36Trafficking 36 48 6 36
Weapons offenses 16 mo 36 mo 4 mo 24 mo
Other offenses e 12 mo 28 mo 4 mo 36 mo
Note: See note on table 1.2. Means exclude sentences to death or to life in prison. Sentence length data were available for 854,592 incarceration and probation sentences.aIncludes nonnegligent manslaughter.bIncludes offenses such as negligent manslaughter, sexual assault, and kidnaping.cIncludes motor vehicle theft.dIncludes forgery and embezzlement.eComposed of nonviolent offenses such as receiving stolen propertyand driving while intoxicated.
6 State Court Sentencing of Convicted Felons, 1992
Table 1.4. Estimated percent of felons sentenced to life in prison, 1992
Most seriousconviction offense
Percent sen-tenced to life
All offenses .7%
Murdera 25.0Rape 2.3Robbery 1.1Aggravated assault .3Other violentb .2
Burglary .2Larcenyc --Fraudd --
Drug possession .3Drug trafficking .5
Weapons .2
Othere .1
--Less than 0.05%.aIncludes nonnegligent manslaughter.bIncludes offenses such as negligent manslaughter,sexual assault, and kidnaping.cIncludes motor vehicle theft.dIncludes forgery and embezzlement.eIncludes such offenses as being an habitual offender.
State Court Sentencing of Convicted Felons, 1992 7
Table 1.5. Estimated time to be served in State prison, 1992
Most serious conviction offense
Percent of sen-tence served in prisona
Mean prisonsentence
Estimated timeto be served in prisonb
All offenses 38% 79 mo 30 mo
Violent offenses 46% 125 mo 58 mo
Murderc 44 251 110Rape 50 164 82Robbery 46 117 54Aggravated assault 48 87 42Other violentd 46 88 40
Property offenses 34% 67 mo 23 mo
Burglary 35 76 27Larcenye 33 53 17Fraudf 30 69 21
Drug offenses 32% 67 mo 21 mo
Possession 27 55 15Trafficking 34 72 24
Weapons offenses 46% 55 mo 25 mo
Other offenses g 42% 53 mo 22 mo
Note: See note on tables 1.1, 1.2, and 1.3. Means and sentence-served percentages exclude sentences to death or to life in prison.aPercent of sentence served includes credited jail time. Sentence length data were available for 382,011 new court commitments in 27 States. Percent of sentence served was tabulated from data in the National Corrections Reporting Program that accounted for almost 86% of persons released from State prisons in 1992.bDerived by multiplying the percent of sentence actually served by the mean sentence imposed.cIncludes nonnegligent manslaughter.dIncludes offenses such as negligent manslaughter, sexual assault, and kidnaping.eIncludes motor vehicle theft.fIncludes forgery and embezzlement.gComposed of nonviolent offenses such as receiving stolen property and driving while intoxicated.
8 State Court Sentencing of Convicted Felons, 1992
Table 1.6. Number of offenses for which convicted and sentenced in 1992 in State courts, by most serious felony conviction offense
Percent of convicted felons with
Most seriousconviction offense Total
One felonyconviction
Two felonyconvictions
Three or more felonyconvictions
All offenses 100% 79% 16% 5%
Violent offenses 100% 71% 20% 9%
Murdera 100 64 25 11Rape 100 65 22 13Robbery 100 67 23 10Aggravated assault 100 74 19 7Other violentb 100 81 14 5
Property offenses 100% 77% 17% 6%
Burglary 100 70 23 7Larcenyc 100 86 11 3Fraudd 100 72 19 9
Drug offenses 100% 81% 15% 4%
Possession 100 90 9 1Trafficking 100 75 19 6
Weapons offenses 100% 80% 16% 4%
Other offenses e 100% 88% 10% 2%
Note: See note on table 1.1. Data on number of convictions were available for 872,559 cases. Number of convictions pertains to current convictions, not past convictions.aIncludes nonnegligent manslaughter.bIncludes offenses such as negligent manslaughter, sexual assault, and kidnaping.cIncludes motor vehicle theft.dIncludes forgery and embezzlement.eComposed of nonviolent offenses such as receiving stolen property and driving while intoxicated.
State Court Sentencing of Convicted Felons, 1992 9
Table 1.7. Percent sentenced to prison by State courts, by number of offenses for which convicted and sentenced in 1992, and by most serious felony conviction offense
Percent of convicted felons sentencedto prison with
Most seriousconviction offense
One felonyconviction
Two felonyconvictions
Three or more felonyconvictions
All offenses 40% 55% 59%
Violent offenses 53% 69% 77%
Murdera 91 95 97Rape 61 77 80Robbery 70 79 86Aggravated assault 39 55 62Other violentb 35 49 64
Property offenses 38% 51% 50%
Burglary 48 58 63Larcenyc 36 48 44Fraudd 27 38 37
Drug offenses 39% 52% 54%
Possession 32 42 37Trafficking 44 55 57
Weapons offenses 36% 52% 57%
Other offenses e 34% 41% 34%
Note: See note on tables 1.1 and 1.2. Data on number of felonyconviction offenses were available for 376,592 cases. Number of convictions pertains to current convictions, not past convictions.aIncludes nonnegligent manslaughter.bIncludes offenses such as negligent manslaughter, sexual assault, and kidnaping.cIncludes motor vehicle theft.dIncludes forgery and embezzlement.eComposed of nonviolent offenses such as receiving stolen property and driving while intoxicated.
10 State Court Sentencing of Convicted Felons, 1992
Table 1.8. Mean sentence lengths for felony sentences imposed, by number of offenses for which convicted and sentenced in 1992,and by most serious conviction offense
Most seriousconviction offense
Maximum sentence length (in months) for felons sentenced to Total Prison Jail Probation
One convictionoffense
All offenses 45 mo 70 mo 6 mo 45 mo
Violent offenses 75 mo 105 mo 7 mo 50 mo
Murdera 217 232 10 73Rape 91 122 8 66Robbery 85 101 10 60Aggravated assault 43 72 7 43Other violentb 44 74 6 48
Property offenses 40 mo 62 mo 7 mo 45 mo
Burglary 49 70 7 56Larcenyc 33 52 7 42Fraudd 40 68 5 42
Drug offenses 40 mo 64 mo 6 mo 46 mo
Possession 31 54 4 44Trafficking 46 69 8 47
Weapons offenses 33 mo 53 mo 5 mo 37 mo
Other offenses e 32 mo 54 mo 6 mo 42 mo
Two or more conviction offenses
All offenses 73 mo 98 mo 9 mo 55 mo
Violent offenses 130 mo 158 mo 9 mo 64 mo
Murdera 276 286 10 110Rape 190 223 9 82Robbery 124 139 13 70Aggravated assault 81 111 8 52Other violentb 90 130 6 80
Property offenses 54 mo 72 mo 8 mo 52 mo
Burglary 63 80 10 53Larcenyc 37 54 8 50Fraudd 52 74 7 52
Drug offenses 54 mo 76 mo 8 mo 62 mo
Possession 37 57 6 51Trafficking 58 79 9 66
Weapons offenses 44 mo 58 mo 8 mo 42 mo
Other offenses e 31 mo 47 mo 9 mo 46 mo
Note: See note on tables 1.1, 1.2, and 1.3. Means exclude sentences to death or life in prison. Where the sentence imposed was a range, the maximum was usedto calculated the mean. Sentence length data were available for 829,910 cases.Number of convictions pertains to current convictions, not past convictions.aIncludes nonnegligent manslaughter.bIncludes offenses such as negligent manslaughter, sexual assault, and kidnaping.cIncludes motor vehicle theft.dIncludes forgery and embezzlement.eComposed of nonviolent offenses such as receiving stolen property and driving while intoxicated.
State Court Sentencing of Convicted Felons, 1992 11
Table 1.9. Felons sentenced to additionalpenalty by State courts, 1992
Percent of felons with an additional penalty of Most serious conviction offense Fine Restitution Treatment
Communityservice Other
All offenses 18% 16% 7% 6% 10%
Violent offenses 12% 14% 7% 4% 9%
Murdera 9 8 2 1 3Rape 13 12 10 2 8Robbery 7 12 3 2 6Aggravated assault 14 18 9 7 11Other violentb 18 11 15 8 13
Property offenses 15% 26% 6% 7% 9%
Burglary 13 24 6 6 9Larcenyc 16 23 5 7 9Fraudd 17 35 5 9 9
Drug offenses 20% 9% 8% 6% 9%
Possession 20 6 11 8 10Trafficking 20 12 6 4 9
Weapons offenses 14% 7% 4% 5% 7%
Other offenses e 27% 13% 7% 6% 13%
Note: See note on table 1.1. Where the data indicated affirmatively that a particular additional penalty was imposed, the case was coded accordingly. Where the data did not indicate affirmatively or negatively, the case was treated as not having an additional penalty. These proceduresprovide a conservative estimate of the prevalence of additional penalties. Note also that a person receiving more than one kind of additional penalty appears under more than one table heading. Data on additional penalty were available for 893,630 cases.aIncludes nonnegligent manslaughter.bIncludes offenses such as negligent manslaughter, sexual assault, and kidnaping.cIncludes motor vehicle theft.dIncludes forgery and embezzlement.eComposed of nonviolent offenses such as receiving stolen property and driving while intoxicated.
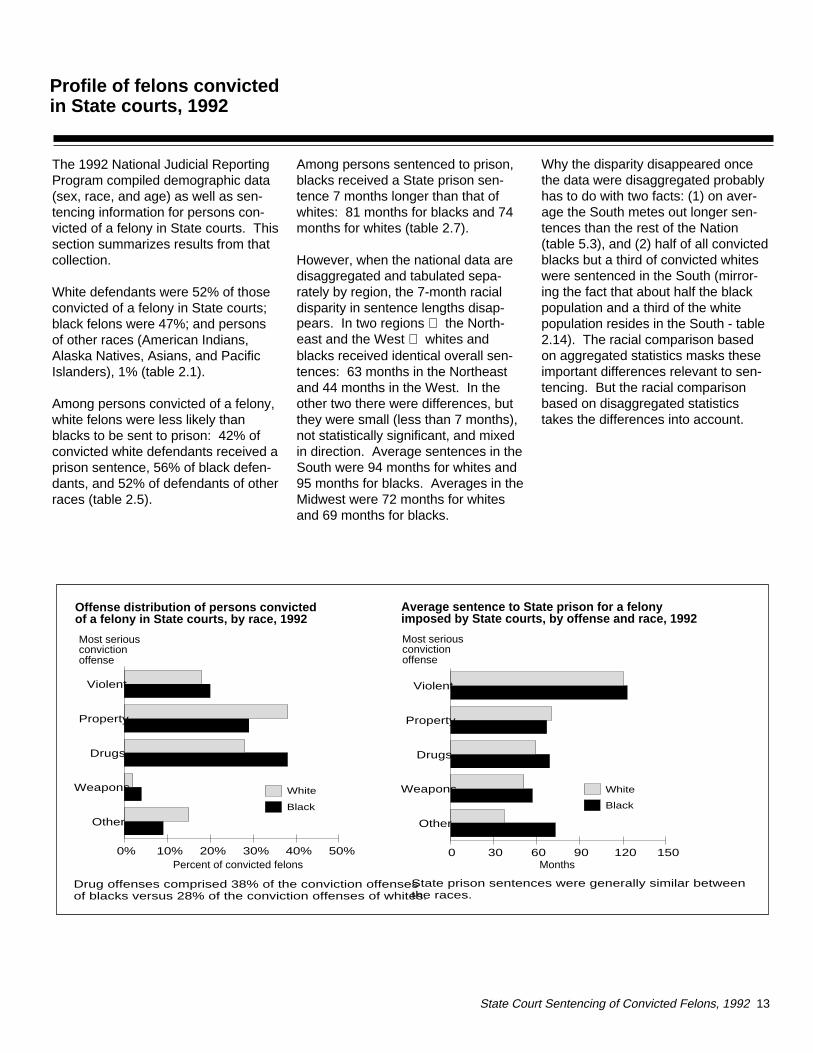
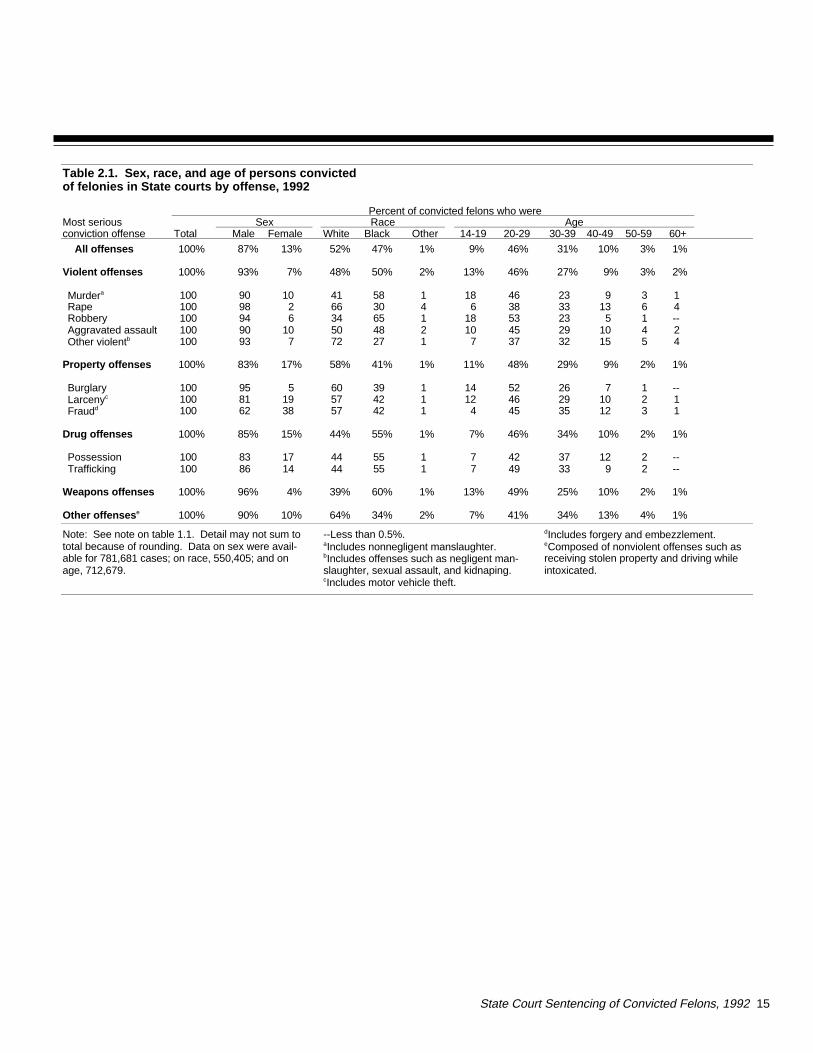
The 1992 National Judicial ReportingProgram compiled demographic data(sex, race, and age) as well as sen-tencing information for persons con-victed of a felony in State courts. Thissection summarizes results from thatcollection.
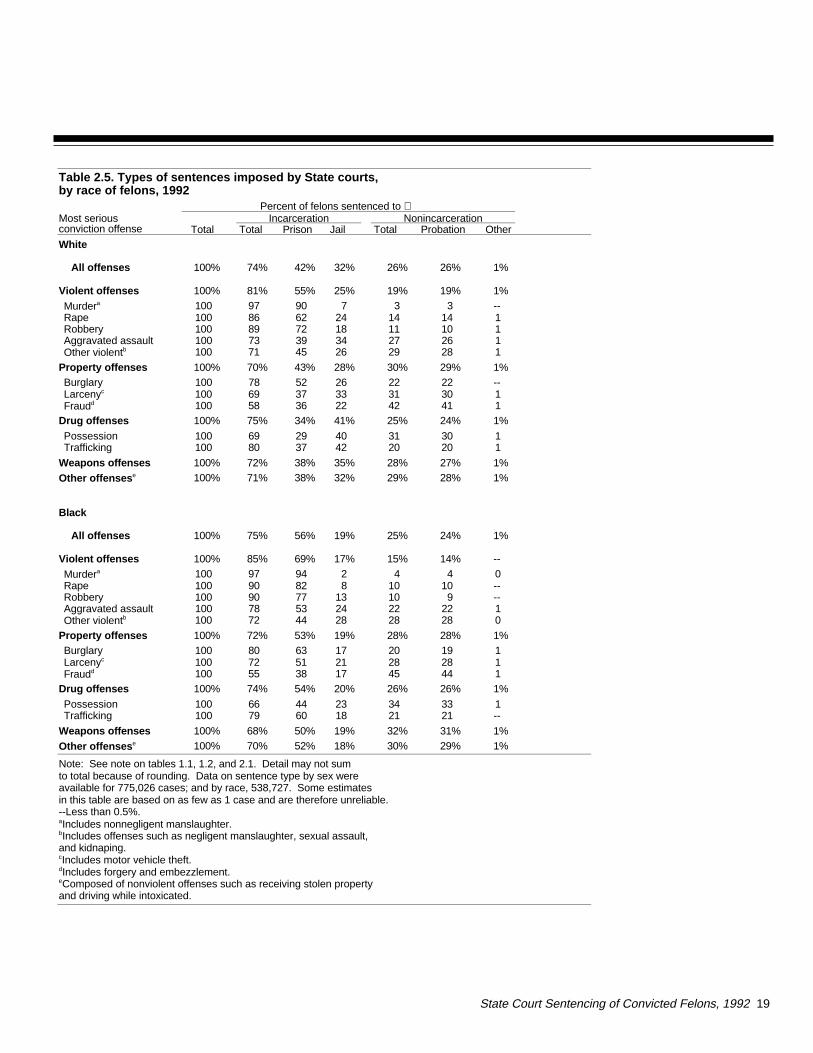
White defendants were 52% of thoseconvicted of a felony in State courts;black felons were 47%; and personsof other races (American Indians,Alaska Natives, Asians, and PacificIslanders), 1% (table 2.1).
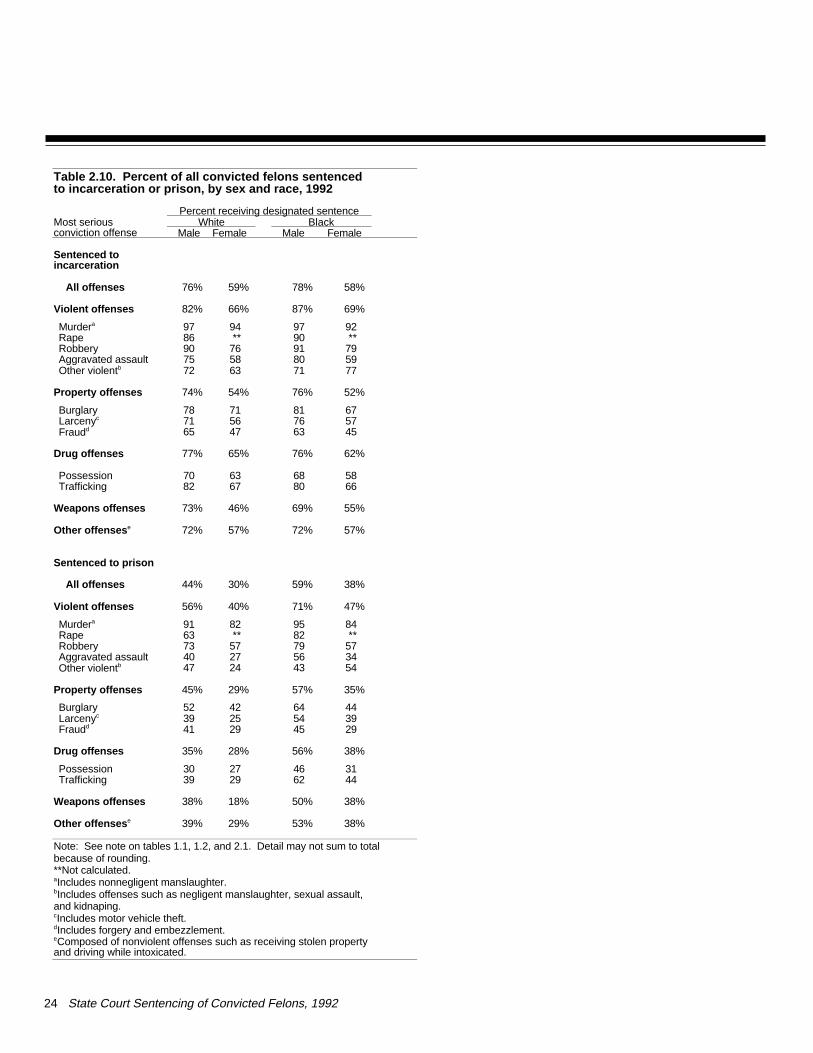
Among persons convicted of a felony,white felons were less likely thanblacks to be sent to prison: 42% ofconvicted white defendants received aprison sentence, 56% of black defen-dants, and 52% of defendants of otherraces (table 2.5).
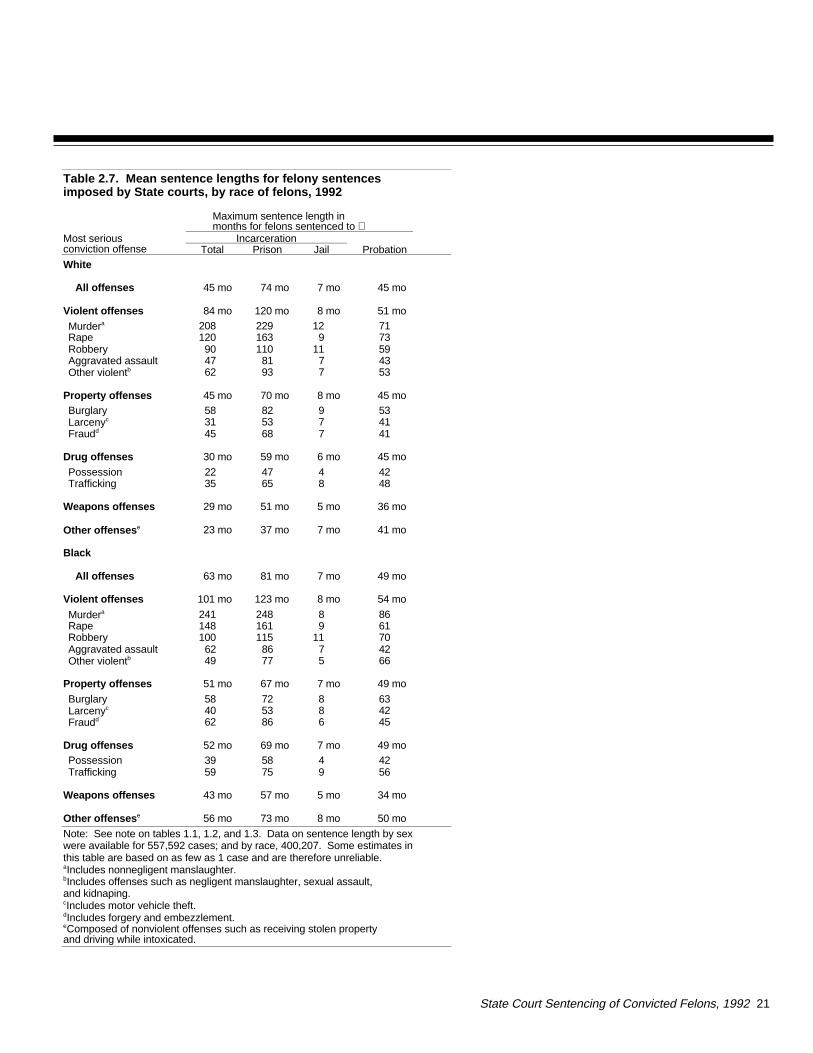
Among persons sentenced to prison,blacks received a State prison sen-tence 7 months longer than that ofwhites: 81 months for blacks and 74months for whites (table 2.7).
However, when the national data aredisaggregated and tabulated sepa-rately by region, the 7-month racialdisparity in sentence lengths disap-pears. In two regions the North-east and the West whites andblacks received identical overall sen-tences: 63 months in the Northeastand 44 months in the West. In theother two there were differences, butthey were small (less than 7 months),not statistically significant, and mixedin direction. Average sentences in theSouth were 94 months for whites and95 months for blacks. Averages in theMidwest were 72 months for whitesand 69 months for blacks.
Why the disparity disappeared oncethe data were disaggregated probablyhas to do with two facts: (1) on aver-age the South metes out longer sen-tences than the rest of the Nation(table 5.3), and (2) half of all convictedblacks but a third of convicted whiteswere sentenced in the South (mirror-ing the fact that about half the blackpopulation and a third of the whitepopulation resides in the South - table2.14). The racial comparison basedon aggregated statistics masks theseimportant differences relevant to sen-tencing. But the racial comparisonbased on disaggregated statisticstakes the differences into account.
State Court Sentencing of Convicted Felons, 1992 13
Violent
Property
Drugs
Weapons
Other
0 30 60 90 120 150
White
Black
Months
Violent
Property
Drugs
Weapons
Other
0% 10% 20% 30% 40% 50%
White
Black
Percent of convicted felons
Most seriousconvictionoffense
Most seriousconvictionoffense
Drug offenses comprised 38% of the conviction offenses of blacks versus 28% of the conviction offenses of whites.
Average sentence to State prison for a felony imposed by State courts, by offense and race, 1992
Offense distribution of persons convicted of a felony in State courts, by race, 1992
State prison sentences were generally similar between the races.
Profile of felons convictedin State courts, 1992
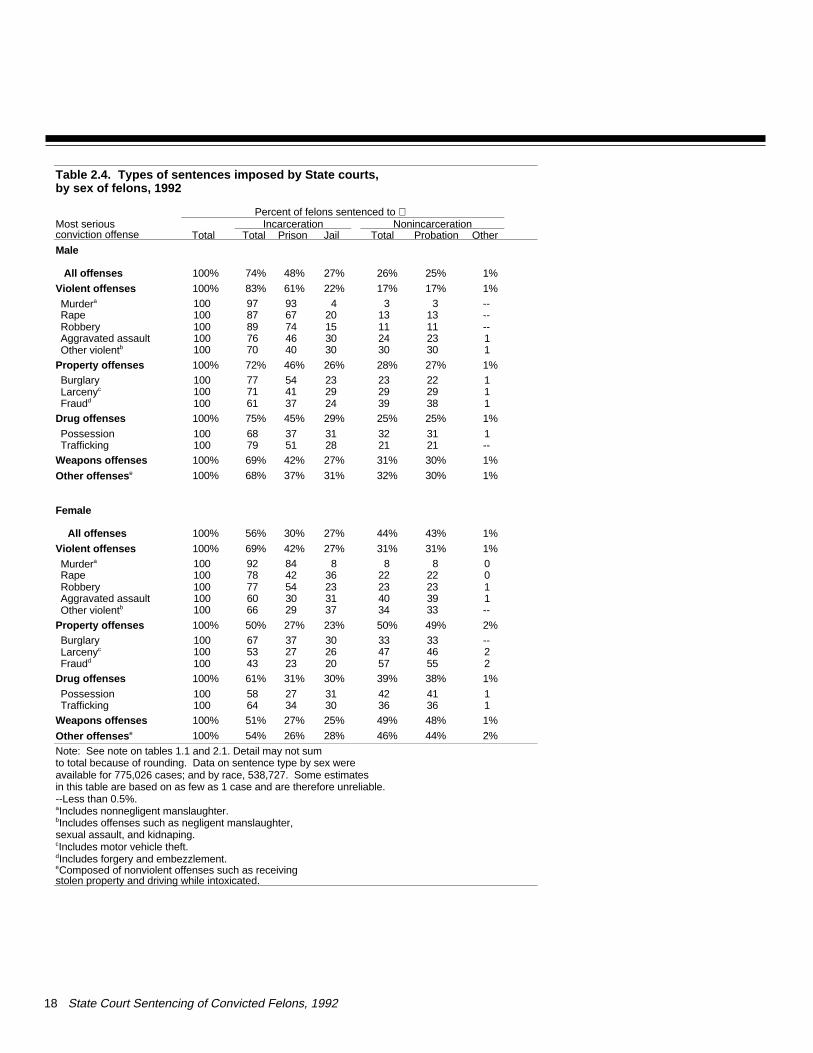
Other findings were In 1992 men comprised 87% of per-
sons convicted of a felony (table 2.1).An estimated 48% of males received aState prison sentence, compared to30% of females (table 2.4). As a re-sult of this sentencing difference,males comprised a larger percentageof the total sentenced to prison (91%)than the total convicted (87%).
Among all felons convicted nation-wide, about 465,000 (52%) werewhite, 420,000 (47%) were black, andan estimated 9,000 (1%) were of otherraces (American Indian, Alaska Native, Asian, or Pacific Islander) (table 2.1).
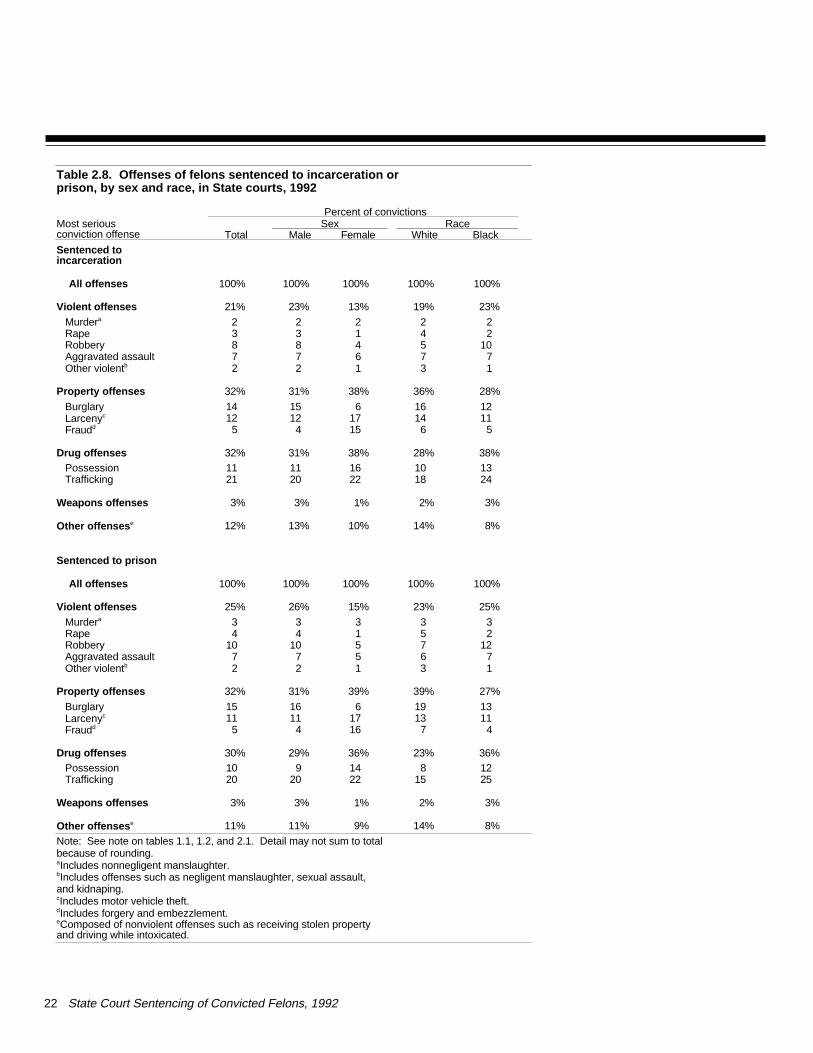
The most serious conviction offensewas a violent felony in 13% of casesfor women, and 23% of cases formen. Among convicted whites 19%had a violent felony conviction of-fense; among blacks 23% (table 2.8).
The average age of felons convictedin 1992 was 30 years (table 2.3).
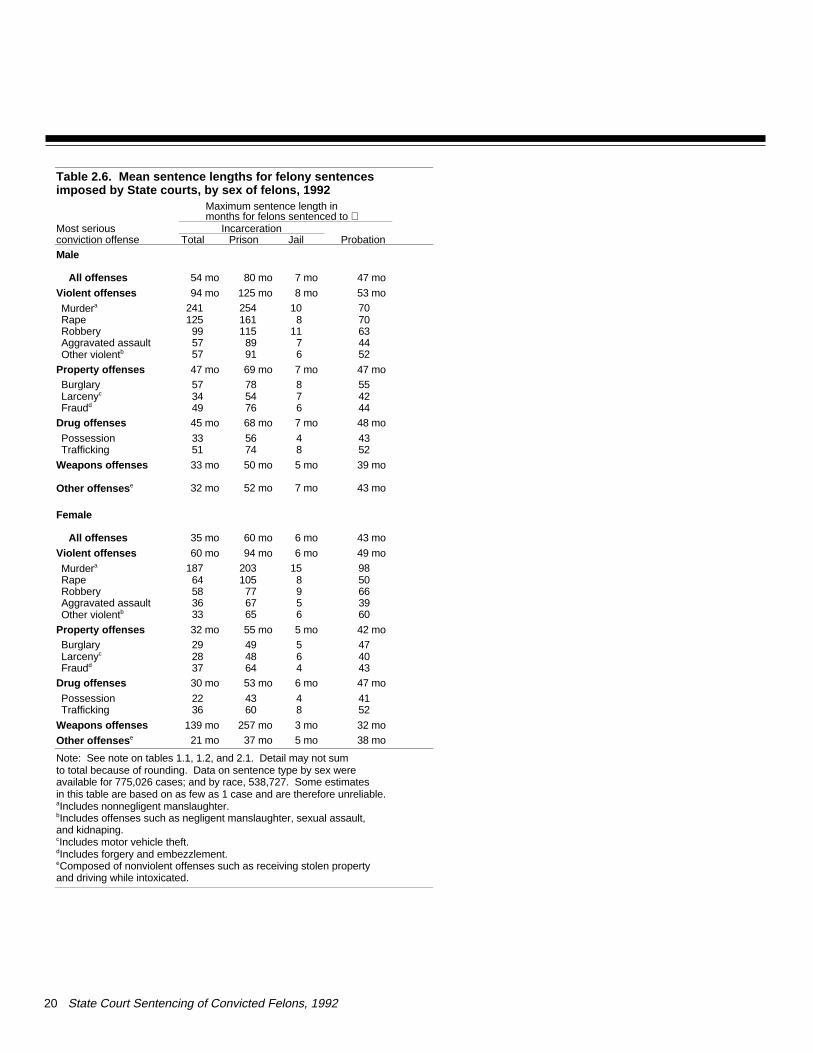
Men sentenced to prison nationwidehad an average sentence length of 6 years and 8 months, while womennationwide had an average prisonsentence of 5 years (table 2.6).
Men nationwide were sentenced tolocal jail for an average of 7 months,and women for 6 months (table 2.6).The larger proportion of violent convic-tion offenses for men partly explainstheir greater likelihood of a sentenceto incarceration and longer averagesentences.
14 State Court Sentencing of Convicted Felons, 1992
State Court Sentencing of Convicted Felons, 1992 15
Table 2.1. Sex, race, and age of persons convicted of felonies in State courts by offense, 1992
Percent of convicted felons who wereMost serious Sex Race Ageconviction offense Total Male Female White Black Other 14-19 20-29 30-39 40-49 50-59 60+
All offenses 100% 87% 13% 52% 47% 1% 9% 46% 31% 10% 3% 1%
Violent offenses 100% 93% 7% 48% 50% 2% 13% 46% 27% 9% 3% 2%
Murdera 100 90 10 41 58 1 18 46 23 9 3 1Rape 100 98 2 66 30 4 6 38 33 13 6 4Robbery 100 94 6 34 65 1 18 53 23 5 1 --Aggravated assault 100 90 10 50 48 2 10 45 29 10 4 2Other violentb 100 93 7 72 27 1 7 37 32 15 5 4
Property offenses 100% 83% 17% 58% 41% 1% 11% 48% 29% 9% 2% 1%
Burglary 100 95 5 60 39 1 14 52 26 7 1 --Larcenyc 100 81 19 57 42 1 12 46 29 10 2 1Fraudd 100 62 38 57 42 1 4 45 35 12 3 1
Drug offenses 100% 85% 15% 44% 55% 1% 7% 46% 34% 10% 2% 1%
Possession 100 83 17 44 55 1 7 42 37 12 2 --Trafficking 100 86 14 44 55 1 7 49 33 9 2 --
Weapons offenses 100% 96% 4% 39% 60% 1% 13% 49% 25% 10% 2% 1%
Other offenses e 100% 90% 10% 64% 34% 2% 7% 41% 34% 13% 4% 1%
Note: See note on table 1.1. Detail may not sum tototal because of rounding. Data on sex were avail-able for 781,681 cases; on race, 550,405; and onage, 712,679.
--Less than 0.5%.aIncludes nonnegligent manslaughter.bIncludes offenses such as negligent man-slaughter, sexual assault, and kidnaping.cIncludes motor vehicle theft.
dIncludes forgery and embezzlement.eComposed of nonviolent offenses such asreceiving stolen property and driving whileintoxicated.
16 State Court Sentencing of Convicted Felons, 1992
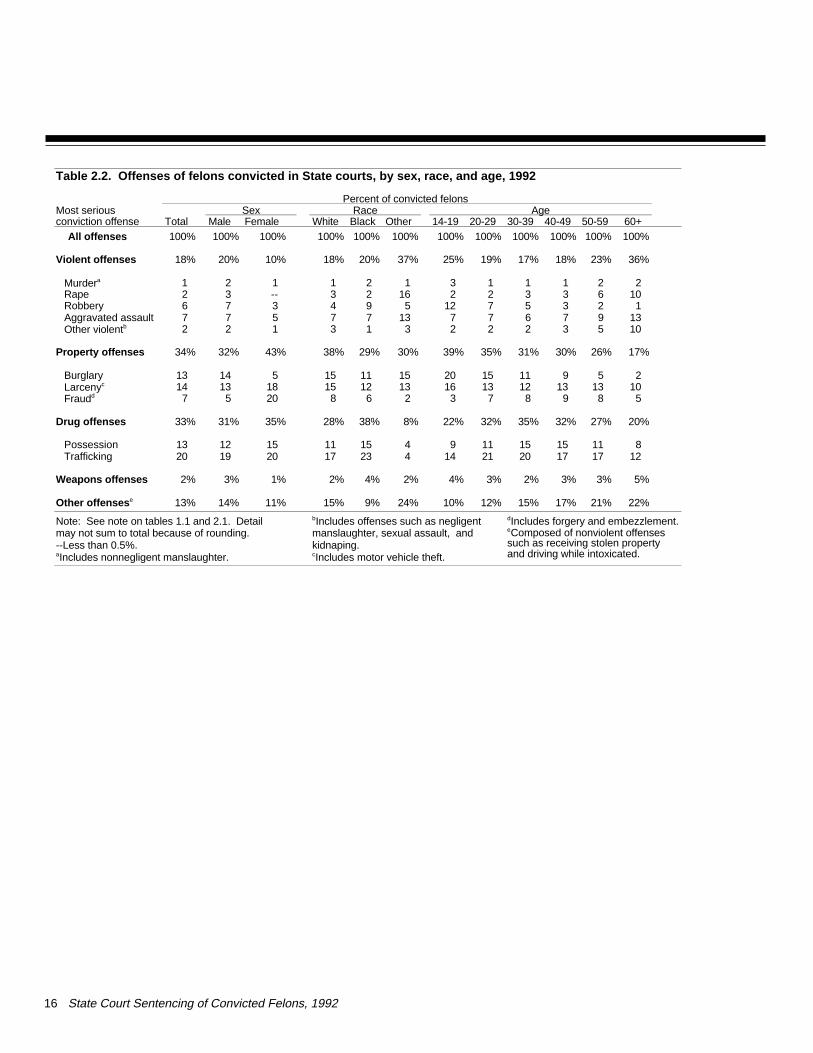
Table 2.2. Offenses of felons convicted in State courts, by sex, race, and age, 1992
Percent of convicted felons Most serious Sex Race Ageconviction offense Total Male Female White Black Other 14-19 20-29 30-39 40-49 50-59 60+
All offenses 100% 100% 100% 100% 100% 100% 100% 100% 100% 100% 100% 100%
Violent offenses 18% 20% 10% 18% 20% 37% 25% 19% 17% 18% 23% 36%
Murdera 1 2 1 1 2 1 3 1 1 1 2 2Rape 2 3 -- 3 2 16 2 2 3 3 6 10Robbery 6 7 3 4 9 5 12 7 5 3 2 1Aggravated assault 7 7 5 7 7 13 7 7 6 7 9 13Other violentb 2 2 1 3 1 3 2 2 2 3 5 10
Property offenses 34% 32% 43% 38% 29% 30% 39% 35% 31% 30% 26% 17%
Burglary 13 14 5 15 11 15 20 15 11 9 5 2Larcenyc 14 13 18 15 12 13 16 13 12 13 13 10Fraudd 7 5 20 8 6 2 3 7 8 9 8 5
Drug offenses 33% 31% 35% 28% 38% 8% 22% 32% 35% 32% 27% 20%
Possession 13 12 15 11 15 4 9 11 15 15 11 8Trafficking 20 19 20 17 23 4 14 21 20 17 17 12
Weapons offenses 2% 3% 1% 2% 4% 2% 4% 3% 2% 3% 3% 5%
Other offenses e 13% 14% 11% 15% 9% 24% 10% 12% 15% 17% 21% 22%
Note: See note on tables 1.1 and 2.1. Detail may not sum to total because of rounding. --Less than 0.5%.aIncludes nonnegligent manslaughter.
bIncludes offenses such as negligentmanslaughter, sexual assault, andkidnaping.cIncludes motor vehicle theft.
dIncludes forgery and embezzlement.eComposed of nonviolent offensessuch as receiving stolen propertyand driving while intoxicated.
State Court Sentencing of Convicted Felons, 1992 17
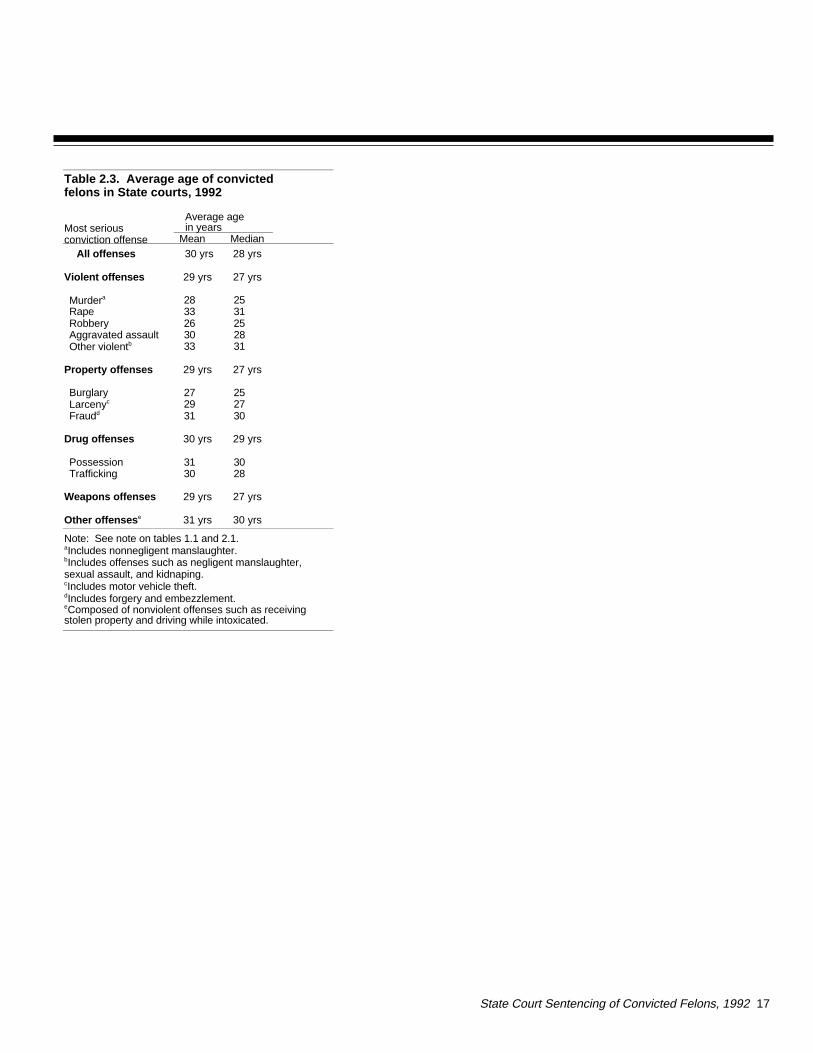
Table 2.3. Average age of convicted felons in State courts, 1992
Most serious conviction offense
Average age in years Mean Median
All offenses 30 yrs 28 yrs
Violent offenses 29 yrs 27 yrs
Murdera 28 25Rape 33 31Robbery 26 25Aggravated assault 30 28Other violentb 33 31
Property offenses 29 yrs 27 yrs
Burglary 27 25Larcenyc 29 27Fraudd 31 30
Drug offenses 30 yrs 29 yrs
Possession 31 30Trafficking 30 28
Weapons offenses 29 yrs 27 yrs
Other offenses e 31 yrs 30 yrs
Note: See note on tables 1.1 and 2.1. aIncludes nonnegligent manslaughter.bIncludes offenses such as negligent manslaughter, sexual assault, and kidnaping.cIncludes motor vehicle theft.dIncludes forgery and embezzlement.eComposed of nonviolent offenses such as receiving stolen property and driving while intoxicated.
18 State Court Sentencing of Convicted Felons, 1992
Table 2.4. Types of sentences imposed by State courts,by sex of felons, 1992
Percent of felons sentenced to Most serious conviction offense
Incarceration NonincarcerationTotal Total Prison Jail Total Probation Other
Male
All offenses 100% 74% 48% 27% 26% 25% 1%
Violent offenses 100% 83% 61% 22% 17% 17% 1%
Murdera 100 97 93 4 3 3 --Rape 100 87 67 20 13 13 --Robbery 100 89 74 15 11 11 --Aggravated assault 100 76 46 30 24 23 1Other violentb 100 70 40 30 30 30 1
Property offenses 100% 72% 46% 26% 28% 27% 1%Burglary 100 77 54 23 23 22 1Larcenyc 100 71 41 29 29 29 1Fraudd 100 61 37 24 39 38 1
Drug offenses 100% 75% 45% 29% 25% 25% 1%
Possession 100 68 37 31 32 31 1Trafficking 100 79 51 28 21 21 --
Weapons offenses 100% 69% 42% 27% 31% 30% 1%
Other offenses e 100% 68% 37% 31% 32% 30% 1%
Female
All offenses 100% 56% 30% 27% 44% 43% 1%
Violent offenses 100% 69% 42% 27% 31% 31% 1%
Murdera 100 92 84 8 8 8 0Rape 100 78 42 36 22 22 0Robbery 100 77 54 23 23 23 1Aggravated assault 100 60 30 31 40 39 1Other violentb 100 66 29 37 34 33 --
Property offenses 100% 50% 27% 23% 50% 49% 2%Burglary 100 67 37 30 33 33 --Larcenyc 100 53 27 26 47 46 2Fraudd 100 43 23 20 57 55 2
Drug offenses 100% 61% 31% 30% 39% 38% 1%
Possession 100 58 27 31 42 41 1Trafficking 100 64 34 30 36 36 1
Weapons offenses 100% 51% 27% 25% 49% 48% 1%
Other offenses e 100% 54% 26% 28% 46% 44% 2%
Note: See note on tables 1.1 and 2.1. Detail may not sum to total because of rounding. Data on sentence type by sex were available for 775,026 cases; and by race, 538,727. Some estimates in this table are based on as few as 1 case and are therefore unreliable.--Less than 0.5%.aIncludes nonnegligent manslaughter.bIncludes offenses such as negligent manslaughter, sexual assault, and kidnaping.cIncludes motor vehicle theft.dIncludes forgery and embezzlement.eComposed of nonviolent offenses such as receiving stolen property and driving while intoxicated.
State Court Sentencing of Convicted Felons, 1992 19
Table 2.5. Types of sentences imposed by State courts,by race of felons, 1992
Percent of felons sentenced to Most serious conviction offense
Incarceration NonincarcerationTotal Total Prison Jail Total Probation Other
White
All offenses 100% 74% 42% 32% 26% 26% 1%
Violent offenses 100% 81% 55% 25% 19% 19% 1%
Murdera 100 97 90 7 3 3 --Rape 100 86 62 24 14 14 1Robbery 100 89 72 18 11 10 1Aggravated assault 100 73 39 34 27 26 1Other violentb 100 71 45 26 29 28 1
Property offenses 100% 70% 43% 28% 30% 29% 1%Burglary 100 78 52 26 22 22 --Larcenyc 100 69 37 33 31 30 1Fraudd 100 58 36 22 42 41 1
Drug offenses 100% 75% 34% 41% 25% 24% 1%
Possession 100 69 29 40 31 30 1Trafficking 100 80 37 42 20 20 1
Weapons offenses 100% 72% 38% 35% 28% 27% 1%
Other offenses e 100% 71% 38% 32% 29% 28% 1%
Black
All offenses 100% 75% 56% 19% 25% 24% 1%
Violent offenses 100% 85% 69% 17% 15% 14% --
Murdera 100 97 94 2 4 4 0Rape 100 90 82 8 10 10 --Robbery 100 90 77 13 10 9 --Aggravated assault 100 78 53 24 22 22 1Other violentb 100 72 44 28 28 28 0
Property offenses 100% 72% 53% 19% 28% 28% 1%Burglary 100 80 63 17 20 19 1Larcenyc 100 72 51 21 28 28 1Fraudd 100 55 38 17 45 44 1
Drug offenses 100% 74% 54% 20% 26% 26% 1%
Possession 100 66 44 23 34 33 1Trafficking 100 79 60 18 21 21 --
Weapons offenses 100% 68% 50% 19% 32% 31% 1%
Other offenses e 100% 70% 52% 18% 30% 29% 1%
Note: See note on tables 1.1, 1.2, and 2.1. Detail may not sum to total because of rounding. Data on sentence type by sex were available for 775,026 cases; and by race, 538,727. Some estimates in this table are based on as few as 1 case and are therefore unreliable.--Less than 0.5%.aIncludes nonnegligent manslaughter.bIncludes offenses such as negligent manslaughter, sexual assault, and kidnaping.cIncludes motor vehicle theft.dIncludes forgery and embezzlement.eComposed of nonviolent offenses such as receiving stolen property and driving while intoxicated.
20 State Court Sentencing of Convicted Felons, 1992
Table 2.6. Mean sentence lengths for felony sentences imposed by State courts, by sex of felons, 1992
Maximum sentence length inmonths for felons sentenced to
Most serious Incarcerationconviction offense Total Prison Jail ProbationMale
All offenses 54 mo 80 mo 7 mo 47 mo
Violent offenses 94 mo 125 mo 8 mo 53 mo
Murdera 241 254 10 70Rape 125 161 8 70Robbery 99 115 11 63Aggravated assault 57 89 7 44Other violentb 57 91 6 52
Property offenses 47 mo 69 mo 7 mo 47 moBurglary 57 78 8 55Larcenyc 34 54 7 42Fraudd 49 76 6 44
Drug offenses 45 mo 68 mo 7 mo 48 mo
Possession 33 56 4 43Trafficking 51 74 8 52
Weapons offenses 33 mo 50 mo 5 mo 39 mo
Other offenses e 32 mo 52 mo 7 mo 43 mo
Female
All offenses 35 mo 60 mo 6 mo 43 mo
Violent offenses 60 mo 94 mo 6 mo 49 mo
Murdera 187 203 15 98Rape 64 105 8 50Robbery 58 77 9 66Aggravated assault 36 67 5 39Other violentb 33 65 6 60
Property offenses 32 mo 55 mo 5 mo 42 moBurglary 29 49 5 47Larcenyc 28 48 6 40Fraudd 37 64 4 43
Drug offenses 30 mo 53 mo 6 mo 47 mo
Possession 22 43 4 41Trafficking 36 60 8 52
Weapons offenses 139 mo 257 mo 3 mo 32 mo
Other offenses e 21 mo 37 mo 5 mo 38 mo Note: See note on tables 1.1, 1.2, and 2.1. Detail may not sum to total because of rounding. Data on sentence type by sex were available for 775,026 cases; and by race, 538,727. Some estimates in this table are based on as few as 1 case and are therefore unreliable.aIncludes nonnegligent manslaughter.bIncludes offenses such as negligent manslaughter, sexual assault, and kidnaping.cIncludes motor vehicle theft.dIncludes forgery and embezzlement.eComposed of nonviolent offenses such as receiving stolen property and driving while intoxicated.
State Court Sentencing of Convicted Felons, 1992 21
Table 2.7. Mean sentence lengths for felony sentences imposed by State courts, by race of felons, 1992
Maximum sentence length inmonths for felons sentenced to
Most serious conviction offense
IncarcerationTotal Prison Jail Probation
White
All offenses 45 mo 74 mo 7 mo 45 mo
Violent offenses 84 mo 120 mo 8 mo 51 mo
Murdera 208 229 12 71Rape 120 163 9 73Robbery 90 110 11 59Aggravated assault 47 81 7 43Other violentb 62 93 7 53
Property offenses 45 mo 70 mo 8 mo 45 moBurglary 58 82 9 53Larcenyc 31 53 7 41Fraudd 45 68 7 41
Drug offenses 30 mo 59 mo 6 mo 45 mo
Possession 22 47 4 42Trafficking 35 65 8 48
Weapons offenses 29 mo 51 mo 5 mo 36 mo
Other offenses e 23 mo 37 mo 7 mo 41 mo
Black
All offenses 63 mo 81 mo 7 mo 49 mo
Violent offenses 101 mo 123 mo 8 mo 54 mo
Murdera 241 248 8 86Rape 148 161 9 61Robbery 100 115 11 70Aggravated assault 62 86 7 42Other violentb 49 77 5 66
Property offenses 51 mo 67 mo 7 mo 49 mo
Burglary 58 72 8 63Larcenyc 40 53 8 42Fraudd 62 86 6 45
Drug offenses 52 mo 69 mo 7 mo 49 moPossession 39 58 4 42Trafficking 59 75 9 56
Weapons offenses 43 mo 57 mo 5 mo 34 mo
Other offenses e 56 mo 73 mo 8 mo 50 mo
Note: See note on tables 1.1, 1.2, and 1.3. Data on sentence length by sex were available for 557,592 cases; and by race, 400,207. Some estimates in this table are based on as few as 1 case and are therefore unreliable.aIncludes nonnegligent manslaughter.bIncludes offenses such as negligent manslaughter, sexual assault, and kidnaping.cIncludes motor vehicle theft.dIncludes forgery and embezzlement.eComposed of nonviolent offenses such as receiving stolen property and driving while intoxicated.
22 State Court Sentencing of Convicted Felons, 1992
Table 2.8. Offenses of felons sentenced to incarceration orprison, by sex and race, in State courts, 1992
Percent of convictionsMost serious conviction offense
Sex RaceTotal Male Female White Black
Sentenced to incarceration
All offenses 100% 100% 100% 100% 100%
Violent offenses 21% 23% 13% 19% 23%
Murdera 2 2 2 2 2Rape 3 3 1 4 2Robbery 8 8 4 5 10Aggravated assault 7 7 6 7 7Other violentb 2 2 1 3 1
Property offenses 32% 31% 38% 36% 28%
Burglary 14 15 6 16 12Larcenyc 12 12 17 14 11Fraudd 5 4 15 6 5
Drug offenses 32% 31% 38% 28% 38%Possession 11 11 16 10 13Trafficking 21 20 22 18 24
Weapons offenses 3% 3% 1% 2% 3%
Other offenses e 12% 13% 10% 14% 8%
Sentenced to prison
All offenses 100% 100% 100% 100% 100%
Violent offenses 25% 26% 15% 23% 25%
Murdera 3 3 3 3 3Rape 4 4 1 5 2Robbery 10 10 5 7 12Aggravated assault 7 7 5 6 7Other violentb 2 2 1 3 1
Property offenses 32% 31% 39% 39% 27%
Burglary 15 16 6 19 13Larcenyc 11 11 17 13 11Fraudd 5 4 16 7 4
Drug offenses 30% 29% 36% 23% 36%Possession 10 9 14 8 12Trafficking 20 20 22 15 25
Weapons offenses 3% 3% 1% 2% 3%
Other offenses e 11% 11% 9% 14% 8%
Note: See note on tables 1.1, 1.2, and 2.1. Detail may not sum to total because of rounding.aIncludes nonnegligent manslaughter.bIncludes offenses such as negligent manslaughter, sexual assault, and kidnaping.cIncludes motor vehicle theft.dIncludes forgery and embezzlement.eComposed of nonviolent offenses such as receiving stolen property and driving while intoxicated.
State Court Sentencing of Convicted Felons, 1992 23
Table 2.9. Offenses of felons sentenced to jail or probation, by sex and race, in State courts, 1992
Percent of convictionsMost serious conviction offense
Sex RaceTotal Male Female White Black
Sentenced to jail
All offenses 100% 100% 100% 100% 100%
Violent offenses 16% 16% 11% 14% 18%
Murdera -- -- -- -- --Rape 2 2 -- 2 1Robbery 4 4 2 2 6Aggravated assault 8 8 6 7 9Other violentb 2 3 2 2 2
Property offenses 31% 30% 38% 33% 29%Burglary 11 12 6 13 10Larcenyc 14 14 18 15 13Fraudd 6 4 15 5 6
Drug offenses 36% 34% 40% 36% 41%
Possession 14 13 18 14 18Trafficking 21 20 22 22 23
Weapons offenses 3% 3% 1% 2% 4%
Other offenses e 15% 17% 11% 15% 9%
Sentenced to probation
All offenses 100% 100% 100% 100% 100%
Violent offenses 12% 14% 8% 13% 12%
Murdera -- -- -- -- --Rape 1 1 -- 2 1Robbery 2 3 2 2 3Aggravated assault 6 6 5 7 6Other violentb 2 3 1 3 1
Property offenses 38% 35% 49% 43% 33%Burglary 11 13 4 13 9Larcenyc 15 14 20 17 13Fraudd 11 8 26 12 11
Drug offenses 31% 31% 31% 26% 40%
Possession 15 15 15 13 20Trafficking 16 16 16 13 20
Weapons offenses 3% 4% 1% 2% 5%
Other offenses e 15% 17% 11% 17% 11%
Note: See note on tables 1.1, 1.2, and 2.1. Detail may not sum to total because of rounding.--Less than 0.5%.aIncludes nonnegligent manslaughter.bIncludes offenses such as negligent manslaughter, sexual assault, and kidnaping.cIncludes motor vehicle theft.dIncludes forgery and embezzlement.eComposed of nonviolent offenses such as receiving stolen property and driving while intoxicated.
24 State Court Sentencing of Convicted Felons, 1992
Table 2.10. Percent of all convicted felons sentenced to incarceration or prison, by sex and race, 1992
Percent receiving designated sentenceMost serious conviction offense
White BlackMale Female Male Female
Sentenced toincarceration
All offenses 76% 59% 78% 58%
Violent offenses 82% 66% 87% 69%
Murdera 97 94 97 92Rape 86 ** 90 **Robbery 90 76 91 79Aggravated assault 75 58 80 59Other violentb 72 63 71 77
Property offenses 74% 54% 76% 52%
Burglary 78 71 81 67Larcenyc 71 56 76 57Fraudd 65 47 63 45
Drug offenses 77% 65% 76% 62%
Possession 70 63 68 58Trafficking 82 67 80 66
Weapons offenses 73% 46% 69% 55%
Other offenses e 72% 57% 72% 57%
Sentenced to prison
All offenses 44% 30% 59% 38%
Violent offenses 56% 40% 71% 47%
Murdera 91 82 95 84Rape 63 ** 82 **Robbery 73 57 79 57Aggravated assault 40 27 56 34Other violentb 47 24 43 54
Property offenses 45% 29% 57% 35%
Burglary 52 42 64 44Larcenyc 39 25 54 39Fraudd 41 29 45 29
Drug offenses 35% 28% 56% 38%
Possession 30 27 46 31Trafficking 39 29 62 44
Weapons offenses 38% 18% 50% 38%
Other offenses e 39% 29% 53% 38%
Note: See note on tables 1.1, 1.2, and 2.1. Detail may not sum to total because of rounding.**Not calculated.aIncludes nonnegligent manslaughter.bIncludes offenses such as negligent manslaughter, sexual assault, and kidnaping.cIncludes motor vehicle theft.dIncludes forgery and embezzlement.eComposed of nonviolent offenses such as receiving stolen property and driving while intoxicated.
State Court Sentencing of Convicted Felons, 1992 25
Table 2.11. Percent of all convicted felons sentenced to jail orprobation, by sex and race, 1992
Percent receiving designated sentenceMost serious conviction offense
White BlackMale Female Male Female
Sentenced to jail
All offenses 32% 30% 18% 21%
Violent offenses 25% 27% 16% 22%
Murdera 6 12 2 8Rape 24 ** 8 **Robbery 18 19 13 22Aggravated assault 35 30 24 26Other violentb 25 40 28 23
Property offenses 28% 25% 19% 18%
Burglary 26 29 17 23Larcenyc 33 31 22 18Fraudd 24 19 18 16
Drug offenses 42% 37% 19% 24%
Possession 41 36 22 26Trafficking 43 38 18 22
Weapons offenses 35% 29% 19% 17%
Other offenses e 33% 28% 18% 19%
Sentenced to probation
All offenses 24% 41% 23% 42%
Violent offenses 19% 34% 13% 31%
Murdera 3 6 3 8Rape 14 ** 10 **Robbery 10 24 9 21Aggravated assault 25 42 20 41Other violentb 29 37 29 23
Property offenses 27% 47% 24% 48%
Burglary 22 29 19 33Larcenyc 29 44 24 43Fraudd 35 53 37 55
Drug offenses 23% 35% 24% 38%
Possession 30 37 32 43Trafficking 18 33 20 34
Weapons offenses 27% 54% 31% 45%
Other offenses e 28% 43% 28% 43%
Note: See note on tables 1.1, 1.2, and 2.1. Data on sentence type by sex and race were available for 538,669 cases.**Not calculated.aIncludes nonnegligent manslaughter.bIncludes offenses such as negligent manslaughter, sexual assault, and kidnaping.cIncludes motor vehicle theft.dIncludes forgery and embezzlement.eComposed of nonviolent offenses such as receiving stolen property and driving while intoxicated.

26 State Court Sentencing of Convicted Felons, 1992
Table 2.12. Mean State felony sentence lengths, by sex, race, and type of felony sentences, 1992
Mean sentence length in months for felons who were
Most serious conviction offense
White BlackMale Female Male Female
Sentenced toincarceration
All offenses 46 mo 32 mo 65 mo 40 mo
Violent offenses 85 mo 58 mo 103 mo 65 mo
Murdera 212 179 245 199Rape 120 ** 148 **Robbery 93 54 102 59Aggravated assault 47 38 65 35Other violentb 64 28 46 90
Property offenses 47 mo 34 mo 54 mo 31 mo
Burglary 59 29 59 34Larcenyc 33 19 42 29Fraudd 43 49 76 33
Drug offenses 31 mo 26 mo 54 mo 36 mo
Possession 22 19 42 26Trafficking 35 31 61 44
Weapons offenses 29 mo 16 mo 34 mo 244 mo
Other offenses e 24 mo 20 mo 59 mo 26 mo
Sentenced to prison
All offenses 75 mo 58 mo 84 mo 59 mo
Violent offenses 121 mo 95 mo 125 mo 92 mo
Murdera 231 204 251 216Rape 163 ** 162 **Robbery 112 68 117 78Aggravated assault 82 75 89 57Other violentb 95 59 73 119
Property offenses 71 mo 58 mo 70 mo 44 mo
Burglary 83 45 72 50Larcenyc 55 35 56 38Fraudd 63 77 102 50
Drug offenses 60 mo 53 mo 71 mo 55 mo
Possession 48 41 59 45Trafficking 65 61 76 61
Weapons offenses 51 mo 35 mo 45 mo 358 mo
Other offenses e 38 mo 36 mo 77 mo 36 moNote: See note on tables 1.1, 1.2, and 2.1. Data on sentence length by sex and race were available for 534,919 cases.**Not calculated.aIncludes nonnegligent manslaughter.bIncludes offenses such as negligent manslaughter, sexual assault, and kidnaping.cIncludes motor vehicle theft.dIncludes forgery and embezzlement.eComposed of nonviolent offenses such as receiving stolen property and driving while intoxicated.
State Court Sentencing of Convicted Felons, 1992 27
Table 2.13. Mean State felony sentence lengths, by sex, race,and type of felony sentences, 1992
Mean sentence length in months for felons who were
Most serious conviction offense
White BlackMale Female Male Female
Sentenced to jail
All offenses 7 mo 6 mo 7 mo 6 mo
Violent offenses 8 mo 7 mo 9 mo 6 mo
Murdera 10 22 7 8Rape 9 ** 9 **Robbery 12 9 11 8Aggravated assault 7 5 7 5Other violentb 7 8 5 2
Property offenses 8 mo 6 mo 8 mo 6 mo
Burglary 10 6 8 5Larcenyc 7 7 7 8Fraudd 8 6 7 4
Drug offenses 7 mo 6 mo 7 mo 6 mo
Possession 4 3 4 4Trafficking 8 8 9 8
Weapons offenses 5 mo 3 mo 5 mo 3 mo
Other offenses e 7 mo 4 mo 8 mo 5 mo
Sentenced to probation
All offenses 46 mo 43 mo 50 mo 46 mo
Violent offenses 52 mo 46 mo 55 mo 50 mo
Murdera 76 53 76 125Rape 74 ** 62 **Robbery 59 61 69 74Aggravated assault 44 34 43 38Other violentb 51 72 65 98
Property offenses 46 mo 41 mo 51 mo 44 mo
Burglary 53 51 64 55Larcenyc 42 39 43 39Fraudd 41 41 43 47
Drug offenses 44 mo 49 mo 50 mo 45 mo
Possession 42 43 42 39Trafficking 46 55 57 51
Weapons offenses 37 mo 28 mo 35 mo 29 mo
Other offenses e 43 mo 33 mo 48 mo 55 mo
Note: See note on tables 1.1, 1.2, and 2.1. Data on sentence length by sex and race were available for 534,919 cases.**Not calculated.aIncludes nonnegligent manslaughter.bIncludes offenses such as negligent manslaughter, sexual assault, and kidnaping.cIncludes motor vehicle theft.dIncludes forgery and embezzlement.eComposed of nonviolent offenses such as receiving stolen property and driving while intoxicated.
28 State Court Sentencing of Convicted Felons, 1992
Table 2.14. Population percent of U.S. residents, by region and race, 1990
RaceOutside the South
Total South Total Northeast Midwest West
Total 100% 34% 66% 20% 24% 21%
White 100 33 67 21 26 20Black 100 53 47 19 19 9Other 100 21 79 16 10 52
Total 100% 100% 100% 100% 100% 100%
White 80 77 82 83 87 76Black 12 19 9 11 10 5Other 8 5 9 6 3 19
Note: Detail may not sum to total because of rounding.Source: Statistical Abstract of the United States, 1994.
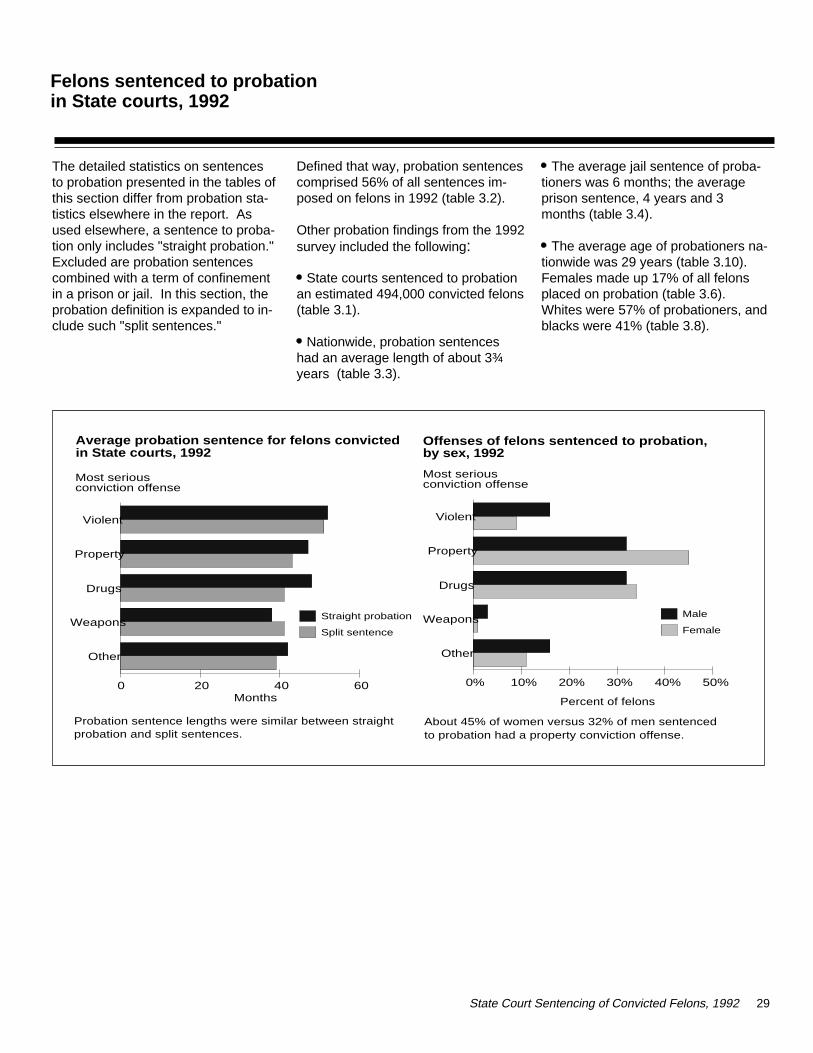
The detailed statistics on sentences to probation presented in the tables ofthis section differ from probation sta-tistics elsewhere in the report. Asused elsewhere, a sentence to proba-tion only includes "straight probation."Excluded are probation sentencescombined with a term of confinementin a prison or jail. In this section, theprobation definition is expanded to in-clude such "split sentences."
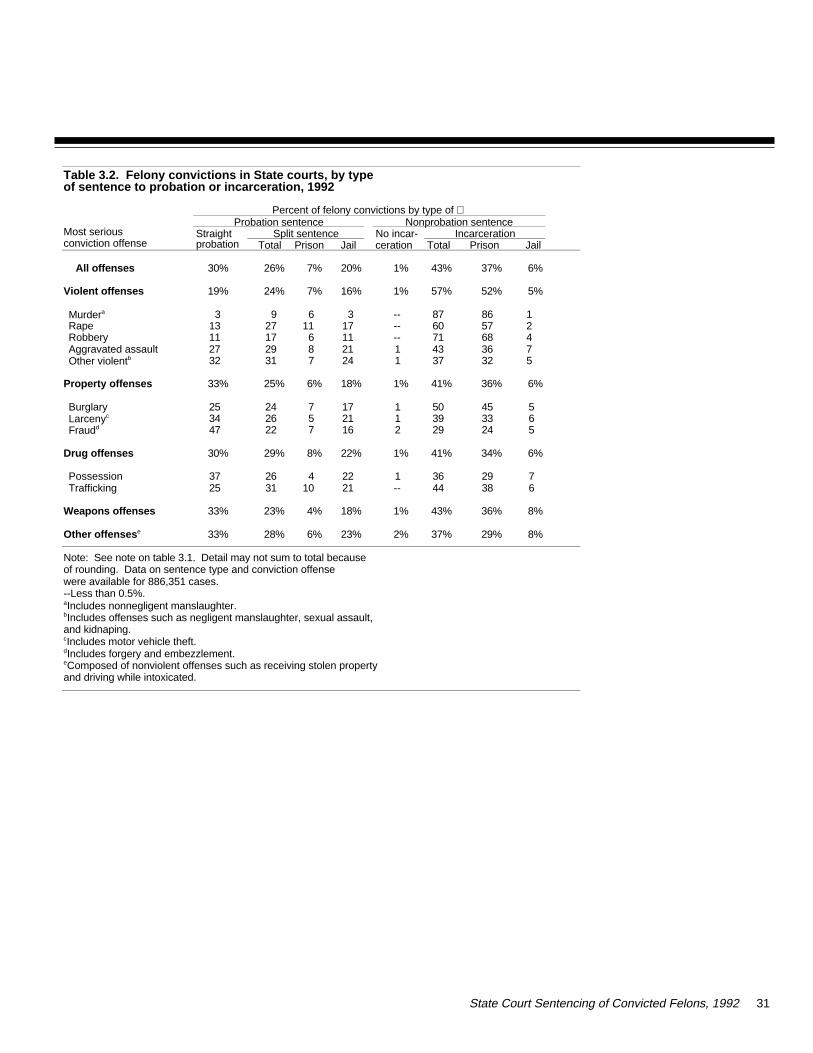
Defined that way, probation sentencescomprised 56% of all sentences im-posed on felons in 1992 (table 3.2).
Other probation findings from the 1992survey included the following:
State courts sentenced to probation an estimated 494,000 convicted felons(table 3.1).
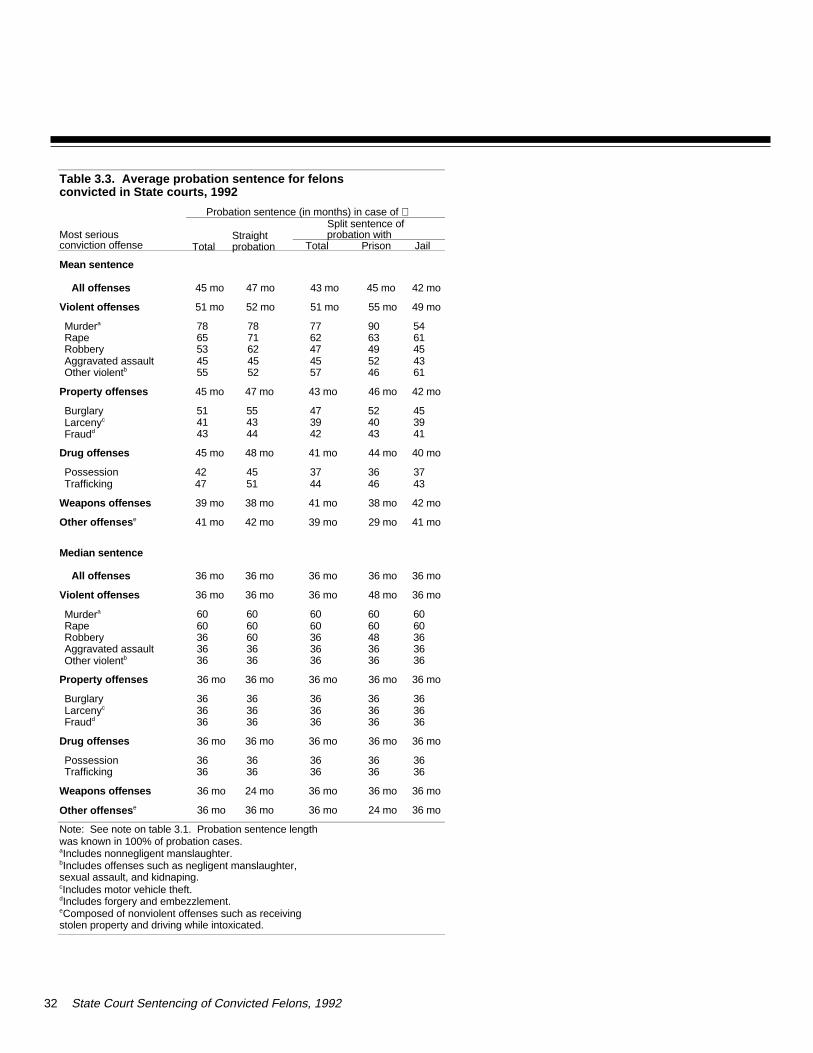
Nationwide, probation sentenceshad an average length of about 3¾ years (table 3.3).
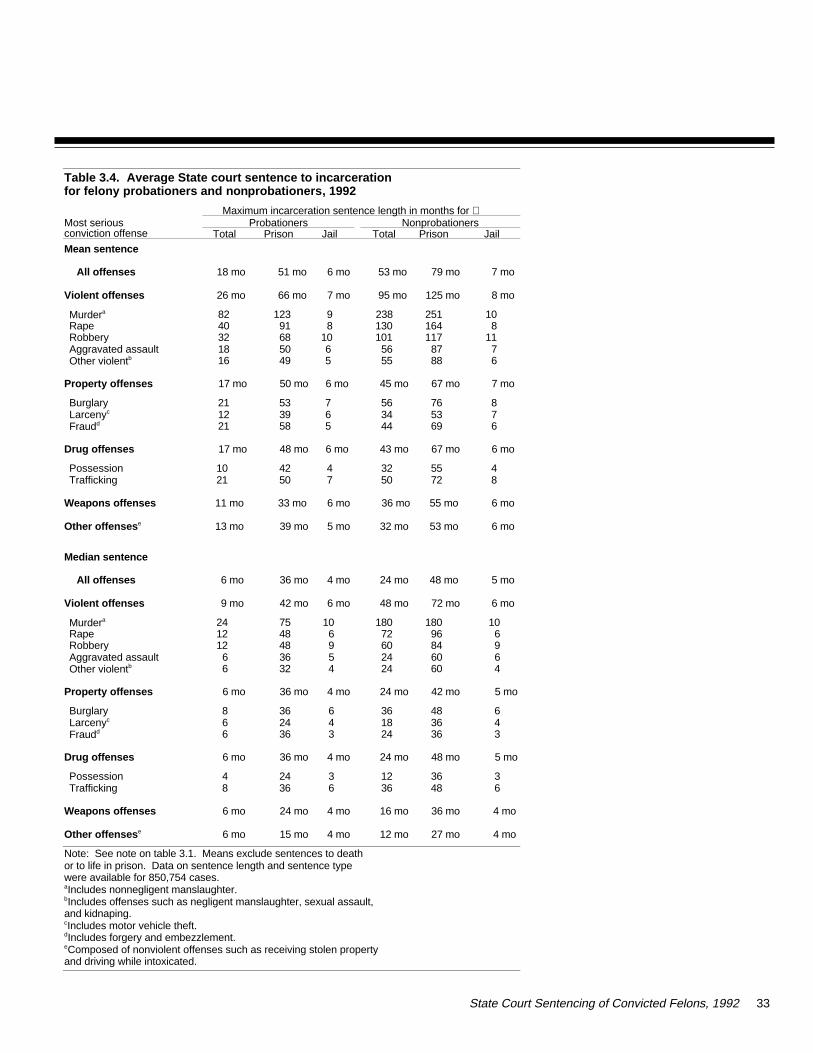
The average jail sentence of proba-tioners was 6 months; the averageprison sentence, 4 years and 3months (table 3.4).
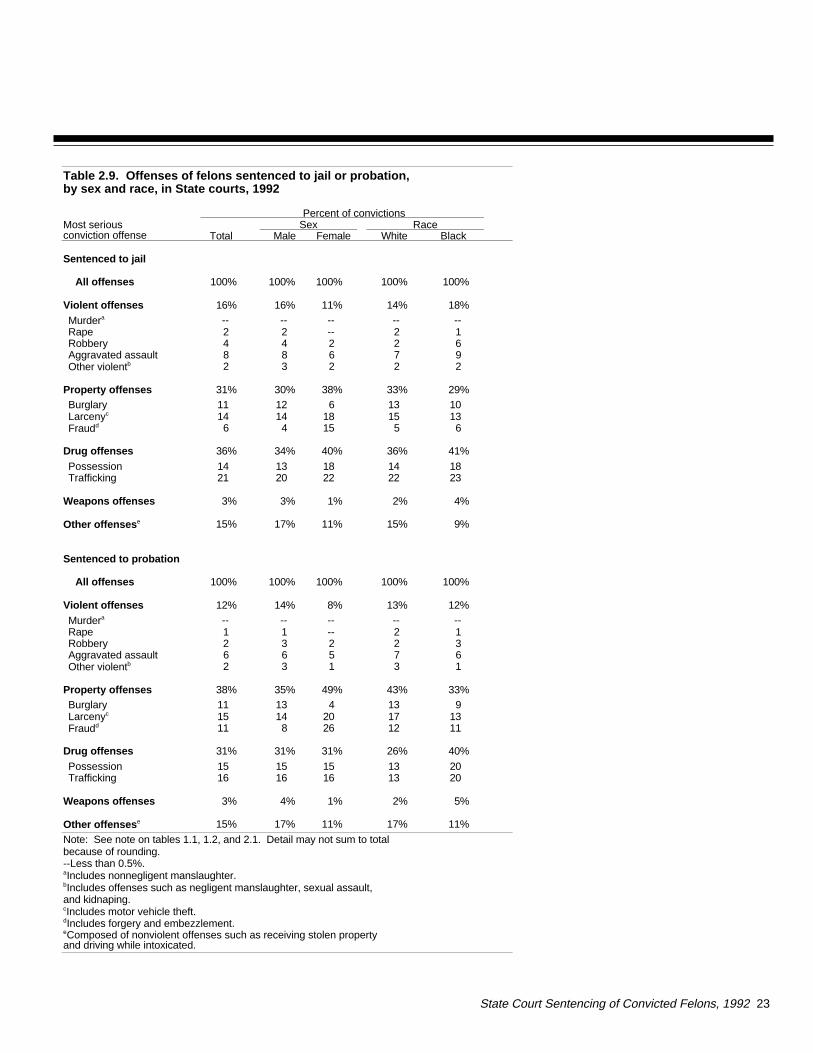
The average age of probationers na-tionwide was 29 years (table 3.10).Females made up 17% of all felonsplaced on probation (table 3.6).Whites were 57% of probationers, andblacks were 41% (table 3.8).
State Court Sentencing of Convicted Felons, 1992 29
Violent
Property
Drugs
Weapons
Other
0% 10% 20% 30% 40% 50%
Male
Female
Violent
Property
Drugs
Weapons
Other
0 20 40 60
Straight probation
Split sentence
Most seriousconviction offense
Months
Most seriousconviction offense
Percent of felons
Probation sentence lengths were similar between straight probation and split sentences.
Average probation sentence for felons convictedin State courts, 1992
About 45% of women versus 32% of men sentencedto probation had a property conviction offense.
Offenses of felons sentenced to probation, by sex, 1992
Felons sentenced to probation in State courts, 1992

30 State Court Sentencing of Convicted Felons, 1992
Table 3.1. Estimated number of felony convictions in State courts, by type of sentence, 1992
Percent of felony convictions by
Most seriousconviction offense
1992 felony convictionsSentence typewithin offense
Offense within sentence type
Total Probation Total ProbationNo pro-bation Total Probation
No pro-bation
All offenses 893,630 493,853 100% 55% 45% 100% 100% 100%
Violent offenses 165,099 69,835 100% 42% 58% 19% 14% 24%
Murdera 12,548 1,568 100 13 88 1 -- 3Rape 21,655 8,574 100 40 60 2 2 3Robbery 51,878 14,535 100 28 72 6 3 9Aggravated assault 58,969 32,783 100 56 44 7 7 7Other violentb 20,049 12,375 100 62 38 2 3 2
Property offenses 297,494 170,403 100% 57% 43% 33% 35% 32%
Burglary 114,630 55,807 100 49 51 13 11 15Larcenyc 119,000 70,742 100 60 41 13 14 12Fraudd 63,864 43,855 100 69 31 7 9 5
Drug offenses 280,232 162,603 100% 58% 42% 31% 33% 29%
Possession 109,426 68,709 100 63 37 12 14 10Trafficking 170,806 93,894 100 55 45 19 19 19
Weapons offenses 26,422 14,663 100% 56% 45% 3% 3% 3%
Other offenses e 124,383 76,350 100% 62% 39% 14% 16% 12%
Note: Detail may not sum to total because of rounding.In this table persons are counted as probation cases solong as their sentences included probation and withoutregard to whether a term of incarceration was also included. Dates on sentence type and conviction offensewere available for 892,611 cases.--Less than 0.5%.
aIncludes nonnegligent manslaughter. bIncludes offenses such as negligent manslaughter, sexual assault, and kidnaping.cIncludes motor vehicle theft.dIncludes forgery and embezzlement.eComposed of nonviolent offenses such as receiving stolen property and driving while intoxicated.
State Court Sentencing of Convicted Felons, 1992 31
Table 3.2. Felony convictions in State courts, by type of sentence to probation or incarceration, 1992
Most seriousconviction offense
Percent of felony convictions by type of Probation sentence Nonprobation sentence
Straightprobation
Split sentence No incar- IncarcerationTotal Prison Jail ceration Total Prison Jail
All offenses 30% 26% 7% 20% 1% 43% 37% 6%
Violent offenses 19% 24% 7% 16% 1% 57% 52% 5%
Murdera 3 9 6 3 -- 87 86 1Rape 13 27 11 17 -- 60 57 2Robbery 11 17 6 11 -- 71 68 4Aggravated assault 27 29 8 21 1 43 36 7Other violentb 32 31 7 24 1 37 32 5
Property offenses 33% 25% 6% 18% 1% 41% 36% 6%
Burglary 25 24 7 17 1 50 45 5Larcenyc 34 26 5 21 1 39 33 6Fraudd 47 22 7 16 2 29 24 5
Drug offenses 30% 29% 8% 22% 1% 41% 34% 6%
Possession 37 26 4 22 1 36 29 7Trafficking 25 31 10 21 -- 44 38 6
Weapons offenses 33% 23% 4% 18% 1% 43% 36% 8%
Other offenses e 33% 28% 6% 23% 2% 37% 29% 8%
Note: See note on table 3.1. Detail may not sum to total becauseof rounding. Data on sentence type and conviction offense were available for 886,351 cases.--Less than 0.5%.aIncludes nonnegligent manslaughter.bIncludes offenses such as negligent manslaughter, sexual assault, and kidnaping.cIncludes motor vehicle theft.dIncludes forgery and embezzlement.eComposed of nonviolent offenses such as receiving stolen propertyand driving while intoxicated.
32 State Court Sentencing of Convicted Felons, 1992
Table 3.3. Average probation sentence for felonsconvicted in State courts, 1992
Probation sentence (in months) in case of
Most serious conviction offense Total
Straightprobation
Split sentence of probation with
Total Prison Jail
Mean sentence
All offenses 45 mo 47 mo 43 mo 45 mo 42 mo
Violent offenses 51 mo 52 mo 51 mo 55 mo 49 mo
Murdera 78 78 77 90 54Rape 65 71 62 63 61Robbery 53 62 47 49 45Aggravated assault 45 45 45 52 43Other violentb 55 52 57 46 61
Property offenses 45 mo 47 mo 43 mo 46 mo 42 mo
Burglary 51 55 47 52 45Larcenyc 41 43 39 40 39Fraudd 43 44 42 43 41
Drug offenses 45 mo 48 mo 41 mo 44 mo 40 mo
Possession 42 45 37 36 37Trafficking 47 51 44 46 43
Weapons offenses 39 mo 38 mo 41 mo 38 mo 42 mo
Other offenses e 41 mo 42 mo 39 mo 29 mo 41 mo
Median sentence
All offenses 36 mo 36 mo 36 mo 36 mo 36 mo
Violent offenses 36 mo 36 mo 36 mo 48 mo 36 mo
Murdera 60 60 60 60 60Rape 60 60 60 60 60Robbery 36 60 36 48 36Aggravated assault 36 36 36 36 36Other violentb 36 36 36 36 36
Property offenses 36 mo 36 mo 36 mo 36 mo 36 mo
Burglary 36 36 36 36 36Larcenyc 36 36 36 36 36Fraudd 36 36 36 36 36
Drug offenses 36 mo 36 mo 36 mo 36 mo 36 mo
Possession 36 36 36 36 36Trafficking 36 36 36 36 36
Weapons offenses 36 mo 24 mo 36 mo 36 mo 36 mo
Other offenses e 36 mo 36 mo 36 mo 24 mo 36 mo
Note: See note on table 3.1. Probation sentence length was known in 100% of probation cases.aIncludes nonnegligent manslaughter.bIncludes offenses such as negligent manslaughter, sexual assault, and kidnaping.cIncludes motor vehicle theft.dIncludes forgery and embezzlement.eComposed of nonviolent offenses such as receiving stolen property and driving while intoxicated.
State Court Sentencing of Convicted Felons, 1992 33
Table 3.4. Average State court sentence to incarceration for felony probationers and nonprobationers, 1992
Maximum incarceration sentence length in months for Most serious conviction offense
Probationers NonprobationersTotal Prison Jail Total Prison Jail
Mean sentence
All offenses 18 mo 51 mo 6 mo 53 mo 79 mo 7 mo
Violent offenses 26 mo 66 mo 7 mo 95 mo 125 mo 8 mo
Murdera 82 123 9 238 251 10Rape 40 91 8 130 164 8Robbery 32 68 10 101 117 11Aggravated assault 18 50 6 56 87 7Other violentb 16 49 5 55 88 6
Property offenses 17 mo 50 mo 6 mo 45 mo 67 mo 7 mo
Burglary 21 53 7 56 76 8Larcenyc 12 39 6 34 53 7Fraudd 21 58 5 44 69 6
Drug offenses 17 mo 48 mo 6 mo 43 mo 67 mo 6 mo
Possession 10 42 4 32 55 4Trafficking 21 50 7 50 72 8
Weapons offenses 11 mo 33 mo 6 mo 36 mo 55 mo 6 mo
Other offenses e 13 mo 39 mo 5 mo 32 mo 53 mo 6 mo
Median sentence
All offenses 6 mo 36 mo 4 mo 24 mo 48 mo 5 mo
Violent offenses 9 mo 42 mo 6 mo 48 mo 72 mo 6 mo
Murdera 24 75 10 180 180 10Rape 12 48 6 72 96 6Robbery 12 48 9 60 84 9Aggravated assault 6 36 5 24 60 6Other violentb 6 32 4 24 60 4
Property offenses 6 mo 36 mo 4 mo 24 mo 42 mo 5 mo
Burglary 8 36 6 36 48 6Larcenyc 6 24 4 18 36 4Fraudd 6 36 3 24 36 3
Drug offenses 6 mo 36 mo 4 mo 24 mo 48 mo 5 mo
Possession 4 24 3 12 36 3Trafficking 8 36 6 36 48 6
Weapons offenses 6 mo 24 mo 4 mo 16 mo 36 mo 4 mo
Other offenses e 6 mo 15 mo 4 mo 12 mo 27 mo 4 mo
Note: See note on table 3.1. Means exclude sentences to death or to life in prison. Data on sentence length and sentence type were available for 850,754 cases.aIncludes nonnegligent manslaughter.bIncludes offenses such as negligent manslaughter, sexual assault, and kidnaping.cIncludes motor vehicle theft.dIncludes forgery and embezzlement.eComposed of nonviolent offenses such as receiving stolen property and driving while intoxicated.
34 State Court Sentencing of Convicted Felons, 1992
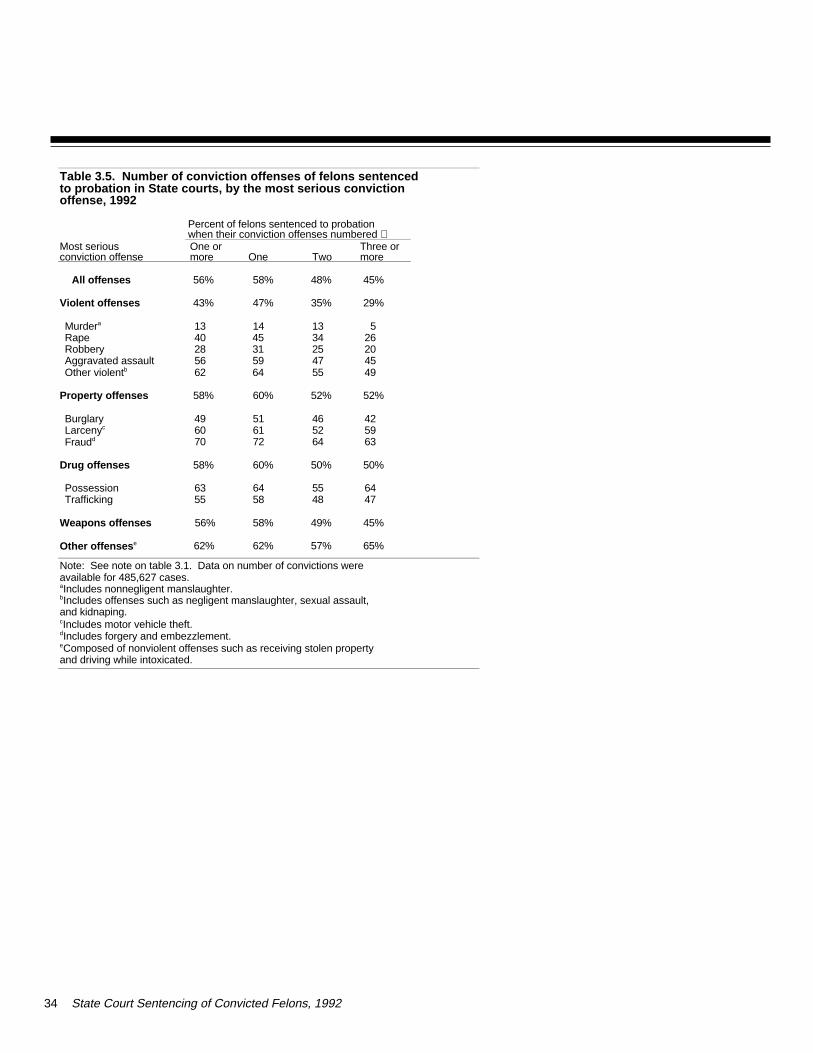
Table 3.5. Number of conviction offenses of felons sentenced to probation in State courts, by the most serious conviction offense, 1992
Percent of felons sentenced to probationwhen their conviction offenses numbered
Most serious conviction offense
One ormore One Two
Three ormore
All offenses 56% 58% 48% 45%
Violent offenses 43% 47% 35% 29%
Murdera 13 14 13 5Rape 40 45 34 26Robbery 28 31 25 20Aggravated assault 56 59 47 45Other violentb 62 64 55 49
Property offenses 58% 60% 52% 52%
Burglary 49 51 46 42Larcenyc 60 61 52 59Fraudd 70 72 64 63
Drug offenses 58% 60% 50% 50%
Possession 63 64 55 64Trafficking 55 58 48 47
Weapons offenses 56% 58% 49% 45%
Other offenses e 62% 62% 57% 65%
Note: See note on table 3.1. Data on number of convictions were available for 485,627 cases.aIncludes nonnegligent manslaughter.bIncludes offenses such as negligent manslaughter, sexual assault, and kidnaping.cIncludes motor vehicle theft.dIncludes forgery and embezzlement.eComposed of nonviolent offenses such as receiving stolen property and driving while intoxicated.

State Court Sentencing of Convicted Felons, 1992 35
Table 3.6. Sex of felons sentenced to probation or nonprobationin State courts, by the most serious conviction offense, 1992
Most seriousconviction offense
Percent of probation sentences
Percent of probation sentences
All Male Female All Male Female
All offenses 100% 83% 17% 100% 91% 9%
Violent offenses 100% 90% 10% 100% 95% 5%
Murdera 100 83 17 100 92 9Rape 100 98 3 100 99 1Robbery 100 91 10 100 95 5Aggravated assault 100 87 13 100 93 7Other violentb 100 92 8 100 95 6
Property offenses 100% 77% 23% 100% 89% 11%
Burglary 100 93 7 100 97 3Larcenyc 100 78 22 100 87 13Fraudd 100 57 43 100 73 27
Drug offenses 100% 82% 18% 100% 89% 11%
Possession 100 81 19 100 87 13Trafficking 100 83 17 100 90 10
Weapons offenses 100% 95% 6% 100% 97% 3%
Other offenses e 100% 87% 13% 100% 93% 7%
Note: See note on tables 2.1 and 3.1. Detail may not sum to total becauseof rounding. Data on sentence type by sex were available for 780,835 cases.aIncludes nonnegligent manslaughter.bIncludes offenses such as negligent manslaughter, sexual assault, and kidnaping.cIncludes motor vehicle theft.dIncludes forgery and embezzlement.eComposed of nonviolent offenses such as receiving stolen property and driving while intoxicated.
36 State Court Sentencing of Convicted Felons, 1992
Table 3.7. Offenses of felons sentenced to probation or nonprobation in State courts, by sex, 1992
Most seriousconviction offense
Percent of probation sentences
Percent of nonprobation sentences
All Male Female All Male Female
All offenses 100% 100% 100% 100% 100% 100%
Violent offenses 15% 16% 9% 24% 25% 15%
Murdera -- -- -- 3 3 3Rape 2 2 -- 3 4 --Robbery 3 4 2 10 10 5Aggravated assault 7 7 5 7 7 5Other violentb 3 3 1 2 2 1
Property offenses 34% 33% 45% 32% 31% 39%
Burglary 11 13 5 15 16 6Larcenyc 14 13 19 12 12 18Fraudd 9 6 22 5 4 15
Drug offenses 33% 32% 34% 30% 29% 37%
Possession 14 13 15 11 10 16Trafficking 19 19 19 19 19 21
Weapons offenses 3% 3% 1% 3% 3% 1%
Other offenses e 15% 16% 11% 12% 12% 9%
Note: See note on tables 2.1 and 3.1. Detail may not sum to total becauseof rounding. Data on sentence type by race were available for 549,740 cases.--Less than 0.5%.aIncludes nonnegligent manslaughter.bIncludes offenses such as negligent manslaughter, sexual assault, and kidnaping.cIncludes motor vehicle theft.dIncludes forgery and embezzlement.eComposed of nonviolent offenses such as receiving stolen propertyand driving while intoxicated.
State Court Sentencing of Convicted Felons, 1992 37
Table 3.8. Race of felons sentenced to probation or nonprobationin State courts, by the most serious conviction offense, 1992
Most seriousconviction offense
Percent of probation sentences Percent of nonprobation sentences All White Black Other All White Black Other
All offenses 100% 57% 41% 1% 100% 47% 53% 1%
Violent offenses 100% 55% 42% 3% 100% 44% 55% 1%
Murdera 100 46 53 2 100 40 59 1Rape 100 70 22 8 100 63 35 1Robbery 100 39 61 1 100 33 66 1Aggravated assault 100 55 43 2 100 45 54 1Other violentb 100 73 26 2 100 70 29 1
Property offenses 100% 62% 36% 1% 100% 54% 45% 1%
Burglary 100 65 33 2 100 55 44 1Larcenyc 100 62 37 2 100 52 48 1Fraudd 100 59 41 1 100 56 44 --
Drug offenses 100% 50% 49% 1% 100% 37% 63% --
Possession 100 50 49 1 100 37 63 --Trafficking 100 51 49 1 100 37 63 --
Weapons offenses 100% 44% 55% 1% 100% 33% 66% 1%
Other offenses e 100% 68% 30% 2% 100% 60% 39% 1%
Note: See note on tables 2.1 and 3.1. Detail may not sum to total becauseof rounding. Data on sentence type by race were available for 549,740 cases.--Less than 0.5%.aIncludes nonnegligent manslaughter.bIncludes offenses such as negligent manslaughter, sexual assault, and kidnaping.cIncludes motor vehicle theft.dIncludes forgery and embezzlement.eComposed of nonviolent offenses such as receiving stolen property and driving while intoxicated.
38 State Court Sentencing of Convicted Felons, 1992
Table 3.9. The most serious conviction offense, by race of felons sentenced to probation or nonprobation in State courts, 1992
Most seriousconviction offense
Percent of probation sentences Percent of nonprobation sentences All White Black Other All White Black Other
All offenses 100% 100% 100% 100% 100% 100% 100% 100%
Violent offenses 15% 15% 15% 26% 24% 22% 25% 33%
Murdera -- -- 1 1 3 2 3 4Rape 2 2 1 11 3 4 2 5Robbery 3 2 5 2 9 7 12 14Aggravated assault 7 7 8 11 7 6 7 9Other violentb 2 3 1 2 2 2 1 1
Property offenses 34% 37% 30% 35% 33% 38% 29% 35%
Burglary 12 13 9 16 16 18 13 19Larcenyc 14 15 12 15 13 14 11 15Fraudd 9 9 9 4 5 6 4 1
Drug offenses 35% 31% 41% 18% 30% 24% 35% 11%
Possession 15 13 17 10 11 9 13 6Trafficking 20 18 24 8 19 15 22 5
Weapons offenses 3% 2% 4% 3% 3% 2% 4% 2%
Other offenses e 13% 16% 10% 18% 11% 14% 8% 19%
Note: See note on tables 2.1, 3.1, and 3.9. Detail may not sum to total because of rounding. --Less than 0.5%. aIncludes nonnegligent manslaughter.bIncludes offenses such as negligent manslaughter, sexual assault, and kidnaping.cIncludes motor vehicle theft.dIncludes forgery and embezzlement.eComposed of nonviolent offenses such as receiving stolen propertyand driving while intoxicated.
State Court Sentencing of Convicted Felons, 1992 39
Table 3.10. Average age of felons sentenced to probation or nonprobation in State courts, 1992
Age at time of sentencingMost seriousconviction offense
Probation Nonprobation Mean Median Mean Median
All offenses 29 years 28 years 30 years 28 years
Violent offenses 30 years 28 years 29 years 27 years
Murdera 30 28 28 25Rape 33 33 33 31Robbery 25 22 27 25Aggravated assault 31 29 29 28Other violentb 33 31 34 31
Property offenses 28 years 26 years 30 years 27 years
Burglary 25 23 29 26Larcenyc 28 26 30 28Fraudd 31 29 32 30
Drug offenses 30 years 29 years 30 years 29 years
Possession 30 30 31 30Trafficking 29 28 30 28
Weapons offenses 29 years 27 years 29 years 26 years
Other offenses e 31 years 29 years 32 years 30 years
Note: See note on tables 2.1 and 3.1.aIncludes nonnegligent manslaughter.bIncludes offenses such as negligent manslaughter, sexual assault, and kidnaping.cIncludes motor vehicle theft.dIncludes forgery and embezzlement.eComposed of nonviolent offenses such as receiving stolen propertyand driving while intoxicated.
40 State Court Sentencing of Convicted Felons, 1992
Table 3.11. Felons sentenced to probation in State courts, by age at sentencing, 1992
Percent of felon age group who received a probation sentence
Most seriousconviction offense
40 orolderUnder 20 20-29 30-39
All offenses 61% 54% 51% 54%
Violent offenses 42% 40% 42% 48%
Murdera 12 12 13 17Rape 47 44 36 45Robbery 39 28 24 26Aggravated assault 51 53 56 59Other violentb 78 61 60 58
Property offenses 69% 58% 49% 52%
Burglary 66 50 37 32Larcenyc 73 61 51 51Fraudd 75 71 63 70
Drug offenses 64% 57% 55% 55%
Possession 65 62 59 57Trafficking 63 54 52 53
Weapons offenses 63% 51% 49% 62%
Other offenses e 70% 61% 58% 60%
Note: See note on tables 2.1 and 3.1.aIncludes nonnegligent manslaughter.bIncludes offenses such as negligent manslaughter, sexual assault, and kidnaping.cIncludes motor vehicle theft.dIncludes forgery and embezzlement.eComposed of nonviolent offenses such as receiving stolen property and driving while intoxicated.
Nationwide in 1992, 92% of convic-tions were the product of a guilty plea(table 4). That number is not thesame as the percentage of felony con-victions that involved a plea bargainbetween the prosecution and the de-fense. Plea bargains, in which the de-fendant agrees to plead guilty inexchange for dropped or reducedcharges or in exchange for a reducedsentence, is a common practice in thecriminal justice system. The propor-tion of those who pleaded guilty aspart of a plea bargain is not known.
An estimated 821,000 personspleaded guilty to a felony offense.Persons convicted of murder were theleast likely to have pleaded guilty andthe most likely to have been convictedby a jury (table 4.1). Murderers con-victed by a jury were the most likely ofall convicted defendants to have re-ceived a life sentence (47%) or thedeath penalty (4%) (table 4.6).
Of felons convicted in State courts, 4% were found guilty by a jury, and4% were found guilty by a judge in abench trial (table 4.2). The most seri-ous offenses the violent crimes ofmurder, rape, robbery, aggravated as-sault, and other violent offenses comprised about 19% of all felonyconvictions but an estimated 46% ofall jury trials (table 4.3).
Convictions for murder or nonnegli-gent manslaughter, had the lowestpercentage of guilty pleas (59%) (table4.2).
Sentences to prison or jail occurred in 86% of jury convictions, 65% ofbench trial convictions (decided by ajudge alone), and 70% of guilty pleas(table 4.4).
An estimated 75% of felons con-victed by a jury received a prison sentence, compared to 48% of thoseconvicted by a judge and 44% ofthose who pleaded guilty (table 4.4).
Prison sentences were much longerfor felons convicted by a jury trial (190months) than for felons who pleadedguilty (72 months) or were convictedby a judge (88 months) (table 4.5).
Felons sentenced to jail in a jury trialreceived a mean or average sentence of 11 months. The mean jail sentencein a bench trial was 7 months; in aguilty plea, 7 months (table 4.5).
An estimated 51% of felons con-victed of murder or nonnegligent man-slaughter by a jury were sentenced tolife in prison or to death. Such sen-tences for murder or nonnegligentmanslaughter occurred in about 14%of the bench trials and 15% of theguilty pleas (table 4.6).
In 43% of jury trial convictions na-tionwide, felons were found guilty ofmultiple offenses. Twenty-three per-cent of the guilty pleas and 17% of thebench trial convictions involved multiple offenses (table 4.7).
State Court Sentencing of Convicted Felons, 1992 41
Nature ofconviction
Trial
Jury
Bench
Guilty plea
0% 20% 40% 60% 80%
Prison
Jail
Probation
Types of sentences imposed by State courts,by nature of conviction, 1992
Most seriousconvictionoffense
Months
Violent
Property
Drug
Weapons
Other
0 50 100 150 200 250
Total trial
Guilty plea
Percent of sentences imposedThe average sentence to prison for drug offenses was abo10 years for trial convictions versus 5 years for guilty pleas
Average sentence to State prison,by offense and nature of conviction, 1992
A prison sentence resulted in 62% of trial convictions versus 44% of guilty plea convictions.
Felony case processing in State courts, 1992
The following findings on elapsed timeare based on cases with complete dis-position information. Because smalldifferences exist between cases withcomplete information and cases withincomplete information, these statis-tics may differ from other elapsed-timestatistics derived from the survey:
Mean elapsed time from date of ar-rest to date of felony conviction wasabout 6 months. Jury cases took thelongest time (about 9 months). Guiltyplea cases took almost as much time(about 169 days) as bench trial cases(192 days). The longest average timewas for murder or nonnegligent man-slaughter, about 10½ months, andthe shortest, almost 5 months, for bur-glary and larceny (table 4.9).
Mean elapsed time from conviction to sentencing for persons convicted ofa felony was about 1 month, regard-less of the method of conviction (table4.10).
Mean elapsed time from arrest to sentencing in 1992 was nearly 7months, unchanged from 1988; themedian was nearly 5 months, also un-changed (table 4.11).
Cases decided by juries had a meanelapsed time from arrest to sentencingof about 10 months; those disposedby guilty plea or a bench trial, a meanof 6¾ months (table 4.11).
42 State Court Sentencing of Convicted Felons, 1992
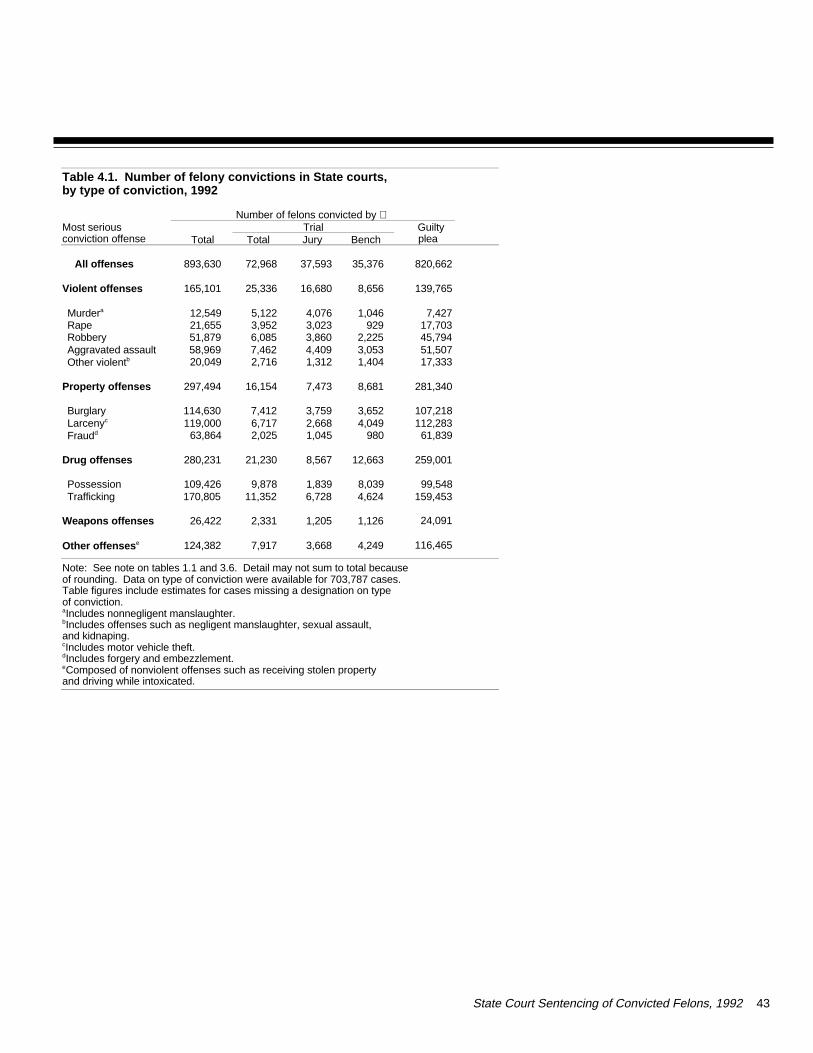
State Court Sentencing of Convicted Felons, 1992 43
Table 4.1. Number of felony convictions in State courts, by type of conviction, 1992
Number of felons convicted by Most seriousconviction offense
Trial Guiltyplea Total Total Jury Bench
All offenses 893,630 72,968 37,593 35,376 820,662
Violent offenses 165,101 25,336 16,680 8,656 139,765
Murdera 12,549 5,122 4,076 1,046 7,427Rape 21,655 3,952 3,023 929 17,703Robbery 51,879 6,085 3,860 2,225 45,794Aggravated assault 58,969 7,462 4,409 3,053 51,507Other violentb 20,049 2,716 1,312 1,404 17,333
Property offenses 297,494 16,154 7,473 8,681 281,340
Burglary 114,630 7,412 3,759 3,652 107,218Larcenyc 119,000 6,717 2,668 4,049 112,283Fraudd 63,864 2,025 1,045 980 61,839
Drug offenses 280,231 21,230 8,567 12,663 259,001
Possession 109,426 9,878 1,839 8,039 99,548Trafficking 170,805 11,352 6,728 4,624 159,453
Weapons offenses 26,422 2,331 1,205 1,126 24,091
Other offenses e 124,382 7,917 3,668 4,249 116,465
Note: See note on tables 1.1 and 3.6. Detail may not sum to total because of rounding. Data on type of conviction were available for 703,787 cases. Table figures include estimates for cases missing a designation on type of conviction.aIncludes nonnegligent manslaughter.bIncludes offenses such as negligent manslaughter, sexual assault, and kidnaping.cIncludes motor vehicle theft.dIncludes forgery and embezzlement.eComposed of nonviolent offenses such as receiving stolen property and driving while intoxicated.

44 State Court Sentencing of Convicted Felons, 1992
Table 4.2. Offenses of felons convicted in State courts, by type of conviction, 1992
Percent of felons convicted by Most seriousconviction offense
Trial Guiltyplea Total Total Jury Bench
All offenses 100% 8% 4% 4% 92%
Violent offenses 100% 15% 10% 5% 85%
Murdera 100 41 33 8 59Rape 100 18 14 4 82Robbery 100 12 8 4 88Aggravated assault 100 13 8 5 87Other violentb 100 14 7 7 86
Property offenses 100% 5% 2% 3% 95%
Burglary 100 6 3 3 94Larcenyc 100 6 2 4 94Fraudd 100 3 2 1 97
Drug offenses 100% 8% 3% 5% 92%
Possession 100 9 2 7 91Trafficking 100 7 4 3 93
Weapons offenses 100% 9% 5% 4% 91%
Other offenses e 100% 6% 3% 3% 94%
Note: See note on tables 1.1, 3.6, and 4.1. Detail may not sum to total because of rounding. Data on conviction type were available for 703,787 cases.aIncludes nonnegligent manslaughter.bIncludes offenses such as negligent manslaughter, sexualassault, and kidnaping.cIncludes motor vehicle theft.dIncludes forgery and embezzlement.eComposed of nonviolent offenses such as receiving stolen property and driving while intoxicated.
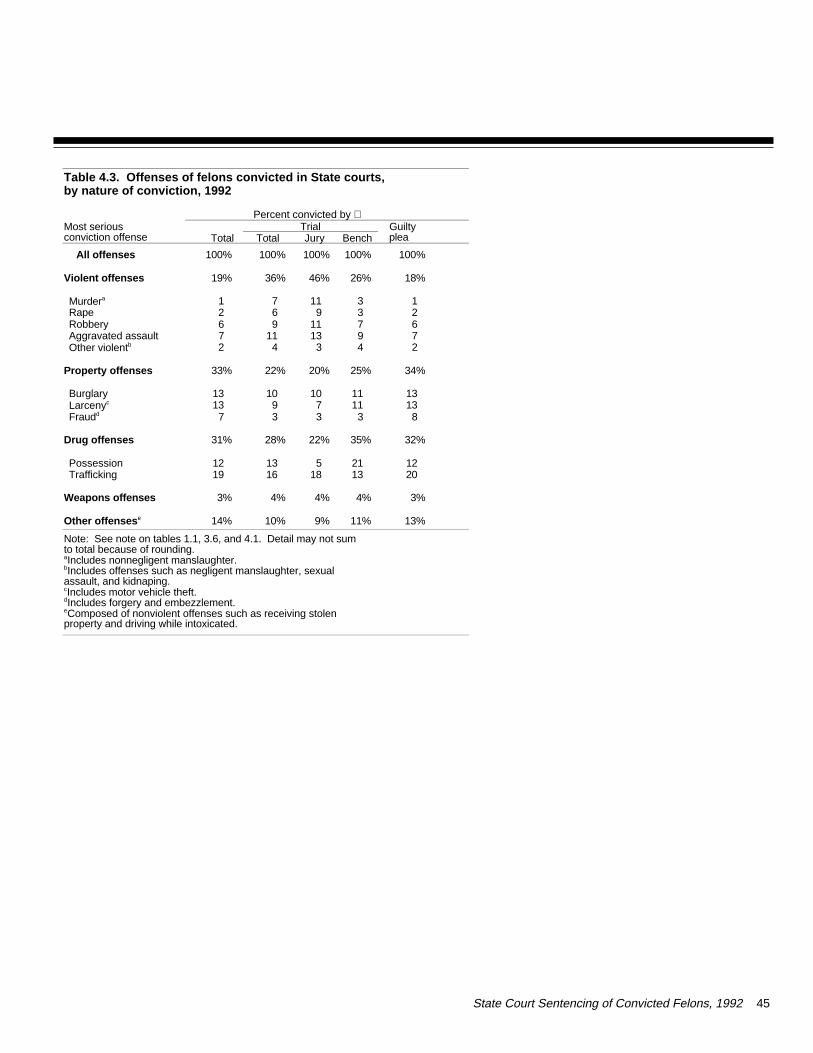
State Court Sentencing of Convicted Felons, 1992 45
Table 4.3. Offenses of felons convicted in State courts, by nature of conviction, 1992
Percent convicted by Most seriousconviction offense
Trial Guiltyplea Total Total Jury Bench
All offenses 100% 100% 100% 100% 100%
Violent offenses 19% 36% 46% 26% 18%
Murdera 1 7 11 3 1Rape 2 6 9 3 2Robbery 6 9 11 7 6Aggravated assault 7 11 13 9 7Other violentb 2 4 3 4 2
Property offenses 33% 22% 20% 25% 34%
Burglary 13 10 10 11 13Larcenyc 13 9 7 11 13Fraudd 7 3 3 3 8
Drug offenses 31% 28% 22% 35% 32%
Possession 12 13 5 21 12Trafficking 19 16 18 13 20
Weapons offenses 3% 4% 4% 4% 3%
Other offenses e 14% 10% 9% 11% 13%
Note: See note on tables 1.1, 3.6, and 4.1. Detail may not sum to total because of rounding. aIncludes nonnegligent manslaughter.bIncludes offenses such as negligent manslaughter, sexualassault, and kidnaping.cIncludes motor vehicle theft.dIncludes forgery and embezzlement.eComposed of nonviolent offenses such as receiving stolen property and driving while intoxicated.
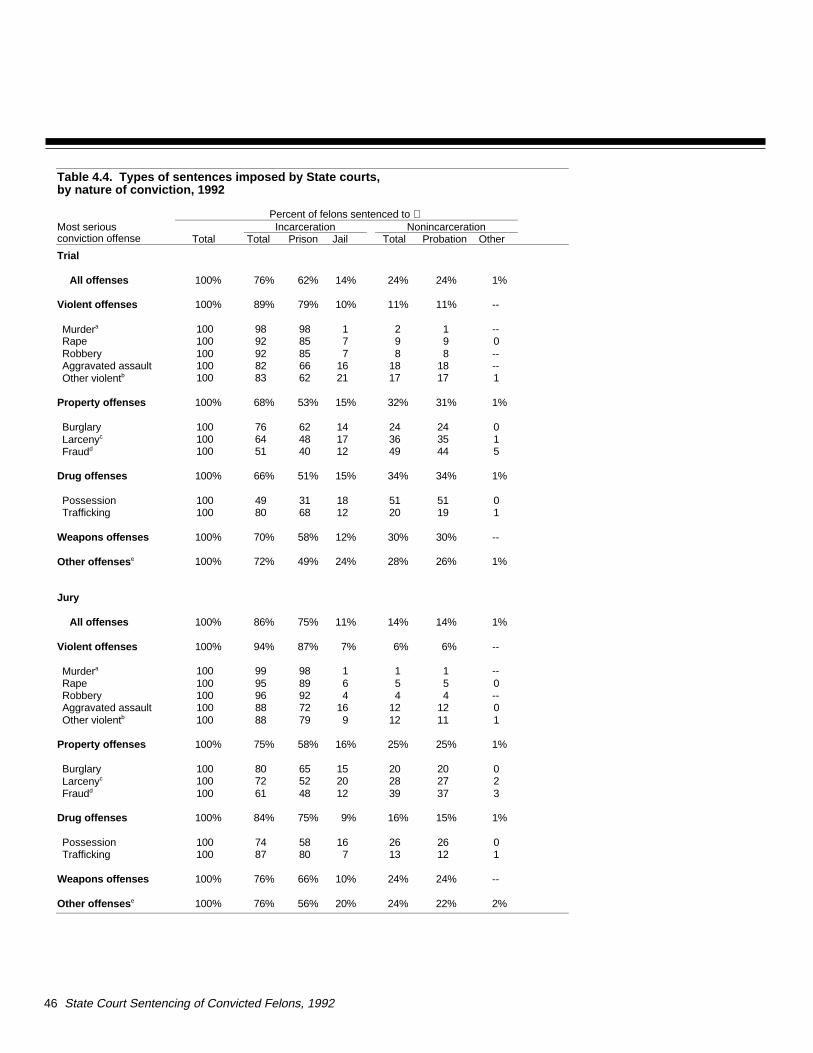
46 State Court Sentencing of Convicted Felons, 1992
Table 4.4. Types of sentences imposed by State courts, by nature of conviction, 1992
Percent of felons sentenced to Most seriousconviction offense
Incarceration NonincarcerationTotal Total Prison Jail Total Probation Other
Trial
All offenses 100% 76% 62% 14% 24% 24% 1%
Violent offenses 100% 89% 79% 10% 11% 11% --
Murdera 100 98 98 1 2 1 --Rape 100 92 85 7 9 9 0Robbery 100 92 85 7 8 8 --Aggravated assault 100 82 66 16 18 18 --Other violentb 100 83 62 21 17 17 1
Property offenses 100% 68% 53% 15% 32% 31% 1%
Burglary 100 76 62 14 24 24 0Larcenyc 100 64 48 17 36 35 1Fraudd 100 51 40 12 49 44 5
Drug offenses 100% 66% 51% 15% 34% 34% 1%
Possession 100 49 31 18 51 51 0Trafficking 100 80 68 12 20 19 1
Weapons offenses 100% 70% 58% 12% 30% 30% --
Other offenses e 100% 72% 49% 24% 28% 26% 1%
Jury
All offenses 100% 86% 75% 11% 14% 14% 1%
Violent offenses 100% 94% 87% 7% 6% 6% --
Murdera 100 99 98 1 1 1 --Rape 100 95 89 6 5 5 0Robbery 100 96 92 4 4 4 --Aggravated assault 100 88 72 16 12 12 0Other violentb 100 88 79 9 12 11 1
Property offenses 100% 75% 58% 16% 25% 25% 1%
Burglary 100 80 65 15 20 20 0Larcenyc 100 72 52 20 28 27 2Fraudd 100 61 48 12 39 37 3
Drug offenses 100% 84% 75% 9% 16% 15% 1%
Possession 100 74 58 16 26 26 0Trafficking 100 87 80 7 13 12 1
Weapons offenses 100% 76% 66% 10% 24% 24% --
Other offenses e 100% 76% 56% 20% 24% 22% 2%
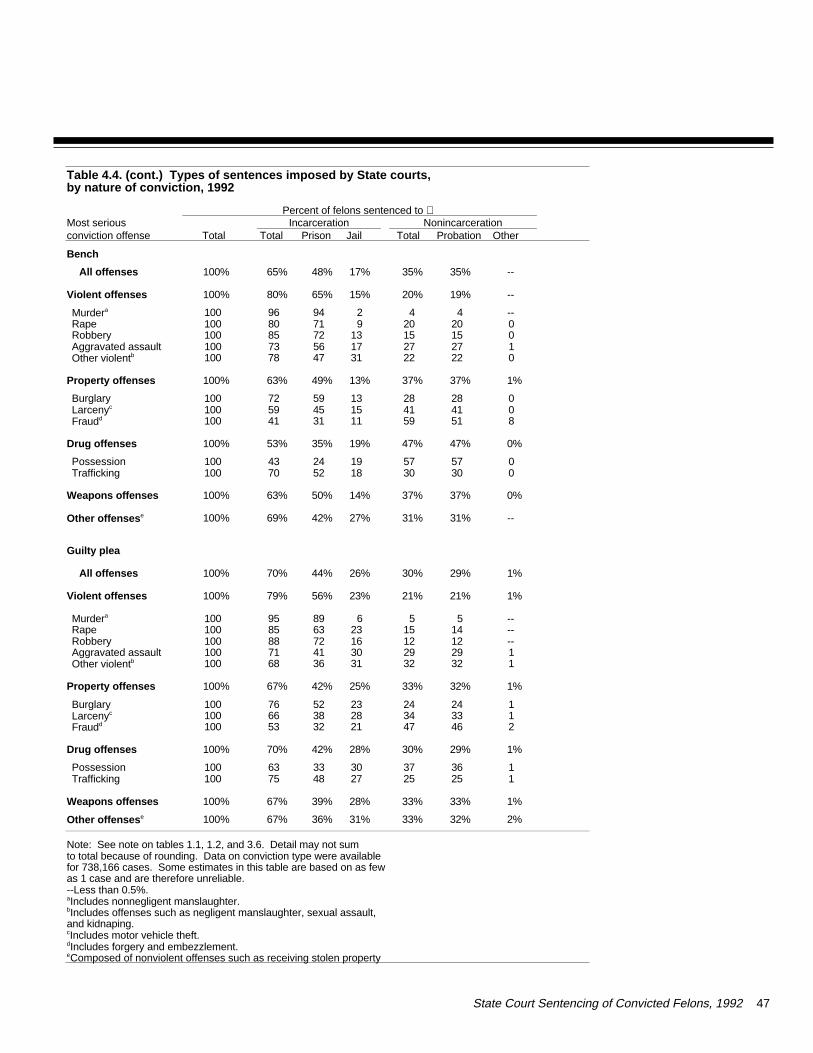
State Court Sentencing of Convicted Felons, 1992 47
Table 4.4. (cont.) Types of sentences imposed by State courts,by nature of conviction, 1992
Percent of felons sentenced to Most seriousconviction offense
Incarceration Nonincarceration Total Total Prison Jail Total Probation Other
Bench
All offenses 100% 65% 48% 17% 35% 35% --
Violent offenses 100% 80% 65% 15% 20% 19% --
Murdera 100 96 94 2 4 4 --Rape 100 80 71 9 20 20 0Robbery 100 85 72 13 15 15 0Aggravated assault 100 73 56 17 27 27 1Other violentb 100 78 47 31 22 22 0
Property offenses 100% 63% 49% 13% 37% 37% 1%
Burglary 100 72 59 13 28 28 0Larcenyc 100 59 45 15 41 41 0Fraudd 100 41 31 11 59 51 8
Drug offenses 100% 53% 35% 19% 47% 47% 0%
Possession 100 43 24 19 57 57 0Trafficking 100 70 52 18 30 30 0
Weapons offenses 100% 63% 50% 14% 37% 37% 0%
Other offenses e 100% 69% 42% 27% 31% 31% --
Guilty plea
All offenses 100% 70% 44% 26% 30% 29% 1%
Violent offenses 100% 79% 56% 23% 21% 21% 1%
Murdera 100 95 89 6 5 5 --Rape 100 85 63 23 15 14 --Robbery 100 88 72 16 12 12 --Aggravated assault 100 71 41 30 29 29 1Other violentb 100 68 36 31 32 32 1
Property offenses 100% 67% 42% 25% 33% 32% 1%
Burglary 100 76 52 23 24 24 1Larcenyc 100 66 38 28 34 33 1Fraudd 100 53 32 21 47 46 2
Drug offenses 100% 70% 42% 28% 30% 29% 1%
Possession 100 63 33 30 37 36 1Trafficking 100 75 48 27 25 25 1
Weapons offenses 100% 67% 39% 28% 33% 33% 1%
Other offenses e 100% 67% 36% 31% 33% 32% 2%
Note: See note on tables 1.1, 1.2, and 3.6. Detail may not sum to total because of rounding. Data on conviction type were available for 738,166 cases. Some estimates in this table are based on as few as 1 case and are therefore unreliable.--Less than 0.5%.aIncludes nonnegligent manslaughter.bIncludes offenses such as negligent manslaughter, sexual assault, and kidnaping.cIncludes motor vehicle theft.dIncludes forgery and embezzlement.eComposed of nonviolent offenses such as receiving stolen property
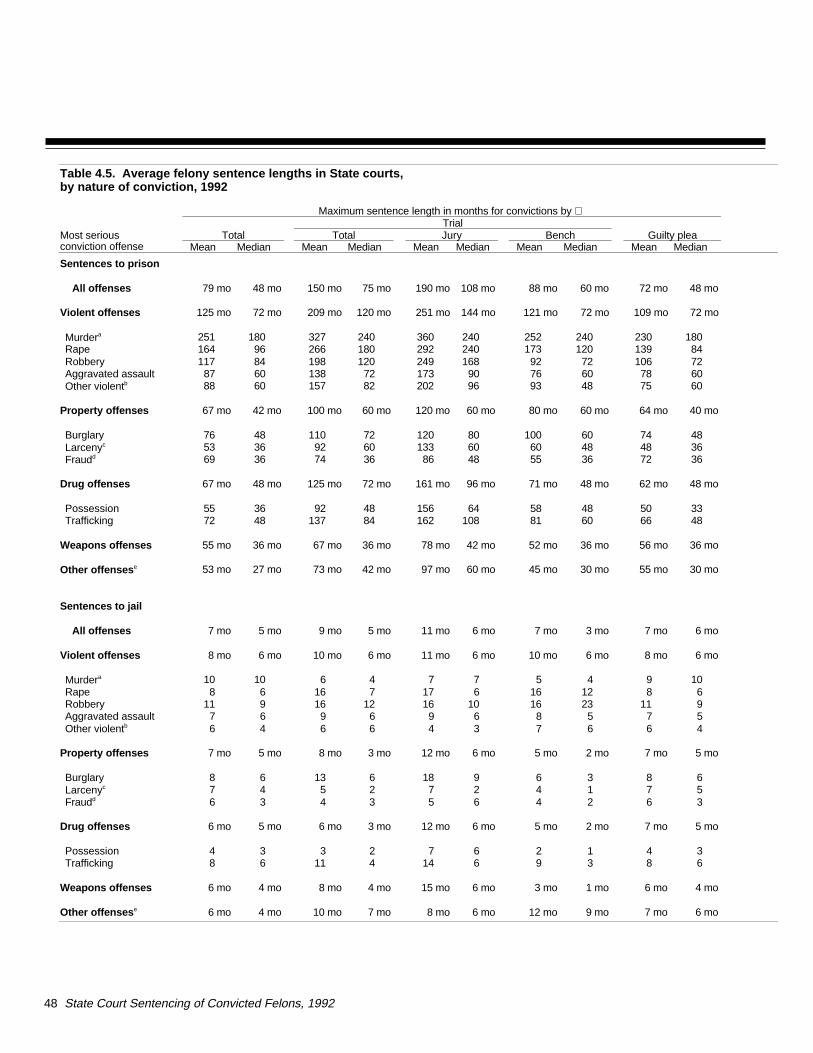
48 State Court Sentencing of Convicted Felons, 1992
Table 4.5. Average felony sentence lengths in State courts, by nature of conviction, 1992
Maximum sentence length in months for convictions by Trial
Most seriousconviction offense
Total Total Jury Bench Guilty pleaMean Median Mean Median Mean Median Mean Median Mean Median
Sentences to prison
All offenses 79 mo 48 mo 150 mo 75 mo 190 mo 108 mo 88 mo 60 mo 72 mo 48 mo
Violent offenses 125 mo 72 mo 209 mo 120 mo 251 mo 144 mo 121 mo 72 mo 109 mo 72 mo
Murdera 251 180 327 240 360 240 252 240 230 180Rape 164 96 266 180 292 240 173 120 139 84Robbery 117 84 198 120 249 168 92 72 106 72Aggravated assault 87 60 138 72 173 90 76 60 78 60Other violentb 88 60 157 82 202 96 93 48 75 60
Property offenses 67 mo 42 mo 100 mo 60 mo 120 mo 60 mo 80 mo 60 mo 64 mo 40 mo
Burglary 76 48 110 72 120 80 100 60 74 48Larcenyc 53 36 92 60 133 60 60 48 48 36Fraudd 69 36 74 36 86 48 55 36 72 36
Drug offenses 67 mo 48 mo 125 mo 72 mo 161 mo 96 mo 71 mo 48 mo 62 mo 48 mo
Possession 55 36 92 48 156 64 58 48 50 33Trafficking 72 48 137 84 162 108 81 60 66 48
Weapons offenses 55 mo 36 mo 67 mo 36 mo 78 mo 42 mo 52 mo 36 mo 56 mo 36 mo
Other offenses e 53 mo 27 mo 73 mo 42 mo 97 mo 60 mo 45 mo 30 mo 55 mo 30 mo
Sentences to jail
All offenses 7 mo 5 mo 9 mo 5 mo 11 mo 6 mo 7 mo 3 mo 7 mo 6 mo
Violent offenses 8 mo 6 mo 10 mo 6 mo 11 mo 6 mo 10 mo 6 mo 8 mo 6 mo
Murdera 10 10 6 4 7 7 5 4 9 10Rape 8 6 16 7 17 6 16 12 8 6Robbery 11 9 16 12 16 10 16 23 11 9Aggravated assault 7 6 9 6 9 6 8 5 7 5Other violentb 6 4 6 6 4 3 7 6 6 4
Property offenses 7 mo 5 mo 8 mo 3 mo 12 mo 6 mo 5 mo 2 mo 7 mo 5 mo
Burglary 8 6 13 6 18 9 6 3 8 6Larcenyc 7 4 5 2 7 2 4 1 7 5Fraudd 6 3 4 3 5 6 4 2 6 3
Drug offenses 6 mo 5 mo 6 mo 3 mo 12 mo 6 mo 5 mo 2 mo 7 mo 5 mo
Possession 4 3 3 2 7 6 2 1 4 3Trafficking 8 6 11 4 14 6 9 3 8 6
Weapons offenses 6 mo 4 mo 8 mo 4 mo 15 mo 6 mo 3 mo 1 mo 6 mo 4 mo
Other offenses e 6 mo 4 mo 10 mo 7 mo 8 mo 6 mo 12 mo 9 mo 7 mo 6 mo
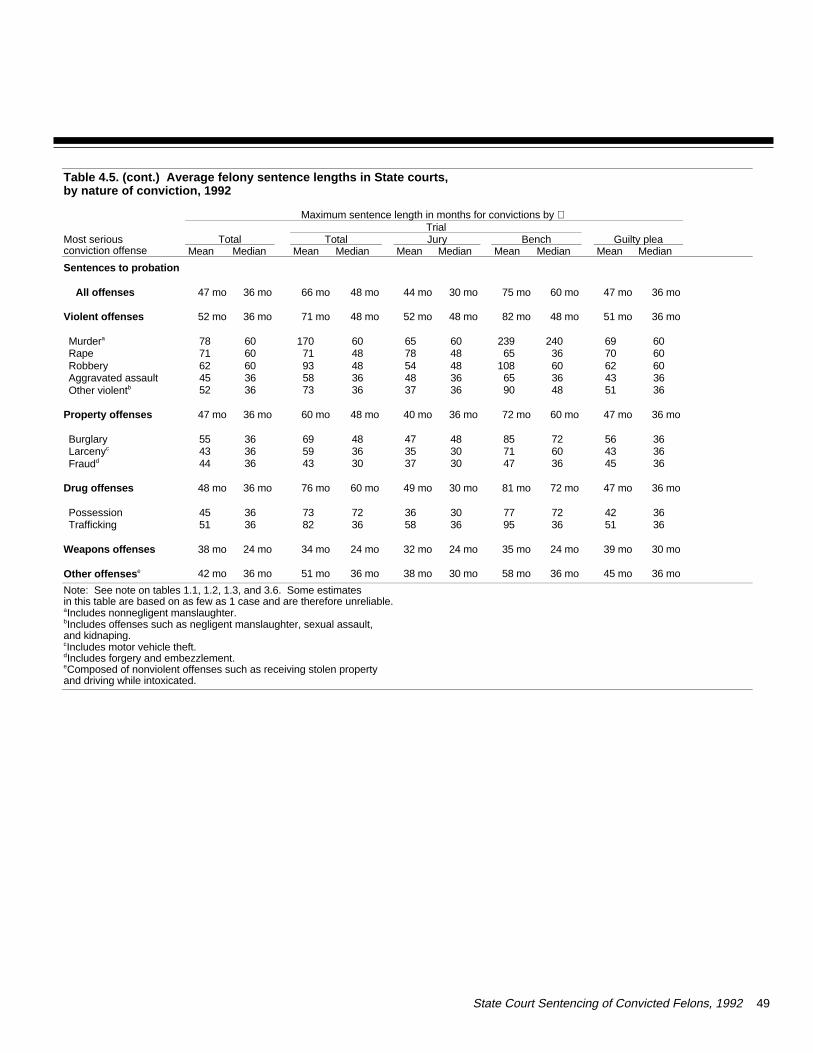
State Court Sentencing of Convicted Felons, 1992 49
Table 4.5. (cont.) Average felony sentence lengths in State courts,by nature of conviction, 1992
Maximum sentence length in months for convictions by Trial
Most seriousconviction offense
Total Total Jury Bench Guilty pleaMean Median Mean Median Mean Median Mean Median Mean Median
Sentences to probation
All offenses 47 mo 36 mo 66 mo 48 mo 44 mo 30 mo 75 mo 60 mo 47 mo 36 mo
Violent offenses 52 mo 36 mo 71 mo 48 mo 52 mo 48 mo 82 mo 48 mo 51 mo 36 mo
Murdera 78 60 170 60 65 60 239 240 69 60Rape 71 60 71 48 78 48 65 36 70 60Robbery 62 60 93 48 54 48 108 60 62 60Aggravated assault 45 36 58 36 48 36 65 36 43 36Other violentb 52 36 73 36 37 36 90 48 51 36
Property offenses 47 mo 36 mo 60 mo 48 mo 40 mo 36 mo 72 mo 60 mo 47 mo 36 mo
Burglary 55 36 69 48 47 48 85 72 56 36Larcenyc 43 36 59 36 35 30 71 60 43 36Fraudd 44 36 43 30 37 30 47 36 45 36
Drug offenses 48 mo 36 mo 76 mo 60 mo 49 mo 30 mo 81 mo 72 mo 47 mo 36 mo
Possession 45 36 73 72 36 30 77 72 42 36Trafficking 51 36 82 36 58 36 95 36 51 36
Weapons offenses 38 mo 24 mo 34 mo 24 mo 32 mo 24 mo 35 mo 24 mo 39 mo 30 mo
Other offenses e 42 mo 36 mo 51 mo 36 mo 38 mo 30 mo 58 mo 36 mo 45 mo 36 mo
Note: See note on tables 1.1, 1.2, 1.3, and 3.6. Some estimates in this table are based on as few as 1 case and are therefore unreliable.aIncludes nonnegligent manslaughter.bIncludes offenses such as negligent manslaughter, sexual assault, and kidnaping.cIncludes motor vehicle theft.dIncludes forgery and embezzlement.eComposed of nonviolent offenses such as receiving stolen property and driving while intoxicated.
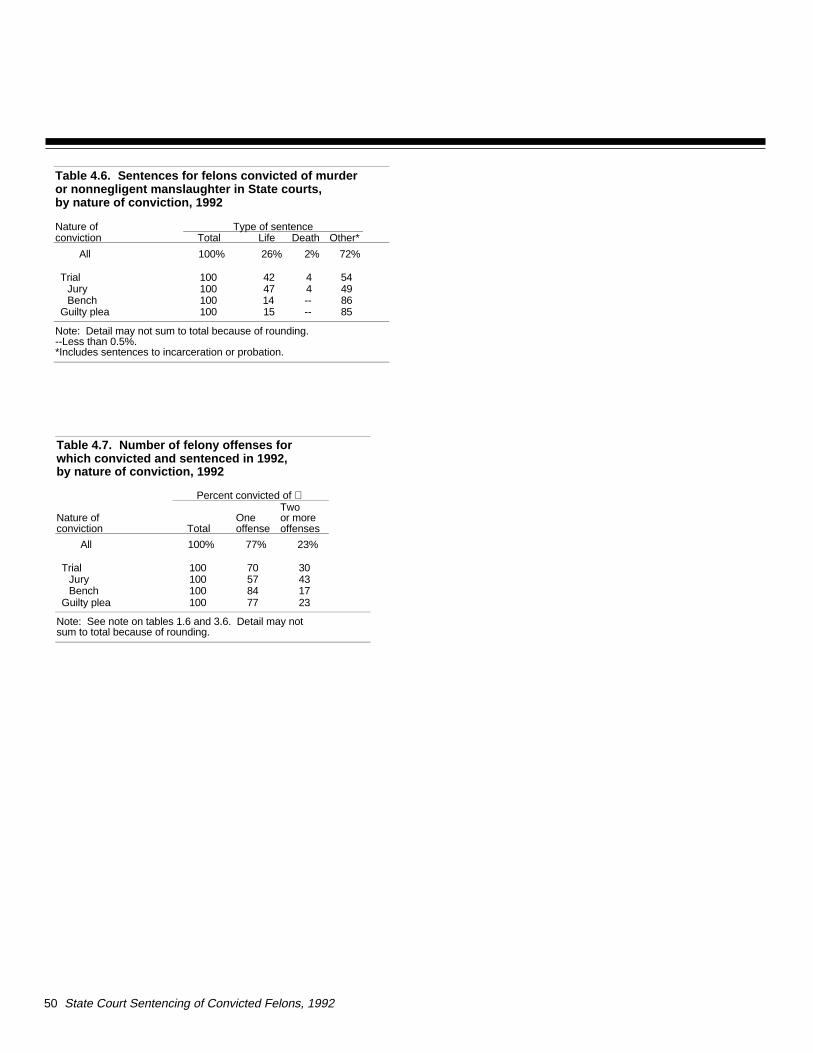
50 State Court Sentencing of Convicted Felons, 1992
Table 4.7. Number of felony offenses forwhich convicted and sentenced in 1992, by nature of conviction, 1992
Percent convicted of
Nature of conviction Total
Oneoffense
Two or moreoffenses
All 100% 77% 23%
Trial 100 70 30Jury 100 57 43Bench 100 84 17
Guilty plea 100 77 23
Note: See note on tables 1.6 and 3.6. Detail may not sum to total because of rounding.
Table 4.6. Sentences for felons convicted of murder or nonnegligent manslaughter in State courts, by nature of conviction, 1992
Nature of Type of sentenceconviction Total Life Death Other*
All 100% 26% 2% 72%
Trial 100 42 4 54Jury 100 47 4 49Bench 100 14 -- 86
Guilty plea 100 15 -- 85
Note: Detail may not sum to total because of rounding.--Less than 0.5%.*Includes sentences to incarceration or probation.
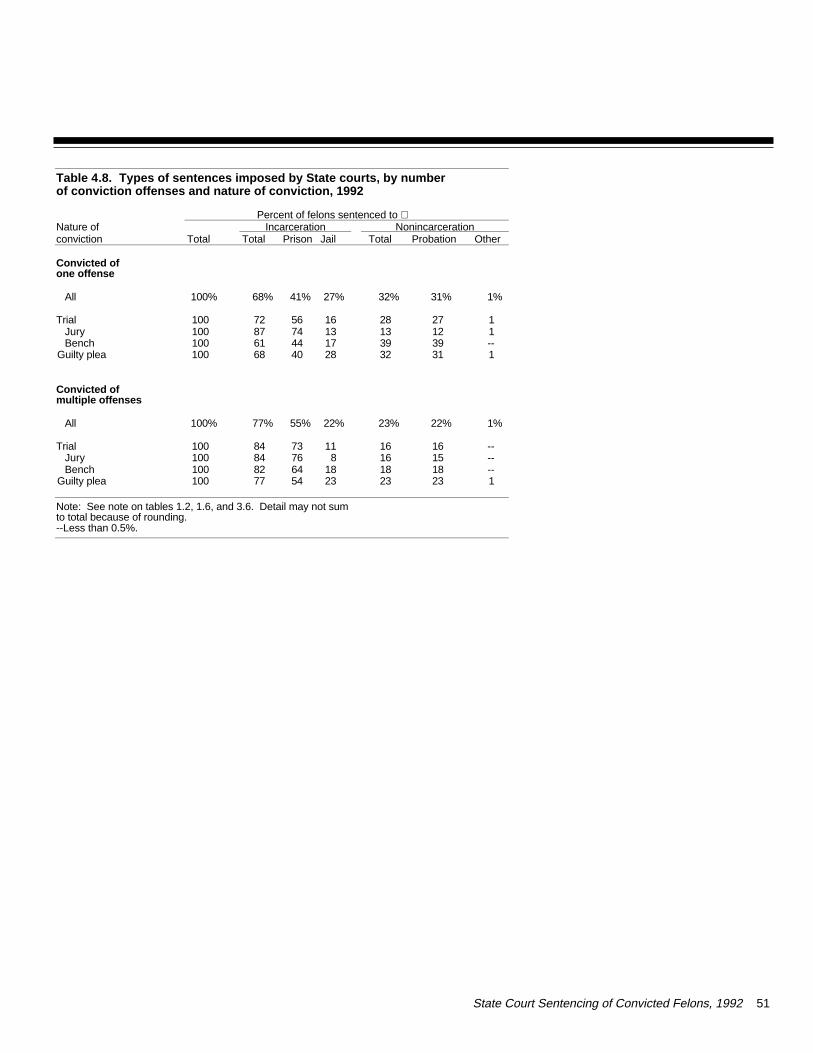
State Court Sentencing of Convicted Felons, 1992 51
Table 4.8. Types of sentences imposed by State courts, by number of conviction offenses and nature of conviction, 1992
Percent of felons sentenced to Nature of Incarceration Nonincarcerationconviction Total Total Prison Jail Total Probation Other
Convicted of one offense
All 100% 68% 41% 27% 32% 31% 1%
Trial 100 72 56 16 28 27 1Jury 100 87 74 13 13 12 1Bench 100 61 44 17 39 39 --
Guilty plea 100 68 40 28 32 31 1
Convicted of multiple offenses
All 100% 77% 55% 22% 23% 22% 1%
Trial 100 84 73 11 16 16 --Jury 100 84 76 8 16 15 --Bench 100 82 64 18 18 18 --
Guilty plea 100 77 54 23 23 23 1
Note: See note on tables 1.2, 1.6, and 3.6. Detail may not sum to total because of rounding. --Less than 0.5%.
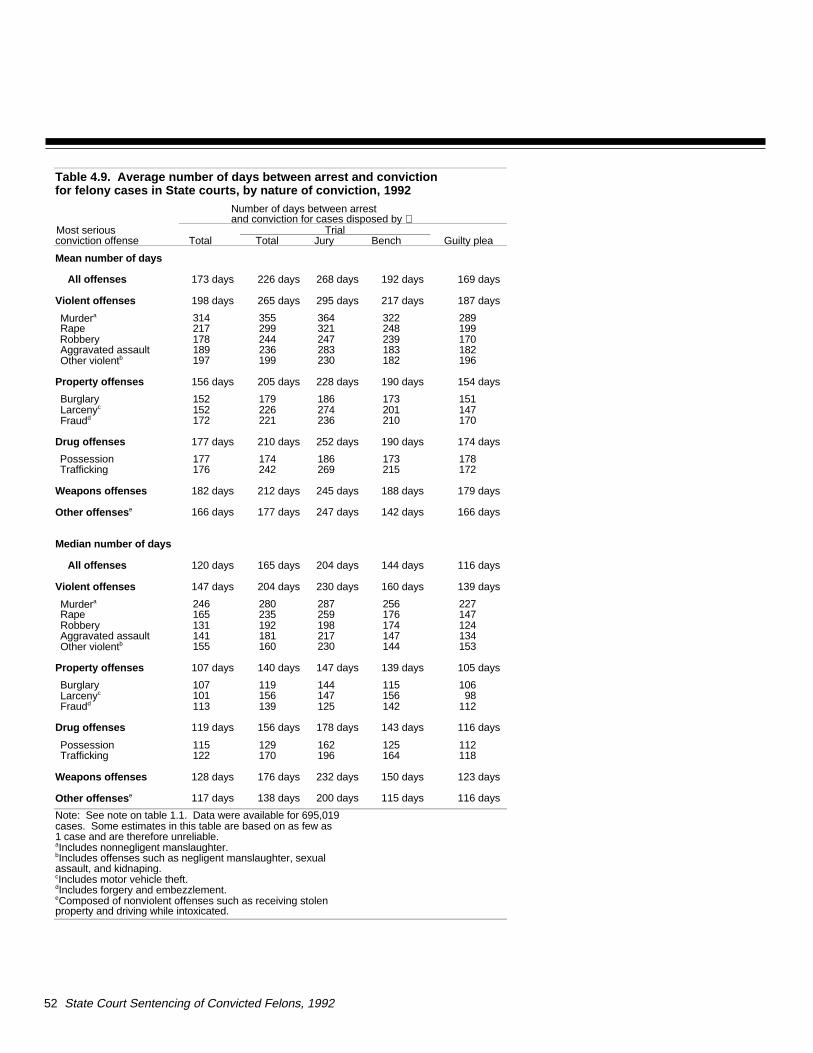
52 State Court Sentencing of Convicted Felons, 1992
Table 4.9. Average number of days between arrest and conviction for felony cases in State courts, by nature of conviction, 1992
Number of days between arrest and conviction for cases disposed by
Most seriousconviction offense
TrialGuilty plea Total Total Jury Bench
Mean number of days
All offenses 173 days 226 days 268 days 192 days 169 days
Violent offenses 198 days 265 days 295 days 217 days 187 days
Murdera 314 355 364 322 289Rape 217 299 321 248 199Robbery 178 244 247 239 170Aggravated assault 189 236 283 183 182Other violentb 197 199 230 182 196
Property offenses 156 days 205 days 228 days 190 days 154 days
Burglary 152 179 186 173 151Larcenyc 152 226 274 201 147Fraudd 172 221 236 210 170
Drug offenses 177 days 210 days 252 days 190 days 174 days
Possession 177 174 186 173 178Trafficking 176 242 269 215 172
Weapons offenses 182 days 212 days 245 days 188 days 179 days
Other offenses e 166 days 177 days 247 days 142 days 166 days
Median number of days
All offenses 120 days 165 days 204 days 144 days 116 days
Violent offenses 147 days 204 days 230 days 160 days 139 days
Murdera 246 280 287 256 227Rape 165 235 259 176 147Robbery 131 192 198 174 124Aggravated assault 141 181 217 147 134Other violentb 155 160 230 144 153
Property offenses 107 days 140 days 147 days 139 days 105 days
Burglary 107 119 144 115 106Larcenyc 101 156 147 156 98Fraudd 113 139 125 142 112
Drug offenses 119 days 156 days 178 days 143 days 116 days
Possession 115 129 162 125 112Trafficking 122 170 196 164 118
Weapons offenses 128 days 176 days 232 days 150 days 123 days
Other offenses e 117 days 138 days 200 days 115 days 116 days
Note: See note on table 1.1. Data were available for 695,019cases. Some estimates in this table are based on as few as 1 case and are therefore unreliable.aIncludes nonnegligent manslaughter.bIncludes offenses such as negligent manslaughter, sexualassault, and kidnaping.cIncludes motor vehicle theft.dIncludes forgery and embezzlement.eComposed of nonviolent offenses such as receiving stolen property and driving while intoxicated.
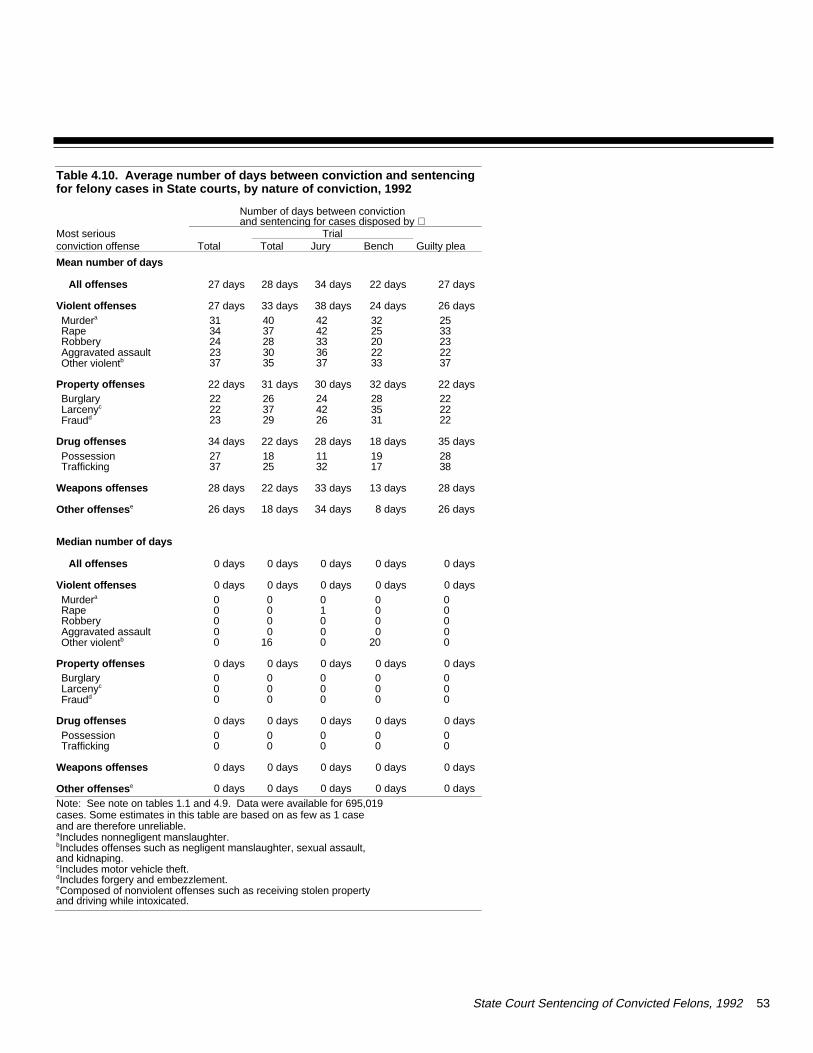
State Court Sentencing of Convicted Felons, 1992 53
Table 4.10. Average number of days between conviction and sentencingfor felony cases in State courts, by nature of conviction, 1992
Number of days between conviction and sentencing for cases disposed by
Most seriousconviction offense
TrialGuilty plea Total Total Jury Bench
Mean number of days
All offenses 27 days 28 days 34 days 22 days 27 days
Violent offenses 27 days 33 days 38 days 24 days 26 daysMurdera 31 40 42 32 25Rape 34 37 42 25 33Robbery 24 28 33 20 23Aggravated assault 23 30 36 22 22Other violentb 37 35 37 33 37
Property offenses 22 days 31 days 30 days 32 days 22 daysBurglary 22 26 24 28 22Larcenyc 22 37 42 35 22Fraudd 23 29 26 31 22
Drug offenses 34 days 22 days 28 days 18 days 35 daysPossession 27 18 11 19 28Trafficking 37 25 32 17 38
Weapons offenses 28 days 22 days 33 days 13 days 28 days
Other offenses e 26 days 18 days 34 days 8 days 26 days
Median number of days
All offenses 0 days 0 days 0 days 0 days 0 days
Violent offenses 0 days 0 days 0 days 0 days 0 daysMurdera 0 0 0 0 0Rape 0 0 1 0 0Robbery 0 0 0 0 0Aggravated assault 0 0 0 0 0Other violentb 0 16 0 20 0
Property offenses 0 days 0 days 0 days 0 days 0 daysBurglary 0 0 0 0 0Larcenyc 0 0 0 0 0Fraudd 0 0 0 0 0
Drug offenses 0 days 0 days 0 days 0 days 0 daysPossession 0 0 0 0 0Trafficking 0 0 0 0 0
Weapons offenses 0 days 0 days 0 days 0 days 0 days
Other offenses e 0 days 0 days 0 days 0 days 0 daysNote: See note on tables 1.1 and 4.9. Data were available for 695,019cases. Some estimates in this table are based on as few as 1 case and are therefore unreliable.aIncludes nonnegligent manslaughter.bIncludes offenses such as negligent manslaughter, sexual assault, and kidnaping.cIncludes motor vehicle theft.dIncludes forgery and embezzlement.eComposed of nonviolent offenses such as receiving stolen property and driving while intoxicated.
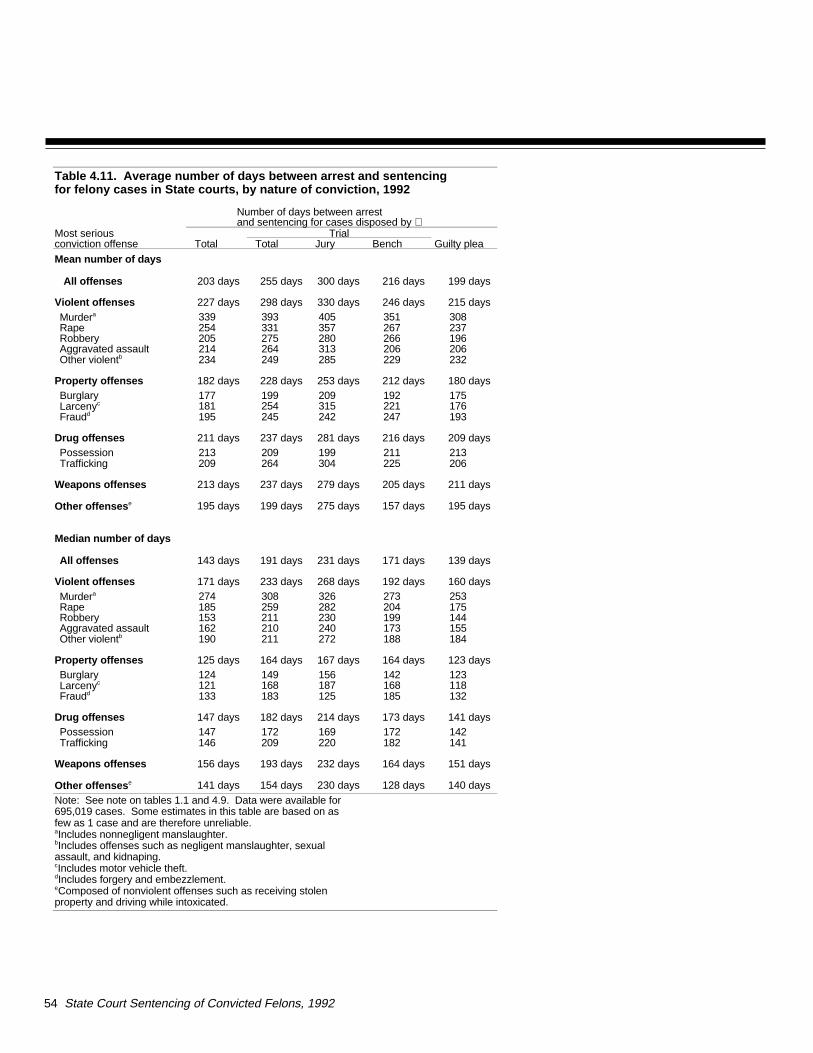
54 State Court Sentencing of Convicted Felons, 1992
Table 4.11. Average number of days between arrest and sentencing for felony cases in State courts, by nature of conviction, 1992
Number of days between arrest and sentencing for cases disposed by
Most seriousconviction offense
TrialGuilty plea Total Total Jury Bench
Mean number of days
All offenses 203 days 255 days 300 days 216 days 199 days
Violent offenses 227 days 298 days 330 days 246 days 215 daysMurdera 339 393 405 351 308Rape 254 331 357 267 237Robbery 205 275 280 266 196Aggravated assault 214 264 313 206 206Other violentb 234 249 285 229 232
Property offenses 182 days 228 days 253 days 212 days 180 daysBurglary 177 199 209 192 175Larcenyc 181 254 315 221 176Fraudd 195 245 242 247 193
Drug offenses 211 days 237 days 281 days 216 days 209 daysPossession 213 209 199 211 213Trafficking 209 264 304 225 206
Weapons offenses 213 days 237 days 279 days 205 days 211 days
Other offenses e 195 days 199 days 275 days 157 days 195 days
Median number of days
All offenses 143 days 191 days 231 days 171 days 139 days
Violent offenses 171 days 233 days 268 days 192 days 160 daysMurdera 274 308 326 273 253Rape 185 259 282 204 175Robbery 153 211 230 199 144Aggravated assault 162 210 240 173 155Other violentb 190 211 272 188 184
Property offenses 125 days 164 days 167 days 164 days 123 daysBurglary 124 149 156 142 123Larcenyc 121 168 187 168 118Fraudd 133 183 125 185 132
Drug offenses 147 days 182 days 214 days 173 days 141 daysPossession 147 172 169 172 142Trafficking 146 209 220 182 141
Weapons offenses 156 days 193 days 232 days 164 days 151 days
Other offenses e 141 days 154 days 230 days 128 days 140 daysNote: See note on tables 1.1 and 4.9. Data were available for 695,019 cases. Some estimates in this table are based on as few as 1 case and are therefore unreliable.aIncludes nonnegligent manslaughter.bIncludes offenses such as negligent manslaughter, sexualassault, and kidnaping.cIncludes motor vehicle theft.dIncludes forgery and embezzlement.eComposed of nonviolent offenses such as receiving stolen property and driving while intoxicated.
Likelihood of conviction if arrested
Data sources
A comparison of convictions and ar-rests was made using data from theNational Judicial Reporting Programand the FBI's Uniform Crime Reports(UCR). The number of felony convic-tions in 1992 was compared to thenumber of adult arrests for offenseslikely to be felonies: murder (includingnonnegligent manslaughter), robbery,aggravated assault, burglary, and drugtrafficking. The numbers are aggre-gates and should not be interpreted asrepresenting the disposition of individ-ual cases tracked across processingstages of the criminal justice system.Nevertheless, the comparisons illus-trate the approximate odds of convic-tion given an arrest for a felony.
Higher likelihood of conviction in the South
Nationally, an estimated 35% of adultarrests for a felony resulted in a felonyconviction in 1992. For violent felo-nies it was 21%; for other offenses,48% (table 5.1). The lower likelihoodfor violent felonies is largely attribut-able to aggravated assault arrests,which are unlikely to result in a felonyconviction.
The likelihood of felony convictiongiven arrest was greater in the South(41%) than elsewhere (31%) (table5.1). The greater likelihood in theSouth was true not only for all of-fenses combined but also for individ-ual offenses.
Likelihood of State prison sentenceif convicted
Data source
Data on 1992 felony convictions andsentences are from the National Judi-cial Reporting Program.
Higher likelihood of prison sentence in the South
From among prison, jail, and proba-tion, the most severe sentence isprison. Compared to convicted felonsoutside the South, those convicted inthe South stood a greater chance ofreceiving a prison sentence. Statecourts in the South sentenced toprison 57% of the felons they con-victed in 1992. That compares to 41%in State courts elsewhere (table 5.2).
In general, the pattern of more severesentencing in the South held true forall types of offenses, although to alesser extent for violent offenses. Fora particularly serious crime, such asmurder, the convicted felon is almostcertain to be sent to prison, regardlessof where the sentencing occurs. Forless serious felonies such as propertyoffenses, there exists greater regionalvariation in sentencing practices.
Length of State prison sentence
Data source
Data on felony sentence lengths arefrom the 1992 National Judicial Re-porting Program.
Prison sentences longer in the South
Felony prison sentences were longerin the South than elsewhere. The av-erage State prison sentence in theSouth in 1992 was 94 months (about 8years), compared to 57 months (about5 years) outside the South (table 5.3).The pattern of longer prison sentencesin the South generally holds true re-gardless of the offense.
State Court Sentencing of Convicted Felons, 1992 55
Regional variation in adjudication and sentencing, 1992
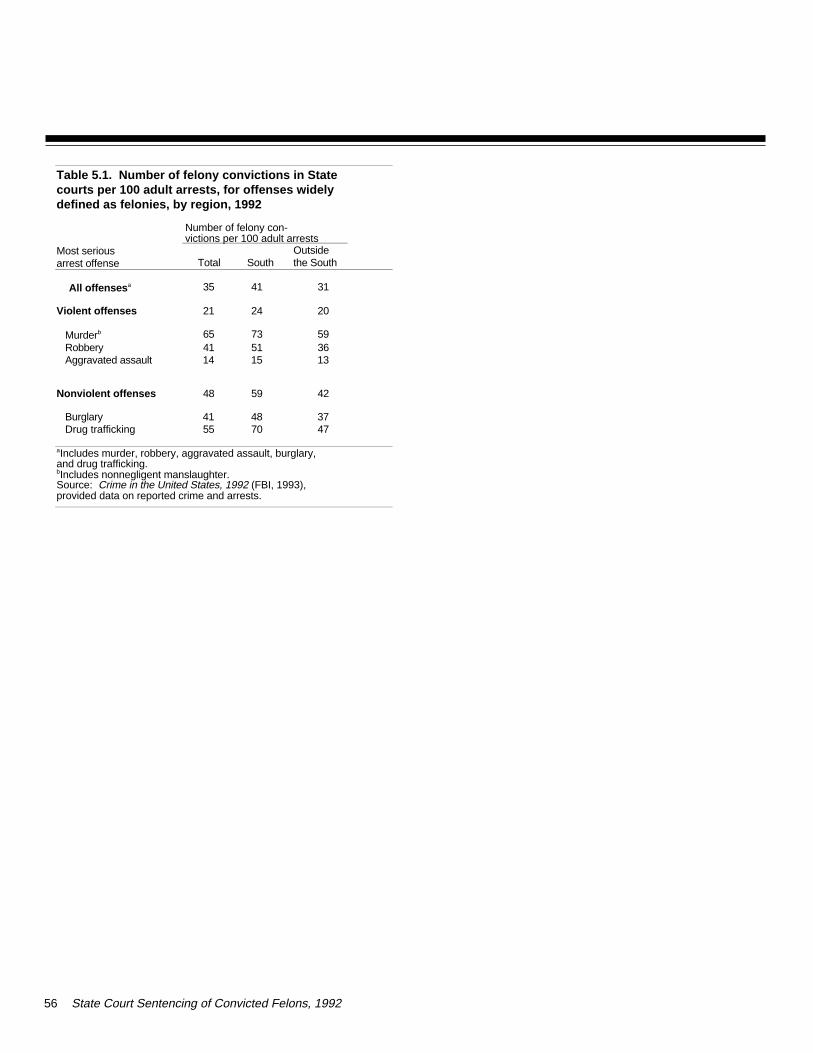
56 State Court Sentencing of Convicted Felons, 1992
Table 5.1. Number of felony convictions in State courts per 100 adult arrests, for offenses widely defined as felonies, by region, 1992
Number of felony con-victions per 100 adult arrests
Most serious arrest offense Total South
Outside the South
All offenses a 35 41 31
Violent offenses 21 24 20
Murderb 65 73 59Robbery 41 51 36Aggravated assault 14 15 13
Nonviolent offenses 48 59 42
Burglary 41 48 37Drug trafficking 55 70 47
aIncludes murder, robbery, aggravated assault, burglary, and drug trafficking.bIncludes nonnegligent manslaughter.Source: Crime in the United States, 1992 (FBI, 1993), provided data on reported crime and arrests.
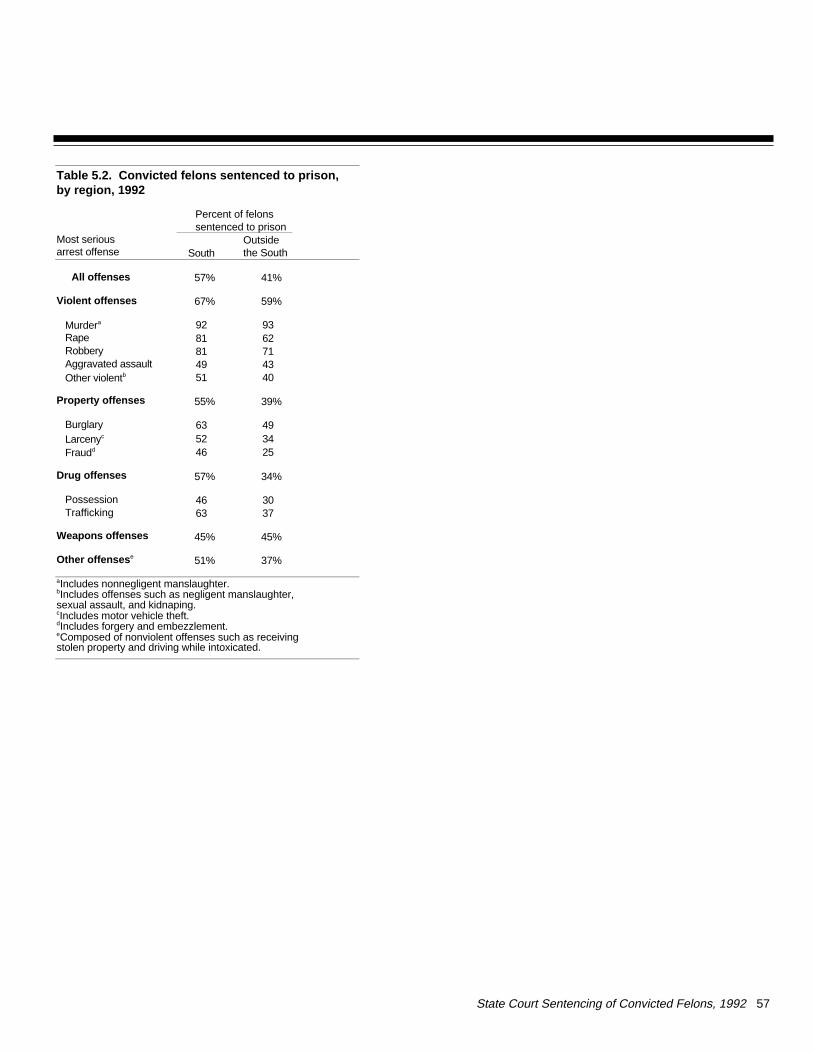
State Court Sentencing of Convicted Felons, 1992 57
Table 5.2. Convicted felons sentenced to prison, by region, 1992
Most serious arrest offense
Percent of felons sentenced to prison
Outsidethe SouthSouth
All offenses 57% 41%
Violent offenses 67% 59%
Murdera 92 93Rape 81 62Robbery 81 71Aggravated assault 49 43Other violentb 51 40
Property offenses 55% 39%
Burglary 63 49Larcenyc 52 34Fraudd 46 25
Drug offenses 57% 34%
Possession 46 30Trafficking 63 37
Weapons offenses 45% 45%
Other offenses e 51% 37%
aIncludes nonnegligent manslaughter.bIncludes offenses such as negligent manslaughter, sexual assault, and kidnaping.cIncludes motor vehicle theft.dIncludes forgery and embezzlement.eComposed of nonviolent offenses such as receiving stolen property and driving while intoxicated.
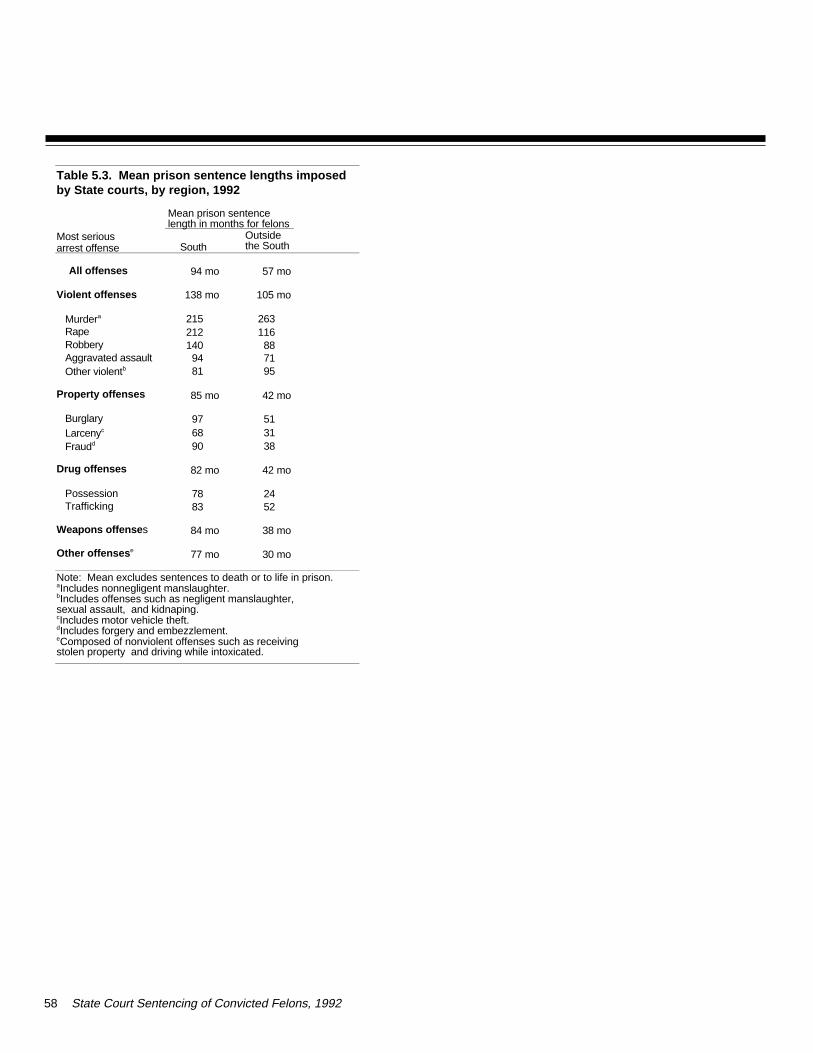
58 State Court Sentencing of Convicted Felons, 1992
Table 5.3. Mean prison sentence lengths imposed by State courts, by region, 1992
Mean prison sentence length in months for felons
Most serious arrest offense
Outsidethe SouthSouth
All offenses 94 mo 57 mo
Violent offenses 138 mo 105 mo
Murdera 215 263Rape 212 116Robbery 140 88Aggravated assault 94 71Other violentb 81 95
Property offenses 85 mo 42 mo
Burglary 97 51Larcenyc 68 31Fraudd 90 38
Drug offenses 82 mo 42 mo
Possession 78 24Trafficking 83 52
Weapons offense s 84 mo 38 mo
Other offenses e 77 mo 30 mo
Note: Mean excludes sentences to death or to life in prison. aIncludes nonnegligent manslaughter.bIncludes offenses such as negligent manslaughter, sexual assault, and kidnaping.cIncludes motor vehicle theft.dIncludes forgery and embezzlement.eComposed of nonviolent offenses such as receiving stolen property and driving while intoxicated.
Trends in drug trafficking arrests
From 1986 to 1989 adult arrests fordrug trafficking rose. Since then, thenumber has generally fallen. In thepeak year, 1989, an estimated406,000 adults were arrested nation-wide for drug trafficking (table 6.1). Inthe latest year of available data, 1994,319,000 were arrested, or 22% fewerthan in 1989.
In short, drug trafficking arrests rosethrough the late 1980's and have gen-erally fallen since.
Trends in drug traffickingconvictions
Biennial data exist since 1986 on con-victions for drug trafficking. Theyshow a large increase in drug traffick-ing convictions from 1986 to 1988, fol-lowed by a large increase from 1988to 1990, followed then by a modestincrease from 1990 to the latest yearof available data, 1992 (table 6.2).
In short, drug trafficking convictionsrose substantially through the late1980's but have risen only slightly in the 1990's.
Trends in drug traffickers as percentages of all convictions
In 1986, 13% of all State court felonyconvictions were for drug trafficking.The number rose to 17% in 1988 andto 20% in 1990. In 1992 it stayed atabout that same level, 19%.
Trends in likelihood of convictiongiven arrest for drug trafficking
The likelihood of conviction given ar-rest can be approximated by relatingthe number of convictions to the num-ber of arrests. Accordingly, in 1986,for every 100 arrests for drug traffick-ing there were 41 convictions. In 1988it was about the same: 39 convictionsfor every 100 arrests. But in 1990 itrose substantially, to 53 convictionsper 100 arrests. In 1992 it stayed atabout that same level, 55 convictionsper 100 arrests.
In short, the likelihood of convictiongiven arrest for drug trafficking roseconsiderably from 1986 to 1990 buthas risen only slightly since then.
Trends in likelihood of prison sen-tence given conviction for drugtrafficking
In 1986, 37% of convicted drug traf-fickers received a prison sentence. In1988 about the same percentage weresent to prison, 41%. But in 1990 thatrate rose considerably, to 52%, and itremained at about that level in 1992,55%.
In short, from 1986 to 1990 a growingpercentage of convicted drug traffick-ers received a prison sentence. Sincethen, the percentage has risen onlyslightly.
Trends in drug traffickers as percentages of prison entries
In 1986 drug traffickers accounted for 11% of all entries to State prisons.In 1988 that number grew to 16% andin 1990 to 22%. In 1992, 21% of en-tering inmates were traffickers.
Overview of recent national trendsin the justice system response todrug trafficking
The period from the mid-1980's to thelate 1980's was characterized by markedly rising risk of apprehension,prosecution, and imprisonment andwas followed by a leveling-off period.However risk is measured whetherby the number of arrests, the numberof convictions, the number of convic-tions relative to arrests, or the per-centage of convictions receiving prison risk rose through the late 1980'sand, except for arrests, has stayed atabout that level since.
In 1986 drug traffickers were 1 inevery 8 persons entering prison, andin 1992, 1 in every 5. This change,over a short period of years, resultednot just from police making more ar-rests, but also from prosecutors pur-suing charges and obtaining con-victions against a larger fraction ofthose arrested and from judges sen-tencing to prison a larger fraction ofthose convicted.
State Court Sentencing of Convicted Felons, 1992 59
Trends in drug trafficking, 1986-94
Drug traffickers and violent offenders: 1992 felony sentencescompared
State courts nationwide sentencedconvicted violent offenders more se-verely than convicted drug traffickers:
48% of drug traffickers and 60% ofviolent offenders received a prisonsentence (table 1.2).
Average prison sentences were 6years for drug traffickers and 10½ years for violent offenders (table1.3).
However, not all State courts sen-tenced violent felony offenders moreseverely than drug traffickers, accord-ing to survey results from the 1992National Judicial Reporting Program.Of the 300 counties that participated inthe survey, courts in 274 convicted atleast 1 drug trafficker and 1 violent of-fender in 1992.
Seventy-four of the 274 or 27% ofthe courts sentenced a greaterfraction of drug traffickers thanviolent offenders to prison:
In the 74 courts where prison sen-tences were imposed more often fordrug traffickers than violent offend-ers, prison sentences were imposedon 76% of convicted drug traffickersand 55% of convicted violentoffenders.
These results suggest that about aquarter of the Nation's State courtsimprison a higher percentage of drugtraffickers than violent offenders.
In some courts, longer prison sen-tences were imposed on drug traffick-ers than on violent offenders. Of the246 courts that sentenced to prison atleast one drug trafficker and one vio-lent offender in 1992, 30 or 12% on average sentenced drug traffickersto longer terms of imprisonment thanviolent offenders:
In the 30 State courts where sen-tences were longer for drug traffick-ers than violent offenders, theaverage prison sentence imposedwas nearly 12 years for drug traffick-ers and 9 years for violent offenders.
60 State Court Sentencing of Convicted Felons, 1992
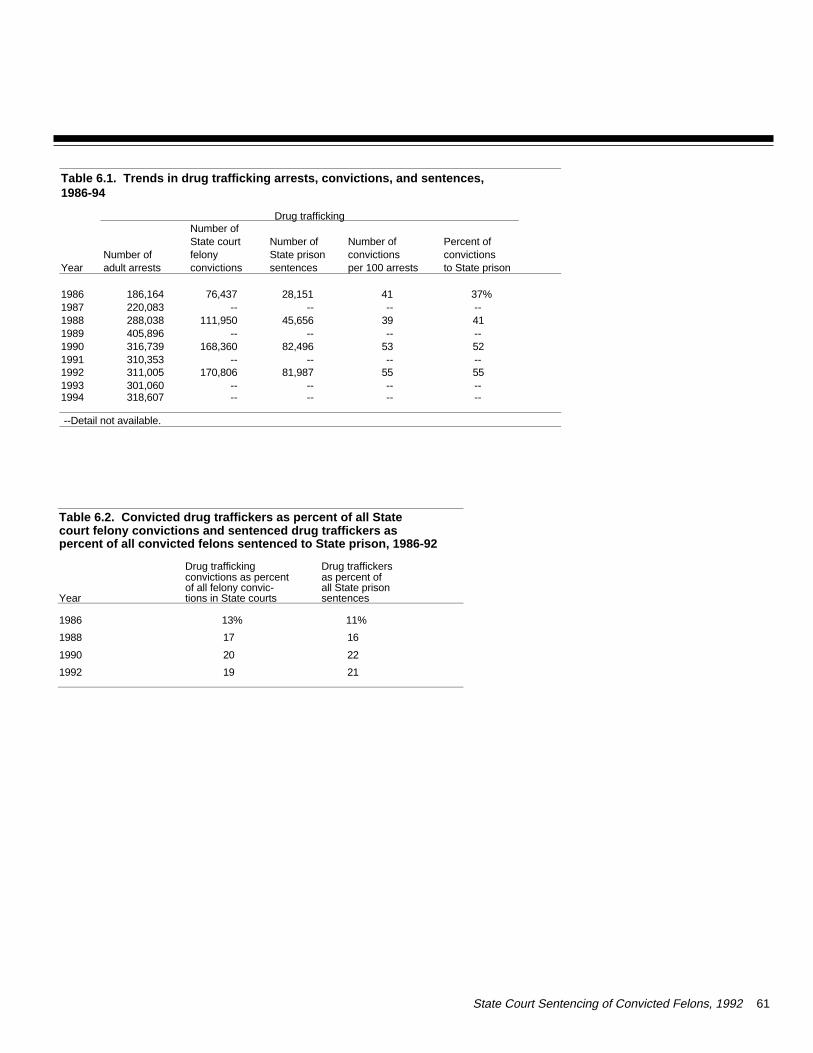
State Court Sentencing of Convicted Felons, 1992 61
Table 6.2. Convicted drug traffickers as percent of all State court felony convictions and sentenced drug traffickers as percent of all convicted felons sentenced to State prison, 1986-92
Year
Drug trafficking convictions as percentof all felony convic-tions in State courts
Drug traffickers as percent of all State prisonsentences
1986 13% 11%
1988 17 16
1990 20 22
1992 19 21
Table 6.1. Trends in drug trafficking arrests, convictions, and sentences,1986-94
Drug trafficking
YearNumber ofadult arrests
Number ofState court felonyconvictions
Number ofState prisonsentences
Number of convictions per 100 arrests
Percent of convictions to State prison
1986 186,164 76,437 28,151 41 37%1987 220,083 -- -- -- -- 1988 288,038 111,950 45,656 39 411989 405,896 -- -- -- -- 1990 316,739 168,360 82,496 53 521991 310,353 -- -- -- -- 1992 311,005 170,806 81,987 55 551993 301,060 -- -- -- -- 1994 318,607 -- -- -- --
--Detail not available.
Sampling
Except for 1 county (replaced by an-other county), the sample of 300 coun-ties drawn for the 1988 survey wasalso used in the 1992 survey. Everycounty in the Nation had a nonzeroprobability of being in the sample. In general, the more felony cases acounty had, the more likely that countywas to be in the sample.
The survey used a two-stage, strati-fied cluster sampling design. In thefirst stage the Nation's 3,109 countiesor county equivalents were dividedinto 8 strata. Strata 1 and 2 consistedsolely of the 75 largest counties in theUnited States as defined by the1985resident population. Strata 3 through8 consisted of the remaining 3,034counties.
Because the 75 largest counties ac-count for a disproportionately largeamount of serious crime in the Nation,they were given a greater chance ofbeing selected than the remainingcounties.
Stratum 1 consisted of the 19 countieswith the largest number of felony con-victions in 1985, plus 12 countieswhose participation in the survey hadbeen prearranged. Every county instratum 1 was selected for thesample.
Stratum 2 consisted of the 44 mostpopulous counties that were not instratum 1. The 44 were ordered bytheir number of felony convictions in1985, and then approximately everyother county was selected. Stratum 2 thus contributed 23 counties to thesample. Altogether, 54 out of the 75largest counties were sampled. Dataon 1985 felony convictions were ob-tained from a mail survey described
in State Felony Courts and FelonyLaws (NCJ-106273) and Census ofState Felony Courts, 1985(ICPSR-8667).
The 54 sampled counties in the 1992NJRP survey were the same 54 as inthe 1986, 1988, and 1990 NJRPsurveys.
The 3,034 counties not among the 75 largest were placed into 6 strata defined by the total number of felonyconvictions in 1985 and then arrayedwithin stratum by region and within re-gion from largest to smallest on felonyconviction totals. The final sample in-cluded 246 counties from among the3,034 counties outside the 75 largest.Case-level data were successfully ob-tained on convicted felons sentencedin 1992 from these 300 sampled coun-ties. (Two of the 300 had no felonyconvictions during the survey period.)
The 60 sampled counties in strata 1and 3 were self-representing only, andtheir sampled cases therefore had afirst-stage sampling weight of 1. Theremaining 240 counties sampled fromstrata 2 and 4 through 8 were selectedto represent their respective strata sothat the felony conviction cases sam-pled had first-stage weights greaterthan 1.
At the second stage of sampling, asystematic sample of felons sen-tenced for murder/nonnegligent man-slaughter, rape, robbery, aggravatedassault, burglary, felony larceny/motorvehicle theft, fraud/forgery/-embezzlement, drug trafficking, drugpossession, weapons offenses, andother offenses was selected from eachcounty's official records. The totalsample numbered 105,657 cases. Ofthese, 72,943 cases were in the 75largest counties. Rates at which cases were sampledvaried by stratum and crime type.
In smaller counties every felony casewas taken. In larger counties all murder cases and rape cases weretypically included, but other offensecategories were sampled.
Sampling error
NJRP data were obtained from a sample and not from a complete enumeration. Consequently, esti-mates are subject to sampling error.A standard error, which is a measureof sampling error, is associated witheach number in the report. In general,if the difference between two numbersis at least twice the standard error ofthat difference (the criterion used inthis report), there is at least 95% confidence that the two numbers do infact differ; that is, the apparent differ-ence is not simply the result of survey-ing a sample rather than the entirepopulation.
National estimates of the number ofconvictions for individual crime catego-ries and for the aggregate total had acoefficient of variation of 3%.
Missing data
Unless otherwise stated, computationsof statistics shown in the report's ta-bles excluded sample cases that weremissing data for the particular vari-ables being tabulated. Sources of data
For about 80% of the 300 countiessampled, NJRP data were obtaineddirectly from the State courts. Othersources included prosecutor offices,and courts and prosecutor officescombined. Individual-level NJRP rec-ords were obtained through a varietyof collection methods, including mag-netic tape (61% of the counties), fieldcollection (12%), printouts and other
62 State Court Sentencing of Convicted Felons, 1992
Methodology
documents, and manually completedforms.
Data collection for 235 counties wasperformed by the U.S. Bureau of theCensus and for 65 counties by the Na-tional Association of Criminal JusticePlanners.
Targeted population
The survey targeted and recorded ini-tial sentences imposed in 1992. If asentence was imposed on one dateand then modified at a later date, therevision was ignored. The survey re-corded sentences that were actuallyexecuted and excluded suspendedsentences.
Because year of conviction was not adefining characteristic, some cases inthe sample were of persons convictedbefore 1992 but not sentenced until1992. In a few counties in which itwas impractical to target sentences in1992, the target was felons convictedin 1992. In some of the cases, thedata relate to sentences imposedafter 1992.
Crime definitions
Murder and nonnegligent manslaugh-ter: Murder is (1) intentionally causingthe death of another person withoutextreme provocation or legal justifica-tion or (2) causing the death of an-other while committing or attemptingto commit another crime. Nonnegli-gent (or voluntary) manslaughter isintentionally and without legal justifica-tion causing the death of anotherwhen acting under extreme provoca-tion. The combined category of mur-der and nonnegligent manslaughterexcludes involuntary or negligent man-slaughter, conspiracies to commitmurder, solicitation of murder, and at-tempted murder.
Rape: forcible intercourse (vaginal,anal, or oral) with a female or male.Includes forcible sodomy or penetra-tion with a foreign object (which aresometimes called "deviate sexual as-sault"), but excludes statutory rape orany other nonforcible sexual acts witha minor or with someone unable togive legal or factual consent. Includesattempts.
Robbery: the unlawful taking of prop-erty that is in the immediate posses-sion of another, by force or the threatof force. Includes forcible pursesnatching, but excludes nonforciblepurse snatching, which is classified as larceny/theft. Includes attempts.
Aggravated assault: (1) intentionallyand without legal justification causingserious bodily injury, with or without adeadly weapon, or (2) using a deadlyor dangerous weapon to threaten, at-tempt, or cause bodily injury, regard-less of the degree of injury, if any.Includes "attempted murder," "aggra-vated battery," "felonious assault," and"assault with a deadly weapon."
Other violent: violent offenses exclud-ing murder and nonnegligent man-slaughter, rape, robbery, andaggravated assault. Includes offensessuch as sexual assault, kidnaping, ex-tortion, and negligent manslaughter.Includes attempts.
Burglary: the unlawful entry of a fixedstructure used for a regular residence,industry, or business, with or withoutthe use of force, to commit a felony or theft. Includes attempts.
Larceny and motor vehicle theft: Lar-ceny is the unlawful taking of propertyother than a motor vehicle from thepossession of another, by stealth,without force or deceit. Includespocket picking, nonforcible pursesnatching, shoplifting, and thefts from
motor vehicles. Excludes receivingand/or reselling stolen property (fenc-ing), and thefts through fraud or de-ceit. Includes attempts.
Motor vehicle theft: The unlawful tak-ing of a self-propelled road vehicleowned by another. Includes the theftof automobiles, trucks, and motorcy-cles, but excludes the theft of boats,aircraft, or farm equipment (which isclassified as larceny/theft). Also in-cludes receiving, possessing, strip-ping, transporting, and reselling stolenvehicles, and unauthorized use of avehicle (joyriding). Includes attempts.
Fraud, forgery, and embezzlement:using deceit or intentional misrepre-sentation to unlawfully deprive a per-son of his or her property or legalrights. Includes offenses such ascheck fraud, confidence game, coun-terfeiting, and credit card fraud. In-cludes attempts.
Drug possession: Includes posses-sion of an illegal drug, but excludes"possession with intent to sell." In-cludes attempts.
Drug trafficking: includes manufactur-ing, distributing, selling, smuggling, or"possession with intent to sell." In-cludes attempts.
Weapons offenses: The unlawfulsale, distribution, manufacture, altera-tion, transportation, possession, oruse of a deadly or dangerous weaponor accessory.
Other felonies: All felony offenses notlisted above. Includes receiving stolenproperty, driving while intoxicated orother traffic offenses, bribery, ob-structing justice, escaping from cus-tody, family offenses (such as childneglect, contributing to the delin-quency of a minor, and nonpaymentof child support), and nonviolent
State Court Sentencing of Convicted Felons, 1992 63
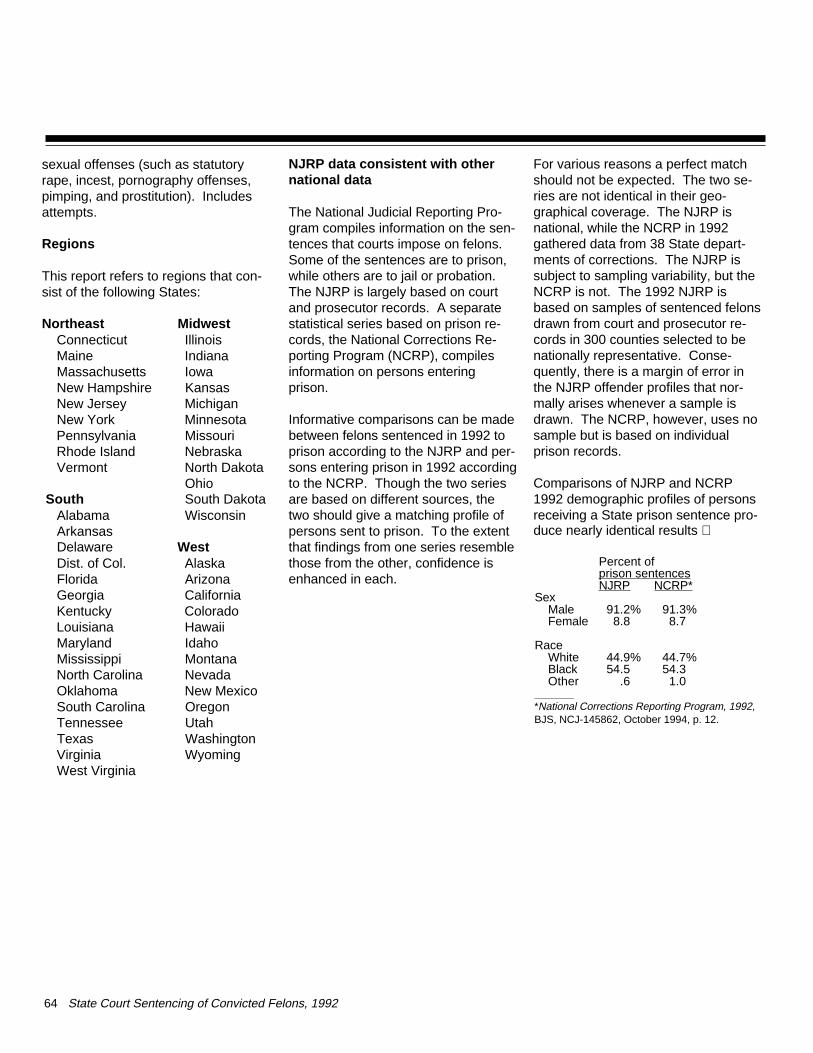
sexual offenses (such as statutoryrape, incest, pornography offenses,pimping, and prostitution). Includesattempts.
Regions
This report refers to regions that con-sist of the following States:
Northeast Midwest Connecticut Illinois Maine Indiana Massachusetts Iowa New Hampshire Kansas New Jersey Michigan New York Minnesota Pennsylvania Missouri Rhode Island Nebraska Vermont North Dakota Ohio South South Dakota Alabama Wisconsin Arkansas Delaware West Dist. of Col. Alaska Florida Arizona Georgia California Kentucky Colorado Louisiana Hawaii Maryland Idaho Mississippi Montana North Carolina Nevada Oklahoma New Mexico South Carolina Oregon Tennessee Utah Texas Washington Virginia Wyoming West Virginia
NJRP data consistent with othernational data
The National Judicial Reporting Pro-gram compiles information on the sen-tences that courts impose on felons.Some of the sentences are to prison,while others are to jail or probation.The NJRP is largely based on courtand prosecutor records. A separatestatistical series based on prison re-cords, the National Corrections Re-porting Program (NCRP), compilesinformation on persons enteringprison.
Informative comparisons can be madebetween felons sentenced in 1992 toprison according to the NJRP and per-sons entering prison in 1992 accordingto the NCRP. Though the two seriesare based on different sources, thetwo should give a matching profile ofpersons sent to prison. To the extentthat findings from one series resemblethose from the other, confidence isenhanced in each.
For various reasons a perfect matchshould not be expected. The two se-ries are not identical in their geo-graphical coverage. The NJRP isnational, while the NCRP in 1992gathered data from 38 State depart-ments of corrections. The NJRP issubject to sampling variability, but theNCRP is not. The 1992 NJRP isbased on samples of sentenced felonsdrawn from court and prosecutor re-cords in 300 counties selected to benationally representative. Conse-quently, there is a margin of error inthe NJRP offender profiles that nor-mally arises whenever a sample isdrawn. The NCRP, however, uses nosample but is based on individualprison records.
Comparisons of NJRP and NCRP1992 demographic profiles of personsreceiving a State prison sentence pro-duce nearly identical results
Percent of prison sentencesNJRP NCRP*
SexMale 91.2% 91.3%Female 8.8 8.7
RaceWhite 44.9% 44.7%Black 54.5 54.3Other .6 1.0
64 State Court Sentencing of Convicted Felons, 1992
*National Corrections Reporting Program, 1992,BJS, NCJ-145862, October 1994, p. 12.