Embed Size (px)
Citation preview
State Diagrams These are useful for objects or
attributes that have a small number of states or values,
and restrictions on permitted transitions.
Not too many objects/attributes satisfy these conditions…
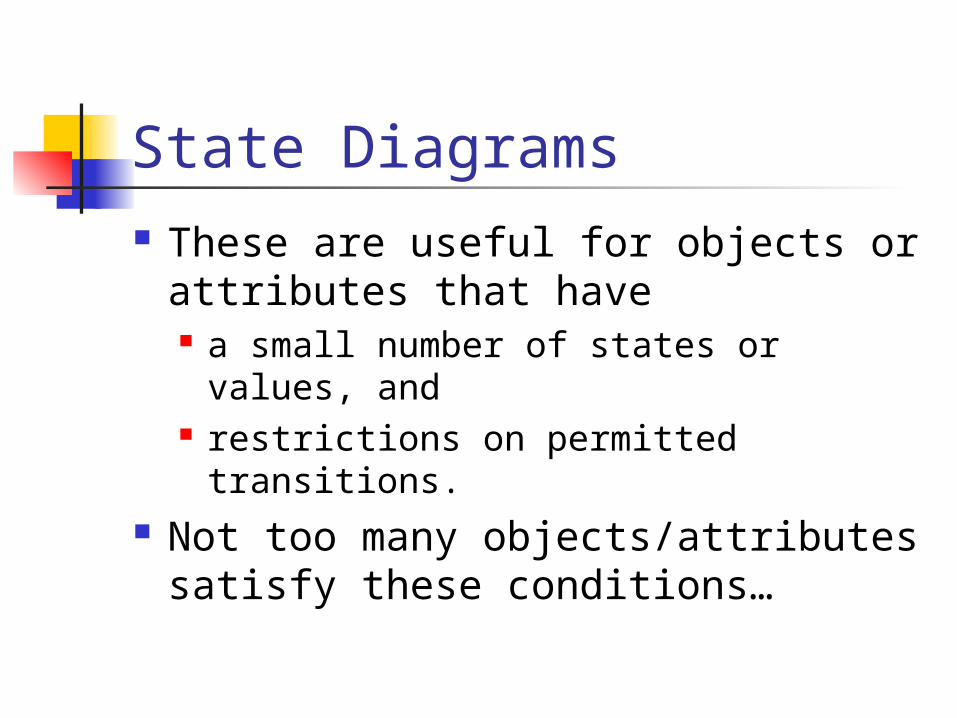
Pittsburgh Intersection
RoadIntersection
direction
North/south may go straight North/south may go left
East/west may turn left East/west may go straight
time-out time-out
time-out[ cars in E/W left lane ]
time-out[ no cars in E/W left lane ]
time-out[ cars in N/S left lane ]
time-out[ no cars in N/S left lane ]
state
event
guard
States A state may be indicated by values of one
or more variables, or it may be recognized by the legal
operations currently permitted. “A state represents the response of the
object to input events.” (Rumbaugh) States depend on the level of abstraction in
use: My calendar says “traveling to London” (a single
state) The airline says “Pgh-Mtl, Mtl-Lon.
Events Events happen “instantaneously”
(states have duration). “An event is a one-way transmission of
information from one object to another.” (Rumbaugh).
If there is a reply, it is a separate event. Events may signal that something has
occurred, or may (also) transmit information.
Other Stuff in State Diagrams Guards (conditions): a logical condition
that must be true, in addition to the firing of an event.
“When you arrive to class late (event), if the professor is in a good mood (condition), you’ll be allowed in (new state).
Guards are also implicit in nested states; you must be in the outer state in order to get to the inner state.
Other Stuff (cont.) Operations
Can happen within a state (Moore convention), or
Can happen at the time of transition(Mealy convention).
Operations use the same notation as class operations
Entry and exit operations are also distinguished.
Nested States A way to relate states hierarchically. Ex: buttons in a non-modal dialog box will
respond only if the dialog “has the focus”. Ex: a document can be printed only if it has
been saved. Nesting reduces the number of guards. Nested state diagrams show entry and exit
states with dots and bulls eye symbols.
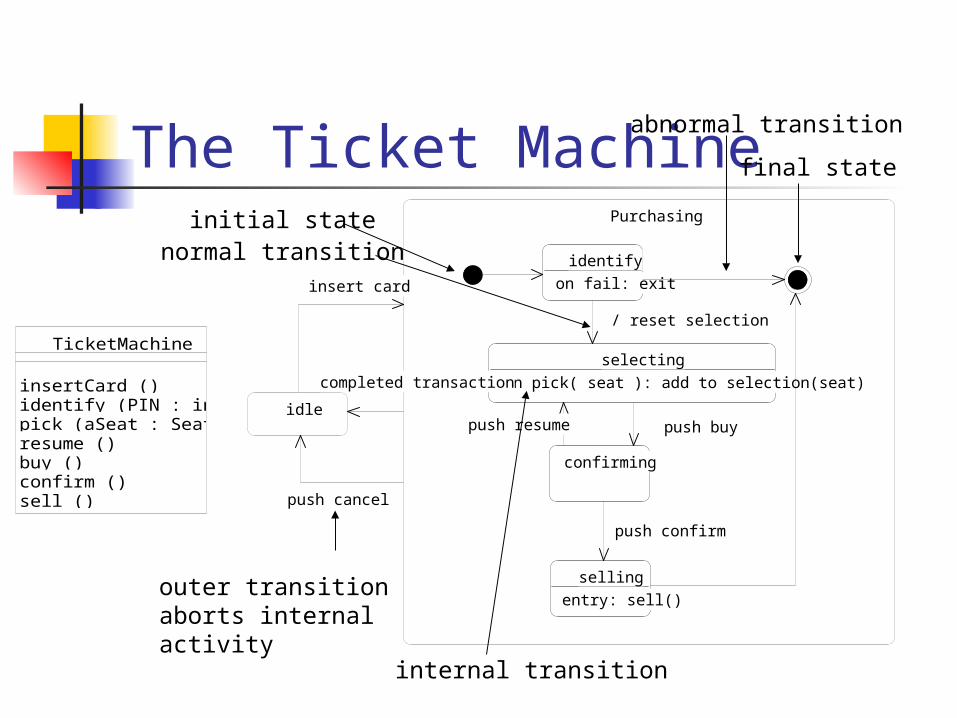
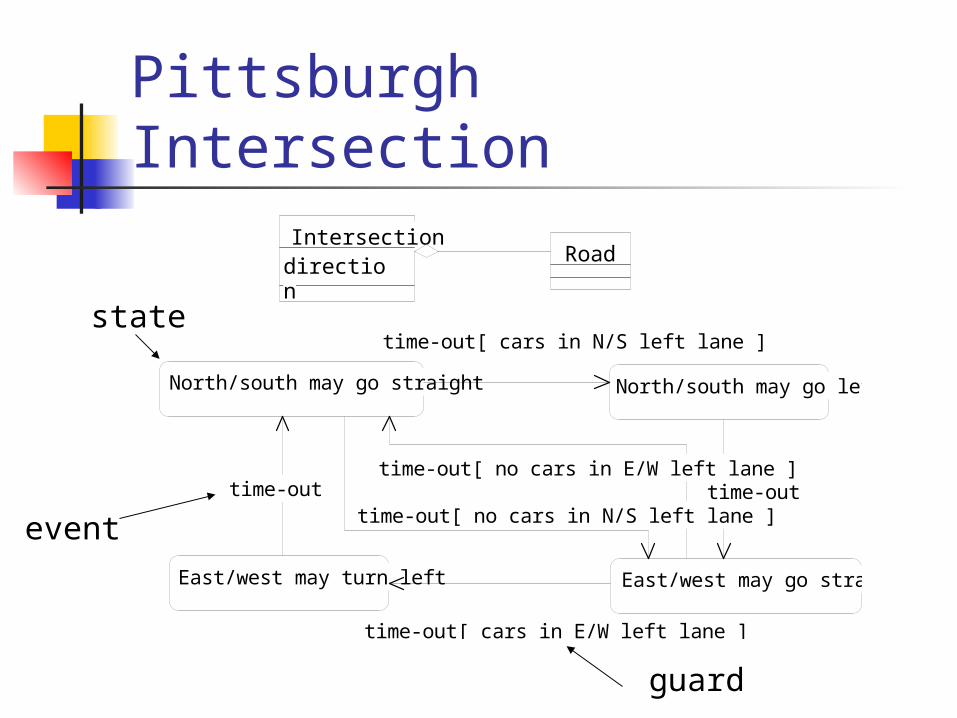
TicketMachine
insertCard ()identify (PIN : int) : booleanpick (aSeat : Seat)resume ()buy ()confirm ()sell ()cancel ()
The Ticket MachinePurchasing
identify
on fail: exit
selecting
on pick( seat ): add to selection(seat)
confirming
selling
entry: sell()
identify
on fail: exit
selecting
on pick( seat ): add to selection(seat)
confirming
selling
entry: sell()
push buyidle
push cancel
completed transaction
insert card
push resume
push confirm
/ reset selection
initial state
final state
outer transitionaborts internalactivity
abnormal transition
internal transition
normal transition
Example: The Mouse In many applications, objects on the
screen are selected by a mouse cursor and (left) button.
The cursor “tracks” the mouse movement. If the left button is pressed with the cursor
on an item, that item is selected, otherwise the previously selected items are deselected.
Moving the mouse with the left button held down drags any selected items.
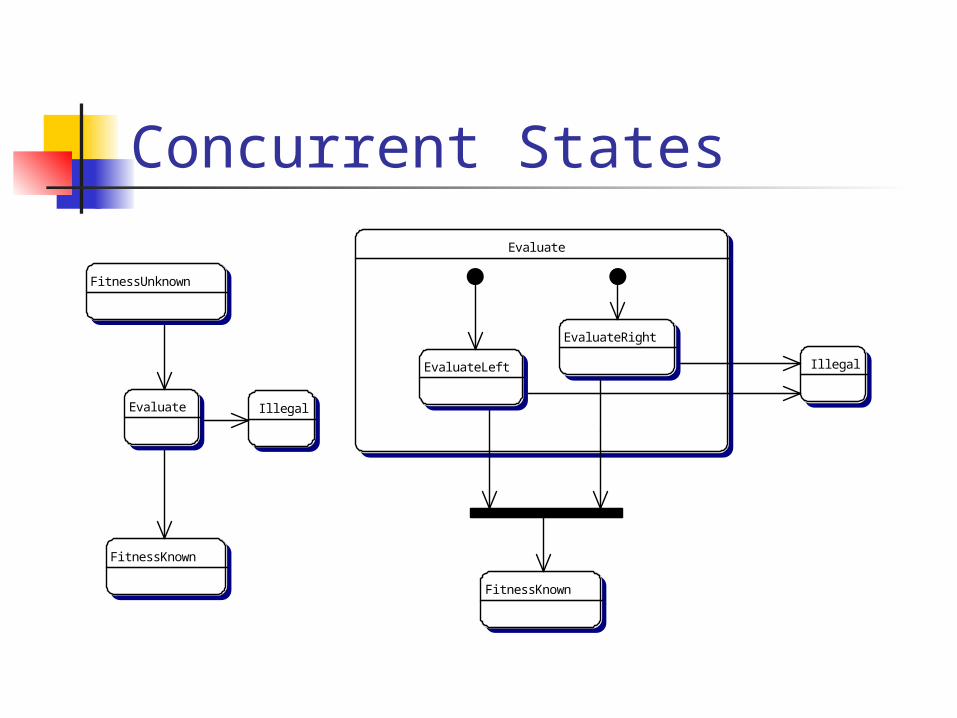
Concurrent States
FitnessKnown
FitnessUnknown
IllegalEvaluate
FitnessKnown
Illegal
Evaluate
EvaluateLeft
EvaluateRight
Comments on Together You can draw concurrent states,
but the dotted line separating concurrent parts isn’t there.
I can’t seem to get the “stub state” symbol, though it is part of UML.
Together Help is useless…
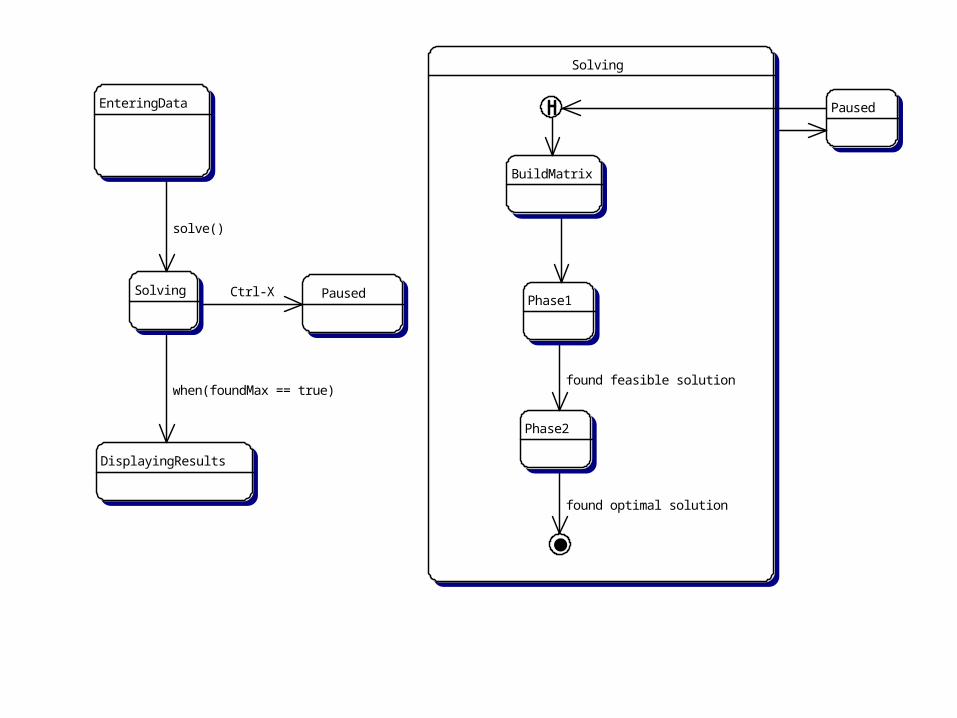
History Symbol An entry point, indicating the
object sub-state should be the same as it was when the enclosing state was last left.
On first entry, start in the state the history symbol points to.
Consider an optimizer, which the user can pause (to examine an intermediate solution).
DisplayingResults
EnteringData
Solving Paused
Paused
Solving
BuildMatrix
Phase1
Phase2
when(foundMax == true)
solve()
Ctrl-X
found optimal solution
found feasible solution
System Architecture A package is a collection of software elements,
usually classes. Package diagrams show dependencies between
packages: Some class in PackageA uses a class in PackageB
Multiple dependencies between a pair of packages are shown as a single dependency.
In UML, packages may contain other packages Together makes it reasonably easy to create
actual Java packages, straight from the notation.
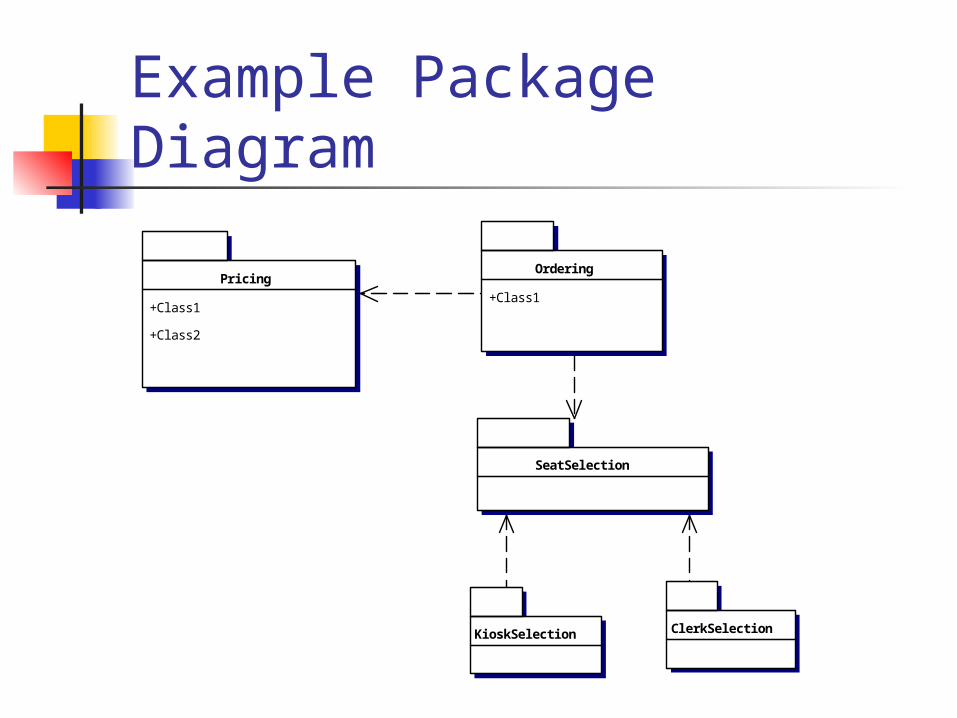
Example Package Diagram
Pricing
+Class1
+Class2
Ordering
+Class1
KioskSelection ClerkSelection
SeatSelection
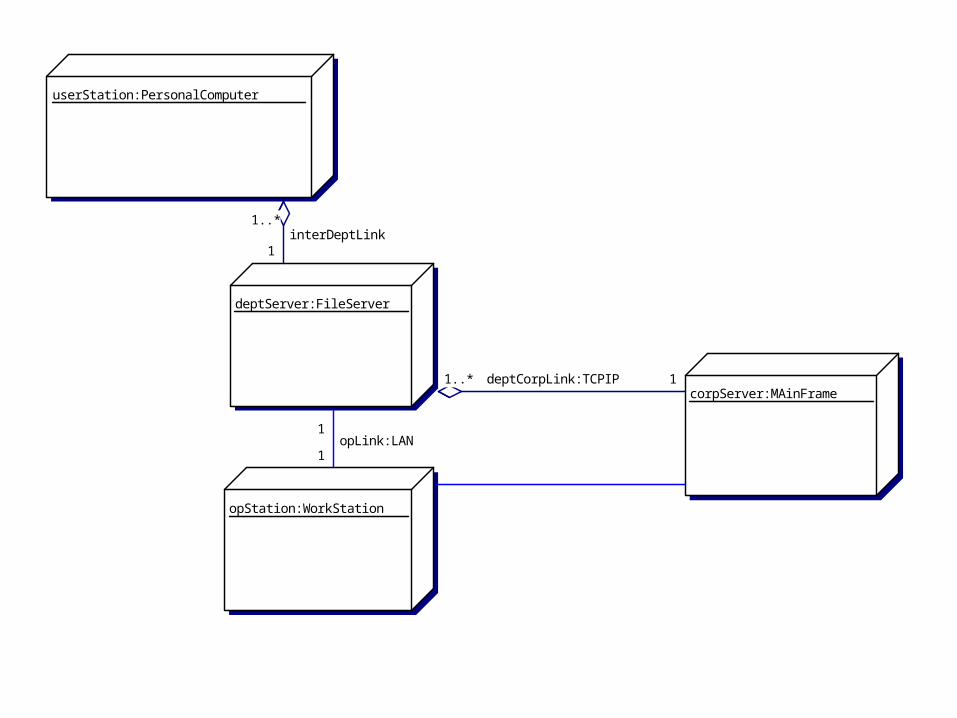
Deployment Diagrams Nodes are run-time physical objects
representing computing resources. Associations are communications
paths. UML specifies that stereotyping is
possible, but not in Together. Nodes can contain components, with
interfaces. You’ll might like this for Java beans, but I won’t cover it.
opStation:WorkStation
corpServer:MAinFrame
userStation:PersonalComputer
deptServer:FileServer
1..* 1deptCorpLink:TCPIP
1
1opLink:LAN
1..*
1interDeptLink
User Interface Diagrams Not part of UML, but possibly useful. Together doesn’t support this. Mock-ups are easily made in e.g., Visual
Basic. Probably useful to show window
navigation; this would nicely augment use cases.
Like Page-Jones, you could use a state diagram as a quick-and-dirty substitute.
More Interaction Diagram Examples The OneMinute Microwaver
A single control button If door closed and button pushed,
oven will cook (tube on) for 1 minute. Pushing the button while cooking
adds 1 minute of cooking time. Pushing the button with the door
open has no effect.
OneMinute Microwaver (cont.)
There is a light inside the oven. Any time the oven is cooking, the light must
be on. Any time the door is open, the light must be
on. Opening the door stops cooking. If user closes the door, the light goes out. If the oven times out, both the power tube
and the light go off, and a warning beep is issued.
Let’s Try This Use case: Ask a command prompt
user for one or more values, all on on one input line (i.e., before a \cr). Examine the input and check if each value is of the proper type, and within range. Be prepared to answer if the input is legitimate, and if not, which input values are illegitimate.
ArcView & Avenue ArcView is a very nice GIS product. Avenue is an excellent (but soon
dearly departed) O-O scripting language.
You can’t create classes in Avenue, but the existing ones have zillions of methods.
Message passing is all you do!
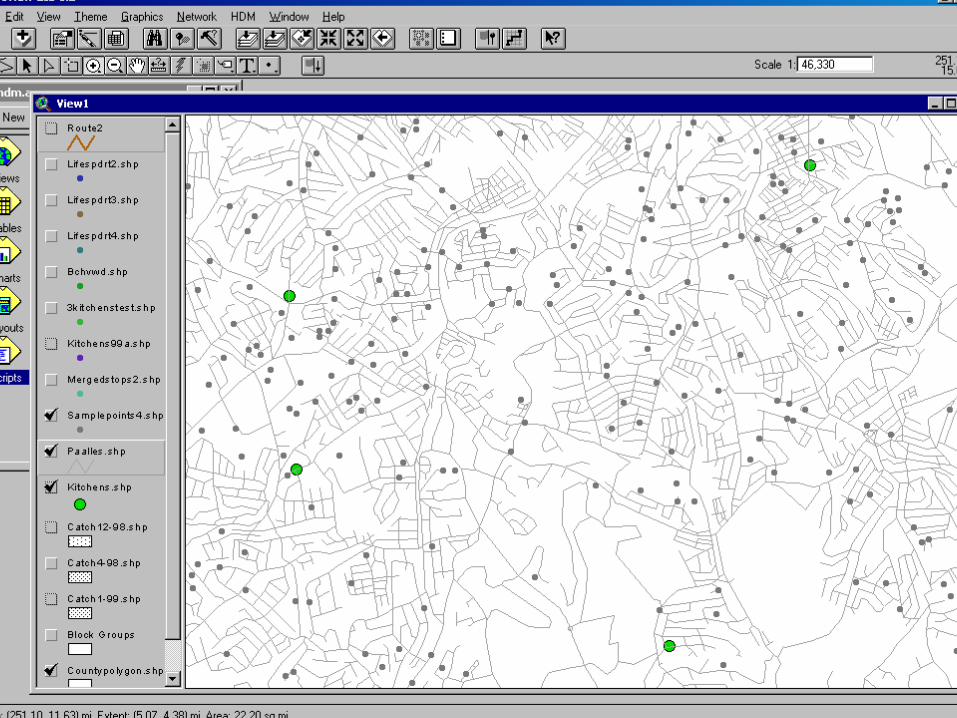
ArcView & Avenue
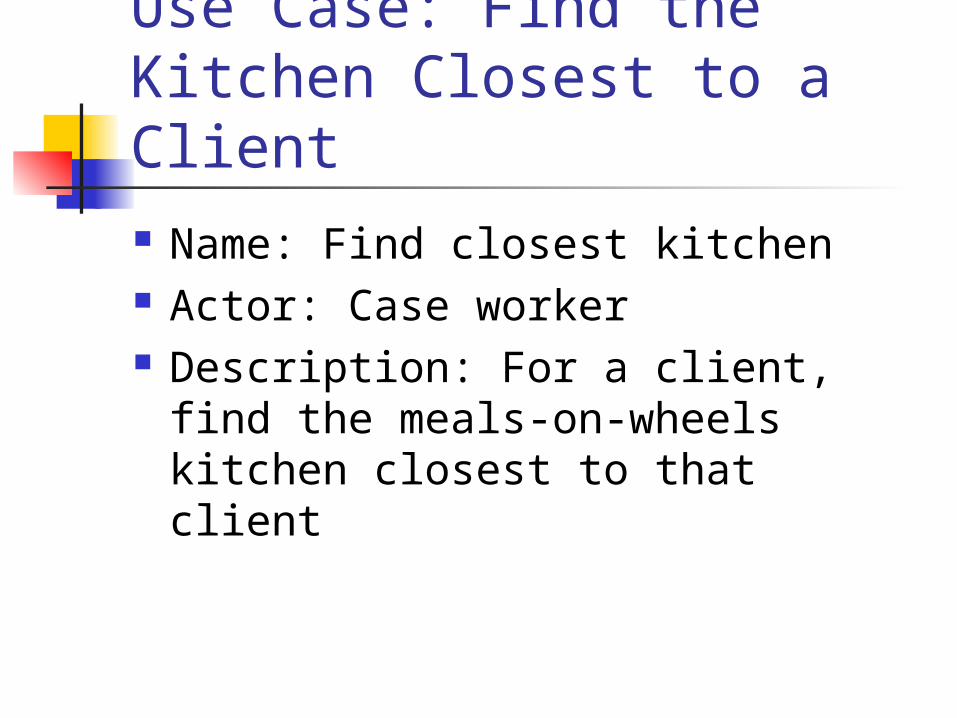
Use Case: Find the Kitchen Closest to a Client Name: Find closest kitchen Actor: Case worker Description: For a client, find the
meals-on-wheels kitchen closest to that client
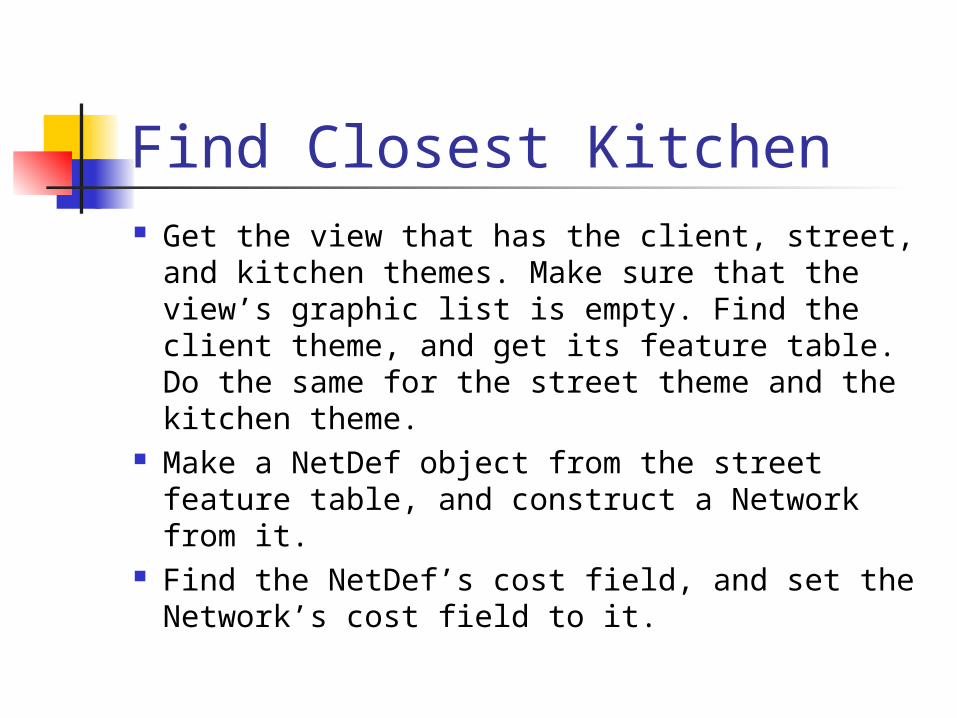
Find Closest Kitchen Get the view that has the client, street, and
kitchen themes. Make sure that the view’s graphic list is empty. Find the client theme, and get its feature table. Do the same for the street theme and the kitchen theme.
Make a NetDef object from the street feature table, and construct a Network from it.
Find the NetDef’s cost field, and set the Network’s cost field to it.
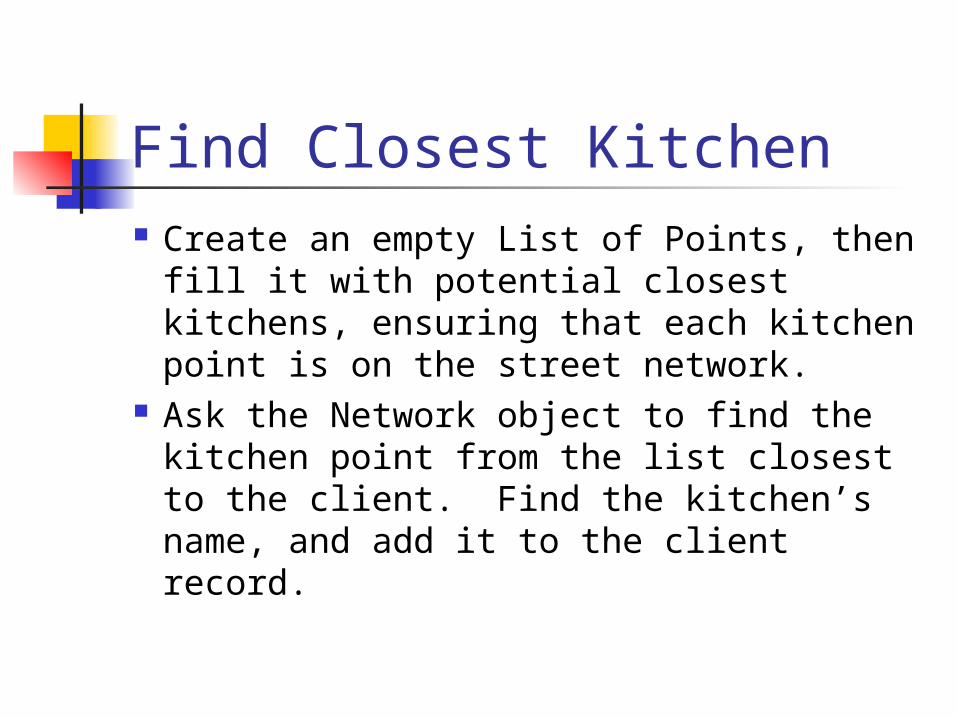
Find Closest Kitchen Create an empty List of Points, then
fill it with potential closest kitchens, ensuring that each kitchen point is on the street network.
Ask the Network object to find the kitchen point from the list closest to the client. Find the kitchen’s name, and add it to the client record.
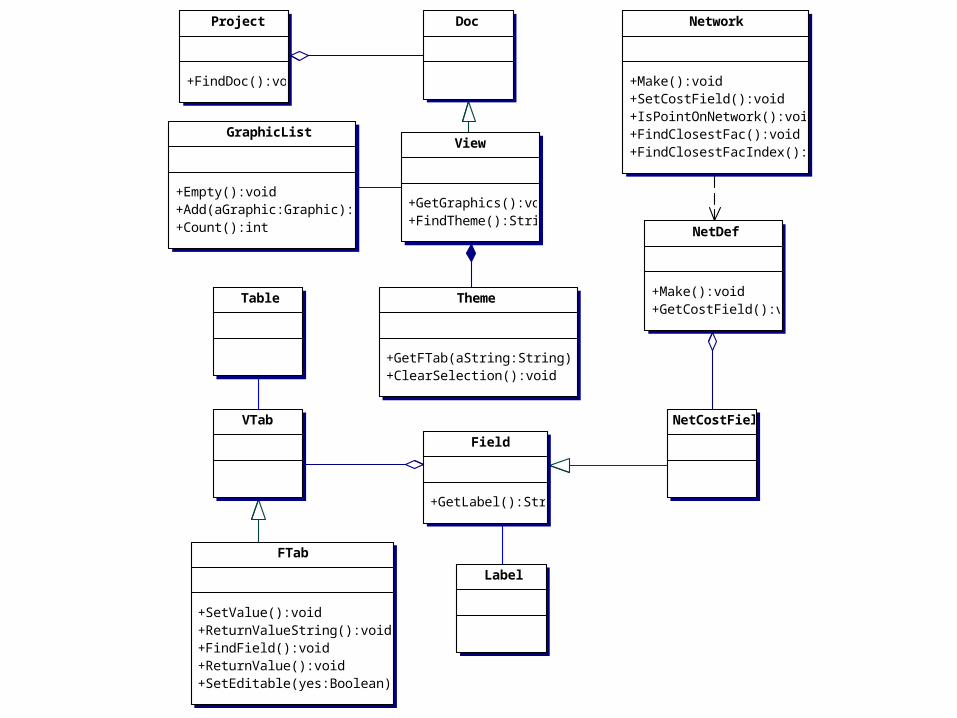
View
+GetGraphics():void+FindTheme():String
DocProject
+FindDoc():void
GraphicList
+Empty():void+Add(aGraphic:Graphic):void+Count():int
Table Theme
+GetFTab(aString:String):FTab+ClearSelection():void
VTab
FTab
+SetValue():void+ReturnValueString():void+FindField():void+ReturnValue():void+SetEditable(yes:Boolean):void
Network
+Make():void+SetCostField():void+IsPointOnNetwork():void+FindClosestFac():void+FindClosestFacIndex():void
Field
+GetLabel():String
Label
NetCostField
NetDef
+Make():void+GetCostField():void
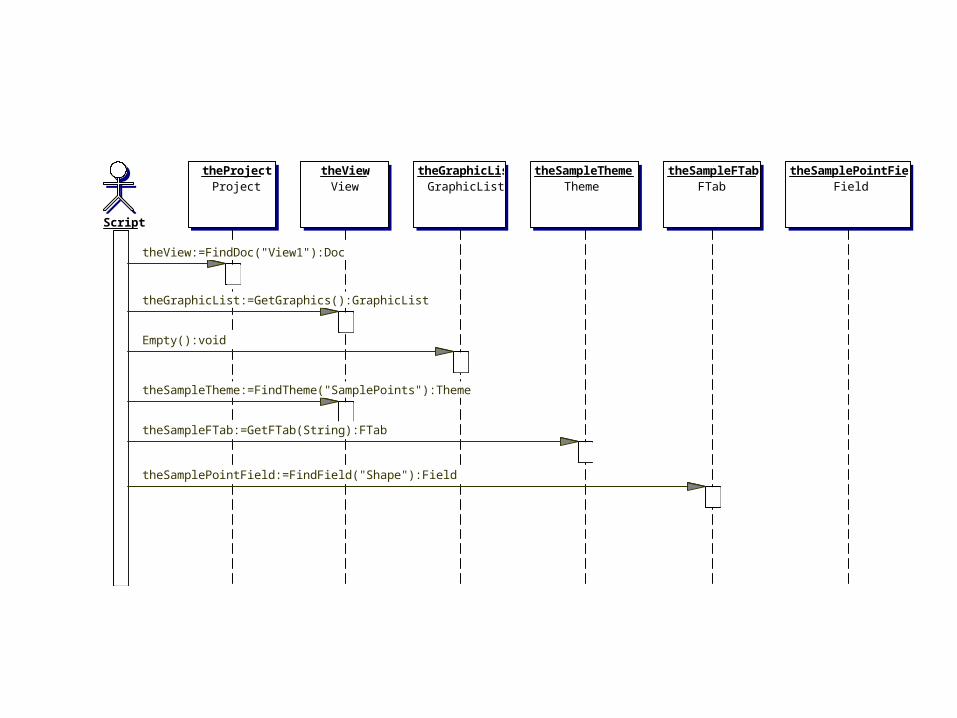
theViewView
theGraphicListGraphicList
theSampleThemeTheme
theSamplePointFieldField
theSampleFTabFTab
theProjectProject
Script
theSamplePointField:=FindField("Shape"):Field
theSampleFTab:=GetFTab(String):FTab
theSampleTheme:=FindTheme("SamplePoints"):Theme
Empty():void
theGraphicList:=GetGraphics():GraphicList
theView:=FindDoc("View1"):Doc
This Seems a Bit Tedious! Are there methods that can
encapsulate these requests? Does a sequence diagram like this
suggest that we’ve failed in defining necessary objects?
Or is this just the normal state of affairs?