Embed Size (px)
Citation preview
Results-Driven Accountability (RDA)
State Directors ConferenceBoise, ID, March 4, 2013
Cesar D’AgordRegional Resource Center ProgramWRRC – Western Region
What do we know about RDA? How is RDA likely to impact your State?
How will it possibly impact your School district?
RDA…
“ The opinions and information expressed in this presentation do not necessarily reflect the position or policy of the Office of Special Education Programs (OSEP) or the United States Department of Education (USDOE). No endorsement of OSEP or USDOE should be inferred."
A presentation prepared by OSEP, delivered nationally to all states via webinar on August 27, 2012
OSEP’s Memo 13-6, distributed to states on December 12, 2012 (12/12/12)
IDEA Section 618 Report to Congress data National Center on Educational Outcomes
(NCEO) materials WRRC materials and data calculations IDEA 2004
Data Sources for this Presentation:
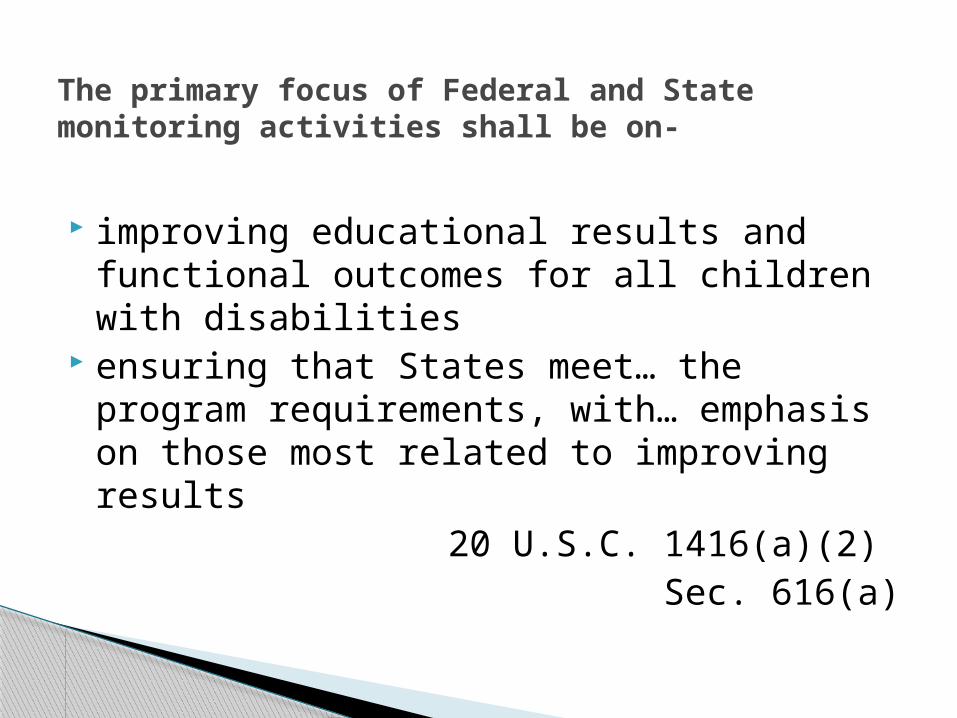
improving educational results and functional outcomes for all children with disabilities
ensuring that States meet… the program requirements, with… emphasis on those most related to improving results
20 U.S.C. 1416(a)(2) Sec. 616(a)
The primary focus of Federal and State monitoring activities shall be on-
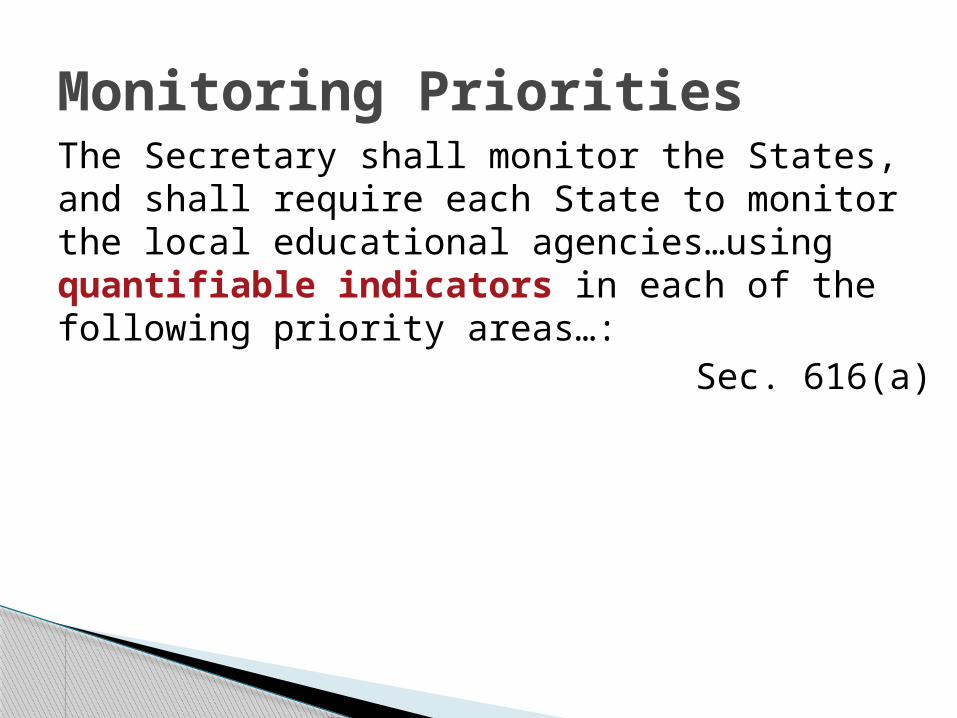
The Secretary shall monitor the States, and shall require each State to monitor the local educational agencies…using quantifiable indicators in each of the following priority areas…:
Sec. 616(a)
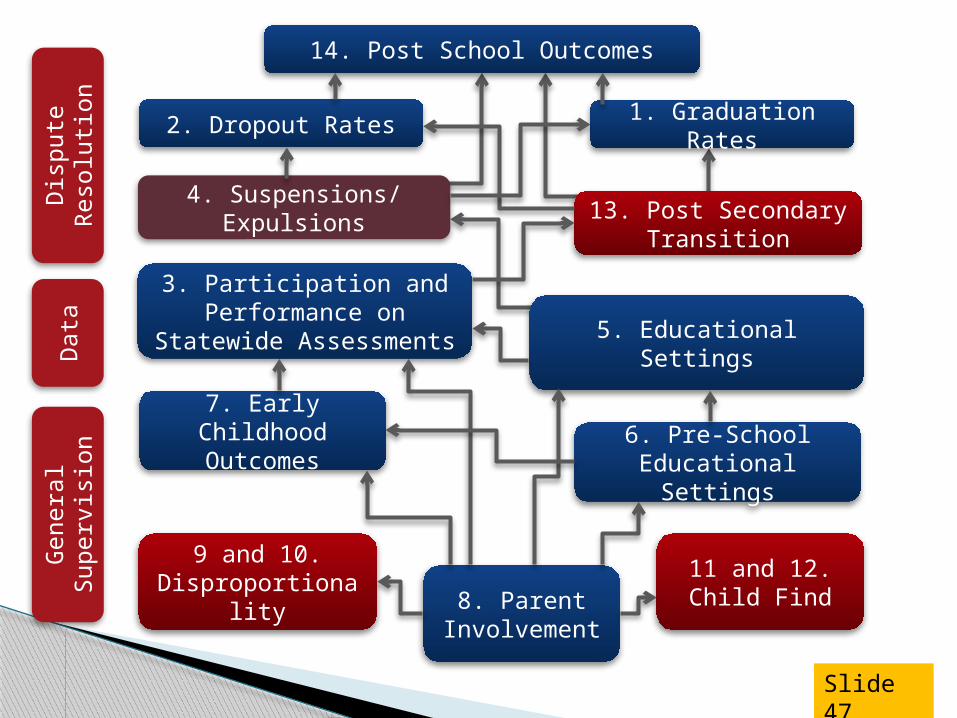
Monitoring Priorities
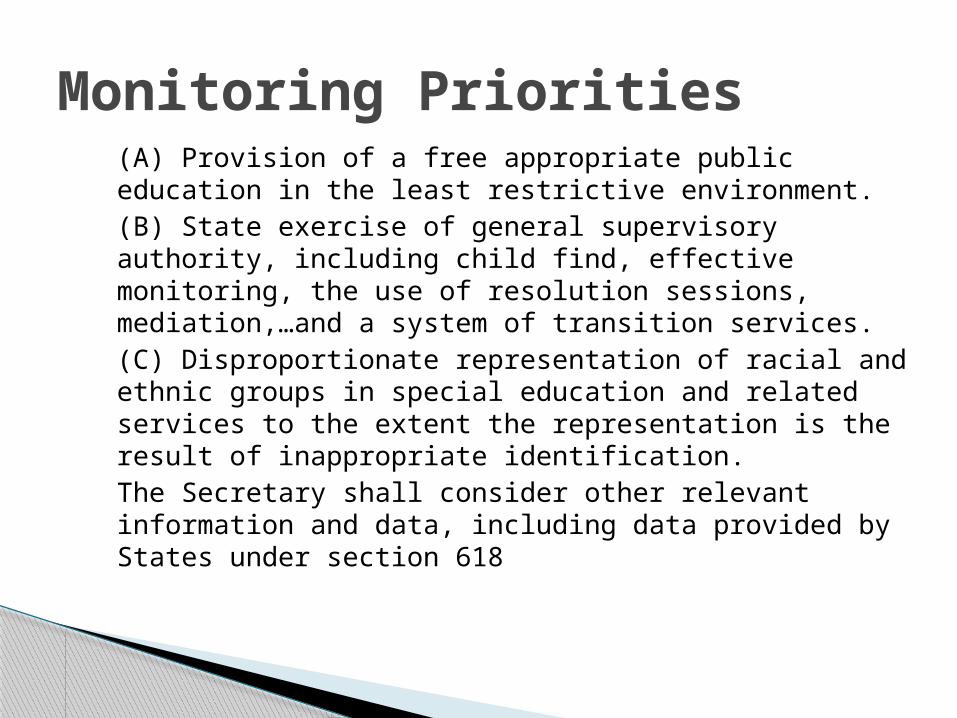
(A) Provision of a free appropriate public education in the least restrictive environment. (B) State exercise of general supervisory authority, including child find, effective monitoring, the use of resolution sessions, mediation,…and a system of transition services. (C) Disproportionate representation of racial and ethnic groups in special education and related services to the extent the representation is the result of inappropriate identification. The Secretary shall consider other relevant information and data, including data provided by States under section 618
Monitoring Priorities
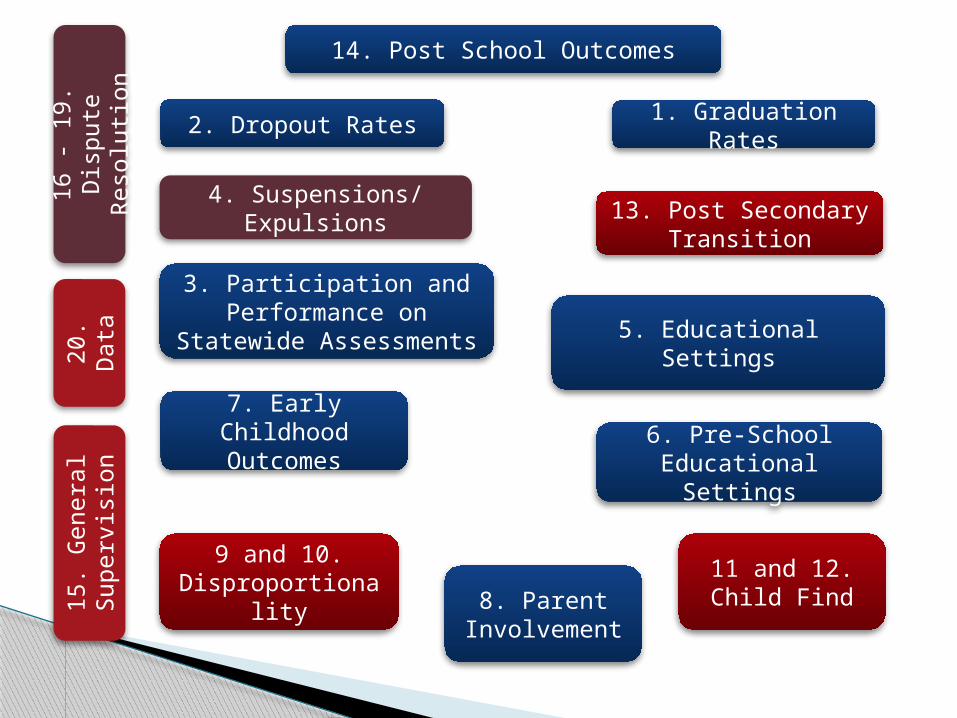
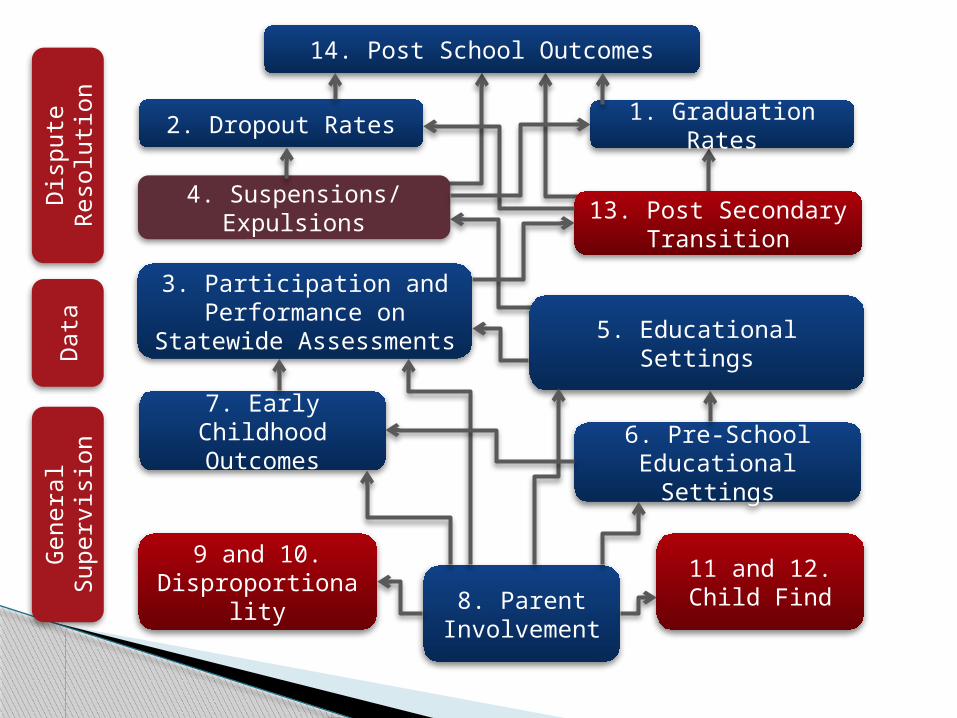
14. Post School Outcomes
1. Graduation Rates2. Dropout Rates
13. Post Secondary Transition
4. Suspensions/ Expulsions
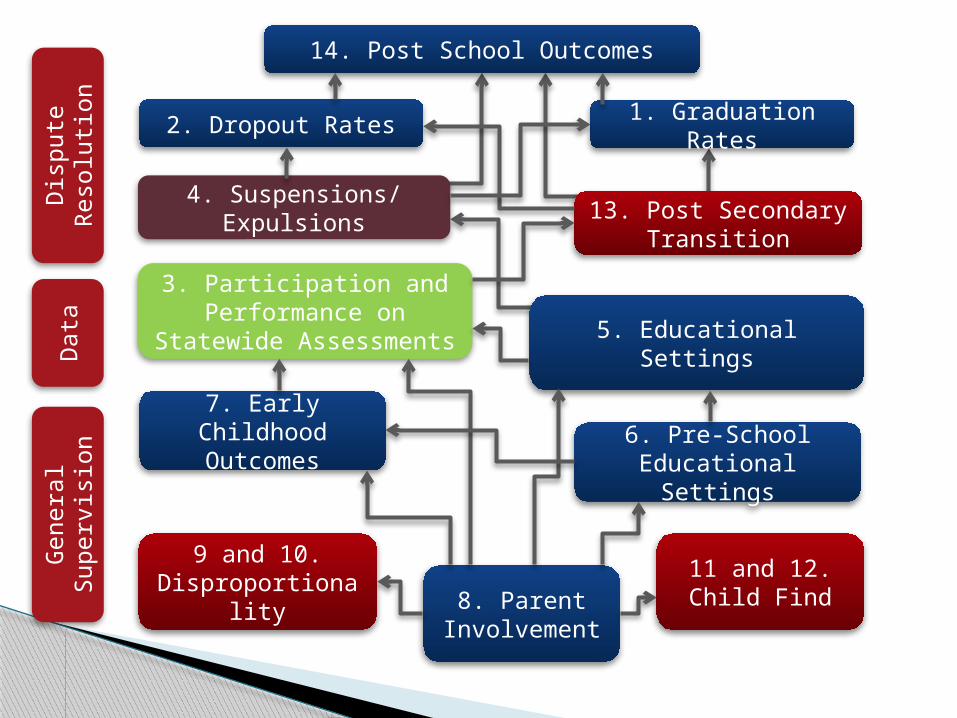
3. Participation and Performance on
Statewide Assessments
6. Pre-School Educational Settings
5. Educational Settings
7. Early Childhood Outcomes
8. Parent Involvement
9 and 10. Disproportionalit
y
11 and 12. Child Find
16 -
19.
Dis
pute
R
eso
luti
on
20.
Data
15.
Genera
l Sup
erv
isio
n
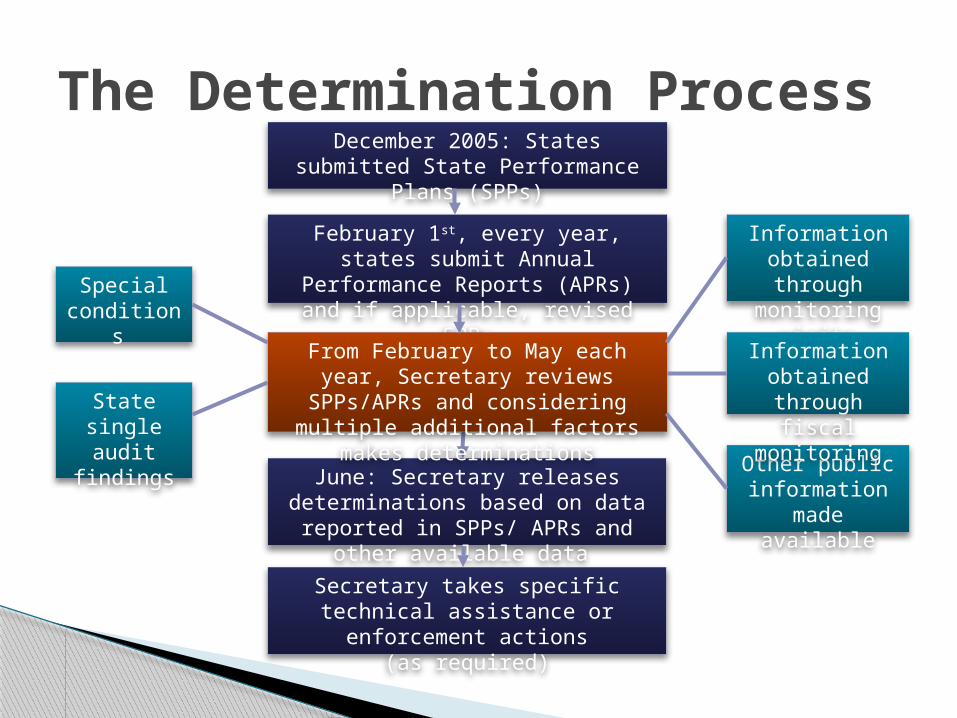
The Determination ProcessDecember 2005: States submitted State
Performance Plans (SPPs)
February 1st, every year, states submit Annual Performance Reports (APRs) and if
applicable, revised SPPs
June: Secretary releases determinations based on data reported in SPPs/ APRs and
other available data
Secretary takes specific technical assistance or enforcement actions
(as required)
Information obtained through monitoring visits
Other public information made
available
From February to May each year, Secretary reviews SPPs/APRs and considering multiple
additional factors makes determinations
Specialconditions
State single audit
findings
Information obtained through fiscal monitoring
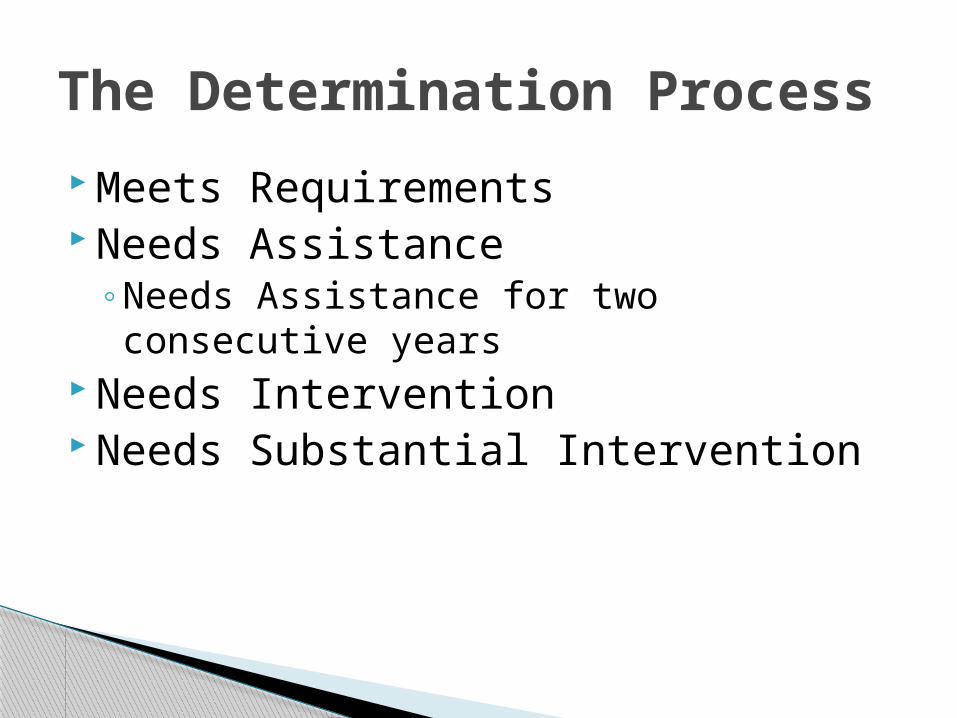
Meets Requirements Needs Assistance
◦Needs Assistance for two consecutive years
Needs Intervention Needs Substantial Intervention
The Determination Process
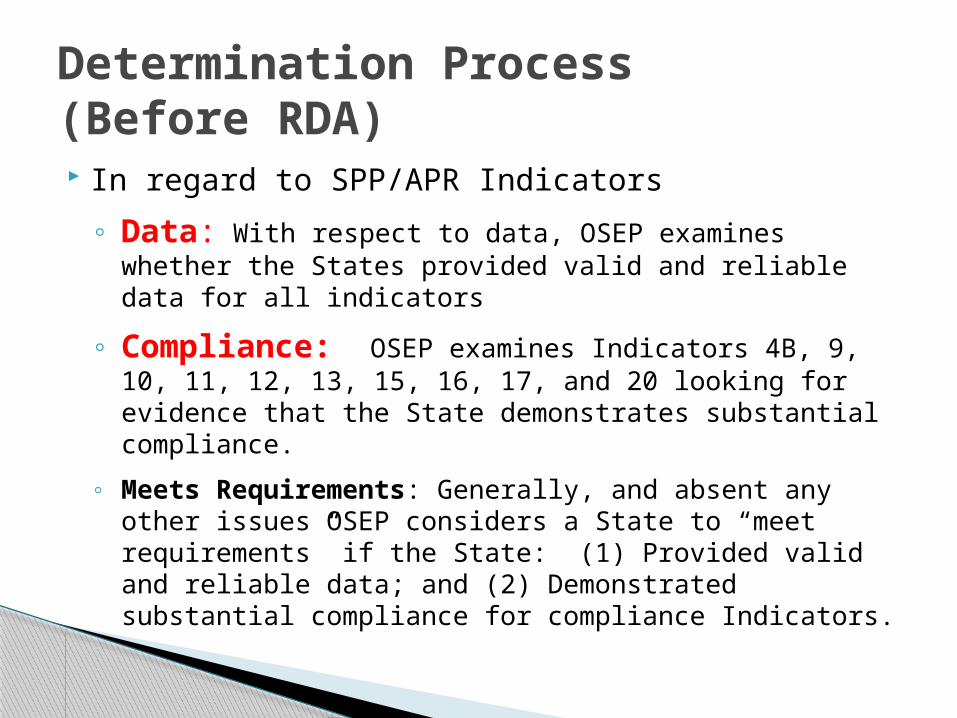
In regard to SPP/APR Indicators
◦ Data: With respect to data, OSEP examines whether the States provided valid and reliable data for all indicators
◦ Compliance: OSEP examines Indicators 4B, 9, 10, 11, 12, 13, 15, 16, 17, and 20 looking for evidence that the State demonstrates substantial compliance.
◦ Meets Requirements: Generally, and absent any other issues OSEP considers a State to “meet requirements” if the State: (1) Provided valid and reliable data; and (2) Demonstrated substantial compliance for compliance Indicators.
Determination Process (Before RDA)
Results Driven Accountability
Based on OSEP’s Presentation of August 2012
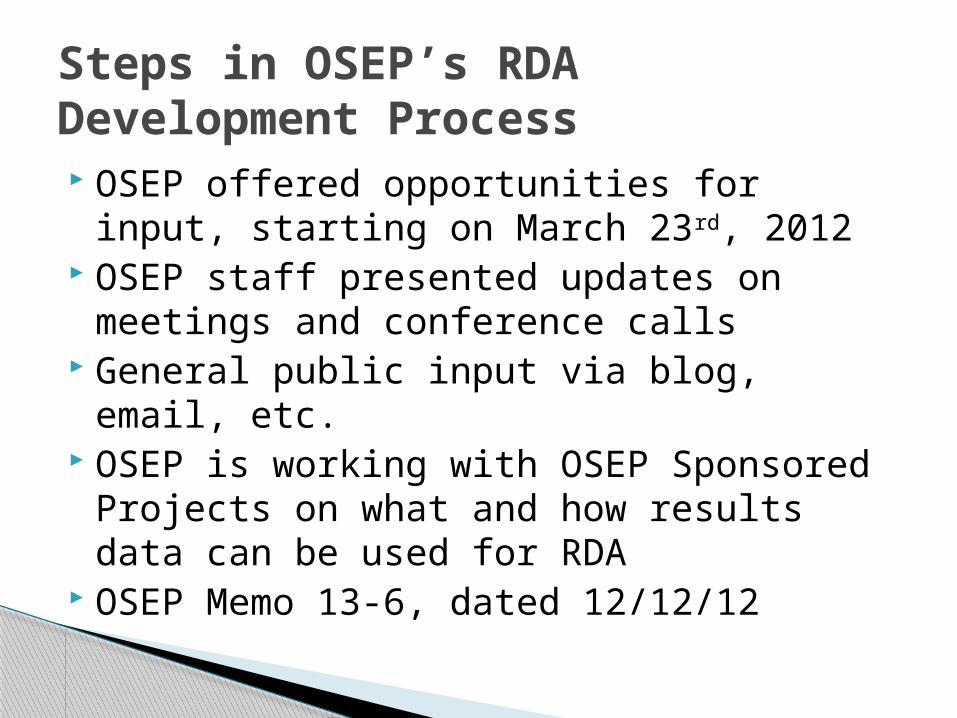
OSEP offered opportunities for input, starting on March 23rd, 2012
OSEP staff presented updates on meetings and conference calls
General public input via blog, email, etc. OSEP is working with OSEP Sponsored
Projects on what and how results data can be used for RDA
OSEP Memo 13-6, dated 12/12/12
Steps in OSEP’s RDA Development Process
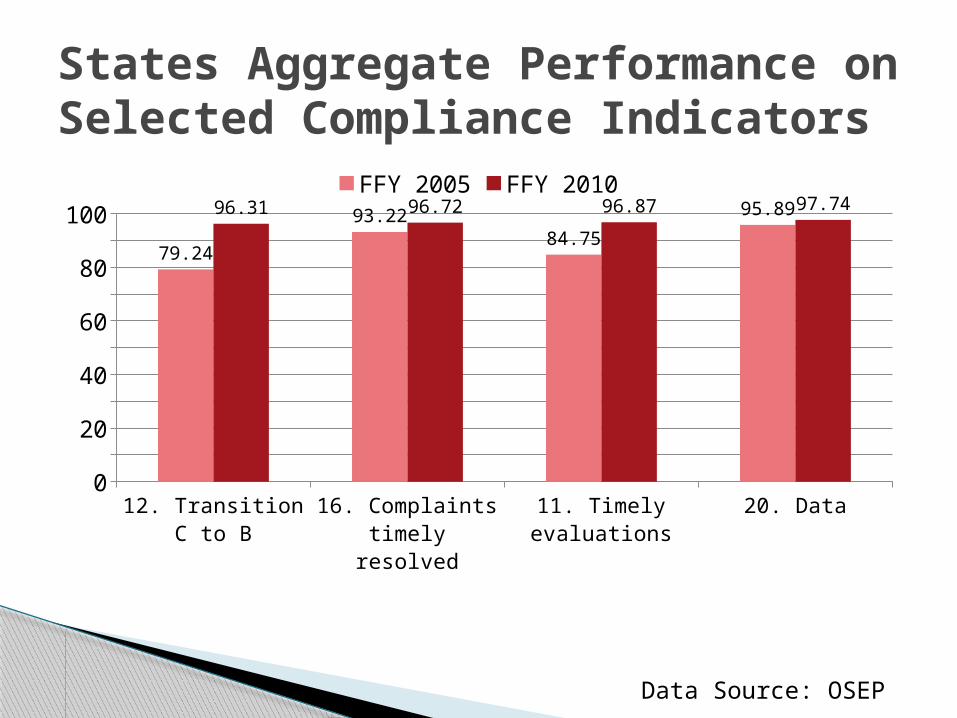
States Aggregate Performance on Selected Compliance Indicators
12. Transition C to B
16. Complaints timely resolved
11. Timely evaluations
20. Data0
102030405060708090
100
79.24
93.22
84.75
95.8996.31 96.72 96.87 97.74
FFY 2005 FFY 2010
Data Source: OSEP
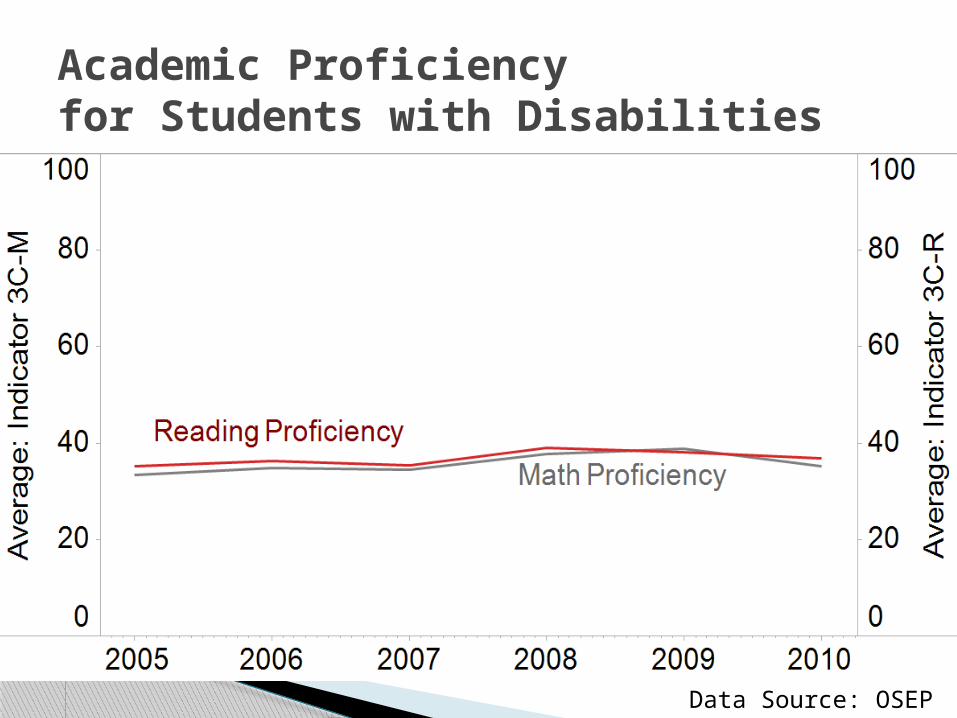
Academic Proficiency for Students with Disabilities
Data Source: OSEP
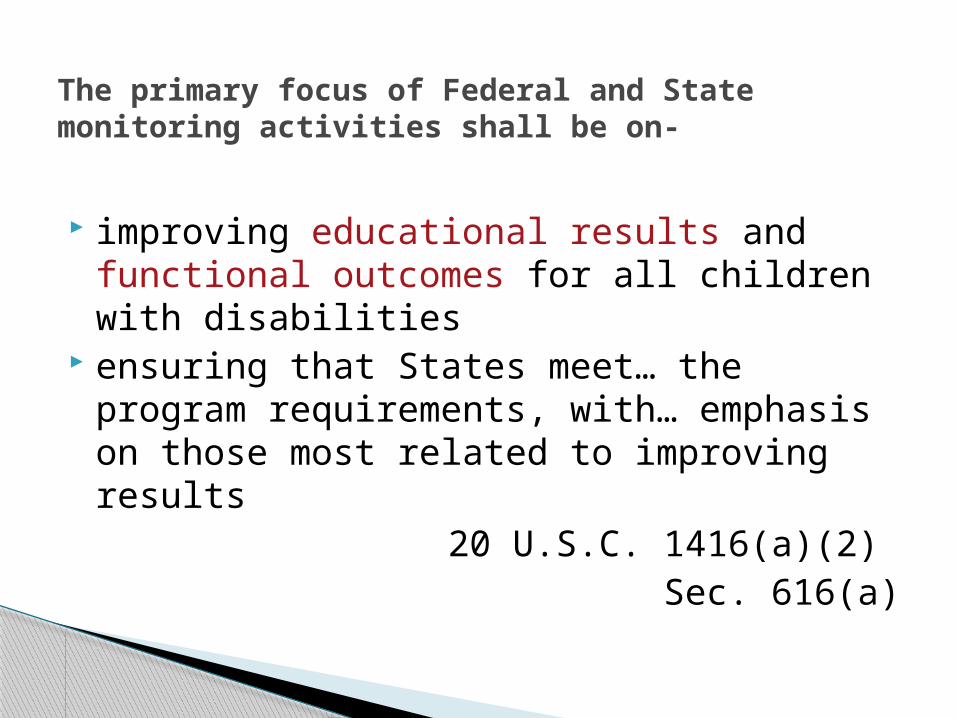
improving educational results and functional outcomes for all children with disabilities
ensuring that States meet… the program requirements, with… emphasis on those most related to improving results
20 U.S.C. 1416(a)(2) Sec. 616(a)
The primary focus of Federal and State monitoring activities shall be on-
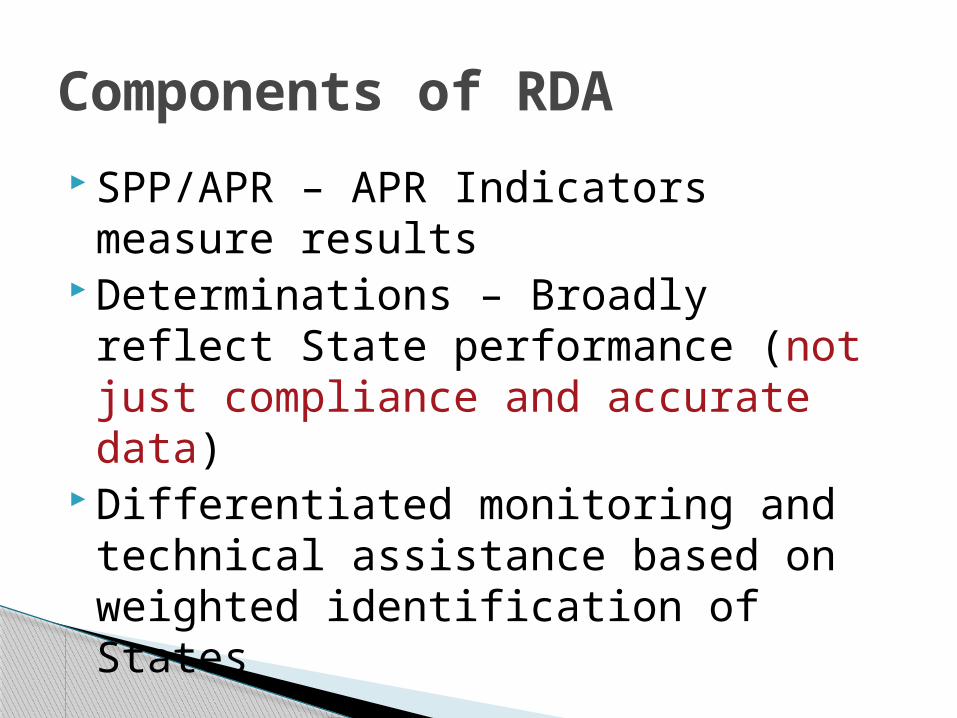
SPP/APR – APR Indicators measure results
Determinations – Broadly reflect State performance (not just compliance and accurate data)
Differentiated monitoring and technical assistance based on weighted identification of States
Components of RDA
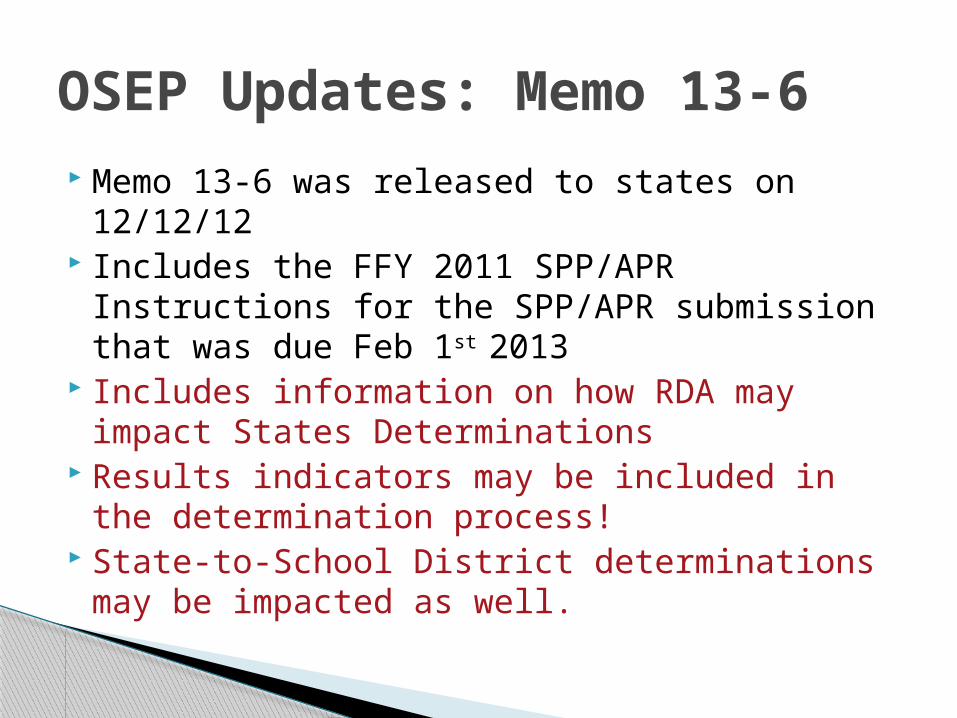
Memo 13-6 was released to states on 12/12/12
Includes the FFY 2011 SPP/APR Instructions for the SPP/APR submission that was due Feb 1st 2013
Includes information on how RDA may impact States Determinations
Results indicators may be included in the determination process!
State-to-School District determinations may be impacted as well.
OSEP Updates: Memo 13-6
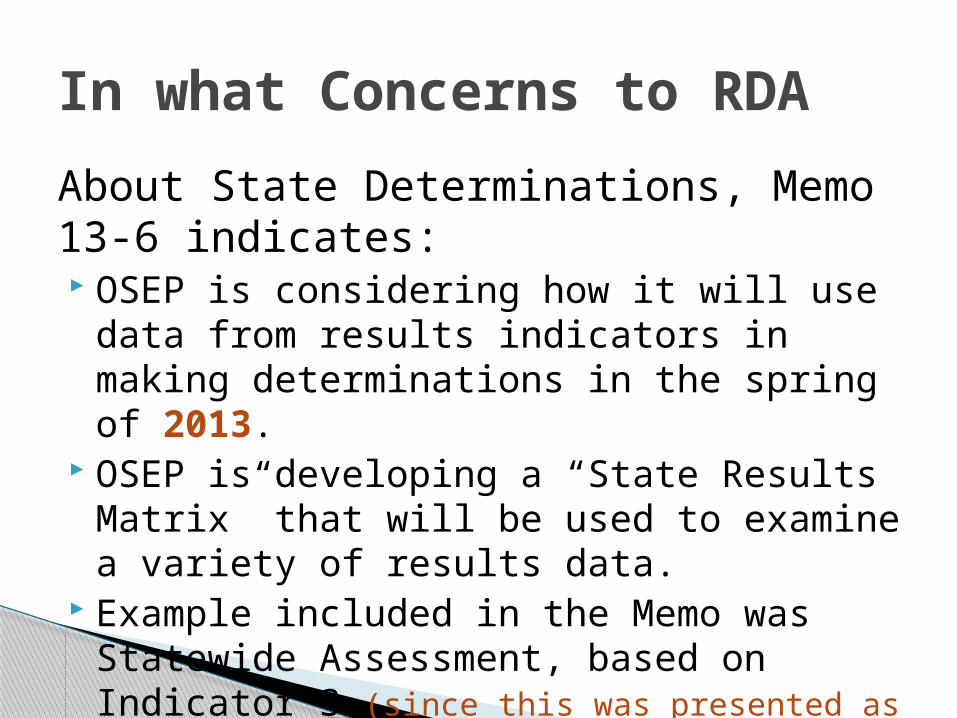
About State Determinations, Memo 13-6 indicates: OSEP is considering how it will use data
from results indicators in making determinations in the spring of 2013.
OSEP is developing a “State Results Matrix” that will be used to examine a variety of results data.
Example included in the Memo was Statewide Assessment, based on Indicator 3 (since this was presented as an example, it indicates other results indicators may be included)
In what Concerns to RDA
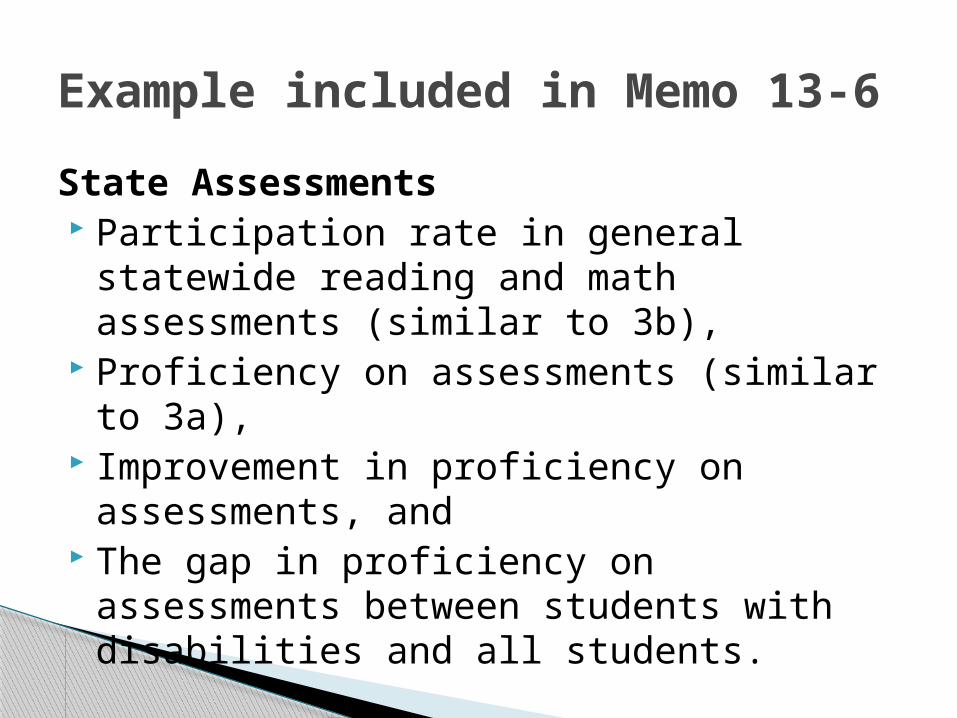
State Assessments Participation rate in general statewide
reading and math assessments (similar to 3b),
Proficiency on assessments (similar to 3a), Improvement in proficiency on
assessments, and The gap in proficiency on assessments
between students with disabilities and all students.
Example included in Memo 13-6
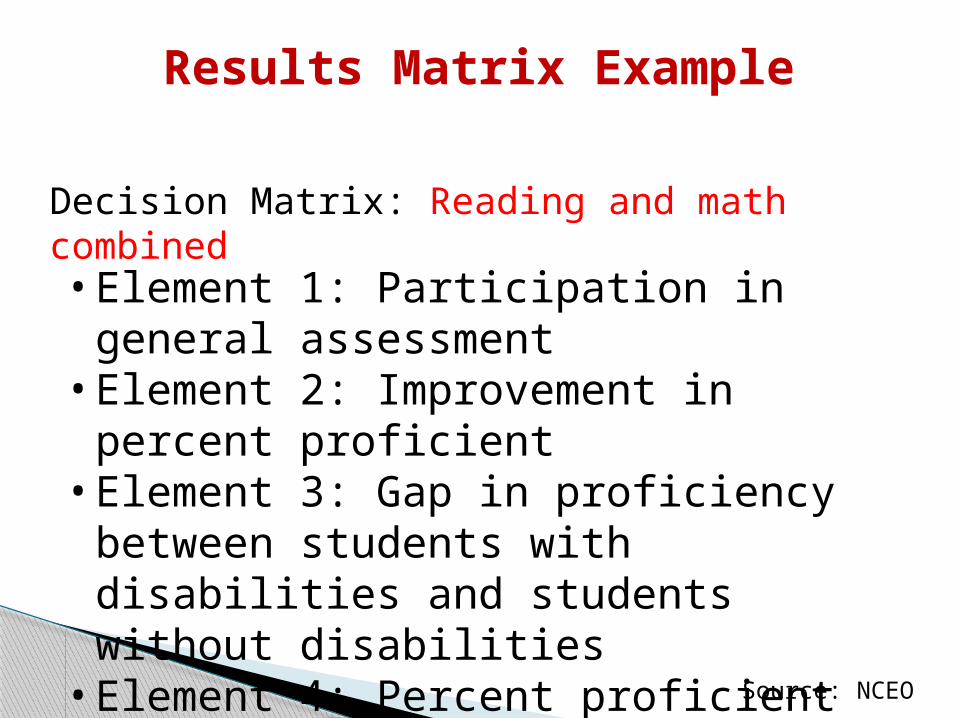
Decision Matrix: Reading and math combined
Results Matrix Example
• Element 1: Participation in general assessment• Element 2: Improvement in percent proficient• Element 3: Gap in proficiency between
students with disabilities and students without disabilities• Element 4: Percent proficient or above
Source: NCEO
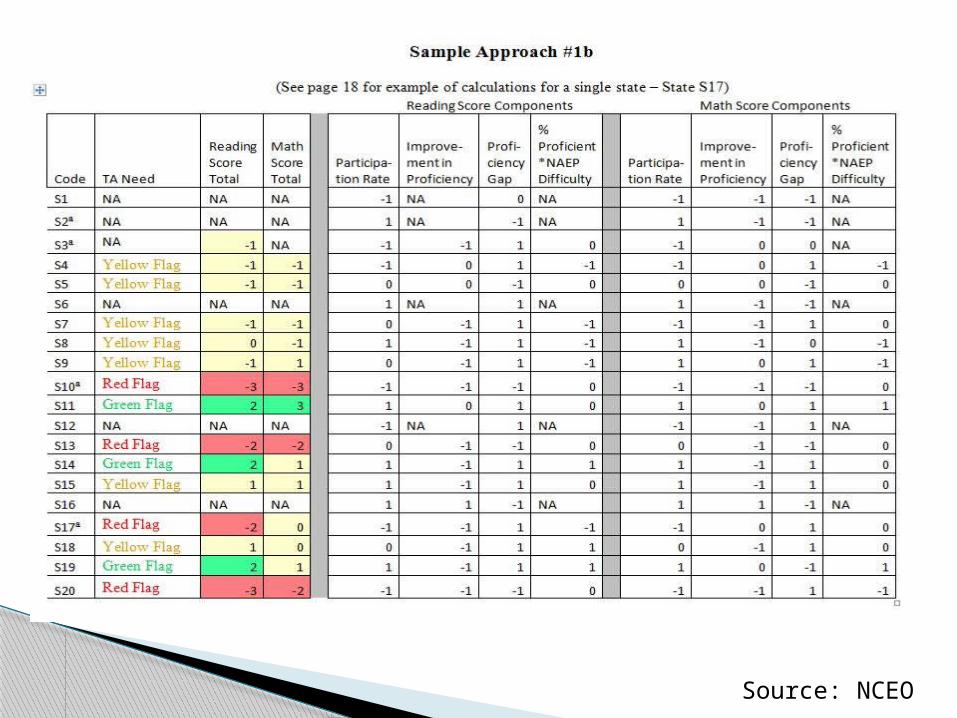
Source: NCEO
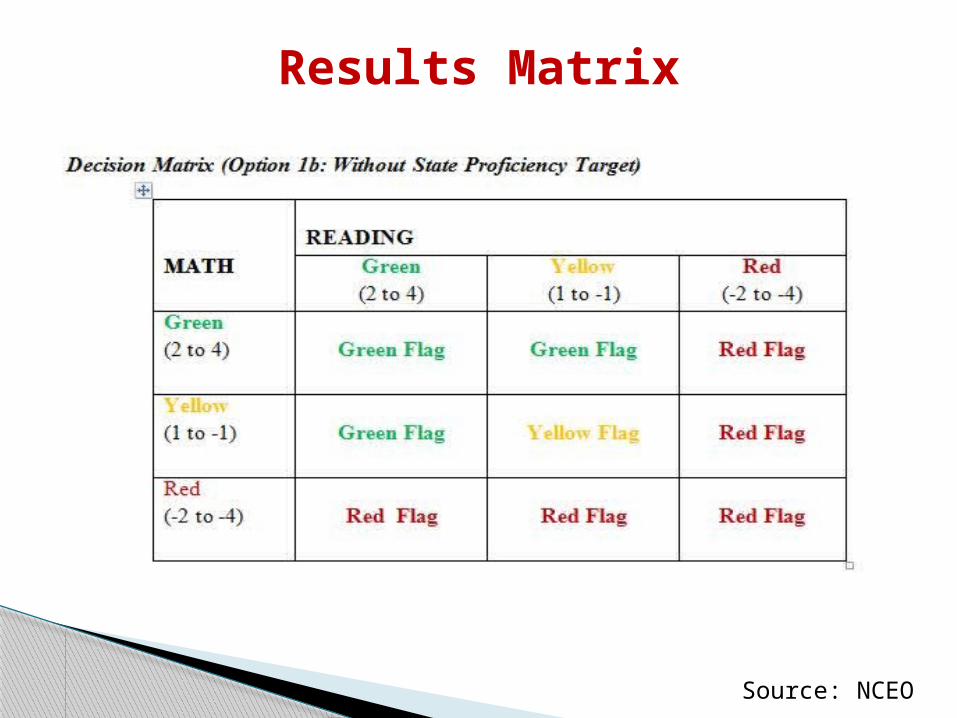
Results Matrix
Source: NCEO
How is Idaho Performing on Selected Results Data?Comparing Idaho to RRC Region 6 (WRRC)
and National Data where available
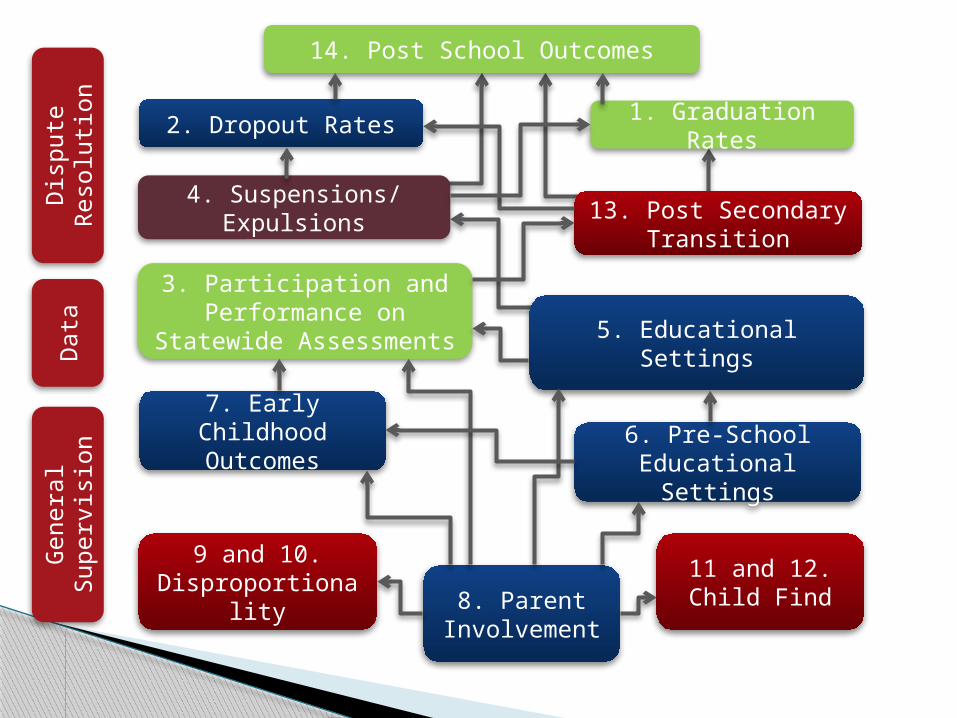
14. Post School Outcomes
1. Graduation Rates2. Dropout Rates
13. Post Secondary Transition
4. Suspensions/ Expulsions
3. Participation and Performance on
Statewide Assessments
6. Pre-School Educational Settings
5. Educational Settings
7. Early Childhood Outcomes
8. Parent Involvement
9 and 10. Disproportionalit
y
11 and 12. Child Find
Dis
pute
R
eso
luti
on
Data
Genera
l Sup
erv
isio
n
Slide 47
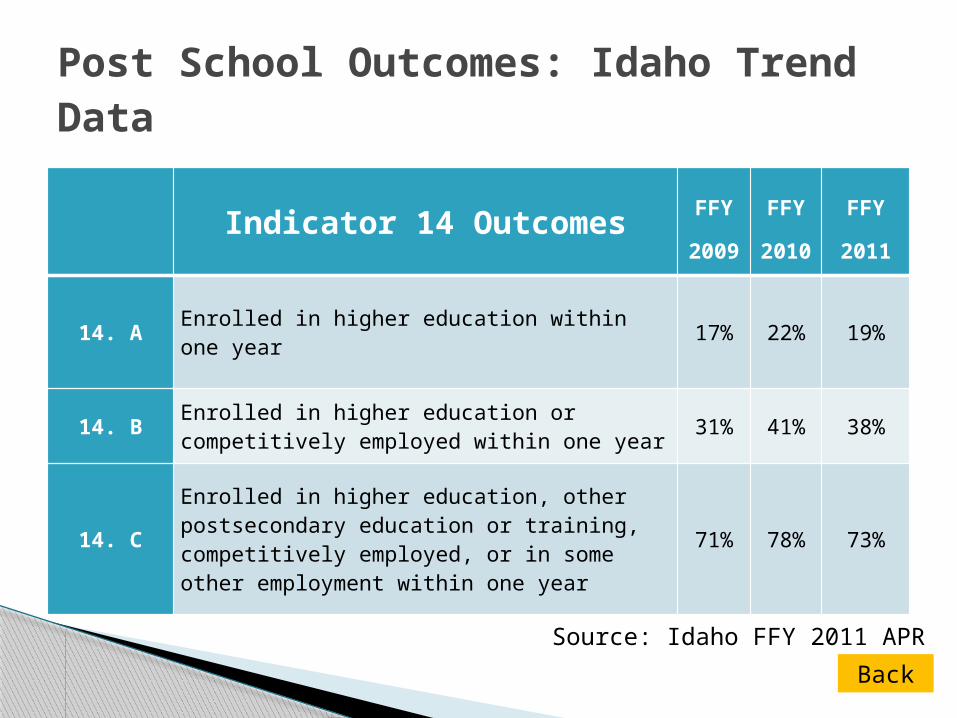
Indicator 14 OutcomesFFY
200
9
FFY
201
0
FFY
2011
14. A Enrolled in higher education within one year 17% 22%
19%
14. B Enrolled in higher education or competitively employed within one year 31% 41% 38%
14. C
Enrolled in higher education, other postsecondary education or training, competitively employed, or in some other employment within one year
71% 78% 73%
Post School Outcomes: Idaho Trend Data
Back
Source: Idaho FFY 2011 APR
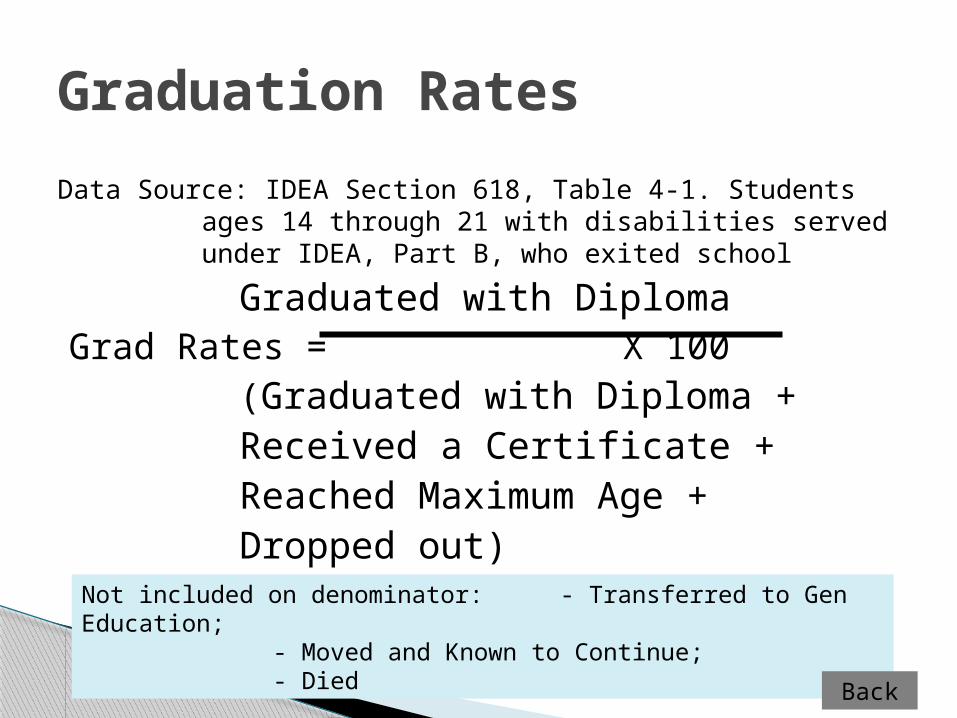
Graduation Rates
Data Source: IDEA Section 618, Table 4-1. Students ages 14 through 21 with disabilities served under IDEA, Part B, who exited school
Graduated with DiplomaGrad Rates = X
100(Graduated with Diploma +Received a Certificate +Reached Maximum Age +Dropped out)Not included on denominator: - Transferred to Gen Education;
- Moved and Known to Continue;- Died
Back
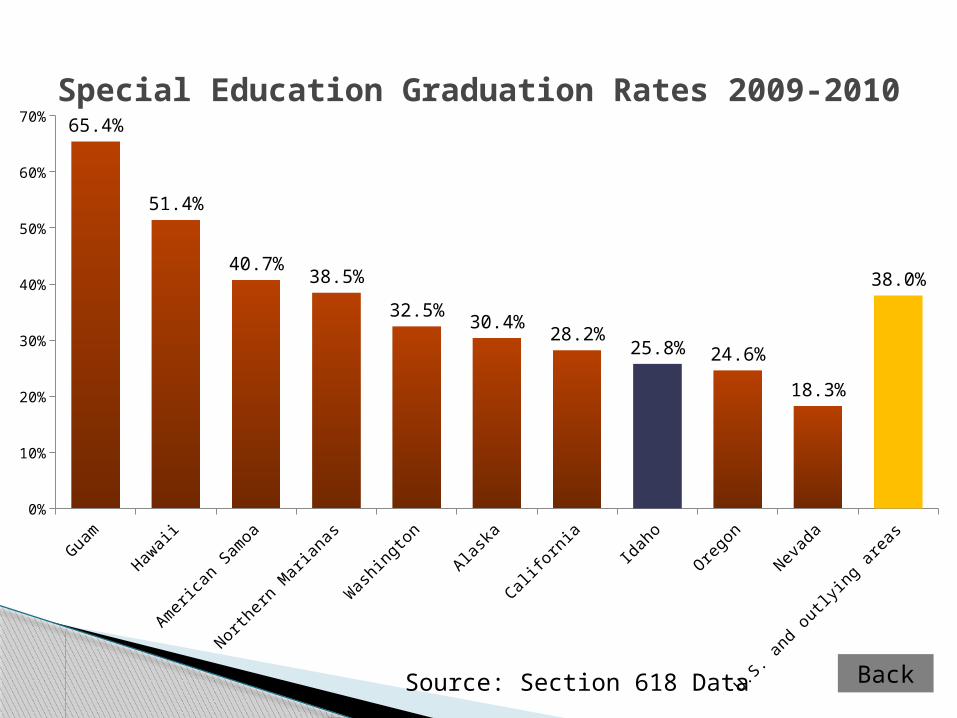
Special Education Graduation Rates 2009-2010
Guam
Hawaii
Amer
ican
Sam
oa
North
ern
Mar
iana
s
Was
hing
ton
Alask
a
Califo
rnia
Idah
o
Orego
n
Nevad
a
U.S. a
nd o
utlyi
ng a
reas
0%
10%
20%
30%
40%
50%
60%
70%65.4%
51.4%
40.7%38.5%
32.5%30.4%
28.2%25.8% 24.6%
18.3%
38.0%
BackSource: Section 618 Data
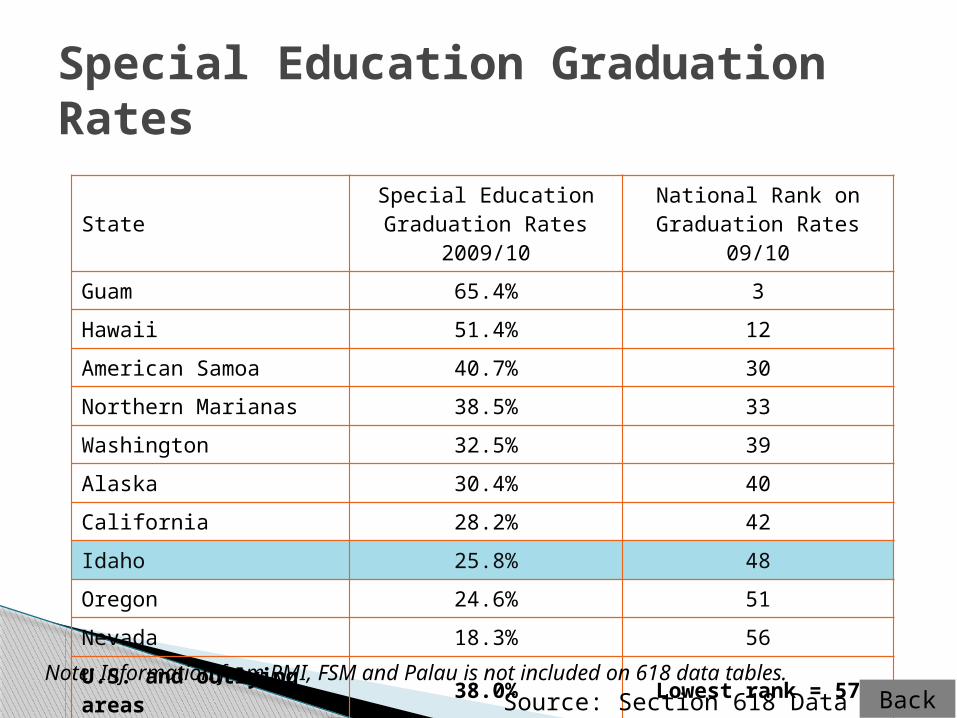
Special Education Graduation Rates
StateSpecial Education Graduation Rates
2009/10
National Rank on Graduation Rates 09/10
Guam 65.4% 3
Hawaii 51.4% 12
American Samoa 40.7% 30
Northern Marianas 38.5% 33
Washington 32.5% 39
Alaska 30.4% 40
California 28.2% 42
Idaho 25.8% 48
Oregon 24.6% 51
Nevada 18.3% 56
U.S. and outlying areas 38.0% Lowest rank = 57
Note: Information from RMI, FSM and Palau is not included on 618 data tables.BackSource: Section 618 Data
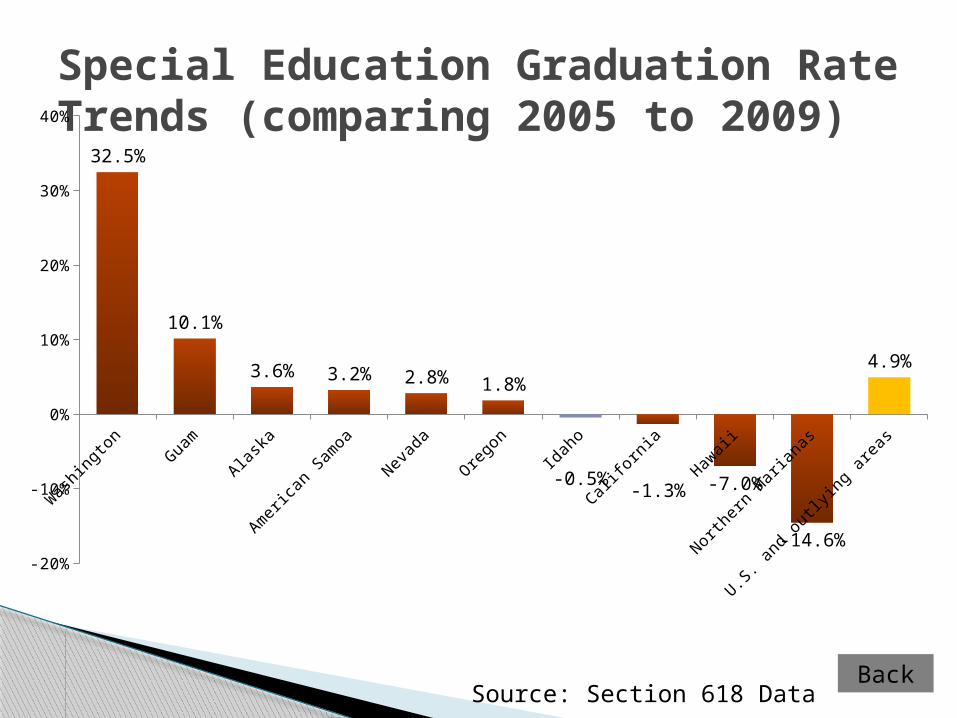
Special Education Graduation Rate Trends (comparing 2005 to 2009)
Was
hing
ton
Guam
Alask
a
Amer
ican
Sam
oa
Nevad
a
Orego
n
Idah
o
Califo
rnia
Hawaii
North
ern
Mar
iana
s
U.S. a
nd o
utlyi
ng a
reas
-20%
-10%
0%
10%
20%
30%
40%
32.5%
10.1%
3.6% 3.2% 2.8% 1.8%
-0.5%-1.3% -7.0%
-14.6%
4.9%
BackSource: Section 618 Data
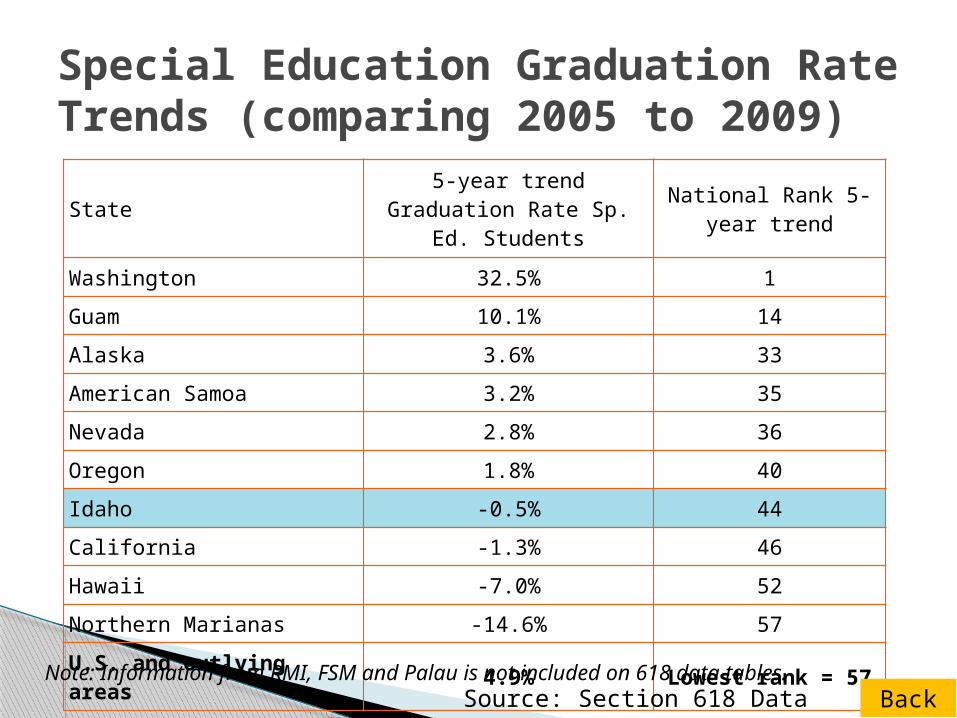
Special Education Graduation Rate Trends (comparing 2005 to 2009)
State 5-year trend Graduation Rate Sp. Ed. Students
National Rank 5-year trend
Washington 32.5% 1
Guam 10.1% 14
Alaska 3.6% 33
American Samoa 3.2% 35
Nevada 2.8% 36
Oregon 1.8% 40
Idaho -0.5% 44
California -1.3% 46
Hawaii -7.0% 52
Northern Marianas -14.6% 57
U.S. and outlying areas 4.9% Lowest rank = 57
Note: Information from RMI, FSM and Palau is not included on 618 data tables.BackSource: Section 618 Data
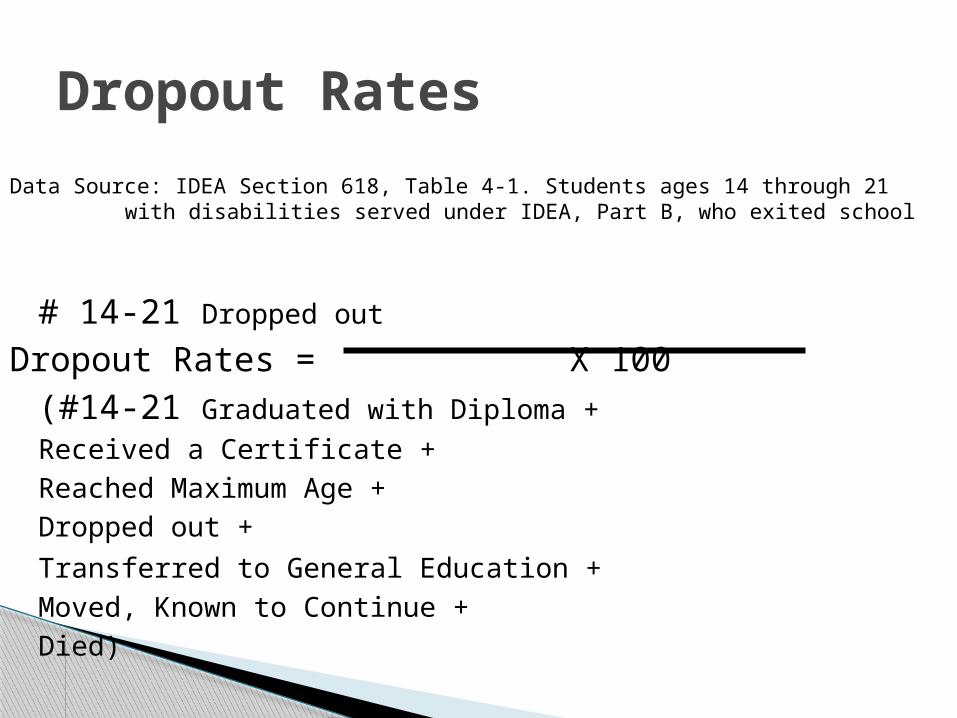
Dropout Rates
Data Source: IDEA Section 618, Table 4-1. Students ages 14 through 21 with disabilities served under IDEA, Part B, who exited school
# 14-21 Dropped out
Dropout Rates = X 100(#14-21 Graduated with Diploma +Received a Certificate +Reached Maximum Age +Dropped out +
Transferred to General Education +Moved, Known to Continue +Died)
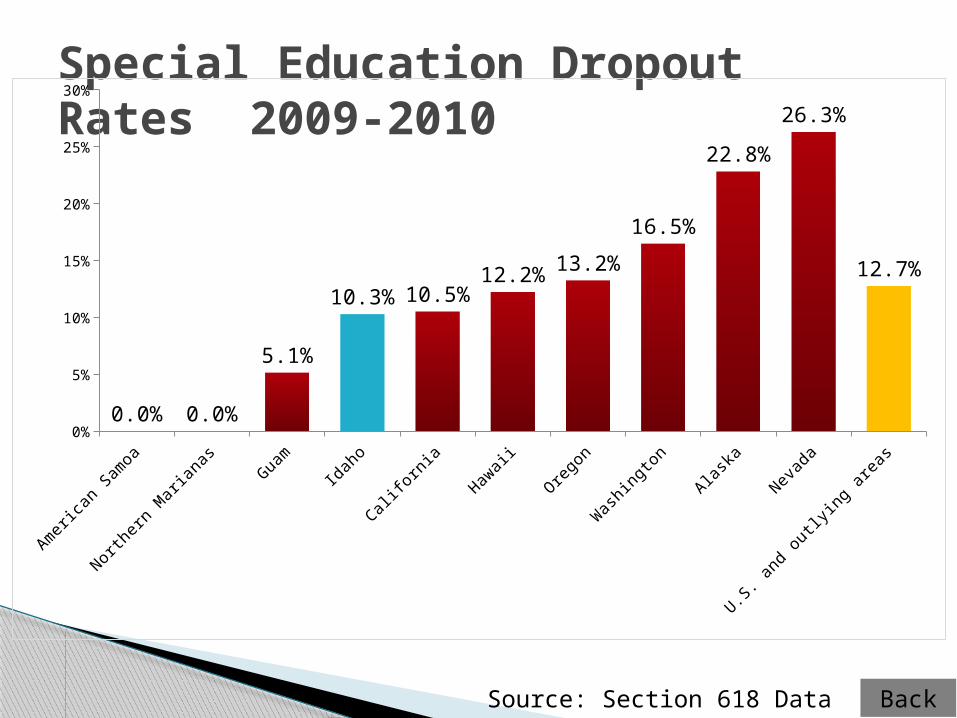
Special Education Dropout Rates 2009-2010
Amer
ican
Sam
oa
North
ern
Mar
iana
s
Guam
Idah
o
Califo
rnia
Hawaii
Orego
n
Was
hing
ton
Alask
a
Nevad
a
U.S. a
nd o
utlyi
ng a
reas
0%
5%
10%
15%
20%
25%
30%
0.0% 0.0%
5.1%
10.3% 10.5%12.2%
13.2%
16.5%
22.8%
26.3%
12.7%
BackSource: Section 618 Data
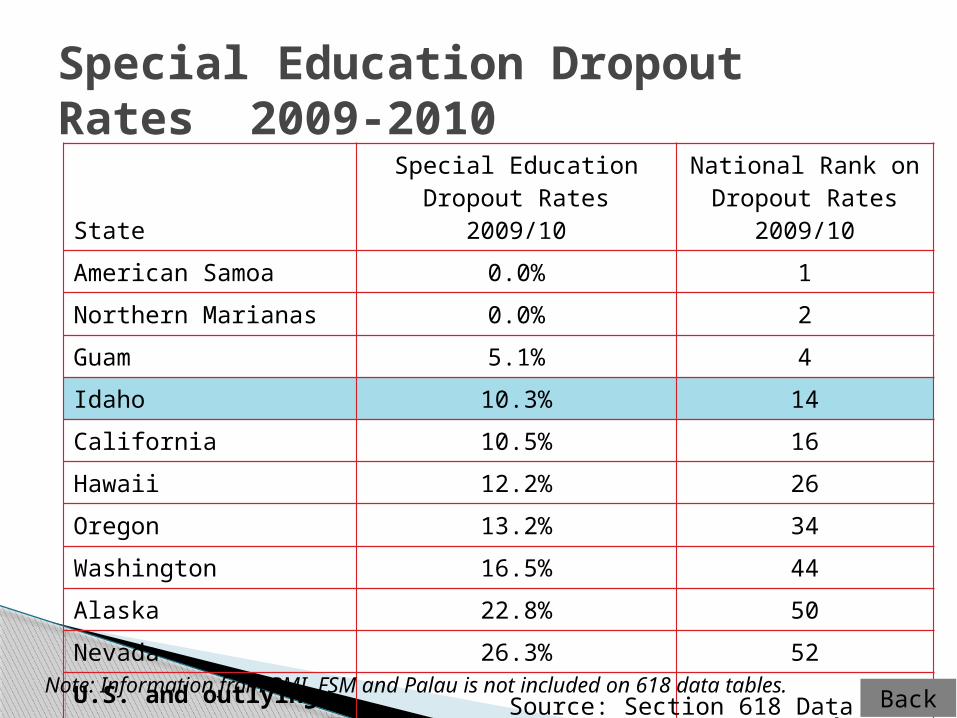
Special Education Dropout Rates 2009-2010
StateSpecial Education
Dropout Rates 2009/10
National Rank on Dropout Rates
2009/10
American Samoa 0.0% 1
Northern Marianas 0.0% 2
Guam 5.1% 4
Idaho 10.3% 14
California 10.5% 16
Hawaii 12.2% 26
Oregon 13.2% 34
Washington 16.5% 44
Alaska 22.8% 50
Nevada 26.3% 52
U.S. and outlying areas 12.7% Lowest rank = 57
Note: Information from RMI, FSM and Palau is not included on 618 data tables.BackSource: Section 618 Data
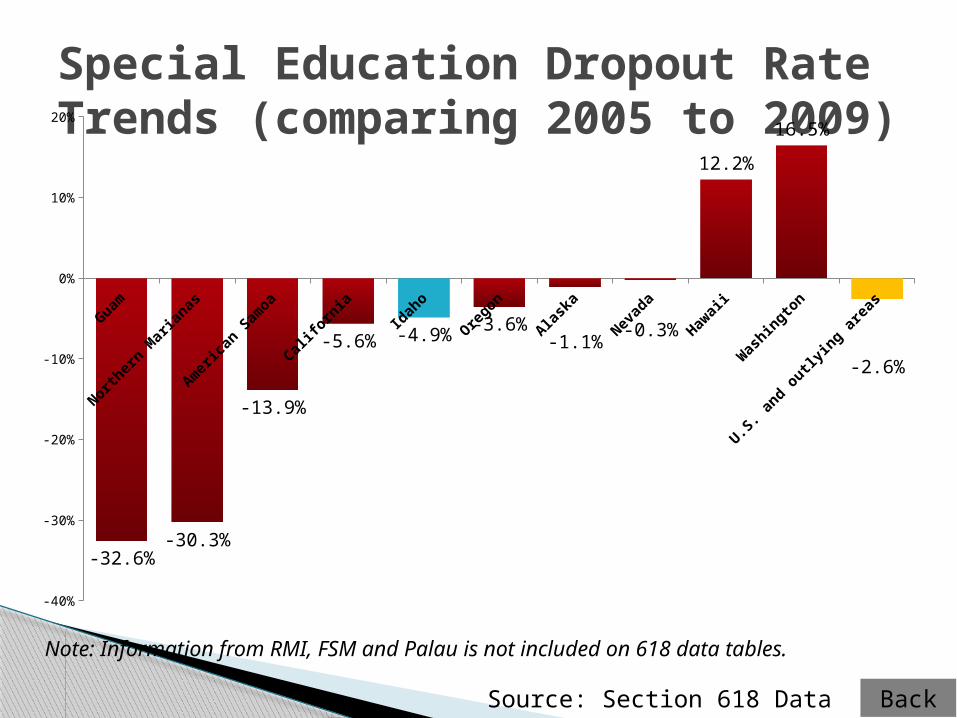
Special Education Dropout Rate Trends (comparing 2005 to 2009)
Guam
Nor
ther
n Mar
ianas
Amer
ican
Sam
oa
Califo
rnia
Idah
o
Ore
gon
Alask
a
Nev
ada
Haw
aii
Was
hingto
n
U.S. a
nd outly
ing a
reas
-40%
-30%
-20%
-10%
0%
10%
20%
-32.6%-30.3%
-13.9%
-5.6% -4.9% -3.6%-1.1%
-0.3%
12.2%
16.5%
-2.6%
Note: Information from RMI, FSM and Palau is not included on 618 data tables.
BackSource: Section 618 Data
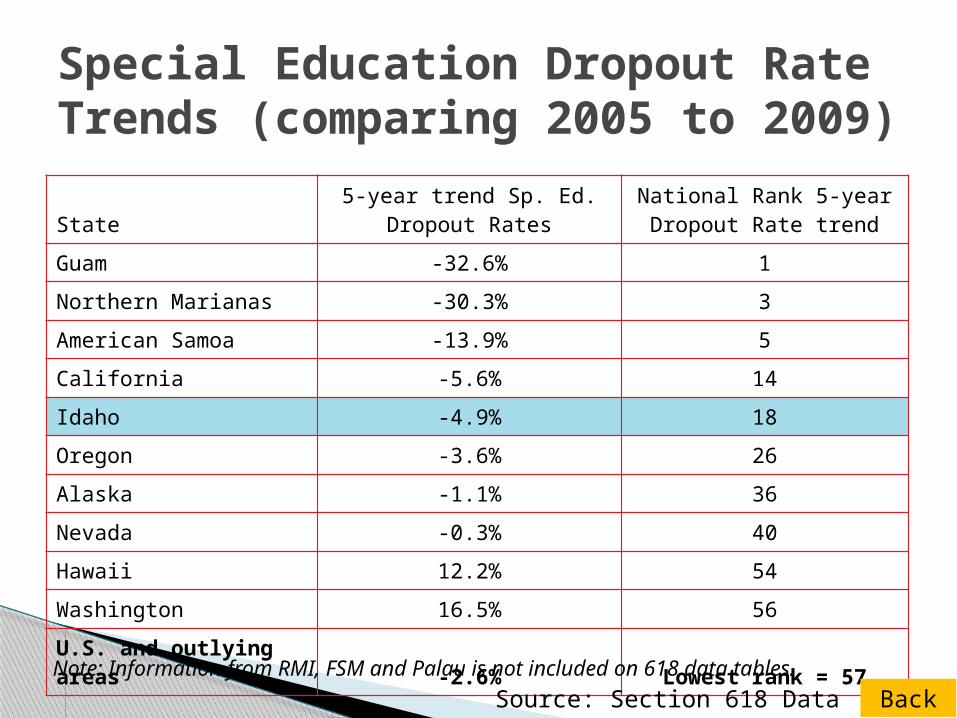
Special Education Dropout Rate Trends (comparing 2005 to 2009)
State5-year trend Sp. Ed.
Dropout RatesNational Rank 5-year Dropout Rate trend
Guam -32.6% 1
Northern Marianas -30.3% 3
American Samoa -13.9% 5
California -5.6% 14
Idaho -4.9% 18
Oregon -3.6% 26
Alaska -1.1% 36
Nevada -0.3% 40
Hawaii 12.2% 54
Washington 16.5% 56
U.S. and outlying areas -2.6% Lowest rank = 57
Note: Information from RMI, FSM and Palau is not included on 618 data tables.
BackSource: Section 618 Data
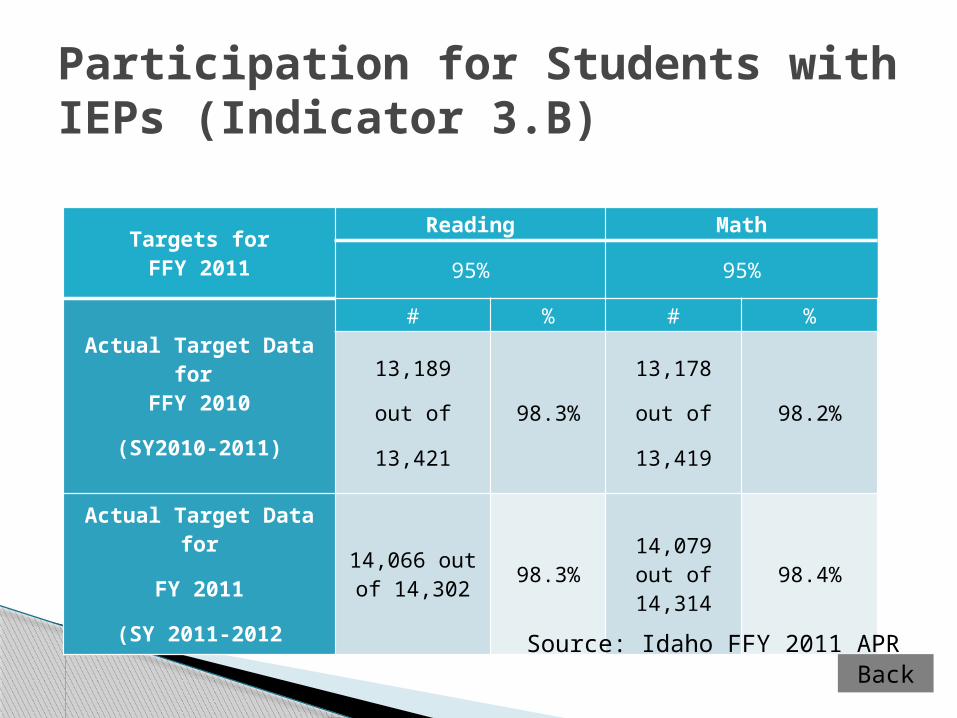
Participation for Students with IEPs (Indicator 3.B)
Targets forFFY 2011
Reading Math
95% 95%
Actual Target Data for
FFY 2010
(SY2010-2011)
# % # %
13,189
out of
13,421
98.3%
13,178
out of
13,419
98.2%
Actual Target Data for
FY 2011
(SY 2011-2012
14,066 out of 14,302 98.3% 14,079 out
of 14,314 98.4%
BackSource: Idaho FFY 2011 APR
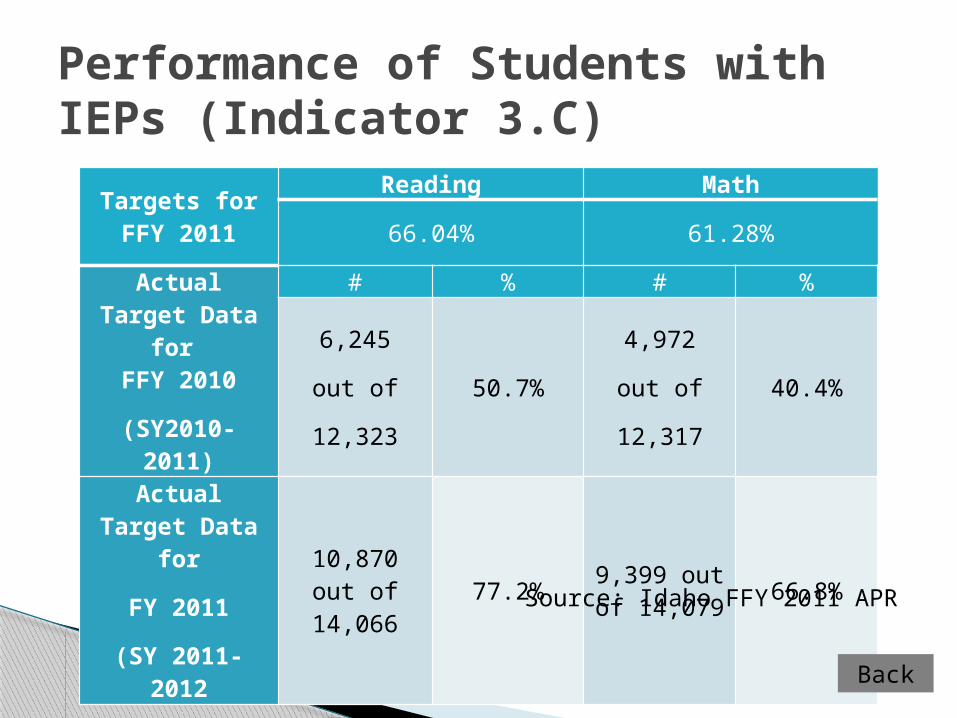
Performance of Students with IEPs (Indicator 3.C)
Targets forFFY 2011
Reading Math
66.04% 61.28%
Actual Target Data for FFY 2010
(SY2010-2011)
# % # %
6,245
out of
12,323
50.7%
4,972
out of
12,317
40.4%
Actual Target Data for
FY 2011
(SY 2011-2012
10,870 out of 14,066 77.2% 9,399 out
of 14,079 66.8%
Back
Source: Idaho FFY 2011 APR
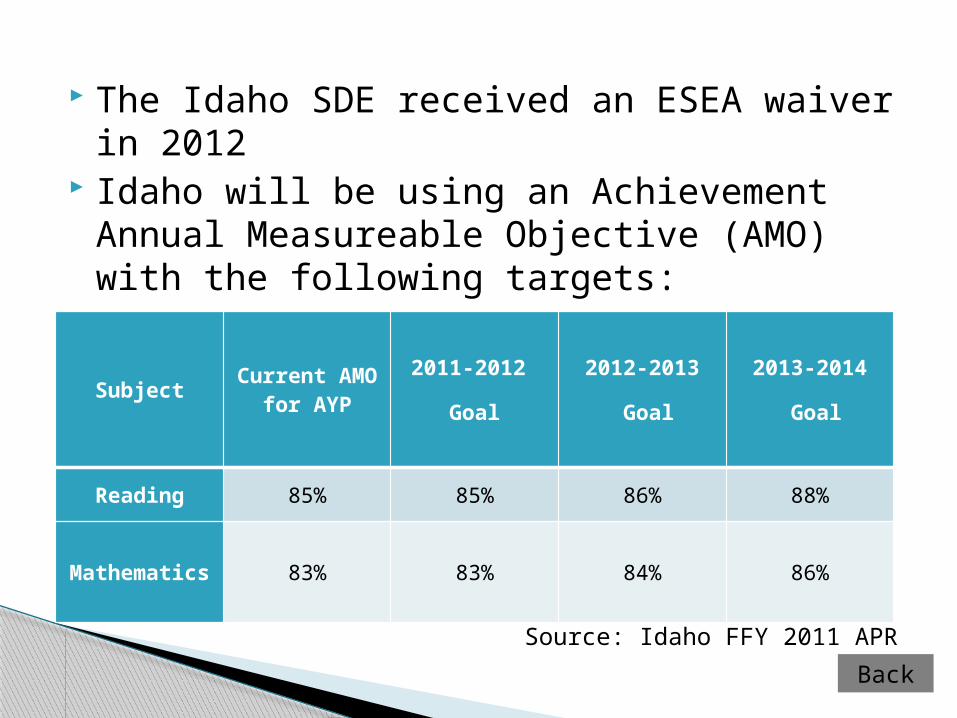
The Idaho SDE received an ESEA waiver in 2012
Idaho will be using an Achievement Annual Measureable Objective (AMO) with the following targets:
Subject Current AMO for AYP
2011-2012
Goal
2012-2013
Goal
2013-2014
Goal
Reading 85% 85% 86% 88%
Mathematics 83% 83% 84% 86%
Back
Source: Idaho FFY 2011 APR
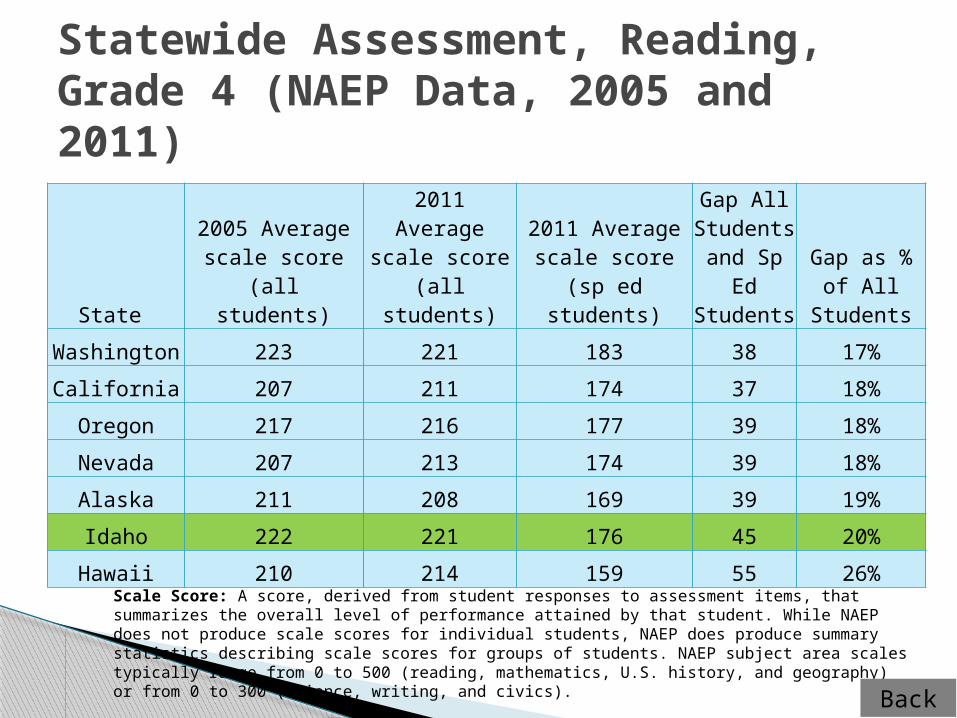
Statewide Assessment, Reading, Grade 4 (NAEP Data, 2005 and 2011)
State
2005 Average scale score (all
students)
2011 Average scale score
(all students)
2011 Average scale score (sp ed students)
Gap All Students and Sp
Ed Students
Gap as % of All
Students
Washington 223 221 183 38 17%
California 207 211 174 37 18%
Oregon 217 216 177 39 18%
Nevada 207 213 174 39 18%
Alaska 211 208 169 39 19%
Idaho 222 221 176 45 20%
Hawaii 210 214 159 55 26%
Scale Score: A score, derived from student responses to assessment items, that summarizes the overall level of performance attained by that student. While NAEP does not produce scale scores for individual students, NAEP does produce summary statistics describing scale scores for groups of students. NAEP subject area scales typically range from 0 to 500 (reading, mathematics, U.S. history, and geography) or from 0 to 300 (science, writing, and civics).
Back
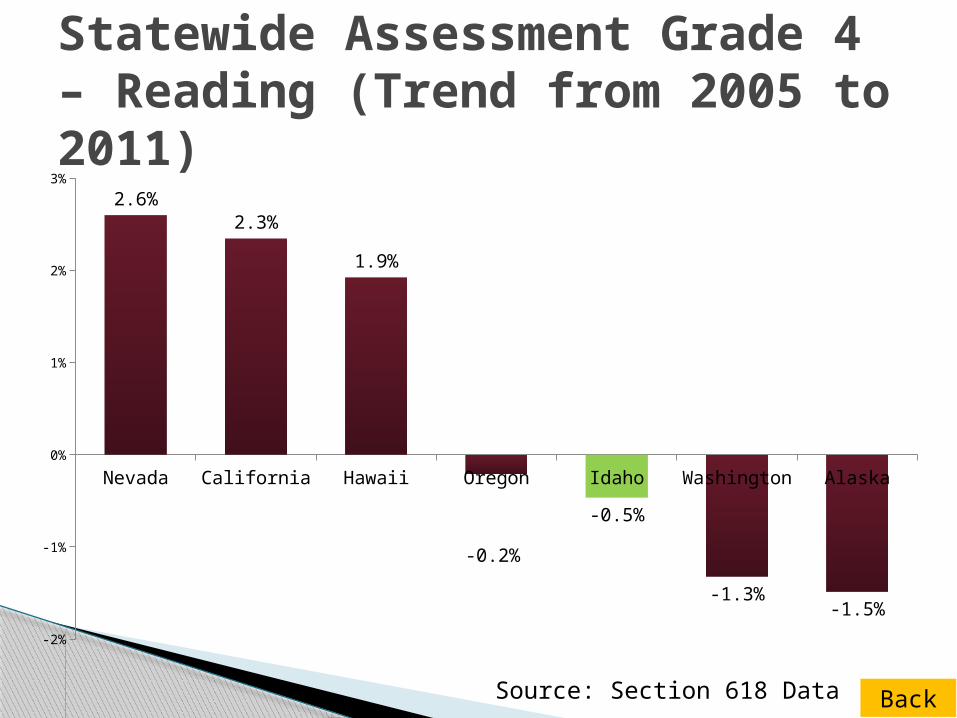
Statewide Assessment Grade 4 – Reading (Trend from 2005 to 2011)
Nevada California Hawaii Oregon Idaho Washington Alaska
-2%
-1%
0%
1%
2%
3%
2.6%2.3%
1.9%
-0.2%
-0.5%
-1.3%-1.5%
BackSource: Section 618 Data
Amer
ican S
amoa
North
ern M
arianas
Oregon
Nevad
a
Idah
o
Alask
a
Califo
rnia
Was
hingto
n
Guam
Hawaii
U.S. a
nd outly
ing a
reas
0%
10%
20%
30%
40%
50%
60%
70%
80%
90%
100%
89.4%84.8%
70.8%64.7% 61.9% 58.8%
52.5% 50.8%
40.3%
21.0%
60.5%
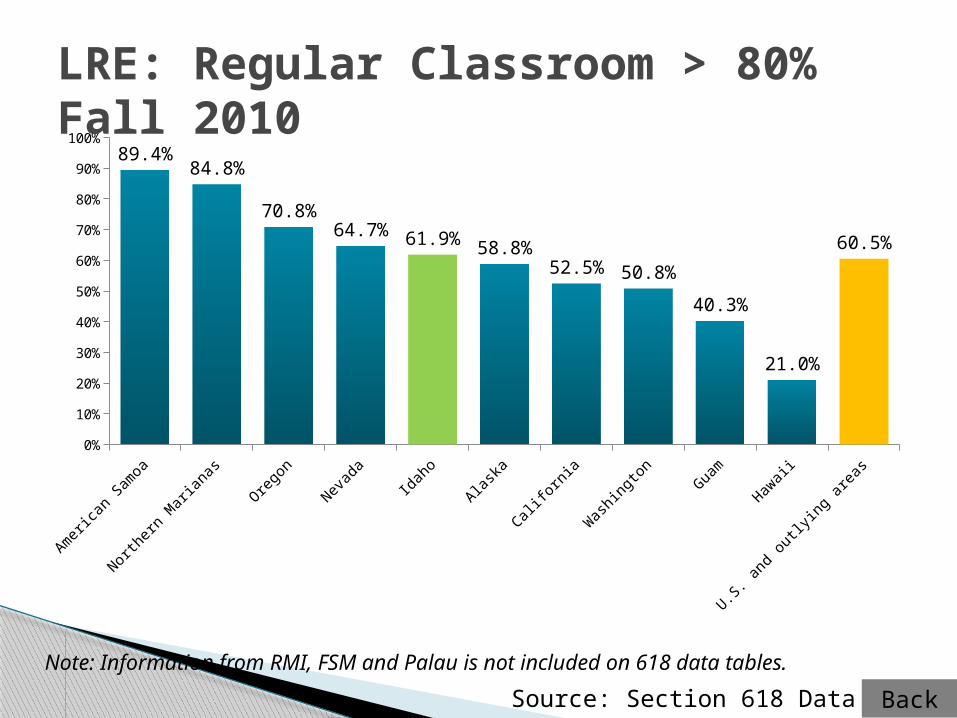
LRE: Regular Classroom > 80% Fall 2010
Note: Information from RMI, FSM and Palau is not included on 618 data tables.
BackSource: Section 618 Data
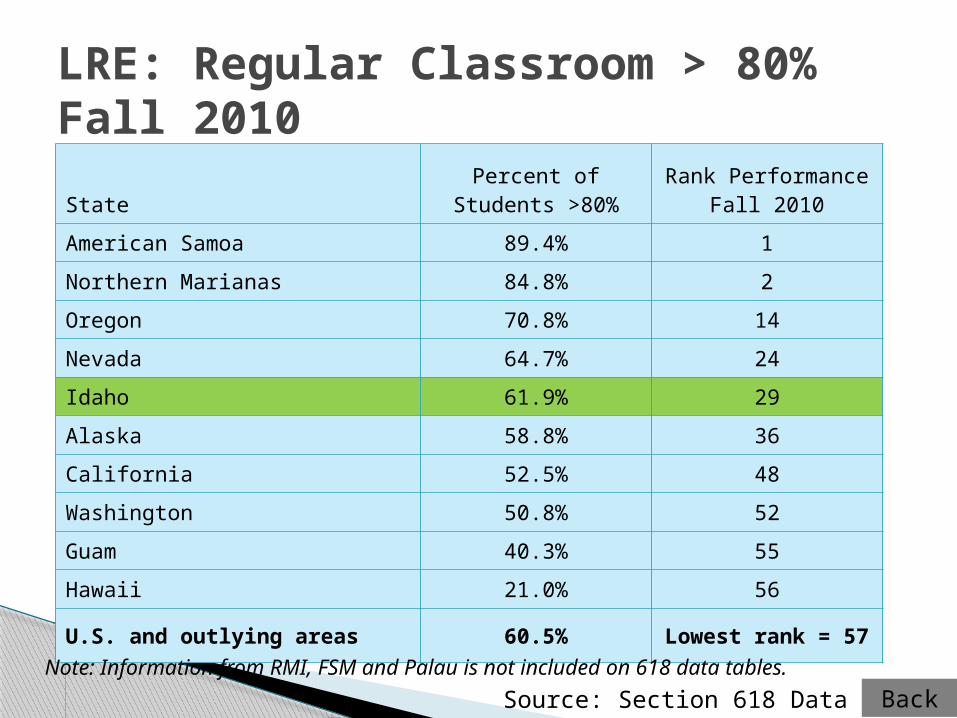
LRE: Regular Classroom > 80% Fall 2010
StatePercent of Students
>80%Rank Performance
Fall 2010
American Samoa 89.4% 1
Northern Marianas 84.8% 2
Oregon 70.8% 14
Nevada 64.7% 24
Idaho 61.9% 29
Alaska 58.8% 36
California 52.5% 48
Washington 50.8% 52
Guam 40.3% 55
Hawaii 21.0% 56
U.S. and outlying areas 60.5% Lowest rank = 57
Note: Information from RMI, FSM and Palau is not included on 618 data tables.
BackSource: Section 618 Data
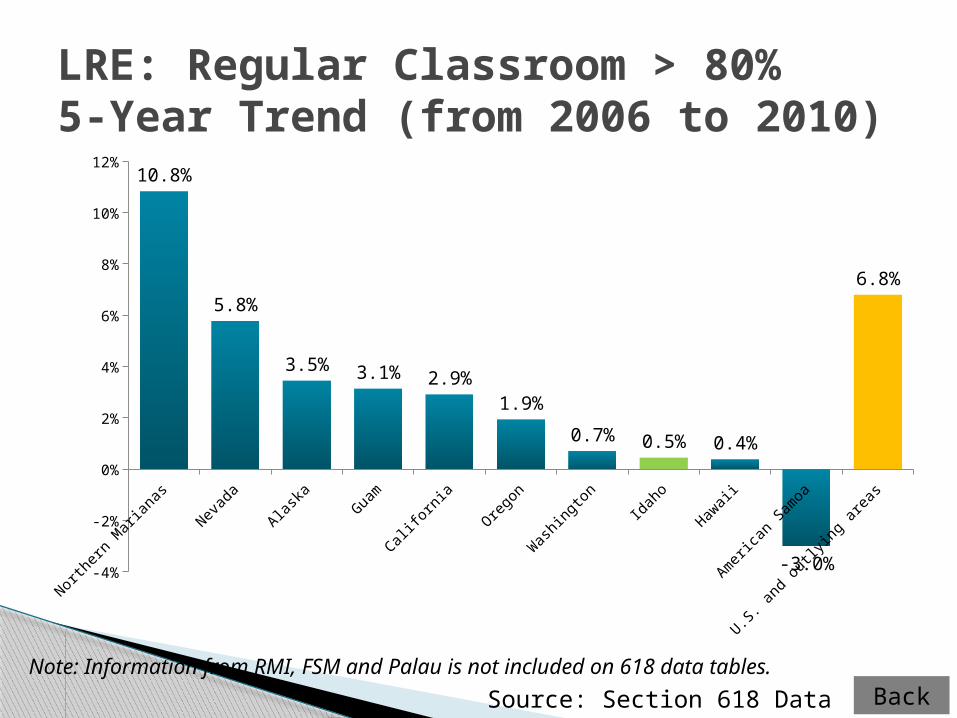
LRE: Regular Classroom > 80% 5-Year Trend (from 2006 to 2010)
North
ern M
arianas
Nevad
a
Alask
a
Guam
Califo
rnia
Oregon
Was
hingto
n
Idah
o
Hawaii
Amer
ican S
amoa
U.S. a
nd outly
ing a
reas
-4%
-2%
0%
2%
4%
6%
8%
10%
12%10.8%
5.8%
3.5% 3.1% 2.9%1.9%
0.7% 0.5% 0.4%
-3.0%
6.8%
Note: Information from RMI, FSM and Palau is not included on 618 data tables.BackSource: Section 618 Data
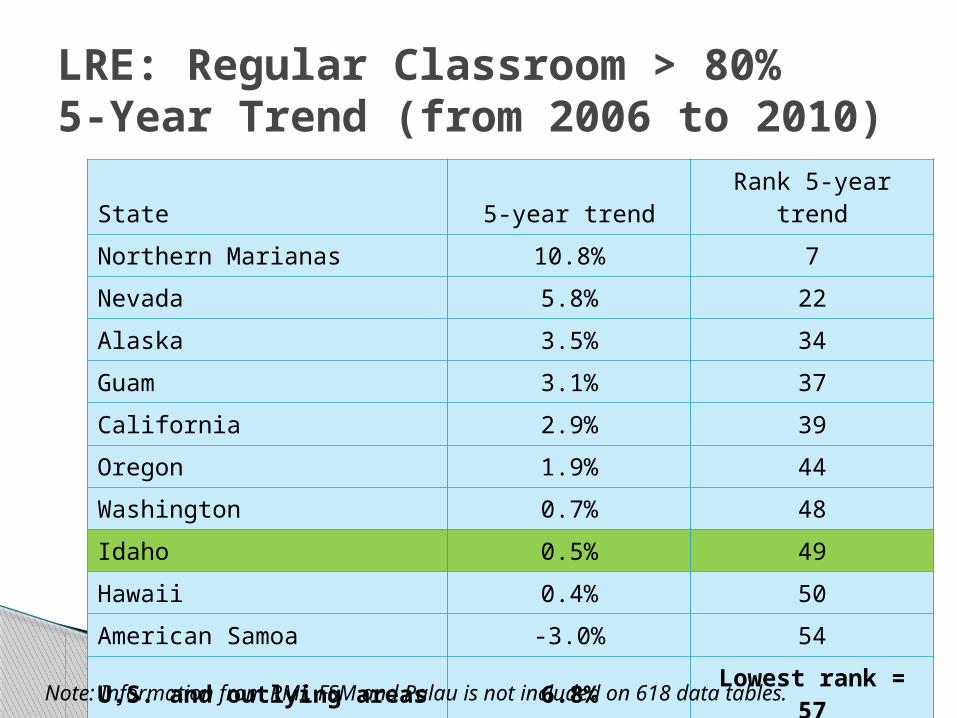
LRE: Regular Classroom > 80% 5-Year Trend (from 2006 to 2010)
State 5-year trend Rank 5-year trend
Northern Marianas 10.8% 7
Nevada 5.8% 22
Alaska 3.5% 34
Guam 3.1% 37
California 2.9% 39
Oregon 1.9% 44
Washington 0.7% 48
Idaho 0.5% 49
Hawaii 0.4% 50
American Samoa -3.0% 54
U.S. and outlying areas 6.8% Lowest rank = 57
Note: Information from RMI, FSM and Palau is not included on 618 data tables.
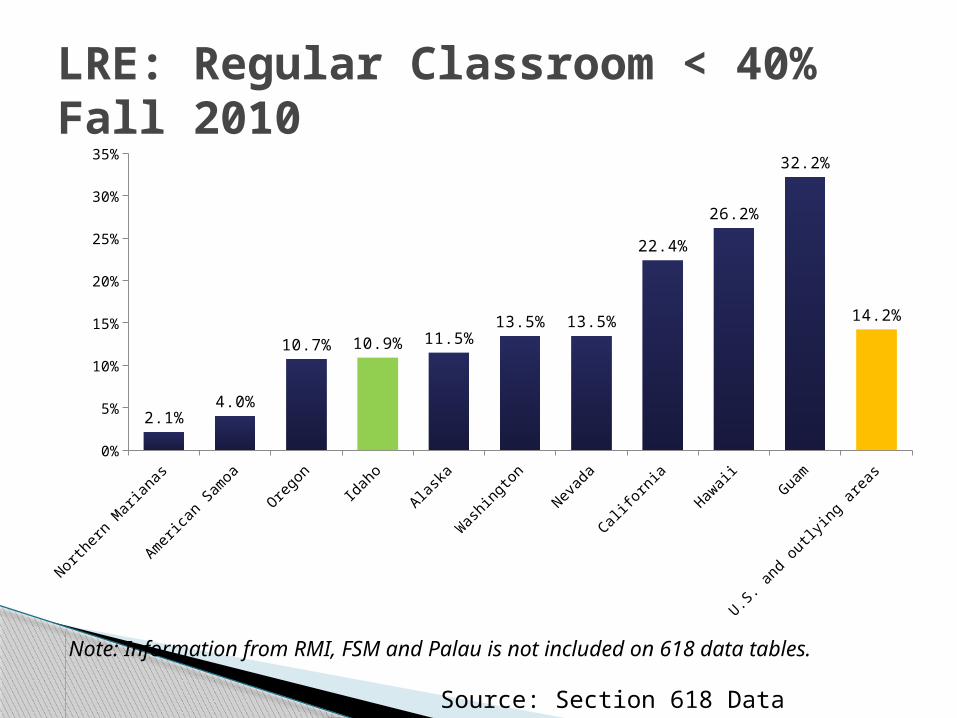
LRE: Regular Classroom < 40% Fall 2010
North
ern M
arianas
Amer
ican S
amoa
Oregon
Idah
o
Alask
a
Was
hingto
n
Nevad
a
Califo
rnia
Hawaii
Guam
U.S. a
nd outly
ing a
reas
0%
5%
10%
15%
20%
25%
30%
35%
2.1%4.0%
10.7% 10.9% 11.5%13.5% 13.5%
22.4%
26.2%
32.2%
14.2%
Note: Information from RMI, FSM and Palau is not included on 618 data tables.
Source: Section 618 Data
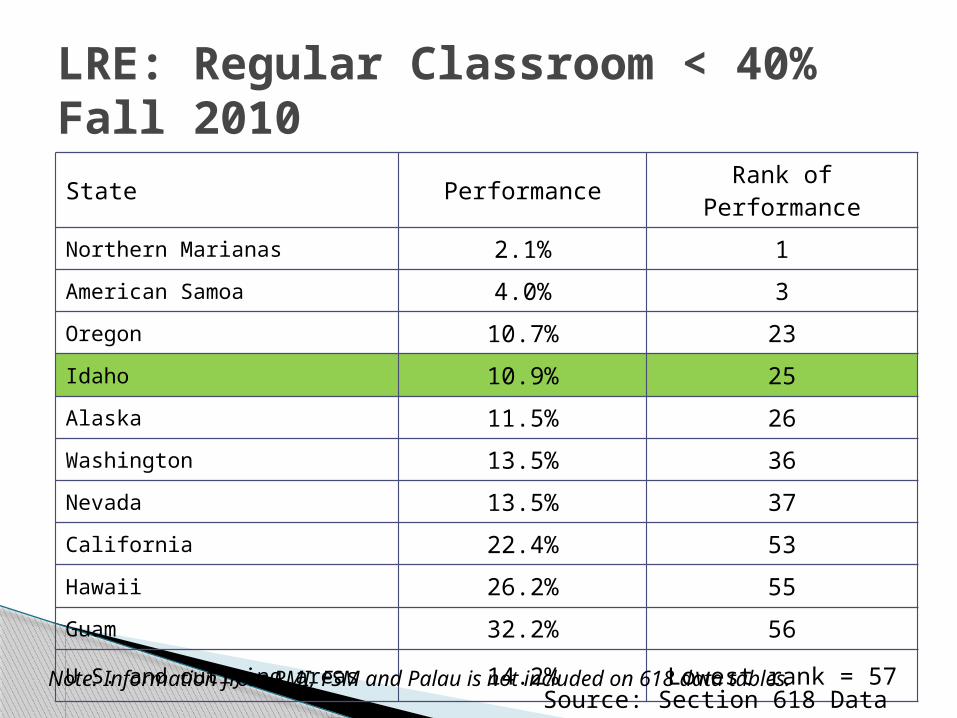
LRE: Regular Classroom < 40% Fall 2010State Performance Rank of Performance
Northern Marianas 2.1% 1
American Samoa 4.0% 3
Oregon 10.7% 23
Idaho 10.9% 25
Alaska 11.5% 26
Washington 13.5% 36
Nevada 13.5% 37
California 22.4% 53
Hawaii 26.2% 55
Guam 32.2% 56
U.S. and outlying areas 14.2% Lowest rank = 57
Note: Information from RMI, FSM and Palau is not included on 618 data tables.Source: Section 618 Data
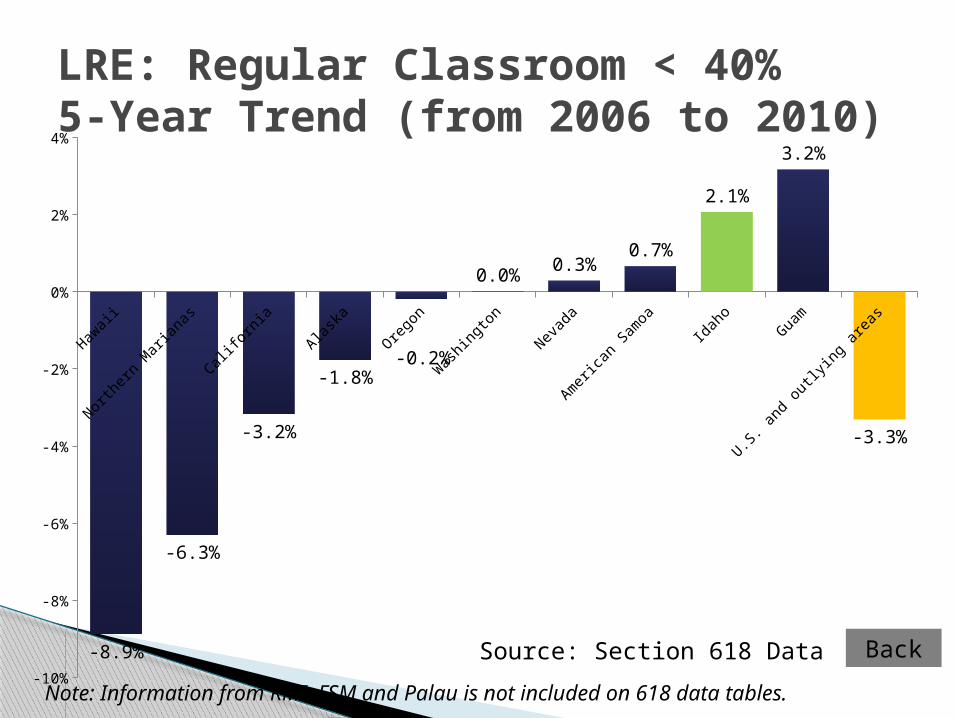
LRE: Regular Classroom < 40% 5-Year Trend (from 2006 to 2010)
Hawaii
North
ern M
arianas
Califo
rnia
Alask
a
Oregon
Was
hingto
n
Nevad
a
Amer
ican S
amoa
Idah
o
Guam
U.S. a
nd outly
ing a
reas
-10%
-8%
-6%
-4%
-2%
0%
2%
4%
-8.9%
-6.3%
-3.2%
-1.8%-0.2%
0.0%0.3%
0.7%
2.1%
3.2%
-3.3%
Note: Information from RMI, FSM and Palau is not included on 618 data tables.
BackSource: Section 618 Data
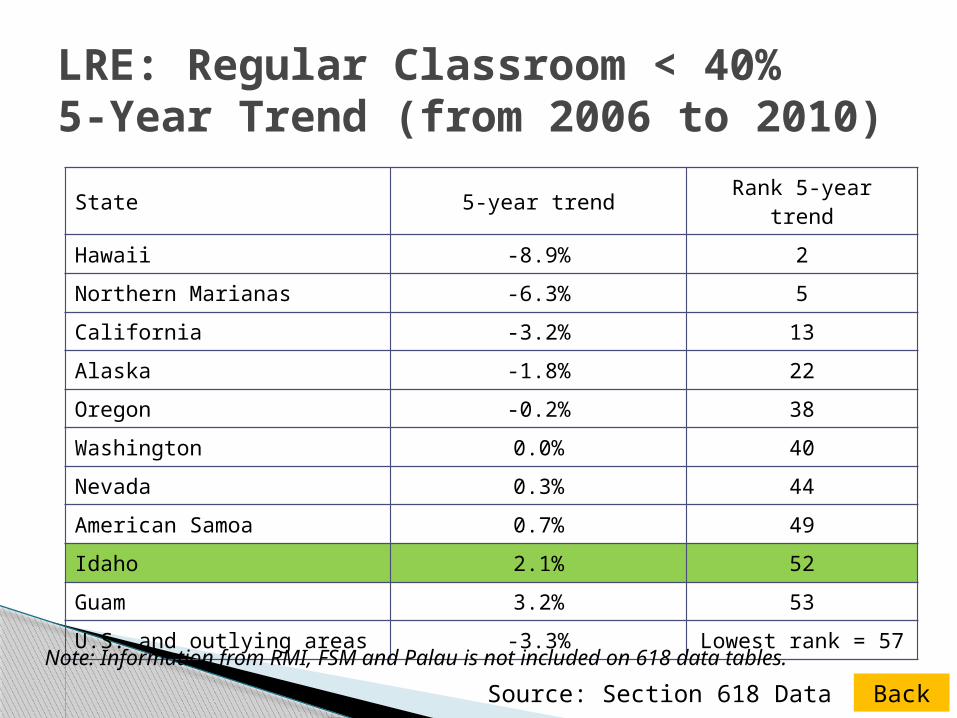
LRE: Regular Classroom < 40% 5-Year Trend (from 2006 to 2010)
State 5-year trend Rank 5-year trend
Hawaii -8.9% 2
Northern Marianas -6.3% 5
California -3.2% 13
Alaska -1.8% 22
Oregon -0.2% 38
Washington 0.0% 40
Nevada 0.3% 44
American Samoa 0.7% 49
Idaho 2.1% 52
Guam 3.2% 53
U.S. and outlying areas -3.3% Lowest rank = 57
Note: Information from RMI, FSM and Palau is not included on 618 data tables.
BackSource: Section 618 Data
14. Post School Outcomes
1. Graduation Rates2. Dropout Rates
13. Post Secondary Transition
4. Suspensions/ Expulsions
3. Participation and Performance on
Statewide Assessments
6. Pre-School Educational Settings
5. Educational Settings
7. Early Childhood Outcomes
8. Parent Involvement
9 and 10. Disproportionalit
y
11 and 12. Child Find
Dis
pute
R
eso
luti
on
Data
Genera
l Sup
erv
isio
n

Questions?