Embed Size (px)
Citation preview
Report of theComptroller and Auditor General of India
on
State Financesfor the year ended March 2016
Government of OdishaReport No.6 of the year 2016


Report of the
Comptroller and Auditor General of India
on
State Finances
for the year ended March 2016
Government of Odisha


Audit Report (State Finances)
for the year ended March 2016
i
Table of Contents
Reference
Para No. Page No.
Preface v
Executive Summary vii-x
CHAPTER I: Finances of the State Government
Profile of the State 1
Gross State Domestic Product (GSDP) 1
Introduction 1.1 2
Summary of Current Year’s Fiscal Transactions 1.2 2
Resources of the State 1.3 5
Revenue Receipts 1.4 7
Capital Receipts, recoveries of Loans and Advances and Debt etc. 1.5 13
Public Account Receipts 1.6 14
Application of Resources 1.7 14
Quality of Expenditure 1.8 21
Financial Analysis of Government Expenditure and Investment 1.9 26
Assets and Liabilities 1.10 32
Debt Sustainability 1.11 36
Fiscal Imbalances 1.12 37
Public Private Partnerships (PPP) 1.13 40
Implementation of UDAY Scheme 1.14 41
Conclusion and Recommendations 1.15 42
CHAPTER II: Financial Management and Budgetary Control
Introduction 2.1 45
Summary of Appropriation Accounts 2.2 46
Financial Accountability and Budget Management 2.3 47
Advances from Contingency Fund 2.4 54
Errors in Budgetary Process 2.5 54
Outcome of review of selected grants 2.6 57
Outcome of Inspection of Treasuries 2.7 59
Conclusion and Recommendations 2.8 60
CHAPTER III: Financial Reporting Delay in furnishing Utilisation Certificates 3.1 63
Non-submission/delay in submission of details of grants/ loans
paid
3.2 64
Delays in Submission of Accounts of Autonomous Bodies 3.3 65
Departmentally Managed Commercial Activities 3.4 65
Inadequate departmental action on cases of misappropriations,
losses, defalcations, etc.
3.5 66

ii Audit Report (State Finances)
for the year ended March 2016
Reference
Para No. Page No.
Pendency in adjustment of Abstract Contingent Bills 3.6 67
Non-closure of inoperative/unwarranted Personal Deposit (PD)
Account
3.7 71
Booking under minor head ‘800-Other Receipts and 800- Other
Expenditure’
3.8 71
Labour Cess amounting to ` 965.26 crore kept in Boards
Account without Legislative scrutiny
3.9 72
Fund management practices 3.10 73
Conclusion and Recommendations 3.11 74
Appendices
1.1 A brief profile of Odisha 77
1.2 Structure and Form of Government Accounts 1.1 78
1.3 Time series data on the State Government Finances 1.2 79
1.4 Abstract of receipt and disbursement for the year 2015-16 1.2 82
1.5 DDO-wise parking of fund in banks amounting to
` 899 crore 1.7.6 85
1.6 Statement of outcome budget during the financial year
2015-16 1.8.3 86
1.7 Summarised financial position of the Government of
Odisha as on 31 March 2016 1.10.1 88
1.8 Status of Public Private Partnership Projects in Odisha as
on 31 March 2016 1.13 90
2.1 Statement of various grants/appropriations where saving
was more than ` 10 crore each and more than 20 per cent
of the total provision during 2015-16
2.3.1 93
2.2 List of Grants indicating persistent savings during 2011-16 2.3.4 94
2.3 Statement showing cases where supplementary provision
(` 1 crore or more in each case) proved unnecessary
during 2015-16
2.3.5 95
2.4 Statement showing cases where supplementary provision
(` 1 crore or more in each case) proved excessive during
2015-16
2.3.5 96
2.5 Statement showing excess / unnecessary re-appropriation
of funds during 2015-16 2.3.6 97
2.6 Statement showing results of substantial surrenders made
during the year 2015-16 ( `10 crore or more in each case) 2.3.8 99
2.7 Statement showing details of savings of ` 1 crore and
above not surrendered during 2015-16 2.3.10 103
2.8 Statement showing grant / major head of account wise
surrender of funds in excess of ` 10 crore on 31 March 2016 2.3.10 104
Audit Report (State Finances)
for the year ended March 2016
iii
Reference
Para No. Page No.
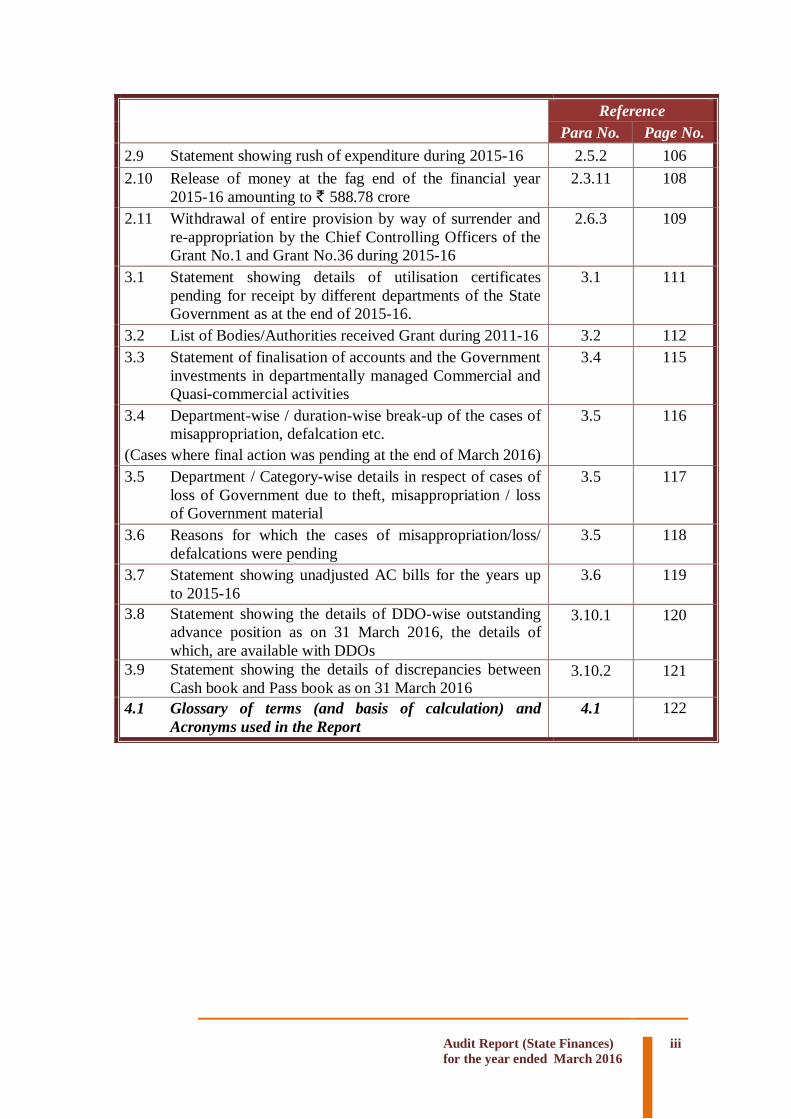
2.9 Statement showing rush of expenditure during 2015-16 2.5.2 106
2.10 Release of money at the fag end of the financial year
2015-16 amounting to ` 588.78 crore
2.3.11 108
2.11 Withdrawal of entire provision by way of surrender and
re-appropriation by the Chief Controlling Officers of the
Grant No.1 and Grant No.36 during 2015-16
2.6.3 109
3.1 Statement showing details of utilisation certificates
pending for receipt by different departments of the State
Government as at the end of 2015-16.
3.1 111
3.2 List of Bodies/Authorities received Grant during 2011-16 3.2 112
3.3 Statement of finalisation of accounts and the Government
investments in departmentally managed Commercial and
Quasi-commercial activities
3.4 115
3.4 Department-wise / duration-wise break-up of the cases of
misappropriation, defalcation etc.
(Cases where final action was pending at the end of March 2016)
3.5 116
3.5 Department / Category-wise details in respect of cases of
loss of Government due to theft, misappropriation / loss
of Government material
3.5 117
3.6 Reasons for which the cases of misappropriation/loss/
defalcations were pending
3.5 118
3.7 Statement showing unadjusted AC bills for the years up
to 2015-16
3.6 119
3.8 Statement showing the details of DDO-wise outstanding
advance position as on 31 March 2016, the details of
which, are available with DDOs
3.10.1 120
3.9 Statement showing the details of discrepancies between
Cash book and Pass book as on 31 March 2016 3.10.2 121
4.1 Glossary of terms (and basis of calculation) and
Acronyms used in the Report
4.1 122

Audit Report (State Finances)
for the year ended March 2016 v
Preface
1. This Report has been prepared for submission to the Governor of
Odisha under Article 151 of the Constitution.
2. Chapters I and II of the Report contain audit observations on matters
arising from examination of Finance Accounts and Appropriation
Accounts respectively, of the State Government for the year ended 31
March 2016. Information has been obtained from the Government of
Odisha wherever necessary.
3. Chapter III on ‘Financial Reporting’ provides an overview and status of
the State Government’s compliance with various financial rules,
procedures and directives during the current year.
4. The Report containing the findings of performance audit and audit of
transactions in various departments and observations arising out of
audit of Statutory Corporations, Boards and Government Companies
and the Report containing observations on Revenue Receipts are
presented separately.


EEXXEECCUUTTIIVVEE SSUUMMMMAARRYY


Executive Summary
Audit Report (State Finances)
for the year ended March 2016
vii
Background
This Report on the Finances of the Government of Odisha is being brought
out with a view to assess objectively the financial performance of the State
during 2015-16 and to provide the State Government and State Legislature
with timely inputs based on audit analysis of financial data. In order to
provide a perspective to the analysis, an effort has been made to compare
the achievements with the targets envisaged by the State Government in the
Fiscal Responsibilities and Budget Management (FRBM) Amendment Act
2012 under Mid Term Fiscal Plan (MTFP) in the Budget Estimates of
2015-16, and norms recommended by the Fourteenth Finance Commission
(FFC).
The Report
Based on the audited accounts of the State Government for the year ended
March 2016, this Report provides an analytical review of the Annual
Accounts of the State Government. The financial performance of the State
has been assessed with reference to the FRBM Act, budget documents,
Fourteenth Finance Commission recommendations and other financial data
obtained from various Government departments and organisations. The
Report is structured in three chapters.
Chapter I is based on the audit of Finance Accounts and makes an
assessment of Odisha Government’s fiscal position as of 31 March 2016. It
provides an insight into trends in committed expenditure, borrowing
pattern, resource allocation and resource generation.
Chapter II is based on audit of Appropriation Accounts and it gives
grant-wise description of appropriations and the manner in which the
allocated resources were managed by the service delivery departments.
Besides, comments arising out of audit of budgetary process and budget
assumptions and outcome of Inspection of Treasuries have also been
included in Chapter II.
Chapter III is an inventory of Government’s compliance with various
reporting requirements and financial rules. The Report also has an
appendix of additional data collected from several sources in support of the
findings.
Executive Summary
Executive Summary
viii Audit Report (State Finances)
for the year ended March 2016
Appendix 4.1 at the end gives a glossary of selected terms used in this
Report.
Audit findings
Finances of the State Government
Amendment to the State FRBM Act: In accordance with the Thirteenth
Finance Commission (ThFC) recommendations, the State Government had
amended (February 2012) the FRBM Act incorporating therein the
continuation of the already achieved zero revenue deficit, setting a target of
three per cent of fiscal deficit and review of compliance with provisions of
FRBM Act through an independent agency as required by the ThFC. The
government complied with these requirements duly during 2015-16.
However, disclosures like projection of Revenue Consequences of Capital
Expenditure (RCCE) in the MTFP, Public Private Partnerships (PPPs) and
related liabilities and bringing out statements on physical and financial
assets and vacant public land and building were not included, as
recommended by ThFC, to be featured under MTFP. Further, the
Government has not prepared the outcome indicators of Fiscal Correction
Path (FCP) during the period covered by ThFC.
Revenue Receipts: Revenue Receipts showed progressive increase from
` 40267 crore in 2011-12 to ` 68941 crore in 2015-16, registering a growth
of 71 per cent. The annual growth rate has increased by five per cent from
16 per cent during 2014-15 to 21 per cent during 2015-16.
Revenue Expenditure: Revenue Expenditure had a predominant share
which was 77 per cent of Total Expenditure in 2015-16. Revenue
Expenditure increased by ` 7670 crore during current year. Plan Revenue
Expenditure (PRE) contributed 60 per cent (` 16659 crore) of the increase
in Revenue Expenditure. Non Plan Revenue Expenditure (NPRE), as a
proportion of Revenue Expenditure, decreased from 72 per cent in 2011-12
to 40 per cent in 2015-16.
Funds parked in Bank Accounts: Funds amounting to ` 899 crore were
parked in bank accounts of 11 District Rural Development Agencies
(DRDAs), 21 Block Development Offices (BDOs) and four Land
Acquisition Offices (LAOs), violating the Odisha Treasury Code provision
and Finance Department instructions.
Public Debt: Public Debt of the State Government increased from ` 24618
crore in 2011-12 to ` 33757 crore in 2015-16, registering an increase of
37.12 per cent during the period 2011-16. Debt repayment as a percentage
of Debt Receipt showed a decreasing trend.

Executive Summary
Audit Report (State Finances)
for the year ended March 2016
ix
Fiscal position: Fiscal position of the State is viewed in terms of trends in
deficit/surplus indicators. The State continued to maintain revenue surplus.
The fiscal and primary deficit of the previous year continued during 2015-
16, though it was within the limits prescribed by FRBM (Amendment) Act,
2012. The ThFC had recommended that by the year 2015-16, fiscal liability
should be brought down to 25 per cent of GSDP. The Government has
been able to achieve this target during 2015-16.
Greater priority to Capital Expenditure: Capital Expenditure (CE)
increased significantly by 54 per cent over the previous year. However,
the CE was 5.14 per cent of GSDP.
Review of Government Investments: As of 31 March 2016, Government
had invested ` 3881.32 crore in Statutory Corporations, Rural Banks, Joint
Stock Companies and Co-operatives. Average return on this investment
was 17.50 per cent in the last five years (14.26 per cent during 2015-16),
while Government paid an average interest rate of 5.90 per cent to 6.56 per
cent on its borrowings during 2011-12 to 2015-2016.
Financial Management and Budgetary Control
During 2015-16, there was overall saving of ` 16717.36 crore. The savings
were mainly due to non implementation of schemes, less requirement of
funds etc. Major Policy initiatives in the budget could not be implemented
due to lack of prior planning. There were savings of ` 8393.66 crore in 10
cases under eight grants and two appropriations exceeding ` 100 crore in
each case.
There were instances of persistent savings by the departments exceeding
` 10 crore in 20 cases relating to 17 grants and one appropriation during
2011-16. There were instances of excess expenditure and expenditure
without provision of funds, unnecessary/excessive supplementary
provision, substantial surrenders, non-surrender of anticipated savings
during 2015-16.
Monthly expenditure during the year was highly erratic. Rush of
expenditure was noticed during the month of March. Several instances of
incurring 100 per cent expenditure during March were found.
Financial Reporting
There were delays in submission of Utilisation Certificates against Grants-
in-Aid of ` 27611 crore. As such,State Government has no assurance and
account of utilisation of this amount. This was mainly due to non
adherence to the existing instructions for watching timely receipt of UCs
from implementing agencies.

Executive Summary
x Audit Report (State Finances)
for the year ended March 2016
Information on financial assistance given to various institutions/authorities
by different departments of the State Government have been furnished by
23 out of 40 departments to Audit as required under the provisions of Audit
and Accounts Regulations 2007 and State Government rules.
Cases of misappropriation, losses and defalcations were pending for
settlement in many departments of State Government despite the same
being pointed out regularly in earlier Audit Reports.
The Chief Controlling Officers did not submit Detailed Contingent Bills
against the advances drawn on Abstract Contingent (AC) Bills of ` 44.30
crore as of March 2016.
A large amount of unspent balance (` 1242.47 crore) was lying in 849
Personal Deposit (PD) Accounts and was not credited back to Government
Account.
Labour Cess amounting to ` 965.26 crore at the end of 31 March 2016 was
kept in bank accounts, keeping the collected cess out of purview of
legislative scrutiny. This also violates Constitutional provisions.
CChhaapptteerr--II
FFiinnaanncceess ooff tthhee
SSttaattee GGoovveerrnnmmeenntt


Audit Report (State Finances)
for the year ended March 2016
1
18324fT
*
Profile of Odisha
Odisha is located on the east coast of the country. It is the ninth largest State in terms of
geographical area (155707 sq. km) and the 11th largest by population as per 2011
census. The State’s population increased from 3.68 crore in 2001 to 4.20 crore in 2011,
recording a decadal growth of 14 per cent as indicated in Appendix-1.1. Population
below the poverty line at 45.9 per cent was higher than the national average of 29.5 per
cent. Odisha has a lower literacy rate, lower life expectancy at birth and higher infant
mortality rate when compared to the all India average. The State has shown a lower
economic growth in the past decade as the compound annual growth rate of its Gross
State Domestic Product (GSDP) for the period 2006-07 to 2015-16 has been 14.04
per cent as compared to 15.75 per cent in General Category States. During the above
mentioned period, its population grew by 8.22 per cent against 12.24 per cent in
General Category States. General data relating to the State is given in Appendix-1.1.
Gross State Domestic Product (GSDP)
GSDP is the market value of all officially recognised final goods and services produced
within the State in a given period of time. The growth of GSDP of the State is an
important economic indicator of the State Economy, as it depicts the increase in total
value of production activities in the State. The trends in the annual growth of India’s
GSDP at current prices are indicated below:
Annual growth rate of GDP and GSDP (at current price)
Year 2011-12 2012-13 2013-14 2014-15 2015-16
India’s Gross Domestic Product
(GDP) (` in crore) 8736039 9951344 11272764 12488205 13576086
Growth rate of GDP (in percentage) 20.52 13.91 13.28 10.78 8.71
State’s GSDP (` in crore) 225283 255273 277271 309807 332329
Growth rate of GSDP (in percentage) 14.05 13.31 8.62 11.73 7.27
Source: For GSDP, Directorate of Economics & Statistics and for All-India- Central Statistical Office.
The GSDP of the State increased from ` 309807 crore during 2014-15 to ` 332329
crore during 2015-16, thereby registering a growth rate of 7.27 per cent over the
previous year, whereas GDP registered a growth of 8.71 per cent over the previous year.
* The abbreviations used in this report have been expanded in the Glossary of terms (and basis of calculation) and
Acronyms used in the Report at Appendix – 4.1 at page 121.
Finances of the
State Government
Chapter
I

Finances of the State Government
2 Audit Report (State Finances)
for the year ended March 2016
1.1 Introduction
This chapter is based on the audit of the Finance Accounts and makes an assessment of
the State’s fiscal position as on 31 March 2016. It provides a broad perspective of the
finances of the State Government during 2015-16 and analyses critical changes in the
major fiscal aggregates relative to the previous year, keeping in view the overall trends
during last five years. The structure of Government Accounts and the layout of Finance
Accounts are given at the Appendix-1.2.
1.2 Summary of Current Year’s Fiscal Transactions
Table 1.1 presents the summary of the State Government’s fiscal transactions during the
current year (2015-16) vis-à-vis the previous year, Appendix-1.3 shows the overall
fiscal position of the State and Appendix-1.4 shows details of receipts and
disbursements during the current year.
Table 1.1: Summary of Current Year’s fiscal operations (` in crore)
Receipt Disbursement 2014-15 2015-16 2014-15 2015-16
Section A Total Total Section A Total Non-Plan Plan Total
Revenue Receipts
56998
68941
Revenue
Expenditure 51136
35536
23270
58806
Tax Revenue 19828 22527 General Services 14529 14962 97 15059
Non-Tax Revenue 8071 8711 Social Services 20964 12171 12472 24643
Share of Union
Taxes/ Duties 16181 23574 Economic Services 14825 7486 10702 18188
Grants from
Government of India 12918 14129
Grants-in-Aid and
Contributions 817 916 0 916
Section B Miscellaneous
Capital Receipts
-- -- Capital Outlay 11075 14 17076 17090
Recoveries of
Loans and Advances
92 228 Loans and Advances
Disbursed 358 95 242 337
Public Debt
Receipts
7646 9790 Repayment of Public
Debt* 4111 -- -- 2881
Contingency Fund 150 -- Contingency Fund -- -- -- 123
Public Account
Receipts
24801 31098
Public Account
Disbursement
22511 -- -- 28766
Opening Cash
Balance
9501 9997 Closing Cash
Balance
9996 -- -- 12051
TOTAL 99187 120054 TOTAL 99187 -- -- 120054
Source: Finance Accounts of the Government of Odisha for respective years
The following significant changes occurred during 2015-16, compared to the previous
year:
Revenue Receipts of the State increased by ₹ 11943 crore (20.95 per cent) over
the previous year. This increase was mainly contributed by State’s own Tax
Revenue (₹ 2699 crore), Grants-in-Aid (GIA) from Government of India (₹ 1211
crore) and State’s share of Union Taxes/Duties (₹ 7393 crore). There was also
increase in own Non-Tax Revenue (₹ 640 crore).
excluding net transactions under Ways and Means advances and overdrafts.

Finances of the State Government
Audit Report (State Finances)
for the year ended March 2016
3
Revenue Expenditure increased by ₹ 7670 crore (15 per cent) during 2015-16
over the previous year, mainly due to increase in expenditure in Economic
Service Sector (₹ 3362 crore), Social Service Sector (₹ 3679 crore), General
Service Sector (₹ 530 crore) and disbursement of Grants-in-Aid and
contributions (₹ 99 crore).
Capital outlay increased by ₹ 6015 crore (54.31 per cent) over the previous year,
mainly on account of increase in expenditure on Roads & Bridges (₹ 3106
crore), Power Projects (` 802 crore), Irrigation (` 1088 crore) and Animal
Husbandry (` 184 crore).
Public Debt receipts increased by ₹ 2144 crore (28.04 per cent) while repayment
of public debt decreased by ₹ 1230 crore (29.92 per cent).
Public Account receipts (₹ 31098 crore) increased by ₹ 6297 crore (25.39 per
cent) over the previous year, mainly due to increase in Small Savings and
Provident Fund (₹ 617 crore), Reserve Fund (₹ 1275 crore) and Deposits and
Advances (₹ 357 crore) and Remittances (₹ 4084 crore), which was set off by
decrease in Suspense and Miscellaneous (₹ 36 crore). Public Account
disbursements (₹ 28766 crore) on the other hand, increased by ₹ 6255 crore
(27.78 per cent) during the same period.
Cash Balance of the State increased by ` 2055 crore.
1.2.1 Review of the fiscal situation
The Thirteenth Finance Commission (ThFC) had recommended that every State needed
to amend the Fiscal Responsibility and Budget Management (FRBM) Act and work out
a fiscal reform path to make credible progress towards fiscal consolidation.
Keeping in line with the recommendations of the ThFC, the State Government had
amended (February, 2012) the State FRBM Act, 2005 which laid down the following
fiscal targets:
Revenue deficit during 2011-12 and onwards to be maintained at Zero.
Fiscal deficit to be contained within three per cent of the Gross State Domestic
Product (GSDP) from 2011-12 and onwards.
In order to bring the debt stock to a sustainable level, interest payment as a
percentage of Revenue Receipt to be limited to 15 per cent.
For the purpose of ensuring compliance with the provisions of the FRBM Act,
the State Government shall entrust an agency independent of State Government
who shall periodically make review of such compliance and submit reports
thereof to the State Government for laying the same before the State Legislature.
The State Government has got its compliance with FRBM Act reviewed by the National
Institute of Public Finance.

Finances of the State Government
4 Audit Report (State Finances)
for the year ended March 2016
The State has achieved the targets for Revenue, Fiscal Deficits, level of debt stock and
interest payment, as laid down by ThFC/FRBM Act for the year 2015-16. However,
disclosures such as projection of Revenue Consequences of Capital Expenditure
(RCCE), Public Private Partnerships (PPPs) and related liabilities, statements on
physical and financial assets and vacant public land and buildings were not included in
the Mid Term Fiscal Plan (MTFP), even though recommended by ThFC.
1.2.2 Budget Estimates and Actuals
Budget papers presented by the State Government provide estimation of Revenue and
expenditure for a particular financial year. The importance of accuracy in estimation of
Revenue and expenditure is widely accepted in the context of effective implementation
of fiscal policies for overall economic management. Deviations from Budget Estimates
are indicative of non-attainment and non-optimisation of desired fiscal objectives.
Compared to the Budget Estimates for 2015-16, there was variation in actuals in the
case of several key fiscal parameters. Chart 1.1 presents the Budget Estimates and
actuals for some important parameters.
Source: Finance Accounts for the year 2015-16 and Budget at a Glance 2015-16, Government of Odisha.
As may be observed from Chart 1.1, the State’s actual Revenue Receipts were less than
the Budget Estimates by ` 1999 crore, whereas the State’s own Tax Revenue was more
than the Budget Estimates by ` 1247 crore (six per cent) while Non-Tax Revenue was
less than the Budget Estimates by ` 302 crore (three per cent). Revenue expenditure
was also less than Budget estimate by ` 7033 crore. As a result, Revenue surplus was
` 10135 crore, instead of Budget estimate of ` 5101crore. Capital expenditure was also
less by ` 1559 crore.

Finances of the State Government
Audit Report (State Finances)
for the year ended March 2016
5
1.2.3 Major policy initiatives in the budget
Major policy initiatives of the budget 2015-16 and their status during the financial year
2015-16 are given in Table 1.2 below:
Table 1.2: Major policy announcement in the Budget and implementation thereof
Sl.
No.
Department Policy announcement details Status of Implementation
1 Agriculture
Department
State Potato Mission was launched in 2015-16
using State’s Own Resources.
Total expenditure incurred during the
year was ₹ 11.44 crore, out of which an expenditure of ₹ 11.22 crore was
incurred in March 2016.
2
Housing and
Urban
Development
Department
Odisha Urban Livelihood Mission (OULM)
was launched during 2015-16. A provision of
₹ 10 crore was made for 77 Urban Local Bodies
of the State.
₹ 10 crore was transferred to 77
ULBs for launching of Odisha Urban
Livelihood Mission.
3
Health &
Family
Welfare
Department
The State Government decided to open five
new Government Medical Colleges in the districts of Balangir, Koraput, Mayurbhanj,
Balasore and Puri.
Construction work is in progress and
expenditure to the extent of ` 155.67 crore has been made up to the end of
2015-16.
4 Energy
Department
A sum of ₹ 310 crore was released for installation of 500 numbers of 33/11 KV Sub-
stations for up-gradation of the distribution
system.
23 numbers of 33/11 KV Sub-stations were constructed.
5
School and
Mass
Education
Department
₹ 25 crore was provided for construction of a
Sainik School at Sambalpur.
The construction work had not
started up to the end of 2015-16.
6
₹ 30 crore was provided towards recurring cost
of Model Schools. This scheme was proposed
to be completed during 2015-16 to 2019-20 using State’s Own Resources (SOR) under the
plan scheme.
Funds were placed with the State
Project Director, Odisha Adarsh
Vidyalaya Sangathan for the purpose.
7
Water
Resources
Department
Irrigation Road Construction & Improvement
scheme was launched in 2014-15. It was
proposed to provide ` 500 crore during a period
of five years for the scheme.
During 2015-16, the financial
progress of work was very slow compared to the previous year.
8 Works
Department
A new scheme “Biju Express Way” was launched to improve connectivity in Western
Odisha and KBK districts which would act as
an economic corridor between Jagdalpur and Rourkela. ₹ 30 crore was provided for the
purpose.
Funds have been utilised for execution of works for 60 Km of
Sohela-Nuapada portion.
Source: Budget at a Glance 2016-17, Government of Odisha.
1.3 Resources of the State
1.3.1 Resources of the State as per Finance Accounts
Revenue and Capital are the two streams of receipts that constitute the resources of the
State Government. Revenue Receipts consist of Tax Revenues, Non-Tax Revenues,
State’s share of Union Taxes and Duties and Grants-in-Aid from Government of India
(GoI). Total Capital Receipts comprise Capital Receipts, such as miscellaneous Capital
Receipts from disinvestments, and other receipts are recoveries of loans and advances,
debt receipts from internal sources (market loans, borrowings from financial
Finances of the State Government
6 Audit Report (State Finances)
for the year ended March 2016
institutions/commercial banks) and loans and advances from GoI as well as accruals
from Public Account.
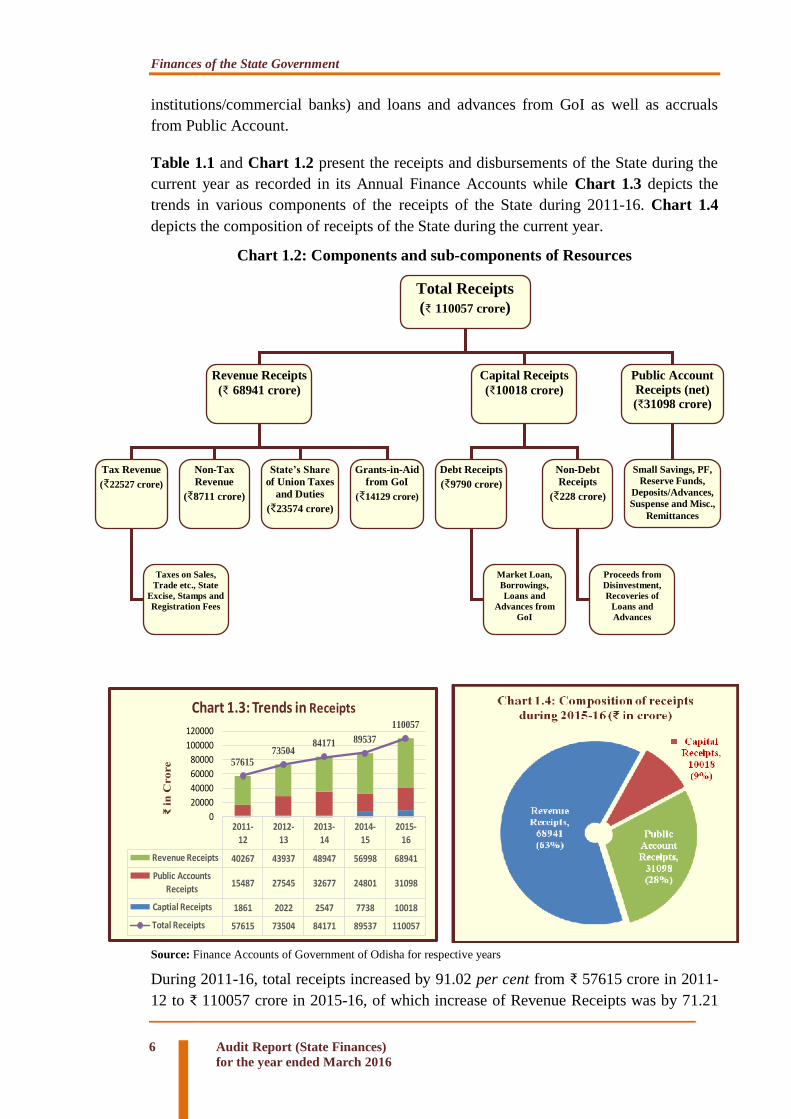
Table 1.1 and Chart 1.2 present the receipts and disbursements of the State during the
current year as recorded in its Annual Finance Accounts while Chart 1.3 depicts the
trends in various components of the receipts of the State during 2011-16. Chart 1.4
depicts the composition of receipts of the State during the current year.
Chart 1.2: Components and sub-components of Resources
2011-12
2012-13
2013-14
2014-15
2015-16
Revenue Receipts 40267 43937 48947 56998 68941
Public Accounts
Receipts15487 27545 32677 24801 31098
Captial Receipts 1861 2022 2547 7738 10018
Total Receipts 57615 73504 84171 89537 110057
5761573504
84171 89537
110057
0
20000
40000
60000
80000
100000
120000
₹ in
Crore
Chart 1.3: Trends in Receipts
Source: Finance Accounts of Government of Odisha for respective years
During 2011-16, total receipts increased by 91.02 per cent from ₹ 57615 crore in 2011-
12 to ₹ 110057 crore in 2015-16, of which increase of Revenue Receipts was by 71.21
Total Receipts
(₹ 110057 crore)
Revenue Receipts
(₹ 68941 crore)
Capital Receipts
(₹10018 crore)
Public Account
Receipts (net)
(₹31098 crore)
Tax Revenue
(₹22527 crore)
Non-Tax
Revenue
(₹8711 crore)
State’s Share
of Union Taxes
and Duties
(₹23574 crore)
Grants-in-Aid
from GoI
(₹14129 crore)
Debt Receipts
(₹9790 crore)
Non-Debt
Receipts
(₹228 crore)
Small Savings, PF,
Reserve Funds,
Deposits/Advances,
Suspense and Misc.,
Remittances
Taxes on Sales,
Trade etc., State
Excise, Stamps and
Registration Fees
Market Loan,
Borrowings,
Loans and
Advances from
GoI
Proceeds from
Disinvestment,
Recoveries of
Loans and
Advances

Finances of the State Government
Audit Report (State Finances)
for the year ended March 2016
7
per cent from ₹ 40267 crore to ₹ 68941 crore during the period, due to higher collection
of State’s own taxes as well as increases in State’s share of Central tax transfers and
Grants-in-Aid from GoI. However, the share of Revenue Receipts as percentage of total
receipts decreased from 70 to 63 from 2011-12 to 2015-16. The share of Capital
Receipts increased from three per cent in 2011-12 to nine per cent in 2015-16. The share
of Public Account receipts to the total receipts increased from 27 per cent in 2011-12 to
28 per cent in 2015-16.
1.3.2 Funds transferred to State Implementing Agencies outside the State Budget
Direct transfer to State Implementing Agencies by GoI was ` 281.69 crore in 2015-16.
Funds for Members of Parliament’s Local Area Development Schemes (MPLADS)
amounted to ` 135 crore. Thus, during 2015-16 the quantum of direct transfers was 0.41
per cent of State’s Revenue Receipts.
1.4 Revenue Receipts
Revenue Receipts consist of State Government’s own Tax and Non-Tax Revenues,
State’s share of Central tax transfers and Grants-in-Aid from GoI. Statement 14 of the
Finance Accounts depicts the Revenue Receipts and Capital Receipts of the
Government. The State’s share in Central taxes and Grants-in-Aid is determined on the
basis of recommendation of the Finance Commission. Collection of Central tax receipts
and Central assistance for plan schemes etc. is also determined on the basis of
recommendation of Finance Commission. The trends and composition of Revenue
Receipts over the period 2011-16 are shown in Appendix-1.3 and also depicted in Chart
1.5 and 1.6 respectively.
2011-12 2012-13 2013-14 2014-15 2015-16
State's Own Revenue 19886 23112 25271 27899 31238
Central Tax Transfer 12229 13965 15247 16181 23574
GIA 8152 6860 8429 12918 14129
Total Revenue Receipts 40267 43937 48947 56998 68941
0
10000
20000
30000
40000
50000
60000
70000
80000
Chart 1.5: Trends in Revenue Receipts (₹ in crore)
Source: Finance Accounts of Government of Odisha for respective years.
Overall, 45 per cent of Revenue came from State’s own resources and the balance was
from GoI in the form of State’s share of taxes and Grants-in-Aid. An increase of
` 2699 crore (14 per cent) in own Tax Revenue, increase of ` 640 crore (eight per cent)
in Non-Tax Revenue, increase of ` 7393 crore (46 per cent) in State’s share in Union
taxes and duties and ` 1211 crore (nine per cent) in Grants-in-Aid resulted in increase of
` 11943 crore (21 per cent) in Revenue Receipts during 2015-16 over the previous year.

Finances of the State Government
8 Audit Report (State Finances)
for the year ended March 2016
Revenue Receipts showed progressive increase from ` 40267 crore in 2011-12 to
` 68941 crore in 2015-16 registering a growth of 71 per cent. The trends in Revenue
Receipts relative to GSDP are presented in Table 1.3:
Table 1.3: Trends in Revenue Receipts relative to GSDP 2011-12 2012-13 2013-14 2014-15 2015-16
Gross State Domestic Product
(GSDP) (` in crore) 225283 255273 277271 309807 332329
Rate of growth of GSDP 14.05 13.31 8.62 11.73 7.27
Revenue Receipts (RR)
(` in crore) *
40267 43937 48947 56998 68941
Rate of growth of RR (per cent) 21.01 9.11 11.40 16.45 20.95
R R/GSDP (per cent) 18.25 17.49 17.93 18.34 20.74
Buoyancy Ratios1
Revenue Buoyancy with respect
to GSDP
1.50 0.68 1.32 1.40 2.88
Rate of growth of own tax 20.10 11.83 12.36 17.38 13.61
State’s Own Tax Buoyancy
with respect to GSDP
1.43 0.89 1.43 1.48 1.87
Source: GSDP - Directorate of Economics and Statistics, Government of Odisha and Revenue Receipts – Finance
Accounts of the respective years,* Do not include GoI funds transferred to Non-Government organisations and others.
Revenue buoyancy fluctuated during the period due to fluctuations in the growth
rate of Revenue Receipts.
It can be seen from the table that Revenue buoyancy with reference to GSDP
was above one during 2011-16 except 2012-13. The growth rate of Revenue
Receipts was better than the growth rate of GSDP except in 2012-13.
The State’s own tax buoyancy with respect to GSDP was also more than one
during 2011-16, except in 2012-13, indicating that growth rate of own tax was
better than GSDP.
1.4.1 State’s Own Resources
The State’s own resources comprised Revenue Receipts from its Own Tax and Non-Tax
source. The actual receipts under State’s Tax and Non-Tax revenue vis-à-vis assessment
made by Fourteenth Finance Commission (FFC) and the State Government in MTFP are
indicated in Table1.4 below:
Table 1.4: Mobilisation of Own Tax and Non - Tax Revenue during 2015-16.
(` in crore)
Assessment
made by FFC
Assessment made by State
Government in MTFP
Actuals
State’s own Tax Revenue 25098 21280 22527
State’s own Non-Tax Revenue 9009 9014 8711 Source: Finance Accounts, FFC and MTFP of Government of Odisha
During 2015-16, the receipts under State’s Tax Revenue and Non-Tax Revenue were
less than the assessment of FFC by ten per cent and three per cent respectively.
However, the State’s own Tax Revenue was more than the assessment made in MTFP
1 Buoyancy ratio indicates the elasticity or degree of responsiveness of a fiscal variable with respect to a given
change in the base variable. For instance, Revenue buoyancy at 0.6 implies that Revenue Receipts tend to
increase by 0.6 percentage points, if the GSDP increases by one per cent.

Finances of the State Government
Audit Report (State Finances)
for the year ended March 2016
9
by ` 1247 crore (six per cent) and Non-Tax Revenue was less by ` 303 crore (three per
cent). Tax Revenue increased by 14 per cent (₹ 2699 crore) over the previous year and
Non-Tax Revenue increased by eight per cent (₹ 640 crore) during the same period.
1.4.1.1 Tax Revenue
The sector-wise components of Tax Revenue during 2011-12 to 2015-16 are shown in
Table 1.5.
Table 1.5: Head- wise components of State’s Tax Revenue
(` in crore)
Revenue Head 2011-12 2012-13 2013-14 2014-15 2015-16
Percentage increase
in 2015-16 over
previous year
Taxes on Sales, Trades etc. 8197 9685 10729 11817 13097 10.83
State Excise 1379 1499 1780 2035 2547 25.16
Taxes on Vehicles 788 746 860 910 1044 14.73
Stamp Duty and
Registration Fees
498 545 606 800 2157 169.63
Land Revenue 522 420 431 646 589 -8.82
Taxes on Goods and
Passengers
1312 1342 1613 1711 1663 -2.89
Other Taxes2 747 797 873 1909 1430 -25.09
Total 13443 15034 16892 19828 22527 13.61
Source: Finance Accounts of Government of Odisha for the respective years
The Compound Annual Growth Rate (CAGR) of Tax Revenue for 2006-15 of the State
was marginally higher as compared to the General Category States (Appendix-1.1). The
Tax Revenue during the current year (` 22527 crore) increased by 14 per cent over the
previous year (` 19828 crore). The revenue through Taxes on Sales, Trades etc.
(` 13097 crore) was the main source of State’s own Tax Revenue and registered an
increase of 11 per cent, Taxes on Goods and Passengers (` 1663 crore) decreased by
three per cent, State Excise (` 2547 crore) increased by 25 per cent, Taxes on Vehicles
(` 1044 crore) by 15 per cent, Stamp Duty and Registration Fees (` 2157 crore) by 170
per cent and Taxes on Land Revenue (` 589 crore) decreased by nine per cent over the
previous year.
The ratio of Own Tax Revenue (OTR) with respect to GSDP was nearly seven per cent
(6.78) in 2015-16. Therefore, the State could not achieve the target of 7.5 per cent by
2015-16 as projected by FFC.
Major increase / decrease in current year’s Own Revenue along with reasons are given
in Table 1.6.
2 Other taxes include taxes on immovable property other than agricultural land, taxes and duties on electricity
and agricultural income.

Finances of the State Government
10 Audit Report (State Finances)
for the year ended March 2016
Table 1.6: Major increase /decrease in current year’s Own Revenue
Sl. No. Major Heads of Account Increase
(` in crore)
Main Reasons
1 0030-Stamp Duty and
Registration Fees
1356.84 Due to higher receipt of Sale proceeds of
Impressed Stamps, Impressing Duties under
Impressing of Documents and Fees for
Registration of Documents.
2 0040-Taxes on Sales, Trade
etc
1280.26 Due to higher receipt under Odisha Value
Added Tax Act, 2004.
Sl. No. Major Heads of Account Decrease
(` in crore)
Main Reasons
3 0050-Dividends and Profits 523.09 Due to less receipt of Dividends from Odisha
Mining Corporation.
4 0043-Taxes and Duties on
Electricity
510.39 Due to less receipt of Duty on Captive power.
5 0701-Medium Irrigation 58.64 Due to less receipt of Miscellaneous other
Receipts.
6 0029-Land Revenue 56.83 Due to less receipt of Collection of payments
for service rendered and Land Revenue/Tax.
7 0042-Taxes on Goods and
Passengers
47.88 Due to less receipt of Tax on entry of Goods to
Local Areas.
Source: Finance Accounts 2015-16, Government of Odisha.
1.4.1.2 Non-Tax Revenue
The components of Non-Tax Revenue during 2011-12 to 2015-16 are given in Table
1.7:
Table 1.7: Components of State’s own Non-Tax resources
(` in crore)
Revenue Head 2011-12 2012-13 2013-14 2014-15 2015-16 Percentage
increase over
previous year
Interest Receipts 576 588 1241 331 560 69.18
Dividends & Profits 286 565 452 1076 553 -48.61
Non-Ferrous Mining
and Metallurgy receipts
4572 5697 5519 5310 5799 9.21
Other Non-Tax Receipts 1009 1228 1167 1354 1799 32.86
Total 6443 8078 8379 8071 8711 7.93
Source: Finance Accounts of Government of Odisha for the respective years
The Compound Annual Growth Rate (CAGR) of Non-Tax Revenue for 2006-15 of the
State was higher as compared to the General Category States (Appendix-1.1). However,
growth of the State was also lower than the General Category States during 2015-16.
The Non-Tax Revenue collected during 2011-16 ranged between 13 to 18 per cent of
revenue receipts. The Own Non-Tax Revenue (ONTR) (` 8711 crore), which
constituted 13 per cent of Revenue Receipts during 2015-16, increased by ` 640 crore
(eight per cent) over previous year. The increase was mainly under Interest Receipts
(` 229 crore) and Non-Ferrous Mining and Metallurgy receipts (` 489 crore) which was
partly set off by decrease under Dividends and Profits (` 523 crore).

Finances of the State Government
Audit Report (State Finances)
for the year ended March 2016
11
1.4.2 Grants-in-Aid from Government of India
Grants-in-Aid from GoI increased from ` 8152 crore in 2011-12 to ` 14129 crore during
2015-16 as shown in Table 1.8.
Table 1.8: Grants-in–Aid from Government of India
(` in crore)
Particulars 2011-12 2012-13 2013-14 2014-15 2015-16
Grants for Non Plan Schemes 2561 1505 2729 1929 3063
Grants for State Plan Schemes 3853 3484 3429 10886 10773
Grants for Central Plan Schemes 109 183 122 102 293
Grants for Centrally Sponsored Schemes 1629 1688 2149 0.08 0.04
Grants for Special Plan Schemes -- -- -- -- --
Total 8152 6860 8429 12917 14129
Percentage of increase over previous
year
19.78 (-)15.85 22.87 53.24 9.38
Total grants as a percentage of Revenue
Receipts
20.24 15.61 17.22 22.66 20.49
Source: Finance Accounts of Government of Odisha for the respective years.
Grants-in-Aid from GoI increased by ` 5977 crore (73.32 per cent) from ` 8152 crore in
2011-12 to ` 14129 crore in 2015-16. The increase was under grants for State Plan
Schemes (` 6920 crore), Non-Plan Schemes (` 502 crore) and Central-Plan Grants
(` 184 crore) and there was significant decrease in Centrally Sponsored Schemes
(` 1628.96 crore). Percentage share of grants to Revenue Receipts increased from 20.24
in 2011-12 to 20.49 in 2015-16.
1.4.3 Recommendations of the Fourteenth Finance Commission
As per the recommendations of the Fourteenth Finance Commission (FFC), the share of
the states in the net proceeds of shareable central taxes has been increased to 42 per cent
from 32 per cent. As per the reworked criteria for distribution of shares among the
states, population has 17.5 per cent weightage while demographic change has 10 per
cent weightage. Income distance3, area and forest cover bear weightages of 50 per cent,
15 per cent and 7.5 per cent, respectively. As a result, the share of Odisha is 4.64 per
cent of the divisible pool, down from 4.78 per cent, recommended by the Thirteenth
Finance Commission (ThFC). The commission has recommended ` 1,84,070 crore as
the state’s share in the net proceeds of the central taxes and duties during the period.
1.4.3.1 Comparison between ThFC and FFC recommendations
The comparative recommendations of the ThFC and the FFC are summarized in Table
1.9.
3 Income distance is the distance of actual per capita income of a state from the state with highest per capita income.

Finances of the State Government
12 Audit Report (State Finances)
for the year ended March 2016
Table-1.9 Comparative Statement on Finance Commissions
(₹ in crore)
Items
2010-15
Recommendations of
ThFC
2015-20
Recommendations of
F FC
1 2 3
Pre-Devolution Non-Plan Revenue Deficit/Surplus
-28282.67 -
126511.00 Central Tax Devolution (including Service Tax) 69316.10 184070.00
Post Tax Devolution Deficit/ Surplus 41033.43 57559.00
GRANT
S
Non-Plan Revenue Deficit Grant 0.00 -
Calamity Relief/ Disaster Relief 1647.82 3717.00
Grant for Calamity Relief Fund (newly Disaster
Response Fund)
1622.82
3717.00
Grant for Capacity Building 25.00 -
Upgradation and Special Problem (a+b) 1745.00 -
a. Upgradation 0.00 -
b. Special Problems/ State Specific Needs 1745.00 -
Other Grants 2995.10 -
c. Maintenance of Roads and Bridges 1022.00 -
d. Maintenance of Major & Medium Irrigation 184.00
-
e. Maintenance of Flood Control & Drainage -
f. Maintenance of Minor Irrigation -
g. Maintenance of Forests 331.00 - h. Elementary Education 1016.00 - i. Improvement in Justice Delivery 193.60 - j. Incentive for Issuing UIDs 178.50 - k. District Innovation Fund 30.00 - l. Improvement in Statistical System in State 30.00 - m. Employee & Pension Data Base 10.00 -
Grants for Local Bodies 3270.90 10622.79
1. Rural Local Bodies 2591.20 8850.31
2. Urban Local Bodies 496.10 1772.48
3. Special Area Grant 183.60 -
TOTAL GRANTS 9658.82 14339.79
TOTAL TRANSFER 78974.92 198409.79
Source- Odisha Budget at a Glance – 2016-17
It is observed from the above table that the State is likely to receive ₹ 119434.87 crore
more than the ThFC recommendations.
1.4.3.2 Payment of Penal Interest
As per GoI guidelines, the FFC grants should be transferred to Local Bodies within 15
days of receipt. Any delay will require the State Government to release the installment
with penal interest, at the Bank rate of RBI, for the number of days of delay. Audit
scrutiny showed that in 2015-16, the State Government violated the time limit by two
Finances of the State Government
Audit Report (State Finances)
for the year ended March 2016
13
days, which resulted in avoidable payment of penal interest (` 20.29 lakh) from State
resources.
1.4.4 Central Tax transfers
During 2015-16, Central tax transfers increased by ` 7393 crore over previous year and
constituted 11 per cent of Revenue Receipts. The increase was mainly under
Corporation Tax (₹ 1758 crore), Service Tax (₹ 1701 crore), Taxes on Income other
than Corporation Tax (₹ 1106 crore), Customs (₹ 1154 crore) and Union Excise Duties
(` 1669 crore). The increase was partly set off by decrease in Wealth Tax (` 13 crore).
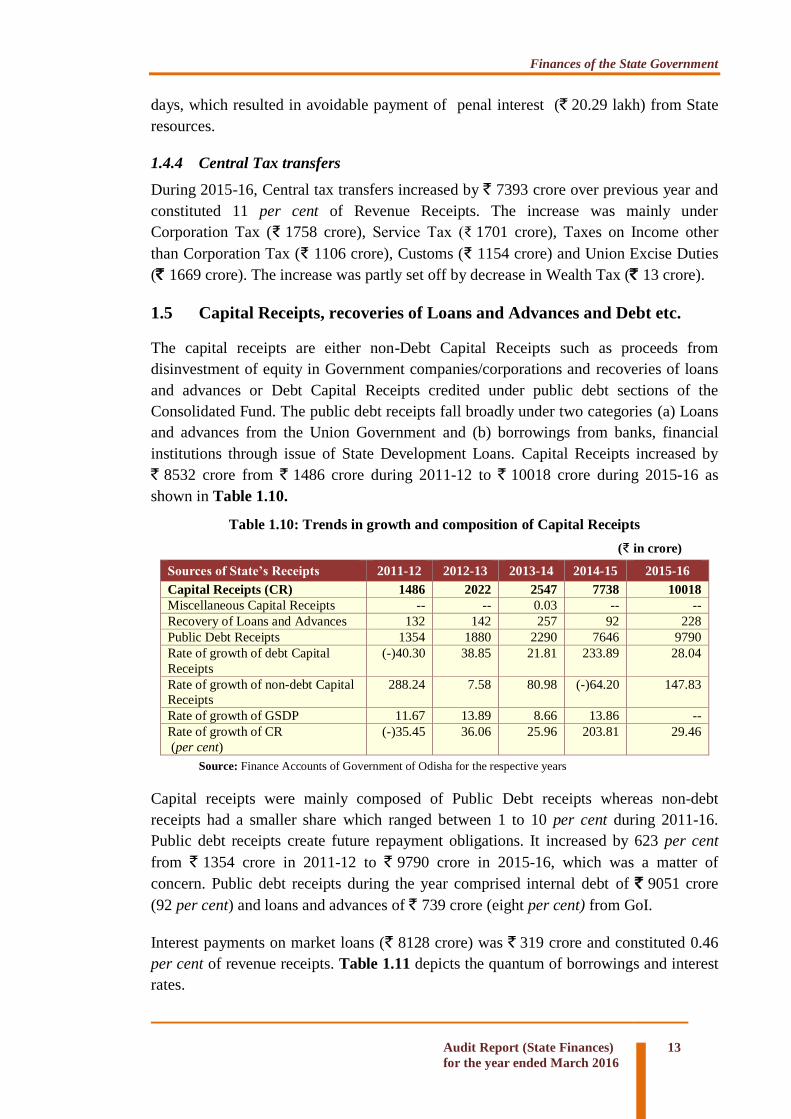
1.5 Capital Receipts, recoveries of Loans and Advances and Debt etc.
The capital receipts are either non-Debt Capital Receipts such as proceeds from
disinvestment of equity in Government companies/corporations and recoveries of loans
and advances or Debt Capital Receipts credited under public debt sections of the
Consolidated Fund. The public debt receipts fall broadly under two categories (a) Loans
and advances from the Union Government and (b) borrowings from banks, financial
institutions through issue of State Development Loans. Capital Receipts increased by
` 8532 crore from ` 1486 crore during 2011-12 to ` 10018 crore during 2015-16 as
shown in Table 1.10.
Table 1.10: Trends in growth and composition of Capital Receipts
(₹ in crore)
Sources of State’s Receipts 2011-12 2012-13 2013-14 2014-15 2015-16
Capital Receipts (CR) 1486 2022 2547 7738 10018
Miscellaneous Capital Receipts -- -- 0.03 -- --
Recovery of Loans and Advances 132 142 257 92 228
Public Debt Receipts 1354 1880 2290 7646 9790
Rate of growth of debt Capital
Receipts
(-)40.30 38.85 21.81 233.89 28.04
Rate of growth of non-debt Capital
Receipts
288.24 7.58 80.98 (-)64.20 147.83
Rate of growth of GSDP 11.67 13.89 8.66 13.86 --
Rate of growth of CR
(per cent)
(-)35.45 36.06 25.96 203.81 29.46
Source: Finance Accounts of Government of Odisha for the respective years
Capital receipts were mainly composed of Public Debt receipts whereas non-debt
receipts had a smaller share which ranged between 1 to 10 per cent during 2011-16.
Public debt receipts create future repayment obligations. It increased by 623 per cent
from ` 1354 crore in 2011-12 to ` 9790 crore in 2015-16, which was a matter of
concern. Public debt receipts during the year comprised internal debt of ` 9051 crore
(92 per cent) and loans and advances of ` 739 crore (eight per cent) from GoI.
Interest payments on market loans (` 8128 crore) was ` 319 crore and constituted 0.46
per cent of revenue receipts. Table 1.11 depicts the quantum of borrowings and interest
rates.

Finances of the State Government
14 Audit Report (State Finances)
for the year ended March 2016
Table 1.11: Market Loans as a percentage of Internal Debt (` in crore)
Particulars 2011-12 2012-13 2013-14 2014-15 2015-16
Total Internal debt 17338 16109 16073 19728 26525
Total Market Loans 5114 3806 2921 4565 8128
Percentage of Market Loans to
Internal Debt 29 24 18 23 31
Interest paid on Market Loans 427 322 217 175 319 Source: Finance Accounts of respective years
1.6 Public Account Receipts
Receipts and disbursements in respect of certain transactions, such as small savings,
provident funds, reserve funds, deposits, suspense, remittances etc., which do not form
part of the Consolidated Fund of the State, are kept in Public Account set up under
Article 266(2) of the Constitution of India and are not subject to vote by the State
Legislature. Here the Government acts as a banker. The balance, after disbursements, is
the amount of funds available with the Government for its use. Composition of Public
Account Receipt by the Government for the last five years is detailed in Table 1.12.
Table 1.12: Trends in growth and composition of Public Account Receipts
(` in crore)
Resources under various heads 2011-12 2012-13 2013-14 2014-15 2015-16
Public Account Receipts 15487 27545 32677 24801 31098
a. Small Savings, Provident Fund etc. 2492 3001 3332 3471 4088
b. Reserve Fund 1661 939 1760 658 1933
c. Deposits and Advances 4126 6537 7019 6842 7199
d. Suspense and Miscellaneous -32 8527 10225 210 175
e. Remittances 7240 8541 10341 13620 17703
Source: Finance Accounts of Government of Odisha for the respective years.
The share of Public Account receipts on total receipts increased from 26.88 per cent in
2011-12 to 28.26 per cent in 2015-16. As compared to 2014-15, the increase during
2015-16 was 25.39 per cent (` 6297 crore), which was mainly under Reserve Fund,
Remittances, Small Savings, Provident Fund and Deposits and Advances, etc.
1.7 Application of Resources
Analysis of the allocation of expenditure at the State Government level assumes
significance since major expenditure responsibilities are entrusted with them. Within the
framework of fiscal responsibility legislations, there are budgetary constraints in raising
public expenditure financed by deficit or borrowings. It is, therefore, important to ensure
that the ongoing fiscal correction and consolidation process at the State level is not at
the cost of expenditure, especially the expenditure directed towards development of
social sector.

Finances of the State Government
Audit Report (State Finances)
for the year ended March 2016
15
1.7.1 Growth and Composition of Expenditure
Chart 1.7 presents the trends in total expenditure over a period of five years (2011-16)
and its composition both in terms of ‘economic classification’ and ‘expenditure by
activities’ is depicted in Charts 1.8 and 1.9, respectively.
2011-12 2012-13 2013-14 2014-15 2015-16
Loans and Advances 621 216 463 358 337
Capital Expenditure 4496 5622 7756 11075 17090
Revenue Expenditure 34660 38238 45618 51136 58806
Total Expenditure 39777 44076 53837 62569 76233
3977744076
53837
62569
76233
0
10000
20000
30000
40000
50000
60000
70000
80000
90000₹
in C
rore
s
Chart 1.7: Total Expenditure-Trends and
composition
Source: Finance Accounts of Government of Odisha for respective years.
Total expenditure of the State increased by 92 per cent from ` 39777 crore in 2011-12
to ` 76233 crore in 2015-16 due to increase in Revenue Expenditure (` 24146 crore)
and Capital outlay (` 12594 crore) and it was offset by decrease in disbursement of
Loans and Advances (` 284 crore). While the share of Revenue Expenditure in the Total
Expenditure decreased from 87 per cent during 2011-12 to 77 per cent in 2015-16, the
share of Capital Expenditure increased from 11 per cent in 2011-12 to 22 per cent in
2015-16.
The increase of ` 13664 crore in Total Expenditure in 2015-16 over the previous year
was on account of increase in Revenue Expenditure and Capital Expenditure by ` 7670
crore and ` 6015 crore, respectively. The Total Expenditure was 22.94 per cent of
GSDP during 2015-16 as compared to 20.20 per cent during the previous year.
Source: Finance Accounts of Government of Odisha for respective years.

Finances of the State Government
16 Audit Report (State Finances)
for the year ended March 2016
1.7.2 Total Expenditure
Total Expenditure (TE) consisted of expenditure on General Services including Interest
Payments, Social and Economic Services and Grants-in-Aid and disbursement of Loans
and Advances. The movement of relative shares of the component of expenditure is
indicated in Chart 1.9.
1.7.3 Revenue Expenditure
Revenue Expenditure (RE) is incurred to maintain the current level of services and
payment of the past obligation and, as such, does not result in any addition to the State’s
infrastructure and service network. Revenue Expenditure had a predominant share of 87
per cent of Total Expenditure in 2011-12 which decreased to 77 per cent in 2015-16.
However, it increased by 15 per cent from ` 51136 crore in 2014-15 to ` 58806 crore in
2015-16 in absolute terms.
In the context of State finances, the quality of expenditure has always been an important
issue. Currently, revenue expenditure accounts for around 77 per cent of the State’s
aggregate expenditure, which is in the nature of current consumption, leaving only 23
per cent for investment in infrastructure and asset creation.
1.7.4 Non-Plan Revenue Expenditure
Non-Plan Revenue Expenditure (NPRE) increased by ` 3277 crore (10 per cent) from
` 32259 crore in 2014-15 to ` 35536 crore during the current year and, as a proportion
of Revenue Expenditure, it decreased from 72 per cent (` 24940 crore) in 2011-12 to
60 per cent (` 35536 crore) in 2015-16. Increase in Plan Revenue Expenditure (PRE)
contributed mainly to the total increase of ` 7670 crore in Revenue Expenditure during
the current year over the previous year. Increase in PRE during the current year was
mainly on Rural Employment (` 1970 crore), General Education (` 1240 crore), Other
Rural Development Programmes (` 977 crore), Water Supply and Sanitation (` 937
crore), Crop Husbandry (` 590 crore) and Interest payments (` 533 crore). The NPRE
remained below the assessment made by the Government in MTFP (` 40892 crore) for
2015-16 by ` 5356 crore, as indicated in Table 1.13.
Table 1.13: Comparative assessments of RE and NPRE and per cent of GSDP
(` in crore)
Assessment made
by FFC
Assessment made by
Government in MTFP
Actual in
2015-16
Revenue Expenditure 55114 65839 58806
NPRE NA 40892 35536
Source: Fourteenth Finance Commission’s Report and Finance Accounts 2015-16 and Budget at a Glance 2015-16 of Government of Odisha.
NPRE constituted 47 per cent of the total expenditure of the State during 2015-16. Its
ratio with Revenue Expenditure declined from 72 per cent in 2011-12 to 60 per cent in
the current year, an improvement over the previous period.

Finances of the State Government
Audit Report (State Finances)
for the year ended March 2016
17
1.7.5 Capital Expenditure
Capital Expenditure (CE) of the State, as proportion of Total Expenditure, increased
from 11 per cent (` 4496 crore) in 2011-12 to 22 per cent (` 17090 crore) in 2015-16.
However, CE (` 17090 crore) increased significantly (54 per cent) during 2015-16 over
the previous year (` 11075 crore) in absolute terms, mainly on account of increase in
expenditure on Roads and Bridges (` 3107 crore), Power Projects (` 802 crore),
Irrigation and Flood Control (` 1088 crore), Medical and Public Health (` 112 crore)
and Education, Sports, Arts and Culture (` 141 crore). The CE during 2015-16, was
5.14 per cent of GSDP against Government’s projection of 4.56 per cent in Budget
Estimate for 2015-16. The CE (` 17090 crore) decreased by ` 1559 crore against
Budget Estimate (` 18649 crore) during the year.
1.7.6 Parking of Government Fund outside Government Account
Supplementary Rule-242 of Odisha Treasury Code (OTC) Volume-I provides that no
money shall be drawn from the treasury unless it is required for immediate
disbursement. Rule-141 Sub Rule (3) of Odisha Budget Manual, 1963 provides that no
money should be withdrawn from the treasury unless it is required for immediate
payment. It is also not permissible to draw money from the treasury and keep it in banks
or Post Offices without the sanction of the Finance Department. Finance Department
(F.D) had also instructed (March 2015) not to park money in bank accounts.
On test check of records of 11 District Rural Development Agencies (DRDAs), 21
Block Development Offices (BDOs) and four Land Acquisition Offices (LAOs) it was
observed that funds amounting to ` 899 crore (Appendix-1.5 ) were parked in bank
accounts, violating the OTC codal provision and FD instructions. The issue of unspent
balance becomes important as the schemes are funded through borrowed funds,
attracting a significant interest burden.
The funds were kept in savings bank accounts of commercial banks which earned
interest of nearly four per cent. On the other hand, the State Government borrowed
` 4473 crore from the open market at the rates of interest varying between 8.08 to 8.48
per cent and also paid interest amounting to ` 319.42 crore on market loans during
2015-16. List of cases where the amount was more than ` 25 crore is given in Table
1.14:
Table No-1.14: Parking of scheme funds as on 31 March 2016
(₹ in crore)
Sl.No Scheme name Closing Balance
1 Indira Awas Yojana 97.75
2 Gopabandhu Gramin Yojana 77.28
3 Land Acquisition 324.89
4 National Old Age Pension 43.26
5 AWC Building 26.67
6 Schemes under State Finance Commission 27.65
7 MPLAD 26.39
Source: Compiled from information collected from DDOs
Finances of the State Government
18 Audit Report (State Finances)
for the year ended March 2016
Among DRDAs, parking of unspent balances was highest in DRDA, Balangir (` 54.82
crore) and lowest in DRDA, Cuttack (` 2.05 crore). In case of BDOs, the unspent
balance was highest in Cuttack Sadar (` 33.84 crore) and lowest in Koraput Sadar
(` 3.69 crore).
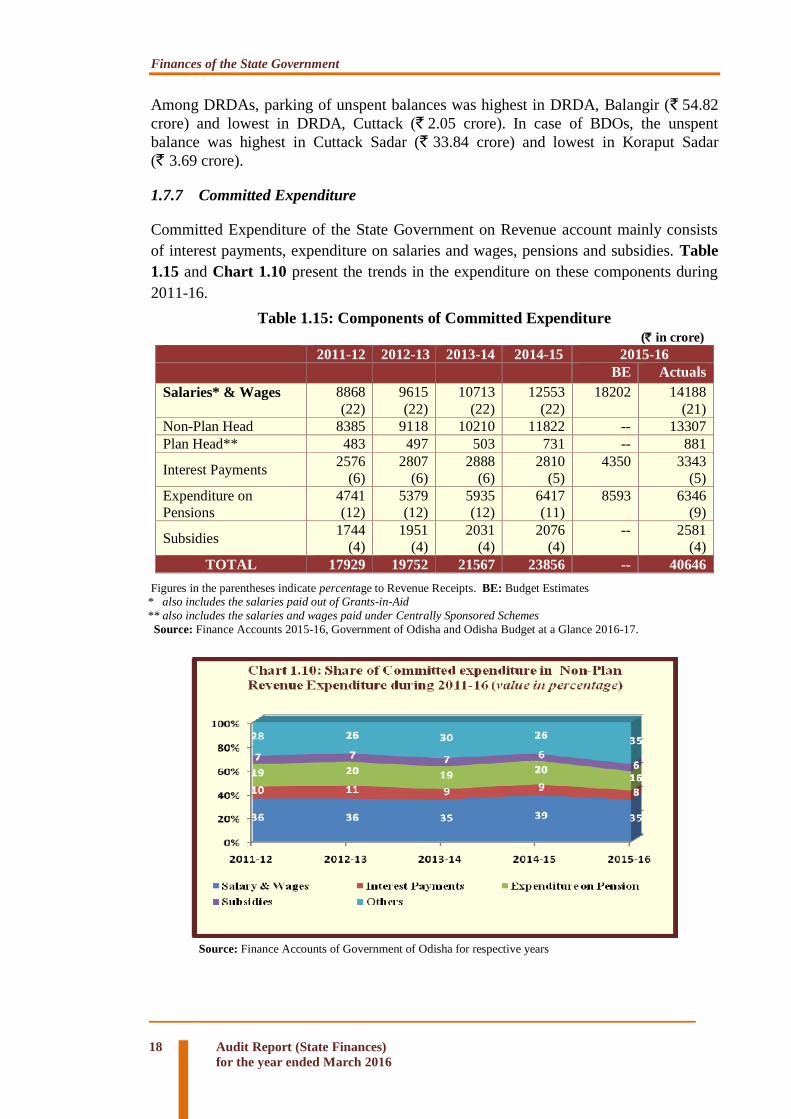
1.7.7 Committed Expenditure
Committed Expenditure of the State Government on Revenue account mainly consists
of interest payments, expenditure on salaries and wages, pensions and subsidies. Table
1.15 and Chart 1.10 present the trends in the expenditure on these components during
2011-16.
Table 1.15: Components of Committed Expenditure
(` in crore)
2011-12 2012-13 2013-14 2014-15 2015-16
BE Actuals
Salaries* & Wages
8868
(22)
9615
(22)
10713
(22)
12553
(22)
18202 14188
(21)
Non-Plan Head 8385 9118 10210 11822 -- 13307
Plan Head** 483 497 503 731 -- 881
Interest Payments 2576
(6)
2807
(6)
2888
(6)
2810
(5)
4350 3343
(5)
Expenditure on
Pensions
4741
(12)
5379
(12)
5935
(12)
6417
(11)
8593 6346
(9)
Subsidies 1744
(4)
1951
(4)
2031
(4)
2076
(4)
-- 2581
(4)
TOTAL 17929 19752 21567 23856 -- 40646
Figures in the parentheses indicate percentage to Revenue Receipts. BE: Budget Estimates * also includes the salaries paid out of Grants-in-Aid
** also includes the salaries and wages paid under Centrally Sponsored Schemes
Source: Finance Accounts 2015-16, Government of Odisha and Odisha Budget at a Glance 2016-17.
Source: Finance Accounts of Government of Odisha for respective years

Finances of the State Government
Audit Report (State Finances)
for the year ended March 2016
19
1.7.7.1 Salaries
Expenditure on salaries increased from ` 8868 crore in 2011-12 to ` 14188 crore in
2015-16. This accounted for nearly 21 per cent of Revenue Receipts and 61 per cent of
the NPRE of the State Government during the year. The expenditure on salary decreased
to 24 per cent of Revenue Expenditure during 2015-16 as against 25 per cent in 2014-
15.
1.7.7.2 Interest Payments
Interest payments during the current year (` 3343 crore) increased by ` 533 crore over
the previous year (` 2810 crore). During 2015-16, interest payment as a percentage of
total Revenue Receipts was five per cent.
1.7.7.3 Pensions
Expenditure on pension (` 6346 crore), which was 9 per cent of total Revenue Receipts
of the State during the year, increased by 34 per cent from ` 4741 crore in 2011-12 to
` 6346 crore in 2015-16. It decreased by ` 71 crore from ` 6417 crore in 2014-15 to
` 6346 crore in 2015-16. The decrease in the current year over the previous year was
mainly due to less expenditure under pensions on superannuation and other retirement
allowances to Government servants. The pension payment during the current year was
within the projection made by FFC (` 8592 crore) for the year.
The Government introduced a ‘Defined Contributory Pension Scheme’ for all
employees recruited on or after 1 January 2005 for managing the future pension liability.
The State Government has executed agreement with National Securities Depository
Limited (NSDL), Mumbai, the Central Record Keeping Agency appointed by the
Pension Fund Regulatory and Development Authority (PFRDA) as well as with New
Pension Scheme (NPS) Trust, New Delhi for smooth management of NPS. An amount
of ` 28.33 crore, being the employees’ contribution as well as employer’s contribution,
was kept under Public Account (8342-Other Deposits) for transfer to National Pension
Scheme (NPS) Trust. Thus, the State Government’s liability on this account was ` 28.33
crore as on 31 March 2016. This amount has not been transferred to NPS, thus defeating
the main objective of introducing the Defined Contributory Pension Scheme in order to
limit future pension liabilities.
1.7.7.4 Subsidies
For welfare of public at large, states provide subsidies/subventions to disadvantaged
sections of the society. Subsidies are dispensed not only explicitly but also implicitly by
providing subsidised public service to the people. Budgetary support to financial
institutions and poor recovery of user charges from social and economic services
provided by the Government fall in the category of implicit subsidies.
The State Government in its MTFP for 2007-08, had aimed to rationalise general
subsidy and reduce their overall volume gradually at a rate of 10 per cent per annum
beginning from 2005-06. However, the expenditure on subsidies increased from ` 1744
Finances of the State Government
20 Audit Report (State Finances)
for the year ended March 2016
crore in 2011-12 to ` 2581 crore (over 48 per cent) in 2015-16, which included food
subsidy of ` 1118 crore due to disbursement of rice at rupee one per kilogram to people
living below poverty line, ` 221 crore under Relief on account of Natural Calamities
which consisted mainly of assistance to farmers affected by floods/cyclone for purchase
of agricultural inputs etc, ` 30 crore under subsidy to Odisha Lift Irrigation Corporation
Limited and ` 194 crore interest subsidy/subvention to the Co-operative banks for
providing crop loan at five per cent interest per annum to the farmers.
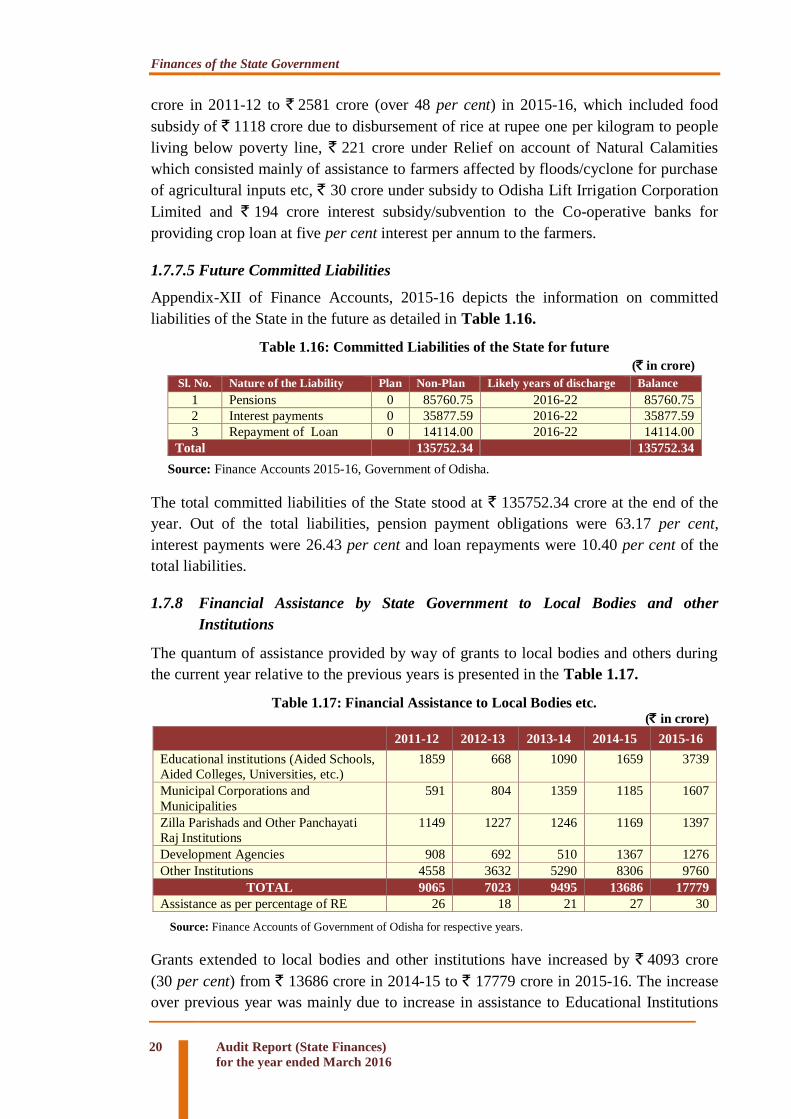
1.7.7.5 Future Committed Liabilities
Appendix-XII of Finance Accounts, 2015-16 depicts the information on committed
liabilities of the State in the future as detailed in Table 1.16.
Table 1.16: Committed Liabilities of the State for future
(` in crore)
Sl. No. Nature of the Liability Plan Non-Plan Likely years of discharge Balance
1 Pensions 0 85760.75 2016-22 85760.75
2 Interest payments 0 35877.59 2016-22 35877.59
3 Repayment of Loan 0 14114.00 2016-22 14114.00
Total 135752.34 135752.34
Source: Finance Accounts 2015-16, Government of Odisha.
The total committed liabilities of the State stood at ` 135752.34 crore at the end of the
year. Out of the total liabilities, pension payment obligations were 63.17 per cent,
interest payments were 26.43 per cent and loan repayments were 10.40 per cent of the
total liabilities.
1.7.8 Financial Assistance by State Government to Local Bodies and other
Institutions
The quantum of assistance provided by way of grants to local bodies and others during
the current year relative to the previous years is presented in the Table 1.17.
Table 1.17: Financial Assistance to Local Bodies etc. (` in crore)
2011-12 2012-13 2013-14 2014-15 2015-16
Educational institutions (Aided Schools,
Aided Colleges, Universities, etc.)
1859 668 1090 1659 3739
Municipal Corporations and
Municipalities
591 804 1359 1185 1607
Zilla Parishads and Other Panchayati
Raj Institutions
1149 1227 1246 1169 1397
Development Agencies 908 692 510 1367 1276
Other Institutions 4558 3632 5290 8306 9760
TOTAL 9065 7023 9495 13686 17779
Assistance as per percentage of RE 26 18 21 27 30
Source: Finance Accounts of Government of Odisha for respective years.
Grants extended to local bodies and other institutions have increased by ` 4093 crore
(30 per cent) from ` 13686 crore in 2014-15 to ` 17779 crore in 2015-16. The increase
over previous year was mainly due to increase in assistance to Educational Institutions

Finances of the State Government
Audit Report (State Finances)
for the year ended March 2016
21
(` 2080 crore), Other Institutions (` 1454 crore) and Municipal Corporations (` 422
crore) and Zilla Parishads and Other Panchayati Raj Institutions (` 228 crore) which
was partly set off by decrease in assistance to Development Agencies (` 91 crore),
resulting in increase in the share of grants and loans to the Revenue Expenditure from
27 per cent in 2014-15 to 30 per cent in 2015-16.
1.8 Quality of Expenditure
Availability of better infrastructure in the social, educational and health sector in the
State generally reflects the quality of expenditure. Improvement in the quality of
expenditure basically involves three aspects, viz., adequacy of the expenditure (i.e.
adequate provisions for providing public services), efficiency of expenditure use
(assessment of input–output relationship in terms of time etc.) and the effectiveness
(assessment of outlay-outcome relationships for selected services).
1.8.1 Adequacy of Public Expenditure
The expenditure responsibilities relating to the social sector and the economic
infrastructure assigned to the State Governments are largely State subjects. Enhancing
human development levels requires the States to step up their expenditure on key social
services like education, health etc. Low fiscal priority (ratio of expenditure under a
category to aggregate expenditure) is attached to a particular sector, if it is below the
respective national average. Table 1.18 analyses the fiscal priority of the State
Government with regard to Development Expenditure, Social Expenditure and Capital
Expenditure during 2015-16.
Table 1.18: Fiscal Priority and Fiscal Capacity of the State in 2012-13 and 2015-16 (In per cent)
Fiscal Priority by the State AE/GSDP DE#/AE SSE/AE ESE/AE CE/AE Education/AE Health/AE
General Category States’*
average (Ratio) 2012-13 14.14 70.03 38.47 29.70 13.70 17.72 4.72
Odisha State’s average (Ratio) 2012-13
17.27 123.77 36.72 32.68 12.76 16.57 4.00
General Category States’* average (Ratio) 2015-16
16.05 70.63 36.29 34.34 14.89 15.63 4.45
Odisha State’s average (Ratio)
2015-16 22.94 78.36 36.17 42.20 22.42 15.16 4.83
As per cent to GSDP
* General Category States excluding Goa and Puducherry
AE: Aggregate Expenditure, DE: Development Expenditure, SSE: Social Sector Expenditure, ESE: Economic Sector Expenditure,
CE: Capital Expenditure
# Development Expenditure includes Development Revenue Expenditure, Development Capital Expenditure and Loans &
Advance disbursed
From the above table, it may be seen that
The ratios of the AE to GSDP in 2012-13 and 2015-16 (17.27 per cent and 22.94
per cent) were higher in Odisha as compared to other General Category States
(GCS).

Finances of the State Government
22 Audit Report (State Finances)
for the year ended March 2016
Development Expenditure as a proportion of Aggregate Expenditure in Odisha
was also higher compared to the average of GCS during 2012-13 as well as in
2015-16. Development Expenditure consists of both Economic Service
Expenditure and Social Sector Expenditure.
Capital Expenditure as a proportion of Aggregate Expenditure in Odisha was
lower as compared to the average of GCS during 2012-13. However, in 2015-16,
Odisha spent a higher proportion on this account as compared to GCS. Increased
priority to physical capital formation will further increase the growth prospects
of the state by creating durable assets.
Fiscal priority given to education in Odisha was lower than other GCS in 2012-
13 and in 2015-16.
Fiscal priority given to health sector in Odisha during 2015-16 (4.83 per cent),
based on the proportion of Aggregate Expenditure, was higher than GCS.
However, it was lower in 2012-13 compared to GCS.
1.8.2 Efficiency of Expenditure use
Table 1.19 presents the trends in Development Expenditure relative to the Aggregate
Expenditure of the State during the current year vis-à-vis budget and the previous years,
Table 1.20 provides the details of Capital Expenditure and the components of Revenue
Expenditure incurred on the maintenance of the selected social and economic services.
Table 1.19: Development Expenditure (` in crore)
Components of
Development
Expenditure$
2011-12 2012-13 2013-14
2014-15 2015-16
(BE) (Actual)
Development Expenditure (a to c)
a. Development
Revenue Expenditure
(DRE)
23070
(58)
25173
(57)
31036 (58)
35790 (57)
NA 42831 (56)
b. Development Capital Expenditure (DCE)
4238 (11)
5271
(12)
7286
(14)
10685
(17)
18649 16665
(22)
c. Development Loans and Advances
401 (1)
142
(0.3)
364
(0.7)
260
(0.4)
NA 242
(0.3)
TOTAL 27709
(70)
30586
(69)
38687
(72)
46735
(75)
- 59738
(78)
Figures in parentheses indicate percentage to aggregate expenditure,
Source: Odisha Budget at a Glance 2015-16 and Finance Accounts 2015-16. $ The expenditure on social and economic services constitutes Development Expenditure.
Development expenditure comprising Revenue, Capital and expenditure on Loans and
Advances on socio-economic services increased from ` 23070 crore in 2011-12 to
` 42831 crore in 2015-16. As a percentage of total expenditure, it decreased from 58 per
cent in 2011-12 to 56 per cent in 2015-16.
It would be seen from the above that Development Revenue Expenditure which was
` 23070 crore during 2011-12 rose to ` 42831 crore during 2015-16, registering a
growth of nearly 86 per cent.

Finances of the State Government
Audit Report (State Finances)
for the year ended March 2016
23
During 2015-16, Development Revenue Expenditure increased by ` 7041 crore (20 per
cent) in absolute terms and Development Capital Expenditure increased by ` 5980 crore
(56 per cent) over the previous year.
The increase in Development Revenue Expenditure during 2015-16 over the previous
year was mainly due to increase under Education (` 1240 crore), Rural Employment
(` 1970 crore), Rural Development Programmes (` 977), Water Supplies and Sanitation
(` 937 crore), Urban Development (` 233 crore) and Health & Family Welfare
(` 476 crore). The increase in Capital Expenditure during 2015-16 over the previous
year was mainly due to increase in expenditure on Roads and Bridges (` 3106 crore),
Power Projects (` 802 crore), Irrigation and Flood Control (` 1088 crore), Health &
Family Welfare (` 112 crore) and Animal Husbandry (` 184 crore).
Table 1.20: Efficiency of expenditure in selected Social and Economic services
(In per cent) Sectors 2014-15 2015-16
Ratio of CE
to TE
In RE, the share of Ratio of CE
to TE
In RE, the share of
S &W O&M S&W O &M
Social Services (SS)
General Education 3.54 52.50 NA 2.94 54.57 NA
Health and Family Welfare 12.98 47.79 NA 3.08 49.38 NA
Water Supplies, Sanitation
& Housing & Urban
Development
24.99 4.75 22.65 5.86 3.31 0.45
TOTAL (SS) 9.58 34.02 2.04 17.13 44.34 NA
Economic Services (ES)
Agriculture & Allied
Activities
2.36 16.98 NA 2.10 18.08 NA
Irrigation and Flood Control 67.35 15.52 32.21 24.42 12.69 0.85
Power & Energy 16.47 10.67 7.38 8.19 6.73 NA
Transport 70.61 0.38 42.24 44.20 0.40 NA
Total (ES) 31.50 11.74 8.41 80.38 30.93 NA
TOTAL (SS+ES) 21.14 24.79 4.68 97.52 45.02 NA
TE: Total Expenditure; CE: Capital Expenditure; RE: Revenue Expenditure; S&W: Salaries and Wages; O&M: Operations &
Maintenance.
O&M figures are not available in General Education, Health and Family Welfare, Agriculture & Allied Activities and Transport
Departments.
Source: Finance Accounts of Government of Odisha
Access to basic education, health services, drinking water and sanitation facilities are
strong indicators of socio-economic progress. Further, expenditure on economic services
includes all such services that promote directly and indirectly productive capacity within
the State by improving the quality of human resources. Therefore, it is pertinent to make
an assessment with regard to expansion and efficient provision of these services in the
State. Table 1.20 summarises percentage of expenditure under different components of
social and economic services sectors incurred by the State Government in expanding
and maintaining social and economic services in the State during 2014-15 and 2015-16.
The share of Capital Expenditure to total expenditure decreased in respect of General
Education and Health & Family Welfare (in Social Services) and Irrigation and Flood
Control and Transport (in Economic Services) during 2015-16 as compared to the
previous year.

Finances of the State Government
24 Audit Report (State Finances)
for the year ended March 2016
As seen from Appendix-1.3, expenditure on Social Services during 2015-16 (` 27572
crore), constituting 36 per cent of total expenditure (` 76233 crore), increased by 19 per
cent over the previous year’s expenditure (` 23252 crore), while in Development
Expenditure (` 59497 crore), which was 78 per cent of total expenditure, there was an
increase of 27 per cent over the previous year (` 46735 crore). Revenue Expenditure on
salaries continued to share a dominant proportion of Revenue Expenditure on Social
Services (33.62 per cent). Capital Expenditure on Social Services relative to the total
expenditure showed an increase (4.69 per cent) over the previous year.
Expenditure on economic services includes all such expenditure that promotes directly
or indirectly, productive capacity within the State’s economy. During 2015-16, total
expenditure under economic services (` 31925 crore) increased by 20 per cent over
previous year. The expenditure on total economic services (` 31925 crore) accounted
for 42 per cent of total expenditure and 53 per cent of Development Expenditure.
1.8.3 Outcome Budget (Effectiveness of the Expenditure)
The concept of outcome budget is an important tool for effective Government
management and accountability. It is a performance measurement tool that helps in
better service delivery, decision-making, evaluating programme performance and
results, communicating programme goals, and improving programme effectiveness. The
exercise is primarily meant at converting financial outlays into measurable and
monitorable outcome. The idea is to make the programme implementing agencies more
result oriented by shifting the focus from 'Outlay' to 'Outcome'.
Outlay-outcome budgets of five departments viz. Fisheries & Animal Resources
Development, Rural Development, Energy, Agriculture and Works departments were
reviewed for the year 2015-16 and it was seen that the financial and physical targets
were not fully achieved (Appendix-1.6).
In Fisheries and Animal Resources Development Department, though the financial
target has been fully achieved, the physical target has not been achieved to that extent in
the following schemes:
In assistance to Matsyajibi Basagruha Yojana, the financial target was achieved
but the physical achievement was just three per cent (31 houses) of the target of
1066 houses. Though ₹ 8 crore was spent, only 31 houses were completed during
the period.
In Interest Subvention on Short Term Credit Support to Fish Farmers Scheme,
the financial target was fully achieved, but the physical target was not achieved.
The achievement was only 151.20 hectares (eight per cent) of land against target
of 2000 hectares of land.

Finances of the State Government
Audit Report (State Finances)
for the year ended March 2016
25
In interest Subvention on Long Term Credit Support to Fish Farmers Scheme,
the financial target has been fully achieved, but the physical target achieved was
349.47 hectares (35 per cent) against target of 1000 hectares.
In Rural Development Department, the financial and physical achievements are given
below:
In Mukhya Mantri Sadaka Yojana, against the financial target achievement of
` 19.50 crore, the physical target achieved was 27 per cent (136.14 Km
completed against the target of 500 Km).
In construction of buildings by Rural Development Department, the financial
target was ` 3.22 crore, whereas the physical target achieved was 40 per cent (84
out of the targeted 209 buildings).
In case of improvement of R.D. Roads, the physical target achievement was 37
per cent (15 out of the targeted 40 roads).
In construction of Bailey bridges, financial target was fully achieved, whereas
the physical target achievement was 45 per cent (41 out of the targeted 92
bridges).
In Energy Department, the financial and physical achievements are given below:
In State Capital Region Improvement of Power Scheme, the financial target was
fully achieved but physical progress of work was limited to engagement of
consultants by OPTCL.
In Agriculture Department, the financial and physical achievements are given below:
Under Development of Potato, Vegetable and Spices scheme, the financial
achievement for ‘Subsidised Sale of vegetable seeds’ was ` 9.84 crore (51 per
cent) against the targeted ` 19.23 crore, whereas the physical achievement was
five per cent (24922 seeds against the target of 500000 seeds).
In Works Department, the financial and physical achievements are given below:
In Odisha State Road Project (Externally Aided Project), the financial
achievement was ` 79.73 crore (30 per cent) against the target of ` 262.00 crore.
The physical achievement was only 32 per cent (improvement of 26 Km road
out of targeted 80 Km road).

Finances of the State Government
26 Audit Report (State Finances)
for the year ended March 2016
1.9 Financial Analysis of Government Expenditure and Investment
This section presents the broad financial analysis of investments and other Capital
Expenditure undertaken by the Government during the current year vis-à-vis previous
years.
1.9.1 Financial Results of Irrigation Works
The financial results of 62 irrigation projects (13-major and 49-medium projects) with a
Capital Expenditure of ` 4665.99 crore at the end of March 2016 showed that an
amount of ` 443.98 crore was realised from these projects during 2015-16 by way of
sale of water to industries. After meeting the working and maintenance expenditure of
` 281.91 crore and interest charges of ` 310.70 crore, the schemes suffered net loss of
` 148.64 crore.
1.9.2 Incomplete Projects
Blocking of funds on incomplete works affects quality of expenditure negatively. The
department-wise information pertaining to incomplete projects as on 31 March 2016 is
given in Table 1.21.
Table 1.21: Department-wise profile of incomplete projects.
(` in crore)
Name of
Department
No. of
incomplete
projects as
on
31/03/2015
Projects
identified
to be
completed
during
2015-16
Total No. of
projects
completed
during
2015-16
No. of
incomplete
projects as
on
31/03/2016
Initial
Budgeted
cost
Revised
cost of
projects
Cumulative
actual
expenditure
as on
31/03/2016
Works 29 79 108 90 18 270.43 269.46 211.82
H & UD 7 0 7 5 2 5.16 10.16 10.16
Skill
Development & Technical
Education
3 20 23 12 11 3513.96 3709.41 2100.61
TOTAL 39 99 138 107 31 3789.55 3989.03 2322.59
Source: Information collected from the respective Departments.
All the above 31 projects were incomplete due to the prolonged processes involved in
land acquisition, matters lying sub-judice in courts, non-eviction of encroachment of
land, change in the designs of bridges, shortage of funds and slow progress of work.
Due to non-completion of projects, not only the benefits that were to accrue to the
intended beneficiaries were delayed, but also the cost to the exchequer increased by
` 199.48 crore, due to time overrun involved in their completion.
1.9.3 Investment and Returns
As of March 2016, Government had invested ` 3881.32 crore in Statutory Corporations,
Rural Banks, Joint Stock Companies and Co-operatives. Average return on this
investment was 17.50 per cent in the last five years (14.26 per cent during 2015-16),

Finances of the State Government
Audit Report (State Finances)
for the year ended March 2016
27
while Government paid an average interest rate of 6.09 to 6.06 per cent on its
borrowings during 2011-12 to 2015-16 (Table 1.22).
Table 1.22: Return on Investment
(` in crore)
Year 2011-12 2012-13 2013-14 2014-15 2015-16
Investment at the end of the year 2908.07 2964.28 3308.79 3504.87 3881.32
Return 286.23 564.53 452.40 1076.44 553.36
Percentage of return 9.84 19.04 13.67 30.71 14.26
Average rate of interest on
Government borrowing
6.09 6.54 6.56 5.90 6.06
Difference between interest rate and return
(-)3.75 (-)12.50 (-)7.11 (-)24.81 (-)8.20
Source: Finance Accounts of Government of Odisha for respective years
The investment of State Government at the end of 2015-16 included ` 3881.32 crore in
Public Sector Undertakings (PSU) comprising Government Companies (` 2786.31
crore),Co-operative Societies (₹601.87 crore), Statutory Corporations (` 490.99 crore)
and others4 (₹2.15 crore).Of this investment, ₹2721.47 crore or 70 per cent of the total
investment fetched no return by way of dividend. The dividend of ` 553.36 crore was
received on investment of ₹1159.85 crore (or 30 per cent of total investment) on 12
PSUs during 2015-16, which included one Co-operative Society5, nine Government
Companies6 ,one Rural Bank7 and one Statutory Corporation8 . Only one PSU, the
Odisha Mining Corporation contributed as much as ` 500 crore or 90 per cent of the
total dividend.
As per information furnished in the Odisha Budget at a Glance 2015-16, Grid
Corporation of Odisha Limited (GRIDCO) with accumulated loss of ` 3475.81 crore,
Odisha State Financial Corporation (OSFC) with accumulated loss of ` 476.90 crore,
and Odisha Forest Development Corporation (OFDC) with accumulated loss of ` 18.22
crore were among the major loss incurring PSUs in the State up to 2014-15.
The return on investment was higher as Odisha Mining Corporation (OMC) made a
profit of ` 2727.86 crore during the year. The other profit making PSUs were Odisha
Power Generation Corporation (OPGC with ` 1150.57 crore), Industrial Development
Corporation (IDCO with ` 634.83 crore), Odisha Hydro Power Corporation (OHPC
with ` 578.12 crore) and Odisha State Beverage Corporation (OSBC with ` 237.65
crore). During the year 2015-16, the Government invested ` 96.50 crore in Angul-
Sukinda Railways Limited (` 46.50 crore), and Khurda-Bolangir Rail Link (` 50.00
crore) for completion of railways lines.
4 Other Joint Stock Companies and Partnerships (₹ 1.25 crore) & Rural Banks (₹ 0.90 crore)
5 Co-operative Society: Credit Co-operatives: ₹ 0.42 crore.
6 Government Companies: Odisha Mining Corporation Limited : ₹ 500.00 crore, Industrial Development Corporation Limited(IDCOL): ₹ 0.19 crore, Odisha Forest Development Corporation Limited: ₹ 1.20 crore,
Odisha State Cashew Development Corporation Limited: ₹ 0.31 crore, Odisha State Police Housing and
Welfare Corporation ₹ 6.32 crore, Odisha Construction Corporation Limited(OCC) ₹ 1.16 crore, Odisha
Hydro Power Corporation: ₹ 4.68 crore, Odisha Power Generation Corporation Limited: ₹ 18.75 crore and Odisha State Beverage Corporation Limited : ₹ 16.88 crore,
7 Rural Bank: Odisha State Co-operative Bank: ₹ 0.19 crore
8 Statutory Corporation: Odisha State Warehousing Corporation, Bhubaneswar: ₹ 3.14 crore

Finances of the State Government
28 Audit Report (State Finances)
for the year ended March 2016
1.9.4 Loans and Advances by State Government
In addition to investments in Co-operative Societies, Corporations and Companies,
Government has also been providing loans and advances to many of these institutions/
organisations. Loans and advances by the State Government increased by ` 108 crore
from ` 4449 crore in 2014-15 to ` 4557 crore in 2015-16. During the year, Government
advanced loans amounting to ` 337 crore and ` 228 crore was repaid by the loanee
entities. Major portion of loans advanced during 2015-16 was to Energy sector (` 130
crore), Agriculture sector (` 125 crore) and Government servants (` 90 crore). Table
1.23 presents outstanding loans and advances as on 31 March 2016 and interest receipts
vis-à-vis interest payments during the last four years.
Table 1.23: Average Interest Received on Loans Advanced by the State Government (` in crore)
Quantum of Loans/Interest
Receipts/ Cost of Borrowings
2011-12 2012-13 2013-14 2014-15 2015-16
Opening Balance 3414 3903 3977 4183 4449
Amount advanced during the year 621 216 463 358 337
Amount repaid during the year 132 142 257 92 228
Closing Balance 3903 3977 4183 4449 4557
Of which outstanding balance for
which terms and conditions have
been settled
Net addition (+)489 (+)74 (+)206 (+)266 (+)109
Interest Receipts 16 16 610 14 181
Interest Receipts as a percentage
to outstanding Loans and
advances
0.41 0.40 14.58 0.31 3.97
Interest Payments as a percentage
to outstanding Fiscal Liabilities of
the State Government.
6.07 6.48 6.46 5.57 5.59
Difference between Interest
Payments and Interest Receipts
(per cent)
(-)5.66 (-)6.08 (+)8.12 (-)5.26 (-)1.62
Source: Finance Accounts of Government of Odisha for respective years
Loans outstanding as of 31 March 2016 aggregated ` 4557 crore. Of the total
outstanding loans, terms and conditions for loan amount of ` 1533.79 crore are yet to be
settled. Scrutiny of the total outstanding loans showed that loan amounts ranging from
` 3251 crore to ` 4013 crore during 2011-12 to 2015-16 relating to 11 departments were
marginally repaid. Table 1.24 shows that closing balances remained at static levels
indicating marginal repayment.

Finances of the State Government
Audit Report (State Finances)
for the year ended March 2016
29
Table 1.24: Loans and Advances rolling for a long time (` in crore)
Sl. No. Name of Department 2011-12 2012-13 2013-14 2014-15 2015-16
1 Education 6.05 6.11 6.34 6.04 4.41
2 Housing & Urban
Development
639.68 637.25 625.25 625.73 624.92
3 Information & Public
Relation (I & PR)
0.54 0.54 0.54 0.54 0.54
4 ST, SC Dev. and Minorities
and Backward Classes
Welfare
13.56 13.56 13.56 11.25 11.25
5 Agriculture 49.54 49.46 49.46 31.62 31.62
6 Fisheries & Animal
Resources Development
19.21 19.21 19.21 19.40 14.38
7 Co-operation 83.67 81.22 78.45 72.58 41.00
8 Water Resources 6.09 6.01 5.93 5.85 5.78
9 Energy 2218.86 2296.20 2849.13 2849.13 3098.30
10 Micro Small and Medium
Enterprises (Industries)
206.04 209.25 168.12 167.51 173.20
11 Finance 7.34 7.34 7.34 7.34 7.34
Total 3250.58 3326.15 3823.33 3796.99 4012.74
Source: Finance Accounts of Government of Odisha for respective years.
As seen from above, in two cases (I & PR and Finance Department), the loans and
advances remained constant over the last five years. In four cases (Education, ST, SC
Dev. and Minorities and Backward Classes Welfare, Fisheries & Animal Resources
Development and Water Resources Departments), the repayment of loan was negligible.
Further, it was observed that loans amounting to ` 243.36 crore relating to 23 loanee
entities remained in arrears for long periods as detailed in Table 1.25.
Table 1.25: Arrear of loans from loanee entities (` in crore)
Sl.
No.
Name of the Loanee entity Amount of arrears as
on March 2016
Earliest period to
which arrears relate
1 The Odisha Film Development Corporation Limited 1.28 2008-09
2 Industrial Development Corporation of Odisha Limited
78.20 Not mentioned
3 Tribal Development Co-operative Corporation of Odisha Ltd.(TDCCOL)
42.54 1985-86
4 National Institute of Social Work and Social Science
(NISWASS)
3.62 01/04/1997
5 Odisha State Road Transport Corporation 1.81 2002-03
6 Odisha Textiles Mills, Chaudwar 25.89 1995-96
7 Odisha State Co-operative Milk Producers’
Federation, Bhubaneswar
10.00 2009-10
8 Odisha State Textiles Corporation (Bhaskar Textiles
Mills, Jharsuguda)
7.71 1986-87
9 Odisha State Co-operative Handicraft Corporation Limited
2.11 2005-06
10 Odisha Weavers’ Co-operative Spinning Mills, Tora, Baragarh
1.05 2005-06
11 Gopinath Weavers’ Co-operative Spinning Mills,
Baliapala
4.40 2005-06

Finances of the State Government
30 Audit Report (State Finances)
for the year ended March 2016
Sl.
No.
Name of the Loanee entity Amount of arrears as
on March 2016
Earliest period to
which arrears relate
12 Utkal Weavers’ Co-operative Spinning Mills,
Khurda
7.00 2005-06
13 Sarala Weavers’ Co-operative Spinning Mills, Tirtol 2.73 2005-06
14 Kalinga Weavers’ Co-operative Spinning Mills,
Dhenkanal
2.47 2005-06
15 Odisha State Handicrafts Corporation 2.11 2005-06
16 Gangpur Weavers’ Co-operative Spinning Mills,
Kerei
21.50 1995-96
17 Sambalpuri Bastralaya 6.90 2009-10
18 Odisha State Co-operative Spinning Mills Federation
Ltd.,Bhubaneswar
4.80 1980-81
19 Odisha Cotton Textiles Processing Unit, Jagatpur 3.53 1980-81
20 Konark Cotton Growers’ Co-operative Spinning
Mills, Kesinga, Kalahandi
5.80 2003-04
21 Madhu Nagar Powerloom Weavers’ Co-operative Societies
1.25 1961-62
22 Primary Handloom Weavers’ Co-operative Societies
Ltd.
3.24 1959-60
23 Sri Jagannath Weavers’ Co-operative Spinning Mills,
Nuapatna
3.42 1985-86
243.36
Source: Finance Account 2015-16 of Government of Odisha
It was further observed that fresh loans of ` 48.75 crore were advanced during 2015-16
to Grid Corporation of Odisha Limited (GRIDCO) from whom repayment of earlier loan
to the extent of ` 1988.95 crore was in arrears. Reason for disbursement during the
current year was not explained.
Interest receipts increased from ` 16 crore in 2011-12 to ` 181 crore during the current
year. Similarly, interest received against the total outstanding loans and advances
increased from 0.41 per cent in 2011-12 to 3.97 per cent in 2015-16. While interest
payment during 2015-16 was 5.59 per cent of its outstanding fiscal liabilities, the
interest received was 3.97 per cent of the outstanding loans and advances. As a result,
interest spread of Government borrowings was negative during the year which meant
that the State’s borrowings were more expensive than the loans advanced by it.
1.9.5 Cash Balances and Investment of Cash Balances
Table 1.26 depicts the cash balances and investments made by the State Government
out of cash balances during 2015-16. Total investment out of cash balances during 2015-
16 were ` 5836.24 crore, major portion of which was in ‘14 days Government of India
Treasury Bills (` 5775.24 crore)’. On these investments, the Government earned interest
of ` 365.34 crore during the current year. Cash balance at the close of the current year
increased from ` 9993.57 crore of the previous year to ` 12047.68 crore during the
current year and was reflected in cash balance investment accounts as follows:

Finances of the State Government
Audit Report (State Finances)
for the year ended March 2016
31
Table 1.26: Cash balance and investment of cash balance
(` in crore)
Opening balance on
1/4/2015
Closing balance on
31/3/2016
(a) General Cash Balance -
Cash in Treasuries -- --
Deposits with Reserve Bank 578.65 666.99
Deposits with other Banks -- --
Remittances in transit - Local -- --
Investments held in Cash Balance
investment account
3870.55 5836.24
Total (a) 4449.20 6503.23
(b) Other Cash Balances and Investments
Cash with departmental officers viz. Public
Works Department Officers, Forest
Department Officers, District Collectors
21.04 21.12
Permanent advances for contingent
expenditure with departmental officers
0.33 0.33
Investment of earmarked funds 5523.00 5523.00
Total (b) 5544.37 5544.45
Grand total (a)+ (b) 9993.57 12047.68
Source: Finance Accounts 2015-16, Government of Odisha.
The State Government maintained more than the mandated minimum cash balance
(` 1.28 crore) including the cash balance investment in GoI treasury bills with the
Reserve Bank of India as on 31 March 2016. One option for prudent financial
management would be to maintain optimum cash balances and use the surplus to settle
some of the high cost bonds instead of investing the same in GoI Treasury bills with
Reserve Bank of India at a relatively lower rate (five per cent) of interest. The State
Government’s closing debt stocks of 2015-16 included a few high interest bearing loans
like 8.03 per cent on Odisha Government Loan (OGL) 2020 (` 1000 crore), 8.08 per
cent on OGL 2020 (` 1000 crore), 8.38 per cent on OGL 2026 (` 1500 crore), 8.48 per
cent on OGL 2021 (₹ 1000 crore) and nine per cent on Special Security to National
Small Savings Scheme (NSSF) of Government of India (` 11650 crore). The ThFC had
recommended (paragraph 7.127) that States with large cash balances should make
efforts towards utilising their cash balances before resorting to fresh borrowings.
Analysis of Cash Balance
The primary reason for accumulation of cash balances is borrowing more than the fiscal
deficit. The excess borrowings can be partially attributed to high inflow from NSSF.
Other factors also contribute to cash balance of the State. One of them is the mechanism
of release of Central assistance, wherein grants are released to the State leading to a
temporary build-up of cash balances that get used in due course of time. Transfer of
unspent fund to deposit accounts maintained in the Public Account at the end of
financial year leads to build-up of cash balance.
Efficient debt management is an essential part of the cash management. With reduced
fiscal deficit, it is essential that State follows the practice of borrowing on requirement
rather than on availability. Further, ThFC also had suggested that there should be
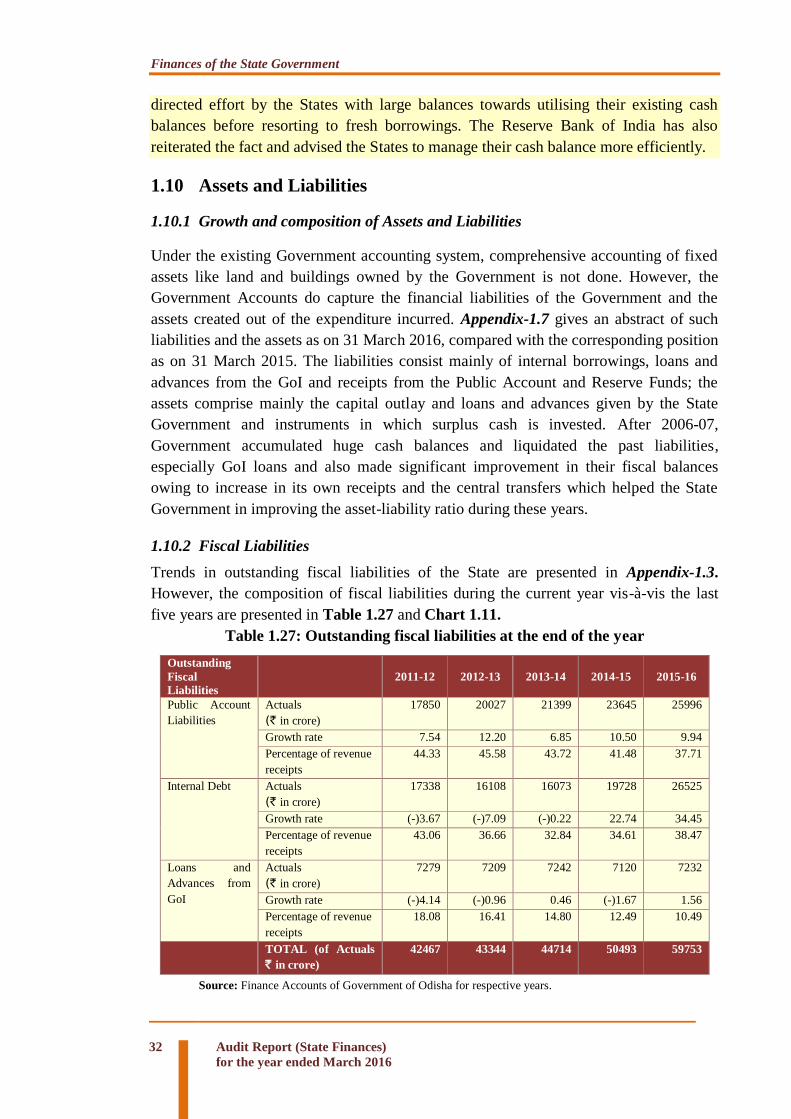
Finances of the State Government
32 Audit Report (State Finances)
for the year ended March 2016
directed effort by the States with large balances towards utilising their existing cash
balances before resorting to fresh borrowings. The Reserve Bank of India has also
reiterated the fact and advised the States to manage their cash balance more efficiently.
1.10 Assets and Liabilities
1.10.1 Growth and composition of Assets and Liabilities
Under the existing Government accounting system, comprehensive accounting of fixed
assets like land and buildings owned by the Government is not done. However, the
Government Accounts do capture the financial liabilities of the Government and the
assets created out of the expenditure incurred. Appendix-1.7 gives an abstract of such
liabilities and the assets as on 31 March 2016, compared with the corresponding position
as on 31 March 2015. The liabilities consist mainly of internal borrowings, loans and
advances from the GoI and receipts from the Public Account and Reserve Funds; the
assets comprise mainly the capital outlay and loans and advances given by the State
Government and instruments in which surplus cash is invested. After 2006-07,
Government accumulated huge cash balances and liquidated the past liabilities,
especially GoI loans and also made significant improvement in their fiscal balances
owing to increase in its own receipts and the central transfers which helped the State
Government in improving the asset-liability ratio during these years.
1.10.2 Fiscal Liabilities
Trends in outstanding fiscal liabilities of the State are presented in Appendix-1.3.
However, the composition of fiscal liabilities during the current year vis-à-vis the last
five years are presented in Table 1.27 and Chart 1.11.
Table 1.27: Outstanding fiscal liabilities at the end of the year
Outstanding
Fiscal
Liabilities
2011-12 2012-13 2013-14 2014-15 2015-16
Public Account
Liabilities
Actuals
(` in crore)
17850 20027 21399 23645 25996
Growth rate 7.54 12.20 6.85 10.50 9.94
Percentage of revenue
receipts
44.33 45.58 43.72 41.48 37.71
Internal Debt Actuals
(` in crore)
17338 16108 16073 19728 26525
Growth rate (-)3.67 (-)7.09 (-)0.22 22.74 34.45
Percentage of revenue
receipts
43.06 36.66 32.84 34.61 38.47
Loans and
Advances from
GoI
Actuals
(` in crore)
7279 7209 7242 7120 7232
Growth rate (-)4.14 (-)0.96 0.46 (-)1.67 1.56
Percentage of revenue
receipts
18.08 16.41 14.80 12.49 10.49
TOTAL (of Actuals
` in crore)
42467 43344 44714 50493 59753
Source: Finance Accounts of Government of Odisha for respective years.

Finances of the State Government
Audit Report (State Finances)
for the year ended March 2016
33
Source: Finance Accounts of Government of Odisha for respective years.
Fiscal liabilities as on 1 April 2015 stood at ` 50493 crore comprising internal debt of
` 19728 crore (39 per cent), Public Account liability of ` 23645 crore (47 per cent) and
loans and advance of ` 7121 crore (14 per cent) from GoI. However, these increased by
` 9259 crore to ` 59753 crore as of 31 March 2016. The fiscal liabilities comprised
internal debt of ` 26525 crore (44 per cent), public account liability of ` 25996 crore
(44 per cent) and loans and advances of ` 7232 crore (12 per cent) as at the end of
2015-16. The internal debt of ` 26525 crore comprised mainly of market loans bearing
interest (` 8128 crore), loans from National Bank for Agriculture and Rural
Development (` 6671 crore) and special securities issued to National Small Savings
Fund (` 11650 crore). The fiscal liabilities at the end of 2015-16 constituted 18 per cent
of GSDP which is two per cent more than previous year.
1.10.3 Status of Guarantees – Contingent Liabilities
Guarantees are contingent liabilities on the Consolidated Fund of the State in case of
default by the borrower for whom the guarantee has been extended by the State
Government.
The maximum amount for which guarantees were given by the State and outstanding
guarantees as per the Finance Accounts for the last three years is given in Table 1.28.

Finances of the State Government
34 Audit Report (State Finances)
for the year ended March 2016
Table 1.28: Guarantees given by the Government of Odisha
(` in crore)
Guarantees 2011-12 2012-13 2013-14 2014-15 2015-16
Maximum amount guaranteed 10578.61 10578.61 10624.61 10885.61 10890.61
Outstanding amount of guarantees 2510.43 2251.23 1705.26 1671.77 1290.26
Percentage of maximum amount guaranteed to total Revenue Receipt of
current year (percentage)
26.27 24.08 21.71 19.10 15.80
Percentage of outstanding guarantee to total Revenue Receipt of 2nd preceding year less Grants-in-Aid as provided in the
MTFP (in percentage)
12.12 8.50 5.31 4.51 3.18
Source: Finance Accounts of Government of Odisha for respective years.
The outstanding guarantees decreased by 23 per cent from ` 1672 crore in 2014-15 to
` 1290 crore in 2015-16. Guarantees were given in respect of Power sector (4), Co-
operatives sector (42), Housing & Urban Development (86), Irrigation sector (1), Roads
and Transport sector (2), State Financial Corporation sector (7) and other infrastructure
(16). Government in their resolution (March 2004) had issued instruction to the Public
Sector Undertakings/Urban Local Bodies/Co-operative Societies etc, who had borrowed
or intended to borrow against Government guarantees to open an Escrow Account in a
Nationalised Bank for timely repayment of guaranteed loans. During 2015-16, 14 new
escrow accounts have been opened.
To provide for sudden discharge of State’s obligation on guarantees, Twelfth Finance
Commission (TFC) had recommended that States should set up Guarantee Redemption
Fund through earmarked guarantee fees. The Government set up a “Guarantee
Redemption Fund” during 2002-03 to meet the contingent liabilities arising out of the
total outstanding liabilities. However, there was no transaction since 2008-09 though
there were guarantee commission receipts and expenditure on account of discharge of
guarantee obligation. As on 31 March 2016, ` 480 crore remained invested in the fund.
Further, in consideration of the guarantee given by the Government, the institutions in
some cases are required to pay guarantee commission at rates varying from 0.01 per
cent to one per cent. As per information furnished to Audit, ` 173.21 crore was received
as Guarantee Commission or fee against the arrear of ` 304.73 crore as shown in Table
1.29.
Table 1.29: Guarantee Commission received/to be received by the Government.
(` in crore)
Name of the Sector Commission Received Commission Receivable
Power 135.23 234.58
Co-operatives 2.03 4.04
Irrigation -- --
State Financial Corporation 2.88 8.51
Housing and Urban Development 26.81 40.95
Roads and Transport 1.84 1.84
Other Infrastructure 4.42 13.55
Any Other -- 1.26
TOTAL 173.21 304.73
Source: Finance Accounts 2015-16, Government of Odisha.

Finances of the State Government
Audit Report (State Finances)
for the year ended March 2016
35
1.10.4 Transactions under Reserve fund
i) Consolidated Sinking Fund (CSF): Twelfth Finance Commission had recommended
that States should set up Sinking Funds for amortization of all loans including loans
from banks, liabilities on account of National Small Savings Fund etc. which should not
be used for any other purpose, except for redemption of Loans. Guarantee Redemption
Fund is meant for discharge of the States’ obligations on Guarantee. The State
Government is required to contribute a minimum of 0.5 per cent of the total liabilities
outstanding at the beginning of the year to the Fund. The State Government has raised
debt amounting to ` 50493.34 crore, out of which, ` 4564.85 crore constituted market
loans. Accordingly, the amount due to be contributed to the Fund was ` 252.47 crore (at
the rate of 0.5 per cent of total liabilities at the beginning of the year) in terms of the
recommendations of the Twelfth Finance Commission. However, the State Government
did not contribute any amount to the Fund during the year. Consequently, the Revenue
Surplus during the year was overstated by ` 252.47 crore.
ii) Guarantee Redemption Fund (GRF): Guarantee Redemption Fund was constituted
in the year 2002-03 as per recommendation of the Twelfth Finance Commission with a
corpus of ` 20 crore. The balance at the credit of the fund as on 31 March 2016 (` 480
crore) has been invested in Government of India securities by the Reserve Bank of
India. The Government of Odisha has not made any contributions to the Fund during
2015-16.
iii) State Disaster Response Fund (SDRF): As per recommendation of the ThFC the
State Disaster Response Fund was constituted in 2010-11. In terms of the guidelines,
the Centre and State Governments are required to contribute to the fund in the ratio of
75:25. Accordingly, the Centre contributed ` 560.25 crore towards SDRF and ` 574.69
crore from NDRF. The State Government contributed ` 186.75 crore to the Fund during
2015-16. The balance in the Fund as on 31 March 2016 was ` 308.87 crore after
incurring an expenditure amount of ` 879.77 crore during the year.
iv) Funds for Protection of Interest of Depositors: The State Government created a
new fund in 2014-15 viz., “Fund for Protection of Interest of Depositors” with a corpus
of ` 300 crore to safeguard the interest of small and genuine depositors of the State. The
Fund has to be maintained in the Public Account under section ‘Reserve Funds not
bearing interest’. No expenditure was made out of the Fund during 2015-16.
1.10.5 Inoperative Reserve Funds
Ten reserve funds have been created and maintained in the accounts of the State
Government. Out of these, nine funds were inoperative or dormant for significant period
and one reserve fund (Consumer Welfare Fund) was created in 2012-13. The details of
Reserve Funds are given in Table 1.30.

Finances of the State Government
36 Audit Report (State Finances)
for the year ended March 2016
Table 1.30: Inoperative Reserve Funds
(` in lakh)
Sl.
No. Major and Minor heads with nomenclature
No. of Reserve
Funds
Balance as on
31.03.2016
Year of last
transaction
1 8011-Insurance and Pension Funds
105-State Government Insurance Fund
01
Cr.
0.07
2003-04
2 8012-Special Deposit and Accounts
123-Special Deposit for Employees Provident
Fund Scheme (Administration Fund)
01 Cr. 1.63 2002-03
3 8013-Other Deposits and Accounts
01-Deposit Schemes for Retiring Employees
101-Deposit Scheme for Retiring Govt.
Employees, 1989
01
Cr.
38.81
1997-98
4 8121-General and Other Reserve Fund
101-General and Other Reserve Funds –
Government Commercial Departments and
Undertakings.
01 Cr. 1.88 1996-97
5 8229-Development and Welfare Funds
109-Co-operative Development Funds, State
Co-operative Development Fund
123- Consumer Welfare Fund
02
Cr.
Cr.
2.00
26.00
1959-60
2012-13
6 8235-General and Other Reserve Funds
102-Zamindary Abolition Fund
103-Religious and Charitable Endowment
Funds
200-Other Funds: -
Guarantee Reserve Fund
Passengers Amenities Reserve Fund
04
Cr.
Cr.
Cr.
Cr.
59.19
1.51
110.88
6.00
1994-95
1983-84
1997-98
1982-83
TOTAL 10 247.97
Source: Finance Accounts of Government of Odisha 2015-16 (Volume-1)
Out of the above ten Reserve Funds, nine have remained inoperative for periods ranging
from 11 to 56 years.
1.11 Debt Sustainability
Apart from the magnitude of the debt of the Government, it is important to analyse the
various indicators that determine the debt sustainability of the State. This section
assesses the sustainability of debt of the Government in terms of rate of growth of
outstanding debt, ratio of interest payment and revenue receipt, debt repayment and debt
receipt and net debt available to the State. Table 1.31 analyses the debt sustainability of
the State according to these indicators for the period of five years beginning from 2011-
12.
Table 1.31: Debt Sustainability
(` in crore)
Debt Sustainability 2011-12 2012-13 2013-14 2014-15 2015-16
Outstanding public Debt 24618 23317 23314 26849 33757
Rate of growth of outstanding Public Debt (-)3.81 (-)5.28 (-)0.01 15.16 25.73
GSDP 225283 255273 277271 309807 332329
Rate of Growth of GSDP 14.05 13.31 8.62 11.73 7.27
Average interest Rate of Outstanding Debt(Interest
paid/OB of Public Debt + CB of Public Debt/2) 6.08 6.54 6.56 5.90 6.06
Percentage of Interest to Revenue Receipt 6.40 6.39 5.90 4.93 4.85
Percentage of Debt Payment to Debt Receipt 97.10 92.80 90.34 68.53 59.36
Net Debt available to the State 276 878 1369 5780 9260
(Source: State Finance Accounts of the respective years.)

Finances of the State Government
Audit Report (State Finances)
for the year ended March 2016
37
Public Debt of the State Government increased from ` 24618 crore in 2011-12 to
` 33757 crore in 2015-16, registering an increase of 37.12 per cent during the period
2011-16.The rate of growth ranged between (-) 0.01 per cent and 25.73 per cent over the
period 2011-12 to 2015-16. Public Debt increased at the rate of 25.72 per cent in 2015-
16 as compared to 15.16 per cent in previous year, which is mainly due to debt
amounting to ` 4473 crore (Odisha Government Loans).
Rate of growth of GSDP registered a decreasing trend from 14.05 per cent in 2011-12 to
7.27 per cent in 2015-16 but was still higher than the average rate of interest of public
debt which ranged between 5.90 per cent and 6.56 per cent over the period 2011-
2016.The State needs to step up its resource mobilisation efforts to ensure prudent fiscal
situation rather than depend on debt receipts.
Interest payment as a percentage of revenue receipt decreased from 6.40 per cent in
2011-12 to 4.85 per cent in 2015-16, which shows that the interest payment on public
debt was decreasing, resulting in more availability of funds for development.
Debt repayment as a percentage of Debt receipt showed a decreasing trend from 97.10
per cent in 2011-12 to 59.36 per cent in 2015-16, indicating that public debt receipt was
higher than public debt payment, resulting in higher dependency on debt receipt rather
than own sources of revenue.
1.12 Fiscal Imbalances
Three key fiscal parameters - Revenue, fiscal and primary deficits - indicate the extent
of overall fiscal imbalances in the finances of the State Government during a specified
period. The deficit in the Government Account represents the gap between its
expenditure and receipts. This section presents the trends, nature, magnitude and the
manner of financing these deficits and also the assessment of actual levels of Revenue
and fiscal deficits for the financial year 2015-16.
1.12.1 Trends in Deficits/Surpluses
Table 1.32, Chart 1.12 and 1.13 present the trends in deficits/surpluses indicators over
the period 2011-16.
Table 1.32: Deficits/Surpluses
2011-12 2012-13 2013-14 2014-15 2015-16
Revenue deficit (RD) (-)/ surplus (+)
(` in crore)
(+)5607 (+)5699 (+)3329 (+)5862 (+)10135
Fiscal deficit (FD) (-)/ surplus (+)
(` in crore)
(+)622 (+)3 (-)4633 (-)5479 (-)7064
Primary deficit (PD) (-)/ surplus (+) (` in
crore)
(+)3198 (+)2810 (-)1745 (-)2669 (-)3721
RD/GSDP (per cent) (+)2.54 (+)2.27 (+)1.22 (+)1.89 (+)3.05
FD/GSDP (per cent) (+)0.28 (+)0.00 (-)1.70 (-)1.76 (-)2.13
PD/GSDP (per cent) (+)1.45 (+)1.12 (-)0.63 (-)0.86 (-)1.12
Source: Finance Accounts of Government of Odisha for respective years

Finances of the State Government
38 Audit Report (State Finances)
for the year ended March 2016
0.28 0.00
-1.70 -1.70 -2.13
1.45 1.12
-0.64 -0.86 -1.12
2.542.27
1.22
1.89
3.05
-3
-2
-1
0
1
2
3
4
2011-12 2012-13 2013-14 2014-15 2015-16
Chart 1.13: Trends in deficit indicators relative to
GSDP (in percentage)
FD/GSDP PD/GSDP RD/GSDP
Source: Finance Accounts of Government of Odisha for respective years.
Revenue Surplus/Deficit
Revenue Surplus represents the difference between Revenue Receipts and Revenue
Expenditure. Revenue surplus helps to reduce the borrowings. In 2005-06, after a gap of
22 years, the State was able to attain a Revenue surplus of ` 481 crore and has
continued to be a Revenue surplus State. During 2015-16, revenue receipts grew 21 per
cent against a growth rate of 15 per cent by revenue expenditure, resulting in revenue
surplus being increased by ` 4273 crore as compared to previous year. The achievement
was in line with the State’s FRBM (Amendment) Act, 2011 which had prescribed
reduction of Revenue deficit to zero for the financial year 2011-12 onwards.
Fiscal Surplus/Deficit
Fiscal Surplus of three crore in 2012-13 turned into Fiscal Deficit of ` 7064 crore during
2015-16, mainly on account of steep increase in the capital expenditure by the State.
However, Fiscal Deficit (` 7064 crore) was within the State’s FRBM (Amendment) Act,
2011 target of not more than three per cent of GSDP (` 9970 crore).
Primary Surplus/Deficit
The Primary Deficit of ` 2669 crore in 2014-15 increased to ` 3721 crore during the
current year. While Fiscal Deficit represents the need for additional resources in general,
a part of such resources may be needed to finance interest payment. Interest payment
represents the expenditure of past obligation and is independent of current allocative
priorities. During 2015-16, the Fiscal Deficit was almost twice the interest payment.
This meant that around 50 per cent of the fiscal deficit was due to revenue expenditure
other than interest payment. Hence prudent reduction of revenue expenditure could
enable the State Government to attain primary surplus.
1.12.2 Components of Fiscal Deficit/Surplus and its Financing / Investing Pattern
The financing / investing pattern of fiscal deficit/surplus underwent a compositional
shift as reflected in the Table 1.33.
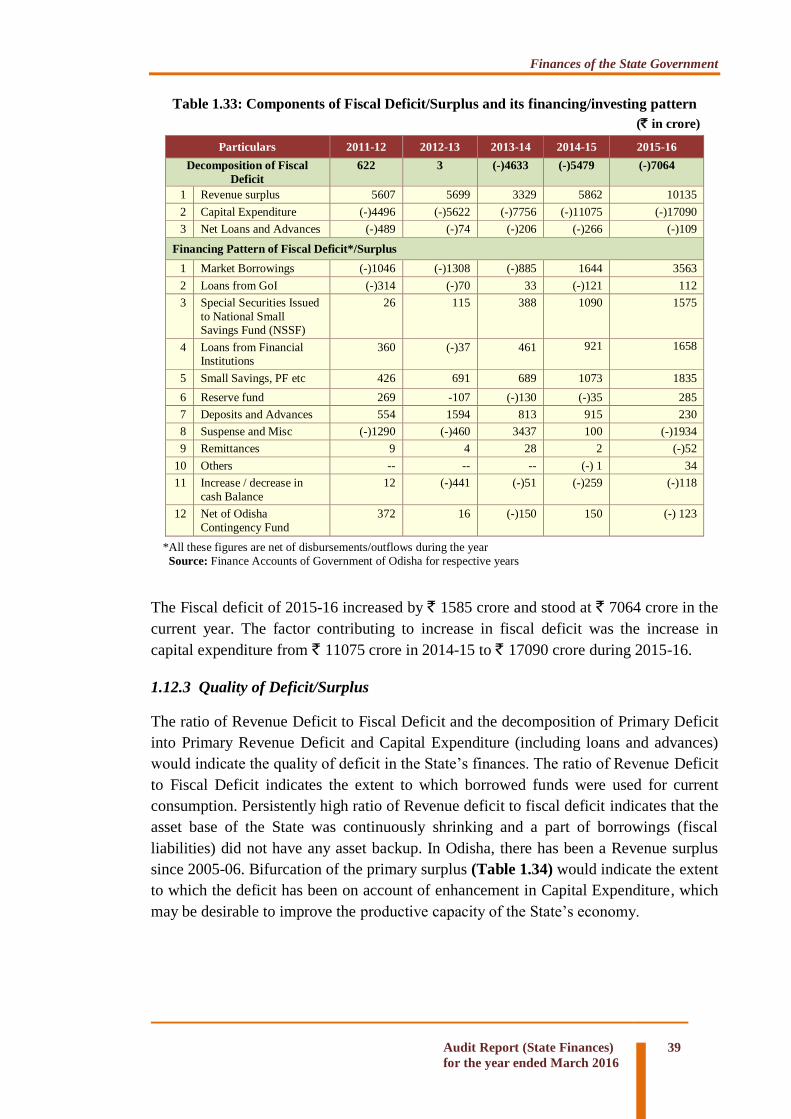
Finances of the State Government
Audit Report (State Finances)
for the year ended March 2016
39
Table 1.33: Components of Fiscal Deficit/Surplus and its financing/investing pattern
(` in crore)
Particulars 2011-12 2012-13 2013-14 2014-15 2015-16
Decomposition of Fiscal
Deficit
622 3 (-)4633 (-)5479 (-)7064
1 Revenue surplus 5607 5699 3329 5862 10135
2 Capital Expenditure (-)4496 (-)5622 (-)7756 (-)11075 (-)17090
3 Net Loans and Advances (-)489 (-)74 (-)206 (-)266 (-)109
Financing Pattern of Fiscal Deficit*/Surplus
1 Market Borrowings (-)1046 (-)1308 (-)885 1644 3563
2 Loans from GoI (-)314 (-)70 33 (-)121 112
3 Special Securities Issued
to National Small Savings Fund (NSSF)
26 115 388 1090 1575
4 Loans from Financial Institutions
360 (-)37 461 921 1658
5 Small Savings, PF etc 426 691 689 1073 1835
6 Reserve fund 269 -107 (-)130 (-)35 285
7 Deposits and Advances 554 1594 813 915 230
8 Suspense and Misc (-)1290 (-)460 3437 100 (-)1934
9 Remittances 9 4 28 2 (-)52
10 Others -- -- -- (-) 1 34
11 Increase / decrease in
cash Balance
12 (-)441 (-)51 (-)259 (-)118
12 Net of Odisha
Contingency Fund
372 16 (-)150 150 (-) 123
*All these figures are net of disbursements/outflows during the year
Source: Finance Accounts of Government of Odisha for respective years
The Fiscal deficit of 2015-16 increased by ` 1585 crore and stood at ` 7064 crore in the
current year. The factor contributing to increase in fiscal deficit was the increase in
capital expenditure from ` 11075 crore in 2014-15 to ` 17090 crore during 2015-16.
1.12.3 Quality of Deficit/Surplus
The ratio of Revenue Deficit to Fiscal Deficit and the decomposition of Primary Deficit
into Primary Revenue Deficit and Capital Expenditure (including loans and advances)
would indicate the quality of deficit in the State’s finances. The ratio of Revenue Deficit
to Fiscal Deficit indicates the extent to which borrowed funds were used for current
consumption. Persistently high ratio of Revenue deficit to fiscal deficit indicates that the
asset base of the State was continuously shrinking and a part of borrowings (fiscal
liabilities) did not have any asset backup. In Odisha, there has been a Revenue surplus
since 2005-06. Bifurcation of the primary surplus (Table 1.34) would indicate the extent
to which the deficit has been on account of enhancement in Capital Expenditure, which
may be desirable to improve the productive capacity of the State’s economy.

Finances of the State Government
40 Audit Report (State Finances)
for the year ended March 2016
Table 1.34: Primary Deficit/Surplus – Bifurcation of factors
(` in crore)
Year
Non-
debt
receipts
Primary
Revenue
Expenditure
Capital
Expenditure
Loans
and
Advances
Primary
Expenditure
Primary
Revenue
deficit (-)
/surplus (+)
Primary
deficit (-) /
surplus (+)
1 2 3 4 5 6 (3+4+5) 7 (2-3) 8 (2-6)
2011-12 40399 32084 4496 621 37201 8315 3198
2012-13 44079 35431 5622 216 41269 8648 2810
2013-14 49204 42730 7756 463 50949 6474 (-)1745
2014-15 57090 48326 11075 358 59759 8765 (-)2669
2015-16 69169 55463 17090 337 72890 13706 (-)3721
Source: Finance Accounts of Government of Odisha for respective years
During 2015-16, non-debt receipts increased from ` 57090 crore to ` 69169 crore (21
per cent) against an increase of 15 per cent in Primary Revenue Expenditure.
Analysis of the factors resulting into primary revenue surplus of the State during 2011-
13 showed that the State was experiencing primary surplus during these years. However,
during 2014-15 and 2015-16, the State had a primary deficit of ` 2669 crore and ` 3721
crore, respectively. In other words, non-debt receipts of the State were not enough to
meet the primary expenditure9 requirements in the Revenue account. Ideally,
incremental non-debt receipts every year should cover not only the primary expenditure
but also incremental interest burden.
1.13 Public Private Partnerships (PPP)
Recourse to the PPP mode for project financing is generally encouraged because it frees
valuable fiscal space for the provision of public goods in areas where such financing
may not be forthcoming, as envisaged in ThFC. The Government of Odisha framed their
PPP Policy in August 2007 to support private investment, particularly in the
infrastructure sector, to utilise the efficiency and innovativeness of the private investors,
besides tapping their capital. PPP projects in sectors that come under the purview of the
Government of Odisha cover 19 infrastructure sectors such as Roads, Ports, Airports,
Industrial parks, Inland Container Depot and Logistic hubs, Water Supply, Power
Generation, Solid Waste Management, Railway related projects and Agriculture
Production and Marketing etc. Out of the 19 sectors, the Government has not entered
into the PPP contracts in five sectors viz. Airports, Airstrips and Heliports, Inland
Container Depots and Logistic Hubs, Sewerage and Drainage, Inland Water Transport
and Agriculture Production and Marketing. In terms of the main types of PPP contracts,
almost all contracts have been of the Build, Operate and Transfer (BOT) type or Build,
Own, Operate and Transfer (BOOT) type (either toll or annuity payment models) or
close variants.
The status of the PPPs in Odisha as on 31 March 2016 is given in Table 1.35:
9 Primary expenditure of the State defined as the total expenditure net of the interest payments indicates the expenditure incurred on the transactions undertaken during the year.

Finances of the State Government
Audit Report (State Finances)
for the year ended March 2016
41
Table 1.35: Status of projects as of 31 March 2016 (` in crore)
Sector Operational Under
Implementation
In Pipeline Total
Number Cost Number Cost Number Cost Number Cost
Urban Development 10 258 7 1336 4 693 21 2287
Health 11 200 0 0 2 322 13 522
Finance & Revenue 1 72 0 0 0 0 1 72
Transport 3 5061 4 2784 0 0 7 7845
Industrial Infrastructure 2 165 3 720 0 0 5 885
Roads 1 48 1 1293 0 0 2 1341
Tourism 2 51 8 20 0 0 10 71
Education 14 35 0 0 1 50 15 85
Energy 0 0 1 108 1 50 2 158
Food Supplies and Consumer Welfare
0 0 1 20 0 0 1 20
Total 44 5890 25 6281 8 1115 77 13286
Source: Figures furnished by Planning & Co-ordination Department, Government of Odisha
A total number of 77 PPP projects in Odisha in different sectors are given in Appendix
1.8, out of which 44 projects have been completed, 25 are in
implementation/construction stage and the rest eight projects are still in the pipeline.
During the financial year, the number of operational projects increased by three, under
implementation projects reduced by four and the projects in pipeline increased by one.
1.14 Implementation of UDAY Scheme
The Government of India has approved (November 2015) the Ujwal Discom Assurance
Yojana (UDAY). It is a scheme for financial turnaround of Power Distribution
Companies (DISCOMS) and expected to improve the operational and financial
efficiency of the State DISCOMS. Some important provisions of the UDAY scheme are
as follows:
- State shall take over 75 per cent of DISCOM debt as on 30 September 2015
over two years.
- States will issue non-Statutory Liquidity Ratio (SLR) including State
Development Loan (SDL) bonds.
- The transfer to the DISCOM by the state will be as grant.
- Banks/Financial Institutions shall not advance short term debt to DISCOMS for
financing losses.
The Government of Odisha has expressed its willingness to join the UDAY scheme. The
State government has proposed to restructure the debt of Grid Corporation (GRIDCO)
which has arisen mainly due to revenue gap over the years. The debt balance of
GRIDCO was ₹ 5406.44 crore as on 30 September 2015.

Finances of the State Government
42 Audit Report (State Finances)
for the year ended March 2016
1.15 Conclusion
Revenue Receipts increased by five per cent from around 16 per cent in 2014-15
to around 21 per cent in 2015-16 (Paragraph 1.4).
Non-Plan Revenue Expenditure (NPRE) as a proportion of Revenue Expenditure
decreased from 72 per cent in 2011-12 to 40 per cent in 2015-16. There was a
total increase of ` 7670 crore in Revenue Expenditure during the current year
over the previous year (Paragraph 1.7.4).
Capital Expenditure of the State as a percentage of total expenditure increased
from 11 per cent in 2011-12 to 22 per cent in 2015-16. However, it was still 5.14
per cent of GSDP during 2015-16, against the projection of 4.56 per cent in the
Budget Estimates (Paragraph 1.7.5).
The total committed liabilities of the State stood at ` 135752.34 crore at the end
of the year. Out of these, pension payment obligations were 63.17 per cent,
interest payments 26.43 per cent and loan repayments were 10.40 per cent
(Paragraph 1.7.7.5).
Funds amounting to ` 899 crore were parked in bank accounts of 11 District
Rural Development Agencies (DRDAs), 21 Block Development Offices (BDOs)
and four Land Acquisition Offices (LAOs), violating the codal provision of
OTC and FD instructions (Paragraph 1.7.6).
Outlay-outcome budgets of four departments viz. Fisheries & Animal Resources
Development, Panchayati Raj, Rural Development and Water Resources
departments were reviewed for the year 2015-16 and it was seen that the
financial and physical targets were mostly not achieved (Paragraph 1.8.3).
Expenditure of over ` 2323 crore was incurred on 31 projects which were still
incomplete due to the prolonged processes involved in land acquisition, matters
lying sub-judice in Courts, finalisation and revision of designs, shortage of funds
and slow progress of work. (Paragraph 1.9.2).
The ThFC had recommended that by the year 2015-16, fiscal liability should be
brought down to 25 per cent of GSDP. The Government has been able to achieve
this target during 2015-16.(Paragraph 1.10.2)
Out of 10 Reserve Funds, nine remained inoperative or dormant for significant
period. (Paragraph 1.10.5).
Debt repayment as a percentage of Debt Receipt showed a decreasing trend from
97.10 per cent in 2011-12 to 59.36 per cent in 2015-16, indicating that public
Debt Receipt was higher than public debt payment, resulting in higher
dependency on debt receipt rather than own resources of revenue. (Paragraph
1.11).

Finances of the State Government
Audit Report (State Finances)
for the year ended March 2016
43
Out of 77 PPP projects, 44 projects were complete, 25 in
implementation/construction stage and the remaining eight projects are still in
pipeline (Paragraph 1.13).
Recommendations
Government may consider making all out efforts to avoid parking of funds
outside Government accounts.
Government may consider taking steps for closure of inoperative Reserve Funds.
Government may prioritise repayment of high value loans first, to reduce the
debt.


CChhaapptteerr--IIII
FFiinnaanncciiaall MMaannaaggeemmeenntt
AAnndd BBuuddggeettaarryy CCoonnttrrooll


Audit Report (State Finances) for the year ended 31 March 2016
45
8500.07
2.1 Introduction
2.1.1 Appropriation Accounts are accounts of the actual expenditure, voted and
charged, of the Government for each financial year compared with the amounts of
voted grants and appropriations charged for different purposes as specified in the
schedules appended to the Appropriation Acts. These Accounts list the original
budget estimates, supplementary grants, surrenders and re-appropriations distinctly
and indicate actual Capital and Revenue Expenditure on various specified services
vis-à-vis those authorised by the Appropriation Acts in respect of both charged and
voted items of budget. Appropriation Accounts, thus, facilitate management of
finances and monitoring of budgetary provisions and are, therefore,
complementary to Finance Accounts.
2.1.2 Audit of appropriations by the Comptroller and Auditor General of India
seeks to ascertain whether the expenditure actually incurred under various grants is
within the authorisation given under the Appropriation Act and that the
expenditure required to be charged under the provisions of the Constitution is so
charged. It also ascertains whether the expenditure so incurred is in conformity
with the law, relevant rules, regulations and instructions. It also seeks to assess to
what extent the Government/ Executive has been able to manage the planned and
intended allocation of its resources among various departments.
2.1.3 As per the Odisha Budget Manual (OBM), the Finance Department is
responsible for preparation of the annual budget by obtaining estimates from
various departments. The departmental estimates of receipts and expenditure are
prepared by Controlling Officers on the advice of the heads of departments and
submitted to the Finance Department on prescribed dates. The Finance Department
consolidates the estimates and prepares the detailed estimates called “Demand for
Grants”. In the preparation of the budget, the aim should be to achieve as close an
approximation to the actual as possible. This demands the exercise of foresight in
both estimating revenue and anticipating expenditure. The budget procedure
envisages that the sum provided in an estimate of expenditure on a particular item
must be that sum which can be expended in the year and neither larger nor smaller.
A saving in an estimate constitutes as much of a financial irregularity as an excess
in it. The budget estimates of receipts should be based on the existing rates of
taxes, duties, fees etc.
Deficiencies in the management of budget and expenditure and violation of the
OBM observed in audit have been discussed in the subsequent paragraphs.
Financial Management
and Budgetary Control
Chapter
II

Financial Management and Budgetary Control
46 Audit Report (State Finances)
for the year ended March 2016
2.2 Summary of Appropriation Accounts
The summarised position of actual expenditure during 2015-16 against 40 grants
and four appropriations was as given in Table 2.1:
Table 2.1: Position of actual expenditure vis-à-vis original/ supplementary provisions
for the year 2015-16 (` in crore)
Nature of
Expenditure
Original Grant/
Appropriation
Supplementary
Grant/
Appropriation
Total Actual
Expenditure
Savings (-)/
Excess (+)
Amount
Surrendered
Amount
surrendered
on 31 March
Percentage of
amount
surrendered
on 31 March
to unspent
provision
1 2 3 4 5 6 7 8 9
Voted I Revenue 62146.54 7557.19 69703.73 56763.89 (-)12939.84 12045.19 11374.20 88
II Capital 15288.43 3774.03 19062.46 17215.18 (-)1847.28 1665.39 1657.34 90
III Loans and
Advances
594.51 60.47 654.98 336.54 (-)318.44 314.91 314.91 99
Total Voted 78029.48 11391.69 89421.17 74315.61 (-)15105.56 14025.49 13346.45 88
Charged
IV Revenue 4958.71 6.10 4964.81 3429.65 (-)1535.16 1522.38 1522.38 99
V Capital 9.54 4.39 13.93 9.07 (-) 4.86 0.94 0.94 19
VI Public Debt
-Repayment
2906.70 46.45 2953.15 2881.37 (-)71.78 71.78 71.78 100
Total Charged 7874.95 56.94 7931.89 6320.09 (-)1611.80 1595.10 1595.10 99
Grand Total 85904.43 11448.64 97353.06 80635.70 (-)16717.36 15620.59 14941.55 89
Source: The Odisha Appropriation Act 2015, Finance and Appropriation Accounts 2015-16, Govt. of Odisha.
The expenditure figures were gross figures without taking into account the
recoveries adjusted in accounts as reduction of expenditure under the Revenue
heads (` 1387.83 crore) and the Capital heads (` 133.78 crore). The overall
savings of ` 16717.36 crore was due to savings in all the 40 grants and two
appropriations under Revenue Section and 33 grants and two appropriations under
Capital Section, which is offset by excess of ` 0.25 crore in one grant under
Capital Section.
It is seen from the above table that against the original provision of ` 85904.43
crore, expenditure of ` 80635.70 crore was incurred, thereby not requiring any
supplementary provision, as there were savings of ` 5268.73 crore from the
original provision, which clearly indicates inaccurate estimation of funds and lack
of control mechanism.
Further, it was also observed that against the total savings of ` 16717.36 crore
during the year, departments surrendered ` 15620.59 crore, out of which
` 14941.55 crore (96 per cent) was surrendered on the last day of the financial
year, i.e., 31 March 2016.

Financial Management and Budgetary Control
Audit Report (State Finances) for the year ended March 2016
47
Evidently, the concerned Chief Controlling Officers (CCOs) overlooked the
budgetary controls laid down in OBM and made inaccurate estimation for the
budget provision.
2.3 Financial Accountability and Budget Management
2.3.1 Appropriation vis-à-vis Allocative Priorities
During the year, the outcome of the appropriation audit showed that in 20 cases
relating to 16 grants and two appropriations, savings exceeded ` 10 crore and by
more than 20 per cent of total provision in each case (Appendix 2.1) amounting to
` 8797.23 crore. Out of the above, savings of as large as ` 8393.66 crore (95 per
cent)1 occurred in 10 cases relating to eight grants and two appropriations as
indicated in Table 2.2.
Table 2.2: List of Grants with savings of ` 100 crore and above.
(` in crore)
Sl. No. No. and Name of the
Grant
Original Supple-
mentary
Total Actual
Expenditure
Savings
Revenue (Charged)
1
2048-Appropriation for
Reduction or Avoidance
of Debt
500.00 0 500.00 0 500.00
2 2049- Interest Payments 4350.00 02 4350.00 3343.30 1006.70
Revenue (Voted)
3 3-Revenue and Disaster
Management 2913.49 2306.18 5219.67 3181.26 2038.41
4 5-Finance 9844.34 0 9844.34 6610.41 3233.93
5 16-Planning and
Co-ordination 1178.19 03 1178.19 610.90 567.29
6 22-Forest and
Environment 717.15 68.56 785.71 578.43 207.28
Capital (Voted)
7 1-Home 442.48 77.00 519.48 318.58 200.90
8 30-Energy 1156.87 798.82 1955.69 1517.39 438.30
9 34-Co-operation 240.95 133.13 374.08 273.26 100.82
10 36-Women and Child
Development 300.00 20.00 320.00 219.97 100.03
TOTAL 21643.47 3403.69 25047.16 16653.50 8393.66
Source: Appropriation Accounts for the year 2015-16, Government of Odisha.
Reasons furnished by the departments to the Principal Accountant General (A&E),
for unspent provisions under a few major heads of account, as reported in
Appropriation Accounts, are given below:
1 Exceeding ` 100 crore in each case 2 ` 4000 only 3 ` 9000 only

Financial Management and Budgetary Control
48 Audit Report (State Finances)
for the year ended March 2016
01-Home (Capital-Voted)
Anticipated savings of (i) ` 6.44 crore under major head “4059- Capital
Outlay on Public Works-SP-SS-60-Other Buildings-789-Special
Component Plan for Scheduled Castes-2378-Construction of Buildings for
Courts” and (ii) ` 1.15 crore under major head “4059- Capital Outlay on
Public Works-SP-SS-60-Other Buildings-796-Tribal Area Sub-Plan-3023-
National Scheme for Modernisation of Courts” were surrendered due to
non-finalisation of sites for district courts.
05-Finance (Revenue-Voted)
Anticipated savings of (i) ` 7.11 crore under major head “2040-Taxes on
Sales, Trade etc.-NP-001-Direction and Administration-0308-District
Establishment,” (ii) ` 4.04 crore under major head “2040-Taxes on Sales,
Trade etc.-NP-001-Direction and Administration-0617-Headquarters
Establishment” and (iii) ` 3.23 crore under major head “2040-Taxes on
Sales, Trade etc.-NP-001-Direction and Administration-1158-Range
Administration” were surrendered due to vacancy of posts, non-settlement
of claims, non-completion of procurement process and observance of
economy.
Anticipated savings of ` 2.45 crore under major head “2040- Taxes on
Sales, Trade etc.-NP-001-Direction and Administration-1515-Upgraded
Check Gates in Commercial Tax Organisations” were due to (i) vacancy of
posts and non-regularisation of salaries, (ii) non-receipt of admissible
claims and (iii) non-availing of LTC by staff.
Anticipated savings of ` 632.89 crore under major head “2052-Secretariat-
General Services- NP- 090- Secretariat- 0488- Finance Department” was
attributed to meet the additional requirement under other heads as per
Supplementary Statement of Expenditure and vacancy of posts.
Entire provision of ` 7.50 crore under major head “2054-Treasury and
Accounts Administration-NP-800-Other Expenditure-2555-Thirteenth
Finance Commission (ThFC) Grant for setting up of a Database for
Government Employees and Pensioners” was surrendered due to non-
sanction of fund by ThFC.
16- Planning and Co-ordination (Revenue-Voted)
Budgeted provision of (i) ` 234.12 crore under major head “3451-
Secretariat-Economic Services-SP-DS-102-District Planning Machinery-
2918-Additional Central Assistance (ACA) for Left Wing Extremism
(LWE) affected districts,” (ii) ` 71.79 crore under major head “3451-
Secretariat-Economic Services-SP-DS-789-Special Component Plan for
Scheduled Castes-2918-ACA for LWE affected districts” and (iii)

Financial Management and Budgetary Control
Audit Report (State Finances) for the year ended March 2016
49
` 158.45 crore under major head “3451-Secretariat-Economic Services-SP-
DS-796-Tribal Area Sub-Plan-2918-ACA for LWE affected districts” were
surrendered due to non-receipt of additional central assistance.
Anticipated saving of ` 20.23 crore under major head “3454-Census
Surveys and Statistics-CP-SS-02-Surveys and Statistics-001-Direction and
Administration-2570-Sixth Economic Census” was surrendered due to
non-completion of works and non-receipt of claims.
22-Forest and Environment (Revenue-Voted)
Anticipated savings of (i) ` 10 crore under major head “2406-Forestry and
Wildlife-SP-SS-01-Forestry-102-Social and Farm Forestry-3074-
Management of Plantation and Forest,” (ii) ` 5.60 crore under major head
“2406-Forestry and Wildlife-SP-SS-01-Forestry-789-Special Component
Plan for Scheduled Castes-3074-Management of Plantation and Forest”
and (iii) ` 6.40 crore under major head “2406-Forestry and Wildlife-SP-
SS-01-Forestry-796-Tribal Area Sub-Plan-3074-Management of Plantation
and Forest” were surrendered due to non-introduction of schemes as per
decision of the Government of Odisha.
Anticipated saving of ` 10 crore under major head “3435-Ecology and
Environment-CP-SS-03-Environmental Research and Ecological
Regeneration-102-Environmental Planning and Co-ordination-2693-
Climate Change Action Plan” were surrendered due to non-release of fund
by GoI.
30-Energy (Capital-Voted)
Anticipated savings of ` 210 crore under major head “4801-Capital Outlay
on Power Projects-SP-SS-05-Transmission and Distribution-800-Other
Expenditure-0140-Reimbursement of Land Acquisition Establishment
Cost” were surrendered due to introduction of Cash Management System
in the department.
34-Co-operation (Capital-Voted)
Anticipated savings of ` 70 crore under major head “6425-Loans for Co-
operation-SP-SS-108-Loans to Other Co-operatives-2980-Corpus Fund for
Odisha State Co-operative Marketing Federation Ltd.” were surrendered
due to short release of fund by the Government.
36-Women and Child Development (Capital-Voted)
Withdrawal of anticipated savings of (i) ` 37.40 crore under major head
“4235-Capital Outlay on Social Security and Welfare-SP-DS-02-Social
Welfare-102-Child Welfare-2596-ThFC Award for Construction of
Anganwadi Centres,” (ii) ` 22 crore under major head “4235-Capital
Outlay on Social Security and Welfare-SP-DS-02-Social Welfare-789-
Special Component Plan for Scheduled Castes-2596-ThFC Award for

Financial Management and Budgetary Control
50 Audit Report (State Finances)
for the year ended March 2016
Construction of Anganwadi Centres” and (iii) ` 40.60 crore under major
head “4235-Capital Outlay on Social Security and Welfare-SP-DS-02-
Social Welfare-796-Tribal Area Sub-Plan-2596-ThFC Award for
Construction of Anganwadi Centres” was due to non-release of state
specific grants by ThFC.
2048-Appropriation for Reduction or Avoidance of Debt (Revenue-Charged)
Entire provision of ` 500 crore under major head “2048-Appropriation for
Reduction or Avoidance of Debt-NP-101-Sinking Funds-1202-Reserve
Funds” was surrendered as per decision of the Government of Odisha.
2049-Interest Payments (Revenue-Charged)
Anticipated savings of ` 210.13 crore under major head “2049-Interest
Payments-NP-01-Interest on Internal Debt-101-Interest on Market Loans-
0754-Interest Payment on Market Loans” was due to short receipt of loan
during the financial year by the State Government.
The above cases indicate lack of monitoring of the flow of expenditure in the
department by the Chief Controlling Officers (CCOs) of such grants as required
under Chapters IV and VI of OBM.
2.3.2 Excess expenditure over provisions relating to previous years requiring
regularisation by the State Legislature
According to Article 205 of the Constitution of India, it is mandatory for a State
Government to get the excess over a grant/ appropriation regularised by the State
Legislature. Excess expenditure amounting to ` 598.85 crore was incurred over the
provisions during 2010-11, 2011-12, 2013-14 and 2014-15 as detailed in Table
2.3.
Table 2.3: Excess expenditure over provisions relating to previous years requiring
regularisation Year Number of Grants/ Appropriations Amount of
excess
expenditure
( ` in crore)
Grants Appropriations
2010-11 4 1
07-Works, 22-Forest and Environment, 23-
Agriculture, 28-Rural Development, 6004-Loans
and Advances from Central Government
428.51
2011-12 1 1 05-Finance, 6004 – Loans and Advances from
Central Government 151.77
2013-14 3 -- 22-Forest and Environment, 26-Excise and 31-
Handlooms, Textile and Handicrafts 18.56
2014-15 1 -- 26-Excise 0.014
Total 9 2 598.85
Source: Appropriation Accounts for the respective years, Government of Odisha.
4 ` 87,887.00 only

Financial Management and Budgetary Control
Audit Report (State Finances) for the year ended March 2016
51
Excess expenditure over the provisions amounting to ` 580.28 crore pertaining to
the year 2010-11 and 2011-12 was recommended for regularisation by the Public
Accounts Committee in its Seventh Report of 14th Assembly (December 2013),
which has not been done.
2.3.3 Excess expenditure over Budget provision from Consolidated Fund of the
State during 2015-16 requiring regularisation by the State Legislature
During 2015-16, Forest and Environment Department incurred an expenditure of
` 3.93 crore against the total provision of ` 3.67 crore in the Capital (voted)
section, leading to excess expenditure of ` 0.25 crore5 over and above the amount
authorised from the Consolidated Fund of the State (CFS) by the State
Legislature. The excess expenditure occurred under the head “4406-Capital Outlay
on Forestry and Wildlife-State Plan-District Sector-01-Forestry-070-
Communication and Buildings-2327-Construction and Renovation of Forest
Buildings.” No demand for consideration of regularisation by the State Legislature
as per Article 205 of the Constitution has yet been placed. Thus, the excess
expenditure remained unauthorised.
2.3.4 Persistent Savings
There were persistent savings of more than ` 10 crore in 20 cases in 17 grants and
one appropriation during 2011-16 as detailed in Appendix 2.2. The savings ranged
between ` 50.92 crore and ` 3233.94 crore during the year 2015-16. Persistent
savings in a substantial number of grants over the years are indicative of over
assessment of requirement of funds by the Government in Appropriation Act
repeatedly without taking into account the previous years’ trends and adequately
scrutinising the need for funds.
This has been pointed out repeatedly in earlier Audit Reports; however, no action
has been taken by the Government.
2.3.5 Unnecessary/ Excessive supplementary provision
Supplementary provision aggregating ` 2682.53 crore (` one crore or more in each
case) obtained in 31 cases (23 grants) during the year 2015-16 proved unnecessary
as the actual expenditure (` 37829.97 crore) did not come up to the level of
original provision (` 40631.48 crore) in these cases as detailed in Appendix-2.3.
Similarly, supplementary provision aggregating ` 8746.26 crore proved excessive
by ` 5173.19 crore over the total required supplementary provision of ` 3573.07
crore in 18 cases under 15 grants and one appropriation (` one crore or more in
each case) as detailed in Appendix-2.4.
5 ` 25,40,175.00 only

Financial Management and Budgetary Control
52 Audit Report (State Finances)
for the year ended March 2016
This indicated that the CCOs did not adequately watch the actual requirement of
funds for the remaining period of the financial year and monitor the flow of
expenditure through the monthly expenditure control mechanism prescribed in
Chapters IV and VI of OBM.
2.3.6 Excessive/ unnecessary re-appropriation of funds
Re-appropriation is transfer of funds within a grant from one unit of appropriation,
where savings are anticipated, to another unit where additional funds are needed.
Re-appropriations proved excessive or insufficient and resulted in savings/ excess
of over ` 10 lakh (in each case) in 107 sub-heads, of which excess / saving was
more than ` one crore (in each case) in 27 sub-heads (savings of ` 159.16 crore in
23 sub-heads under nine grants and excess of ` 26.33 crore in four sub-heads
under three grants) as detailed in Appendix- 2.5.
2.3.7 Re-appropriations on the last day of the financial year
According to Rule 139 of OBM, reasons for additional expenditure and savings
should be explained in the re-appropriation statement which should reach the
Finance Department by 10 March at the latest. As per the records of the office of
the Principal Accountant General (A&E), during 2015-16, 661 re-appropriation
orders amounting to ` 4628.59 crore were issued, out of which 17 re-appropriation
orders aggregating ` 623.79 crore were issued by the following Departments on 31
March 2016, the last day of the financial year when there was no scope for
expenditure during that year as given in Table 2.4 below.
Table 2.4: Re-appropriations on 31 March 2016 (last day of the financial year)
Sl
No
No. of the Grant/Appropriation
and Name of the Department
Head of Account
from where
re-appropriation
was made
Amount
(` in crore)
Order No./ Date
1 05-Finance 2030-Non Plan 0.51 10136 / 31-03-2016
2 05-Finance 2071-Non Plan 100.90 10138 / 31-03-2016
3 05-Finance 7610-Non Plan 1.03 10140/31-03-2016
4 08-Odisha Legislative Assembly 2011-Non Plan 0.02 4688/31-03-2016
5 13-Housing and Urban
Development
2217-Non Plan 9.42 8299/31-03-2016
6 20-Water Resources 4700- State Plan 24.08 8015/31-03-2016
7 20-Water Resources 4701- State Plan 0.14 8017/31-03-2016
8 20-Water Resources 4701-State Plan 14.30 8013/31-03-2016
9 23-Agriculture 2401-Non Plan 10.01 5933/31-03-2016
10 23-Agriculture 2402-Non Plan 3.02 5997/31-03-2016
11 23-Agriculture 2402-Non Plan 4.80 6000/31-03-2016
12 23-Agriculture 2402-Non Plan 0.83 6015/31-03-2016
13 28-Rural Development 4215-State Plan
5054-State Plan
43.29 42013/31-03-2016
14 30-Energy 6801-Non Plan 70.00 2606/31-03-2016
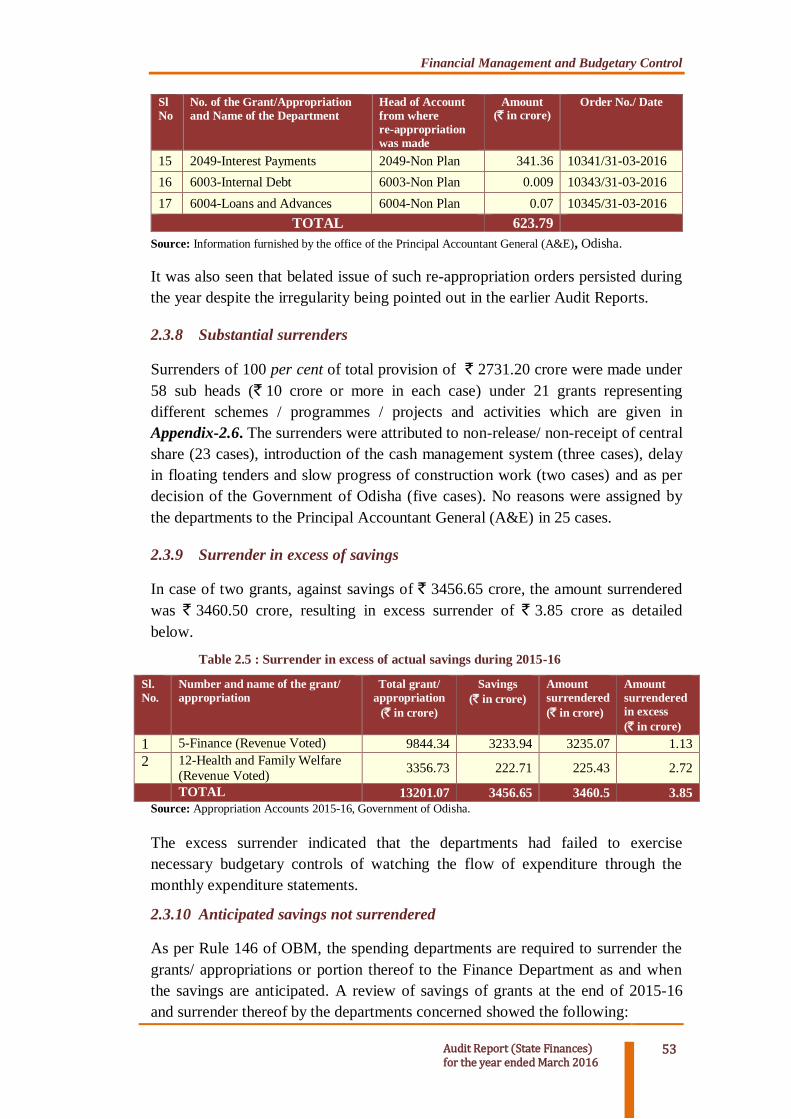
Financial Management and Budgetary Control
Audit Report (State Finances) for the year ended March 2016
53
Sl
No
No. of the Grant/Appropriation
and Name of the Department
Head of Account
from where
re-appropriation
was made
Amount (` in crore)
Order No./ Date
15 2049-Interest Payments 2049-Non Plan 341.36 10341/31-03-2016
16 6003-Internal Debt 6003-Non Plan 0.009 10343/31-03-2016
17 6004-Loans and Advances 6004-Non Plan 0.07 10345/31-03-2016
TOTAL 623.79
Source: Information furnished by the office of the Principal Accountant General (A&E), Odisha.
It was also seen that belated issue of such re-appropriation orders persisted during
the year despite the irregularity being pointed out in the earlier Audit Reports.
2.3.8 Substantial surrenders
Surrenders of 100 per cent of total provision of ` 2731.20 crore were made under
58 sub heads (` 10 crore or more in each case) under 21 grants representing
different schemes / programmes / projects and activities which are given in
Appendix-2.6. The surrenders were attributed to non-release/ non-receipt of central
share (23 cases), introduction of the cash management system (three cases), delay
in floating tenders and slow progress of construction work (two cases) and as per
decision of the Government of Odisha (five cases). No reasons were assigned by
the departments to the Principal Accountant General (A&E) in 25 cases.
2.3.9 Surrender in excess of savings
In case of two grants, against savings of ` 3456.65 crore, the amount surrendered
was ` 3460.50 crore, resulting in excess surrender of ` 3.85 crore as detailed
below.
Table 2.5 : Surrender in excess of actual savings during 2015-16
Sl.
No.
Number and name of the grant/
appropriation
Total grant/
appropriation
(` in crore)
Savings
(` in crore)
Amount
surrendered
(` in crore)
Amount
surrendered
in excess
(` in crore)
1 5-Finance (Revenue Voted) 9844.34 3233.94 3235.07 1.13
2 12-Health and Family Welfare
(Revenue Voted) 3356.73 222.71 225.43 2.72
TOTAL 13201.07 3456.65 3460.5 3.85
Source: Appropriation Accounts 2015-16, Government of Odisha.
The excess surrender indicated that the departments had failed to exercise
necessary budgetary controls of watching the flow of expenditure through the
monthly expenditure statements.
2.3.10 Anticipated savings not surrendered
As per Rule 146 of OBM, the spending departments are required to surrender the
grants/ appropriations or portion thereof to the Finance Department as and when
the savings are anticipated. A review of savings of grants at the end of 2015-16
and surrender thereof by the departments concerned showed the following:

Financial Management and Budgetary Control
54 Audit Report (State Finances)
for the year ended March 2016
In 24 cases (17 grants) savings of more than ` one crore in each case
remained to be surrendered; however the departments partially refunded
savings, resulting in retention of ` 1097.43 crore (17 per cent of the total
savings of ` 6640.58 crore in these cases) as per details given in
Appendix 2.7.
Besides, as per information compiled by the Office of the Principal
Accountant General (A&E), Odisha, there were surrenders of funds under
different major heads of accounts in excess of ` 10 crore and by more than
20 per cent of the total provision in each case on the last working day of
the financial year i.e. on 31 March 2016 in 33 cases (in 21 grants)
aggregating ` 6774.44 crore covering 35 per cent of the budgetary
provision of ` 19,115.06 crore (Appendix 2.8).
Thus, the Chief Controlling Officers overlooked the budgetary controls laid down
in OBM.
2.4 Advances from Contingency Fund
Contingency Fund of the State has been established under the Odisha Contingency
Fund Act, 1967 in terms of provisions of Article 267(2) and 283(2) of the
Constitution of India. Advances from the Fund are to be made only for meeting
expenditure of an unforeseen and emergent character, postponement of which, till
its authorisation by the Legislature, would be undesirable. The fund is in the nature
of an imprest and required to be recouped by obtaining supplementary grants
during the first session of Assembly immediately after the advance is sanctioned.
Its corpus was ` 400 crore.
During 2015-16, advance of ` 122.90 crore was drawn (29 March 2016) from the
Contingency Fund of the State which was not recouped by the close of the
financial year. The advance was drawn for implementation of the Centrally
Sponsored Scheme “National Health Mission” (NHM) under Grant No.12-Health
and Family Welfare (Major Head-2210-Medical and Public Health) and
transferred to the Mission Directorate, NHM, Odisha. Further scrutiny showed that
out of the above grant received by the Mission Director, NHM, Odisha, an amount
of ` 21.86 crore was kept in savings bank accounts as on 31 March 2016 after
incurring an expenditure of ` 1.45 crore and making further fund transfers of
` 93.11 crore to the executing agencies.
2.5 Errors in Budgetary Process
The Odisha Budget Manual (Rule 46) requires the Controlling Officers to see that
proper estimates are made which should take into account only such payments
which are expected to be made during the budget year. The aim is to make the
estimates as accurate as possible, not to over-estimate and show large savings at
the end of the year.

Financial Management and Budgetary Control
Audit Report (State Finances) for the year ended March 2016
55
During 2015-16, implementation of the Budget was not in conformity with the
approved Budget leading to large-scale savings under the Revenue (voted) and
Capital (voted) sections as under:
Under Revenue (voted) Section, the original grants and supplementary
grants were ` 62146.54 crore and ` 7557.19 crore, respectively,
aggregating ` 69703.73 crore against which the actual expenditure was
` 56763.89 crore, resulting in savings of ` 12939.84 crore. Supplementary
provision of ` 7557.19 crore obtained during the year, proved unnecessary
as the expenditure did not come up to the level of original provision.
Similarly under Capital (voted) Section, the original and supplementary
grants were ` 15288.43 crore and ` 3774.03 crore, respectively,
aggregating ` 19062.46 crore against which the actual expenditure was
` 17215.18 crore resulting in savings of ` 1847.28 crore.
However, it was also observed from the audit of Appropriation Accounts that 17
departments continued to make savings of more than ` 10 crore during last four
years, despite repeated comments in the Audit Reports from 2011-12 to 2014-15 as
detailed in Appendix 2.2.
2.5.1 Analysis of Cash Management System and Rush of Expenditure
Pursuant to the provisions of sub-section (1-a) of Section 8 of the Odisha Fiscal
Responsibility and Budget Management Act, Government of Odisha implemented
Cash Management System in 18 departments for 2015-16.
As per Finance Department circular No.12453/F., dated 20 April 2015, the level of
expenditure at the end of the third quarter was not to be less than 60 per cent and
during the month of March, the same should not be more than 15 per cent of the
budget provision.
However, it was observed that out of 18, only 12 departments had spent minimum
60 per cent of the budget provision by the end of third quarter, while the remaining
six departments had failed to achieve the norm during 2015-16. Similarly, 12
departments exceeded 15 per cent of the budget provision for the month of March
2016 as indicated in Table 2.6.
Table 2.6: Analysis of cash management system (` in crore)
Sl.
No.
Grant No/ Department Original
Budget
Provision
April - December 2015 March 2016
Expenditure
during first
three quarters
Percentage of
Expenditure
Expenditure
during the
month
Percentage of
Expenditure
1 7-Works 4302.07 3205.97 75 1256.99 29
2 10-School and Mass
Education
10014.49 6045.15 60 1346.99 13
3 11-ST & SC Development,
Minorities and Backward
2374.84 1409.73 59 619.97 26

Financial Management and Budgetary Control
56 Audit Report (State Finances)
for the year ended March 2016
Sl.
No.
Grant No/ Department Original
Budget
Provision
April - December 2015 March 2016
Expenditure
during first
three quarters
Percentage of
Expenditure
Expenditure
during the
month
Percentage of
Expenditure
Classes Welfare
4 12- Health and Family
Welfare
3877.88 2601.26 67 472.50 12
5 13-Housing and Urban
Development
2932.29 1288.99 44 1019.96 35
6 17-Panchayati Raj 7066.10 5314.77 75 510.97 7
7 19-Industry 46.92 28.60 61 17.71 38
8 20-Water Resources 6236.36 3989.93 64 1124.32 18
9 22-Forest and Environment 720.82 379.71 53 79.93 11
10 23-Agriculture 3131.38 2110.43 67 636.38 20
11 28-Rural Development 5976.97 3987.54 67 1172.89 20
12 30-Energy 1187.35 591.35 50 192.09 16
13 31-Handloom, Textile &
Handicrafts
152.74 94.92 62 25.00 16
14 33-Fisheries and Animal
Resources Development
629.80 417.33 66 74.74 12
15 36-Women & Child
Development
4162.63 2162.32 52 998.71 24
16 38-Higher Education 1993.11 1265.65 64 358.18 18
17 39- Skill Development and Technical Education
712.97 488.53 69 69.54 10
18 40-Micro, Small and
Medium Enterprises
114.61 54.99 48 19.33 17
Source: Monthly Appropriation Reports for December 2015 and March 2016.
According to Rule 147 of OBM, rush of expenditure in the closing month of the
financial year will ordinarily be regarded as breach of financial regularity, which
should be avoided. Contrary to this, in respect of 34 schemes (sub-heads) listed in
Appendix 2.9, Revenue / Capital Expenditure exceeding ` 10 crore and also more
than 90 per cent of the total expenditure (in each case) was incurred in March
2016. Out of this, in 22 cases, hundred per cent expenditure was incurred in March
2016.
Maintaining uniform pace of expenditure is a crucial component of sound public
financial management, as it obviates fiscal imbalance and temporary cash crunches
due to mismatch of revenue expenditure during a particular month arising out of
unanticipated heavy expenditure in that particular month.
2.5.2 Release of funds at the fag end of the financial year
Timely release of funds to the implementing agencies has a direct bearing on
successful implementation of the schemes and avoiding rush of expenditure. From
examination of sanction orders, it was observed that the government released
₹ 588.78 crore in respect of five departments (Appendix 2.10) during the last week
of March 2016. There was no possibility of proper utilisation of these funds during
the financial year 2015-16. Department-wise release of funds is mentioned below:-
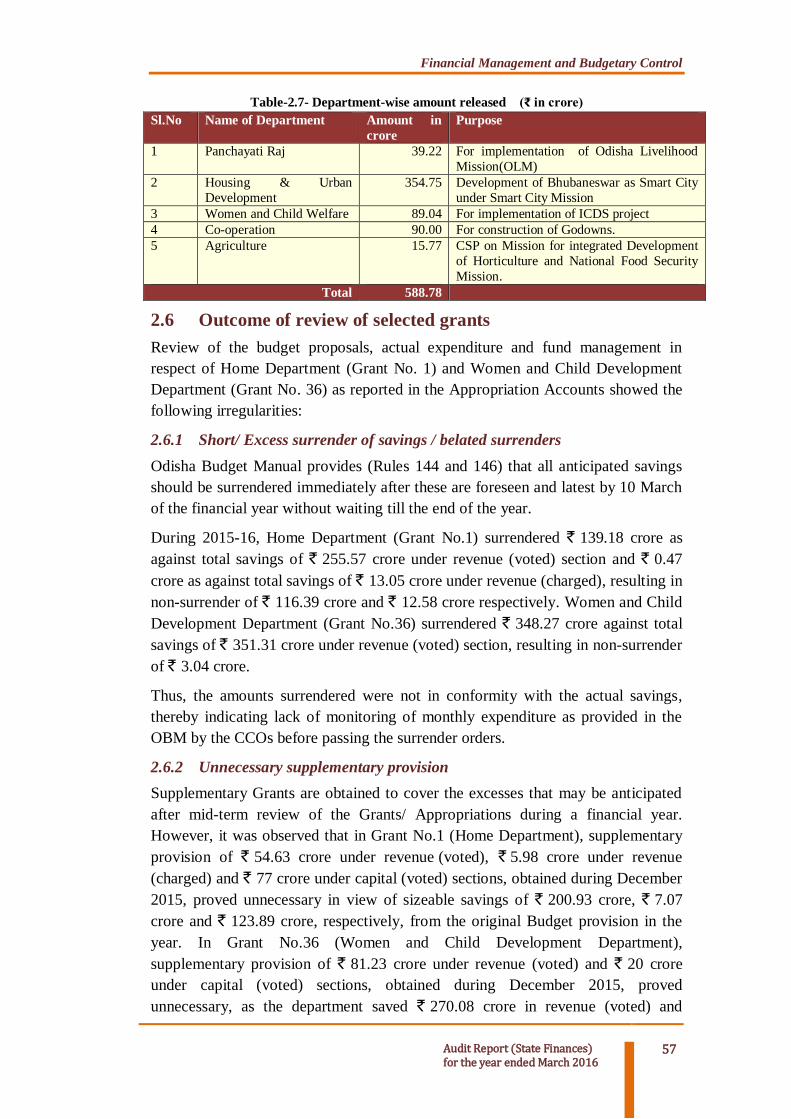
Financial Management and Budgetary Control
Audit Report (State Finances) for the year ended March 2016
57
Table-2.7- Department-wise amount released (₹ in crore) Sl.No Name of Department Amount in
crore
Purpose
1 Panchayati Raj 39.22 For implementation of Odisha Livelihood
Mission(OLM)
2 Housing & Urban
Development
354.75 Development of Bhubaneswar as Smart City
under Smart City Mission
3 Women and Child Welfare 89.04 For implementation of ICDS project
4 Co-operation 90.00 For construction of Godowns.
5 Agriculture 15.77 CSP on Mission for integrated Development
of Horticulture and National Food Security
Mission.
Total 588.78
2.6 Outcome of review of selected grants
Review of the budget proposals, actual expenditure and fund management in
respect of Home Department (Grant No. 1) and Women and Child Development
Department (Grant No. 36) as reported in the Appropriation Accounts showed the
following irregularities:
2.6.1 Short/ Excess surrender of savings / belated surrenders
Odisha Budget Manual provides (Rules 144 and 146) that all anticipated savings
should be surrendered immediately after these are foreseen and latest by 10 March
of the financial year without waiting till the end of the year.
During 2015-16, Home Department (Grant No.1) surrendered ` 139.18 crore as
against total savings of ` 255.57 crore under revenue (voted) section and ` 0.47
crore as against total savings of ` 13.05 crore under revenue (charged), resulting in
non-surrender of ` 116.39 crore and ` 12.58 crore respectively. Women and Child
Development Department (Grant No.36) surrendered ` 348.27 crore against total
savings of ` 351.31 crore under revenue (voted) section, resulting in non-surrender
of ` 3.04 crore.
Thus, the amounts surrendered were not in conformity with the actual savings,
thereby indicating lack of monitoring of monthly expenditure as provided in the
OBM by the CCOs before passing the surrender orders.
2.6.2 Unnecessary supplementary provision
Supplementary Grants are obtained to cover the excesses that may be anticipated
after mid-term review of the Grants/ Appropriations during a financial year.
However, it was observed that in Grant No.1 (Home Department), supplementary
provision of ` 54.63 crore under revenue (voted), ` 5.98 crore under revenue
(charged) and ` 77 crore under capital (voted) sections, obtained during December
2015, proved unnecessary in view of sizeable savings of ` 200.93 crore, ` 7.07
crore and ` 123.89 crore, respectively, from the original Budget provision in the
year. In Grant No.36 (Women and Child Development Department),
supplementary provision of ` 81.23 crore under revenue (voted) and ` 20 crore
under capital (voted) sections, obtained during December 2015, proved
unnecessary, as the department saved ` 270.08 crore in revenue (voted) and

Financial Management and Budgetary Control
58 Audit Report (State Finances)
for the year ended March 2016
` 80.03 crore under capital (voted) sections, respectively, out of the original
provision. This showed that the CCOs of these two departments did not watch
actual requirement of funds for the remaining period of the financial year due to
failure of monthly expenditure control mechanism prescribed in the OBM.
2.6.3 Withdrawal of entire provision by way of surrender and re-appropriation
Home and Women and Child Development Departments made provisions of
` 152.38 crore and ` 123.53 crore, respectively, under different heads/ schemes
during 2015-16; however the total provisions were withdrawn by way of
re-appropriation and surrender during the financial year 2015-16, as indicated in
Appendix 2.11.
The above indicated that the CCOs had prepared the budget and made allocations
to different schemes/projects/objects of expenditure without sufficient basis and
without carrying out due diligence as prescribed in the OBM.
2.6.4 Non-adherence to Cash Management System
Government of Odisha (Finance Department) in their circular (April 2015) laid
down the guidelines for timely spending of budgetary grants through the Cash
Management System in 2015-16 in 18 departments including the Women and
Child Development Department.
As per Cash Management System, the departments have to adhere to the Quarterly
Expenditure Allocation (QEA) norm of 15 per cent, 15 per cent, 30 per cent and
40 per cent for of the Budget Estimates in the first, second, third and fourth
quarter, respectively, as prescribed by the Finance Department for the year 2015-
16. The distribution of the QEA vis-à-vis quarterly expenditure for the
departments during 2015-16 is given in Table 2.8.
Table 2.8: Budget Estimate and Quarterly Expenditure Allocation by Women and Child
Development Department (`in Crore) Sl
No Budget
Estimate
First Quarter Second Quarter Third Quarter Fourth Quarter
QEA Expenditure QEA Expenditure QEA Expenditure QEA Expenditure
36-Women and Child Development Department
1 4162.63 624.39
(15%)
384.11
(9%)
624.39
(15%)
811.13
(19%)
1248.79
(30%)
966.80
(23%)
1665.05
(40%)
1650.19
(40%)
Source: Monthly Appropriation Accounts 2015-16.
Women and Child Development Department failed in adhering to the stipulated
expenditure norms by six per cent and seven per cent during first quarter and third
quarter, respectively, against the targeted norm and also fell short of achieving the
third quarter norm (60 per cent of BE) by nine per cent.
Further, it was also seen that Women and Child Development Department had
incurred expenditure of ` 998.71 crore (24 per cent) in March 2016, i.e. the last
month of the year, which exceeded the norm (15 per cent) by 9 per cent.

Financial Management and Budgetary Control
Audit Report (State Finances) for the year ended March 2016
59
The above actions not only violated guidelines of the Cash Management System
but also stood in the way of achieving the objectives thereof, like (i) even pacing
of expenditure within the financial year, (ii) reduction of rush of expenditure
during the last month of the financial year and (iii) effective monitoring of the
expenditure pattern.
2.7 Outcome of Inspection of Treasuries
During 2015-16, 30 District Treasuries, 8 Special Treasuries and 62 Sub-
Treasuries were inspected by the officials of the Principal Accountant General
(A&E), Odisha. Irregularities and lapses observed during 2015-16, were brought to
the notice of the Treasury Officers / Sub-Treasury Officers concerned through
Inspection Reports. Some of the important irregularities and lapses noticed during
inspection are given below:
2.7 .1 Excess payment of pension and family pension through Treasuries
During inspection of treasuries/ sub-treasuries for the year ended 31 March 2016
by the office of the Principal Accountant General (A&E), excess payment of
pension and family pension amounting to ` 49.22 lakh was observed as indicated
in Table 2.10 below:
Table 2.10: Excess payment of pension and family pension through Treasuries
Sl.
No.
Category Amount
( ` in lakh)
1 Excess payment of pension due to arithmetical inaccuracy 0.78
2 Excess payment due to delayed commencement of reduced
pension on account of commuted value of pension
4.56
3 Excess payment of family pension due to payment at enhanced
rate beyond the stipulated date
14.71
4 Excess payment of pension due to other miscellaneous reasons 29.17
TOTAL 49.22
Source: Provisional Treasury Inspection Report of the Office of the Pr. Accountant General (A&E), Odisha.
2.7 .2 Excess payment of pension through Bank
Pensions/ family pensions are also paid through nationalised banks out of the
purview of treasuries. Audit was conducted in respect of two branches of State
Bank of India, Centralised Pension Processing Cell, Bhubaneswar and Indian
Overseas Bank, Balasore and it was observed that excess payment of pension/
family pension aggregating ₹ 62.70 lakh was made, as indicated in Table 2.11
below:

Financial Management and Budgetary Control
60 Audit Report (State Finances)
for the year ended March 2016
Table 2.11: Excess payment of pension and family pension through Bank
Sl.
No.
Category Amount
( ` in lakh)
1 Excess payment of pension due to arithmetical inaccuracy 15.00
2 Excess payment of family pension due to payment at enhanced
rate beyond the stipulated date
47.11
3 Excess payment due to regular credit of pension after death of pensioners
0.59
TOTAL 62.70
Source: Inspection Report of SS-II Group of Accountant General (G&SSA), Odisha, Bhubaneswar.
Thus, there is a need to improve the internal controls in treasuries and banks in
respect of pension and pension-related payments.
2.7.3 Outstanding pension claims from Central Pay and Accounts Office, New
Delhi / Railways
Treasuries in Odisha are not rendering Central Civil Pension/ Central Political
Pension vouchers to the concerned accounting circles for reimbursement due to
which claims of State Government to the extent of ` 28.97 crore as calculated up
to 31 March 2016 remained under “8658- Suspense Account 101- PAO Suspense”
head. Details are given in Table 2.12:
Table 2.12: Outstanding pension claims from different Accounting Circles
Sl.
No.
Name of the Accounting Circle Outstanding amount (` in crore)
1 Central Pay & Accounts Office, New Delhi 27.83
2 Railways 1.14
TOTAL 28.97
Source: Provisional Annual Review Report on the working of Treasuries 2015-16 prepared by Office
of the Principal Accountant General (A&E), Odisha.
2.8 Conclusion
Avoidable supplementary provisions, defective orders for re-appropriation
of fund, issue of re-appropriation orders on the last day of the year,
substantial surrenders, surrender in excess of savings and non-surrender of
anticipated savings did not reflect prudent financial management by the
Chief Controlling Officers (Paragraphs 2.3.5 to 2.3.10).
Hundred per cent of Revenue and Capital provision were spent in some
schemes /sub-heads during March 2016, instead of spreading it throughout
the year leading to rush of expenditure (Paragraph 2.5.2).
Instructions on Cash Management System were not strictly adhered to by
the departments, resulting in non-achievement of targeted periodical
expenditure norm fixed by the State Government (Paragraph 2.5.2).

Financial Management and Budgetary Control
Audit Report (State Finances) for the year ended March 2016
61
Recommendations
Government may consider issuing instructions to all the departments to
ensure surrender of unutilised allocations as soon as they are foreseen so
that the funds can be allocated to other needy departments.
Excess expenditure over provision in the grants out of the Consolidated
Fund of the State needs to be regularised.
Cash Management System may be adhered to strictly by the departments,
so that the expenditure norm fixed by the Government is achieved.


CChhaapptteerr--IIIIII
FFiinnaanncciiaall RReeppoorrttiinngg


Audit Report (State Finances)
for the year ended March 2016
63
A sound internal financial reporting system with relevant and reliable information
significantly contributes to efficient and effective governance. The reports on
compliance and controls with adequacy, accuracy and effectiveness assist the State
Government to meet its basic stewardship responsibilities for strategic planning
and quick decision making. It thus contributes to financial and operational health
of the State Government with transparency and accuracy covering its various
instrumentalities like local bodies, autonomous bodies etc.
This Chapter provides an overview and status of compliance with various broad
significant financial rules, procedures and directives, in so far as financial
reporting is concerned, by the State Government and its various subordinate
offices during the current year.
3.1 Delay in furnishing of Utilisation Certificates
Odisha General Financial Rule1 (OGFR) provides that for the grants, for which
conditions are attached to their utilisation, Utilisation Certificates (UCs) should be
furnished by the grantee institutions in duplicate (in form OGFR-7A)
countersigned by the disbursing authorities so as to reach the Administrative
Department by 1 June of the succeeding year. One copy of the certificate is to be
retained in the Administrative Department and another copy is to be sent to the
Office of the Principal Accountant General (A&E), Odisha, by 30 June of that
year.
Through the instrument of UC, the grantor obtains assurance about non-diversion
and proper utilisation of the funds placed at the disposal of the grantee and also
gets a certificate from the grantee that the intended list of works have been
executed, the details of which are available with him/her. Any delay in furnishing
this report to the grantor or any inaccuracy in such reporting essentially
undermines this control mechanism designed to ensure non-diversion and proper
utilisation. This certificate from the final spending authority/ official/ agency/
grantee is subsequently countersigned by his/its senior officials at different stages/
levels, till it reaches the level of the Chief Controlling Officer (CCO)-cum-Heads
of Department (HODs) who ultimately countersigns it and submits it to the
Government. At every stage of counter-signature, necessary due diligence is
required to be exercised by the counter-signing authority.
1 Rule 173 of OGFR
Financial Reporting Chapter
III
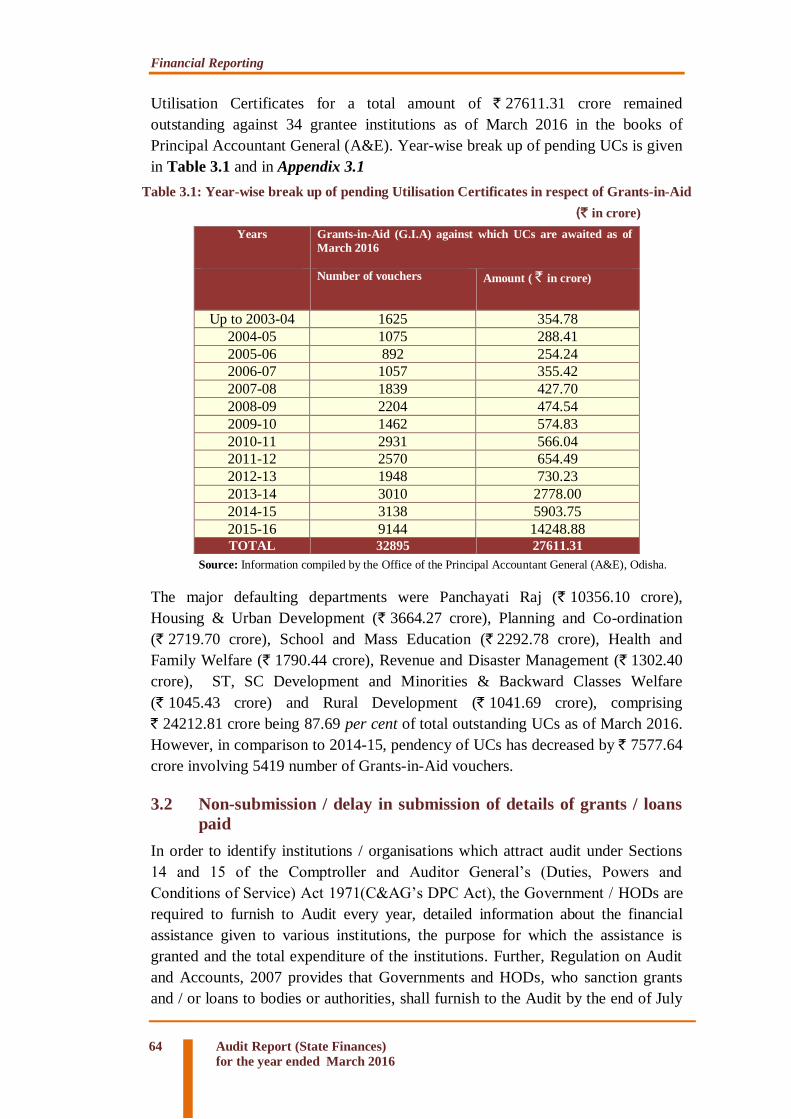
Financial Reporting
64 Audit Report (State Finances)
for the year ended March 2016
Utilisation Certificates for a total amount of ` 27611.31 crore remained
outstanding against 34 grantee institutions as of March 2016 in the books of
Principal Accountant General (A&E). Year-wise break up of pending UCs is given
in Table 3.1 and in Appendix 3.1
Table 3.1: Year-wise break up of pending Utilisation Certificates in respect of Grants-in-Aid
(` in crore)
Years Grants-in-Aid (G.I.A) against which UCs are awaited as of
March 2016
Number of vouchers Amount ( ` in crore)
Up to 2003-04 1625 354.78
2004-05 1075 288.41
2005-06 892 254.24
2006-07 1057 355.42
2007-08 1839 427.70
2008-09 2204 474.54
2009-10 1462 574.83
2010-11 2931 566.04
2011-12 2570 654.49
2012-13 1948 730.23
2013-14 3010 2778.00
2014-15 3138 5903.75
2015-16 9144 14248.88 TOTAL 32895 27611.31
Source: Information compiled by the Office of the Principal Accountant General (A&E), Odisha.
The major defaulting departments were Panchayati Raj (` 10356.10 crore),
Housing & Urban Development (` 3664.27 crore), Planning and Co-ordination
(` 2719.70 crore), School and Mass Education (` 2292.78 crore), Health and
Family Welfare (` 1790.44 crore), Revenue and Disaster Management (` 1302.40
crore), ST, SC Development and Minorities & Backward Classes Welfare
(` 1045.43 crore) and Rural Development (` 1041.69 crore), comprising
` 24212.81 crore being 87.69 per cent of total outstanding UCs as of March 2016.
However, in comparison to 2014-15, pendency of UCs has decreased by ` 7577.64
crore involving 5419 number of Grants-in-Aid vouchers.
3.2 Non-submission / delay in submission of details of grants / loans
paid
In order to identify institutions / organisations which attract audit under Sections
14 and 15 of the Comptroller and Auditor General’s (Duties, Powers and
Conditions of Service) Act 1971(C&AG’s DPC Act), the Government / HODs are
required to furnish to Audit every year, detailed information about the financial
assistance given to various institutions, the purpose for which the assistance is
granted and the total expenditure of the institutions. Further, Regulation on Audit
and Accounts, 2007 provides that Governments and HODs, who sanction grants
and / or loans to bodies or authorities, shall furnish to the Audit by the end of July

Financial Reporting
Audit Report (State Finances)
for the year ended March 2016
65
every year a statement of such bodies, and authorities to which grants and / or
loans aggregating to ` 10 lakh or more were paid during the preceding year
indicating (a) the amount of assistance, (b) the purpose for which the assistance
was sanctioned and (c) the total expenditure of the body or authority. The above
obligation of the Government Departments and their HODs for furnishing
necessary information through Finance Department was also mentioned in the
C&AG's Report on State Finances for the years 2008-15 (paragraph 3.2).
However, during 2015-16, only 23 out of 40 departments have furnished
information regarding receipt of grants by the institutions / organisations under
their jurisdiction to the Accountant General as detailed in Appendix-3.2. Nine
new bodies2 were identified under Section 14(1) and 14(2) of C&AG's DPC Act
1971 during the year 2015-16.
3.3 Delays in Submission of Accounts of Autonomous Bodies
As many as 178 autonomous bodies under various sectors of the Government of
Odisha were identified for audit by the Comptroller and Auditor General of India,
covering verification and regulatory compliance audit of all their transactions,
operational activities and accounts, review of systems and procedures and internal
controls etc.
Twelve bodies / authorities were identified under CAG's DPC Act for submission
of accounts to audit as of March 2016. Of these, only three bodies / authorities
viz. Odisha State Legal Services Authority (OSLSA), Odisha State Police Housing
and Welfare Corporation Limited (OSPH&WC) and Odisha Forestry Sector
Development Project (OFSDP) submitted their accounts to audit up to 2014-15.
So far, the accounts of the remaining nine development authorities3 under section
19(3) of C&AG’s DPC Act have not been received in the Office of Accountant
General (G&SSA), Odisha as of October 2016, despite entrustment of audit to the
Comptroller and Auditor General of India.
3.4 Departmentally Managed Commercial Activities
Government departments which perform activities of quasi-commercial nature are
required to prepare proforma accounts in the prescribed format annually, showing
the working results of financial operations so that the Government can assess their
performance. The finalised accounts of departmentally managed commercial and
quasi-commercial activities reflect their overall financial health and efficiency in
conducting their business. In absence of timely finalisation of accounts, investment
2 (i) Odisha Land Record Modernization Society, (ii) Odisha Tribal Empowerment Livelihoods Programme
(OTELP), (iii) Academy of Tribal Language and Culture (ATLC), (iv) Odisha Tribal Development Society (OTDS),
(v) Odisha Model Tribal Education Society (OMTES), (vi) State Institute of Disability Rehabilitation, Odisha
(SIDR), (vii) Odisha State Child Protection Society (OSCPS), (viii) State Labour Institute (SLI) and (ix) State
Medicinal Plant Board, Mayur Bhawan, Saheed Nagar, Bhubaneswar.
3 (i) Bhubaneswar Development Authority, (ii) Berhampur Development Authority, (iii) Cuttack Development
Authority, (iv) Kalinganagar-Jajpur Development Authority, (v) Paradip Development Authority, (vi) Puri-Konark
Development Authority, (vii) Sambalpur Development Authority, (viii) Rourkela Development Authority, (ix)
Talcher-Angul-Meramundali Development Authority.

Financial Reporting
66 Audit Report (State Finances)
for the year ended March 2016
of the Government remains outside the scrutiny of the Audit/State Legislature.
Consequently, corrective measures, if any required, for ensuring accountability
and improving efficiency cannot be taken in time.
The CCO-cum-HODs of the Government are to ensure that these units prepare
proforma accounts and submit the same to the Accountant General (G&SSA) of
the State within a specified time-frame for audit. As of March 2016, there were 16
such undertakings and none had prepared accounts up to 2015-16, except Chief
Conservator of Forests, Kendu Leaves (Odisha), who has prepared the accounts up
to 2010-11. Of these, four undertakings remained inoperative or closed. Their
assets and liabilities were not fully disposed of or liquidated by the Government.
In respect of two schemes, viz. (i) Purchase and distribution of quality seeds to
cultivators and (ii) Poultry Development, Government had not, till date, prescribed
the methodology of preparation of proforma accounts. Only Personal Ledger
Accounts were opened during 1977-78 for ‘Purchase and distribution of quality
seeds to cultivators’.
Despite repeated recommendations4 of the State Public Accounts Committee and
comments in C&AG’s Reports (Civil) up to 2007-08 and thereafter in the Reports
on State Finances on Government of Odisha about the arrears in preparation of
these accounts, there was no improvement in so far as preparation of proforma
accounts by these undertakings is concerned. The department-wise position of
arrears in preparation of proforma accounts and investments made by the
Government are given in Appendix 3.3.
3.5 Inadequate departmental action on cases of
misappropriations, losses, defalcations etc.
As per provisions of OGFR Vol. I (Rule-19), Government Officers are empowered
to report such cases of loss of money, departmental revenue, stores or other
properties to immediate superior officers as well as to the Accountant General
(G&SSA), Odisha where the amount is ` 500 or more. Various departments of the
State Government reported that there were 713 cases of misappropriation,
defalcation, etc. involving Government money amounting to ` 15.99 crore up to
March 2016, on which final action was pending. The department-wise break up of
pending cases and age-wise analysis are given in Appendix 3.4 and nature of these
cases is given in Appendix 3.5. Age-wise profile of the pending cases and the
number of cases pending in each category of theft and misappropriation/loss as of
March 2016, as evident from these appendices, are summarised in Table 3.2 (i)
and Table 3.2 (ii).
4 10th Assembly 14th Report para 12 and 25, 10th Assembly 33rd Report para-2 and 6.

Financial Reporting
Audit Report (State Finances)
for the year ended March 2016
67
Table 3.2(i): Age -wise pending cases of misappropriations, losses, defalcations, etc.
Age-wise Pending Cases
Range in Years Number of cases Amount involved (` in lakhs)
2014-15 2015-16 2014-15 2015-16
0 - 5 12 23 53.88 130.82
5 - 10 43 39 159.47 128.61
10 - 15 69 69 264.36 232.47
15 - 20 227 208 270.74 331.56
20 - 25 272 246 394.99 367.47
25 & above 701 128 432.19 408.14
Total 1324 713 1575.63 1599.07
Source: Compiled from the information received from various departments of the State Government.
The above table indicates that though the number of cases of misappropriations,
losses and defalcations decreased to 713 from 1324, the amount involved had
increased from ` 15.76 crore to ` 15.99 crore in 2015-16 over the previous year.
Table 3.2(ii): Nature of pending cases of misappropriations, losses, defalcations, etc. Nature/Characteristics of the cases Number of cases Amount involved (` in lakhs)
Theft 393 396.77 Misappropriation/Loss of material 320 1202.30 Total 713 1599.07 Cases of Losses Written off during the
Year 0 0
Total Pending cases 713 1599.07
Source: Compiled from the information received from various departments of the State Government.
Reasons due to which the cases (Appendix-3.6) were outstanding are classified
into five categories, a summary of which is given in Table 3.3.
Table 3.3: Reasons for outstanding cases of misappropriations, losses and defalcations etc.
Reasons for Delay/Outstanding Pending cases Number
of cases
Amount
(` in lakh)
i) Awaiting departmental and criminal investigation 285 494.66 ii) Departmental action initiated but not finalised 277 743.24 iii) Criminal proceedings finalised but execution of
certificate cases for recovery of the amount pending 9 16.84
iv) Awaiting orders for recovery or write off 48 58.97 v) Pending in the courts of law 94 285.36 Total 713 1599.07
Source: Compiled from the information received from various departments of the State Government.
It is pertinent to mention here that as many as 285 cases involving ` 4.95 crore
were awaiting departmental and criminal investigation up to 36 years since the
year 1980-81. Similarly, 48 cases involving ` 0.59 crore were awaiting orders for
recovery or write off of the competent authority. The Departments concerned did
not furnish the reasons for non-finalisation of 277 misappropriation and loss cases
involving ` 7.43 crore, on which departmental action had been initiated.
3.6 Pendency in adjustment of Abstract Contingent Bills
As per provisions of SR 260 and 261 of Odisha Treasury Code Vol. I (OTC), read
with Rule 84 of the OGFR, every drawing officer has to certify in each Abstract

Financial Reporting
68 Audit Report (State Finances)
for the year ended March 2016
Contingent (AC) bill that the detailed bills for all contingent charges drawn by him
prior to first of the current month have been forwarded to the respective
Controlling Officers for counter signature and transmission to the Principal
Accountant General (A&E). The total amount of Detailed Contingent (DC) bills
received up to 2015-16 was only ` 633.42 crore (93.46 per cent) against AC bills
worth ` 677.72 crore drawn during 2005-06 to 2015-16, leading to outstanding
balance of DC bills of ` 44.31 crore as on 31 March 2016. Year-wise details are
given in Table 3.4.
Table 3.4: Pendency in submission of DC Bills against AC Bills
(` in crore)
Year
AC bills drawn DC bills outstanding Amount of outstanding DC
bills as percentage of AC
bills No. Amount No. Amount
Up to
2011-12
102216 338.18 364 2.06 0.61
2012-13 10227 74.14 17 3.82 5.15
2013-14 11122 130.78 118 14.75 11.28
2014-15 12862 72.23 148 6.89 26.89
2015-16 14816 62.39 2299 16.78 44.91
TOTAL 151243 677.72 2946 44.30 6.53
Source: Compiled from the information received from Principal Accountant General (A&E), Odisha.
Department-wise pendency of AC bills up to 2015-16 are detailed in Appendix-3.7
which shows that three major Departments viz. Home (` 29.84 crore), General
Administration (` 7.15 crore) and Transport (` 3.60 crore) accounted for 91.60
per cent of the total unadjusted AC bills. As the amount has already been charged
to the activities concerned as Revenue Expenditure, delayed adjustment of unspent
balances may lead to booking of excess cost than actual expenditure and is also
fraught with the risk of possible embezzlement of Government funds.
Withdrawal of money on an AC bill is accounted against the functional Major
Head in the Consolidated Fund. Unless the account is settled within the time
allotted, the expenditure stands inflated. This would impact the fiscal indicators of
the Government (Revenue surplus/Fiscal deficit).
3.6.1 Analysis of Pendency in adjustment of Abstract Contingent Bills of
Home Department
Home Department was reviewed by Audit for pendency of AC bills, since there
was withdrawal of funds on AC bills on large scale and non-adjustment/settlement
of substantial number of AC bills by way of submission of DC bills over the years.
An analysis of AC bill drawals in Voucher Level Computerisation (VLC) database
of the office of the Principal Accountant General (A&E) in respect of the Home
Department showed the following:

Financial Reporting
Audit Report (State Finances)
for the year ended March 2016
69
3.6.1.1 Money drawn on AC bills and retained with Drawing and Disbursing
Officers
At the time of drawal of funds through AC bill, the expenditure is booked under
the relevant service head. Therefore, it is essential to ensure utilisation of such
funds for the specific purpose within the stipulated period, but not later than 31
March of the financial year. Funds drawn through AC bills remaining outstanding
as of March 2016 are detailed in Table 3.5.
Table 3.5: Year-wise outstanding AC Bills of Home Department (` in crore)
AC Bill Drawn Outstanding DC bills
Year No. of items Amount No. of items Amount
Up to 2011-12 95843 260.68 229 1.16
2012-13 9648 54.08 5 0.01
2013-14 10471 119.39 99 14.38
2014-15 12209 51.24 96 4.91
2015-16 13981 52.19 2050 9.38
Total 142152 537.58 2479 29.84
Source: Information compiled by the Office of the Principal Accountant General (A&E), Odisha
Out of the total AC bills of ` 537.58 crore drawn up to 2015-16, DC bills for
` 29.84 crore remained outstanding for years, which raises serious concerns about
proper utilisation of the amounts drawn on AC bills. The outstanding DC bills for
years together further showed that Government funds drawn for various purposes
inter-alia on the plea of immediate disbursement had been irregularly retained at
DDO level. Further, Rule 261 of OTC requires that a certificate shall be furnished
by the DDOs to the effect that funds drawn on AC bills shall be spent within the
same financial year. However, the funds were carried forward to the next financial
year.
3.6.1.2 Drawal of AC bills in the month of March
As per Article 202 of the Constitution of India, State Government may spend
money within the authorised appropriation during the same financial year. Rule
242 of the OTC stipulated that no money should be drawn from the Treasury
unless it is required for immediate disbursement. Further, Rule 147 of Odisha
Budget Manual (OBM) provides that rush of expenditure in the closing month of
the financial year will ordinarily be regarded as breach of financial regularity,
which should be avoided.
Scrutiny of report generated through Voucher Level Computerisation (VLC) of the
office of the Principal Accountant General (A&E) showed that during 2011-12 to
2015-16, total amount of ` 106.18 crore was drawn in the month of March only,
which constituted 34.30 per cent of the total drawal of ` 309.53 crore during the
years, as detailed in the Table 3.6.

Financial Reporting
70 Audit Report (State Finances)
for the year ended March 2016
Table 3.6: Year-wise break up of AC bills during the month of March
(` in crore)
Sl.
No.
Year Total bills drawn
during the year
Drawal during the
month of March
Percentage against
total bills drawn
1 2011-12 32.63 6.24 19.12
2 2012-13 54.08 27.45 50.76
3 2013-14 119.39 61.03 51.12
4 2014-15 51.24 4.51 8.80
5 2015-16 52.19 6.95 13.32
Total 309.53 106.18 34.30
Source: Information compiled by the Office of the Principal Accountant General (A&E), Odisha
Amounts drawn in the month of March were indicative of the fact that the
likelihood of actual expenditure of such drawals within the concerned financial
year were remote and withdrawals were made merely to avoid lapse of
appropriation.
3.6.1.3 Drawal of funds on AC bills for Plan Expenditure
Drawal of Plan funds in AC bill is not permissible as the same are not of
contingent nature. Plan expenditure is intended to meet the distinct objectives of a
Programme /Scheme /Project of a Central/State Plan. As such, these are planned
well in advance and earmarked for meeting specific purposes as envisaged in the
concerned project/scheme details. Thus, there should be no occasion to draw
money through AC bills to make payments on the items of Plan expenditure under
them.
Table 3.7 below depicts the AC bills drawn for Plan expenditure of the Home
Department remaining outstanding as of March 2016.
Table 3.7: Year-wise AC bills drawn on Plan Scheme of Home Department
(` in lakh)
Sl.
No.
Year Drawal of AC bills on
Plan Scheme
(CP/SP/CSP)
No. of
items
Outstanding DC
bills on Plan Scheme
(CP/SP/CSP)
No. of
items
1 Up to
2011-12
174.70 51 56.51 15
2 2012-13 558.58 14 0 0
3 2013-14 0.10 2 0 0
4 2014-15 1.99 10 0.24 1
Total 735.37 77 56.75 16
Source: Information compiled by the Office of the Pr. Accountant General (A&E), Odisha
Out of total AC bills of ` 537.58 crore drawn for Home Department, ` 7.35 crore
were drawn for Plan Schemes, which constituted 1.36 per cent, out of which
` 0.57 crore, comprising 7.75 per cent of the total drawal for Plan Scheme,
remained outstanding as of March 2016. No AC bill was drawn under Plan
schemes during 2015-16. Withdrawal of funds under Plan Heads through AC bill
was indicative of the fact that project level planning was deficient, items of

Financial Reporting
Audit Report (State Finances)
for the year ended March 2016
71
expenditure were not linked while drawing the amount and, thus funds were
simply drawn for future use, awaiting finalisation of implementation modalities
and to avoid lapse of appropriation. As a result, the Government funds so drawn
on the ground of immediate requirement were allowed to be parked outside
Consolidated Fund at the end of each financial year.
3.7 Non-closure of inoperative / unwarranted Personal Deposit
(PD) Account
Note below Rule 141 read with sub-rule (3) of OBM provides that money should
neither be withdrawn from the Treasury unless it is required for immediate
disbursement nor is it permissible to draw money from the treasury under Revenue
heads of accounts which form a part of the Consolidated Fund of the State and for
placing it in Deposit head under Public Account of the State in order to avoid lapse
of allotment. Parking of funds in PD account adversely affects the transparency of
State accounts as it inflates the Revenue Expenditure to that extent and locks up
resources which otherwise can be utilised elsewhere for development. Further,
according to the provisions of the Odisha Treasury Code, Volume I (Rule 423), PD
accounts remaining inoperative for three full financial years are to be closed
automatically and the unspent balances transferred to Government Account for
which the Treasury Officers are to furnish detailed information to the Principal
Accountant General (A&E) immediately after 31 March of each financial year.
There were 849 PD Account holders in the State with a closing balance (unspent)
of ` 1242.47 crore operating under the head 8443 and 8448 as Personal Deposits at
the end of March 2016. During 2015-16, ` 2064.11 crore were transferred from
the Consolidated Fund of the State to these PD accounts and expenditure of
` 1967.72 crore was incurred therefrom, resulting in net increase of ` 96.39 crore
in the cumulative closing balance at the end of the year.
All such drawals had the approval of the CCOs of the concerned Departments
including the Finance Department. This practice resulted in erosion of legislative
control over expenditure, as drawals from PD Accounts in the subsequent years
neither required legislative approval nor was the expenditure incurred subject to
legislative authority through the appropriation mechanism.
3.8 Booking under Minor Head ‘800-Other Receipts and Other
Expenditure’
A crucial component of a transparent system of accounting is that the forms of
accounts in which the receipts and expenditure of the Government are reported to
the Legislature, are constantly reviewed and updated so that they correctly reflect
the receipt and expenditure on all major activities of the Government in a
transparent manner and to the level of disaggregation necessary to meet the basic
information needs of all the important stakeholders.

Financial Reporting
72 Audit Report (State Finances)
for the year ended March 2016
Booking under Minor Head ‘800-Other Receipts and 800-Other Expenditure’ is
opaque, as it does not disclose the schemes, programmes etc., to which they relate
to. It accommodates the expenditure which could not be classified under the
relevant Minor Head. As such, it does not reflect the receipts / expenditure of the
concerned Heads.
Scrutiny of State Finance Accounts 2015-16 showed that under 60 major heads of
account (both Revenue and Capital), ` 10118.45 crore (13.33 per cent) of the total
expenditure of ` 75896 crore, were classified under the minor head of account
‘800-Other Expenditure’ in the accounts, which also ranged between 11 and 100
per cent of the total expenditure under the respective major heads. Similarly, under
52 major heads of account (Revenue Receipt), ` 12645.12 crore (18.34 per cent)
out of total receipts of ` 68941 crore was classified under ‘800-Other Receipts’,
which ranged between 13 and 100 per cent of the total Revenue Receipts under
the respective major heads of account.
Large amounts booked under the minor head ‘800’ affects transparency in
financial reporting.
3.9 Labour Cess amounting to ₹ 965.26 crore kept in Account of a Board
without Legislative scrutiny.
The Building and Other Construction Workers (BOCW) (Regulation of
Employment and Conditions of Service) Act,1996 provides that the proceeds of
the labour cess shall be transferred to the head of account of the Board under the
accounting procedure of the State Government.
Scrutiny of records of Odisha Building and Other Construction Workers Welfare
Board (OB & OCWWB) showed that the cess collected by various agencies were
sent through cheques/drafts to the Board or deposited in the savings bank account
of the Board opened for the purpose through District Labour Offices. The cess so
collected was kept in the shape of savings bank account and fixed/term deposit in
violation of constitutional provisions and the BOCW Act 1996. The year-wise
position of receipt and expenditure of cess from 2011-12 to the end of 2015- 16 is
detailed in Table 3.8.
Table 3.8: Year-wise Receipt and Utilisation of Labour Cess
(` in crore)
Year Opening
Balance
Receipt Interest
Accrued
Total Expenditure Closing
Balance
2011-12 98.95 103.56 8.86 211.37 0.30 211.07
2012-13 211.07 132.23 25.43 368.73 0.81 367.92
2013-14 367.92 168.90 35.34 572.16 7.62 564.54
2014-15 564.54 211.13 36.72 812.39 38.85 773.54
2015-16 773.54 222.48 76.66 1072.68 107.42 965.26
Source: Compiled from the information received from Odisha Building and Other Construction Workers Welfare Board

Financial Reporting
Audit Report (State Finances)
for the year ended March 2016
73
Moreover, it can be seen from the table that during 2015-16, the board could
utilise only 10 per cent of the total money received up to the end of 2015-16.
The Board, however, stated (August 2016) that for early utilisation of labour cess
towards disbursement of different benefit schemes to the registered construction
workers, the cess fund was kept in Savings Bank Account of the Board and utilised
from that account. It was further stated that the Department of Labour and
Employees State Insurance, Government of Odisha has been moved ( September
2015 ) for amendment of the accounting procedure of Board for deleting the
treasury Head of Account and inserting deposit of labour cess in designated bank
account of the Board.
However, the reply of the Board was not tenable. Article-266(1) of the
Constitution of India provides that all revenues received by the State Government
shall form part of the Consolidated Fund of the State (CFS). Funds kept in the
Savings Bank accounts are not considered as part of the CFS.
3.10 Fund Management Practices
Fund management entails strict adherence to prescribed rules and procedures in
handling and retention of funds. Treasury and Financial Rules of the State
Government require that no money is drawn from treasury unless it is required for
immediate disbursement. All monetary transactions should be entered in the cash
book under proper attestation as soon as these occurred. Expenditure should not be
incurred on items for which there is no specific allotment and sanction of the
Government.
3.10.1 Advances amounting to ₹ 616.47 crore remaining unadjusted
As per Subsidiary Rule 37 Notes 9 of OTC Vol. I, the DDO is required to maintain
a Register of Advances showing all the particulars like date, name and designation
of the officer receiving the advances, the purpose for which it is given, date of
submission of accounts/ bill for payment made against such advances. The
accounts of advances so rendered, are required to be checked and passed by the
DDO. Further, as per Finance Department Notification (2nd December 1986), each
item of outstanding advances as appearing in the cash book of the DDO, is to be
analysed and adjusted within one month of disbursement, failing which, the salary
of the Government servant concerned should be withheld. Subsidiary Rule 509 of
OTC Vol.I envisages that the advance register should be reviewed frequently by
the DDO to ensure that all the advances are cleared by adjustment without delay.
Non-adherence not only results in understatement of actual expenditure but is also
fraught with the risk of improper and irregular utilisation of the advance so drawn.
Continued non-adjustment over a long period is also fraught with the risk of
misappropriation and embezzlement.

Financial Reporting
74 Audit Report (State Finances)
for the year ended March 2016
Test check of records of 10 District Rural Development Agencies and 20 Block
Development Offices showed that advances of ` 616.47 crore as of 31 March 2016
have not been adjusted. Age-wise analysis was also not available with these DDOs
due to non-preparation of the list of outstanding advances and improper
maintenance of the advance ledgers/registers.
In respect of 30 DDOs, advances amounting to ` 602.75 crore were still lying
unadjusted (Appendix-3.8) up to March 2016. Advances had been given to the
implementing agencies for execution of work, imparting training and supply of
agricultural implements.
3.10.2 Discrepancy of ` 31.26 crore due to non-reconciliation between bank
balance and cash book balance.
Reconciliation of bank account figure with that of cash book figure is required to
be done regularly at the end of each month in order to ensure accuracy of the
transactions entered in the books of accounts. DDOs were required to carry out
reconciliation at the end of each month to set right the mismatches/discrepancies,
if any.
Audit found that in 16 sample DDOs, difference of ` 31.26 crore (Appendix-3.9)
between the balances in cash book and bank pass book as of March 2016, was not
reconciled. In absence of reconciliation of cash balances, the authenticity of
accounts maintained by these DDOs could not be vouchsafed in audit.
3.11 Conclusion
There is pendency in receipt of UCs of grants-in-aid paid to various
autonomous bodies. Government released grants as a matter of routine
without keeping a watch on timely receipt of UCs for grants given earlier,
as required under the OGFR and sanction orders for release of such grants
(Paragraph 3.1).
As per reports of different departmental offices, 713 cases of
misappropriation / defalcation of Government money amounting to ` 15.99
crore were pending for settlement (Paragraph 3.5).
Contrary to the provisions of financial rules, Controlling Officers did not
submit Detailed Countersigned Contingent Bills to the Principal
Accountant General (A&E) in respect of ` 44.30 crore drawn on Abstract
Contingent Bills (2946 cases) up to 31 March 2016. Besides, some
departments allowed drawal of AC Bills despite AC Bills of earlier years
remaining unadjusted (Paragraph 3.6).
Labour cess amounting to ` 965.26 crore at the end of March 2016 was
kept in bank accounts, violating the resolution of the Government of
Odisha, Labour and Employees State Insurance Department (Paragraph
3.9).


AAppppeennddiicceess


Appendices
Audit Report (State Finances)
for the year ended March 2016
77
Appendix-1.1 (Refer Page 1)
A brief profile of Odisha
A. General Data Particulars Figures
1 Area 155707 Sq. Km
2
Population
a. As per 2001 Census 3.68 crore
b. As per 2011 Census 4.20 crore
3 Density of Population1 (as per 2011 Census).
(All India Density = 382 persons per Sq. Km ) 270 persons per Sq. Km
4 Population below poverty line2 (BPL) (All India Average = 29.5 per cent) 45.9 per cent
5 Literacy ( as per 2011 Census) (All India Average = 73.0 per cent ) 72.87 per cent
6 Infant mortality (per 1000 live births). (All India Average = 39 per 1000 l ive births ) 51
7 Life Expectancy at birth3. (All India Average = 67.5 years) 64.8 years
8
Gini-Coefficient
a. Rural. (All India = 0.29) 0.26
b. Urban. (All India = 0.38) 0.39
9 Gross State Domestic Product (GSDP) 2015-16 at current price `332329 crore
10 Per Capita GSDP CAGR
(2006-07 to 2015-16)
Odisha 14.45
General Category States 14.27
11 GSDP CAGR (2006-07 to 2015-16) Odisha 15.48
General Category States 15.75
12 Population Growth (2006 to 2015) Odisha 8.45
General Category States 12.24
B. Financial Data Particulars
CAGR 2006-07 to 2014-15 2014-15 to 2015-16
General
Category States Odisha
General
Category States Odisha
(In per cent)
a. of Revenue Receipts. 14.74 15.47 15.00 20.95
b. of Own Tax Revenue. 15.08 15.96 13.28 13.61
c. of Non Tax Revenue. 10.20 15.28 6.00 7.93
d. of Total Expenditure. 16.71 17.27 16.42 21.84
e. of Capital Expenditure. 13.21 28.92 25.80 54.31
f. of Revenue Expenditure on Education. 17.08 18.87 12.17 13.07
g. of Revenue Expenditure on Health. 18.70 23.02 13.44 18.94
h. of Salary and Wages. 15.49 15.27 9.95 13.02
i. of Pension. 18.59 20.07 11.79 -1.11
Gini-coefficient is a measure of inequality of income among the population. Value rate is from zero to one,
closer zero inequality is less: closer to one inequality is higher
1 Census Info India 2011 Final Population Totals 2 Report of the Expert Group(Rangarajan) to Review the methodology for Measurement of Poverty, Planning Commission (June 2014) 3 Economic Survey for 2015-16,Table-9.1, Page – A-129

Appendices
78 Audit Report (State Finances)
for the year ended March 2016
APPENDIX - 1.2 (Refer paragraph 1.1)
Structure and Form of Government Accounts
Part A: Structure and Form of Government Accounts
Structure of Government Account: The accounts of the State Government are kept in three parts
(i) Consolidated Fund, (ii) Contingency Fund and (iii) Public Account.
Part I: Consolidated Fund: All revenues received by the State Government, all loans raised by issue of treasury bills, internal and external loans and all moneys received by the Government in
repayment of loans shall form one consolidated fund entitled 'The Consolidated Fund of State'
established under Article 266(1) of the Constitution of India.
Part II: Contingency Fund: Contingency Fund of the State established under Article 267(2) of
the Constitution is in the nature of an imprest placed at the disposal of the Governor to enable him
to make advances to meet urgent unforeseen expenditure, pending authorisation by the Legislature.
Approval of the Legislature for such expenditure and for withdrawal of an equivalent amount from
the Consolidated Fund is subsequently obtained, whereupon the advances from the Contingency Fund are recouped to the Fund.
Part III: Public Account: Receipts and disbursements in respect of certain transactions such as
small savings, provident funds, reserve funds, deposits, suspense, remittances etc. which do not
form part of the Consolidated Fund, are kept in the Public Account set up under Article 266(2) of
the Constitution and are not subject to vote by the State Legislature.
PART B: Layout of Finance Accounts Statement No. About
Volume - I
1 Statement of Financial Position
2 Statement of Receipts and Disbursements
Annexure A. Cash Balances and Investment of Cash Balances
3 Statement of Receipts (Consolidated Fund)
4 Statement of Expenditure (Consolidated Fund)
5 Statement of Progressive Capital Expenditure 6 Statement of Borrowings and other Liabilities 7 Statement of Loans and Advances given by the Government 8 Statement of Investments of the Government 9 Statement of Guarantees given by the Government
10 Statement of Grants-in-Aid given by the Government 11 Statement of Voted and Charged Expenditure 12 Statement on Sources and Application of funds for expenditure other than revenue
account
13 Summary of Balances under Consolidated Fund, Contingency Fund and Public Account
Volume - II
14 Detailed Statement of Revenue and Capital Receipts by Minor heads
15 Detailed Statement of Revenue Expenditure by Minor heads
16 Detailed Statement of Capital Expenditure by Minor heads and Sub heads
17 Detailed Statement of Borrowings and Other Liabilities
18 Detailed Statement of Loans and Advances given by the State Government
19 Detailed Statement of Investments of the Government
20 Detailed Statement of Guarantees given by the Government
21 Detailed Statement on Contingency Fund and Other Public Account transactions
22 Detailed Statement on Investment of Earmarked Funds

Appendices
Audit Report (State Finances)
for the year ended March 2016
79
APPENDIX – 1.3 (Refer paragraph 1.2)
Time Series data on the State Government Finances
(₹ in crore) 2011-12 2012-13 2013-14 2014-15 2015-16
Part A. Receipts
1. Revenue Receipts 40267 43937 48947 56998 68941
(i) Tax Revenue 13443 (34) 15034(34) 16892(35) 19828(35) 22527(33)
Taxes on Agricultural Income Nil Nil Nil Nil Nil
Taxes on Sales, Trade, etc 8197(61) 9685(64) 10729(64) 11817(60) 13097(58)
State Excise 1379(10) 1499(10) 1780(11) 2035(10) 2547(11)
Taxes on Vehicles 788(6) 746(5) 860(5) 910(5) 1044(5)
Stamps and Registration fees 498(4) 545(4) 606(4) 800(4) 2157(10)
Land Revenue 522(4) 420(3) 431(3) 646(3) 589(3)
Taxes on Goods and Passengers 1312(10) 1342(9) 1613(10) 1711(9) 1663(7)
Other Taxes 747(5) 797(5) 873(5) 1909(10) 1430(6)
(ii) Non-Tax Revenue 6443(16) 8078(18) 8379(17) 8071(14) 8711(13)
(iii) State's share of Union taxes and duties 12229(30) 13965(32) 15247(31) 16181(28) 23574(34)
(iv) Grants in aid from Government of
India *
8152(20) 6860(16) 8429(17) 12918(23) 14129(20)
2. Miscellaneous Capital Receipts Nil Nil 0.03 Nil Nil
3. Recoveries of Loans and Advances 132 142 257 92 228
4. Total Revenue and Non debt capital
receipts (1+2+3) 40399 44079 49204 57090 69169
5. Public Debt Receipts 1354 1880 2290 7646 9790
Internal Debt (excluding Ways and Means Advances and Overdrafts)
1121 1436 1740 6035 9051
Net transactions under Ways and Means Advances and Overdrafts
Nil Nil Nil Nil Nil
Loans and Advances from
Government of India
233 444 550 529 739
6. Total Receipts in the Consolidated
Fund (4+5)
41753 45959 51494 64736 78959
7. Contingency Fund Receipts 375 16 -- 150 --
8. Public Account Receipts 15487 27545 32677 24801 31098
9. Total Receipts of the State
(6+7+8)
57615 73520 84171 89687 110057
Part B. Expenditure/Disbursement
10. Revenue Expenditure 34660(87) 38238(87) 45618(85) 51136(82) 58806(77)
Plan 9720(28) 11593(30) 15008(33) 18877(37) 23270(40)
Non-Plan 24940(72) 26645(70) 30610(67) 32259(63) 35536(60)
General Services
(including interest payments)
10929(32) 12423(32) 13689(30) 14529(28) 15059(26)
Social Services 14338(41) 14977(39) 18722(41) 20964(41) 24643(42)
Economic Services 8732(25) 10196(27) 12315(27) 14826(29) 18188(31)
Grants-in-Aid and Contributions 661(2) 642(2) 892(2) 817(2) 916(1)
11. Capital Expenditure 4496(11) 5622(13) 7756(14) 11075(18) 17090(22)
Plan 4435(99) 5603(99) 7598(98) 11057(100) 17076(100)
Non-Plan 61(1) 19(1) 158(2) 18 14
General Services 258(6) 351(6) 470(6) 390(4) 425(3)
Social Services 657(14) 1205(22) 1725(22) 2288(21) 2929(17)
Economic Services 3581(80) 4066(72) 5561(72) 8397(76) 13737(80)
*aExcludes funds transferred directly to NGOs / VOs in the State.

Appendices
80 Audit Report (State Finances)
for the year ended March 2016
2011-12 2012-13 2013-14 2014-15 2015-16 12. Disbursement of Loans and Advances 621(2) 216(1) 463(1) 358(1) 337(1)
13. Total Expenditure (10+11+12) 39777 44076 53837 62569 76233
14. Repayments of Public Debt 2328 3180 2293 4111 2881
Internal Debt (excluding Ways and Means Advances and Overdrafts)
1781 2666 1775 2379 2254
Net transactions under Ways and Means Advances and Overdraft
Nil Nil Nil Nil Nil
Loans and Advances from Government of India
547 514 518 650 628
15. Appropriation to Contingency Fund Nil Nil Nil Nil Nil
16. Total disbursement out of
Consolidated Fund (13+14+15)
42105 47256 56130 66680 79114
17. Contingency Fund disbursements 3 -- 150 Nil 123
18. Public Account disbursements 14023 24886 31257 22511 28766
19. Total disbursement by the State
(16+17+18)
56131 72142 87537 89191 108003
Part C. Deficits
20. Revenue Deficit (-)/Revenue
Surplus (+) (1-10) 5607 5699 3329 5862 10135
21. Fiscal Deficit (-)/Fiscal
Surplus (+) (4-13) 622 3 (-)4633 (-)5479 (-)7064
22. Primary Deficit(-)/Primary
Surplus(+) (21+23) 3198 2810 (-)1745 (-)2669 (-)3721
Part D. Other data
23. Interest Payments (included in
revenue expenditure) 2576 2807 2888 2810 3343
24. Financial Assistance to local bodies
etc. 9065 7023 9495 13686 17779
25. Ways and Means
Advances/Overdraft availed (days)
-- -- -- 3 --
Ways and Means Advances availed (days)
Nil Nil Nil 3 Nil
Overdraft availed (days) Nil Nil Nil Nil Nil
26. Interest on Ways and Means
Advances/ Overdraft Nil Nil Nil 1 Nil
27 Gross State Domestic Product
(GSDP) 225283 255273 277271 309807 332329
28 Outstanding Fiscal liabilities
(year end) 42467 43344 44714 50493 59753
29. Outstanding guarantees (year end)
(including interest) 2510 2251 1705 1672 1290
30. Maximum amount guaranteed
(year end) 10579 10579 10625 10886 10891
31. Number of incomplete projects 150 151 190 206 31
32. Capital blocked in incomplete
projects 352 347 874 1073 2323
Part E: Fiscal Health Indicators
I Resource Mobilisation
Own Tax Revenue/GSDP 5.97 5.89 6.09 6.4 6.78
Own Non-Tax Revenue/GSDP 2.86 3.16 3.02 2.61 5.24
Central Transfers/GSDP 5.43 5.47 5.5 5.22 7.09
II Expenditure Management
Total Expenditure/GSDP 17.66 17.27 19.42 20.2 22.94
Total Expenditure/Revenue Receipts 559.47 581 566.47 543.54 482.05
Revenue Expenditure/Total Expenditure 87.14 86.75 84.73 81.73 77.14

Appendices
Audit Report (State Finances)
for the year ended March 2016
81
2011-12 2012-13 2013-14 2014-15 2015-16
Expenditure on Social Services/Total Expenditure 36.05 33.98 34.78 33.51 32.33
Expenditure on Economic Services/Total Expenditure 21.95 23.13 22.87 23.7 23.86
Capital Expenditure/Total Expenditure 11.3 12.76 14.41 17.7 22.42
Capital Expenditure on Social and
Economic Services/Total Expenditure. 10.65 11.96 13.53 17.08 21.86
III Management of Fiscal Imbalances
Revenue Deficit (Surplus)/GSDP 2.49 2.23 1.2 1.89 3.05
Fiscal Deficit/GSDP 0.28 0 (-)1.67 (-)1.77 (-)2.13
Primary Deficit (Surplus) /GSDP 1.42 1.1 (-)0.63 (-)0.86 (-)1.12
IV Management of Fiscal Liabilities
Fiscal Liabilities/GSDP 18.85 16.98 16.13 16.3 17.98
Fiscal Liabilities/RR
V Other Fiscal Health Indicators
Return on Investment 9.84 19.04 13.67 30.71 14.26
Balance from Current Revenue
(` in crore)
9946 12437 12637 18493 34604
Financial Assets/Liabilities 1.07 1.19 1.25 1.32 1.43

Appendices
82 Audit Report (State Finances)
for the year ended March 2016
APPENDIX – 1.4 (Refer paragraph 1.2)
Abstract of receipts and disbursements for the year 2015-16
(` in crore) 2014-15 Receipts 2015-16 2014-15 Disbursements Non-Plan Plan 2015-16
Section A: Revenue
56997.88 I.Revenue
Receipts 68941.44 51135.74 I.Revenue
Expenditure- 58805.70
19828.30 -Tax Revenue 22526.95 14528.86 General Services 14961.85 96.81 15058.66
-- -- 20964.13
Social Services- 12171.53 12471.63 24643.16
8070.87 -Non-Tax Revenue 8711.24 9822.05 -Education, Sports,
Art and Culture - - 11055.58
-- -- 2773.53 -Health and Family
Welfare - - 3154.57
16181.22 -State’s Share of
Union Taxes 23573.79 1892.51 -Water Supply,
Sanitation, Housing
and Urban
Development
- - 3086.20
-- -- -- 41.94 -Information and
Broadcasting - - 45.89
1929.34 -Non-Plan Grants 3062.63 1429.34 -Welfare of
Scheduled Castes,
Scheduled Tribes and
Other Backward
Classes
- - 1856.57
10886.18 -Grants for State
Plan Schemes 10773.42 262.16 -Labour and Labour
Welfare - - 251.98
-- -- -- 4610.89 -Social Welfare and
Nutrition - - 5027.72
101.98 -Grants for Central
and Centrally
Sponsored Plan
Schemes
293.41 131.69 -Others - - 164.65
-- -- -- 14825.38 Economic Services- 7486.27 10701.85 18188.12
-- -- -- 5613.46 -Agriculture and
Allied Activities - - 5802.49
-- -- -- 4446.25 -Rural Development - - 7400.21
-- -- -- -- -Special Areas
Programmes - -
-- -- -- 1376.40 -Irrigation and Flood
Control - - 1812.85
-- -- -- 44.96 -Energy - - 52.76
-- -- -- 374.73 -Industry and
Minerals - - 485.80
-- -- -- 1895.54 -Transport - - 1845.50
-- -- -- 54.09 -Science, Technology
and Environment - - 46.12
-- -- -- 1019.94 General Economic
Services - - 742.39
-- -- -- 817.37 Grants-in-aid and
Contributions- - - 915.25
-- II. Revenue deficit
carried over to
-- 5862.14 II. Revenue Surplus
carried over - - 10135.74
Section B : Capital
9510.30 III. Opening Cash
balance including
Permanent
Advances and Cash
Balance Investment
-- -- III. Opening
Overdraft from
Reserve Bank of
India
-- -- --

Appendices
Audit Report (State Finances)
for the year ended March 2016
83
2014-15 Receipts 2015-16 2014-15 Disbursements Non-Plan Plan 2015-16
-- IV.Miscellaneous
Capital Receipts
-- 11074.63 IV. Capital Outlay- -- -- 17090.48
-- -- -- 389.80 General Services- 14.00 411.01 425.01
-- -- -- 2288.39 Social Services- 4.87 2923.68 2928.55
-- -- -- -- -Education, Sports,
Art and Culture -- 501.66 501.66
-- -- -- 413.78 -Health and Family
Welfare -- 525.99 525.99
-- -- -- 838.79
-Water Supply,
Sanitation, Housing
and Urban
Development
4.87 997.44 1002.31
-- -- -- -- -Information and
Broadcasting -- --
--
-- -- -- 436.02
-Welfare of
Scheduled Castes,
Scheduled Tribes and
Other Backward
Classes
-- --
559.73
-- -- -- 143.99 -Social Welfare and
Nutrition -- -- 219.97
-- -- -- 94.91 -Others -- -- 118.88
-- -- -- -- Economic Services- -4.13 13741.05 13736.92
-- -- -- 141.55 -Agriculture and
Allied Activities -1.70 361.36 359.66
-- -- -- -- -Rural Development -- -- --
-- -- -- 148.50 -Special Areas
Programmes -- 148.50 148.50
-- -- -- 2850.79 -Irrigation and Flood
Control -- 4173.23 4173.23
-- -- -- 596.50 -Energy -- 1398.64 1398.64
-- -- -- (-)2.95 -Industry and
Minerals -2.95 1.99 (-)0.95
-- -- -- 4558.30 -Transport 7554.50
-- -- -- 103.75
General Economic
Services -- --
--
91.87 V. Recoveries of
Loans and
Advances-
228.45 358.00 V. Loans and
Advances
disbursed-
336.54 -- 336.54
-- -From Power
Projects -- 130.42 -For Power Projects 118.75 -- 118.75
66.08 -From Government
Servants 66.19 90.40 -To Government
Servants 91.02
--
91.02
25.79 -From Others -- 137.18 -To Others -- -- --
5862.14 VI. Revenue
Surplus brought
down
10135.74 -- VI. Revenue Deficit
brought down -- -- --
7645.63 VII. Public Debt
Receipts- 9789.82 4111.45 VII. Repayment of
Public Debt- -- -- 2881.37
-- -External debt -- -- -External debt -- --
6034.48 -Internal debt other
than Ways and
Means Advances
and Overdrafts
9051 2379.44 -Internal Debt other
than Ways and
Means Advances and
Overdrafts
-- -- 2254
-- Net transactions
under Ways and
Means Advances
-- -- - Net transactions
under Ways and
Means Advances
-- -- --
-- - Net transactions
under Overdraft -- -- -Net transactions
under Overdraft -- -- --
529.10 -Loans and
Advances from
Central
Government
739.24 -- -Repayment of Loans
and Advances to
Central Government
-- -- 627.67
-- VIII.
Appropriation to
Contingency Fund
-- -- VIII. Appropriation
to Contingency Fund -- -- --
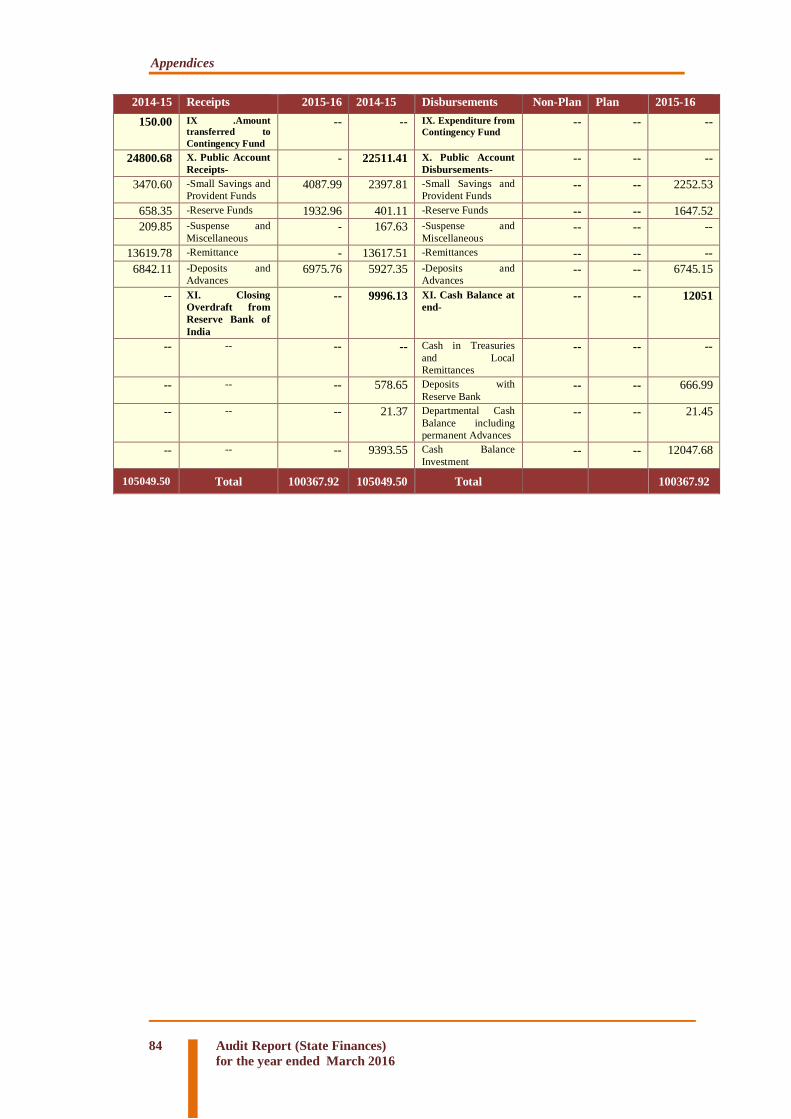
Appendices
84 Audit Report (State Finances)
for the year ended March 2016
2014-15 Receipts 2015-16 2014-15 Disbursements Non-Plan Plan 2015-16
150.00 IX .Amount
transferred to
Contingency Fund
-- -- IX. Expenditure from
Contingency Fund -- -- --
24800.68 X. Public Account
Receipts- - 22511.41 X. Public Account
Disbursements- -- -- --
3470.60 -Small Savings and
Provident Funds 4087.99 2397.81 -Small Savings and
Provident Funds -- -- 2252.53
658.35 -Reserve Funds 1932.96 401.11 -Reserve Funds -- -- 1647.52
209.85 -Suspense and
Miscellaneous - 167.63 -Suspense and
Miscellaneous -- -- --
13619.78 -Remittance - 13617.51 -Remittances -- -- --
6842.11 -Deposits and
Advances 6975.76 5927.35 -Deposits and
Advances -- -- 6745.15
-- XI. Closing
Overdraft from
Reserve Bank of
India
-- 9996.13 XI. Cash Balance at
end- -- -- 12051
-- -- -- -- Cash in Treasuries
and Local
Remittances
-- -- --
-- -- -- 578.65 Deposits with
Reserve Bank -- -- 666.99
-- -- -- 21.37 Departmental Cash
Balance including
permanent Advances
-- -- 21.45
-- -- -- 9393.55 Cash Balance
Investment -- -- 12047.68
105049.50 Total 100367.92 105049.50 Total 100367.92

Appendices
Audit Report (State Finances)
for the year ended March 2016
85
APPENDIX – 1.5 (Refer paragraph 1.7.6)
DDO-wise parking of fund in Banks amounting to ` 899 crore Drawing and Disbursing
Officer
OpeningB
alance Receipt Total Expenditure
Closing
Balance
BDO - Puintala, Balangir 20.14 10.95 31.09 14.96 16.13
BDO - Balangir Sadar 22.86 18.23 41.09 21.10 19.99
BDO – Barang, Cuttack 7.91 1.98 9.89 5.14 4.75
BDO - Cuttack Sadar 33.10 22.79 55.89 22.05 33.84
BDO – Jharsuguda Sadar 22.83 14.48 37.31 20.05 17.26
BDO – Laikera, Jharsuguda 14.30 12.74 27.04 15.03 12.01
BDO - Raghunathpur, Jagatsinghpur 10.31 7.29 17.60 9.98 7.62
BDO - Biridi, Jagatsinghpur 7.47 6.57 14.04 8.07 5.97
BDO – Koraput Sadar 5.25 4.23 9.48 5.79 3.69
BDO – Jeypore, Koraput 7.57 5.01 12.58 7.78 4.80
BDO – Bhawanipatna, Kalahandi 27.72 27.31 55.03 33.21 21.82
BDO – Junagarh, Kalahandi 34.89 40.08 74.97 43.39 31.58
BDO – Ghatagaon, Keonjhar 17.60 27.25 44.85 31.62 13.23
BDO – Keonjhar Sadar 12.82 18.32 31.14 21.64 9.50
BDO – Begunia, Khurda 28.27 17.44 45.71 23.49 22.22
BDO – Jatni, Khurda 14.97 12.23 27.20 13.42 13.78
BDO – Puri Sadar 29.73 31.84 61.57 33.69 27.88
BDO – Dhankauda, Sambalpur 30.12 19.19 49.31 24.56 24.75
BDO – Maneswar, Sambalpur 26.59 21.64 48.23 25.15 23.08
BDO – Sundargarh Sadar 10.49 27.12 37.61 24.47 13.14
BDO – Bargaon, Sundergarh 14.07 17.53 31.60 18.31 13.29
TOTAL (BDOs) 399.01 364.22 763.23 422.90 340.33
DRDA - Balangir 77.22 118.48 195.70 140.89 54.81
DRDA - Cuttack 2.38 0.15 2.53 0.48 2.05
DRDA - Jagatsinghpur 5.83 23.97 29.80 27.35 2.45
DRDA - Jharsuguda 9.08 32.33 41.41 25.51 15.90
DRDA - Kalahandi 10.87 67.45 78.32 44.61 33.71
DRDA - Keonjhar 31.48 88.00 119.48 80.62 38.86
DRDA - Khurda 29.32 51.72 81.04 63.29 17.75
DRDA - Koraput 4.82 100.66 105.48 71.37 34.11
DRDA - Puri 26.17 107.31 133.48 115.12 18.36
DRDA - Sambalpur 5.48 44.68 50.16 41.38 8.78
DRDA - Sundargarh 7.15 104.82 111.97 104.92 7.05
TOTAL (DRDAs) 209.80 739.57 949.37 715.54 233.83
Special Land Acquisition
Officer,Lower Suktel Irrigation
Project, Balangir 86.97 1.80 88.77 3.06 85.71
Project Director,Subarnarekha
Irrigation Project,Baripada,
Mayurbhanj 193.47 52.62 246.09 78.87 167.22
Land Acquisition Office,Lower
Indra Irrigation Project, Khariar,
Nuapada 73.37 0.05 73.42 1.45 71.97
TOTAL (Land Acquisition Office) 353.81 54.47 408.28 83.38 324.90
Grand Total 962.62 1158.26 2120.88 1221.82 899.06

Appendices
86 Audit Report (State Finances)
for the year ended March 2016
APPENDIX – 1.6 (Refer paragraph 1.8.3)
Statement of outcome budget during the financial year 2015-16
Fisheries and Animal Resources Development Department
(₹ in lakh)
Sl.
No.
Name of the Scheme FINANCIAL PHYSICAL
Financial
Outlay for
2015-16
Financial Achievement
Shortfall Physical
Target
Physical Achievement
Shortfall
1 Assistance to Matsyajibi Basagruha Yojana
80000 80000
(100%)
Nil 1066 houses
31 houses
(3%)
1906 houses
(97%)
2 Interest Subvention on Short term Credit Support to Fish Farmers.
21147 21147
(100%)
Nil 2000 ha 151.20 ha
(8%)
1848.80
(92%)
3 Interest Subvention on Long term Credit Support to Fish Farmers.
30000 30000
(100%)
Nil 1000 ha 349.47 ha
(35%)
650.53 ha
(65%)
Rural Development Department
(₹ in lakh)
Sl.
No.
Name of the Scheme FINANCIAL PHYSICAL
Financial
Outlay
Financial
Achievement
Shortfall Physical
Target
Physical
Achievement
Shortfall
1 Mukhya Mantri Sadak Yojana
19500 19295 205 500 Km 136.14Km
(27%)
363.86
(73%)
2 Construction of R.D. department buildings
322 318 4 209 84
(40%)
125
(60%)
3 Construction of Bailey
Bridge
18000 18000 0 92 41
(45%)
51
(55%)
4 Improvement of existing
R.D.Roads
5304 4730 574 40 15
(37%)
25
(63%)
Energy Department (₹ in lakh)
Sl.
No.
Name of the Scheme FINANCIAL PHYSICAL
Financial
Outlay
Financial
Achievement
Shortfall Physical
Target
Physical
Achievement
Shortfall
1 State Capital Region Improvement of Power System(SCRIPS)
7000 7000 0 Underground cabling of 132 KV
Engagement of
Consultants was in
progress
--

Appendices
Audit Report (State Finances)
for the year ended March 2016
87
Agriculture Department (₹ in lakh)
Sl.
No.
Name of the Scheme FINANCIAL PHYSICAL
Financial
Outlay
Financial
Achievement
Shortfall Physical
Target
Physical
Achievement
Shortfall
1 Potato Vegetable and Spices
1923 984
(51%)
939
(49%)
500000 24922
(5%)
475078
(95%)
Works Department (₹ in lakh)
Sl.
No.
FINANCIAL PHYSICAL
Name of the Scheme Financial
Target
Financial
Achievement
Shortfall Physical
Target
Physical Achievement
Shortfall
1 Odisha State Road Project (EAP)
26200 7973
(30%)
18227
(70%)
80 Km 26 Km
(32%)
54 Km
(68%)

Appendices
88 Audit Report (State Finances)
for the year ended March 2016
APPENDIX – 1.7 (Refer paragraph 1.10.1)
Summarised financial postion of the Government of Odisha as on 31 March 2016
(₹ in crore)
As on 31
March 2015 As on 31 March
2016
Liabilities
19727.92 Internal Debt - -- 26524.80
4564.76 Market Loans bearing interest -- 8128.03
0.09 Market Loans not bearing interest -- 0.08
1.01 Loans from Life Insurance Corporation of India
-- 1.85
15162.06 Loans from other Institutions -- 18394.84
-- Ways and Means Advances -- --
-- Overdrafts from Reserve Bank of India -- --
7120.67 Loans and Advances from Central
Government -
-- 7232.25
0.56 Pre 1984-85 Loans -- 0.56
24.14 Non-Plan Loans -- 22.19
7095.98 Loans for State Plan Schemes -- 7209.50
-- Loans for Central Plan Schemes -- --
-- Loans for Centrally Sponsored Plan Schemes
-- --
400.00 Contingency Fund -- 400.00
16425.31 Small Savings, Provident Funds, etc. -- 18260.77
6890.16 Deposits -- 7120.78
5852.28 Reserve Funds Advances -- 6137.72
99.22 Suspense and Miscellaneous Balances -- 130.83
23.67 Remittance Balances -- --
698.15 Miscellaneous Capital Receipts -- 698.15
18493.22 Cumulative excess of receipts over
expenditure
-- 28624.82
75730.60 Total 95130.12
Assets
61277.11 Gross Capital Outlay on Fixed Assets - -- 78363.46
3504.87 Investments in shares of Companies,
Corporations, etc. -- 3881.32
57772.24 Other Capital Outlay -- 74482.14
4449.19 Loans and Advances - -- 4557.27
2979.55 Loans for Power Projects -- 3098.30
1100.27 Other Development Loans --
369.37 Loans to Government servants and Miscellaneous loans
--

Appendices
Audit Report (State Finances)
for the year ended March 2016
89
As on 31
March 2015 As on 31 March
2016
Assets
10.73 Advances -- 11.11
-- Remittance Balances -- 27.70
-- Suspense and Miscellaneous Balances -- --
9993.57 Cash - -- 12047.68
-- Cash in Treasuries and Local Remittances -- --
578.65 Deposits with Reserve Bank -- 666.99
21.37 Departmental Cash Balance including
Permanent Advances
-- 21.45
Security Deposits -- --
5523.00 Investment of Earmarked Funds -- 5523.00
3870.55 Cash Balance Investments -- 5836.24
-- Deficit on Government Account - -- --
-- (i) Less Revenue Surplus of the current year
-- --
150.00 (ii) Appropriation to Contingency Fund -- 122.90
-- Accumulated deficit at the beginning of the year
-- --
75730.60 Total -- 95130.12
** Included under Suspense and Miscellaneous
Note: Closing balance of the contingency fund has been taken under liabilities
Explanatory Notes for Appendices 1.3 and 1.4
The abridged accounts in the foregoing statements have to be read with comments and explanations in the
Finance Accounts. Government accounts being mainly on cash basis, the deficit on Government account, as
shown in Appendix 1.4, indicates the position on cash basis, as opposed to accrual basis in commercial
accounting. Consequently, items payable or receivable or items like depreciation or variation in stock figures,
etc., do not figure in the accounts. Suspense and Miscellaneous balances include cheques issued but not paid,
payments made on behalf of the State and other pending settlements, etc. There was a difference of ₹ 3.67
crore (Net Debit) between the figure reflected in the Accounts ₹ 669.99 crore (Net Debit) and that intimated
by the Reserve Bank of India ₹ 663.32 crore (Net Credit) relating to deposits with Reserve Bank of India
included in the Cash Balance. After reconciliation and adjustment the difference to the extent ₹ 1.79 crore
(Net Debit) remains to be reconciled (June-2016).

Appendices
90 Audit Report (State Finances)
for the year ended March 2016
APPENDIX – 1.8 (Refer paragraph 1.13)
Status of Public Private Partnership Projects in Odisha as on 31 March 2016 COMPLETED PPP PROJECTS
Sl.
No. Name of Project PPP Type Status Remarks
Sector: Urban Development
1 Market-cum-Residential Complex at Bhubaneswar
DBT Operational --
2 Commercial Shopping Complex at Bhubaneswar
DBOO Operational --
3 A.C. Market Complex at Bhubaneswar
DBOT Operational --
4 City Bus Service for larger Sambalpur region
O&M Operational --
5 City Bus Service for Rourkela-Biramitrapur-Rajagangapur
O&M Operational M/s Sampark is the concessionaire
6 City Bus Service for Berhampur-
Gopalpur-Chhatrapur-Hinjilicatu
O&M Operational Mr.P.Anil Kumar is the
concessionaire 7 City Bus Service in Koraput-Jeypore-
Sunabeda
O&M Operational Mr.Ashok Kumar Ray is
the concessionaire 8 City Bus Service in Cuttack-
Choudwar – Athagarh-Banki
O&M Operational M/s Sahara Roadways is
the concessionaire 9 City Bus Service in Bhubaneswar -
Puri
O&M Operational --
10 Energy efficient public street lighting project in Bhubaneswar
DBFOT Operational Consortium of M/s Saha Investments is the
concessionaire Sector: Health
11 Magnetic radio imaging centre at SCB
Medical College
BOT Operational M/s. Kolkata Imaging
Institute is the concessionaire.
12-20
Management of nine (09) primary health care centres in Keonjhar (1),
Cuttack (3), Kendrapara (2) and Balasore (3)
O&M Operational Service level standards are defined. Costs were borne
out of CSR funds by corporate.
21 Odisha Emergency Medical Ambulance Service
(a) 108 Service
(b) 102 Service (for pregnant women and sick infants
under JSSK)
O&M Operational M/s. Zigitsa is the concessionaire.
Sector: Finance & Revenue Related
22 e-registration System (e-dharani) O&M Operational --
Sector: Transport
23 Minor port at Dhamara BOOST Operational M/s DPCL is the concessionaire
24 Minor brownfield port at Gopalpur BOOST Operational M/s GPL is the concessionaire. Phase-I is
operational. Land acquisition for Phase-II is
under way.
25 Driving Training Institute at Chhatia O&M Operational Under Central Government Scheme. M/s
Ashok Leyland is the concessionaire.
Sector: Industrial Infrastructure
26 Up-gradation of common infrastructure in Kalinganagar
Beneficiary participation
Operational Under the Industrial Infrastructure Upgradation

Appendices
Audit Report (State Finances)
for the year ended March 2016
91
Sl.
No. Name of Project PPP Type Status Remarks
Industrial Complex Scheme (IIUS) Scheme.
27 Up-gradation of common infrastructure in plastics and polymers
park in Balasore
Beneficiary participation
Operational Under the IIUS Scheme.
Sector: Roads
28 29 km Palaspanga-Bameberi
Expressway
Beneficiary
participation
Operational M/s KIDCO is the
concessionaire
Sector: Tourism
29 Heritage hotel at Mahodadhinivas DBOT Operational --
30 Eco camp at Ramchandi DBOT Operational --
Sector: Education
31-44
Up-gradation of 14 numbers of Industrial Training Institutes at Puri,
Cuttack, Umarkote, Chhatrapur, Barbil, Baripada, Takatpur,
Dhenkanal, Malkangiri, Boudh,
Baragarh, Anandapur, Khariar and Balangir
BOO Operational Under Central Government Scheme.
Total – 44 Projects
PPP PROJECTS IN PIPELINE UNDER IMPLEMENTATION
Sl.
No. Name of Project PPP Type Status Remarks
Sector: Urban Development
1 Integrated Residential complex at Ranasinghpur
DBOT Construction --
2 Integrated Residential complex at Patrapada
DBOT Construction --
3 Integrated Residential and Commercial Complex at Gadakana
BOT Construction --
4 Development of Foot Over Bridges at
Master Canteen, Rama Devi College and Jaydev Vihar
DBOT Construction --
5 Development of Regional Landfill and Municipal Solid Waste
Processing Facility for Bhubaneswar and Cuttack , Waste to Energy
DBOT Construction M/s Essel Bhubaneswar MSW Ltd. is the
concessionaire
6 Bulk Water Supply project for IIT, NISER, Infocity-II and adjoining
areas
BOOT Conditions precedent period
Consortium of M/s MEIL is the concessionaire
7 Integrated Residential and
Commercial Complex at Shankarpur
BOT Construction --
Sector: Transport
8-9 Two bus terminals at Dhenkanal &
Angul
DBFOT Construction --
10 Haridaspur-Paradeep Railway Corridor
Beneficiary participation
Construction M/s HPRDCL is the concessionaire
11 Angul Sukinda Railway Corridor Beneficiary
participation
Construction M/s ASRL is the
concessionaire
Sector: Industrial Infrastructure
12 Infopark in Bhubaneswar BOT Construction 1st phase likely to be completed in September-
2013
13 Biotech Park in Bhubaneswar BOT Construction M/s Bharat Biotech is the concessionaire

Appendices
92 Audit Report (State Finances)
for the year ended March 2016
Sl.
No. Name of Project PPP Type Status Remarks
14 Mega Food Park in Rayagada district Joint venture Construction Under the scheme of
MoFPI, GoI.
Sector: Roads
15 Fourlaning of 165 km Sambalpur- Rourkela
BOT(Toll) Conditions precedent period
M/s L&T is the concessionaire
Sector: Tourism
16-
23
Development of eight (08) tourism
department properties
Renovate,
augment, operate & transfer
Construction --
Sector: Energy related
24 Ib- Meramundali 400 KV D.C. line BOT (Annuity) Construction M/s Sterlite is the
concessionaire
Sector: Energy related
25 Development of storage &
warehousing infrastructure for rice
at 14 different locations.
BOO Construction No of individual
concessionaire
Total – 25 Projects
PPP PROJECTS IN PIPELINE
Sl.
No. Name of Project PPP Type Status Remarks
Sector: Urban Development
1 Integrated Residential and
commercial complex at Suango
DBOT Pipeline Selection of developer
has been completed.
2 Integrated Residential and commercial
complex at Ranasinghpur DBOT Pipeline Selection of developer
has been completed.
3 Integrated Residential and commercial Complex at Paikarapur
BOT Pipeline Selection of developer has been completed.
4 Programmatic street lighting project
in different ULBs -- Pipeline Consortium of M/s Neev
Energy LLP and M/s
HeSalight A/S is selected
as concessionaire.
Sector: Energy related
5 Roof-top solar project in
Bhubaneswar and Cuttack -- Pipeline M/s Azure Power India
Pvt Ltd is selected as
concessionaire.
Sector: Health
6 Greenfield Hospital and Healthcare network of BMC at Bhubaneswar
-- Pipeline The selection of the bidder has been
completed and contract
awarded.
7 Cardiac Care Hospital at Jharsuguda -- Pipeline --
Sector: Education
8 Institute of Training of Trainers
(ITOTs) and Specialised Skill Training Institutes.
-- Pipeline --
Total – 8 Projects
Grand Total – 77 Projects (Odisha)

Appendices
Audit Report (State Finances)
for the year ended March 2016
93
APPENDIX – 2.1 (Refer paragraph 2.3.1)
Statement of various grants/appropriations where saving was more than ` 10
crore each and more than 20 per cent of the total provision during 2015-16
(` in crore) Sl.
No.
Grant
No
Name of the Grant/
Appropriation
Total Grant/
Appropriation
Actual
Expenditure
Savings out
of total
Provision
Percentage of
savings to
total Provision
(1) (2) (3) (4) (5) (6) (7)
Revenue (Charged)
1 2048
Appropriation for
Reduction or Avoidance of
Debt
500.00 0 500.00 100.00
2 2049 Interest Payment 4350.00 3343.30 1006.70 23.14
Revenue (Voted)
3 3 Revenue and Disaster
Management 5219.67 3181.26 2038.41 39.05
4 5 Finance 9844.34 6610.41 3233.93 32.85
5 15 Sports and Youth Services 45.99 35.64 10.35 22.50
6 16 Planning and Co-ordination
1178.19 610.90 567.29 48.15
7 22 Forest and Environment 785.71 578.43 207.28 26.38
8 37 Information Technology 175.38 110.83 64.55 36.80
9 40 Micro, Small and Medium
Enterprises 130.76 89.50 41.26 31.55
Capital (Voted)
10 1 Home 519.48 318.58 200.90 38.67
11 2 General Administration 128.47 75.13 53.34 41.51
12 5 Finance 151.85 109.50 42.35 27.89
13 10 School and Mass
Education 85.00 37.24 47.76 56.18
14 16 Planning and Co-
ordination 209.21 153.16 56.05 26.79
15 21 Transport 175.00 138.68 36.32 20.75
16 30 Energy 1955.69 1517.39 438.30 22.41
17 33 Fisheries and Animal
Resources Development 133.51 106.47 27.04 20.25
18 34 Co-operation 374.08 273.26 100.82 26.95
19 36 Women and Child
Development 320.00 219.97 100.03 31.25
20 38 Higher Education 71.50 46.95 24.55 34.33
Total 26353.83 17556.60 8797.23 33.38
Source: Appropriation Accounts 2015-16, Government of Odisha.

Appendices
94 Audit Report (State Finances)
for the year ended March 2016
APPENDIX – 2.2 (Refer paragraphs 2.3.4)
List of Grants indicating persistent savings during 2011-16 (` in crore)
Sl.
No.
Number of the Grant and
name of the Department
Amount of savings
2011-12 2012-13 2013-14 2014-15 2015-16
Revenue (Charged)
1 2049- Interest Payments 1470.90
(36)
1704.36
(38)
2119.64
(42)
1918.94
(41)
1006.70
(23)
Revenue (Voted)
2 1-Home 188.84
(10)
192.66
(9)
175.54
(7)
178.91
(6)
255.57
(8)
3 3-Revenue and Disaster
Management
701.91
(17)
1033.25
(55)
2633.53
(43)
1247.47
(36)
2038.41
(39)
4 4-Law 31.26
(17)
36.58
(19)
22.31
(11)
24.04
(9)
50.92
(16)
5 5-Finance 1061.41
(18)
1549 .72
(22)
2754.72
(29)
2052.78
(23)
3233.94
(33)
6 7-Works 52.15
(5)
26.24
(2)
31.18
(2)
84.54
(5)
144.24
(8)
7 10-School and Mass Education 418.64
(8)
806.54
(12)
509.22
(7)
1414.78
(15)
1942.82
(18)
8 11- Scheduled Tribes &
Scheduled Castes Development,
Minorities & Backward Classes
Welfare
79.25
(7)
168.51
(12)
263.10
(16)
373.64
(20)
316.00
(14)
9 12-Health and Family Welfare 180.54
(12)
201.73
(11)
303.30
(14)
651.88
(19)
222.71
(7)
10 13-Housing and Urban
Development
212.74
(17)
100.91
(7)
87.89
(4)
500.80
(22)
453.49
(16)
11 16-Planning and Co-ordination 65.18
(5)
151.25
(13)
144.17
(12 )
270.44
(23)
567.28
(48)
12 17-Panchayati Raj 190.20
(8)
437.70
(15)
436.05
(12)
2064.92
(30)
1439.68
(16)
13 20-Water Resources 179.54
(17)
158.94
(13)
117.70
(8)
333.91
(19)
152.85
(8)
14 22-Forest and Environment 42.57
(11)
98.06
(17)
166.76
(22)
92.90
(13)
207.28
(26)
15 33-Fisheries and Animal
Resources Development
55.43
(16)
77.76
(21)
54.08
(13)
77.11
(16)
78.65
(15)
16 36-Women and Child
Development
273.32
(8)
236.48
(7)
249.75
(6)
1107.72
(24)
351.31
(9)
17 38-Higher Education 26.55
(2)
65.67
(5)
66.24
(4)
350.13
(16)
119.24
(6)
Capital (Voted)
18 7-Works 234.87
(20)
102.04
(9)
59.92
(4)
47.15
(2)
83.97
(2)
19 20-Water Resources 457.77
(21)
254.06
(11)
529.08
(19)
558.12
(16)
339.08
(8)
20 28-Rural Development 119.75
(19)
63.84
(10)
32.85
(4)
825.63
(27)
238.62
(5)
Source: Appropriation Accounts for the respective years of Government of Odisha
Note: Figures in brackets represent percentage to total grants

Appendices
Audit Report (State Finances)
for the year ended March 2016
95
APPENDIX – 2.3
(Refer paragraph 2.3.5)
Statement showing cases where supplementary provision
(` 1 crore or more in each case) proved unnecessary during 2015-16
(` in crore)
Sl. No. Number and Name of the Grant Original
Provision
Actual
expenditure
Savings out of
Original provision
Supplementary
provision
A Revenue (Charged)
1 1-Home 62.46 55.39 7.07 5.98
Total for (Charged) 62.46 55.39 7.07 5.98
A Revenue (Voted)
2 1-Home 3206.95 3006.01 200.94 54.63
3 2-General Administration 162.36 150.06 12.3 1.61
4 4-Law 298.06 273.14 24.92 26.00
5 6-Commerce 61.82 59.76 2.06 1.34
6 7-Works 1806.26 1675.84 130.42 13.83
7 8-Odisha Legislative Assembly 40.21 32.74 7.47 2.11
8 10-School and Mass Education 9929.39 9012.35 917.04 1025.78
9 12-Health and Family Welfare 3233.89 3134.02 99.87 122.84
10 13-Housing and Urban Development 2677.90 2367.42 310.48 143.01
11 20-Water Resources 1889.06 1877.34 11.72 141.12
12 22-Forest and Environment 717.15 578.43 138.72 68.56
13 23-Agriculture 3009.04 3005.56 3.48 456.84
14 29-Parliamentary Affairs 23.90 22.88 1.02 1.11
15 30-Energy 30.48 27.64 2.84 2.8
16 32-Tourism and Culture 118.54 98.95 19.59 4.93
17 33-Fisheries and Animal Resources
Development 501.29 443.44 57.85 20.81
18 36-Women and Child Development 3862.62 3592.54 270.08 81.23
19 38-Higher Education 1921.61 1897.67 23.94 95.30
20 39-Skill Development and Technical
Education 223.11 219.73 3.38 5.16
21 40-Micro, Small and Medium
Enterprises 113.61 89.50 24.11 17.15
Total for (Voted) 33827.25 31565.02 2262.23 2286.16
Total for Revenue 33889.71 31620.41 2269.30 2292.14
B Capital (Voted)
22 1-Home 442.48 318.58 123.90 77.00
23 2-General Administration 126.21 75.13 51.08 2.26
24 6-Commerce 21.30 20.01 1.29 6.00
25 11- ST & SC Development, Minorities
and Backward Classes Welfare 579.10 559.73 19.37 49.38
26 12-Health and Family Welfare 643.61 589.76 53.85 35.00
27 20-Water Resources 4336.56 4177.24 159.32 179.75
28 21-Transport 160 138.68 21.32 15.00
29 25-Information and Public Relation 4 3.99 0.01 1.00
30 33- Fisheries and Animal Resources
Development 128.51 106.47 22.04 5.00
31 36-Women and Child Development 300.00 219.97 80.03 20.00
Total for (Voted) 6741.77 6209.56 532.21 390.39
Total for Capital 6741.77 6209.56 532.21 390.39
Grand Total 40631.48 37829.97 2801.51 2682.53
Source: Appropriation Accounts 2015-16, Government of Odisha.
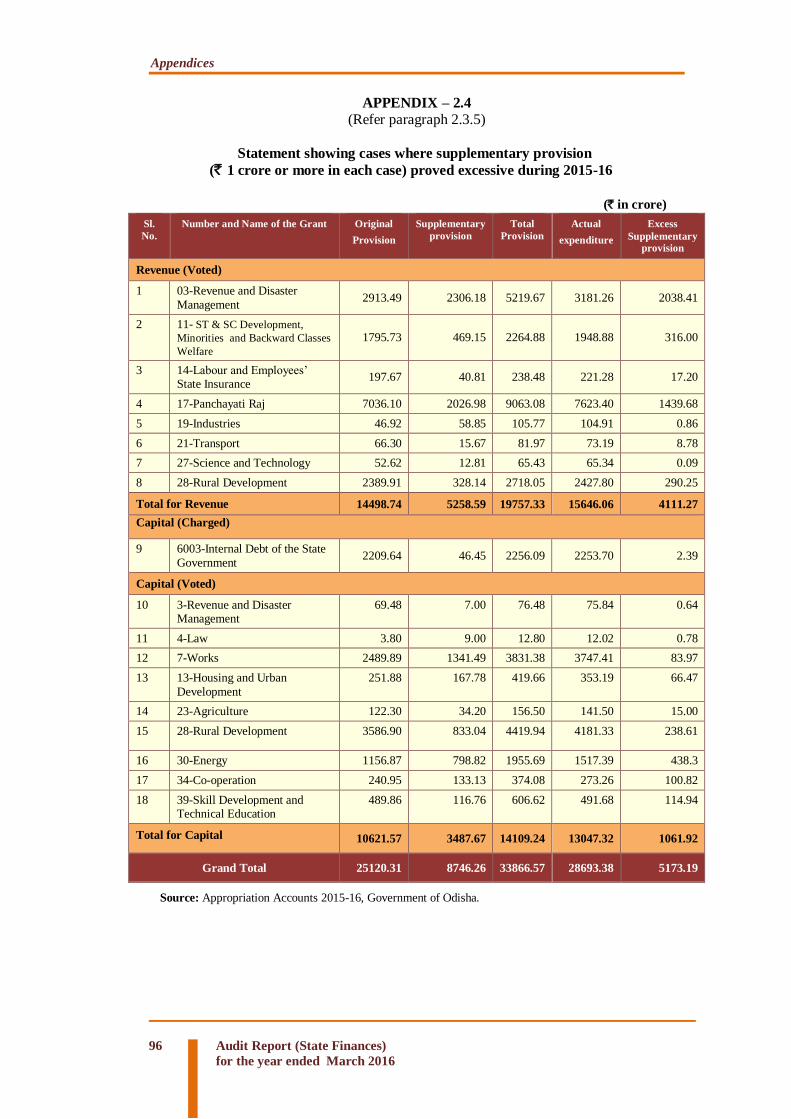
Appendices
96 Audit Report (State Finances)
for the year ended March 2016
APPENDIX – 2.4
(Refer paragraph 2.3.5)
Statement showing cases where supplementary provision
(` 1 crore or more in each case) proved excessive during 2015-16
(` in crore)
Sl.
No.
Number and Name of the Grant Original
Provision
Supplementary
provision
Total
Provision
Actual
expenditure
Excess
Supplementary
provision
Revenue (Voted)
1 03-Revenue and Disaster
Management 2913.49 2306.18 5219.67 3181.26 2038.41
2 11- ST & SC Development,
Minorities and Backward Classes
Welfare 1795.73 469.15 2264.88 1948.88 316.00
3 14-Labour and Employees’ State Insurance
197.67 40.81 238.48 221.28 17.20
4 17-Panchayati Raj 7036.10 2026.98 9063.08 7623.40 1439.68
5 19-Industries 46.92 58.85 105.77 104.91 0.86
6 21-Transport 66.30 15.67 81.97 73.19 8.78
7 27-Science and Technology 52.62 12.81 65.43 65.34 0.09
8 28-Rural Development 2389.91 328.14 2718.05 2427.80 290.25
Total for Revenue 14498.74 5258.59 19757.33 15646.06 4111.27
Capital (Charged)
9 6003-Internal Debt of the State
Government 2209.64 46.45 2256.09 2253.70 2.39
Capital (Voted)
10 3-Revenue and Disaster Management
69.48 7.00 76.48 75.84 0.64
11 4-Law 3.80 9.00 12.80 12.02 0.78
12 7-Works 2489.89 1341.49 3831.38 3747.41 83.97
13 13-Housing and Urban
Development
251.88 167.78 419.66 353.19 66.47
14 23-Agriculture 122.30 34.20 156.50 141.50 15.00
15 28-Rural Development 3586.90 833.04 4419.94 4181.33 238.61
16 30-Energy 1156.87 798.82 1955.69 1517.39 438.3
17 34-Co-operation 240.95 133.13 374.08 273.26 100.82
18 39-Skill Development and Technical Education
489.86 116.76 606.62 491.68 114.94
Total for Capital 10621.57 3487.67 14109.24 13047.32 1061.92
Grand Total 25120.31 8746.26 33866.57 28693.38 5173.19
Source: Appropriation Accounts 2015-16, Government of Odisha.
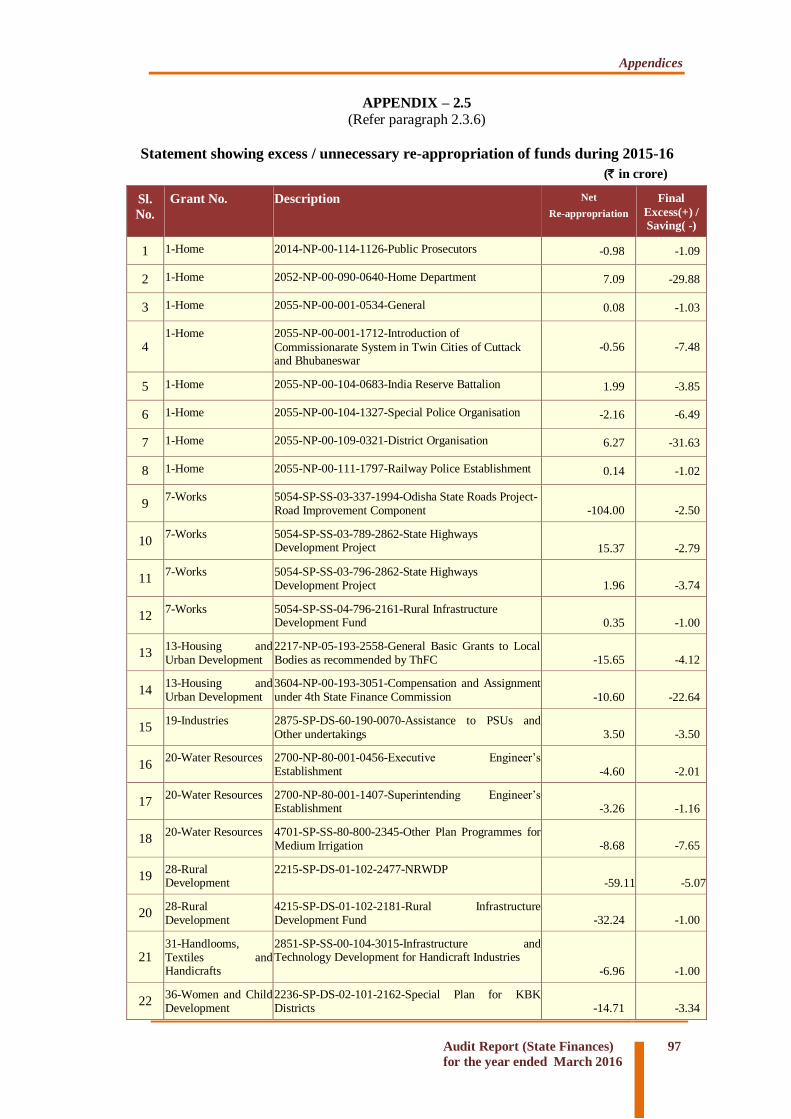
Appendices
Audit Report (State Finances)
for the year ended March 2016
97
APPENDIX – 2.5
(Refer paragraph 2.3.6)
Statement showing excess / unnecessary re-appropriation of funds during 2015-16
(` in crore)
Sl.
No.
Grant No. Description Net
Re-appropriation
Final
Excess(+) / Saving( -)
1 1-Home 2014-NP-00-114-1126-Public Prosecutors -0.98 -1.09
2 1-Home 2052-NP-00-090-0640-Home Department 7.09 -29.88
3 1-Home 2055-NP-00-001-0534-General 0.08 -1.03
4 1-Home 2055-NP-00-001-1712-Introduction of
Commissionarate System in Twin Cities of Cuttack and Bhubaneswar
-0.56 -7.48
5 1-Home 2055-NP-00-104-0683-India Reserve Battalion 1.99 -3.85
6 1-Home 2055-NP-00-104-1327-Special Police Organisation -2.16 -6.49
7 1-Home 2055-NP-00-109-0321-District Organisation 6.27 -31.63
8 1-Home 2055-NP-00-111-1797-Railway Police Establishment 0.14 -1.02
9 7-Works 5054-SP-SS-03-337-1994-Odisha State Roads Project-
Road Improvement Component -104.00 -2.50
10 7-Works 5054-SP-SS-03-789-2862-State Highways
Development Project 15.37 -2.79
11 7-Works 5054-SP-SS-03-796-2862-State Highways
Development Project 1.96 -3.74
12 7-Works 5054-SP-SS-04-796-2161-Rural Infrastructure
Development Fund 0.35 -1.00
13 13-Housing and Urban Development
2217-NP-05-193-2558-General Basic Grants to Local Bodies as recommended by ThFC -15.65 -4.12
14 13-Housing and Urban Development
3604-NP-00-193-3051-Compensation and Assignment under 4th State Finance Commission -10.60 -22.64
15 19-Industries 2875-SP-DS-60-190-0070-Assistance to PSUs and
Other undertakings 3.50 -3.50
16 20-Water Resources 2700-NP-80-001-0456-Executive Engineer’s
Establishment -4.60 -2.01
17 20-Water Resources 2700-NP-80-001-1407-Superintending Engineer’s
Establishment -3.26 -1.16
18 20-Water Resources 4701-SP-SS-80-800-2345-Other Plan Programmes for
Medium Irrigation -8.68 -7.65
19 28-Rural Development
2215-SP-DS-01-102-2477-NRWDP -59.11 -5.07
20 28-Rural Development
4215-SP-DS-01-102-2181-Rural Infrastructure Development Fund -32.24 -1.00
21 31-Handlooms, Textiles and Handicrafts
2851-SP-SS-00-104-3015-Infrastructure and Technology Development for Handicraft Industries
-6.96 -1.00
22 36-Women and Child Development
2236-SP-DS-02-101-2162-Special Plan for KBK Districts -14.71 -3.34

Appendices
98 Audit Report (State Finances)
for the year ended March 2016
Sl.
No.
Grant No. Description Net
Re-appropriation
Final
Excess(+) / Saving( -)
23 38-Higher Education
2202-SP-SS-03-107-1009-Other Educational Facilities -4.00 -15.17
-230.76 -159.16
24 13-Housing and
Urban
Development
3604-NP-00-192-3051-Compensation and Assignment under 4th State Finance Commission
-49.16 20.99
25 20-Water
Resources
4700-SP-SS-01-789-2160-Accelerated Irrigation
Benefit Programme 4.00 2.13
26 20-Water
Resources
4701-SP-SS-58-796-2160- Accelerated Irrigation
Benefit Programme 15.57 2.09
27 22-Forest and
Environment
2406-NP-01-101-0484-Field Establishment
(Division Office) -0.24 1.12
-29.83 26.33
Source: Monthly Appropriation Reports, March 2016 (S), Government of Odisha.

Appendices
Audit Report (State Finances)
for the year ended March 2016
99
APPENDIX – 2.6
(Refer paragraph 2.3.8)
Statement showing results of substantial surrenders made during the year 2015-16
(` 10 crore or more in each case)
Sl.
No.
Number and title
of Grant
Name of the scheme
(Head of Account)
Amount of
Surrender (` in crore)
Percentage
of
Surrender
Reasons for Surrender
1 1-Home
2014-NP-105-2790-ThFC Grant for improving Justice Delivery-Establishment of Courts of Additional District and Sessions Judge
11.97 100 Reason for the surrender of the entire provision has not been intimated to AG (A&E)
2 2-General Administration
2070-NP-104-0308-District Establishment
44.48 100
Entire provision was surrendered to meet additional requirement under other heads.
3 4-Law 2235-NP-60-200-2552- ThFC Grants for Improving Justice Delivery
11.63 100 Reason for the surrender of the entire provision has not been intimated to AG (A&E)
4 5-Finance 2075-NP-800-2897-Fund for Protection of Interest of Depositors
300.00 100 Reason for the surrender of the entire provision has not been intimated to AG (A&E)
5 7-Works 3054-NP-04-337-2582-Maintenance of Roads and Bridges under ThFC Award
82.00 100
Entire provision was surrendered due to non-receipt of approval from the Govt. of Odisha.
6 10-School and Mass Education
2202-SP-SS-02-789-2482-Rastriya Madhyamik Shiksha Abhiyan
22.69 100 Entire provision was surrendered due to non-receipt of Central Assistance
7 10-School and Mass Education
2202-SP-SS-02-796-2482-Rastriya Madhyamik Shiksha Abhiyan
29.78 100 Entire provision was surrendered due to non-receipt of Central Assistance
8 10-School and Mass Education
2202-SP-SS-02-800-2482-Rastriya Madhyamik Shiksha Abhiyan
72.27 100 Entire provision was surrendered due to non-receipt of central assistance
9 10-School and Mass Education
2202-SP-DS-01-111-2251- ThFC Grants for Elementary Education
132.24 100 Entire provision was surrendered due to non-receipt of Central Assistance.
10 10-School and Mass Education
2202-SP-DS-01-789-2251- ThFC Grants for Elementary Education
44.08 100
Entire provision was
surrendered due to non-receipt of Central Assistance.
11 10-School and
Mass Education
2202-SP-DS-01-796-2251- ThFC
Grants for Elementary Education 55.68 100
Entire provision was surrendered due to non-receipt of Central Assistance.
12 10-School and Mass Education
4202-SS-SS-01-201-1192-
Repair, Renovation and Restoration
20.00 100
Entire provision was surrendered due to delay in
floating of tenders and slow progress of construction work.
13 10-School and Mass Education
4202-SS-SS-01-202-0182-Construction of Buildings
25.00 100
Entire provision was surrendered due to delay in floating of tenders and slow progress of work.
14
11-ST & SC Development, Minorities & Backward Classes Welfare
2225-SP-SS-02-102-2638-OTELP Plus
34.05 100 Reason for the surrender of the entire provision has not been intimated to AG (A&E)
15
11- ST & SC Development,
Minorities & Backward Classes Welfare
4225-SP-SS-02-227-0047-Ashram School
19.89 100
Entire provision was
surrendered due to non-receipt of Central Assistance.

Appendices
100 Audit Report (State Finances)
for the year ended March 2016
Sl.
No.
Number and title
of Grant
Name of the scheme
(Head of Account)
Amount of
Surrender (` in crore)
Percentage
of
Surrender
Reasons for Surrender
16
11- ST & SC Development,
Minorities & Backward Classes Welfare
4225-SP-SS-04-800-2255-Multi-sector Development Programme
14.73 100
Entire provision was
surrendered due to non-receipt of Central Assistance.
17 12-Health and Family Welfare
2210-CP-DS-06-101-0957-National Malaria Eradication Programme
30.00 100 Reason for the surrender of the entire provision has not been intimated to AG (A&E)
18 12-Health and Family Welfare
4210-SP-SS-03-105-2588- ThFC
Award for upgradation of Health Infrastructure
18.75 100
Reason for the surrender of
the entire provision has not been intimated to AG (A&E)
19 12-Health and
Family Welfare
4216-SP-SS-01-789-2588- ThFC Award for upgradation of Health Infrastructure
26.75 100 Reason for the surrender of the entire provision has not been intimated to AG (A&E)
20 13-Housing and Urban
Development
2217-CP-DS-05-800-2524-Capacity building of ULBs in
Odisha
12.68 100 Reason for the surrender of the entire provision has not
been intimated to AG (A&E)
21 13-Housing and Urban
Development
3054-NP-80-192-2582-Maintenance of Roads and Bridges under 13th Finance Commission Award
13.96 100 Reason for the surrender of the entire provision has not
been intimated to AG (A&E)
22 17-Panchayati Raj 2515-SP-DS-789-1877-Backward Region Grant Fund
78.57 100 Reason for the surrender of the entire provision has not
been intimated to AG (A&E)
23 17-Panchayati Raj 2515-SP-DS-789-2945-Rajiv Gandhi Panchayat Sashaktikaran Yojana
18.00 100 Reason for the surrender of the entire provision has not been intimated to AG (A&E)
24 17-Panchayati Raj 2515-SP-DS-796-1877-Backward Region Grant Fund
152.78 100 Reason for the surrender of the entire provision has not been intimated to AG (A&E)
25 17-Panchayati Raj 2515-SP-DS-796-2945-Rajiv Gandhi Panchayat Sashaktikaran Yojana
23.00 100 Reason for the surrender of the entire provision has not been intimated to AG (A&E)
26 17-Panchayati Raj 2515-SP-DS-800-1877-Backward Region Grant Fund
205.16 100 Reason for the surrender of the entire provision has not been intimated to AG (A&E)
27 17-Panchayati Raj 2515-SP-DS-800-2945-Rajiv Gandhi Panchayat Sashaktikaran Yojana
59.00 100 Reason for the surrender of the entire provision has not been intimated to AG (A&E)
28 20-Water
Resources
2700-NP-80-800-2587- ThFC Award for Water Sector Management
27.00 100
Entire provision was surrendered due to non-receipt of Central Assistance for Water Sector Management.
29 20-Water
Resources
2701-NP-80-800-2587- ThFC Award for Water Sector Management
13.00 100
Entire provision was surrendered due to non-receipt of Central Assistance for Water Sector Management.
30 22-Forest and Environment
2406-NP-01-101-2556- ThFC Award for Development and
Maintenance of Forest
73.50 100 Reason for the surrender of the entire provision has not
been intimated to AG (A&E)
31 22-Forest and
Environment
2406-NP-02-110-2557- ThFC Award for Preservation of Forest Wealth
13.09 100 Entire provision was surrendered as per Government instructions.
32 22-Forest and
Environment
2406-SP-SS-01-102-3074-Management of Plantation and Forest
10.00 100
Entire provision was surrendered due to non-
introduction of schemes as per Government decision.
33 22-Forest and Environment
3435-SP-SS-03-102-2585- ThFC
Award for Development of Chilika Lake
12.50 100
Entire provision was surrendered due to discontinuance of Finance Commission Grants.

Appendices
Audit Report (State Finances)
for the year ended March 2016
101
Sl.
No.
Number and title
of Grant
Name of the scheme
(Head of Account)
Amount of
Surrender (` in crore)
Percentage
of
Surrender
Reasons for Surrender
34 22-Forest and Environment
3435-SP-SS-03-102-2586-Odisha Bio-Diversity Board
29.00 100 Reason for the surrender of the entire provision has not
been intimated to AG (A&E)
35 22-Forest and Environment
3435-CP-SS-03-102-2693-Climate Change Action Plan
10.00 100 Entire provision was surrendered due to non-release of fund by GoI.
36 28-Rural Development
3054-NP-04-337-2582-Maintenance of Roads and Bridges under ThFC Award
82.00 100
Entire provision was surrendered due to discontinuance of funding
from GoI.
37 28-Rural Development
3054-NP-04-338-2582- Maintenance of Roads and
Bridges under ThFC Award
36.00 100
Entire provision was surrendered due to discontinuance of funding from GoI.
38 28-Rural Development
4215-SP-DS-796-2161-Rural Infrastructure Development Fund
34.50 100 Reason for the surrender of the entire provision has not
been intimated to AG (A&E)
39 30-Energy 4801-SP-SS-05-800-0140-Reimbursement of Land Acquisition Establishment Cost
210.00 100
Entire provision was surrendered due to introduction of cash management system in the department.
40 30-Energy
4801-SP-DS-06-800-3008-
Dindayal Upadhaya Gram Jyoti Yojana
20.00 100
Reason for the surrender of
the entire provision has not been intimated to AG (A&E)
41 30-Energy
6801-SP-SS-205-2612-CAPEX Programme for development and upgradation of Distribution System
195.06 100
Reason for the surrender of
the entire provision has not been intimated to AG (A&E)
42 30-Energy 6801-SP-SS-205-3009-Integrated Power Development Scheme
10.00 100
Reason for the surrender of
the entire provision has not been intimated to AG (A&E)
43 30-Energy
6801- SP-SS-789-2612-CAPEX
Programme for development and upgradation of Distribution System
21.23 100
Entire provision was surrendered due to introduction of cash management system in the department.
44 30-Energy
6801-SP-SS-796-2612-CAPEX Programme for development and upgradation of Distribution
System
28.70 100
Entire provision was surrendered due to introduction of cash management system in the department.
45 32-Tourism and Culture
2205-SP-SS-001-2592- ThFC Award for preservation of
Monuments and Budhist Heritage
16.25 100 Reason for the surrender of the entire provision has not
been intimated to AG (A&E)
46 33-Fisheries and Animal Resources
Development
2404-SP-SS-001-1388-National Plan for Dairy Development
12.85 100
Entire provision was surrendered due to non-release of fund by Government.
47 34-Co-operation 4435-SP-DS-01-101-2593- ThFC Award for establishment of
Market Yards at Block level
11.50 100 Reason for the surrender of the entire provision has not
been intimated to AG (A&E)
48 36-Women and Child Development
2236-SP-DS-02-101-2162-Special Plan for KBK Districts
18.05 100
Reason for the surrender of the entire provision has not been intimated to AG (A&E)
49 36-Women and Child Development
2236-SP-DS-02-796-2162-Special Plan for KBK Districts
15.42 100 Reason for the surrender of the entire provision has not
been intimated to AG (A&E)
50 36-Women and Child Development
4235-SP-DS-02-102-2596- ThFC Award for construction of
Anganwadi Centres
37.40 100
Entire provision was surrendered due to non-release of state specific grant by ThFC.

Appendices
102 Audit Report (State Finances)
for the year ended March 2016
Sl.
No.
Number and title
of Grant
Name of the scheme
(Head of Account)
Amount of
Surrender (` in crore)
Percentage
of
Surrender
Reasons for Surrender
51 36-Women and
Child Development
4235-SP-DS-02-789-2596- ThFC Award for construction of Anganwadi Centres
22.00 100
Entire provision was surrendered due to non-
release of state specific grant by ThFC.
52 36-Women and Child Development
4235-SP-DS-02-796-2596- ThFC
Award for construction of Anganwadi Centres
40.60 100
Entire provision was surrendered due to non-release of state specific grant by ThFC.
53 37-Information Technology
2852-SP-SS-07-202-0776-
Implementation of e-Governance Project as per the National e-Governance Programme onetime ACA
21.71 100 Entire provision was surrendered due to non-release of fund by GoI.
54 37-Information Technology
2852-SP-SS-07-202-2553- ThFC Grant for Incentivising Issue of UID
14.40 100 Entire provision was surrendered due to non-release of fund by GoI.
55 37-Information Technology
2852-SP-SS-07-789-2553- ThFC Grant for Incentivising Issue of UID
10.90 100 Entire provision was surrendered due to non-release of fund by GoI.
56 37-Information Technology
2852-SP-SS-07-796-2553- ThFC Grant for Incentivising Issue of UID
10.40 100 Entire provision was surrendered due to non-release of fund by GoI.
57
39-Skill
Development and Technical Education Department
4250-SP-SS-800-2937-Odisha Skill Development Project Assisted by ADB
105.00 100 Entire provision was surrendered due to non-release of fund by GoI.
58 40-Micro, Small and Medium Enterpirses
2851-SP-DS-102-2334-Grants/Assistance for Micro, Small and Medium Industries
10.00 100
Entire provision was surrendered due to non-approval of Biju Atma Nijukti Yojana by EFC.
TOTAL 2731.20
Source: Appropriation Accounts 2015-16 and Monthly Appropriation Reports, March 2016 (S)

Appendices
Audit Report (State Finances)
for the year ended March 2016
103
APPENDIX – 2.7 (Refer paragraph 2.3.10)
Statement showing details of savings of ` 1 crore and above not surrendered
during 2015-16
(` in crore)
Sl.
No.
Number and Name of
Grants/Appropriation
Total
Provision
Saving Surrender Saving which
remained to
be
surrendered
(1) (2) (3) (4) (5) (6)
Revenue (Charged)
1 1-Home 68.44 13.05 0.47 12.58
Revenue (Voted)
2 1-Home 3261.58 255.57 139.18 116.39
3 3-Revenue and Disaster Management 5219.67 2038.41 2027.02 11.39
4 4-Law 324.06 50.92 33.16 17.76
5 7-Works 1820.09 144.24 116.10 28.14
6 11-ST & SC Development, Minorities
& Backward Classes Welfare 2264.88 316.00 281.79 34.21
7 13-Housing and Urban Development 2820.91 453.49 368.73 84.76
8 15-Sports and Youth Services 45.99 10.36 8.39 1.97
9 17-Panchayati Raj 9063.08 1439.68 902.68 537.00
10 20-Water Resources 2030.18 152.85 134.63 18.22
11 28-Rural Development 2718.05 290.26 283.40 6.86
12 31-Handloom, Textiles and Handicrafts 153.01 21.80 20.80 1.00
13 32-Tourism and Culture 123.47 24.52 6.37 18.15
14 36-Women and Child Development 3943.85 351.31 348.27 3.04
15 38-Higher Education 2016.91 119.24 103.81 15.43
16 40-Micro, Small and Medium Enterprises
130.76 41.26 36.12 5.14
Total for Revenue 36004.93 5722.96 4810.92 912.04
Capital (Charged)
17 20-Water Resources 12.72 4.82 0.91 3.91
Capital (Voted)
18 7-Works 3831.38 83.97 75.25 8.72
19 11- ST & SC Development, Minorities & Backward Classes Welfare
628.49 68.76 65.13 3.63
20 12-Health and Family Welfare 678.61 88.86 1.20 87.66
21 13-Housing and Urban Development 419.66 66.47 6.52 59.95
22 20-Water Resources 4516.31 339.08 321.91 17.17
23 28-Rural Development 4419.94 238.62 237.37 1.25
24 33-Fisheries and Animal Resources
Development 133.51 27.04 23.94 3.10
Total for Capital 14640.62 917.62 732.23 185.39
Grand Total 50645.55 6640.58 5543.15 1097.43
Source: Appropriation Accounts 2015-16, Government of Odisha.

Appendices
104 Audit Report (State Finances)
for the year ended March 2016
APPENDIX – 2.8 (Refer paragraph 2.3.10)
Statement showing grant / major head of account-wise surrender of funds in
excess of ` 10 crore on 31 March 2016.
Sl.
No.
Grant
Number
Major Head of Account Total
Provision
(O+S)
(` in crore)
Amount of
Surrender
(` in crore)
Percentage
(1) (2) (3) (4) (5) (6)
1 1
4059-Capital Outlay on Public Works 269.82 100.45 37.23
2 4216-Capital Outlay on Housing 249.66 100.45 40.24
3
2
4059- Capital Outlay on Public Works 47.90 13.99 29.21
4 4216- Capital Outlay on Housing 42.67 14.57 34.14
5 5053-Capital Outlay on Civil Aviation 30.00 23.93 79.77
6 3 2245-Relief on account of Natural Calamities 4481.71 1951.30 43.54
7
5
2040-Taxes on Sales, Trade etc. 107.70 22.79 21.16
8 2071-Pensions and Other Retirement Benefits 8583.20 2241.98 26.12
9 2075-Miscellaneous General Services 300.00 300.00 100.00
10 7615-Miscellaneous Loans 25.00 21.36 85.44
11 10 4202-Capital Outlay on Education, Sports, Art and Culture
85.00 47.76 56.19
12 12 2211-Family Welfare 45.53 18.52 40.68
13 13 3054- Roads and Bridges 92.73 30.00 32.35
14
16
2401-Crop Husbandry 53.09 22.52 42.42
15 3451-Secretariat -Economical Services 1077.05 513.74 47.70
16 3454-Census Surveys and Statistics 48.02 31.01 64.57
17 4059-Capital Outlay on Public Works 16.70 15.02 89.94
18 5475-Capital Outlay on Other General
Economic Services 40.00 40.00 100.00
19 17 2501- Special Programmes for Rural Development
561.72 204.67 36.44
20 21 4059- Capital Outlay on Public Works 55.00 32.80 59.64
21 22
2406-Forestry and Wild Life 719.43 170.90 23.76
22 3435-Ecology and Environment 52.81 35.85 67.89
23 23 2402-Soil and Water Conservation 341.01 106.81 31.32
24 28 4215- Capital Outlay on Water Supply and Sanitation
485.00 104.92 21.63
25 30 6801-Loans for Power Projects 303.76 185.01 60.91
26 33 2404-Dairy Development 48.94 21.47 43.87
27 34
4435- Capital Outlay on Other Agricultural Programmes
23.50 15.00 63.83
28 6425-Loans for Co-operation 111.09 73.00 65.71
29 36 4235- Capital Outlay on Social Security and Welfare
320.00 100.03 31.26
30 37 2852-Industries 171.12 63.98 37.39
31 38 4202- Capital Outlay on Education, Sports, Art and Culture
70.00 23.10 33.00
32 39 4250-Capital Outlay on Other Social Services 228.60 109.21 47.77
33 40 3453-Foreign Trade and Export
Promotion 27.30 18.30 67.04
Total 19115.06 6774.44 35.44
Source: Pr. Accountant General (A&E), Odisha.

Appendices
Audit Report (State Finances)
for the year ended March 2016
105
APPENDIX – 2.9 (Refer paragraph 2.5.2)
Statement showing rush of expenditure during 2015-16
Sl.
No.
Grant
Number
Head of account
Scheme/Service
Expenditure
incurred
during Jan-
March 2016
Expenditure
incurred in
March 2016
Total
expenditure
during the
year
Percentage of total
expenditure incurred
during
Jan-March
2016
March
2016
(1) (2) (3)
(` in crore)
(7) (8) (4) (5) (6)
1 7 3054-SP-SS-80-797-1361-State Road Fund 124.78 124.78 124.78 100.00 100.00
2 7 5054- SP-SS-03-789-3010-Biju Expressway Projects 14.00 13.28 14.00 100.00 94.86
3 9 2408- SP-SS-01-101-3020-Operation of Potato Buffer stock 50.00 50.00 50.00 100.00 100.00
4 9 3456- SP-SS-00-102-3018-Fair Price Shop Automation 14.00 14.00 14.00 100.00 100.00
5 10 2202- SP-DS-02-800-3072-Odisha Adarsha Vidyalaya 100.00 100.00 100.00 100.00 100.00
6 11 2225- SP-SS -01-277-3052 Schemes for development of Schedule Caste 142.12 142.21 142.63 99.64 99.71
7 11
2225-SP-SS-03-277-2418-Post
Matric Scholarship and Stipend to OBC Students 26.23 26.23 26.23 100.00 100
8 12 2210- SP-SS-05-105-3037-Human Resources in Health & Medical Education 48.05 47.17 48.07 100.00 98.17
9 13 2217- SP-SS-05-796-3062-Smart Cities 88.26 87.36 88.26 100.00 98.98
10 13 2217- SP-SS-05-800-3062-Smart Cities 210.52 208.08 210.52 100.00 98.84
11 13
3604-NP-00-191-3030-V-P-SP-Grants & Assistance under the Award of the 4th State Finance Commission 17.75 17.75 18.48 96.04 96.04
12 13 3604-NP-00-192-3030-Grants and assistance under the award of 4th SFC 25.13 25.13 25.13 100.00 100
13 13 3604-NP-00-193-3030-Grants and assistance under the award of the 4th State Finance Commission 15.92 15.92 15.92 100.00 100
14 21 5055- SP-SS-00-050-0189-
Construction of Bus Stand 20.00 20.00 20.00 100 100
15 23 2401- SP-DS-00-119-3056-State Potato Mission 29.06 28.98 29.78 97.57 97.29
16 23 2401- SP-DS-00-796-3056-State Potato Mission 11.24 11.22 11.44 98.25 98.10
17 23
2402- SP-DS-00-103-3064-
Pradhan Mantri Krishi Sinchai Yojana (PMKSY) 15.53 14.13 15.53 100.00 90.98
18 23 2402- SP-DS-00-796-3054-Pradhan Mantri Krishi Sinchai Yojana (PMKSY) 31.34 30.51 31.34 100.00 97.34
19 23 4401- SP-DS-00-800-1276-Share Capital Investment 34.20 34.20 34.20 100.00 100
20 23
6401- SP-SS-00-103-2981-Corpus Fund for Odisha Agro Industries Corporation Ltd. 15.00 15.00 15.00 100.00 100

Appendices
106 Audit Report (State Finances)
for the year ended March 2016
Sl.
No.
Grant
Number
Head of account
Scheme/Service
Expenditure
incurred
during Jan-
March 2016
Expenditure
incurred in
March 2016
Total
expenditure
during the
year
Percentage of total
expenditure incurred
during
Jan-March
2016
March
2016
(1) (2) (3)
(` in crore)
(7) (8) (4) (5) (6)
21 28
3054-NP-04-338-2583-Maintenance of Roads and Bridges
under Pradhan Mantri Gram Sadak Yojana(PMGSY) 31.96 30.14 31.96 100 94.28
22 30 4801- SP-SS-05-190-1276-Share Capital Investment 25.07 25.07 25.07 100.00 100
23 30 4801- SP-SS-05-800-2304-Electrification for Important Institutes and Sites 28.17 27.17 28.85 97.64 94.18
24 30 4801- SP-DS-06-796-2153-Rajiv Gandhi Gramin Vidutikaran Yojana 20.70 20.70 20.70 100.00 100
25 30 6801- SP-SS-00-205-2152-Accelerated Power Development Reform Programme 70.00 70.00 70.00 100.00 100
26 34 4425- SP-DS-00-107-2875-Construction of Godowns 54.00 54.00 54.00 100.00 100
27 34 4425- SP-SS-00-108-1276-Share Capital Investment 125.05 125.05 125.05 100.00 100
28 34 4425- SP-DS-00-789-2875-Construction of Godowns 15.00 15.00 15.00 100.00 100
29 34 4425- SP-DS-00-796-2875-Construction of Godowns 21.00 21.00 21.00 100.00 100
30 34 6425-SP-SS-00-108-2980-Corpus Fund for Odisha State Co-operative Marketing Federation Ltd. 30.00 30.00 30.00 100.00 100
31 37 2852- SP-SS-07-202-1956-Promotion and facilities of IT 22.78 22.78 22.78 100.00 100
32 37 2852- SP-SS-07-202-2234-Development of Infocity-II-IT SEZ 30.00 30.00 30.00 100.00 100
33 37 2852- SP-SS-07-202-2562-Innovative Projects 15.01 15.01 15.01 100.00 100
34 2049 2049-NP-03-117-1908-Defined Contribution Pension Scheme 25.08 25.08 25.08 100.00 100
Total 1546.95 1536.95 1549.81
Source: Monthly Appropriation Reports 2015-16, Govt. of Odisha
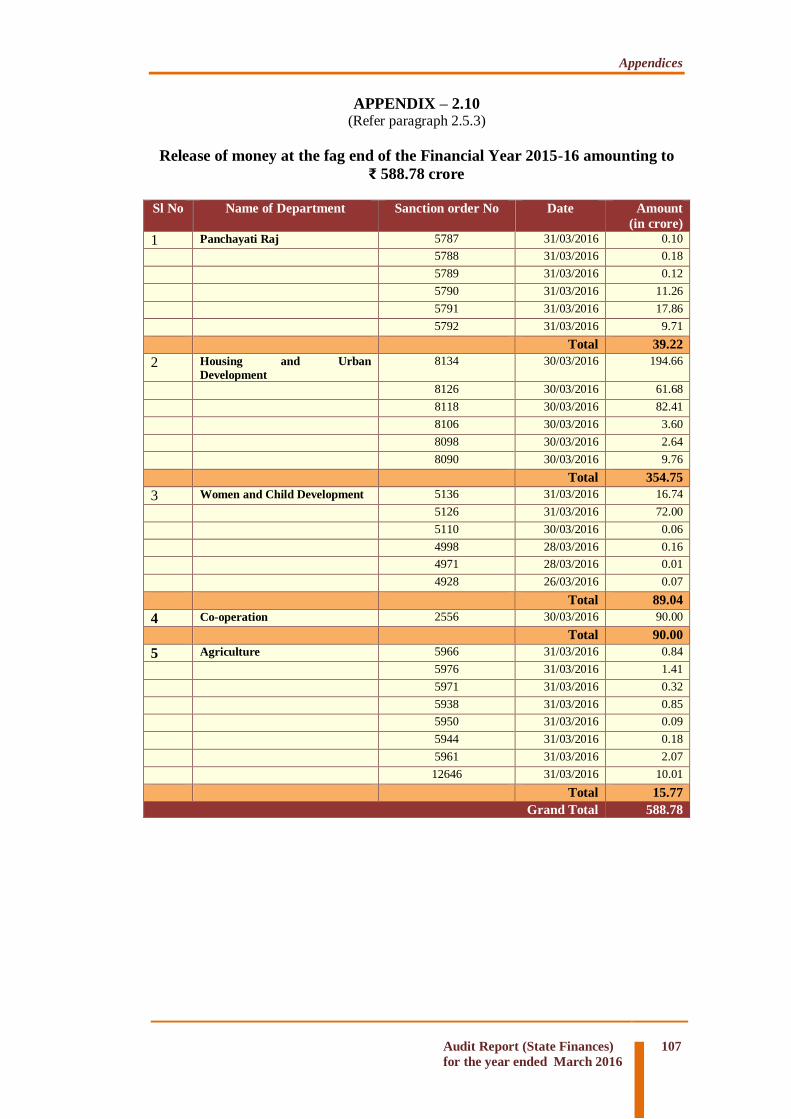
Appendices
Audit Report (State Finances)
for the year ended March 2016
107
APPENDIX – 2.10 (Refer paragraph 2.5.3)
Release of money at the fag end of the Financial Year 2015-16 amounting to
₹ 588.78 crore
Sl No Name of Department Sanction order No Date Amount
(in crore)
1 Panchayati Raj 5787 31/03/2016 0.10
5788 31/03/2016 0.18
5789 31/03/2016 0.12
5790 31/03/2016 11.26
5791 31/03/2016 17.86
5792 31/03/2016 9.71
Total 39.22
2 Housing and Urban
Development
8134 30/03/2016 194.66
8126 30/03/2016 61.68
8118 30/03/2016 82.41
8106 30/03/2016 3.60
8098 30/03/2016 2.64
8090 30/03/2016 9.76
Total 354.75
3 Women and Child Development 5136 31/03/2016 16.74
5126 31/03/2016 72.00
5110 30/03/2016 0.06
4998 28/03/2016 0.16
4971 28/03/2016 0.01
4928 26/03/2016 0.07
Total 89.04
4 Co-operation 2556 30/03/2016 90.00
Total 90.00
5 Agriculture 5966 31/03/2016 0.84
5976 31/03/2016 1.41
5971 31/03/2016 0.32
5938 31/03/2016 0.85
5950 31/03/2016 0.09
5944 31/03/2016 0.18
5961 31/03/2016 2.07
12646 31/03/2016 10.01
Total 15.77
Grand Total 588.78

Appendices
108 Audit Report (State Finances)
for the year ended March 2016
APPENDIX – 2.11 (Refer paragraphs 2.6.3)
Withdrawal of entire provision by way of surrender and re-appropriation by the
Chief Controlling Officers of the Grant No.1 and Grant No.36 during 2015-16
(` in crore)
Sl.
No.
Head of Account Total
Provision
Amount
withdrawn
Remarks
1-Home Department
1 2055-SP-00-003-2589-ThFC Award for Police Training
1.98 1.98
Entire amount was withdrawn
due to discontinuance of sharing/delinking of funding by Government of India.
2 2055-SP-00-114-2933-National Scheme for Modernisation of Police and Other Forces
8.69 8.69
3 2055-SP-00-101-2590-ThFC Award for
upgradation of jails 1.09 1.09
4 2055-SP-00-789-2590-ThFC Award for upgradation of jails 0.23 0.23
5 2055-SP-00-796-2590-ThFC Award for upgradation of jails 0.68 0.68
6 2070-NP-00-105-2908-Commission of Inquiry 0.35 0.35
Entire provisions were withdrawn without assigning any reason.
7 2070-SP-00-108-2591- ThFC Award for Fire Services 1.51 1.51
Entire amount was withdrawn due to delinking of sharing fund by Government of India.
8
2070-CP-00-106-2513- Establishment of new Civil DefenceTraining Institute
0.27 0.27
Entire amount was withdrawn due to non-receipt of technical specifications on equipments from Government of India.
9 4059-SP-60-051-2589-ThFC Award for Police Training
6.00 6.00
Entire amount was withdrawn due to delinking of sharing fund by Government of India.
10 4059-SP-60-051-2590-ThFC Award for upgradation of jails
9.06 9.06
11 4059-SP-60-051-2591- ThFC Award for Fire Services
9.35 9.35
12 4059-SP-60-051-3023- National Scheme for Modernisation of Courts
2.85 2.85
Entire provision was surrendered due to non-finalisation of Action Plan under approval of Ministry of Home Affairs, Government of India.
13 4059-SP-60-789-2590- ThFC Award for
upgradation of jails 2.34 2.34 Entire amount was withdrawn
due to delinking of sponsored schemes by Government of India.
14 4059-SP-60-789-2933- National Scheme for Modernisation of Police and Other Forces 11.51 11.51
15
4059-SP-60-789-3023- National Scheme for Modernisation of Courts
1.00 1.00
Entire provision was surrendered due to non-finalisation of Action Plan under approval of Ministry of Home Affairs, Government of India.
16 4059-SP-60-796-2590- ThFC Award for upgradation of jails
3.22 3.22 Entire amount was withdrawn due to delinking of sharing fund by Government of India. 17 4059-SP-60-796-2933- National Scheme for
Modernisation of Police and Other Forces 14.74 14.74
18
4059-SP-60-796-3023- National Scheme for Modernisation of Courts
1.15 1.15
Entire amount was surrendered attributing to non-finalisation of sites for district courts.

Appendices
Audit Report (State Finances)
for the year ended March 2016
109
Sl.
No.
Head of Account Total
Provision
Amount
withdrawn
Remarks
19 4216-SP-01-700-2589-ThFC Award for
Police Training 10.00 10.00
Entire amount was withdrawn due to delinking of sponsored schemes by Government of India.
20
4216-SP-01-700-2590- ThFC Award for upgradation of jails 6.20 6.20
21 4216-SP-01-700-2591-ThFC Award for Fire Services
27.54 27.54
22 4216-SP-01-789-2590- ThFC Award for upgradation of jails
1.60 1.60
23 4216-SP-01-789-2933- National Scheme for Modernisation of Police and Other Forces
9.91 9.91
24 4216-SP-01-796-2590- ThFC Award for upgradation of jails
2.20 2.20
25 4216-SP-01-796-2933- National Scheme for Modernisation of Police and Other Forces
18.91 18.91
TOTAL 152.38 152.38
36-Women & Child Development Department
1 2235-SP-02-789-0731-Integrated Child
Development Schemes 0.67 0.67
Entire amount was withdrawn due to non-availability of Central Assistance.
2 2235-SP-02-796-0731-Integrated Child
Development Schemes 0.91 0.91
3 2236-SP-02-789-2162-Special Plan for KBK
Districts 6.53 6.53
4 2236-SP-02-796-2162-Special Plan for KBK Districts
15.42 15.42
5 4235-SP-02-102-2596- ThFC Award for construction of Anganwadi Centres
37.40 37.40 Entire amount was withdrawn
due to non-release of State Specific Grant by 13th Fiinance Commission.
6 4235-SP-02-789-2596- ThFC Award for construction of Anganwadi Centres
22.00 22.00
7 4235-SP-02-796-2596- ThFC Award for construction of Anganwadi Centres
40.60 40.60
TOTAL 123.53 123.53
Source: Appropriation Accounts 2015-16, Government of Odisha.

Appendices
110 Audit Report (State Finances)
for the year ended March 2016
APPENDIX – 3.1 (Refer paragraph 3.1)
Statement showing details of utilisation certificates pending for receipt by
different departments of the State Government at the end of 2015-16
(` in crore)
Sl.
No.
Name of the Department Amount
outstanding as on
31.03.2016
No. of GIA
Vouchers
for which
UC awaited 1 Agriculture 36.83 66
2 Co-operation 80.80 39
3 Energy 3.34 1
4 Finance 0.12 2
5 Fisheries and Animal Resources Development 28.00 148
6 Food Supplies and Consumer Welfare 92.77 67
7 Forest and Environment 13.60 25
8 General Administration 82.86 54
9 Health and Family Welfare 1790.44 313
10 Higher Education 786.68 2793
11 Home 2.34 10
12 Housing and Urban Development 3664.27 10049
13 Industries 28.69 15
14 Information Technology 371.16 138
15 Information and Public Relations 0.02 1
16 Labour and Employees’ State Insurance 166.86 20
17 Law 112.89 119
18 Micro, Small and Medium Enterprises 32.19 95
19 Panchayati Raj 10356.10 9198
20 Parliamentary Affairs 0.02 7
21 Planning and Co-ordination 2719.70 1583
22 Revenue and Disaster Management 1302.40 452
23 Rural Development 1041.69 24
24 ST & SC Development, Minorities & Backward Classes Welfare
1045.43 3596
25 School and Mass Education 2292.78 2097
26 Science and Technology 121.96 130
27 Skill Development & Technical Education 402.94 201
28 Sports and Youth Services 7.45 53
29 Handloom, Textile and Handicrafts 46.05 122
30 Tourism and Culture 134.44 467
31 Transport 5.00 1
32 Water Resources 530.07 560
33 Women and Child Development 311.32 444
34 Works 0.10 5
Total 27611.31 32895
Source: Compiled from the information received from Principal Accountant General (A&E), Odisha.
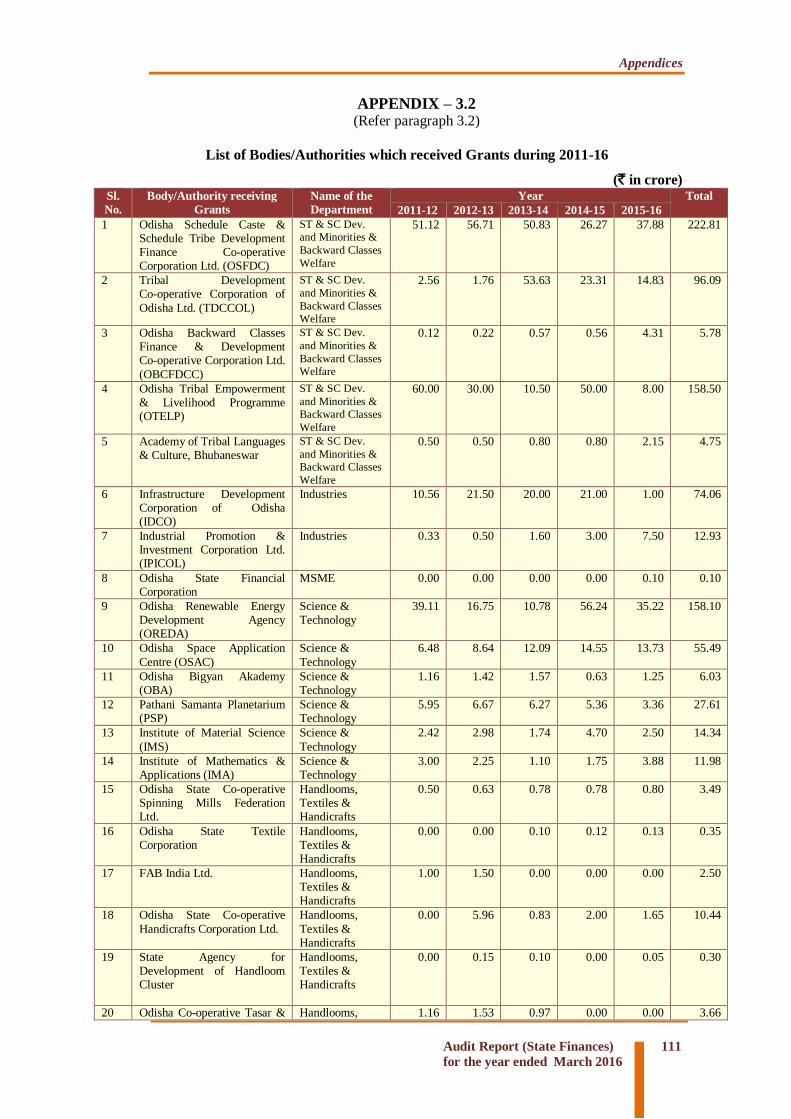
Appendices
Audit Report (State Finances)
for the year ended March 2016
111
APPENDIX – 3.2 (Refer paragraph 3.2)
List of Bodies/Authorities which received Grants during 2011-16
(` in crore) Sl.
No.
Body/Authority receiving
Grants
Name of the
Department
Year Total
2011-12 2012-13 2013-14 2014-15 2015-16
1 Odisha Schedule Caste & Schedule Tribe Development Finance Co-operative Corporation Ltd. (OSFDC)
ST & SC Dev.
and Minorities &
Backward Classes
Welfare
51.12 56.71 50.83 26.27 37.88 222.81
2 Tribal Development Co-operative Corporation of
Odisha Ltd. (TDCCOL)
ST & SC Dev.
and Minorities &
Backward Classes
Welfare
2.56 1.76 53.63 23.31 14.83 96.09
3 Odisha Backward Classes Finance & Development Co-operative Corporation Ltd.
(OBCFDCC)
ST & SC Dev.
and Minorities &
Backward Classes
Welfare
0.12 0.22 0.57 0.56 4.31 5.78
4 Odisha Tribal Empowerment & Livelihood Programme (OTELP)
ST & SC Dev.
and Minorities &
Backward Classes
Welfare
60.00 30.00 10.50 50.00 8.00 158.50
5 Academy of Tribal Languages & Culture, Bhubaneswar
ST & SC Dev.
and Minorities &
Backward Classes
Welfare
0.50 0.50 0.80 0.80 2.15 4.75
6 Infrastructure Development Corporation of Odisha (IDCO)
Industries 10.56 21.50 20.00 21.00 1.00 74.06
7 Industrial Promotion & Investment Corporation Ltd. (IPICOL)
Industries 0.33 0.50 1.60 3.00 7.50 12.93
8 Odisha State Financial Corporation
MSME 0.00 0.00 0.00 0.00 0.10 0.10
9 Odisha Renewable Energy Development Agency (OREDA)
Science & Technology
39.11 16.75 10.78 56.24 35.22 158.10
10 Odisha Space Application
Centre (OSAC)
Science &
Technology
6.48 8.64 12.09 14.55 13.73 55.49
11 Odisha Bigyan Akademy (OBA)
Science & Technology
1.16 1.42 1.57 0.63 1.25 6.03
12 Pathani Samanta Planetarium (PSP)
Science & Technology
5.95 6.67 6.27 5.36 3.36 27.61
13 Institute of Material Science
(IMS)
Science &
Technology
2.42 2.98 1.74 4.70 2.50 14.34
14 Institute of Mathematics & Applications (IMA)
Science & Technology
3.00 2.25 1.10 1.75 3.88 11.98
15 Odisha State Co-operative Spinning Mills Federation Ltd.
Handlooms, Textiles & Handicrafts
0.50 0.63 0.78 0.78 0.80 3.49
16 Odisha State Textile Corporation
Handlooms, Textiles & Handicrafts
0.00 0.00 0.10 0.12 0.13 0.35
17 FAB India Ltd. Handlooms, Textiles & Handicrafts
1.00 1.50 0.00 0.00 0.00 2.50
18 Odisha State Co-operative
Handicrafts Corporation Ltd.
Handlooms,
Textiles & Handicrafts
0.00 5.96 0.83 2.00 1.65 10.44
19 State Agency for Development of Handloom Cluster
Handlooms, Textiles & Handicrafts
0.00 0.15 0.10 0.00 0.05 0.30
20 Odisha Co-operative Tasar & Handlooms, 1.16 1.53 0.97 0.00 0.00 3.66

Appendices
112 Audit Report (State Finances)
for the year ended March 2016
Sl.
No.
Body/Authority receiving
Grants
Name of the
Department
Year Total
2011-12 2012-13 2013-14 2014-15 2015-16
Silk Federation (SERIFED) Textiles &
Handicrafts
21 State Institute for Development of Arts & Crafts
Handlooms, Textiles & Handicrafts
0.20 0.25 0.50 0.26 0.38 1.59
22 Jagannath Weavers Co-operative Spinning Mills
Ltd., Nuapatna
Handlooms, Textiles &
Handicrafts
0.00 0.00 0.00 0.37 0.00 0.37
23 Utkal Weavers Co-operative Spinning Mills Ltd., Khordha
Handlooms, Textiles & Handicrafts
0.00 0.00 0.00 0.27 0.00 0.27
24 State Institute of Hotel Management, Balangir
Tourism & Culture (Tourism)
1.00 1.00 1.00 1.00 1.10 5.10
25 Odisha Lift Irrigation Corporation Ltd.
Department of Water Resources
32.65 39.79 50.96 50.58 182.01 355.99
26 Odisha Community Tank Development & Management Society
Department of Water Resources
28.50 52.50 42.00 100.00 120.00 343.00
27 WALMI Odisha Department of
Water Resources
5.70 6.55 6.37 6.83 7.41 32.86
28 Odisha State Road Transport Corporation, Bhubaneswar (OSRTC)
Commerce & Transport (Transport)
0.46 8.00 10.00 9.00 25.00 52.46
29 Odisha State Civil Supplies Corporation Ltd.
Food, Supplies & Consumer Welfare
6.20 13.00 41.25 23.63 83.58 167.66
30 State Labour Institue, Bhubaneswar
Labour and ESI 0.33 0.90 1.50 1.75 2.00 6.48
31 Mahila Vikas Samabaya Nigam
Women & Child Development
41.38 50.67 132.89 1.99 14.12 241.05
32 Odisha State Commission for Women
Women & Child Development
1.33 1.25 1.69 2.00 2.15 8.42
33 State Social Welfare Board, Odisha
Women & Child Development
2.60 0.62 1.12 0.62 0.79 5.75
34 Odisha State Child Protection Society
Women & Child Development
7.16 9.78 17.36 26.29 63.80 124.39
35 Odisha State Council for Child Welfare, Bhubaneswar
Women & Child Development
2.96 0.46 2.83 1.25 3.22 10.72
36 Odisha State Commission for Protection of Child Rights
Women & Child Development
0.43 0.25 0.25 0.25 0.54 1.72
37 Regional Plant Resource Centre
Forest and Environment
4.00 5.50 6.15 6.60 7.50 29.75
38 Chilika Development Authority
Forest and Environment
13.52 13.52 13.88 14.39 6.02 61.33
39 Centre for Environment Studies
Forest and Environment
1.45 1.65 1.70 1.70 1.07 7.57
40 District Environment Society Forest and Environment
0.66 0.50 0.60 0.00 0.31 2.07
41 State Environment Impact Assessment Authority/State Expert Apprisal Committee
Forest and Environment
0.10 0.10 0.13 0.20 0.31 0.84
42 Integrated Coastal Zone Management Project (ICZMP)
Forest and Environment
6.00 4.50 10.90 7.11 0.32 28.83
43 Odisha Wetland Development Authority
Forest and Environment
0.20 1.00 0.50 1.00 0.00 2.70
44 Appellate Authority Forest and
Environment
0.03 0.13 0.02 0.12 0.02 0.32
45 State Medicinal Plant Board, Odisha
Forest and Environment
0.80 0.62 0.50 1.20 1.20 4.32
46 Odisha Forestry Sector Development Society
Forest and Environment
84.99 73.07 75.73 49.84 0.05 283.68

Appendices
Audit Report (State Finances)
for the year ended March 2016
113
Sl.
No.
Body/Authority receiving
Grants
Name of the
Department
Year Total
2011-12 2012-13 2013-14 2014-15 2015-16
47 Board of Secondary Education, Odisha, Cuttack
School & Mass Education
1.00 0.00 5.00 5.00 5.00 16.00
48 State Youth Welfare Board, Odisha
Sports & Youth Services
7.59 1.07 9.30 5.26 5.35 28.57
49 Odisha Council of Sports Sports & Youth Services
3.14 8.58 2.09 1.35 3.15 18.31
50 Odisha Electricity Regulatory Commission
Energy 0.00 3.00 5.00 5.00 0.00 13.00
51 Utkal University of Culture, Bhubaneswar
Tourism & Culture (Culture)
1.00 4.74 4.58 6.84 3.40 20.56
52 Odisha Urdu Academy, Bhubaneswar
Tourism & Culture (Culture)
0.22 0.34 0.70 0.80 0.70 2.76
53 Odisha Lalit Kala Academy, Bhubaneswar
Tourism & Culture (Culture)
0.31 0.85 0.93 0.95 0.85 3.89
54 Odissi Research Centre, Bhubaneswar
Tourism & Culture (Culture)
0.74 0.91 1.29 1.18 1.00 5.12
55 Odisha Sahitya Academy, Bhubaneswar
Tourism & Culture (Culture)
2.82 1.08 1.68 1.74 1.25 8.57
56 Odisha Sangeet Natak Academy, Bhubaneswar
Tourism & Culture (Culture)
1.31 1.31 2.07 2.61 1.00 8.30
57 South-East Asian Project Tourism & Culture (Culture)
0.00 0.00 0.00 0.00 0.50 0.50
Source: Information furnished by respective Departments.
N.B: Seven Departments (i) Home, (ii) Steel & Mines, (iii) Excise, (iv) Parliamentary Affairs, (v) Revenue and Disaster Management, (vi) Fisheries & Animal Resources Development and (vii) Information and Public Relations have given nil report.

Appendices
114 Audit Report (State Finances)
for the year ended March 2016
APPENDIX – 3.3 (Refer paragraph 3.4)
Statement of finalisation of accounts and Government investments in
departmentally managed Commercial and Quasi-commercial activities
Sl.
No.
Name of the Activities
/Schemes under the
Department
No. of
Activities/
Schemes
under the
Department
Years from
which
Accounts are
due
Investment
as per the
last accounts
finalised
(` in Lakh)
Remarks/Reasons for delay in
preparation of accounts
Department: Forest and Environment
1 Nationalisation of Kendu Leaves operated by Chief Conservator of Forests (Kendu leaves), Odisha
1 2011-12 70.09 Arrear of accounts for five years.
Department : Agriculture
2 Cold Storage Plant,
Kumarmunda
1 1972 11.97 Arrear of accounts for 44 years
3 Cold Storage Plant, Similiguda
1 1977 16.15 Arrear of accounts for 39 years
4 Cold Storage Plant, Paralakhemundi
1 1984 6.36 Arrear of accounts for 32 years
5 Cold Storage Plant, Balangir 1 1994 7.92 Arrear of accounts for 22 years
6 Cold Storage Plant, Bhubaneswar
1 1975 17.89 Transferred (March 1979) to Odisha State Seeds Corporation Limited. Arrear of accounts for nine years
7 Cold Storage Plant, Sambalpur
1 1971 NA Transferred (March 1979) to Odisha State Seeds Corporation Limited. Arrear of accounts for 13 years
8 Purchase and Distribution of Quality Seeds to Cultivators
1 1977-78 NA Proforma Accounts not prescribed by the State Government
Department : Food Supplies and Consumer Welfare
9 Grain Purchase Scheme 1 1977-78 NA Transferred (September 1980) to
Odisha State Seeds Corporation Limited. Arrear of accounts for eight years.
Department : Commerce and Transport (Transport)
10 State Transport Service 1 1972-73 NA Transferred (May 1974) to Odisha
State Road Transport Corporation. Arrear of accounts for seven years.
Department : Commerce and Transport (Commerce)
11 Director Printing, Stationery
and Publication, Odisha, Cuttack (Government Press)
1 1977-78 NA Proforma Accounts are not prepared
though it is required under the provision of Odisha Government Press Manual. Arrear of accounts for 38 years.
Department : Fisheries and Animal Resources Development
12 Poultry Development 1 -- NA Proforma accounts not prescribed by the State Government
Inoperative/Closed Activities/Schemes Year from which remained closed or
inoperative
13 Grain Supply Scheme 1 -- -- 1958-59
14 Scheme for trading in Iron Ore through Paradeep Port
1 -- -- 1966-67
15 Cloth and Yarn Scheme 1 -- -- 1954-55
16 Scheme for exploitation and Marketing of fish
1 -- -- 1982-83
NA: Not available Source: Finance Accounts 2015-16, Government of Odisha.

Appendices
Audit Report (State Finances)
for the year ended March 2016
115
APPENDIX – 3.4 (Refer paragraph 3.5)
Department wise / duration wise break-up of the cases of misappropriation, defalcation etc.
(Cases where final action was pending at the end of March 2016)
( ` in lakh) Sl.
No.
Name of the
Department
Up to 5 years
2010-11 to
2014-15
5 to 10 years
2005-06 to
2009-10
10 to 15 years
2001-02 to
2004-05
15 to 20 years
1995-96 to
2000-01
20 to 25 years
1990-91 to
1994-95
25 years to
More
from inception
upto 1989-90
Total
No.
of
cases
Amount No.
of
cases
Amount No.
of
cases
Amount No.
of
cases
Amount No.
of
cases
Amount No.
of
cases
Amount No.
of
cases
Amount
(1) (2) (3) (4) (5) (6) (7) (8) (9) (10) (11) (12) (13) (14) (15) (16)
1 Finance 0 0.00 0 0.00 0 0.00 0 0.00 1 4.85 3 5.04 4 9.89
2 Revenue &
Disaster
Management 0 0.00 1 2.54 4 108.06 1 0.78 5 4.46 11 25.67 22 141.51
3 Law 1 0.05 0 0.00 2 2.76 1 2.08 4 2.09 0 0.00 8 6.98
4 Water
Resources 3 15.62 15 9.26 29 44.61 69 112.96 77 30.33 21 45.35 214 258.12
5 Rural
Development 0 0 4 56.17 6 5.49 16 9.38 22 18.45 5 4.91 53 94.40
6 Energy 0 0 0 0 0 0 1 1.17 4 226.5 3 16.04 8 243.71
7 Employment
and Technical
Education 0 0.00 1 1.25 1 0.15 3 6.65 0 0.00 1 2.47 6 10.52
8 Micro, Small
and Medium
Enterprises 0 0.00 1 11.59 0 0.00 0 0.00 2 0.13 0 0.00 3 11.72
9
ST&SC
Development
Minorities and
Backward
Classes Welfare
0 0.00 1 0.73 1 2.01 1 0.95 2 0.95 3 2.24 8 6.88
10 Health & Family
Welfare 0 0.00 1 0.03 0 0.00 2 4.53 11 13.60 13 37.51 27 55.67
11 General
Administration 0 0.00 0 0.00 0 0.00 2 0.71 0 0.00 0 0.00 2 0.71
12 Works 0 0 4 3.28 5 2.5 38 54.67 20 7.07 16 117.81 83 185.34
13 Commerce &
Transport 0 0 0 0 3 6.18 0 0 2 1.3 3 1.79 8 9.27
14 School & Mass
Education 0 0.00 0 0.00 1 5.78 2 20.22 4 4.11 4 6.56 11 36.67
15 Higher
Education 0 0.00 2 3.29 2 7.73 0 0.00 1 3.53 0 0.00 5 14.55
16
Fisheries &
Animal
Resources
Development
0 0 0 0 1 0.31 4 0.86 6 2.44 8 71.78 19 75.39
17 Agriculture 0 0 5 18.7 4 32.26 21 25.89 20 10.23 14 18.86 64 105.94
18 Co-operation 0 0.00 0 0.00 0 0.00 1 0.94 2 3.25 0 0.00 3 4.19
19 Panchayati
Raj 0 0.00 0 0.00 2 4.32 1 7.11 5 9.31 10 13.25 18 33.99
20 Home 0 0.00 0 0.00 0 0.00 1 12.70 1 0.50 1 1.77 3 14.97
21 Food Supplies
& Consumer
Welfare 0 0.00 0 0.00 0 0.00 0 0.00 1 0.10 2 2.94 3 3.04
22 Housing &
Urban
Development 0 0 4 21.77 8 10.31 21 13.27 8 12.19 5 11.32 46 68.86
23 Information &
Public
Relations 0 0.00 0 0.00 0 0.00 21 1.57 38 4.75 0 0.00 59 6.32
24 Women &
Child
Development 0 0.00 0 0.00 0 0.00 0 0.00 4 3.30 0 0.00 4 3.30
25 Forest &
Environment 19 115.15 0 0.00 0 0.00 2 55.12 6 4.03 5 22.83 32 197.13
Total 23 130.82 39 128.61 69 232.47 208 331.56 246 367.47 128 408.14 713 1599.07
Source: Compiled from the information received from various departments of the State Government.

Appendices
116 Audit Report (State Finances)
for the year ended March 2016
APPENDIX – 3.5 (Refer paragraph 3.5)
Department / Category wise details in respect of cases of loss to Government
due to theft, misappropriation / loss of Government material
Sl.
No.
Name of Department
Theft Cases
Misappropriation/ Loss of
Government material Total
Number of
Cases
Amount
(` in lakh)
Number of
Cases
Amount
(` in lakh)
Number of
Cases
Amount
(` in lakh)
(1) (2) (3) (4) (5) (6) (7) (8)
1 Finance 0 0.00 4 9.89 4 9.89
2 Revenue & Disaster Management
6 4.10 16 137.41 22 141.51
3 Law 3 0.83 5 6.15 8 6.98
4 Water Resources 144 149.88 70 108.25 214 258.13
5 Rural Development 38 75.92 15 18.48 53 94.40
6 Energy 3 1.23 5 242.48 8 243.71
7 Employment and Technical Education
4 3.80 2 6.72 6 10.52
8 Micro, Small and Medium
Enterprises 0 0.00 3 11.72 3 11.72
9 ST&SC Dev. , Minorities and Backward Classes Welfare
1 0.73 7 6.15 8 6.88
10 Health & Family Welfare 8 6.12 19 49.55 27 55.67
11 General Administration 2 0.71 0 0.00 2 0.71
12 Works 40 14.96 43 170.37 83 185.33
13 Commerce & Transport 3 6.18 5 3.09 8 9.27
14 School & Mass Education 0 0.00 11 36.67 11 36.67
15 Higher Education
1 0.08 4 14.47 5 14.55
16 Fisheries and ARD 6 1.43 13 73.96 19 75.39
17 Agriculture 31 16.67 33 89.27 64 105.94
18 Co-operation 1 0.71 2 3.48 3 4.19
19 Panchayati raj 7 16.89 11 17.10 18 33.99
20 Home 0 0.00 3 14.97 3 14.97
21 Food Supplies & Consumer Welfare
1 0.10 2 2.94 3 3.04
22 Housing & Urban Development 32 43.93 14 24.93 46 68.86
23 Information & Public Relations 53 4.38 6 1.94 59 6.32
24 Women & Child Development 1 0.03 3 3.27 4 3.30
25 Forest & Environment 8 48.09 24 149.04 32 197.13
Total 393 396.77 320 1202.3 713 1599.07
Source: Compiled from the information received from various departments of the State Government.

Appendices
Audit Report (State Finances)
for the year ended March 2016
117
APPENDIX – 3.6 (Refer paragraph 3.5)
Reasons for which the cases of misappropriation / loss / defalcation were
pending ( ` in lakh)
Sl.
No.
Name of the
Department
(A) Under
Departmental/
Criminal
Investigation
(B) Departmental
action started but
not finalised
© Certificate case
is pending
(D) Recovery order
received/ awaited
(E) Case is
sub-judice
Total
No
of
cases
Amount No of
cases
Amoun
t
No of
cases
Amount No of
cases
Amount No
of
cases
Amoun
t
No of
cases
Amount
(1) (2) (3) (4) (5) (6) (7) (8) (9) (10) (11) (12) (13) (14)
1 Finance 0 0.00 0 0.00 0 0.00 0 0.00 4 9.89 4 9.89
2 Revenue &
Disaster
Management 3 1.42 6 6.31 4 2.41 3 4.07 6 127.30 22 141.51
3 Law 1 0.05 1 2.21 1 0.15 2 0.89 3 3.68 8 6.98
4 Water
Resources 103 162.14 103 84.35 1 0 5 11.28 2 0.35 214 258.12
5 Rural
Development 30 77.22 22 17.18 0 0 0 0 1 0 53 94.4
6 Energy 2 16.03 5 226.51 1 1.17 0 0 0 0 8 243.71
7 Employment
and Technical
Education 1 4.24 1 1.25 0 0.00 0 0.00 4 5.03 6 10.52
8
Micro, Small
and Medium
Enterprises 1 11.59 1 0.08 0 0.00 1 0.05 0 0.00 3 11.72
9 ST&SC Dev. ,
Minorities and
Backward
Classes Welfare 2 2.74 4 3.19 0 0.00 2 0.95 0 0.00 8 6.88
10 Health &
Family Welfare 2 0.40 4 6.62 0 0.00 6 8.20 15 40.45 27 55.67
11 General Admn. 0 0.00 0 0.00 0 0.00 2 0.71 0 0.00 2 0.71
12 Works 34 38.5 45 142.43 1 0.41 0 0 3 4 83 185.34
13 Commerce &
Transport 4 6.18 2 1.04 0 0 1 0.75 1 1.3 8 9.27
14 School & Mass
Education 5 10.65 1 1.31 0 0.00 0 0.00 5 24.71 11 36.67
15 Higher
Education 2 3.29 0 0.00 0 0.00 1 0.08 2 11.18 5 14.55
16 Fisheries &
Animal
Resources
Development 0 0.00 10 54.55 0 0.00 5 4.55 4 16.29 19 75.39
17 Agriculture 5 13.5 19 61.16 0 0 13 4.79 27 26.49 64 105.94
18 Co-operation 0 0.00 1 0.94 0 0.00 0 0.00 2 3.25 3 4.19
19 Panchayati Raj 10 21.11 4 10.97 0 0.00 3 1.51 1 0.40 18 33.99
20 Home 0 0.00 0 0.00 1 12.70 0 0.00 2 2.27 3 14.97
21
Food Supplies
& Consumer
Welfare 0 0.00 0 0.00 0 0.00 1 0.10 2 2.94 3 3.04
22
Housing &
Urban
Development 24 39.41 20 26.17 0 0.00 0 0.00 2 3.28 46 68.86
23 Information &
Public Relations 49 5.53 8 0.64 0 0.00 0 0.00 2 0.15 59 6.32
24 Women &
Child
Development 0 0.00 4 3.30 0 0.00 0 0.00 0 0.00 4 3.30
25 Forest &
Environment
7 80.66 16 93.03 0 0.00 3 21.04 6 2.40 32 197.13
Total 285 494.66 277 743.24 9 16.84 48 58.97 94 285.36 713 1599.07
Source: Compiled from the information received from various departments of the State Government.

Appendices
118 Audit Report (State Finances)
for the year ended March 2016
APPENDIX – 3.7 (Refer paragraph 3.6)
Statement showing unadjusted AC bills for the years up to 2015-16
Sl. No. Department Number of AC
bills
Amount
(` in crore )
1 01-Home 2479 29.84
2 02-General Administration 41 7.15
3 03-Revenue and Disaster Management 4 0.01
4 04-Law 81 0.10
5 05-Finance 2 0.08
6 11-ST & SC Develpoment, Minorities & Backward Classes Welfare 4 0.00
7 12-Health and Family Welfare 6 0.07
8 13-Housing and Urban Development 12 0.07
9 17-Panchayati Raj 49 0.75
10 20-Water Resources 1 0.00
11 21-Transport 1 3.60
12 24-Steel and Mines 59 0.12
13 32-Tourism and Culture 1 0.15
14 33-Fisheries and Animal Resource Development 8 0.03
15 34-Co-operation 6 1.23
16 38-Higher Education 192 1.10
Total 2946 44.30
Source: Compiled from the information received from Principal Accountant General (A&E), Odisha

Appendices
Audit Report (State Finances)
for the year ended March 2016
119
APPENDIX – 3.8 (Refer paragraph 3.10.1)
Statement showing details of DDO-wise outstanding advance position
as on 31 March 2016
(₹ in crore)
Source: Compiled from the information received from various DDOs of the State Government.
# `27140
Sl.
No.
Name of the Drawing
& Disbursing Officer
Unadjusted
advance as
on
01/04/2015
Advance
made
during the
year TOTAL
Adjustments
made during
the year
Unadjusted
advance as on
31/03/2016
1 BDO- Sundargarh Sadar 0# 0.35 0.35 0.04 0.31
2 BDO - Bargaon 2.67 0 2.67 0.32 2.35
3 BDO - Puintala 0.42 0.32 0.74 0.01 0.73
4 BDO- Balangir Sadar 0.97 3.87 4.84 3.61 1.23
5 BDO - Cuttack Sadar 0.36 0.54 0.9 0.51 0.39
6 BDO - Raghunathpur 0.62 0.02 0.64 0.02 0.62
7 BDO - Jharsuguda 0.96 0.01 0.97 0.22 0.75
8 BDO - Laikera 1.43 0 1.43 0.78 0.65
9 BDO - Bhawanipatna 5.98 6.67 12.65 9.81 2.84
10 BDO - Junagarh 0.28 5.93 6.21 6.05 0.16
11 BDO - Ghatagaon 0.40 0.06 0.46 0.15 0.31
12 BDO - Begunia 0.07 0.04 0.11 0.04 0.07
13 BDO - Jatni 0.97 0 0.97 0.03 0.94
14 BDO –Puri Sadar 0.28 0.03 0.31 0.05 0.26
15 BDO - Maneswar 0.66 0.14 0.80 0.14 0.66
16 BDO - Dhankauda 0.11 0.38 0.49 0.48 0.01
17 BDO - Baranga 0.12 0 0.12 0.01 0.11
18 BDO –Keonjhar Sadar 0.84 0.03 0.87 0.04 0.83
19 BDO - Koraput 0.33 0.09 0.42 0.20 0.22
20 BDO - Jeypore 0.77 0 0.77 0.49 0.28
Total (BDO) 18.24 18.48 36.72 23.00 13.72
21 DRDA - Balangir 19.79 22.41 42.20 0.02 42.18
22 DRDA - Cuttack 64.15 18.12 82.27 0.19 82.08
23 DRDA - Jagatsinghpur 144.25 33.55 177.80 0.03 177.77
24 DRDA - Jharsuguda 0.23 0.22 0.45 0 0.45
25 DRDA -Kalahandi 259.17 3.13 262.30 0.01 262.29
26 DRDA - Keonjhar 0.87 0.02 0.89 0.02 0.87
27 DRDA - Khurda 6.15 0.02 6.17 0.02 6.15
28 DRDA - Sundargarh 40.53 8.52 49.05 18.15 30.90
29 DRDA - Sambalpur 0.02 0.02 0.04 0.0 0.04
30 DRDA - Puri 0.02 0.03 0.05 0.03 0.02
Total ( DRDA) 535.18 86.04 621.22 18.47 602.75
TOTAL 553.42 104.52 657.94 41.47 616.47

Appendices
120 Audit Report (State Finances)
for the year ended March 2016
APPENDIX – 3.9 (Refer paragraph 3.10.2)
Statement showing the details of discrepancies between Cash book and Pass
book as on 31 March 2016 (₹ in crore)
Sl. No. Name of the DDO Balance as per
Bank pass book
Balance as per
Cash book
Difference
1 DSWO, Balangir 25.50 23.90 1.60
2 DSWO, Kalahandi 43.72 42.93 0.79
3 DSWO, Sambalpur 21.17 18.00 3.17
4 BDO, Baranga 12.16 10.59 1.57
5 DSWO, Cuttack 52.30 44.18 8.12
6 BDO, Raghunathpur 6.60 5.51 1.09
7 DSWO, Jagatsinghpur 13.27 12.33 0.94
8 BDO, Jharsuguda 20.43 16.97 3.46
9 DWO, Sundargarh 15.80 13.39 2.41
10 DSWO, Koraput 52.52 49.40 3.12
11 BDO, Jeypore 17.58 15.90 1.68
12 DWO, Cuttack 12.73 12.22 0.51
13 BDO, Keonjhar 6.81 6.28 0.53
14 DEO, Kalahandi 9.58 8.70 0.88
15 DEO,Sambalpur 6.42 5.44 0.98
16 DWO, Jagatsinghpur 7.17 6.76 0.41
TOTAL 323.76 292.50 31.26
Source: Compiled from the information received from various DDOs of the State Government.
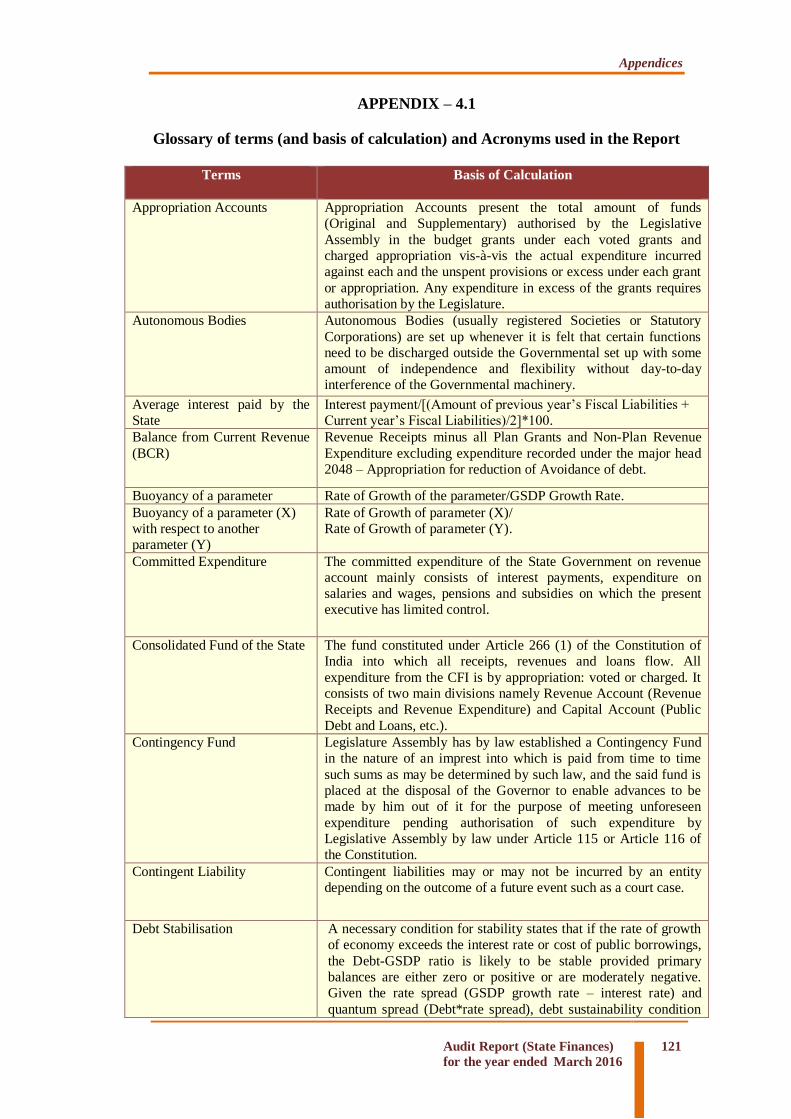
Appendices
Audit Report (State Finances)
for the year ended March 2016
121
APPENDIX – 4.1
Glossary of terms (and basis of calculation) and Acronyms used in the Report
Terms Basis of Calculation
Appropriation Accounts Appropriation Accounts present the total amount of funds
(Original and Supplementary) authorised by the Legislative
Assembly in the budget grants under each voted grants and
charged appropriation vis-à-vis the actual expenditure incurred
against each and the unspent provisions or excess under each grant
or appropriation. Any expenditure in excess of the grants requires
authorisation by the Legislature.
Autonomous Bodies Autonomous Bodies (usually registered Societies or Statutory
Corporations) are set up whenever it is felt that certain functions
need to be discharged outside the Governmental set up with some
amount of independence and flexibility without day-to-day
interference of the Governmental machinery.
Average interest paid by the
State
Interest payment/[(Amount of previous year’s Fiscal Liabilities +
Current year’s Fiscal Liabilities)/2]*100.
Balance from Current Revenue
(BCR)
Revenue Receipts minus all Plan Grants and Non-Plan Revenue
Expenditure excluding expenditure recorded under the major head
2048 – Appropriation for reduction of Avoidance of debt.
Buoyancy of a parameter Rate of Growth of the parameter/GSDP Growth Rate.
Buoyancy of a parameter (X)
with respect to another
parameter (Y)
Rate of Growth of parameter (X)/
Rate of Growth of parameter (Y).
Committed Expenditure The committed expenditure of the State Government on revenue
account mainly consists of interest payments, expenditure on
salaries and wages, pensions and subsidies on which the present
executive has limited control.
Consolidated Fund of the State The fund constituted under Article 266 (1) of the Constitution of
India into which all receipts, revenues and loans flow. All
expenditure from the CFI is by appropriation: voted or charged. It
consists of two main divisions namely Revenue Account (Revenue
Receipts and Revenue Expenditure) and Capital Account (Public
Debt and Loans, etc.).
Contingency Fund Legislature Assembly has by law established a Contingency Fund
in the nature of an imprest into which is paid from time to time
such sums as may be determined by such law, and the said fund is
placed at the disposal of the Governor to enable advances to be
made by him out of it for the purpose of meeting unforeseen
expenditure pending authorisation of such expenditure by
Legislative Assembly by law under Article 115 or Article 116 of
the Constitution.
Contingent Liability Contingent liabilities may or may not be incurred by an entity
depending on the outcome of a future event such as a court case.
Debt Stabilisation A necessary condition for stability states that if the rate of growth
of economy exceeds the interest rate or cost of public borrowings,
the Debt-GSDP ratio is likely to be stable provided primary
balances are either zero or positive or are moderately negative. Given the rate spread (GSDP growth rate – interest rate) and
quantum spread (Debt*rate spread), debt sustainability condition

Appendices
122 Audit Report (State Finances)
for the year ended March 2016
Terms Basis of Calculation
states that if quantum spread together with primary deficit is zero,
Debt-GSDP ratio would be constant or debt would stabilise
eventually. On the other hand, if primary deficit together with
quantum spread turns out to be negative, Debt-GSDP ratio would
be rising and in case it is positive, Debt-GSDP ratio would
eventually be falling.
Debt sustainability The Debt sustainability is defined as the ability of the State to
maintain a constant Debt-GSDP ratio over a period of time and
also embodies the concern about the ability to service its debt.
Sustainability of debt therefore also refers to sufficiency of liquid
assets to meet current or committed obligations and the capacity
to keep balance between costs of additional borrowings with
returns from such borrowings. It means that rise in fiscal deficit
should match with the increase in capacity to service the debt.
Development Expenditure Social Services + Economic Services.
Escrow Account In order to ensure fiscal discipline in public sector
undertaking/Urban Local Bodies/Co-operative Institutions and
State-owned Companies etc., and to ensure minimising the default
on payment of Government guaranteed loans the Government in
Finance Department vide their Resolution No.11311/F dated 19
March 2004 have issued instructions that all Public Sector
Undertakings/ Urban Local Bodies/ Co-operative Institutions and
State-owned Companies etc. who have borrowed against
Government guarantee will open an Escrow Account in a
nationalised bank for timely repayment of guaranteed loans. The
proceeds of this account shall first be utilised for payment of dues
of the financial Institutions and it is only after meeting such
payments that the surplus amount shall be diverted for other
payments including salaries.
Fiscal Deficit Revenue Expenditure + Capital Expenditure + Net Loans and
Advances – Revenue Receipts – Miscellaneous Capital Receipts.
Guarantee Redemption Fund Guarantees are liabilities contingent on the Consolidated Fund of
the State in case of default by the borrower for whom the guarantee
has been extended. Government of Odisha has constituted a
guaranteed redemption fund during the year 2002-2003 with the
objective of meeting the payment obligations arising out of the
default in discharging the debt servicing for the loans guaranteed
by Government.
Internal Debt Internal Debt comprises regular loans from the public in India, also
termed ‘Debt raised in India’. It is confined to loans credited to the
Consolidated Fund.
Interest received as per cent to
Loans Outstanding
Interest Received/ [(Opening balance + Closing balance of Loans
and Advances)/2]*100.
Primary Deficit Fiscal Deficit – Interest payments.
Primary Revenue Expenditure Primary revenue expenditure means revenue expenditure excluding
interest payments.
Public Accounts Committee A Committee constituted by the Legislative Assembly for the
examination of the reports of the Comptroller and Auditor General
of India relating to the appropriation accounts of the State, the
annual financial accounts of the State or such other accounts or
financial matters as are laid before it or which the Committee
deems necessary to scrutinise.
Rate of Growth (ROG) [(Current year Amount /Previous year Amount)-1]*100

Appendices
Audit Report (State Finances)
for the year ended March 2016
123
Terms Basis of Calculation
Re-appropriation Means the transfer of funds from one Primary unit of appropriation
to another such unit.
Revenue Deficit Revenue Receipt – Revenue Expenditure.
Sinking Fund A Fund into which the Government sets aside money over time, in
order to retire its debt.
Sufficiency of Non-debt
Receipts
Adequacy of incremental non-debt receipts of the State to cover
the incremental interest liabilities and incremental primary
expenditure. Debt sustainability could be significantly facilitated if
the incremental non-debt receipts could meet the incremental
interest burden and the incremental primary expenditure.
Supplementary Grants If the amount authorised by any law made in accordance with the
provisions of Article 114 of the Constitution of India to be
expended for a particular service for the current financial year is
found to be insufficient for the purpose of that year or when a need
has arisen during the current financial year for the supplementary
or additional expenditure upon some ‘new service’ not
contemplated in the original budget for that year, Government is to
obtain supplementary grants or appropriations in accordance with
the provision of Article 115 (1) of the Constitution of India.
Surrender of unspent provision Departments of the State Government are to surrender to the
Finance Department, before the close of the financial year, all the
anticipated unspent provisions noticed in the grants or
appropriations controlled by them. The Finance Department is to
communicate the acceptance of such surrenders, as are accepted by
them to the Audit Officer and/or the Accounts Officer, as the case
may be, before the closing of the financial year.
State Implementing Agency State Implementing Agency includes any Organisation/Institution
including Non-Governmental Organisation which is authorised by
the State Government to receive the funds from the Government of
India for implementing specific programmes in the State, e.g. State
Implementation Society for Sarva Siksha Abhiyan and State Health
Mission for National Rural Health Mission, etc.
Suspense and Miscellaneous Items of receipts and payments which cannot at once be taken to a
final head of receipt or charge owing to lack of information as to
their nature or for any other reasons, may be held temporarily
under the major head “8658-Suspense Account” in the sector “L.
Suspense and Miscellaneous” of the Accounts, (Footnotes under
the major head in the list of major/minor heads of account may be
referred to for further guidance). A service receipt of which full
particulars are not given must not be taken to the head “Suspense
Account” but should be credited to the minor head “Other Receipt”
under the revenue major head to which it appears to belong
pending eventual transfer to the credit of the correct head on
receipt of detailed particulars.

Appendices
124 Audit Report (State Finances)
for the year ended March 2016
Acronyms Full Form
AC Abstract Contingency
AE Aggregate Expenditure
BE Budget Estimates
BOO Built, Own and Operate
BOOST Built, Own, Operate, Share and Transfer
BOOT Built, Own, Operate and Transfer
BOT Built, Operate and Transfer
CAG Comptroller and Auditor General of India
CE Capital Expenditure
CFS Consolidated Fund of the State
DBFOT Design, Built, Finance, Operate and Transfer
DBOO Design, Built, Own and Operate
DBOOT Design, Built, Own, Operate and Transfer
DBT Design, Built and Transfer
DCC Detailed Countersigned Contingent
DDO Drawing and Disbursing Officer
DE Development Expenditure
DRDA District Rural Development Agency
DSWO District Social Welfare Office
FCP Fiscal Correction Path
FFC Fourteenth Finance Commission
FRBM Fiscal Responsibility and Budget Management
GIA Grants-in-Aid
GoI Government of India
GSDP Gross State Domestic Product
IP/RR Interest Payment/ Revenue Receipt
MPLAD Member of Parliament Local Area Development
MTFP Medium Term Fiscal Plan
NPRE Non-Plan Revenue Expenditure
NSSF National Small Savings Fund
O&M Operation and Maintenance
OB&OCWWB Odisha Building and Other Construction Workers Welfare Board
OBM Odisha Budget Manual
OGFR Odisha General Financial Rules
ONTR Own Non Tax Revenue
OTC Odisha Treasury Code
OTR Own Tax Revenue
OTS One Time Settlement
PIA Project Implementing Agencies
PPP Public Private Partnership

Appendices
Audit Report (State Finances)
for the year ended March 2016
125
Acronyms Full Form
PSU Public Sector Undertakings
QEA Quarterly Expenditure Allocation
RE Revenue Expenditure
RR Revenue Receipts
S &W Salaries and Wages
SFC State Finance Commission
SSE Social Sector Expenditure
TE Total Expenditure
ThFC Thirteenth Finance Commission
UC Utilisation Certificates


© COMPTROLLER ANDAUDITOR GENERAL OF INDIA
www.cag.gov.in
www.agodisha.gov.in