Embed Size (px)
Citation preview
State Finances
NASACTSanta Fe
August 13, 2014
Scott PattisonExecutive Director
National Association of State Budget Officers444 North Capitol Street, NW, Suite 642 • Washington, DC 20001 • (202) 624-5382 • www.nasbo.org
NASBO 2
Current Economic and Fiscal Situation for States
NASBO
State Fiscal Overview
Most states -- stability and slow growth
Revenue growth less in fiscal 2014 and 2015 than fiscal 2013
Most states: budgets with spending increases
Additional spending on K-12, higher education, and healthcare
3
NASBO 4
NASBO 5
Current Fiscal Situation:
Indicators
NASBO
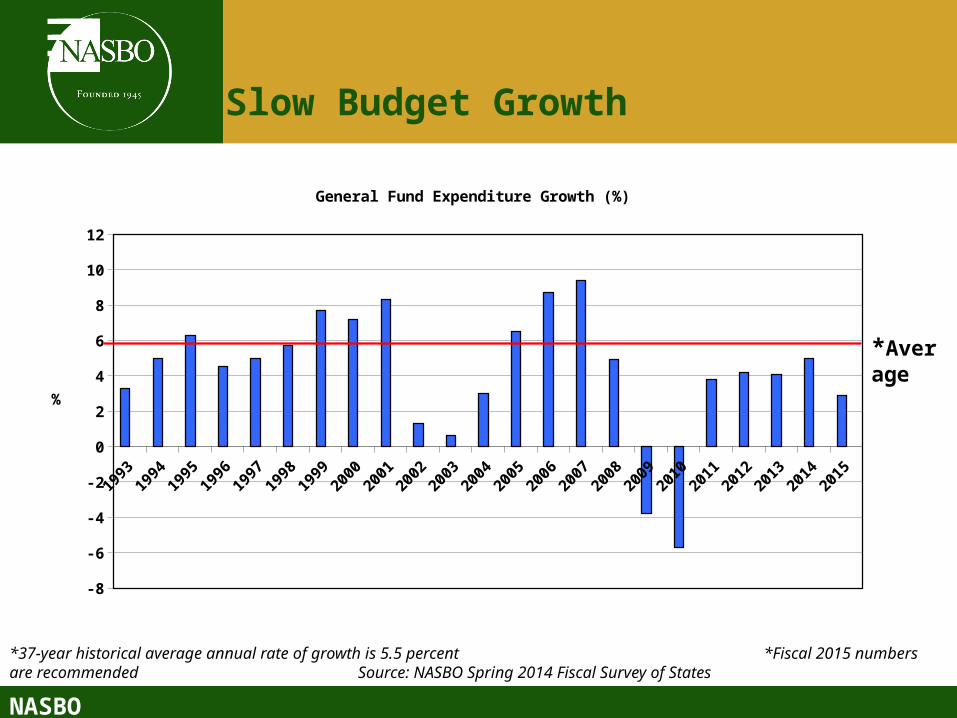
Slow Budget Growth
1993
1994
1995
1996
1997
1998
1999
2000
2001
2002
2003
2004
2005
2006
2007
2008
2009
2010
2011
2012
2013
2014
2015
-8
-6
-4
-2
0
2
4
6
8
10
12
General Fund Expenditure Growth (%)
%
*37-year historical average annual rate of growth is 5.5 percent *Fiscal 2015 numbers are recommended Source: NASBO Spring 2014 Fiscal Survey of States
*Average
NASBO
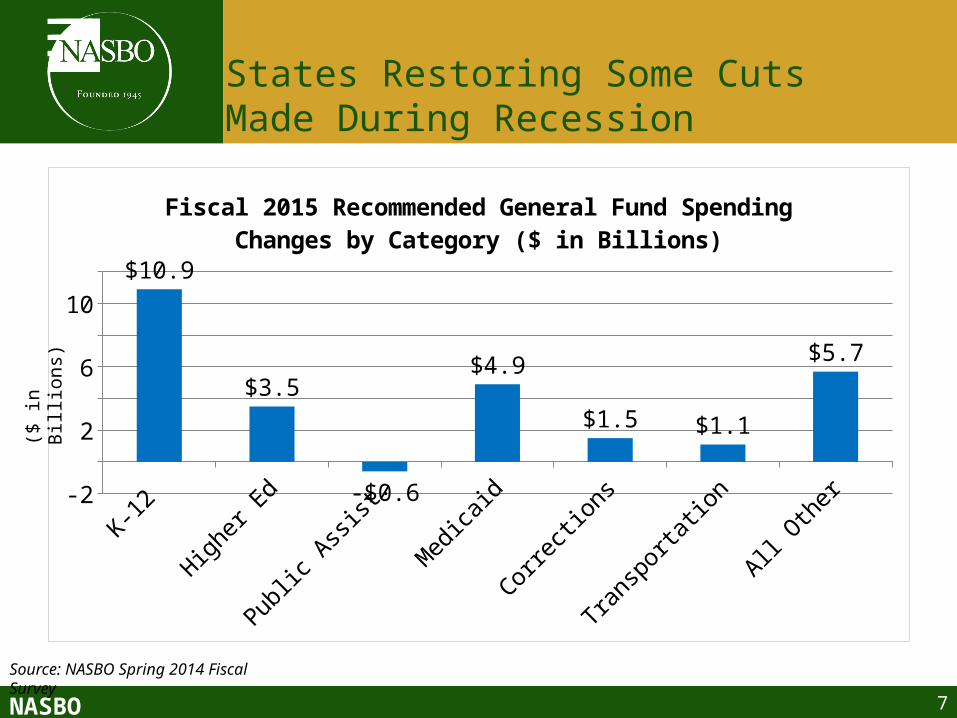
States Restoring Some CutsMade During Recession
K-12
Higher
Ed
Public
Ass
ist.
Med
icaid
Corre
ction
s
Trans
porta
tion
All Oth
er-2
0
2
4
6
8
10
12 $10.9
$3.5
-$0.6
$4.9
$1.5 $1.1
$5.7
Fiscal 2015 Recommended General Fund Spending Changes by Category ($ in Billions)
7
($ in
Bill
ions)
Source: NASBO Spring 2014 Fiscal Survey
NASBO
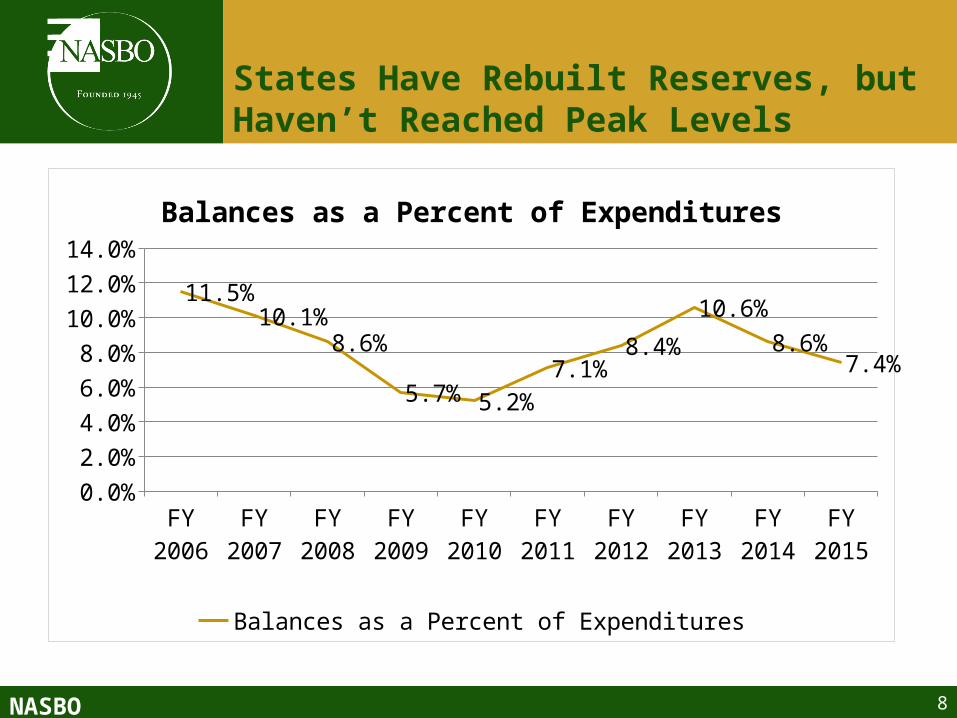
States Have Rebuilt Reserves, but Haven’t Reached Peak Levels
FY 2006
FY 2007
FY 2008
FY 2009
FY 2010
FY 2011
FY 2012
FY 2013
FY 2014
FY 2015
0.0%
2.0%
4.0%
6.0%
8.0%
10.0%
12.0%
14.0%
11.5%10.1%
8.6%
5.7% 5.2%
7.1%8.4%
10.6%
8.6%7.4%
Balances as a Percent of Expenditures
Balances as a Percent of Expenditures
8
NASBO
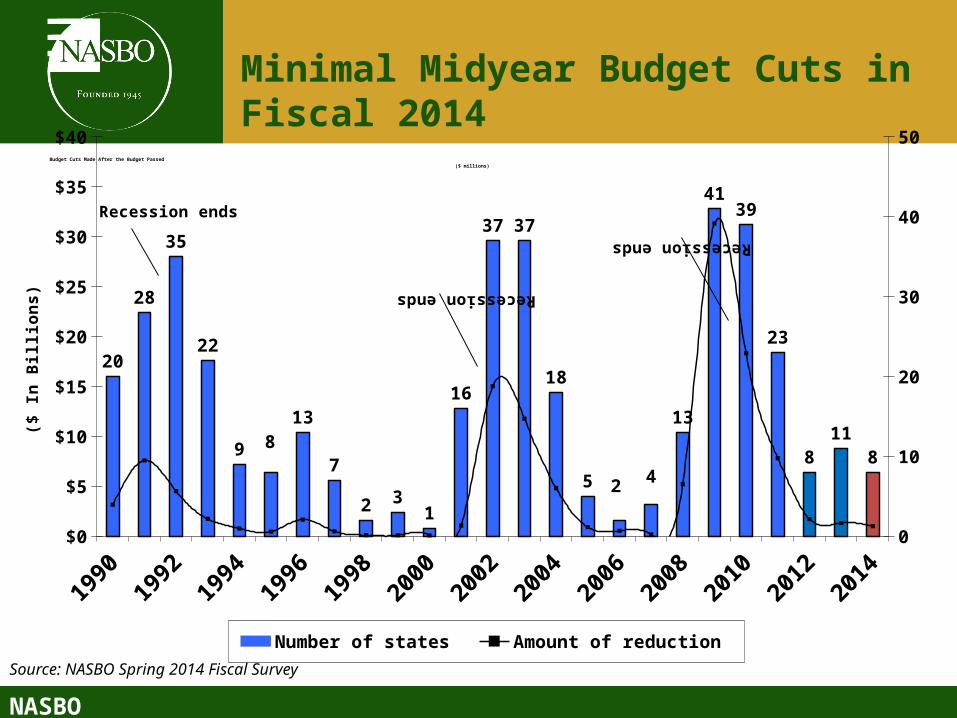
Budget Cuts Made After the Budget Passed ($ millions)
Source: NASBO Spring 2014 Fiscal Survey
Minimal Midyear Budget Cuts in Fiscal 2014
1990
1992
1994
1996
1998
2000
2002
2004
2006
2008
2010
2012
2014
$0
$5
$10
$15
$20
$25
$30
$35
$40
0
10
20
30
40
50
20
28
35
22
9 813
7
2 31
16
37 37
18
5 2 4
13
4139
23
811
8
Number of states Amount of reduction
Recession ends
Recession ends
Recession ends
($ I
n B
illio
ns)
NASBO 10
Critical Challenges
NASBO 11
NASBO 12
NASBO
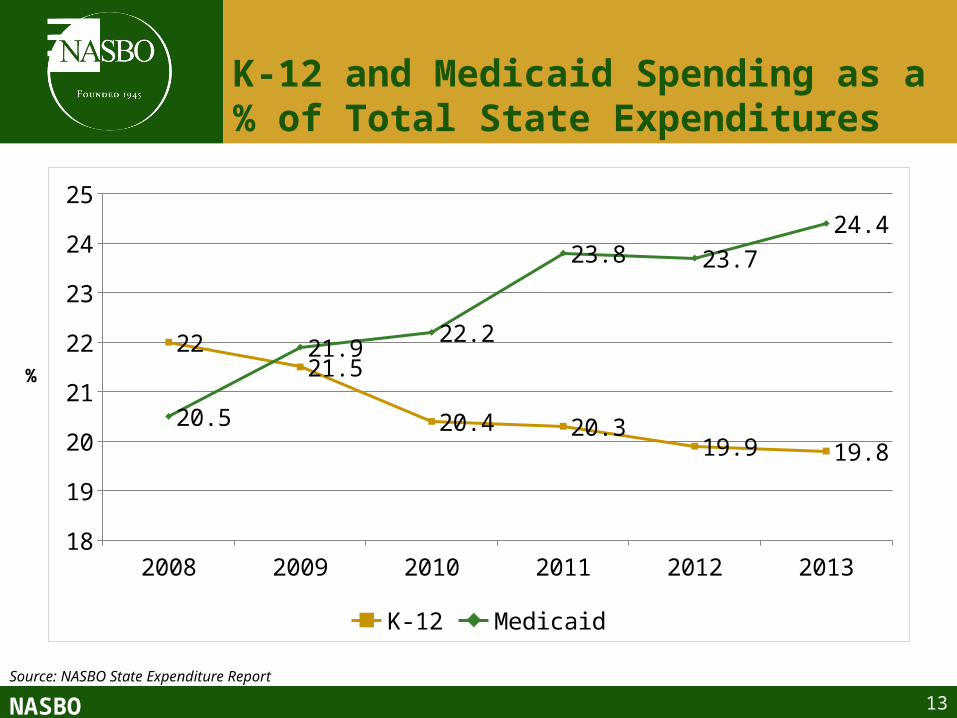
K-12 and Medicaid Spending as a % of Total State Expenditures
13
%
Source: NASBO State Expenditure Report
2008 2009 2010 2011 2012 201318
19
20
21
22
23
24
25
2221.5
20.4 20.319.9 19.8
20.5
21.922.2
23.8 23.7
24.4
K-12 Medicaid
NASBO 14
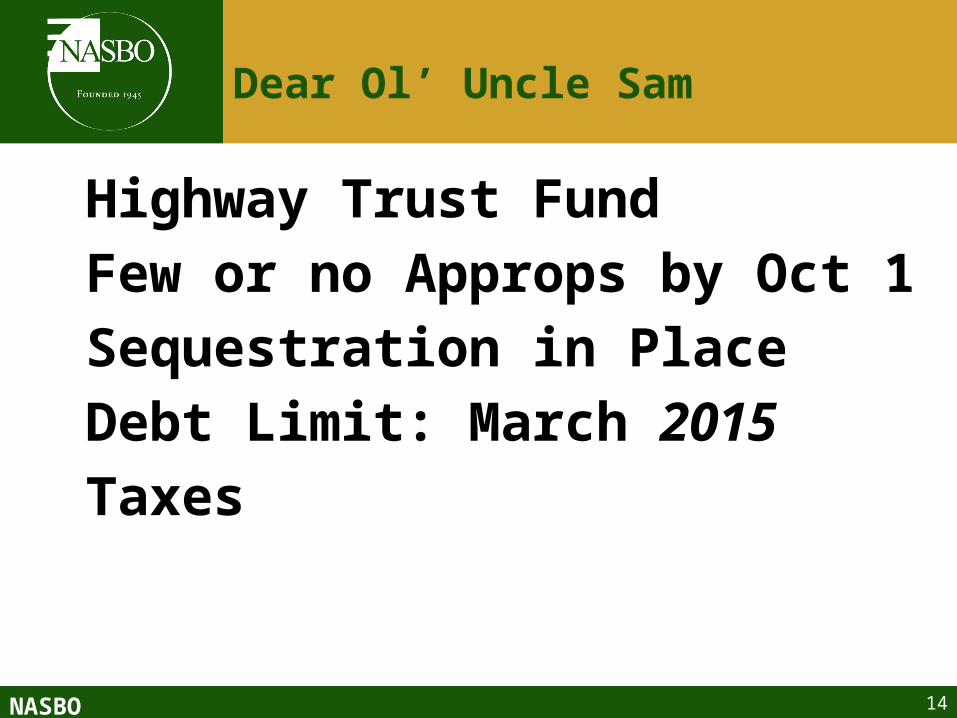
Dear Ol’ Uncle Sam
Highway Trust Fund
Few or no Approps by Oct 1
Sequestration in Place
Debt Limit: March 2015
Taxes
NASBO 15
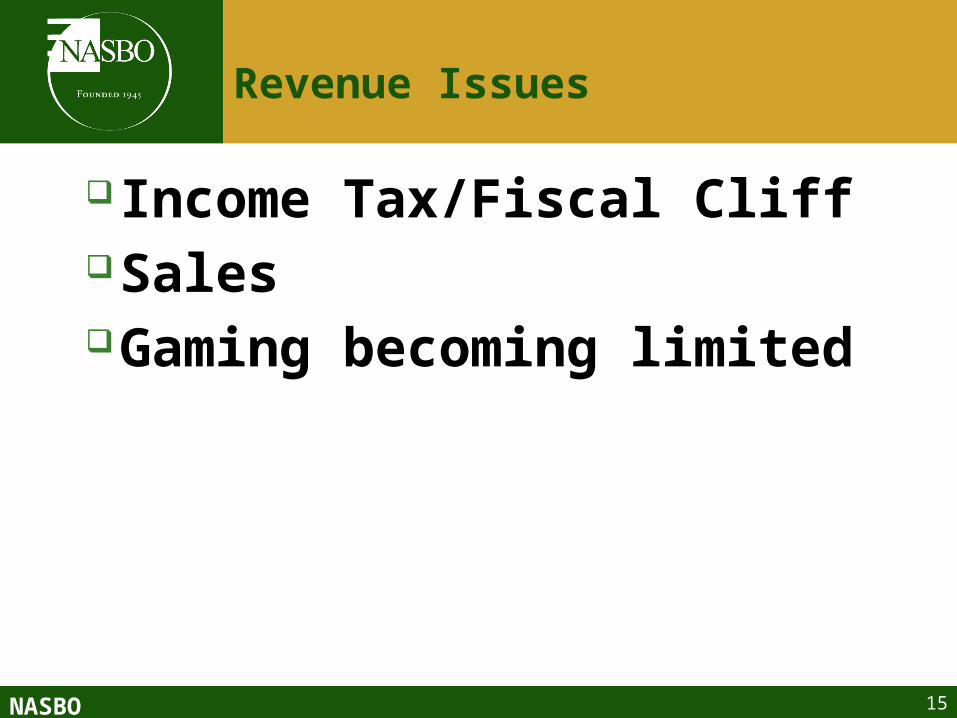
Revenue Issues
Income Tax/Fiscal CliffSalesGaming becoming limited
NASBO 16
Background on State Spending Trends
NASBO 17
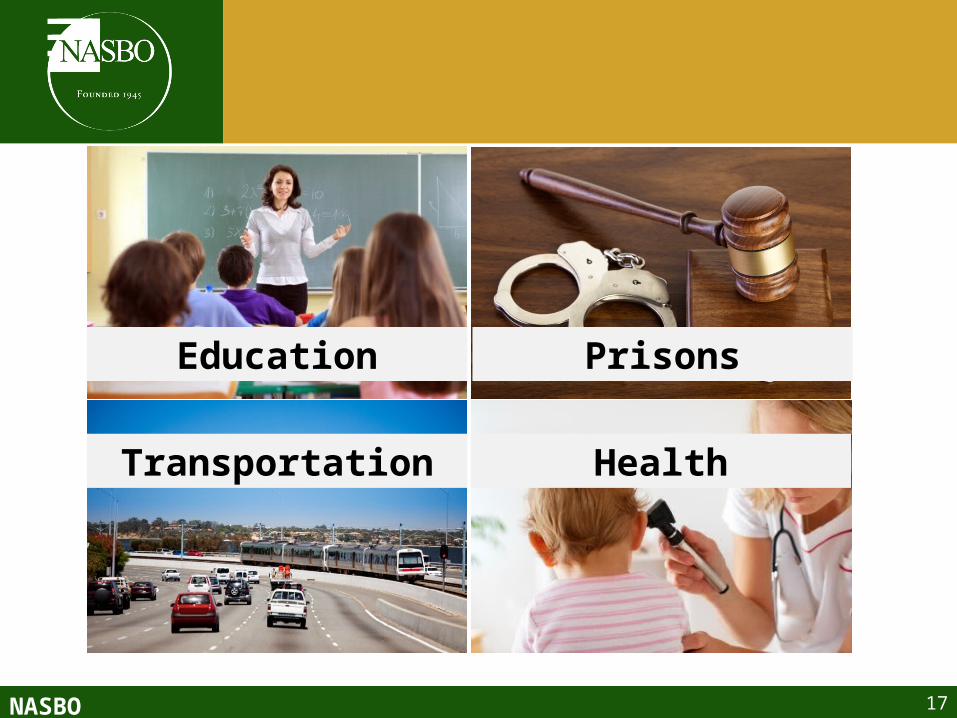
Education Prisons
Transportation Health
NASBO
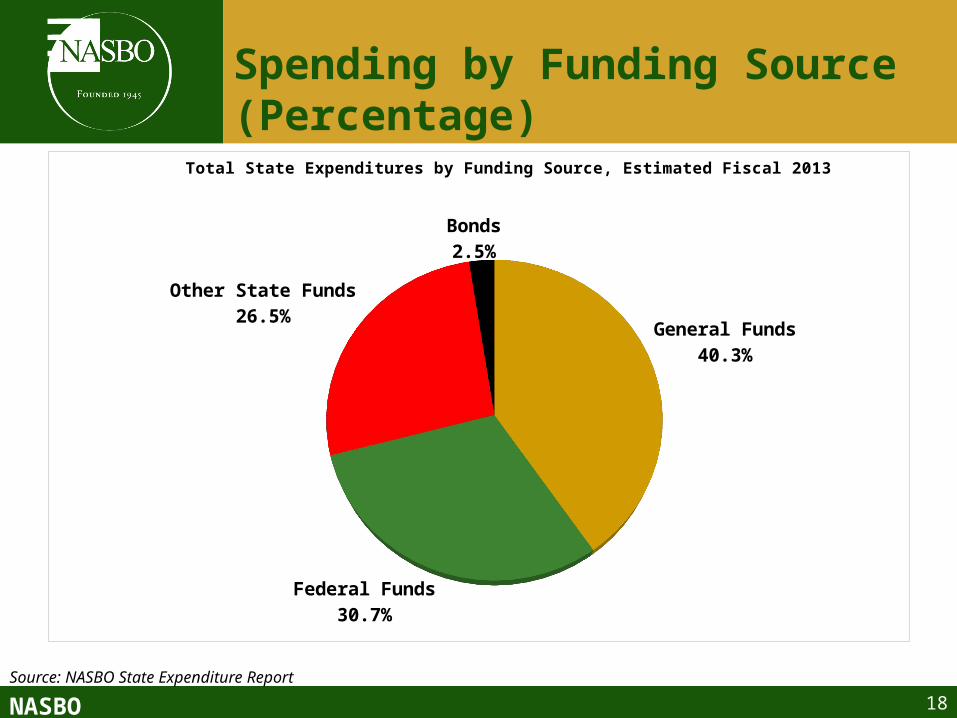
Spending by Funding Source(Percentage)
General Funds40.3%
Federal Funds30.7%
Other State Funds26.5%
Bonds2.5%
Total State Expenditures by Funding Source, Estimated Fiscal 2013
18
Source: NASBO State Expenditure Report
NASBO
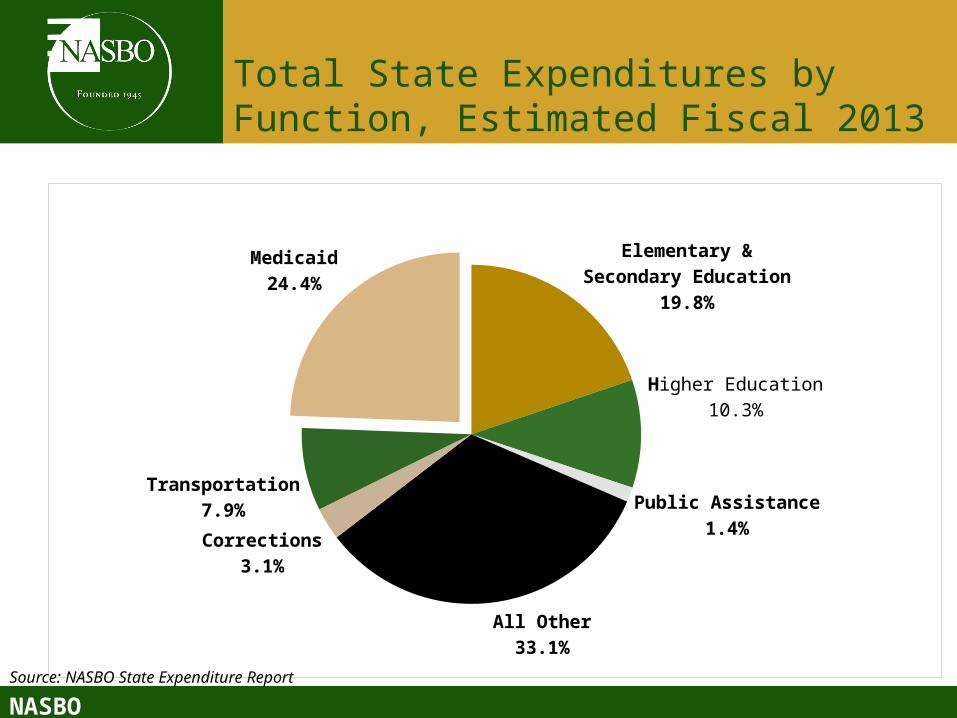
Total State Expenditures by Function, Estimated Fiscal 2013
Elementary & Secondary Education
19.8%
Higher Education10.3%
Public Assistance1.4%
All Other33.1%
Corrections3.1%
Transportation7.9%
Medicaid24.4%
Source: NASBO State Expenditure Report
NASBO
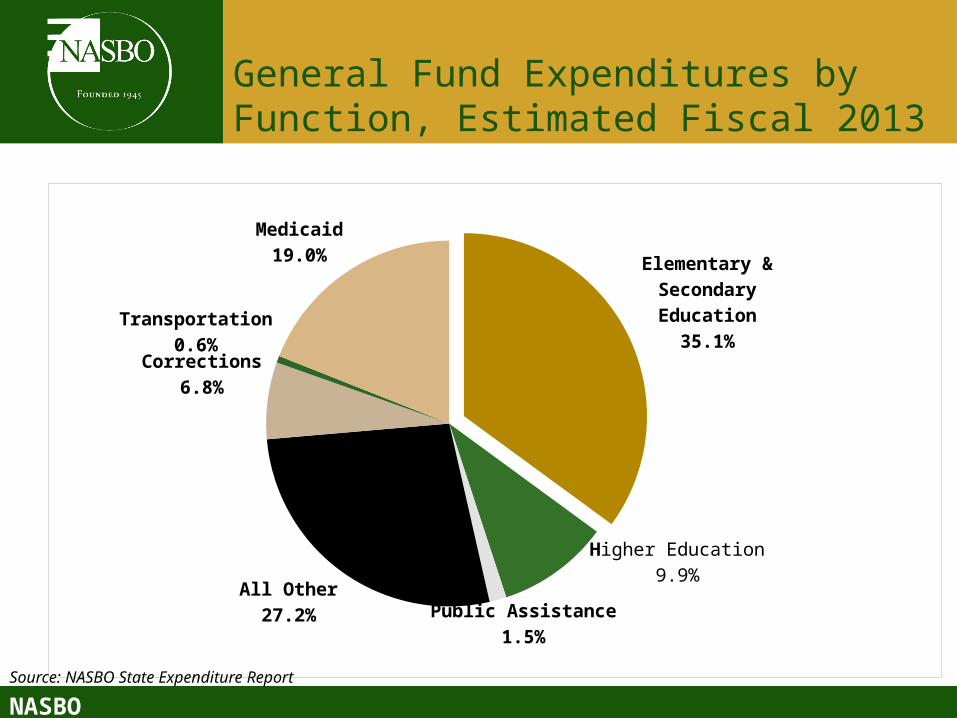
General Fund Expenditures by Function, Estimated Fiscal 2013
Elementary & Secondary Educa-
tion35.1%
Higher Education9.9%
Public Assistance1.5%
All Other27.2%
Corrections6.8%
Transportation0.6%
Medicaid19.0%
Source: NASBO State Expenditure Report
NASBO 21
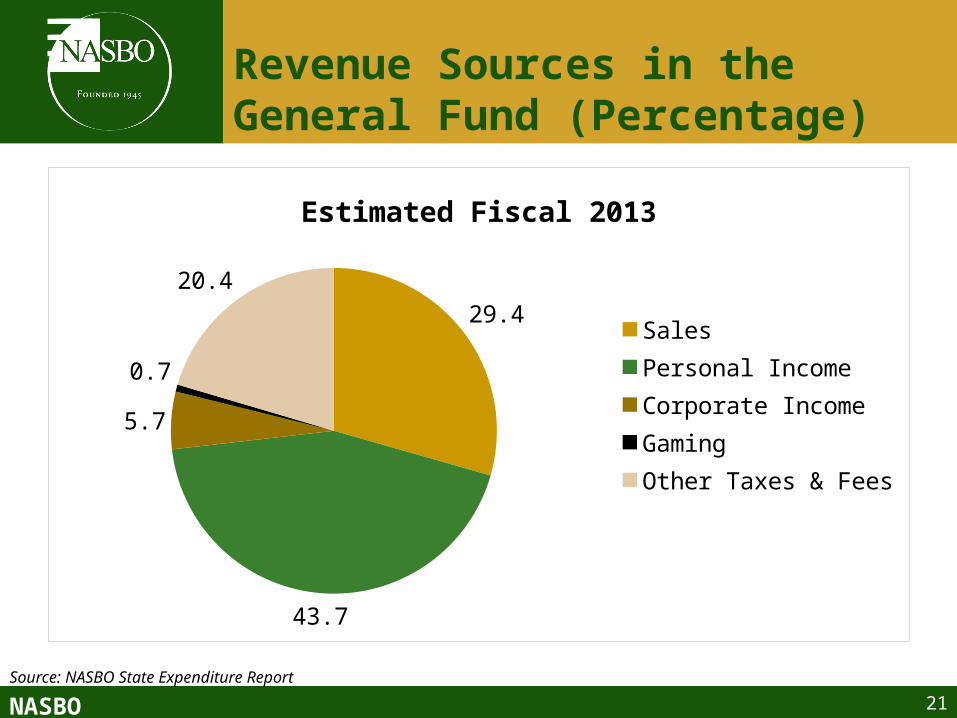
Revenue Sources in the General Fund (Percentage)
Source: NASBO State Expenditure Report
29.4
43.7
5.7
0.7
20.4
Estimated Fiscal 2013
Sales Personal IncomeCorporate IncomeGamingOther Taxes & Fees
NASBO 22
Outlook

NASBO 23
NASBO 24
State Fiscal Outlook
Slow increase in spending
Revenue growth remains slow in fiscal 2015
Challenges: infrastructure, long-term liabilities
“Crowd Out”
Federal impacts