Embed Size (px)
Citation preview
State Freight and Rail Plan
Draft Findings and RecommendationsCentral Regional Meeting
Massachusetts Department of Transportation
April 1, 2010
Commonwealth of MassachusettsCommonwealth of Massachusetts
Freight &Freight &Rail PlanRail Plan
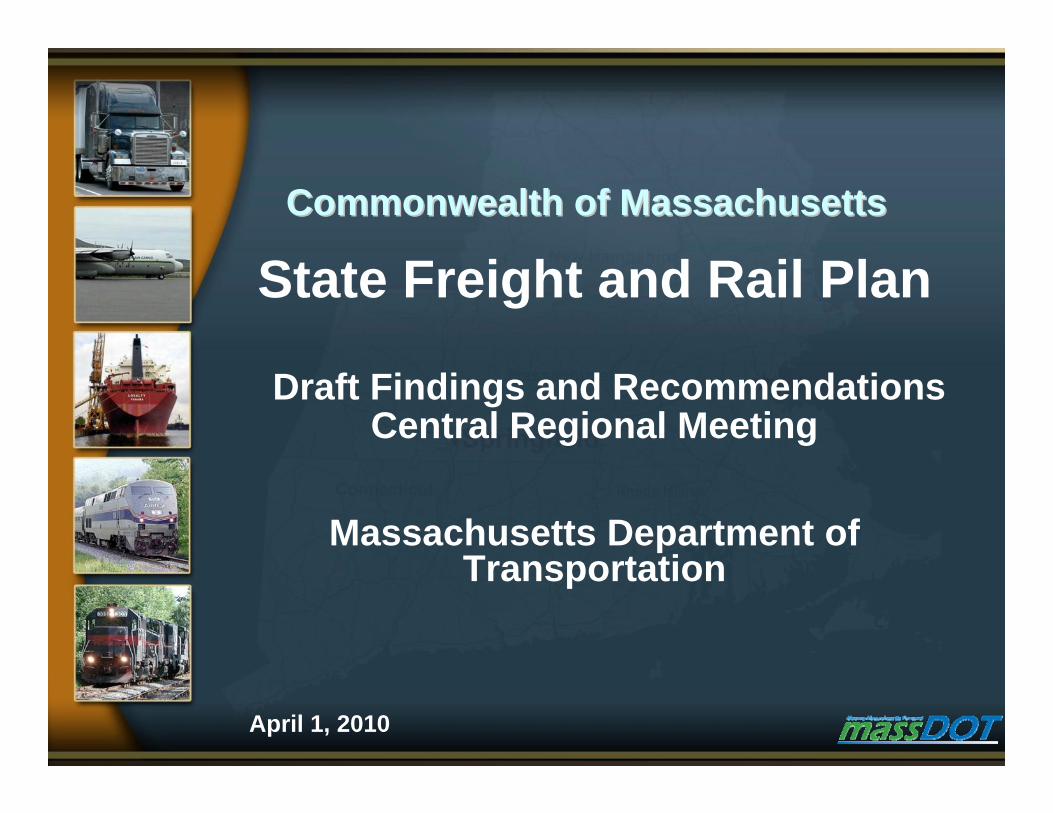
Freight & Rail Plan – Key Components
• Multi-modal Freight Plan and standalone Rail Plan• Evaluation of existing conditions and trends
– Heavy inbound & through-traffic for all modes– Light-weight, smaller volume outbound– Highway dominant freight mode – low rail share – Land use and policy issues
• Analysis of future conditions• Evaluation of issues and opportunities• Recommendations
– Infrastructure improvements and state freight policy

EXISTING FREIGHT NETWORK AND FORECAST
Freight &Freight &Rail PlanRail Plan
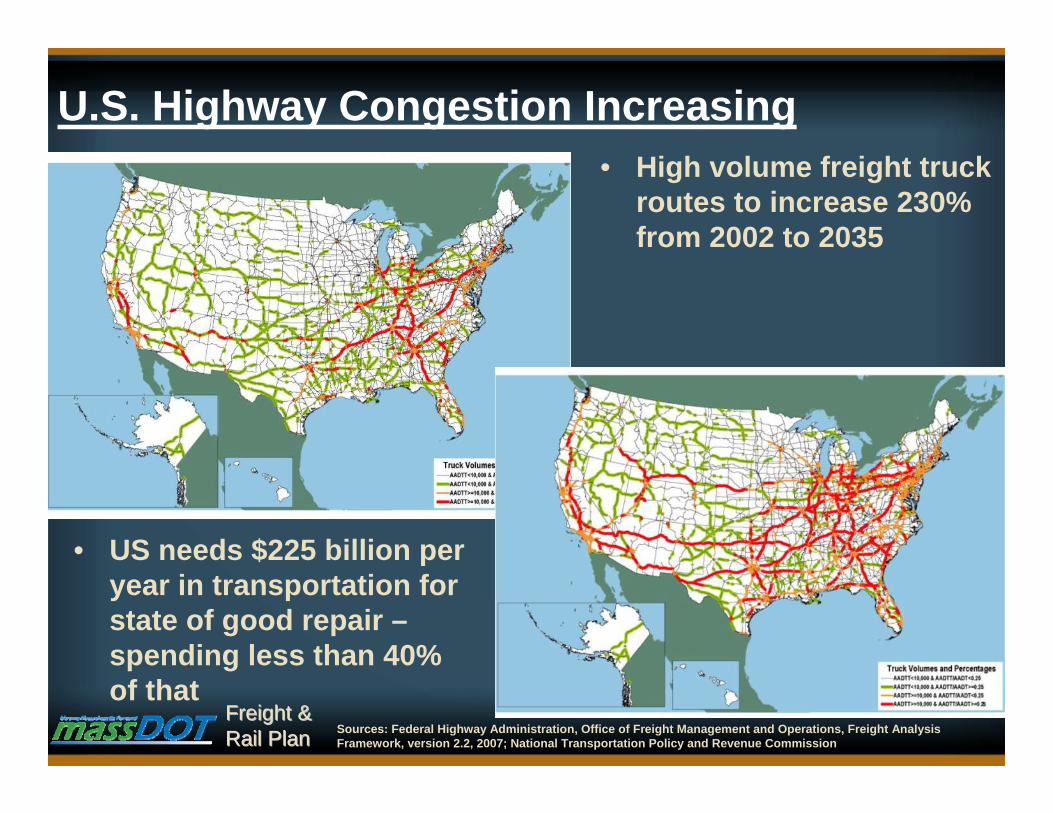
U.S. Highway Congestion Increasing• High volume freight truck
routes to increase 230% from 2002 to 2035
Sources: Federal Highway Administration, Office of Freight Management and Operations, Freight Analysis Framework, version 2.2, 2007; National Transportation Policy and Revenue Commission
• US needs $225 billion per year in transportation for state of good repair –spending less than 40% of that
Freight &Freight &Rail PlanRail Plan
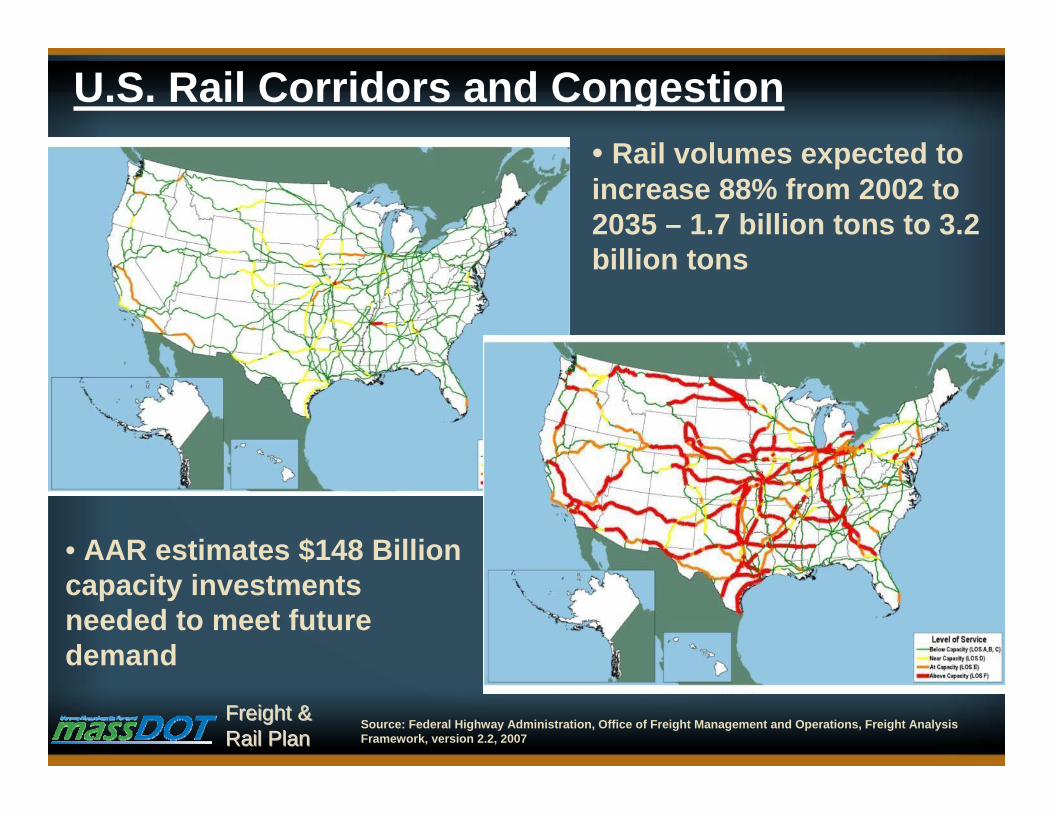
U.S. Rail Corridors and Congestion
Source: Federal Highway Administration, Office of Freight Management and Operations, Freight Analysis Framework, version 2.2, 2007
• Rail volumes expected to increase 88% from 2002 to 2035 – 1.7 billion tons to 3.2 billion tons
• AAR estimates $148 Billion capacity investments needed to meet future demand
Freight &Freight &Rail PlanRail Plan
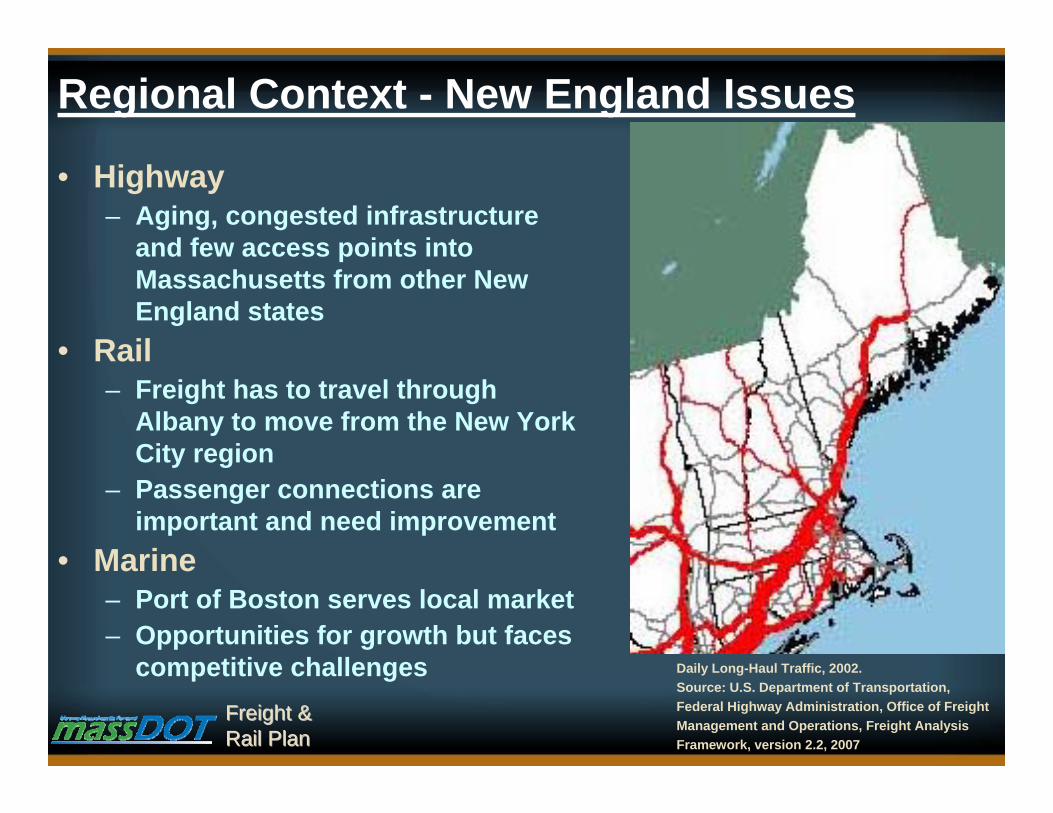
• Highway– Aging, congested infrastructure
and few access points into Massachusetts from other New England states
• Rail– Freight has to travel through
Albany to move from the New York City region
– Passenger connections are important and need improvement
• Marine– Port of Boston serves local market– Opportunities for growth but faces
competitive challenges
Regional Context - New England Issues
Daily Long-Haul Traffic, 2002. Source: U.S. Department of Transportation,Federal Highway Administration, Office of Freight Management and Operations, Freight Analysis Framework, version 2.2, 2007

Freight &Freight &Rail PlanRail Plan
Port of Boston and Northeast Port Container Traffic
Source: American Association of Port Authorities
• Port of Boston serves 30% of New England’s waterborne freight – up 10% from 8 years ago
• 75-90% of port cargo has a destination within 100 miles
• Top bulk commodities: petroleum, LNG, salt, scrap metal
• Top container commodities: fish, furniture, beer & wine, papers, autos

Freight &Freight &Rail PlanRail Plan
Massachusetts Highway Network

Freight &Freight &Rail PlanRail Plan
Massachusetts Freight Rail Network

Freight &Freight &Rail PlanRail Plan
Massachusetts Passenger Rail Network

Freight &Freight &Rail PlanRail Plan
Massachusetts Multi-Modal Freight Network
Freight &Freight &Rail PlanRail Plan
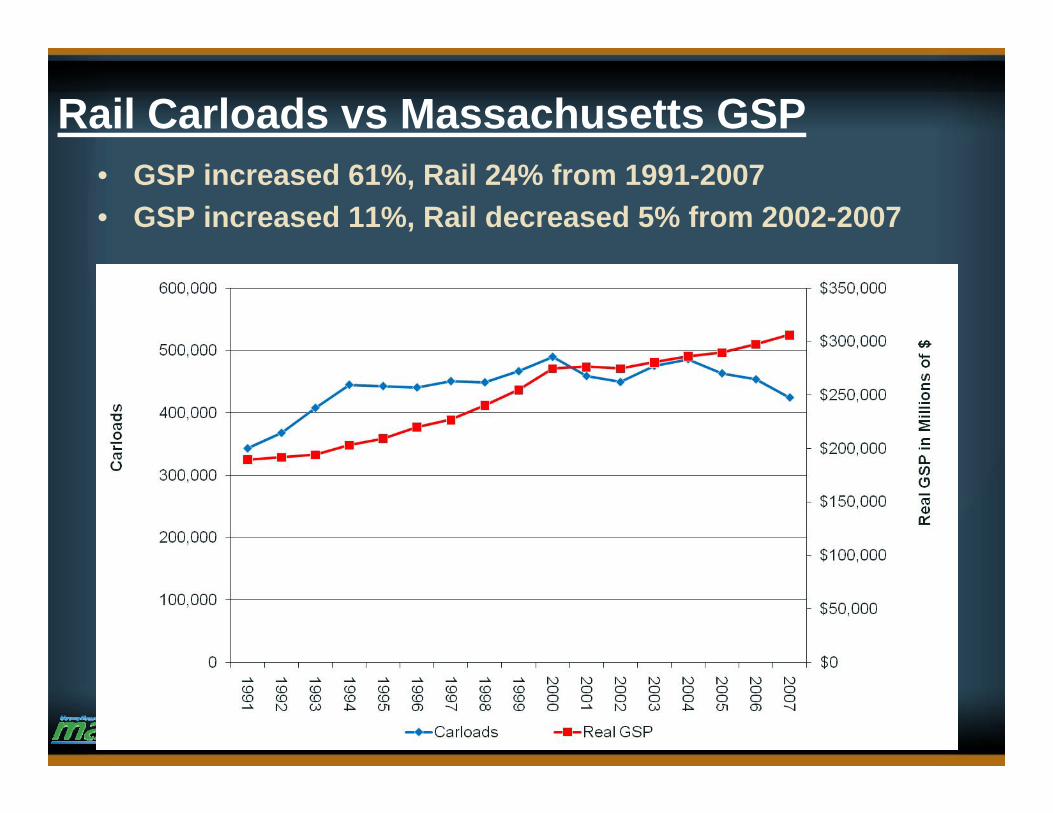
Rail Carloads vs Massachusetts GSP• GSP increased 61%, Rail 24% from 1991-2007• GSP increased 11%, Rail decreased 5% from 2002-2007
Freight &Freight &Rail PlanRail Plan
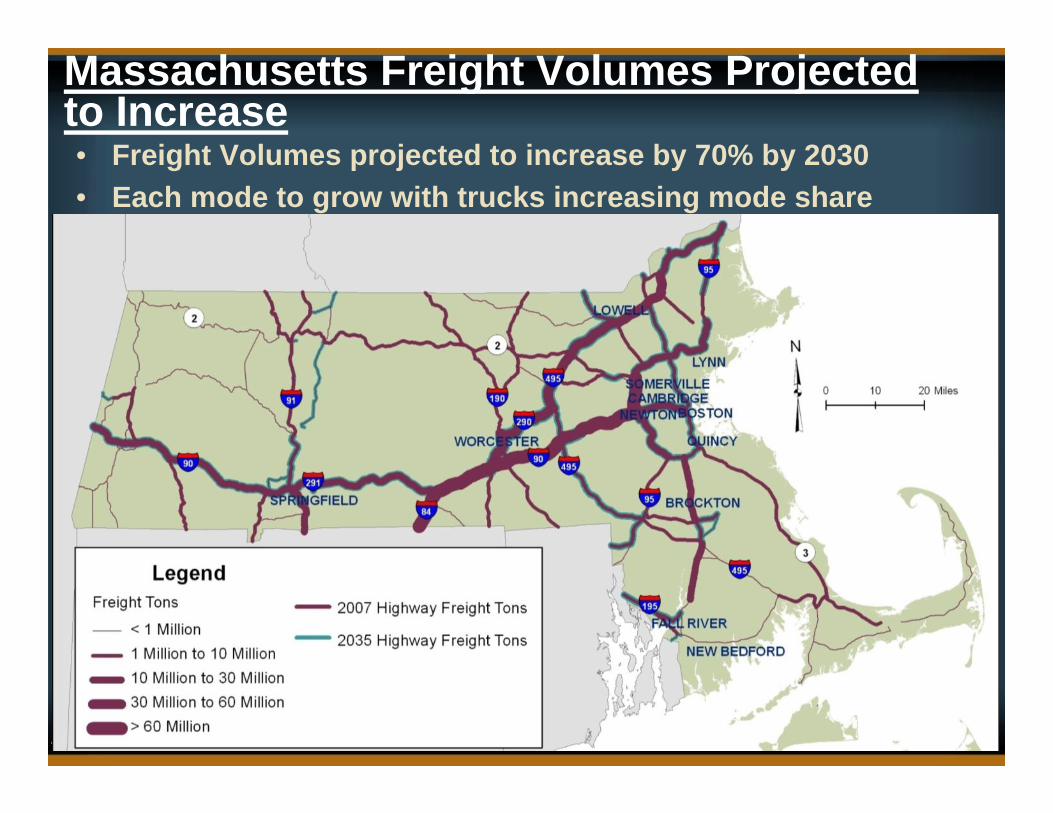
• Freight Volumes projected to increase by 70% by 2030• Each mode to grow with trucks increasing mode share
Massachusetts Freight Volumes Projected to Increase
Freight &Freight &Rail PlanRail Plan
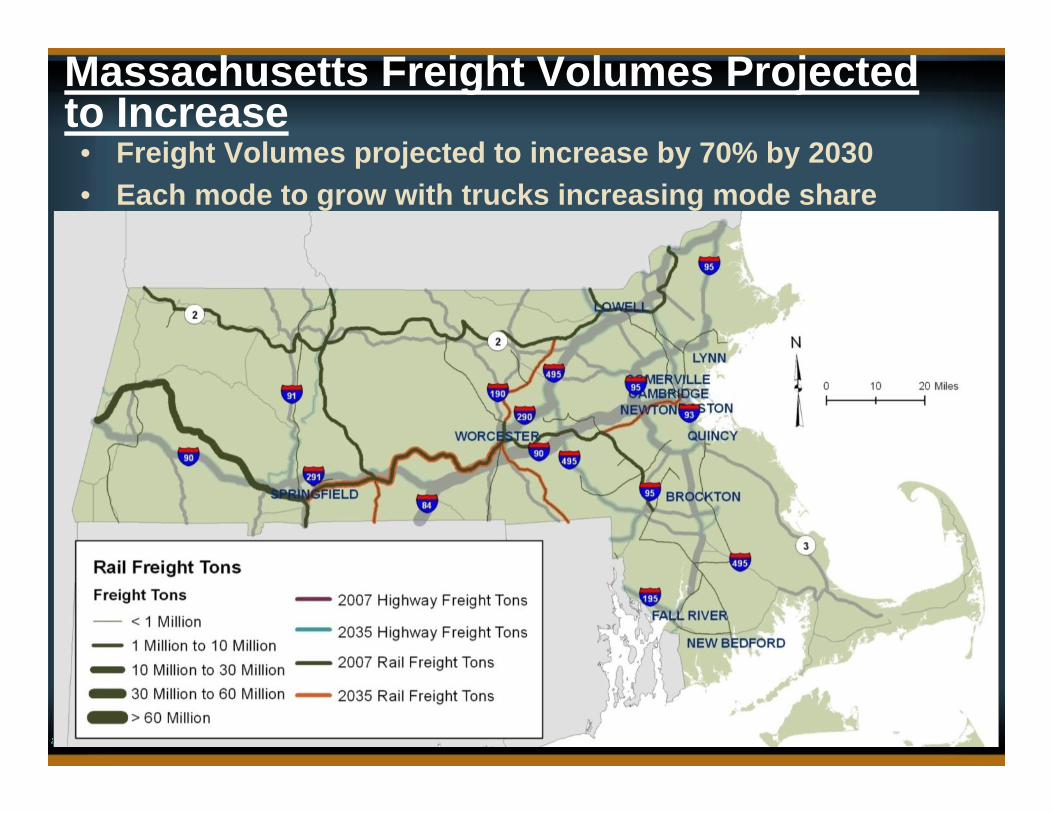
• Freight Volumes projected to increase by 70% by 2030• Each mode to grow with trucks increasing mode share
Massachusetts Freight Volumes Projected to Increase
Freight &Freight &Rail PlanRail Plan
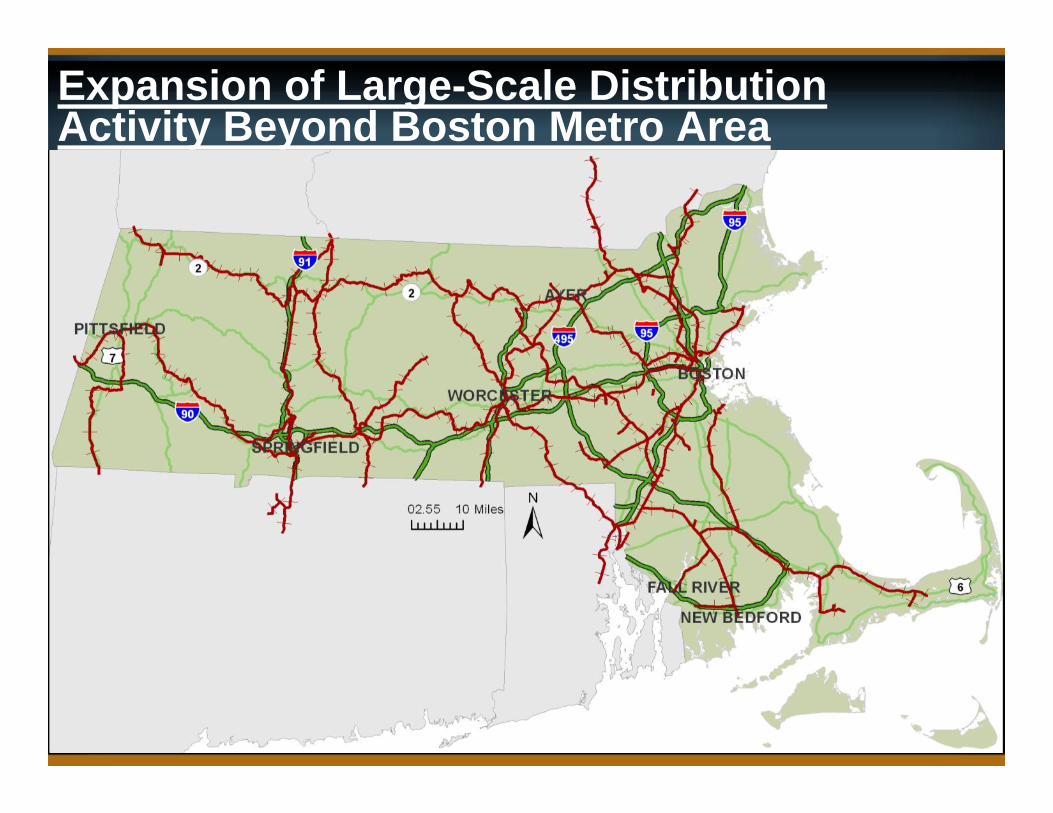
Expansion of Large-Scale Distribution Activity Beyond Boston Metro Area

Freight &Freight &Rail PlanRail Plan
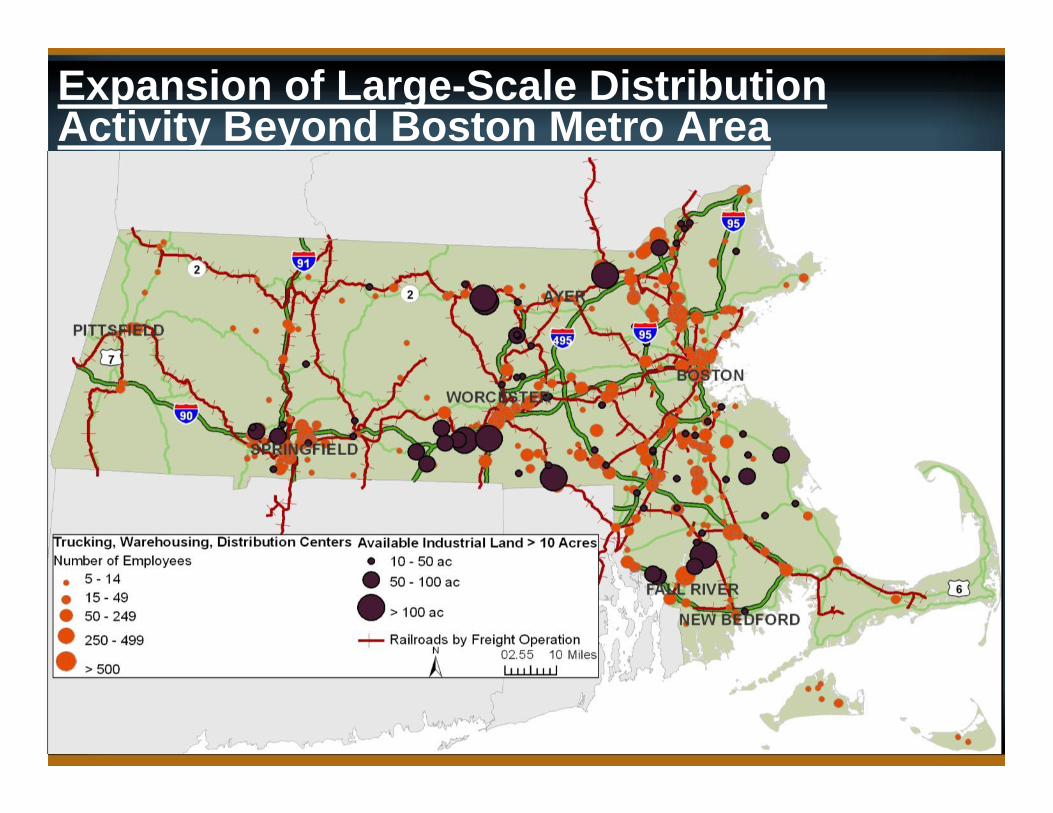
Expansion of Large-Scale Distribution Activity Beyond Boston Metro Area
Freight &Freight &Rail PlanRail Plan
Expansion of Large-Scale Distribution Activity Beyond Boston Metro Area
Freight &Freight &Rail PlanRail Plan
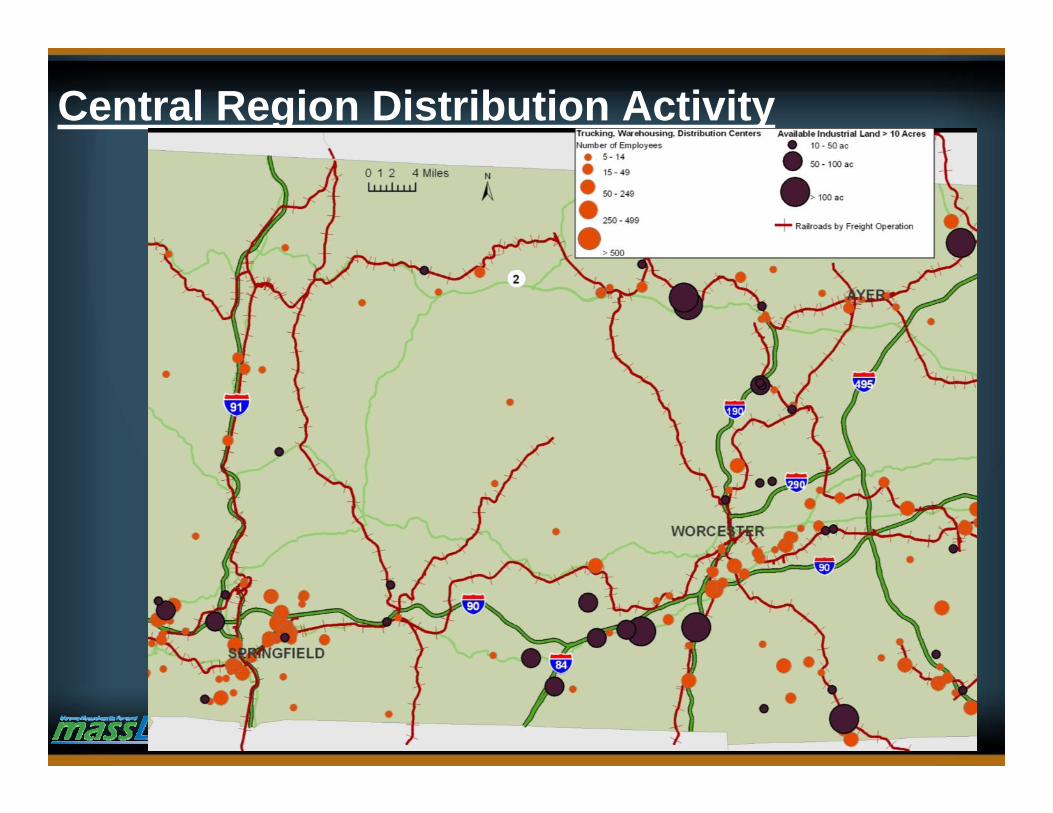
Central Region Distribution Activity

Freight &Freight &Rail PlanRail Plan
Logan Airport Air Freight Facilities
Source: MassPort
The value of air cargo exports at Logan Airport increased by 107% from 1997 to 2007
INFRASTRUCTURE CONDITIONS AND NEEDS
Freight &Freight &Rail PlanRail Plan
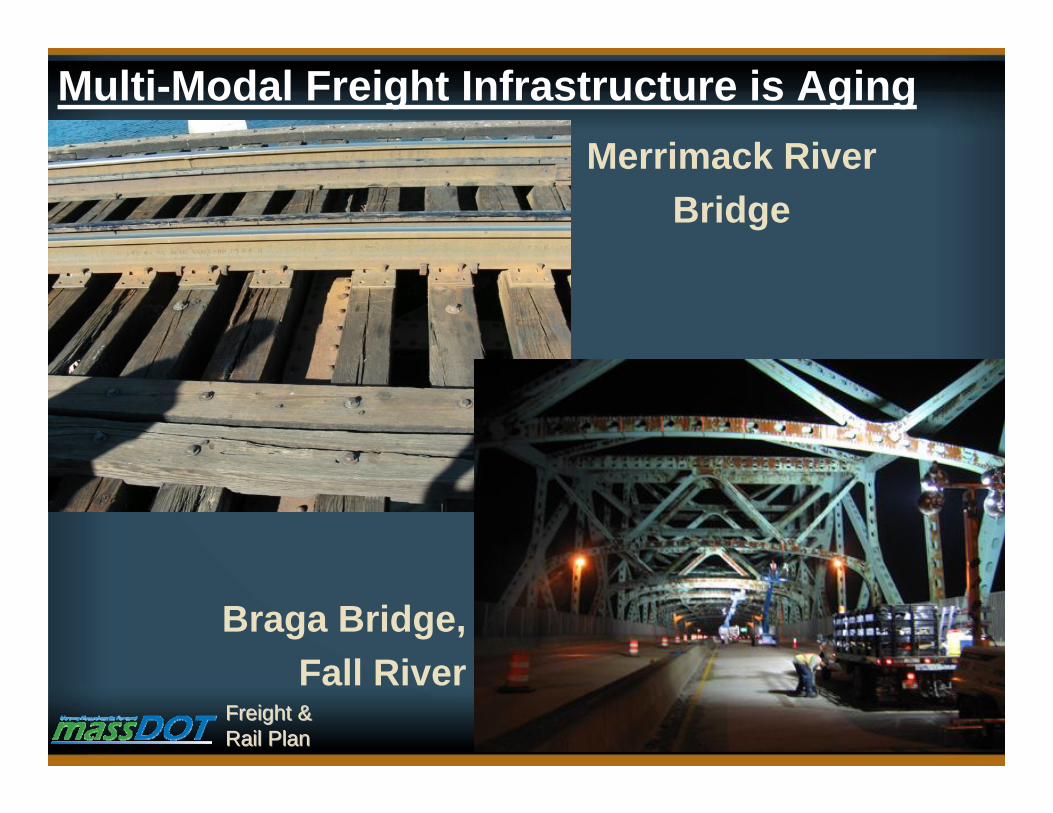
Multi-Modal Freight Infrastructure is Aging
Braga Bridge,Fall River
Merrimack River Bridge

Freight &Freight &Rail PlanRail Plan
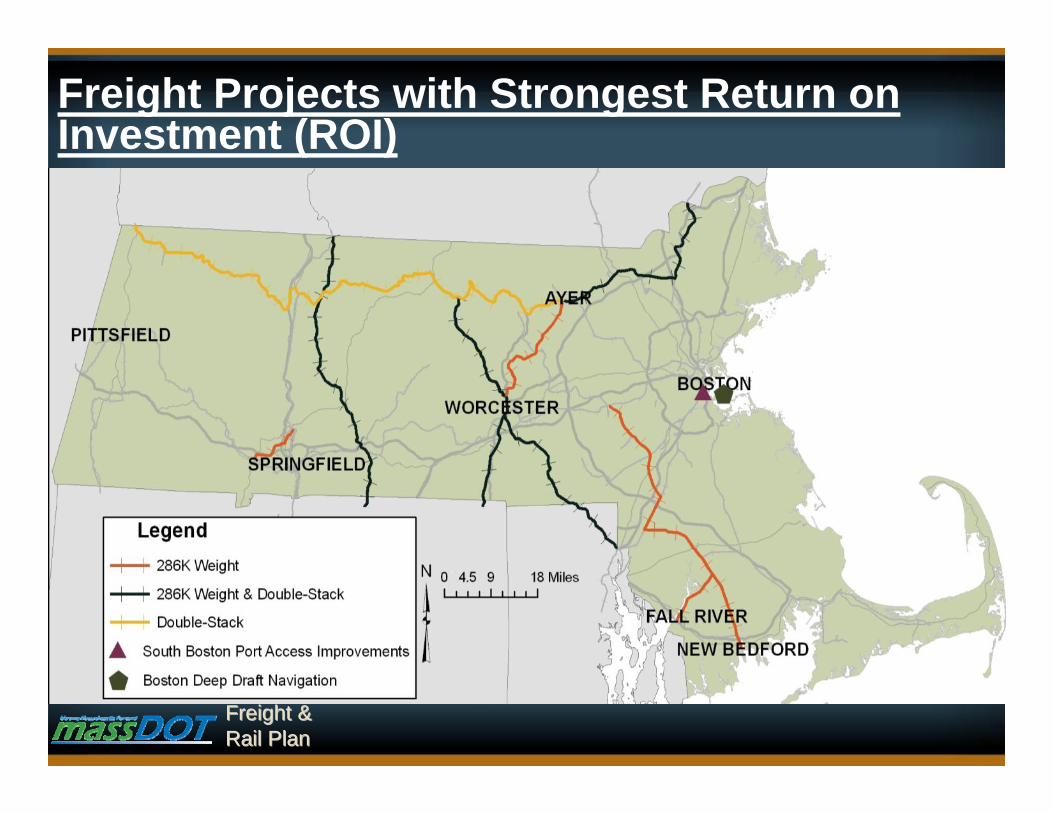
• 286k: 286,000 lbs rail car capacity becoming industry standard vs current 263,000 lbs
• Double-Stack:Vertical rail line clearance for two intermodal containers with a clearance of 20’8”
Infrastructure Constraints Defined

Freight &Freight &Rail PlanRail Plan
• Last Mile Truck Access – Trucks provide the last connection between multiple modes
and the final destination such as airports, seaports and intermodal rail transfers
• Designated Truck Routes• Over weight permitting
• Harbor Depth – Increasing harbor depths will allow larger ships to enter the
port as well as reduce existing vessel delays due to the wait for tidal levels to be sufficient
Infrastructure Constraints Defined (cont’d)

MODAL SHIPPING PATTERNS AND
DIVERSION

Freight &Freight &Rail PlanRail Plan
Modal Variation in Shipping PatternsTruck – 239 million tons Rail – 18 million tons
Source: Global Insight TRANSEARCH 2008 Release
In‐bound, 48%
Out‐bound, 14%Internal,
0.3%
Through, 38%
In‐bound, 37%
Out‐bound, 13%
Internal, 32%
Through, 18%

Freight &Freight &Rail PlanRail Plan
Example of Modal Shipping VariationSecondary Traffic movements are mostly local, almost all by truck
Paper products move longer distances, often through-trips by truck or rail
Shipments from the New York, NY Region
Freight &Freight &Rail PlanRail Plan
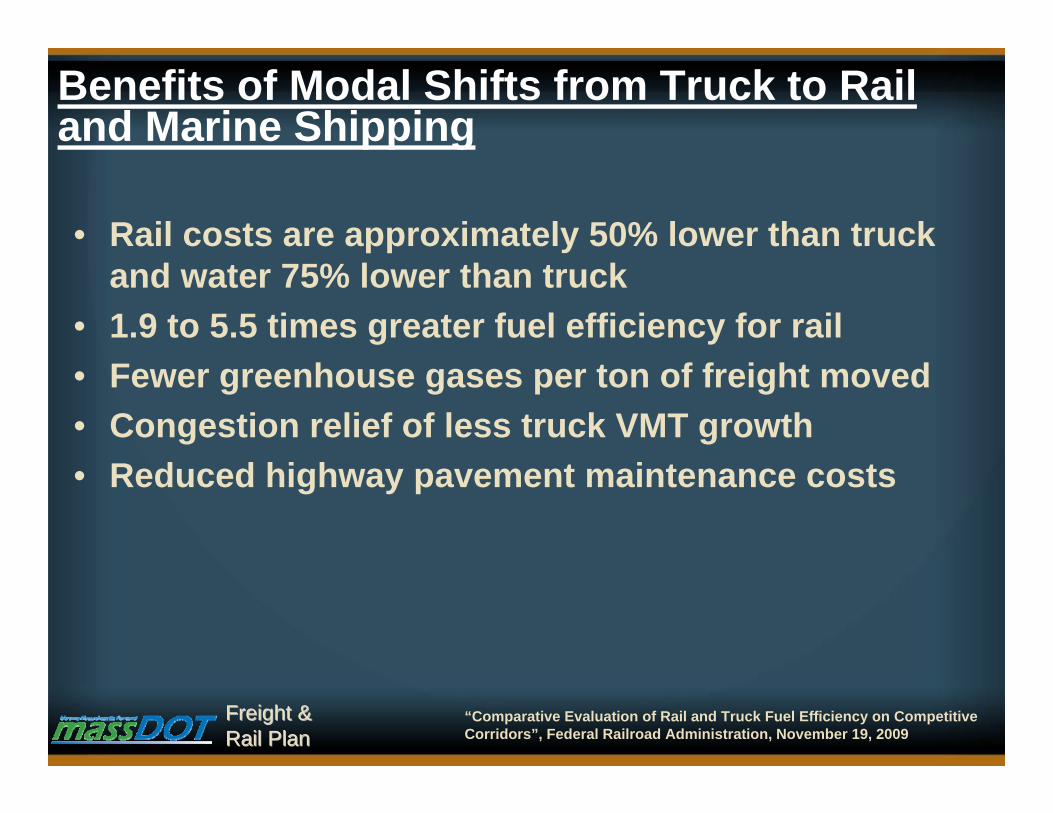
• Rail costs are approximately 50% lower than truck and water 75% lower than truck
• 1.9 to 5.5 times greater fuel efficiency for rail• Fewer greenhouse gases per ton of freight moved• Congestion relief of less truck VMT growth• Reduced highway pavement maintenance costs
Benefits of Modal Shifts from Truck to Rail and Marine Shipping
“Comparative Evaluation of Rail and Truck Fuel Efficiency on Competitive Corridors”, Federal Railroad Administration, November 19, 2009
Freight &Freight &Rail PlanRail Plan
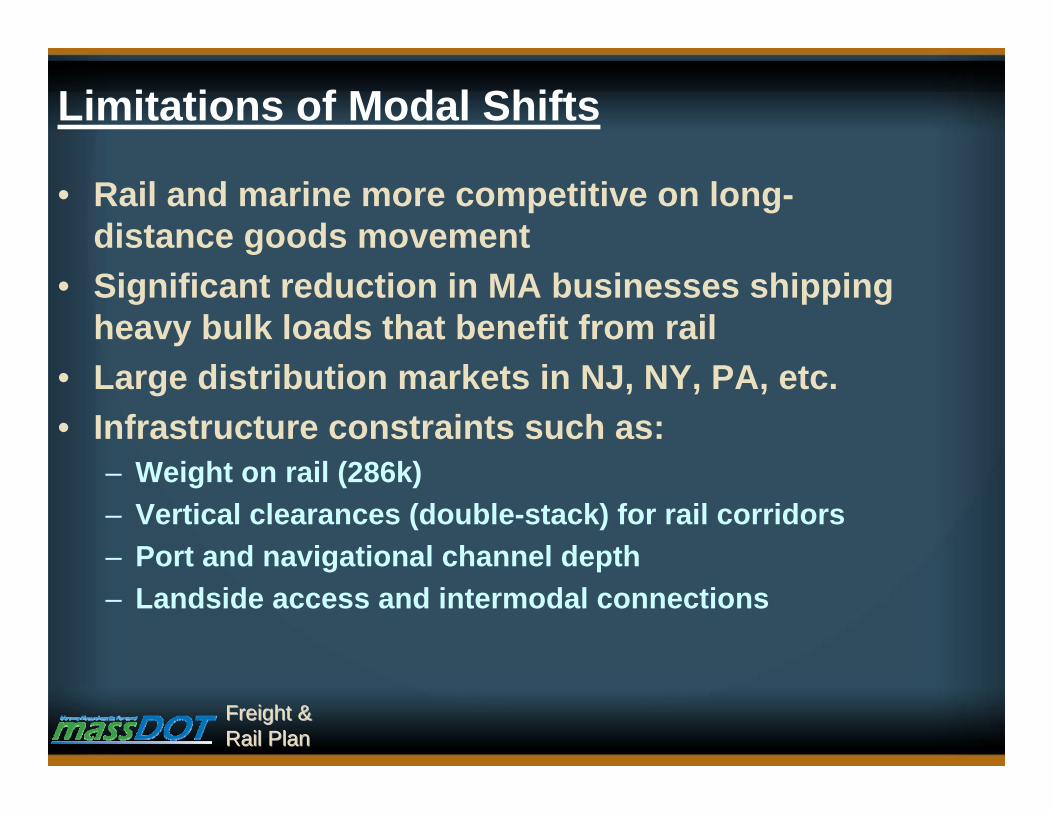
• Rail and marine more competitive on long-distance goods movement
• Significant reduction in MA businesses shipping heavy bulk loads that benefit from rail
• Large distribution markets in NJ, NY, PA, etc.• Infrastructure constraints such as:
– Weight on rail (286k)– Vertical clearances (double-stack) for rail corridors– Port and navigational channel depth– Landside access and intermodal connections
Limitations of Modal Shifts
Freight &Freight &Rail PlanRail Plan
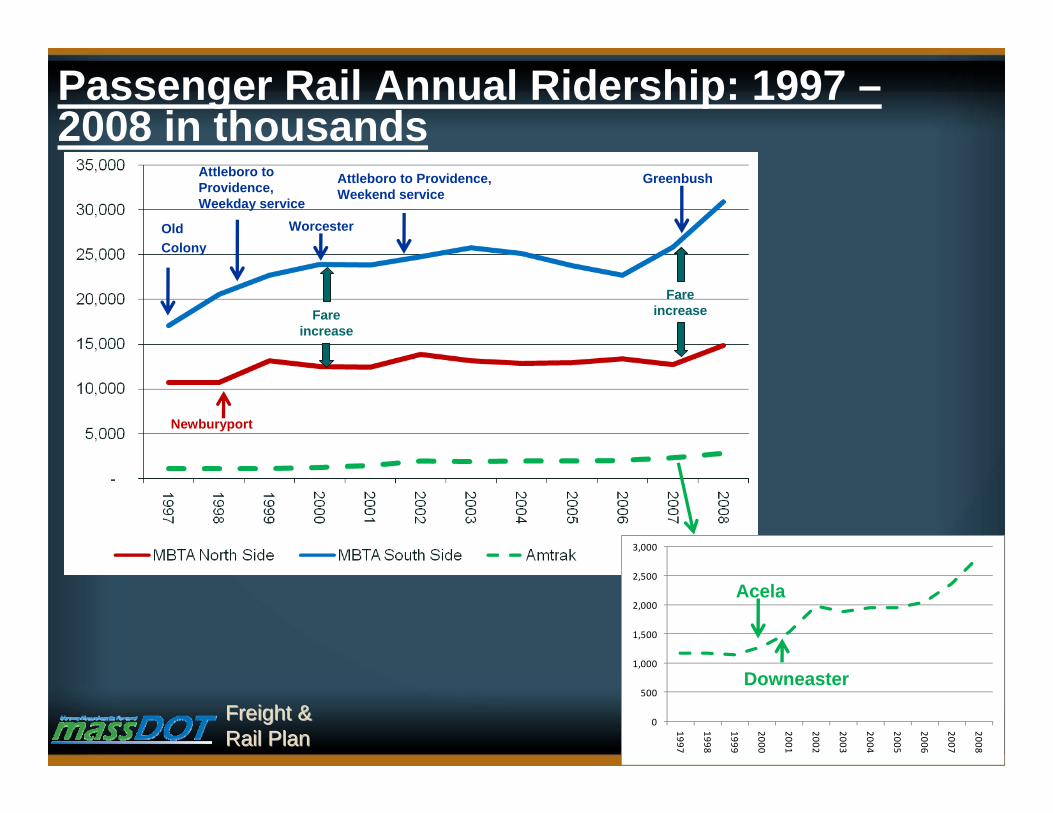
Passenger Rail Annual Ridership: 1997 –2008 in thousands
Old Colony
Attleboro to Providence, Weekday service
Newburyport
Worcester
Attleboro to Providence, Weekend service
Greenbush
Fare increaseFare
increase
0
500
1,000
1,500
2,000
2,500
3,000
1997
1998
1999
2000
2001
2002
2003
2004
2005
2006
2007
2008
Downeaster
Acela

Freight &Freight &Rail PlanRail Plan
Most Passenger Rail is Shared Use with Freight
• Capacity, operations, and liability challenges• Can work well together – Downeaster/Pan Am/MBTA
Freight &Freight &Rail PlanRail Plan
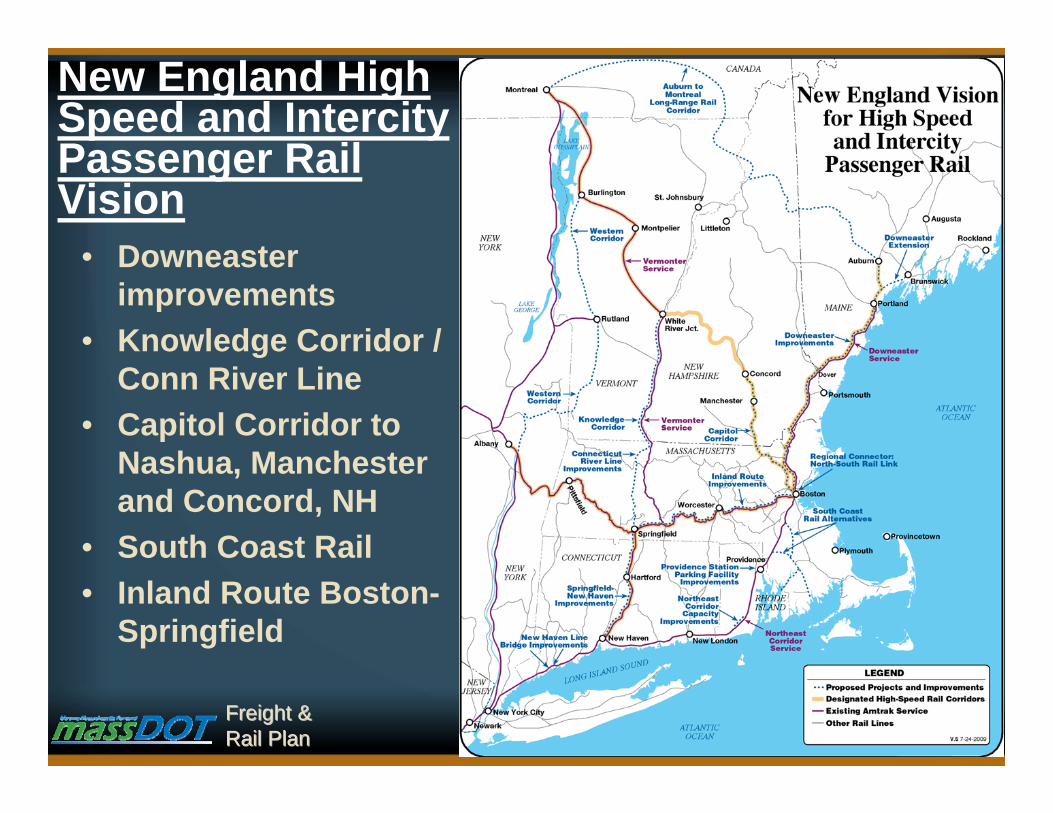
New England High Speed and Intercity Passenger Rail Vision
• Downeaster improvements
• Knowledge Corridor / Conn River Line
• Capitol Corridor to Nashua, Manchester and Concord, NH
• South Coast Rail• Inland Route Boston-
Springfield
FREIGHT INVESTMENT SCENARIOS: EVALUATION
OF 5 OPTIONS
Freight &Freight &Rail PlanRail Plan
Freight Investment Scenarios
• Facilitating anticipated growth in goods movement
• Balancing and diversifying the multi-modal freight system
• Reducing congestion and environmental impacts
• Enhancing economic development opportunities
Freight &Freight &Rail PlanRail Plan
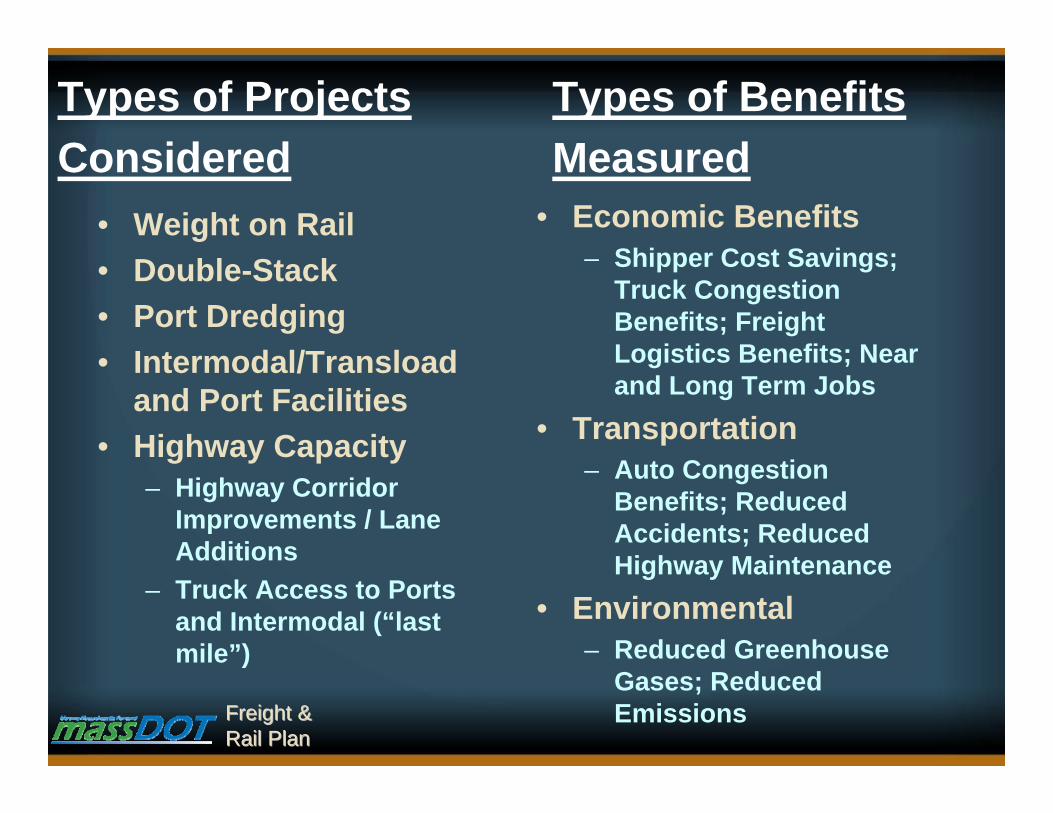
Types of Projects Considered
• Weight on Rail• Double-Stack• Port Dredging• Intermodal/Transload
and Port Facilities• Highway Capacity
– Highway Corridor Improvements / Lane Additions
– Truck Access to Ports and Intermodal (“last mile”)
Types of Benefits Measured
• Economic Benefits– Shipper Cost Savings;
Truck Congestion Benefits; Freight Logistics Benefits; Near and Long Term Jobs
• Transportation– Auto Congestion
Benefits; Reduced Accidents; Reduced Highway Maintenance
• Environmental– Reduced Greenhouse
Gases; Reduced Emissions

Freight &Freight &Rail PlanRail Plan
No-Build (Baseline) Scenario
Freight &Freight &Rail PlanRail Plan
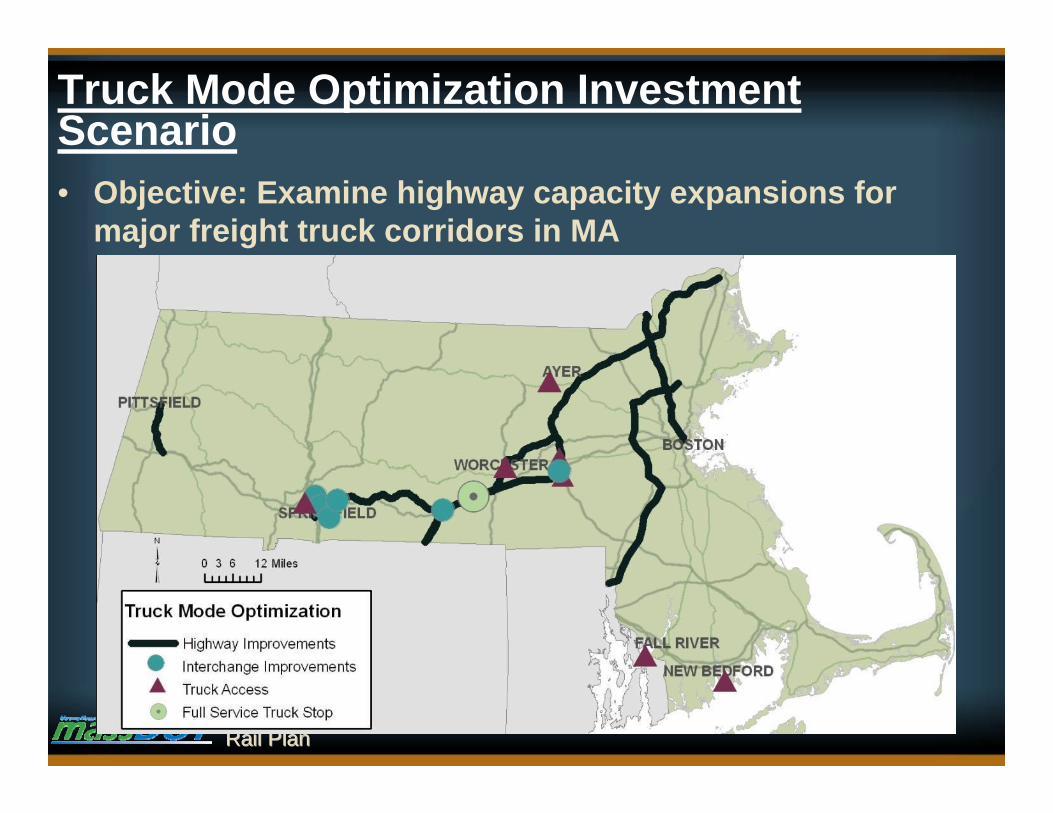
Truck Mode Optimization Investment Scenario• Objective: Examine highway capacity expansions for
major freight truck corridors in MA
Freight &Freight &Rail PlanRail Plan
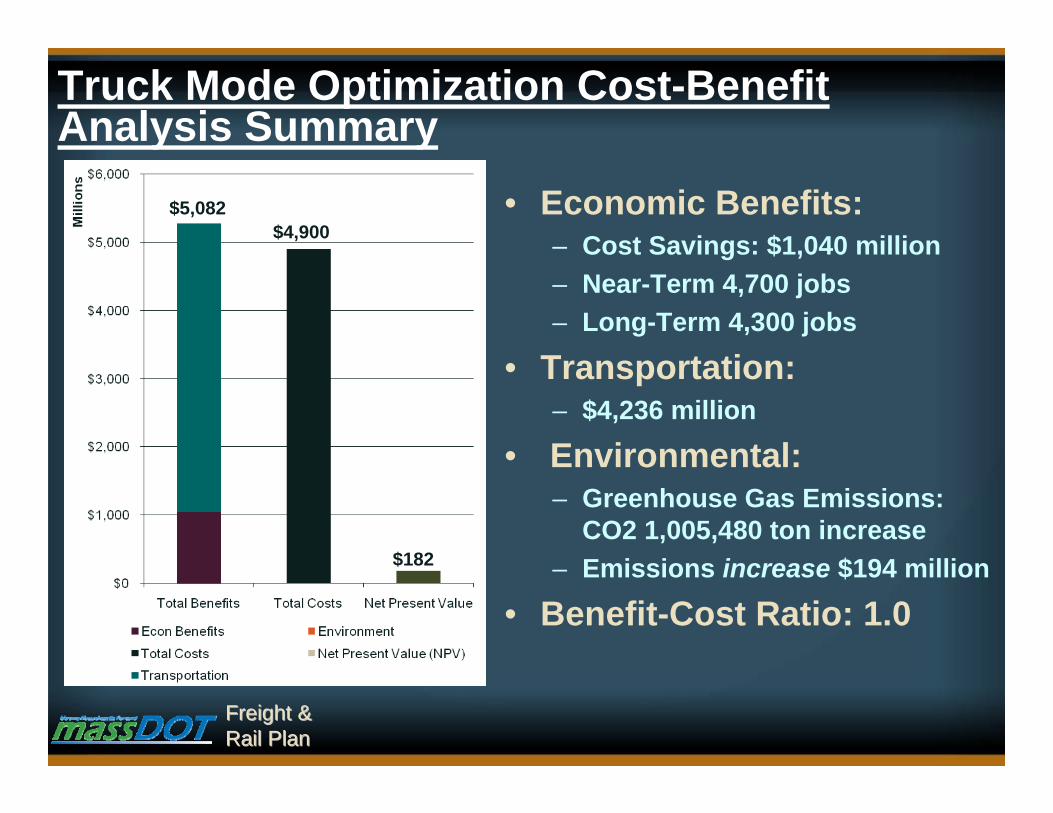
Truck Mode Optimization Cost-Benefit Analysis Summary
$5,082$4,900
$182
• Economic Benefits: – Cost Savings: $1,040 million– Near-Term 4,700 jobs– Long-Term 4,300 jobs
• Transportation: – $4,236 million
• Environmental: – Greenhouse Gas Emissions:
CO2 1,005,480 ton increase– Emissions increase $194 million
• Benefit-Cost Ratio: 1.0

Freight &Freight &Rail PlanRail Plan
Northern Tier Investment Scenario
• Objective: Improve the East-West rail connections from New York through Ayer to Maine– 286k upgrade on connections to Maine, Worcester and Springfield– Full double-stack capability on Patriot Corridor– Supporting investments to intermodal facilities in Ayer
Freight &Freight &Rail PlanRail Plan
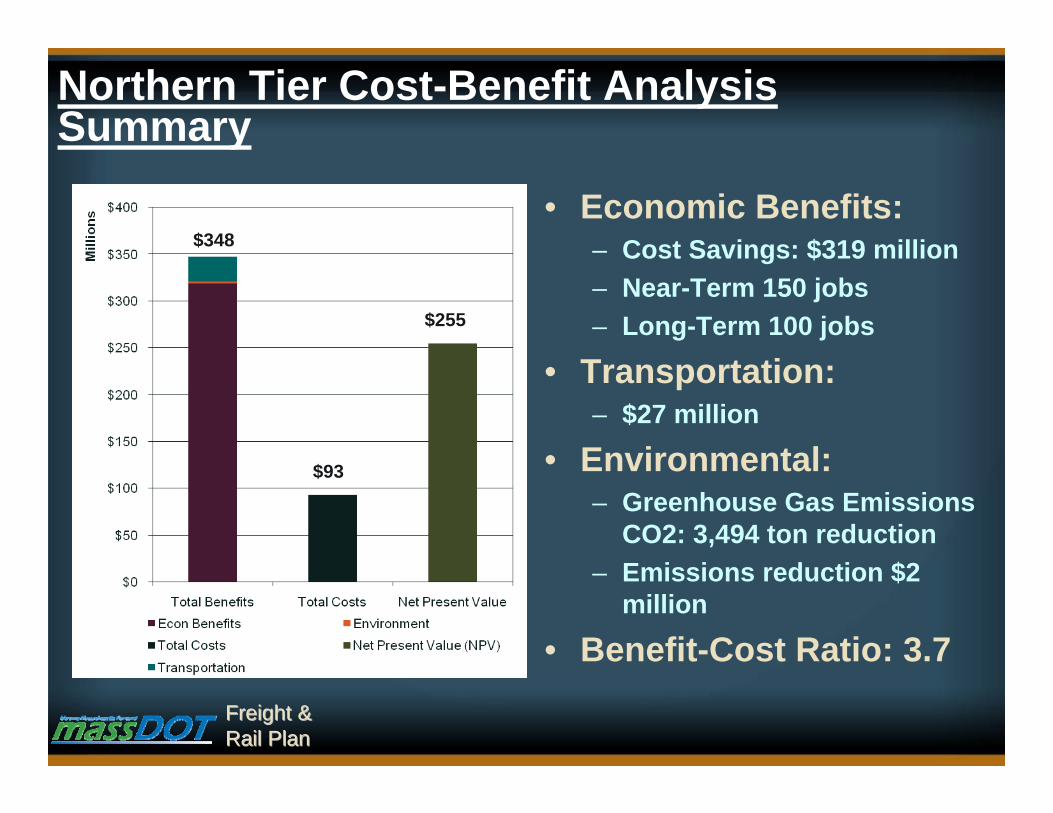
Northern Tier Cost-Benefit Analysis Summary
$348
$93
$255
• Economic Benefits:– Cost Savings: $319 million– Near-Term 150 jobs– Long-Term 100 jobs
• Transportation: – $27 million
• Environmental:– Greenhouse Gas Emissions
CO2: 3,494 ton reduction– Emissions reduction $2
million
• Benefit-Cost Ratio: 3.7

Freight &Freight &Rail PlanRail Plan
Southeastern MA Multi-Modal Scenario• Objective: Improve marine, rail, roadway, and freight
distribution system in Southeastern Massachusetts
– Improved seaport facilities in New Bedford and Fall River
– South Coast Rail 286k improvements to Fall River and New Bedford
– Improved truck access to ports
– Port dredging of New Bedford to allow larger ships and short-sea-shipping
Multi-Use Facility at State Pier
North Terminal Expansion
Restructure Rte 6 Bridge, Truck Access at Rte 18 & Channel Deepening

Freight &Freight &Rail PlanRail Plan
Southeastern MA Cost-Benefit Analysis Summary
$135
$185
($50)
• Economic Benefits: – Cost Savings $110 million– Near-Term 340 jobs– Long-Term 50 jobs
• Transportation:– $25 million
• Environmental: – Greenhouse Gas Emissions
CO2: 1,298 ton reduction– Emissions reduction $780,000
• Benefit-Cost Ratio: 0.7

Freight &Freight &Rail PlanRail Plan
Central and Western MA Freight Scenario• Objective: Improve connections on north-south rail corridors
and improve truck access to intermodal and aviation facilities– 286k improvements on north-south rail corridors– Second generation double-stack on north-south corridors
286kDouble Stack
Freight &Freight &Rail PlanRail Plan
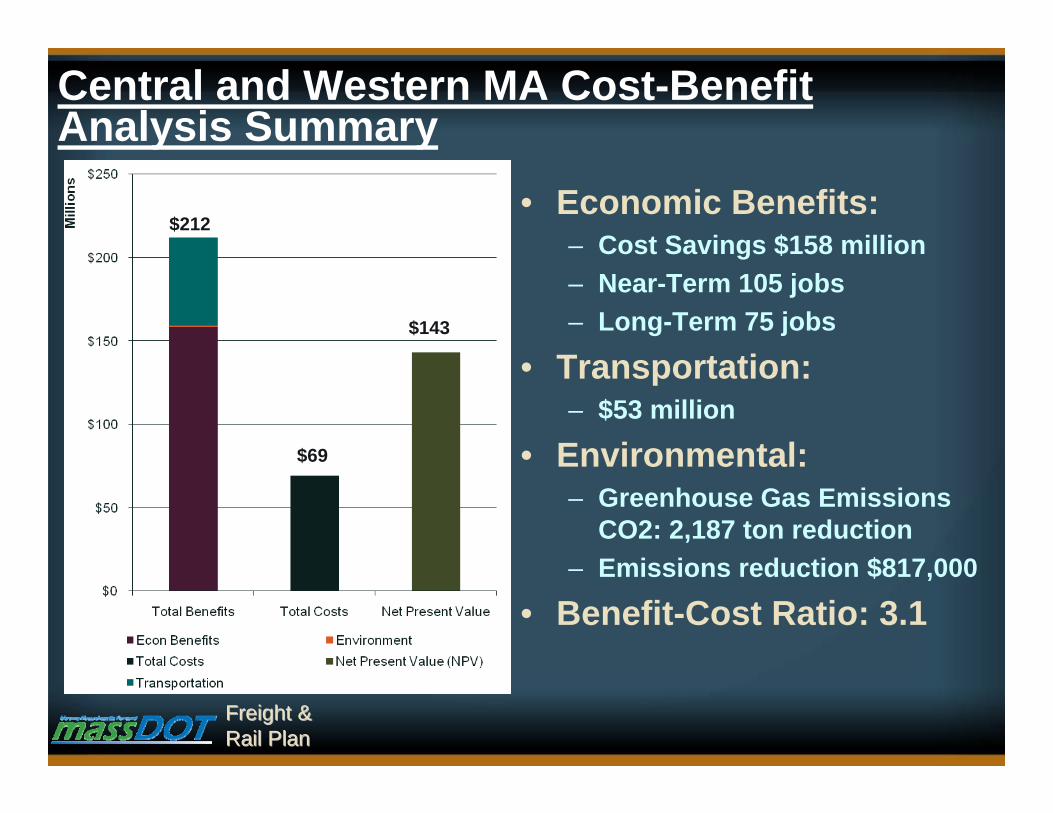
Central and Western MA Cost-Benefit Analysis Summary
$212
$69
$143
• Economic Benefits: – Cost Savings $158 million– Near-Term 105 jobs– Long-Term 75 jobs
• Transportation: – $53 million
• Environmental:– Greenhouse Gas Emissions
CO2: 2,187 ton reduction– Emissions reduction $817,000
• Benefit-Cost Ratio: 3.1
Freight &Freight &Rail PlanRail Plan
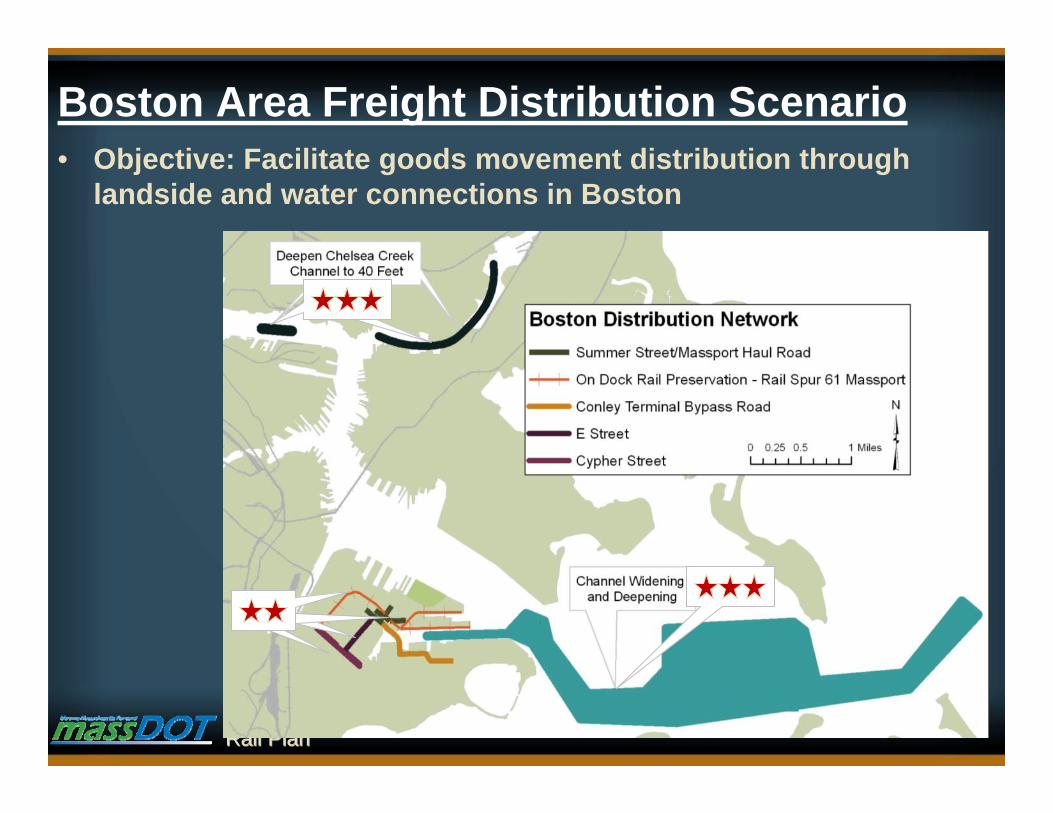
Boston Area Freight Distribution Scenario• Objective: Facilitate goods movement distribution through
landside and water connections in Boston

Freight &Freight &Rail PlanRail Plan
Boston Area Freight Distribution Cost-Benefit Analysis Summary
$415
$290
$126
• Economic Benefits:– Cost Savings $359 million– Near-Term 190 jobs– Long-Term 85 jobs
• Transportation:– $54 million
• Environmental: – Greenhouse Gas Emissions
CO2: 4,053 ton reduction– Emissions reduction $3 million
• Benefit-Cost Ratio: 1.4

Freight &Freight &Rail PlanRail Plan
Benefit-Cost Ratio and Total Cost by Investment Scenario

Freight &Freight &Rail PlanRail Plan
Benefit-Cost Ratio and Total Cost by Investment Scenario – Excluding Truck Mode Optimization
Freight &Freight &Rail PlanRail Plan
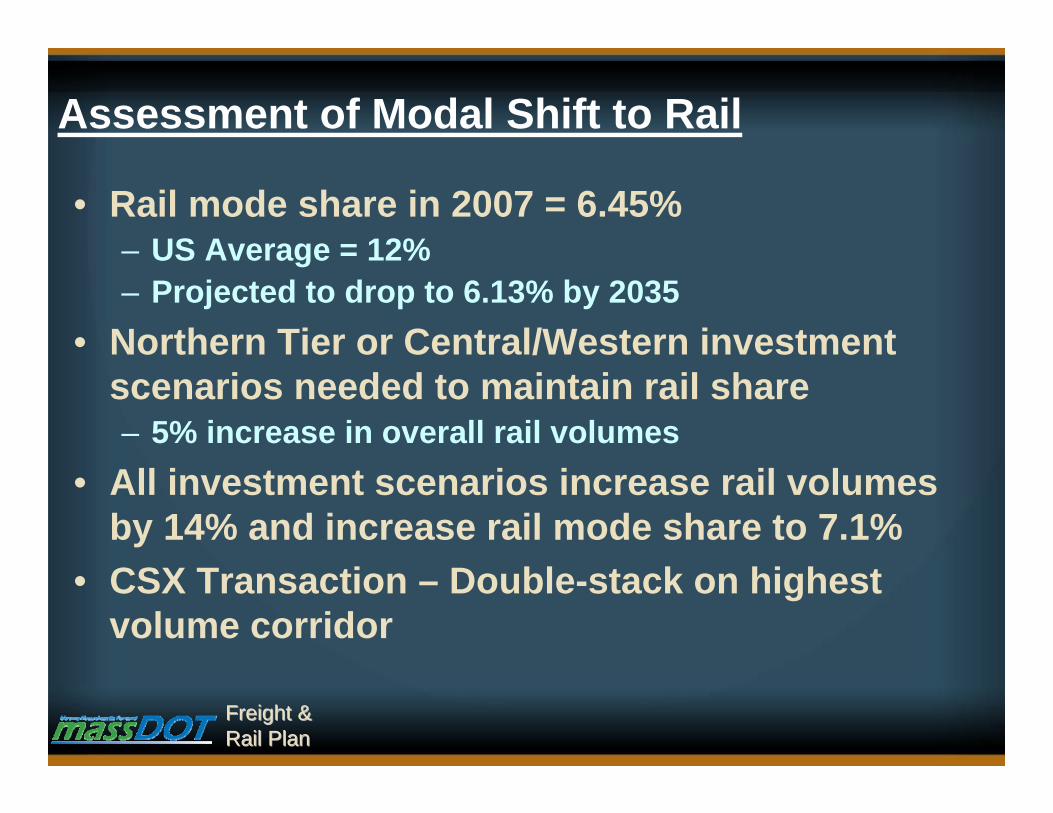
Assessment of Modal Shift to Rail
• Rail mode share in 2007 = 6.45%– US Average = 12%– Projected to drop to 6.13% by 2035
• Northern Tier or Central/Western investment scenarios needed to maintain rail share– 5% increase in overall rail volumes
• All investment scenarios increase rail volumes by 14% and increase rail mode share to 7.1%
• CSX Transaction – Double-stack on highest volume corridor
Freight &Freight &Rail PlanRail Plan
Freight Projects with Strongest Return on Investment (ROI)

Freight &Freight &Rail PlanRail Plan
Policy Issues• Land Use Development
– Identifying, preserving and facilitating freight-intensive uses in Massachusetts
• Funding and Financing– Freight considerations in prioritization of projects– Public benefits justify participation in public-private
partnerships– Industrial Rail Access Program (IRAP)
• Regulatory Environment– Truck routes, regional multi-modal planning, etc.
• Passenger Rail– Reverse commute, operations, TOD / Smart Growth
State Freight and Rail Plan
April 1, 2010
Commonwealth of MassachusettsCommonwealth of Massachusetts
Massachusetts Department of TransportationMassachusetts Department of Transportation
Thank youQuestions and Discussionwww.mass.gov/massdot/freightandrailplan

Freight &Freight &Rail PlanRail Plan
Actions to Address Land Use Development Policy Issues
• Freight-intensive land use policy– Include freight-intensive uses in 43D Priority Sites
and Growth District Initiative• Statewide inventory of strategic sites
– Partner with EOHED, MassEcon, MassDevelopment– Large and medium parcels with multi-modal access
• Industrial incentive areas to preserve freight land uses– Modeled after Agricultural Incentive Areas
• Pre-review of freight-intensive development under MEPA
Freight &Freight &Rail PlanRail Plan
Actions to Address Funding & Financing Policy Issues
• Greater consideration of freight in transportation funding decisions
• Increased use of public-private partnerships for strategic multi-modal investments– Public participation in funding private freight facilities
based on anticipated public benefits• Industrial Rail Access Program (IRAP)
– Matching funding and low-interest loans for economic development opportunities
• Continue to pursue Federal funding opportunities such as TIGER and HSIPR

Freight &Freight &Rail PlanRail Plan
Actions to Address Regulatory Policy Issues
• MassDOT to actively manage all truck routing– Heavy haul routes – Web-based system for truckers and local
communities– Streamlined permitting– Coordination of hazardous materials routing
• Engage in regional multi-modal planning and investments such as I-95 Corridor Coalition
• Pro-active truck parking / rest area program
Freight &Freight &Rail PlanRail Plan
Actions to Address Passenger Rail Policy Issues
• Increase MBTA rail ridership by improving operations and service of existing system
• Promote reverse commute and jobs access– Integrate with Gateway Cities / EOHED initiatives
• Enhance transit-oriented development / sustainable development at train stations– Livable Communities initiative by EPA, HUD and US
DOT – planning and implementation funding– Expand recommendations from South Coast Rail
Economic Development and Land Use Plan