Embed Size (px)
Citation preview
State HealtH RefoRm Impact modelIng pRoject
MassachusettsJanuary 2013
prepared by the center for Health law and policy Innovation of Harvard law School and the treatment access expansion project

State Health Reform Impact Modeling Project: Massachusetts 1
The Patient Protection and Affordable Care Act (ACA) will dramatically change how
people living with HIV access healthcare.1 In states that fully implement the law
(including expanding Medicaid), thousands of uninsured people living with HIV—many
of whom currently receive care and treatment through Ryan White programs—will have
access to healthcare through Medicaid or subsidized private health insurance.
The State Health Reform Impact Modeling Project (the Modeling Project) assesses the impact that healthcare reform will have on people living with HIV by compiling and analyzing the Ryan White program and AIDS Drug Assistance Program (ADAP) data to predict the shift of uninsured people living with HIV from these discretionary programs to Medicaid or private insurance in all 50 states pursuant to the ACA. In addition, for 21 states and the District of Columbia (DC), the Modeling Project compiles and analyzes detailed budgets and benefits guidelines to assess the services provided by the Ryan White program, ADAP, Medicaid, and plans sold on an exchange, in order to estimate the impact that a transition into Medicaid will have on low-income people living with HIV.2
Information on the methodology used to model transitions in each state, as well as the numerical results for each state and DC, are available in Appendix A. See Appendix B for notes on data
collection and a summary of the limitations of the modeling process.
In Massachusetts, the Modeling Project focuses on four state-specific inquiries:
1. What demographic information is available about Ryan White program and ADAP clients?
2. How many ADAP clients will be newly eligible for Medicaid or private insurance subsidies in 2014?
3. What services are currently available to people living with HIV under the Ryan White program versus Medicaid or plans to be sold on an exchange, and what gaps in services currently exist?
4. Given the current Ryan White and Medicaid programs, what are the likely outcomes of a transition from one program to another in 2014?
Background
2 State Health Reform Impact Modeling Project: Massachusetts
MaSSacHuSETTS rESIdEnTS LIVIng WITH HIV or aIdS
UNMET NEED
As of the end of 2011, 20,286 Massachusetts residents were known to be living with HIV/AIDS (HIV+ aware).3 An additional 5,714 to 7,714 individuals are estimated to be HIV+ but have not yet received a diagnosis or had their infection reported.4 At the end of 2010, an estimated 1,765 HIV+ Massachusettans were not receiving HIV primary care (802 individuals living with HIV non-AIDS and 963 people living with AIDS).5 This
proportion of the state’s epidemic is not accounted for in the following modeling of the number of individuals who will transition over to Medicaid or subsidized private insurance under the ACA because these individuals are not currently receiving pharmaceutical treatment through the Ryan White program. Nonetheless, it is likely that nearly all will be newly eligible for either private or public insurance in 2014.
THE RYAN WHITE PROGRAM IN MASSACHUSETTS
The Ryan White program is a discretionary, federally funded program providing HIV-related services across the United States to those who do not have other means of accessing HIV/AIDS treatment and care. In 2010, Massachusetts received $50,082,915 in Ryan White funding,6 and served 20,513 duplicated
clients.7,8 About 40.8% of the state’s Ryan White funds were Part B grants (awarded based on prevalence of HIV in the state).9 Of these, 25.8% covered core medical services, and 73.5% went toward the AIDS Drug Assistance Program (ADAP).10
ADAP IN MASSACHUSETTS
ADAP is a component of Ryan White (within Part B), that is also funded with matching state appropriations and covers the cost of antiretroviral therapy (ART) for enrollees. To be eligible for ADAP in Massachusetts, one must:
❯ Be a Massachusetts resident diagnosed with HIV;
❯ Live at or below 500% of the federal poverty level (FPL)11; and
❯ Submit a copy of a completed and submitted Medicaid application and private non-group-insurance enrollment form, except for those who already have public or private insurance or are incarcerated.12
In fiscal year 2010, Massachusetts ADAP served 6,519 individuals.13 The state’s 2011 ADAP budget was $25,546,195, 59% of which came from federal
funds, 7% from state funds, and 29% from drug rebates.14 In the previous fiscal year, Massachusetts spent $19,801,813 on ADAP—approximately 21% of these funds were used to cover the cost of prescription drugs, with 81.1% of the prescription drug funds being used for antiretroviral drugs.15
Massachusetts ADAP consists of three programs:
❯ Full pay (covering the full costs of the drugs);
❯ Copay (covering drug costs not covered by insurance); and
❯ The Comprehensive Health Insurance Initiative (covering public or private insurance premiums).16,17
As of May 2012, there were 282 individuals enrolled in full pay, 5,854 in the copay program, and 1,544 in the Comprehensive Health Insurance Initiative.18
MaSSacHuSETTS

State Health Reform Impact Modeling Project: Massachusetts 3
THE aca and ITS IMPacT on HIV+ MaSSacHuSETTanS
THE MEDICAID EXPANSION
Beginning in January 2014, the Patient Protection and Affordable Care Act (ACA) expands Medicaid eligibility to most individuals under 65 years of age living below 133% federal poverty level (FPL).19,* Although the Department of Health and Human Services (HHS) cannot force states to comply with the expansion (by withdrawing existing federal medical
funding), the federal government will cover 100% of the cost of newly eligible beneficiaries until 2016, and at least 90% thereafter.20 Newly eligible enrollees will receive a benchmark benefits package that will include ten categories of essential health benefits (EHB), described in the following section.21
THE BASIC HEALTH PLAN
The ACA provides an option for states to create a Basic Health Plan (BHP) that would be largely federally funded (the state would receive up to 95% of the premium credits an individual would have been entitled to for purchase of a plan on the exchange).22 A BHP would cover most individuals under 65 years of age living between 133-200% FPL as well as legal residents who do not qualify for Medicaid because of the 5-year residency requirement.23 BHPs must cover at least the EHB and have the same actuarial value of coverage as a
bronze plan the individual might otherwise purchase on an exchange.24 Cost-sharing on BHPs can be subsidized, either for all beneficiaries or for those with specific chronic conditions (eg, HIV/AIDS).25 In addition to improved affordability, BHPs can minimize “churning” on and off Medicaid as individuals fluctuate around 133% FPL. Because state Medicaid offices can design and manage BHPs, these individuals would more easily transition into a plan with similar provider networks and administrative procedures.
SUBSIDIES FOR PRIVATE INSURANCE PREMIUMS, AND STATE-BASED INSURANCE EXCHANGES
The ACA requires states to establish state-run insurance exchanges, to partner with the federal government to set up a hybrid state-federal exchange, or to default into a federally facilitated exchange.26 Insurance exchanges will provide individuals and families with a choice of plans, tiered by actuarial value of coverage (bronze, silver, gold, and platinum). Each plan available on an exchange must, at a minimum, adhere to a state-defined and federally approved list of EHB; these benefits are discussed in the following section. All exchanges will be operational January 1, 2014.27 As a benchmark plan for purposes of defining EHB, Massachusetts selected
Blue Cross/Blue Shield of Massachusetts HMO Blue small-group plan.28
For those purchasing coverage on an exchange, the ACA extends insurance premium credits to individuals and families living below 400% FPL, to ensure that premiums do not exceed 2.0-9.8% of household income, and imposes out-of-pocket spending caps to protect healthcare consumers from medical bankruptcy.29 Eligible individuals and families can employ these credits to purchase a private health insurance plan on a state or federally operated insurance exchange.
* All undocumented immigrants and lawfully residing immigrant adults who have been in the country 5 years or less will not be eligible for Medicaid coverage. US Department of HealtH anD Human ServiceS office of tHe aSSiStant Secretary for planning anD evaluation, tHe afforDable care act: coverage implicationS anD iSSueS for immigrant familieS 7 (April 2012), available at http://aspe.hhs.gov/hsp/11/ImmigrantAccess/Coverage/ib.pdf.
4 State Health Reform Impact Modeling Project: Massachusetts
ESSENTIAL HEALTH BENEFITS
The ACA requires both Medicaid plans and private health insurance plans sold on exchanges to provide certain essential health benefits (EHB), to be defined by the Secretary of HHS.30 EHB must include items and services within the following ten benefit categories31:
1. Ambulatory patient services;
2. Emergency services;
3. Hospitalization;
4. Maternity and newborn care;
5. Mental health and substance use disorder services, including behavioral health treatment;
6. Prescription drugs;
7. Rehabilitative and habilitative services and devices;
8. Laboratory services;
9. Preventive and wellness services and chronic disease management; and
10. Pediatric services, including oral and vision care.
HHS released a proposed rule that will define the scope of EHB on the private market, and will accept public comments before drafting final guidance.32 The Centers for Medicare and Medicaid Services has indicated that the HHS rule on EHB will also apply to newly eligible Medicaid beneficiaries, in addition to the protections provided for under Social Security Act.33 This means that benefits provided by Medicaid will likely be more robust than on the private market. For example, the Social Security Act requires that a Medicaid benchmark plan cover any US Food and Drug Administration-approved drugs with significant clinically meaningful therapeutic advantage over another.34
AN ESTIMATE OF CURRENT RYAN WHITE AND ADAP CLIENTS WHO WILL BE ELIGIBLE FOR MEDICAID OR INSURANCE CREDITS IN 2014
Given the ACA-instituted reforms, a number of HIV+ individuals in Massachusetts are expected to become eligible for Medicaid or a BHP (without a § 1115 Waiver) or for federal private insurance subsidies in 2014, provided that the state fully implements the law. An estimated 63% of the state’s Ryan White program clients in 2010 were living below 200% FPL, making them potentially eligible for either Medicaid or a BHP in 2014.35 Estimates focused on ADAP specifically show that this population stands to gain significantly from the expansion of Medicaid and creation of federal private insurance subsidies (extending to 400% FPL). As of June 2011, 56% of Massachusetts ADAP recipients were living below 133% FPL, while 15% were between 134-200% FPL in June 2011.36
An estimated 21% of Massachusetts’s ADAP clients will be eligible for Medicaid following its expansion. An additional14% are estimated to be eligible for federal private insurance subsidies starting in
2014.37 Finally, many of the estimated 1,765 HIV+ individuals who did not access care in 2011 are likely to also be eligible for Medicaid, a BHP, or subsidized private insurance in 2014.
The percentage of Massachusetts’s ADAP clients who will be newly eligible for Medicaid (21%) is lower than the national average, which stands at 29%. This is primarily because Massachusetts’s ADAP largely serves a higher proportion of individuals living above 133% FPL and a lower number of uninsured individuals relative to many other states.
The percentage of Massachusetts’s ADAP clients who are expected to qualify for private insurance subsidies (14%) is slightly lower than the national average, which stands at 15%, both because Massachusetts’s ADAP serves comparatively more individuals living above 400% FPL and a lower percentage of uninsured individuals than other states.

State Health Reform Impact Modeling Project: Massachusetts 5
coMParIng SErVIcES ProVIdEd BY rYan WHITE, adaP, MEdIcaId, and THE EXcHangE To HIV+ MaSSacHuSETTanSSince a significant number of HIV+ individuals in Massachusetts who are currently served by the Ryan White program or AIDS Drug Assistance Program (ADAP) are likely to be eligible for Medicaid in 2014, it is important to assess the implications of transitioning this population into Medicaid. This
assessment compares and contrasts the services and treatments that the Ryan White program, ADAP, Medicaid, and Massachusetts’s benchmark plan (for purposes of defining essential health benefits for the exchange) currently provide to HIV+ Massachusetts patients.
COMPARING RYAN WHITE, MEDICAID, AND THE BENCHMARK PLAN FOR THE EXCHANGE IN MASSACHUSETTS
The Ryan White program funds both core medical and support services for patients living with HIV (see Appendix C for a breakdown of core medical versus support services). Both medical and ancillary services are critical to maintaining the health of low-income individuals who may not have access to many necessities that affect access to HIV treatment and care (eg, child care, nutrition). However, Medicaid and Massachusetts’ benchmark plan, which will determine essential health benefits (EHB) for private insurance sold on the state’s exchange, do not cover ancillary services (although they cover a broader range of medical services such as physician,
lab/x-ray, and hospital services). Accounting for the gaps between the Ryan White program and Medicaid or coverage sold on the exchange will be critical in transitioning Ryan White beneficiaries onto Medicaid or private insurance while ensuring that their health status does not deteriorate (eg, due to lack of proper nutrition, access to transportation to a health clinic, or stable housing).
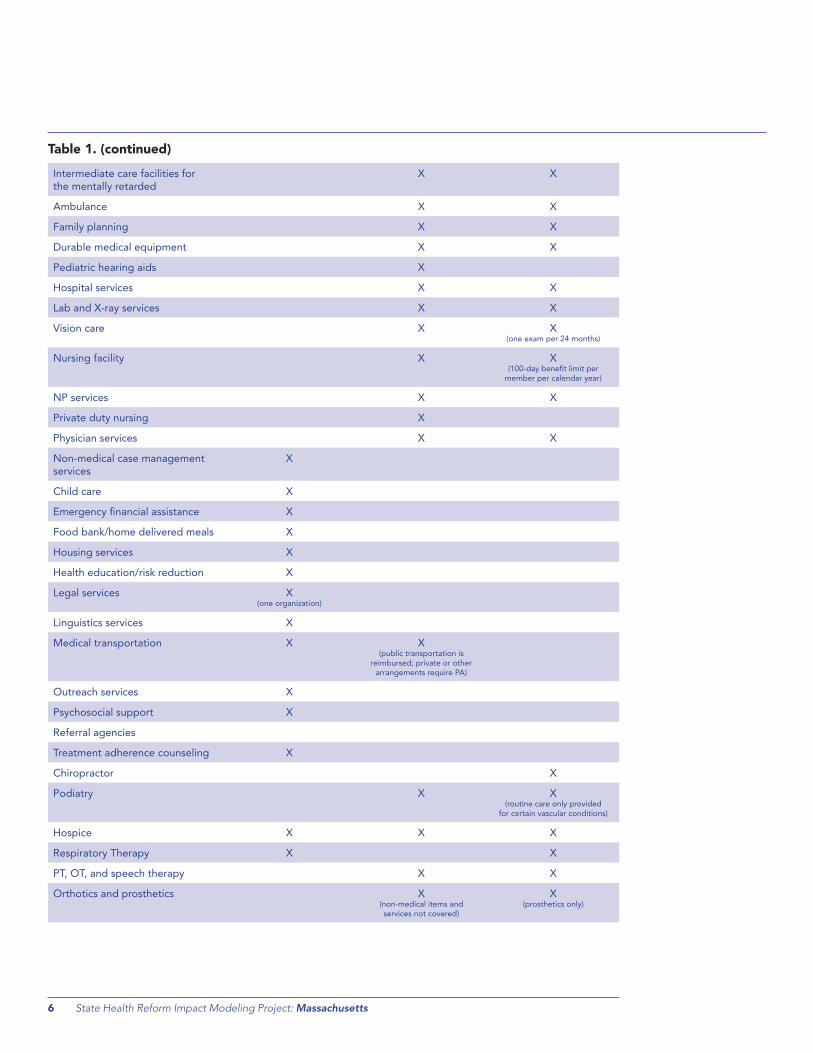
Table 1 provides a comparison of covered services between Massachusetts’ Ryan White and Medicaid programs, as well as the largest small-group market plan in the state (the benchmark plan used for purposes of defining essential health benefits).
† Comparison based on MassHealth Standard rather than Family Assistance because MassHealth for newly eligibles is likely to be a more comprehensive plan than a § 1115 Waiver Program provides. See Letter from Cindy Mann, Director, Centers for Medicare & Medicaid Services, to State Medicaid Director (November 26, 2012).
Table 1. Ryan White versus Medicaid: Covered Services
Covered Service Ryan White38
Medicaid
(MassHealth Standard)†,39
BlueCross BlueShield
Small Group Plan40
Home health care X X X
mental health X X X (limits for non biol-based)
Substance abuse (outpatient) X X41
Substance abuse (inpatient) X (residential substance
abuse services)
X42
medical case management X
community-based care X X
ambulatory/outpatient care X X X
oral health care X X43 (diagnostic and preventive services, extractions, and
emergency treatment)
early intervention clinic X (one organization only)
Continued on next page
6 State Health Reform Impact Modeling Project: Massachusetts
Intermediate care facilities for the mentally retarded
X X
ambulance X X
family planning X X
durable medical equipment X X
pediatric hearing aids X
Hospital services X X
lab and X-ray services X X
Vision care X X (one exam per 24 months)
nursing facility X X (100-day benefit limit per
member per calendar year)
np services X X
private duty nursing X
physician services X X
non-medical case management services
X
child care X
emergency financial assistance X
food bank/home delivered meals X
Housing services X
Health education/risk reduction X
legal services X (one organization)
linguistics services X
medical transportation X X (public transportation is
reimbursed; private or other arrangements require pa)
outreach services X
psychosocial support X
Referral agencies
treatment adherence counseling X
chiropractor X
podiatry X X (routine care only provided
for certain vascular conditions)
Hospice X X X
Respiratory therapy X X
pt, ot, and speech therapy X X
orthotics and prosthetics X (non-medical items and services not covered)
X (prosthetics only)
Table 1. (continued)

State Health Reform Impact Modeling Project: Massachusetts 7
As Table 1 indicates, the Ryan White program offers HIV+ individuals a number of ancillary services that Medicaid and Massachusetts’s benchmark plan do not cover (eg, risk reduction education, psychosocial support and outreach services, childcare, referral services, and housing assistance). Moreover, federal guidance and proposed regulation indicate that
these services will not be required as EHB.44,45 Since these ancillary services are often critical to linkage to and retention in care, those individuals who leave the Ryan White program for Medicaid or private insurance plans are likely to be at a disadvantage if wrap-around Ryan White services do not continue to be available.
COMPARING ADAP, MEDICAID, AND THE BENCHMARK PLAN FOR THE EXCHANGE IN MASSACHUSETTS
ADAP provides funding for a robust drug formulary that is necessary to afford low-income individuals access to a combination of drugs to treat HIV. All states participating in ADAP must cover at least one drug in every class of antiretroviral therapy (ART); most cover almost all drugs in each class. Ensuring that Medicaid and plans sold on the exchange provide coverage for a sufficient number of antiretroviral medications will be critical to
maintaining health as ADAP clients transition onto these plans.
Table 2 provides a comparison of the antiretroviral drug formularies included in the state’s ADAP and Medicaid programs, as well as the largest small-group market plan in the state (the benchmark plan used for purposes of defining EHB for plans sold on an exchange).
Table 2. ADAP Versus Medicaid and the Benchmark Plan: Covered Drugs
Benefits applying only to beneficiaries under 21 years of age are not assessed in this report.
Drugs
(aRt class indicated in bold;
brand name in normal type; generic in italics) ADAP46 Medicaid47
Blue Cross Blue
Shield Small Group
Plan48
Multiclass Combination Drugs 3 Drugs Covered 2 Drugs Covered 3 Drugs Covered
atripla: efavirenz + emtricitabine + tenofovir DF X X X ($30 copay)
complera; emtricitabine + rilpivirine + tenofovir disoproxil fumarate
X X X ($30 copay)
Stribild; elvitegravir + cobicistat + emtricitabine + tenofovir disoproxil fumarate
X X ($30 copay)
Entry Inhibitors- CCR-5 Coreceptor Antagonist 1 Drug Covered 1 Drug Covered 1 Drug Covered
Selzentry; maraviroc X X (pa)
X ($30 copay)
Fusion Inhibitors 1 Drug Covered 1 Drug Covered 1 Drug Covered
fuzeon; enfuvirtide X X X ($30 copay)
HIV Integrase Strand Transfer Inhibitors 1 Drug Covered 1 Drug Covered 1 Drug Covered
Isentress; raltegravir X X X ($30 copay)
NNRTI 4 Drugs Covered 5 Drugs Covered 5 Drugs Covered
edurant; rilpivirine X X (pa for greater than
30 units/month)
X ($30 copay)
Intelence; etravirine X (documentation of
treatment failure required)
X X ($30 copay)
Rescriptor; delavirdine mesylate X X ($30 copay)
Sustiva; efavirenz X X X ($30 copay)
Viramune; nevirapine X X (pa for brand name)
X ($30 copay)
Continued on next page

8 State Health Reform Impact Modeling Project: Massachusetts
NRTI 12 Drugs Covered 9 Drugs Covered 12 Drugs Covered
combivir; zidovudine + lamivudine X X (pa for brand name)
X ($50 copay)
emtriva; emtricitabine X X X ($30 copay)
epivir; lamivudine X X X ($30 copay)
epzicom; abacavir sulfate X X X ($30 copay)
Retrovir; zidovudine X X (pa for brand name)
X ($50 copay; $30 copay for
infusion
trizivir; abacavir + zidovudine + lamivudine X X ($30 copay)
truvada; tenofovir DF + emtricitabine X X ($30 copay)
Videx; didanosine (buffered version) X X (pa for brand name)
X ($30 copay)
Videx ec; didanosine (delayed–release capsules) X X ($50 copay)
Viread; tenofovir disoproxil fumarate DF X X (pa if >30 units/month
for tablet)
X ($30 copay)
Zerit; stavudine X X (pa for brand name)
X ($30 or $50 copay)
Ziagen; abacavir X X (pa for brand name tablets)
X ($30 or $50 copay)
Protease Inhibitors 9 Drugs Covered 9 Drugs Covered 10 Drugs Covered
agenerase; amprenavir X ($30 copay)
aptivus; tipranavir X X X ($30 copay)
crixivan; indinavir sulfate X X X ($30 copay)
Invirase; saquinavir mesylate X X X ($30 copay)
Kaletra; lopinavir + ritonavir X X X ($30 copay)
lexiva; fosamprenavir X X X ($30 copay)
norvir; ritonavir X X (pa for tablets)
X ($30 copay)
prezista; darunavir X X X ($30 copay)
Reyataz; atazanavir sulfate X X X ($30 copay)
Viracept; nelfinavir sulfate X X X ($30 copay)
“A1” Opportunistic Infection Treatments 29 Covered Drugs 28 Covered Drugs 28 Covered Drugs
ancobon; flucytosine X X X ($30 copay)
Bactrim dS; sulfamethoxazole/trimethoprim DS X X X ($50 copay)
Biaxin; clarithromycin X X (pa for brand name)
X ($50 copay)
cleocin; clindamycin X X (pa)
X ($50 copay)
Table 2. (continued)
Continued on next page

State Health Reform Impact Modeling Project: Massachusetts 9
Dapsone X X X ($30 copay)
daraprim; pyrimethamine X X X ($50 copay)
deltasone; prednisone X X (generic only)
X ($50 copay)
diflucan; fluconazole X X (pa for brand name)
X ($30-$50 copay)
famvir; famciclovir X X (pa for brand name)
X ($15 copay)
foscavir; foscarnet X X (generic only)
X ($30 copay)
fungizone; amphotericin B X X (generic only)
X ($30 copay)
InH; isoniazid X X (generic only)
X ($15 copay)
megace; megestrol X X (pa for brand name)
X ($30 copay)
mepron; atovaquone X X X ($15 copay)
myambutol; ethambutol X X (pa for brand name)
X ($30 copay)
mycobutin; rifabutin X X X ($30 copay)
nebupent; pentamidine X X X ($30 copay)
probenecid X X X ($15 copay)
procrit; epoetin alfa X X (pa)
X ($30 copay)
pyrazinamide (pZa) X X (generic)
X ($15 copay)
Sporanox; itraconazole X X (pa for brand name)
X ($15 copay)
Sulfadiazine – oral X X X ($15 copay)
Valcyte; valganciclovir X X X ($30 copay)
Valtrex; valacyclovir X X (pa for brand name)
X ($30 copay)
Vfend; voriconazole X X (pa for tablets)
X ($30 copay)
Vistide; cidofovir X X
Wellcovorin; leucovorin X X (generic only)
X ($15-$30 copay)
Zithromax; azithromycin X X (pa for brand name)
X ($15 copay)
Zovirax; acyclovir X X (pa for cream and
ointment or brand name capsules/tablets)
X ($15 capsules;
$30 cream/ointment)
ADAP = AIDS Drug Assistance Program; ART = antiretroviral therapy; NNRTI = non-nucleoside reverse transcriptase inhibitors; NRTI = nucleoside reverse transcriptase inhibitors; PA = prior authorization.
Table 2. (continued)

10 State Health Reform Impact Modeling Project: Massachusetts
Massachussets ADAP has an open formulary, with specific exclusions for 14 drugs (none of which are critical to ART), and six classes (eg, durable medical equipment; cosmetic medications; erectile dysfunction pharmaceuticals; fertility drugs; herbal medications; and immunizing biological). As indicated in Table 2, it covers an expansive formulary with full coverage of the vital medications needed by people living with HIV/AIDS. In addition to full coverage for persons without insurance, Massachusetts also provides copay and premium assistance to low-income persons with insurance, including Medicaid enrollees and those with
private insurance. Medicaid copays are low: $1 for generic antihyperglycemics, antihypertensives, and antihyperlipidemics, and $3.65 for all other prescriptions and over-the-counter drugs (capped at $250 per year total).49,50
On the contrary, the state’s benchmark plan imposes significant copays which may be prohibitive for low-income persons requiring multiple brand-name medications. In this scenario, ADAP will remain necessary as a payer of last resort even when individuals become newly eligible for Medicaid or are enrolled in private plans on the exchange.
COMMUNITY HEALTH CENTERS
The Patient Protection and Affordable Care Act (ACA) has provided Massachusetts with over $128 million to fund new and existing Community Health Centers.51 These federally supported centers provide preventive and primary care services to 615,708 people at 36 health centers operating in 293 sites. The centers are a vital source of care, serving a combined 61% of Massachusetts’ low-income or uninsured population and 30% of individuals at or below 100% FPL.52 All Community Health Centers in Massachusetts provide primary care services, health education, and case management; 91% provide HIV testing and counseling, the latter of which served 32,166 patients in 2010.53 Three Community Health Centers in Massachusetts have also been designated
as AIDS Education Training Centers (AETC), through the National Centers for HIV Care in Minority Communities’ HIV in Primary Care Learning Community initiative, which aims to help these centers expand primary care services to cover the needs of people living with HIV.54
Medicaid expansion in Massachusetts should strive to integrate these community health centers into the new roster of available service providers, and to use these community-based models to inform the expansion of programs available for HIV/AIDS patients. In particular, the AETC centers, which are sensitive to the needs of minority HIV/AIDS patients, are models for expansion of HIV/AIDS services in minority-dominant urban areas.
MEDICAID MANAGED CARE PROFILE
As of July 2011, 53.1% of Massachusetts Medicaid enrollees participated in a managed care program.55 The State’s Medicaid program has five managed care options: 1) Boston Medical Center (BMC) HealthNet Plan; 2) Fallon Community Health Plan (FCHP); 3) Health New England (HNE); 4) Neighborhood Health Plan (NHP); and 5) Network Health. Each MassHealth
managed care organization offers all of the benefits of Medicaid, plus some additional benefits, such as fitness reimbursements and discounts on child safety products.56 All managed care programs have the same copays and $250 annual cost-sharing limit as provided for above.
concLuSIonS and nEXT STEPSThis report provides analyses of the Ryan White program, AIDS Drug Assistance Program (ADAP), Medicaid, and essential health benefits (EBH) under the Patient Protection and Affordable Care Act (ACA), enumerating the benefits covered under each, and the implications of transitioning individuals living with HIV onto Medicaid or private insurance. This report is intended to assist law makers in implementing the ACA in a manner that serves the needs of those living with HIV in Massachusetts. While much of the ACA has yet to be implemented, it is certain that a large number of people living with
HIV will be newly eligible for Medicaid without a waiver or for federal private subsidies.
The Medicaid system must be ready and able to handle the needs of low-income people who have HIV. As Massachusetts adjusts its Medicaid program pursuant to the ACA, this report provides an initial analysis of the capacity of the program to handle the needs of this influx of individuals living with HIV. Comparing current Ryan White and ADAP programs with existing Medicaid formularies allows for a baseline analysis of the needs of individuals
State Health Reform Impact Modeling Project: Massachusetts 11
living with HIV moving into the Medicaid system. The major challenge highlighted by this report is the need for individuals to retain access to the ancillary services provided by the Ryan White program. The number of services that are currently provided by Ryan White are not available under the state’s current Medicaid program. Thus, HIV+ individuals who shift from the Ryan White program into Medicaid are likely to have trouble accessing a number of services currently available to them.
Further, it is essential that private insurance plans on the Massachusetts exchange provide a comprehensive scope of services that is sufficient to meet the needs of Ryan White clients who transition into these plans. This report identified two challenges with respect to the state’s benchmark plan, which will be used to define EHB for private insurance plans:
1. First, a number of services that are currently provided by the Ryan White program are not available under Massachusetts’ default benchmark plan. HIV+ individuals who shift from the Ryan White program to private insurance plans on the exchange are therefore likely to have trouble accessing a number of vital services currently available to them; and
2. Second, the prescription drug list for HIV+ individuals under Massachusetts' benchmark plan, while comprehensive, contains significant copay requirements, creating potential hardship
on individuals requiring extensive medications for treatment. Identifying ways to reduce these financial burdens on low-income HIV+ individuals will ensure that the insurance plans on the state exchange adequately serve the needs of people living with HIV.
There will remain an ongoing demand for Ryan White and ADAP services to fill coverage or affordability gaps created by Medicaid or private health insurance plans. Identifying these gaps and structuring these programs is not only fiscally prudent but also necessary to secure the health of individuals living with HIV.
In conclusion, this report makes clear that two factors will be essential to successfully implementing the ACA in a way that reduces the burden of HIV on the state:
1. Massachusetts must pay special attention to the needs of individuals living with HIV/AIDS as it adjusts its Medicaid program to comply with the ACA. In particular, those living near 133% FPL will be vulnerable if they frequently move between public and private coverage without a safety net to ensure access to care is not disrupted; and
2. As Massachusetts implements federal private subsidies, it must ensure that Ryan White and ADAP services are available where coverage or affordability gaps exist (eg, nonmedical case management, nutrition, or prohibitive cost-sharing).
Questions may be directed to Katherine Record, [email protected].

12 State Health Reform Impact Modeling Project: Massachusetts
aPPEndIX a
DATA COLLECTION METHODOLOGY
In the interest of consistency among state profiles, and to ensure that data among states are comparable, data sources that provide information for all 21 states and DC were prioritized. More recent or more detailed data for a particular state has also been included.
Ryan White Program Data
Demographic information about Ryan White program clients was culled from a number of sources. For the sake of continuity, the Federal Health Resources and Services Administration (HRSA) 2010 State Profiles were used for data about the Ryan White program. Information from state departments of health has also been included. Demographic information for ADAP clients is most thoroughly documented by the National Alliance of State and Territorial AIDS Directors (NASTAD), and information from that organization has been provided for income and insurance status of ADAP clients. NASTAD’s data for fiscal years 2010 and 2011 and June 2011 were used (fiscal year 2010 was necessary for states that did not report data in 2011). Because ADAP data compiled by NASTAD are unduplicated (ie, patients are not double-counted by multiple providers), it is one of the most reliable sources of information about demographic information for people living with HIV. Data from June 2011 provide information on how many people living with HIV currently enrolled in ADAP live between 100-133% FPL. Since the expansion of Medicaid eligibility to those living under 133% FPL is a new development, there is a relative dearth of data regarding the number of HIV+ individuals currently living between 100-133% FPL. NASTAD provides the only reliable source of these data to date. NASTAD’s ADAP information was used for estimates regarding people living with HIV who are newly eligible for Medicaid in 2014 at the end of this report. Information from state departments of health or HRSA has also been provided.
Estimates of unmet need for people living with HIV in each state are available in each state’s Statewide Coordinated Statement of Need (SCSN). SCSNs must be provided by all states receiving Ryan White program funding, but different states provide SCSNs in different years, so comparability among states is limited. Information about unmet need has also been included.
Information on current services covered by the Ryan White program is available from HRSA and the SCSNs, and these data have been included in each state profile. More detailed information has been included in the profiles if it was available.
Income thresholds for ADAP eligibility, cost-containment measures in each state, and ADAP formularies are available from a variety of sources. The most common sources for this information are meDicare.gov, Kaiser Family Foundation, and NASTAD’s ADAP Watch publication. This information has been included for every state and standardized to the extent possible among states.
Ryan White Program budget allocations are also available from a number of sources, and information from the Kaiser Family Foundation has been included in every profile for the sake of consistency among states. ADAP budget information is available from NASTAD, including the fiscal year 2011 total budget, and a breakdown of expenditures. This information is provided in each state profile. Kaiser Family Foundation’s information on ADAP expenditures has also been included for information on the amount spent by ADAP programs on insurance assistance and full prescription coverage.
Medicaid Coverage Data
Services currently covered by Medicaid and their limitations are detailed by state departments of health and state Medicaid manuals. Amounts of information available and levels of detail differ among states, and detailed information is provided in the profiles where available. The focus in each profile is on services most relevant to people living with HIV as well as limitations that may impede access to needed services.
Community Health Center Data
Community health center (CHC) information is standardized across the states studied, and has been acquired from HealtHcare.gov, published information about HRSA Health Center Planning Grant Awards, state health center fact sheets, and the National Center for HIV Care in Minority Communities. In providing information about CHCs, the focus in each profile is on the amount of money invested in these centers and the services most relevant to people living with HIV within them.
Medicaid Managed Care Data
Information on Medicaid managed care programs in each state varies widely. While some state departments of health detail minutely the various aspects of their Medicaid managed care programs, including eligibility, services provided, and number or percentage of clients enrolled, information for other states is limited to data compiled by the Kaiser Family Foundation from July and October 2010.
State Health Reform Impact Modeling Project: Massachusetts 13
2014 STATE-SPECIFIC ESTIMATES
Medicaid Estimates
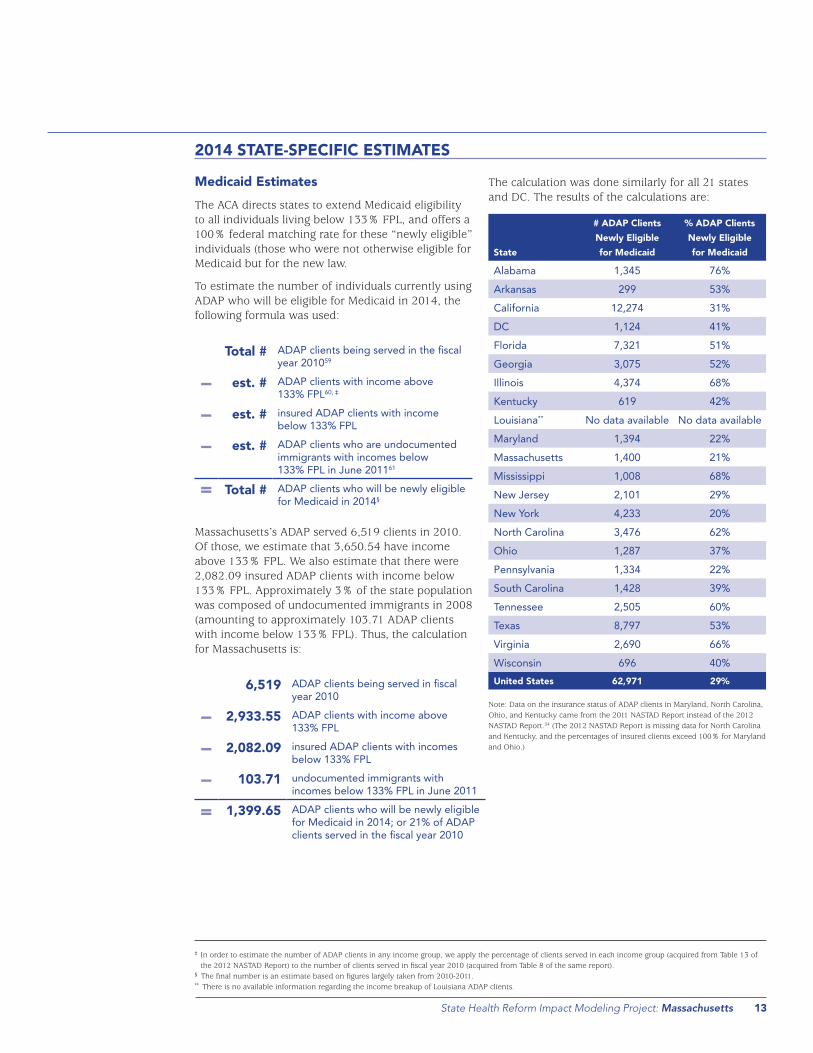
The ACA directs states to extend Medicaid eligibility to all individuals living below 133% FPL, and offers a 100% federal matching rate for these “newly eligible” individuals (those who were not otherwise eligible for Medicaid but for the new law.
To estimate the number of individuals currently using ADAP who will be eligible for Medicaid in 2014, the following formula was used:
Total # adap clients being served in the fiscal year 201059
− est. # adap clients with income above 133% fpl60, ‡
− est. # insured adap clients with income below 133% fpl
− est. # adap clients who are undocumented immigrants with incomes below 133% fpl in june 201161
= Total # adap clients who will be newly eligible for medicaid in 2014§
Massachusetts’s ADAP served 6,519 clients in 2010. Of those, we estimate that 3,650.54 have income above 133% FPL. We also estimate that there were 2,082.09 insured ADAP clients with income below 133% FPL. Approximately 3% of the state population was composed of undocumented immigrants in 2008 (amounting to approximately 103.71 ADAP clients with income below 133% FPL). Thus, the calculation for Massachusetts is:
6,519 adap clients being served in fiscal year 2010
− 2,933.55 adap clients with income above 133% fpl
− 2,082.09 insured adap clients with incomes below 133% fpl
− 103.71 undocumented immigrants with incomes below 133% fpl in june 2011
= 1,399.65 adap clients who will be newly eligible for medicaid in 2014; or 21% of adap clients served in the fiscal year 2010
The calculation was done similarly for all 21 states and DC. The results of the calculations are:
State
# ADAP Clients
Newly Eligible
for Medicaid
% ADAP Clients
Newly Eligible
for Medicaid
alabama 1,345 76%
arkansas 299 53%
california 12,274 31%
dc 1,124 41%
florida 7,321 51%
georgia 3,075 52%
Illinois 4,374 68%
Kentucky 619 42%
louisiana** no data available no data available
maryland 1,394 22%
massachusetts 1,400 21%
mississippi 1,008 68%
new jersey 2,101 29%
new York 4,233 20%
north carolina 3,476 62%
ohio 1,287 37%
pennsylvania 1,334 22%
South carolina 1,428 39%
tennessee 2,505 60%
texas 8,797 53%
Virginia 2,690 66%
Wisconsin 696 40%
United States 62,971 29%
Note: Data on the insurance status of ADAP clients in Maryland, North Carolina, Ohio, and Kentucky came from the 2011 NASTAD Report instead of the 2012 NASTAD Report.54 (The 2012 NASTAD Report is missing data for North Carolina and Kentucky, and the percentages of insured clients exceed 100% for Maryland and Ohio.)
‡ In order to estimate the number of ADAP clients in any income group, we apply the percentage of clients served in each income group (acquired from Table 13 of the 2012 NASTAD Report) to the number of clients served in fiscal year 2010 (acquired from Table 8 of the same report).
§ The final number is an estimate based on figures largely taken from 2010-2011.** There is no available information regarding the income breakup of Louisiana ADAP clients.

14 State Health Reform Impact Modeling Project: Massachusetts
Private Insurance Subsidy Estimates
To estimate the number of people currently using ADAP who will be eligible for private insurance subsidies through health insurance exchanges, the following formula was used:
Total # adap clients being served in fiscal year 201060
− est. # adap clients living below 133% fpl61,††
− est. # adap clients living above 400% fpl62
− est. # insured adap clients living between 133-400% fpl63
− est. # adap clients who are undocumented immigrants living between 133-400% fpl64
= Total # adap clients who will be newly eligible for subsidized private insurance
Massachusetts’s ADAP served 6,519 clients in 2010. Of those, we estimate that 1067.76 (72%) of ADAP clients are living below 133% FPL (there are no ADAP clients in the state with income above 400% FPL). This leaves 28% (415) of ADAP clients living between 133-400% FPL. We also estimate that there were 26 insured ADAP clients living between 133-400% FPL. Approximately 1% of Massachusetts’s population was composed of undocumented immigrants in 2008. Thus, the calculation for Massachusetts is:
6,519 adap clients being served in june 2011
− 4,106.97 adap clients with incomes below 133% fpl or above 400% fpl
− 1,410.13 insured adap clients with incomes between 133-400% fpl
− 70.38 uninsured undocumented immigrants with incomes between 133-400% fpl in june 2011
= 932 adap clients who will be eligible for insurance subsidies in 2014; or 14% of adap clients being served in fiscal year 2010.
The calculation above was done similarly for all 21 states and DC. The results of the calculations are below:
State
# ADAP Clients
Eligible for
Insurance
Subsidies
% ADAP
Clients Eligible
for Insurance
Subsidies
alabama 305 17%
arkansas 147 26%
california 8,580 22%
dc 829 30%
florida 4,134 29%
georgia 1,404 24%
Illinois 1,127 17%
Kentucky 269 18%
louisiana‡‡ no data available no data available
maryland 1,726 28%
massachusetts 932 14%
mississippi 384 26%
new jersey 1,879 26%
new York 4,502 21%
north carolina 621 11%
ohio 901 26%
pennsylvania 1,567 26%
South carolina 1,091 30%
tennessee 1,531 37%
texas 4,301 26%
Virginia 896 22%
Wisconsin 401 23%United States 32,758 15%
Note: Data on the insurance status of ADAP clients in Maryland, North Carolina, Ohio, and Kentucky came from the 2011 NASTAD Report instead of the 2012 NASTAD Report.54 (The 2012 NASTAD Report is missing data for North Carolina and Kentucky, and the percentages of insured clients exceed 100% for Maryland and Ohio.)
†† In order to estimate the number of ADAP clients in any income group, we apply the percentage of clients served in each income group (acquired from Table 13 of the 2012 NASTAD Report) to the number of clients served in fiscal year 2010 (acquired from Table 8 of the same report).
‡‡ There is no available information regarding the income breakup of Louisiana ADAP clients.

State Health Reform Impact Modeling Project: Massachusetts 15
METHODOLOGY FOR DISTRIBUTION OF INSURED ADAP CLIENTS BY INCOME
Estimating the proportion of insured ADAP clients falling into each income bracket required several steps:
1. The percentage of adults living below 133% FPL, between 133-400% FPL, and above 400% FPL in each state who are insured was determined using data available at the Kaiser Family Foundation’s StateHealtHfactS.org website. The website lists insurance status for people beginning at 139% FPL instead of 133% FPL, but because of the ACA’s 5% income disregard, the Medicaid expansion applies to all individuals living below 138% FPL, making this distinction irrelevant. The website also divides the 133-400% FPL income group into two groups: 133-250% FPL and 251-399% FPL. The number of insured adults, and the total number of adults in these two groups were pooled in order to determine the percentage of adults living between 133-400% FPL who are insured.
In Massachusetts, 88% of adults living below 133% FPL are insured; 88% of adults living between 133-400% FPL are insured; and 97% living above 400% FPL are insured;
2. Next, the likelihood of an adult in each of the three income groups being insured—relative to the likelihood of being insured in the other income groups—was determined. To do this, the figure for the insurance rate for adults living below 133% FPL was given the baseline number 1, and the insurance rates for the other income groups were calculated to be multiples of this baseline.
In Massachusetts, the figure 88% was given the baseline number 1 and is the percentage of insured adults with incomes below 133% FPL and between 133-250%. 97%—the percentage of adults living above 400% FPL—is 1.1 times 88%. Thus, in other words, an adult in Massachusetts with income between 133-400% FPL is just as likely to be insured as an adult with income below 133% FPL, while an adult with income above 400% FPL is 1.1 times more likely to be insured than adults in the lower income levels;
3. Next, the number of insured ADAP clients in each state was calculated, by referring to Tables 8 and 14 of the 2012 NASTAD National ADAP Monitoring Project Report (the 2012 NASTAD Report).65 Table 8 lists the total number of ADAP clients served in each state in 2010. Using this number and applying to it the percentage of ADAP clients who are insured in each state (Table 14), it is possible
to estimate the number of insured ADAP clients in each state.
In Massachusetts we estimated that about 3,781of the state’s 6,519 ADAP clients served in 2010 were insured. The insurance rate for ADAP clients in that state stood at 58% in 2011;
4. In order to proportionately divide the number of insured ADAP clients among the three income groups listed in these steps, the percentage of a state’s ADAP clients who fall in each income group was required. Table 13 of the 2012 NASTAD Report shows the percentage of ADAP clients in most states who have income below 133% FPL, income between 133-400% FPL, and income above 400% FPL,
In Massachusetts, 56% of ADAP clients have income below 133% FPL, 38% have income between 133-400% FPL, and only about 7% have income above 400% FPL; and finally
5. The number of insured ADAP clients in each income group in a state was viewed as a product of the relative likelihood of being insured (determined previously), the relative proportion of clients in that income group among the total clients (based on the percentage of ADAP clients in each income group), and a weighing factor called a.
We relied on two formulas:
Formula 1:
number of insured clients in each group
= (relative likelihood of being insured)
x (proportion of income group)
x a
Formula 2:
total number of insured adap clients
= (number of insured clients living below 133% fpl)
+ (number of insured clients living between 133-400% fpl)
+ (number of insured clients living above 400% fpl)
16 State Health Reform Impact Modeling Project: Massachusetts
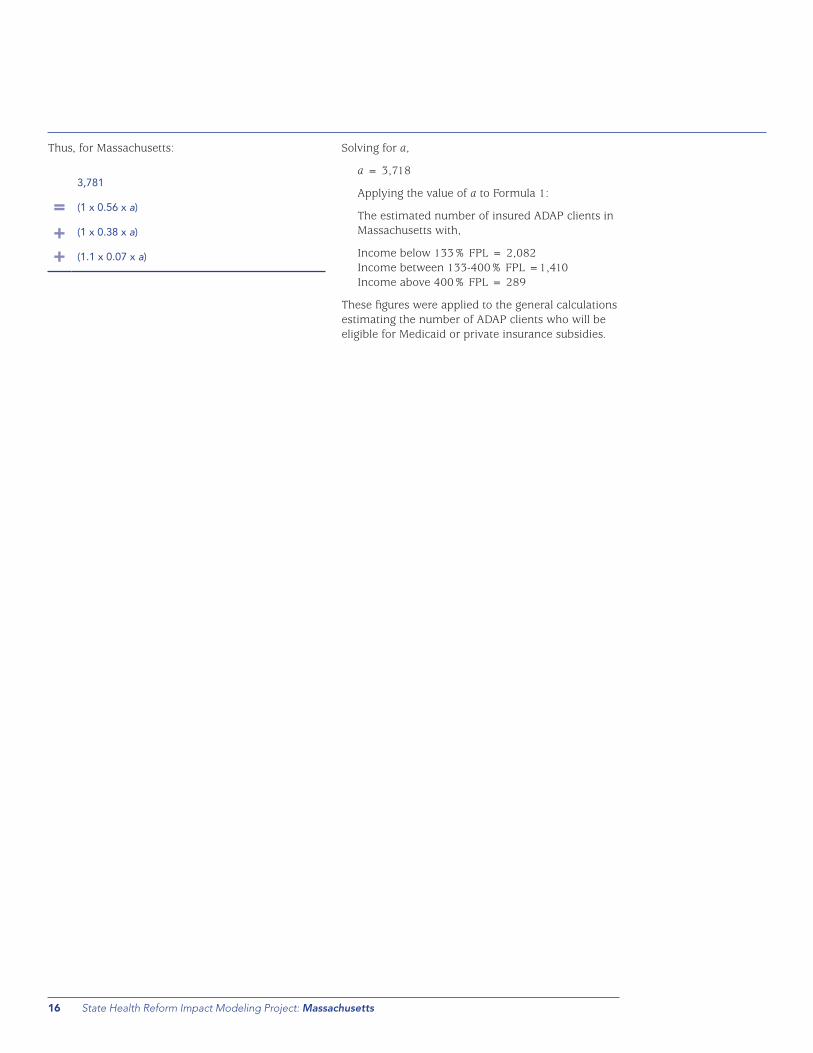
Thus, for Massachusetts:
3,781
= (1 x 0.56 x a)
+ (1 x 0.38 x a)
+ (1.1 x 0.07 x a)
Solving for a,
a = 3,718
Applying the value of a to Formula 1:
The estimated number of insured ADAP clients in Massachusetts with,
Income below 133% FPL = 2,082 Income between 133-400% FPL =1,410 Income above 400% FPL = 289
These figures were applied to the general calculations estimating the number of ADAP clients who will be eligible for Medicaid or private insurance subsidies.
State Health Reform Impact Modeling Project: Massachusetts 17
aPPEndIX B
NOTES
Data for certain states were incomplete in the 2012 National ADAP Monitoring Project Annual Report, so missing data were obtained from alternate sources:
❯ Data regarding June 2011 client income level for Georgia and Louisiana were incomplete in the 2012 Report. Because previous recent NASTAD reports are also incomplete, national averages were used in the income calculations for these states;
❯ Data regarding the insurance status of clients are incomplete in the 2012 Report for Georgia. Because previous recent NASTAD reports are also incomplete, national averages were used for insurance status in the calculations;
❯ Data for insurance status of ADAP clients in Louisiana and North Carolina were incomplete
in the 2012 report but available in the 2011 report. The 2011 report data were used in the calculations for these states; and
❯ Data on the number of clients served by Mississippi’s ADAP program are incorrect in NASTAD’s Monitoring Report, as the number of clients served is listed as 14,483, while the number of eligible ADAP clients in the state is listed as only 1,496. The listed figure appears to be a typo as the figure for number of clients served is reported as 1,483 in other sources, including Kaiser Family Foundation’s fact sheet for Mississippi’s ADAP. Because of the similarity of the figures listed by NASTAD and Kaiser Family Foundation, and the impossibility that the figure listed in NASTAD is correct, this report uses Kaiser Family Foundation's figure in its calculations.
CAVEATS AND ASSUMPTIONS
The estimates provided require a number of caveats and assumptions:
1. ADAP data (as opposed to Ryan White data) were used to account for insurance status and to avoid double-counting individuals who may be enrolled in multiple Ryan White programs (ie, seeing multiple providers). The estimates presented here, therefore, are only for the proportion of ADAP clients who will be eligible for Medicaid and private insurance subsidies.
2. Data for ADAP clients served were used rather than data for clients enrolled because the number of individuals enrolled may exceed the actual number of clients accessing ADAP services. Potential clients who are currently on ADAP waiting lists in several states are also not included in these calculations. Thus, the numbers provide a conservative estimate of ADAP beneficiaries who will transition onto Medicaid or into subsidized private insurance.
3. National data (NASTAD and HRSA) were used in calculations instead of state-specific data to ensure that these estimates could be compared across the states surveyed.
4. The number of undocumented immigrants on ADAP is a rough estimate extrapolated from estimates of the overall number of undocumented immigrants in the state as a whole as of 2008. It is possible that this estimate either overestimates or underestimates the actual number of undocumented immigrants currently served by ADAP.
With these caveats and assumptions in mind, the figures discussed are our best estimates of the number and percentage of ADAP clients who will be newly eligible for Medicaid in 2014 (assuming full implementation of the ACA), and the number and percentage of ADAP clients who will be eligible for private insurance subsidies.
These estimates are for ADAP recipients only, and are of limited analytical assistance in determining percentages of all people living with HIV who will be newly eligible for Medicaid and insurance subsidies in 2014. While the percentages provided could be extrapolated to apply to the broader HIV population in states, given the number of caveats and assumptions needed to arrive at this rough estimate, it would be better to obtain additional information about the unmet need within states before attempting to make such calculations.

18 State Health Reform Impact Modeling Project: Massachusetts
aPPEndIX cPart A of the Ryan White program funds both medical and support services, allowing states to provide HIV+ individuals with a continuum of care. States are required to spend 75% of Part A awards on core medical services, which include:
❯ Outpatient and ambulatory care;
❯ AIDS Drug Assistance Program (ADAP) (full coverage of drugs or insurance assistance);
❯ Oral health;
❯ Early intervention services;
❯ Health insurance premiums and cost-sharing assistance;
❯ Medical nutrition therapy;
❯ Hospice services;
❯ Home- and community-based health services;
❯ Mental health services;
❯ Substance abuse outpatient care;
❯ Home healthcare; and
❯ Medical case management (including treatment adherence services).
States may spend up to 25% on support (ancillary) services that are linked to medical outcomes (eg, patient outreach, medical transportation, linguistic services, respite care for caregivers of people living with HIV/AIDS, healthcare or other support service referrals, case management, and substance abuse residential services).

State Health Reform Impact Modeling Project: Massachusetts 19
rEfErEncES1. Patient Protection and Affordable Care Act (ACA), Pub. L. No. 111-148, 124
Stat. 119 (2010).
2. The states assessed include: Alabama, Arkansas, California, District of Columbia, Florida, Georgia, Illinois, Kentucky, Louisiana, Maryland, Massachusetts, Mississippi, New Jersey, New York, North Carolina, Ohio, Pennsylvania, South Carolina, Tennessee, Texas, Virginia, and Wisconsin.
3. maSSacHuSettS Department of public HealtH, Massachusetts HIV/AIDS Data Fact Sheet: The Massachusetts HIV/AIDS Epidemic at a Glance (2012), available at http://www.mass.gov/eohhs/docs/dph/aids/2012-profiles/epidemic-glance.pdf. At the end of 2011, 18,170 people were reported as living with HIV/AIDS who had been diagnosed in Massachusetts. Another 2,116 people were living with HIV/AIDS in Massachusetts but had been first diagnosed in another state.
4. maSSacHuSettS Department of public HealtH, Integrated Statewide Plan: 2012 Update to the Statewide Coordinated Statement of Need (SCSN) and the Comprehensive Plan, 7 (2012).
5. maSSacHuSettS Department of public HealtH, Integrated Statewide Plan: 2012 Update to the Statewide Coordinated Statement of Need (SCSN) and the Comprehensive Plan, 18 (2012).
6. tHe KaiSer family founDation (KFF), Massachusetts, Ryan White Program, available at http://www.statehealthfacts.org/profileind.jsp?cat=11&sub=126&rgn=23.
7. The number of duplicated clients reflects the cumulative number of clients served by each provider (clients are counted more than once if they receive services from two or more providers).
8. US Department of Health and Human Services, Health Resources and Services Administration, Ryan White HIV/AIDS Program 2010 State Profiles: Massachusetts Client Characteristics, available at http://hab.hrsa.gov/stateprofiles/2010/states/ma/Client-Characteristics.htm.
9. tHe KaiSer family founDation (KFF), Massachusetts, Ryan White Program, available at http://www.statehealthfacts.org/profileind.jsp?cat=11&sub=126&rgn=23.
10. The remaining 0.7% of Part B funding was spent on the Minority HIV/AIDS Initiative which aims to increase participation of minorities in ADAPs and other HIV-related services.
11. national alliance of State & territorial aiDS DirectorS (naStaD), national aDap monitoring project annual report, 2012,tbl 25, http://prod.nastad.dotnet-web1.advansiv.com/Docs/021503_National%20ADAP%20Monitoring%20Project%20Annual%20Report%20-%20August%202012.pdf.
12. Annette Rockwell, HDAP & Federal Grants Coordinator MDPH Office OF HIV/AIDS, Presentation, ADAP and Coordination with Health Insurance in Massachusetts, National ADAP Meeting, April 23, 2012, available at www.nastad.org.
13. national alliance of State & territorial aiDS DirectorS (naStaD), national aDap monitoring project annual report, 2012, Tbl 8, available at http://prod.nastad.dotnet-web1.advansiv.com/Docs/021503_National%20ADAP%20Monitoring%20Project%20Annual%20Report%20-%20August%202012.pdf; KFF, ADAP Massachusetts Beneficiaries, FY 2010, available at http://www.statehealthfacts.org/profileind.jsp?cat=11&sub=203&rgn=23.
14. tHe KaiSer family founDation (KFF), Massachusetts: Distribution of AIDS Drug Assistance Program (ADAP) Budget by Source, FY2011, http://www.statehealthfacts.org/profileind.jsp?rgn=26&cat=11&ind=545.
15. tHe KaiSer family founDation (KFF), Massachusetts: AIDS Drug Assistance Program (ADAP) – Budget, Costs & Prescriptions, http://www.statehealthfacts.org/profileind.jsp?cat=11&sub=127&rgn=23&cmprgn=35.
16. Annette Rockwell, HDAP & Federal Grants Coordinator MDPH Office OF HIV/AIDS, Presentation, ADAP and Coordination with Health Insurance in Massachusetts, National ADAP Meeting, April 23, 2012, available at www.nastad.org.
17. Annette Rockwell, HDAP & Federal Grants Coordinator MDPH Office OF HIV/AIDS, Presentation, ADAP and Coordination with Health Insurance in Massachusetts, National ADAP Meeting, April 23, 2012, available at www.nastad.org.
18. Annette Rockwell, HDAP & Federal Grants Coordinator MDPH Office OF HIV/AIDS, Presentation, ADAP and Coordination with Health Insurance in Massachusetts, National ADAP Meeting, April 23, 2012, available at www.nastad.org.
19. Affordable Care Act, tit. II, § 2001(a)(1), 42 U.S.C. § 1396a(a)(10)(A)(i)(VIII) (2010).
20. Affordable Care Act, tit. II, § 2001(a)(3)(B), 42 U.S.C. § 1396d(y)(1) (2010).
21. Affordable Care Act, tit. II, § 2001(a)(2)(A), 42 U.S.C. § 1396a(k)(1) (2010).
22. Affordable Care Act, tit. I, § 1331(d)(3), 42 U.S.C. § 18051(d)(3) (2010).
23. Affordable Care Act, tit. I § 1331(e), 42 U.S.C. § 18051(e) (2010).
24. Affordable Care Act, tit. I, § 1331(a)(1)-(2), 42 U.S.C. § 18051(a)(1)-(2) (2010).
25. Affordable Care Act, tit. I, § 1331(a)(2)(A)(ii), 42 U.S.C. § 18051(a)(2)(A)(ii) (2010).
26. Affordable Care Act, tit. I, § 1321(b)-(c), 42 U.S.C. § 18041(b)-(c) (2010).
27. Affordable Care Act, tit. I, § 1311(b)(1), 42 U.S.C. § 18031(b)(1) (2010).
28. Essential Health Benefits, Benchmark Plan for Massachusetts, http://www.mass.gov/ocabr/docs/doi/ma-essential-benchmark-plan.pdf.
29. Affordable Care Act, tit. I, § 1401(a), 26 U.S.C. § 36(B) (Amendments 2010).
30. Affordable Care Act, tit. I., §1302(a), 42 U.S.C. § 18022(a).
31. Affordable Care Act, tit. I., §1302(a), 42 U.S.C. § 18022(a).
32. 45 C.F.R. pts. 144, 147, 150, et al (proposed November 26, 2012).
33. Letter from Cindy Mann, Director, Centers for Medicare & Medicaid Services, to State Medicaid Director (November 26, 2012).
34. Social Security Act, 42 U.S.C. § 1927 (2010).
35. See US Department of Health and Human Services, Health Resources and Services Administration, Ryan White HIV/AIDS Program 2010 State Profiles: Massachusetts: Distribution of AIDS Drug Assistance Program (ADAP) Clients Served by Income, June 2011, available at http://www.statehealthfacts.org/profileind.jsp?ind=541&cat=11&rgn=23.
36. national alliance of State & territorial aiDS DirectorS (naStaD), national aDap monitoring project annual report, 2012, Table 13, http://prod.nastad.dotnet-web1.advansiv.com/Docs/021503_National%20ADAP%20Monitoring%20Project%20Annual%20Report%20-%20August%202012.pdf.
37. See Appendix A.
38. US Department of Health and Human Services, Health Resources and Services Administration, Ryan White HIV/AIDS Program 2010 State Profiles: Massachusetts, Services Utilization, available at http://hab.hrsa.gov/stateprofiles/2010/states/ma/Services-Utilization.htm.
39. maSSacHuSettS Department of HealtH & Human ServiceS, MassHealth Member Booklet, available at http://www.mass.gov/eohhs/docs/masshealth/appforms/member-booklet.pdf ; MassHealth Standard, “What Benefits Will I Get?”, http://www.massresources.org/masshealth-standard.html#benefits.
40. Essential Health Benefit Benchmark Plan Options, Commonwealth of Massachusetts, https://www.mahealthconnector.org/portal/binary/com.epicentric.contentmanagement.servlet.ContentDeliveryServlet/Health%2520Care%2520Reform/Exchange%2520Planning/Private%2520Insurance%2520Work%2520Group/2012/2012-04-27/EHBBenchmarkPlanOptionsUpdated.pdf; Schedule of Benefits, HMO Blue $2000 Deductible Plan Option (March 2012).
41. maSSacHuSettS Department of HealtH & Human ServiceS, MassHealth Mental Health and Substance Abuse Treatment: Behavioral Health Services, http://www.massresources.org/masshealth-behavioral.html.
42. maSSacHuSettS Department of HealtH & Human ServiceS, MassHealth Mental Health and Substance Abuse Treatment: Behavioral Health Services, http://www.massresources.org/masshealth-behavioral.html.
43. maSSacHuSettS Department of HealtH & Human ServiceS, MassHealth Dental Program, http://www.massresources.org/masshealth-dental.html.
44. Letter from Cindy Mann, Director, Centers for Medicare & Medicaid Services, to State Medicaid Director (November 26, 2012).

20 State Health Reform Impact Modeling Project: Massachusetts
45. 45 C.F.R. pts. 144, 147, 150, et al. (proposed November 26, 2012).
46. maSSacHuSettS Department of public HealtH, ADAP Patient Eligibility Sheet, December 2009.
47. maSSacHuSettS Department of HealtH & Human ServiceS, MassHealth Drug List, available at https://masshealthdruglist.ehs.state.ma.us/MHDL/pubdruglistget.do?searchBy=Drug+Name&searchFor=zovirax&stdClassDesc=.
48. Essential Health Benefits: Benchmark Plan for Massachusetts, available at http://www.mass.gov/ocabr/docs/doi/ma-essential-benchmark-plan.pdf; Massachusetts Health Connector, Essential Health Benefit Benchmark Plan Options, Commonwealth of Massachusetts, available at https://www.mahealthconnector.org/portal/binary/com.epicentric.contentmanagement.servlet. ContentDeliveryServlet/Health%2520Care%2520Reform/Exchange%2520Planning/Private%2520Insurance%2520Work%2520Group/2012/2012-04-27/EHBBenchmarkPlanOptionsUpdated.pdf.
49. maSSacHuSettS Department of HealtH & Human ServiceS, MassHealth “What Benefits will I Get”?, available at http://www.massresources.org/masshealth-benefits.html#cost.
50. MassHealth, “What Benefits will I Get”?, available at http://www.massresources.org/masshealth-benefits.html#cost.
51. HealtHcare.gov, How the Health Care Law is Making a Difference for the People of Massachusetts (2012) http://www.healthcare.gov/law/resources/ma.html (last visited Nov 1, 2012).
52. national aSSociation of community HealtH centerS, maSSacHuSettS HealtH center fact SHeet (2010), available at http://www.nachc.com/client/documents/research/MA11.pdf (last visited November 1, 2012).
53. national aSSociation of community HealtH centerS, maSSacHuSettS HealtH center fact SHeet (2010), available at http://www.nachc.com/client/documents/research/MA11.pdf (last visited November 1, 2012).
54. national center for Hiv care in minority communitieS, http://www.nchcmc.org/sites/ and http://www.nchcmc.org/about/application/ (last visited November 1, 2012).
55. Kaiser Family Foundation, Massachusetts: Medicaid Managed Care Enrollees as a Percent of State Medicaid Enrollees, as of July 1, 2011, available at http://www.statehealthfacts.org/profileind.jsp?ind=217&cat=4&rgn=23.
56. maSSHealtH, MassHealth MCO Managed Care Health Plans, available at http://www.massresources.org/masshealth-managed-care.html.
57. national alliance of State & territorial aiDS DirectorS (naStaD), national aDap monitoring project annual report, 2012, 44-45 Table 8, auguSt 2012, available at http://prod.nastad.dotnet-web1.advansiv.com/Docs/021503_National%20ADAP%20Monitoring%20Project%20Annual%20Report%20-%20August%202012.pdf.
58. national alliance of State & territorial aiDS DirectorS (naStaD), national aDap monitoring project annual report, 2012, 50, Table 13, auguSt 2012, available at http://prod.nastad.dotnet-web1.advansiv.com/Docs/021503_National%20ADAP%20Monitoring%20Project%20Annual%20Report%20-%20August%202012.pdf.
59. The number of undocumented immigrants on ADAP in each state in FY2009 will be extrapolated from the Pew Research Center’s report, “A Portrait of Unauthorized Immigrants in the United States,” See A Portrait of Unauthorized Immigrants in the United States, pew reSearcH center, (April 14, 2009), available at http://pewhispanic.org/files/reports/107.pdf. This report provides the estimated number of undocumented immigrants in each state for 2008. This number, divided by the overall population of each state in 2008 (estimated at http://www.census.gov/popest/data/state/totals/2011/index.html), provides the percentage that undocumented immigrants make up of the total population in the state. This percentage is then applied to the number of individuals enrolled in ADAP who have incomes below 133% FPL to estimate how many ADAP beneficiaries will not be newly eligible for Medicaid in 2014 as a result of their immigration status.
60. national alliance of State & territorial aiDS DirectorS (naStaD), national aDap monitoring project annual report, 2012, Table 8, available at http://prod.nastad.dotnet-web1.advansiv.com/Docs/021503_National%20ADAP%20Monitoring%20Project%20Annual%20Report%20-%20August%202012.pdf.
61. national alliance of State & territorial aiDS DirectorS (naStaD), national aDap monitoring project annual report 2012, Table 13, available at http://prod.nastad.dotnet-web1.advansiv.com/Docs/021503_National%20ADAP%20Monitoring%20Project%20Annual%20Report%20-%20August%202012.pdf.
62. national alliance of State & territorial aiDS DirectorS (naStaD), national aDap monitoring project annual report 2012, Table 13, available at http://prod.nastad.dotnet-web1.advansiv.com/Docs/021503_National%20ADAP%20Monitoring%20Project%20Annual%20Report%20-%20August%202012.pdf.
63. national alliance of State & territorial aiDS DirectorS (naStaD), national aDap monitoring project annual report, 2012, Table 14, available at http://prod.nastad.dotnet-web1.advansiv.com/Docs/021503_National%20ADAP%20Monitoring%20Project%20Annual%20Report%20-%20August%202012.pdf.
64. The number of undocumented immigrants on ADAP in each state in FY2009 will be extrapolated from the Pew Research Center’s report, “A Portrait of Unauthorized Immigrants in the United States,” see A Portrait of Unauthorized Immigrants in the United States, pew reSearcH center, available at http://pewhispanic.org/files/reports/107.pdf. This report provides the estimated number of undocumented immigrants in each state for 2008. This number, divided by the overall population of the state in 2008 (estimated at http://www.census.gov/popest/data/state/totals/2011/index.html), provides the percentage that undocumented immigrants make up of the total population in the state. This percentage is then applied to the number of individuals enrolled in ADAP to estimate how many ADAP beneficiaries will not be newly eligible for private insurance subsidies as a result of their immigration status.
65. national alliance of State & territorial aiDS DirectorS (naStaD), national aDap monitoring project annual report, 2012, available at http://prod.nastad.dotnet-web1.advansiv.com/Docs/021503_National%20ADAP%20Monitoring%20Project%20Annual%20Report%20-%20August%202012.pdf.

this report discusses research that is conducted by the center for Health law and policy Innovation of Harvard law School, which is funded by Bristol-myers Squibb with no editorial review or discretion. the content of the report does not necessarily
reflect the views or opinions of Bristol-myers Squibb.
prepared by the center for Health law and policy Innovation of Harvard law School and the treatment access expansion project