Embed Size (px)
Citation preview

STATE HIGHWAY ADMINISTRATION
RESEARCH REPORT
INTEGRATION OF OFF-RAMP AND ARTERIAL SIGNAL CONTROLS TO MINIMIZE THE RECURRENT CONGESTION ON
THE I-495 CAPITAL BELTWAY
GANG-LEN CHANG ZICHUAN LI
DEPARTMENT OF CIVIL AND ENVIRONMENTAL ENGINEERING UNIVERSITY OF MARYLAND COLLEGE PARK, MD 20742
SP808B4D FINAL REPORT
NOVEMBER 2010
MD-10-SP808B4D
Martin O’Malley, Governor Anthony G. Brown, Lt. Governor
Beverley K. Swaim-Staley, Secretary Neil J. Pedersen, Administrator

The contents of this report reflect the views of the author who is responsible for the facts and the accuracy of the data presented herein. The contents do not necessarily reflect the official views or policies of the Maryland State Highway Administration. This report does not constitute a standard, specification, or regulation.
ii

Technical Report Documentation Page 1. Report No. MD-10-SP808B4D & UMD-2008-03
2. Government Accession No. 3. Recipient's Catalog No.
4. Title and Subtitle Integration of Off-ramp and Arterial Signal Controls to Minimize the Recurrent Congestion on the I-495 Capital Beltway
5. Report Date November 2010
6. Performing Organization Code
7. Author/s
Gang-Len Chang and Zichuan Li 8. Performing Organization Report No.
9. Performing Organization Name and Address Department of Civil and Environmental Engineering, University of Maryland, College Park, MD 21220
10. Work Unit No. (TRAIS) 11. Contract or Grant No.
SP808B4D & DTRT07-G-0003
12. Sponsoring Organization Name and Address Maryland State Highway Administration Office of Policy & Research 707 North Calvert Street Baltimore MD 21202
13. Type of Report and Period Covered
Final Report
14. Sponsoring Agency Code (7120) STMD - MDOT/SHA
15. Supplementary Notes 16. Abstract This study developed an integrated control model to contend with the impact of off-ramp queue spillback on both the freeway and arterials within the interchange control boundaries. The entire control system consists of two levels that compute the optimally coordinated signal strategies for intersections and off-ramps. Whereas the first level primarily handles oversaturated flows and blockage between lanes at congested intersections, the second level deals with the freeway mainline delays caused by the excessive off-ramp queue spillback; these components work together to produce the optimal systemwide signal and ramp control plans. In addition to developing control modules for oversaturated arterials and excessive off-ramp queues, the study also conducted experimental analyses using field data from the interchange between I-495 and Georgia Avenue. The experimental results indicate that, by accounting for how off-ramp queues impact delays of both freeway and arterial traffic, the integrated interchange control system can yield the best use of a roadway’s overall capacity and prevent the formation of freeway queues in the interchange area caused by the overflow of off-ramp traffic.
17. Key Words off-ramp control, arterial optimization, signal, integrated control model
18. Distribution Statement: No restrictions This document is available from SHA’s Research Division upon request.
19. Security Classification (of this report)
None 20. Security Classification (of this page)
None 21. No. Of Pages
86 22. Price N/A
Form DOT F 1700.7 (8-72) Reproduction of form and completed page is authorized.
iii

iv

TABLE OF CONTENTS
LIST OF FIGURES ........................................................................................................... vii
LIST OF TABLES ix
Executive Summary ..............................................................................................................1
CHAPTER 1: INTRODUCTION ........................................................................................3
1.1 Research Background ................................................................................................................. 3 1.2 Research Objectives and Project Scope ...................................................................................... 4 1.3 Report Organization .................................................................................................................... 4
CHAPTER 2: LITERATURE REVIEW ...........................................................................6
2.1 Introduction................................................................................................................................. 6 2.2 Integrated Interchange Control Strategies ................................................................................... 6 2.3 Integrated Corridor Control Model ............................................................................................. 8 2.4 Freeway Access Control Strategies ...........................................................................................10 2.5 Arterial Traffic Signal Control Strategies ..................................................................................15 2.6 Signal Control Models for Oversaturated Conditions ................................................................16
CHAPTER 3: OVERALL SYSTEM FRAMEWORK ....................................................18
3.1 Introduction................................................................................................................................18 3.2 Key Research Issues ..................................................................................................................18 3.3 System Control Structure and Key modules ..............................................................................20
CHAPTER 4: ARTERIAL TRAFFIC FLOW AND SIGNAL MODELS ....................24
4.1 Introduction...............................................................................................................................24 4.2 Modeling Traffic Flow Interactions at Signalized Intersections ...............................................24 4.2.1 Merging zone .............................................................................................................................26 4.2.2 Propagation zone .......................................................................................................................28 4.2.3 Diverging zone – a new set of formulations ..............................................................................30 4.2.4 An optimization model for oversaturated arterial signals ..........................................................33 4.3 Solution Algorithm ....................................................................................................................36 4.4 Conclusions................................................................................................................................37
CHAPTER 5: AN INTEGRATED INTERCHANGE CONTROL MODEL ...............38
5.1 Introduction................................................................................................................................38 5.2 Modeling Methodology for Freeways........................................................................................39 5.2.1 Modeling of Type-B Segments ..................................................................................................40 5.2.2 Modeling of Type-A Segments ..................................................................................................42 5.3 An integrated single-interchange control model ........................................................................47 5.4 Conclusions................................................................................................................................48
v

CHAPTER 6: EXPERIMENTAL ANALYSES ...............................................................50
6.1 Introduction................................................................................................................................50 6.2 Experimental Design..................................................................................................................50 6.3 Experimental Results of the Arterial Signal Optimization Model .............................................52 6.4 Results of the Integrated Interchange Control Model ................................................................57 6.5 Conclusion .................................................................................................................................63
CHAPTER 7: CONCLUSIONS AND RECOMMENDATIONS ...................................64
7.1 Research findings .......................................................................................................................64 7.2 Recommendations for future studies..........................................................................................65
REFERENCES 67
vi

LIST OF FIGURES
Figure 3-1 System control flowchart .......................................................................... 21
Figure 3-2 Key dystem modules ................................................................................. 23
Figure 4-1 The traffic dynamics of a signalized intersection approach ...................... 25
Figure 4-2 Link spillback blockage at the merging zone ........................................... 27
Figure 4-3 The merging zone represented by a merging cell ..................................... 27
Figure 4-4 The propagation zone represented with ordinary cells ............................. 29
Figure 4-5 Left-turn vehicles block through traffic .................................................... 30
Figure 4-6 Through vehicles block left-turn traffic .................................................... 30
Figure 4-7 The sub-cell concept illustration ............................................................... 31
Figure 4-8 The sub-cell representation of a diverging signalized cell........................ 31
Figure 4-9 An illustration of left-turn queue blocking through traffic ....................... 33
Figure 4-10 NEMA eight-phase signal timing structure .............................................. 35
Figure 4-11 An enhanced fraction-based decoding scheme for signal design ............. 37
Figure 5-1 Graphical illustration of a signalized interchange .................................... 39
Figure 5-2 The freeway segments by destination ....................................................... 40
Figure 5-3 Modeling the traffic flow interactions in Type-B segment by CTM ........ 41
Figure 5-4 Modeling the one-stream segment by cell ................................................ 42
Figure 5-5 Type-A segment traffic dynamics ............................................................. 43
Figure 5-6 On-ramp traffic characteristics ................................................................. 44
Figure 5-7 Exiting-queue effect in a diverging zone .................................................. 45
Figure 5-8 Graphical illustration of the modeling concept for the diverging zone .... 46
Figure 6-1 Graphical illustration of the target interchange ........................................ 51
Figure 6-2 Control boundaries of the case study for arterial signal optimization ...... 52
vii

Figure 6-3 A graphical illustration of the example interchange ................................. 57
Figure 6-4 Comparison of freeway delays by segment .............................................. 61
Figure 6-5 Comparison of arterial delays by segment ................................................ 63
viii

LIST OF TABLES
Table 6-1 Demand scenarios for the arterial signal optimization model (vehicle per hour) ............................................................................................................. 53
Table 6-2 Overall model performance comparison ...................................................... 54
Table 6-3 Total delay comparison by intersection (vehicle minutes) .......................... 56
Table 6-4 Basic demand for entrances and ramps (vehicle per hour) .......................... 58
Table 6-5 Experimental scenarios under different exiting volumes (vehicle per hour) 58
Table 6-6 Overall model performance comparison ...................................................... 58
Table 6-7 Total delay comparison by roadway segment (vehicle minutes) ................. 60
ix

Executive Summary
Effectively contending with the growing congestion on the Capital Beltway has
long been the top priority and the most challenging task of transportation professionals in
this region. Although a variety of factors has contributed to its deteriorating traffic
conditions, insufficient freeway capacity to accommodate the ever-increasing demand
from the Washington Metropolitan Area is certainly the top issue to address. Our
extensive field observations of the congestion patterns on the Capital Beltway over recent
years have revealed that many existing bottlenecks during peak hours are due to the
spillback of the traffic queue from an off-ramp that often takes away the capacity of one
to two mainline travel lanes when it exceeds the length of an auxiliary lane. Examples of
bottlenecks caused by such off-ramp spillback vehicles can be found at the Connecticut
Avenue and Georgia Avenue interchanges during peak hours.
Both field observations and simulation experiments conducted in this study
further indicate: that (1) an interchange’s high off-ramp volume, in conjunction with the
peak-hour arterial flow rates, will cause some intersection approaches to become
oversaturated, consequently paralyzing traffic movements along the entire arterial; (2) an
oversaturated arterial adjacent to the interchange can cause off-ramp queue lengths to
extend beyond their auxiliary lanes and block the freeway’s mainline lanes; and (3) state-
of-the-art signal optimization programs, such as TRANSYT-7F, cannot yield effective
signal control plans for oversaturated arterials that often experience lane blockage
between neighboring lanes and queue spillback to their upstream segments.
In view of those identified critical issues, this study focused on developing an
integrated off-ramp and arterial signal control system for urban interchange that can
dynamically adjust the signal plan to minimize the queue spillback from off-ramps to the
freeway mainline while maximizing throughput on their neighboring arterials. The entire
system consists of the following three primary components: (1) a real-time operational
framework to effectively contend with the impact of off-ramp queue spillback on both the
freeway and arterials within the interchange control boundaries; (2) an arterial control
model to optimize signalizing timings at all oversaturated intersections within the impact
boundaries of a congested interchange; and (3) an integrated interchange control model to
1

minimize the total freeway and arterial delay if any off-ramp queue has spilled back to
the freeway mainline.
An extensive evaluation conducted in this study using both the field data and various
experimental scenarios convincingly indicates that the proposed system framework with
its embedded control models is capable of capturing interactions between turning and
through traffic flows, as well as congestion propagation between neighboring
intersections. It can effectively prevent the formation of local bottlenecks caused by
queue spillback or lane blockage. Further analysis of the traffic queue patterns also
shows that, by accounting for how off-ramp queues impact delays of both freeway and
arterial traffic, the interchange optimal control system can yield the best use of a
roadway’s overall capacity and prevent the formation of freeway queues in the
interchange area caused by the overflow of off-ramp traffic. Hence, the integrated
control model developed from this study can potentially serve as an effective tool for
responsible highway agencies to exercise the proper level of control, based on the
detected distribution of ramp queue length, and traffic volumes on the freeway as well as
arterials.
2

CHAPTER 1: INTRODUCTION
1.1 Research Background
Effectively contending with the growing congestion on the Capital Beltway has
long been the top priority and the most challenging task of transportation professionals in
this region. Although a variety of factors has contributed to its deteriorating traffic
conditions, the insufficient capacity of the freeway mainline to accommodate the ever-
increasing demand from the Washington Metropolitan Area is certainly the top issue to
address. Our extensive field observations of the congestion patterns on the Capital
Beltway over recent years have revealed that many existing bottlenecks during peak
hours are due to the spillback of the traffic queue from an off-ramp that often takes away
the capacity of one to two mainline travel lanes when it exceeds the length of an auxiliary
lane. Examples of bottlenecks caused by such off-ramp spillback vehicles can be found at
the Connecticut Avenue and Georgia Avenue interchanges during peak hours. Thus,
while policy makers explore demand-side methods, such as congestion pricing and HOT
lanes, it is essential that the potentially cost-effective and near-term deployable strategy
of integrated off-ramp control be investigated.
Thus, this study developed a control system for the integrated operation of off-
ramps and their local arterial signals with two layers of operational objectives. The first
layer involves implementing a monitoring mechanism that can prevent off-ramp vehicles
from spilling back into the mainline, thereby reducing its capacity. The second layer
applies optimal control theory to maximize the throughput of the target roadway segment,
including both the off-ramp and its upstream and downstream intersections. Depending
on traffic conditions and the available capacity of the target local arterial, one shall
investigate the impacts of assigning different priorities to the off-ramp vehicles on the
arterial traffic progression and flow speed, if the off-ramp queue has been controlled
within the auxiliary lane.
It should be mentioned that traffic bottlenecks caused by off-ramp spillback
queues are quite common congestion patterns on many metropolitan beltways. Neither
research institutions nor operational agencies have yet developed effective strategies to
contend with their impacts on freeway mainline capacity.
3
1.2 Research Objectives and Project Scope
To meet its primary objective, this study focused on developing an integrated
off-ramp and arterial signal control system for urban interchange that can adjust the
signal plan to minimize the queue spillback from off-ramps to the freeway mainline while
maximizing throughput on neighboring arterials. The proposed system contained three
principal components: (1) a real-time operational framework to effectively contend with
the impact of off-ramp queue spillback on both the freeway and arterials within the
interchange control boundaries; (2) an arterial control model to optimize signalizing
timings at all oversaturated intersections within the impact boundaries of a congested
interchange; and (3) an integrated interchange control model to minimize the total
freeway and arterial delay if any off-ramp queue has spilled back to the freeway mainline.
Unlike most existing models on interchange traffic control, the focus of this
research was on the scenario in which traffic volumes on both the freeway and its local
arterial are high enough to cause intersection overflow and off-ramp spillback to the
freeway mainline segment. Hence, the development of control algorithms to optimize the
overall operational efficiency for such congested interchanges needs to consider the
tradeoff between freeway and arterial traffic delays, while also accounting for potential
lane blockages at local intersections due to oversaturated traffic conditions during
different control periods.
Note that, since most target interchanges on the I-495 Capital Beltway consist of
several on- and off-ramps and intersections, it is essential to ensure that implementing the
optimal systemwide control will not cause undesirable local consequences, such as
increasing the left-turn queue length at a particular intersection. Thus, the scope of this
study also included a comprehensive sensitivity analysis of all possible traffic scenarios,
based on field data from the interchange of I-495 and George Avenue, and the selection
of operational constraints for each control point at the overall system optimization
process.
1.3 Report Organization
To take advantage of existing studies on this vital issue, this study began with an
extensive literature review of the available interchange and corridor control models. The
findings are presented in Chapter 2. Since signal design and ramp operational strategies
4

are the two principal components of an integrated interchange control system, this
chapter also summarizes some state-of-the-art developments associated with both vital
research issues.
Chapter 3 presents the overall framework for the proposed integrated system
control, including the interrelationships between all principal components, the operational
flowchart, and potential extensions to a corridor-level control.
Chapter 4 details the arterial control component, which functions to generate the set
of time-varying optimal timing plans for each signal within the control boundaries during
the congested peak hours. It includes an analysis of the complex interrelations between
the signal phasing plan and the distribution of traffic volumes and formulations for traffic
blockages between lanes under spillback conditions. This chapter also focuses on
illustrating the modeling methodology used to integrate traffic conditions at all
intersections and ramps in an operational optimal control structure.
Chapter 5 illustrates the advanced interchange control system, which includes the
proposed arterial component, but further considers the potential impacts of off-ramp
queue spillback on the freeway through traffic. This chapter focuses on formulations of
the freeway mainline traffic delay and its interdependent relationships with the traffic
volume on the local arterials. The chapter also looks at how to select the proper control
objective for the target interchange system under various congestion levels and how best
to use the resulting measures of effectiveness (MOE).
Chapter 6 reports the evaluation results with respect to the proposed integrated
control system using the field data from the interchange between I-495 (the Capital
Beltway) and Georgia Avenue. This chapter also analyzes the essential subject of how
best to use the computed optimal results for systemwide control operations without
yielding unacceptable levels of service at any local control junctions.
Chapter 7 summarizes the primary research findings from this study, including
valuable lessons obtained from developing all primary models and evaluating the
integrated control system with field data. Concluding comments, along with potential
operational issues that may emerge in any future system implementation, are also the
main focus of this chapter.
5

CHAPTER 2: LITERATURE REVIEW
2.1 Introduction
To take best advantage of existing studies on freeway control and interchange
traffic management, the research team extensively reviewed the related literature
covering integrated interchange control, ramp metering, and signal optimization. Critical
issues and technical constraints identified from the literature review task actually served
as the basis for finalizing the research objectives and scope of this study.
This chapter is organized as follows: Section 2.2 presents state-of-the-art models
for interchange control, including strategies for both freeway ramps and their neighboring
arterial signals. Section 2.3 reviews integrated models for corridor control, as their core
modeling methods are all applicable for use in contending with queue formation and
dissipation around a congested interchange. Section 2.4 summarizes existing studies for
freeway access control, including both on- and off-ramps, which are often the locations
that become the bottlenecks. Section 2.5 and section 2.6 highlight the strengths and
deficiencies of the literature on arterial signal optimization, especially regarding
effectively tackling traffic flows at an oversaturated intersection.
2.2 Integrated Interchange Control Strategies
Integrated interchange control refers to controlling the interchange signals and on-
ramp meters in an integrated manner. Many researchers over the past several decades
have worked on this problem, and some have converted their research results into
commercial products (Munjal, 1971; Messer and Berry, 1975; Messer, Fambro et al.,
1977; Radwan and Hatton, 1990; Dorothy, Maleck et al., 1998; Chlewicki, 2003). For
instance, Venglar et al. (1998) developed PASSER III, a computer program designed to
analyze the operation of an isolated interchange. Engelbrecht and Barnes (2003)
investigated eight possible controller features to improve the operational efficiency of
diamond interchanges under moderate traffic conditions. However, most early studies on
this subject focused only on undersaturated conditions, not congested scenarios where
queue spillback may take place at either an off- or on-ramp and the overflow blockage
between lanes may occur at neighboring intersections.
6
More recently, Kovvali et al. (2002) began to address the issue of optimizing the
control for congested interchanges and proposed an extension to PASSER III with a GA
(genetic algorithm)-based model which can optimize the diamond interchange signals for
both undersaturated and oversaturated traffic conditions with link queue spillback. The
core logic of their proposed method involved employing the delay equations in the
Highway Capacity Manual (HCM) and the platoon dispersion model in TRANSYT-7F to
capture the dynamic interrelationships between the spatial evolution of traffic flows and
the resulting delay under different signal plans.
Building on the work by Kovvali, some researchers (Tian and Messer et al., 2004)
tackled the on-ramp spillback problem using an integrated model that concurrently
optimized on-ramp metering and interchange signal control parameters. Further, Lee and
Messer et al. (2006) conducted field investigation of the performance of actuated controls
used at diamond interchanges under congested conditions.
Along the same lines, Fang and Elefteriadou (2006) developed a different solution
algorithm with a forward dynamic programming method that was adaptive in nature and
thus responsive to fluctuating traffic demand evolving from moderate to congested
conditions. Li and Chang et al. (2009) designed an real-time operational system
framework to prevent off-ramp queues from spilling back to the freeway mainline
segment by controlling the adjacent arterial signals. Zhang, et al. (2009) attempted to use
a local synchronization control scheme for the same type of congested interchange. Their
core control logic is to manage the queues at critical locations by coordinating traffic
signals at neighboring intersections and freeway on-ramp meters. The model
formulations for network traffic dynamics are represented with the traditional cell
transmission concept.
In summary, although recent studies on the subject of interchange control have
started to address complex interactions between congested traffic flows and the resulting
on-ramp queues, many vital issues arising during oversaturated conditions remain to be
tackled, such as overflow blockage between through and turning vehicles on local
arterials and the spillback of off-ramp queues impeding freeway mainline traffic.
7

2.3 Integrated Corridor Control Model
Integrated corridor control refers to the concurrent optimization of freeway ramp
flows and signal timing plans on adjacent arterials so as to maximize the throughput of
the entire system. Since an interchange is a subsystem of a traffic corridor, many
modeling concepts or creative algorithms proposed in the literature for these two traffic
control types share the same potential for applications. Thus, this section also briefly
reviews related modeling strategies in the literature for integrated corridor control.
Most existing studies of corridor control fall into one of the two following
categories: (1) heuristic methods, along with simulation analysis for feedback adjustment
control strategies; and (2) mathematical formulations with traffic flow and control
theories. Some early studies using heuristic methods include the control process proposed
by Reiss (1981) and Van Aerde and Yagar (1988), both of which rely on simulation
programs to evaluate the effectiveness of the proposed methods and to make necessary
adjustments. Another study of the same type, conducted by Pooran and Sumner (1996),
identified four types of coordination strategies and sixteen types of control tactics for
managing corridor traffic.
In the second category, Cremer and Schoof (1989) were the first researchers to
formulate an integrated corridor control model that included off-ramp traffic diversion,
on-ramp metering, mainline speed limit control, and signal timing plans on the surface
streets. They modeled freeway traffic dynamics with the classical continuous flow model
and the arterial flow evolution with the platoon dispersion model from TRANSYT. The
proposed solution algorithm is a mixed-integer nonlinear optimal control model along
with a heuristic decomposition approach. Van Den Berg et al. (2004) proposed a model
predictive control (MPC) approach for mixed urban and freeway traffic in urban
corridors, based on enhanced macroscopic traffic flow formulations. Their study
represents freeway dynamics with a continuous flow model, and reflects the horizontal
and destination-dependent queues on urban arterials with a study by Kashani and Saridis
(1983). Their model has the overall control objective of minimizing the total system
travel time.
Grounded on a similar core theory, but with different formulations for traffic flow
interactions between successive control segments, Chang et al. (1993) presented a
dynamic system-optimal control model for a commuting corridor consisting of a freeway
8

and a parallel arterial. Their proposed formulations integrated ramp metering control with
arterial signal optimization under the common functional objective of minimizing the
total corridor travel time, and solved all control parameters concurrently with a linear
approximation algorithm.
Focusing mainly on nonrecurrent congestion in commuting corridors, Wu and
Chang (1999) later formulated a linear programming model with a heuristic algorithm to
solve for the optimal ramp metering rate, the off-ramp diversion percentage, and arterial
signal timing plans. Their proposed methodology employs classical traffic flow
conservation relationships to capture the temporal and spatial evolution of vehicle flows
on each segment of the freeway and arterial, including the flow transition between
roadway segments and the flow discharge at intersections. To improve the computing
speed for a large corridor network, this study further investigated a two-regime
approximation for the nonlinear speed-density relationship that allows the application of
a specially designed successive linear programming algorithm to solve the systemwide
optimal state.
Along the same line of research, Papageorgiou (1995) developed a similar model
to address corridor traffic management but used classical optimal control theory to model
the traffic flow dynamics and the store-and-forward recursive relationship to reflect the
feedback interrelations between the observed traffic conditions and the responsive
adjustment of the control strategies. Tian and Balke (2002) analyzed the effectiveness of
the integrated operation of surface street and freeway systems with VISSIM, a micro-
simulation model, and concluded the potential benefits with integrated control at the
corridor level. More recently, Tian (2007) formulated an integrated ramp metering model
for diamond interchange control system based on the computed total delay occurring on
the freeway mainline and its ramps, with a second-by-second analysis of the arriving and
departure flow rates.
Overall, the existing studies of corridor congestion management have reported the
necessity and effectiveness of integrating freeway access control with local arterial signal
timing plans. Researchers working on this subject also share common concerns about the
inevitable tradeoff between model accuracy and computing efficiency. Thus, how to
formulate an integrated corridor control model that is sufficiently reliable and efficient
for real-time applications remains a challenging on-going issue for the community.
9
2.4 Freeway Access Control Strategies
Most studies of freeway access control focus on developing various on-ramp
control strategies, which aim to keep the downstream freeway volume under the roadway
capacity by limiting its on-ramp volume. Based on the employed logic, one can divide
existing ramp metering studies into the following two categories: pretimed and automated
metering control. Studies of the former sort use historical average volumes to compute
the ramp metering rate, whereas those in the latter category focus on keeping traffic
conditions near prespecified levels based on real-time traffic measurements. The
automated metering strategies can use either actuated or adoptive control models,
depending on the employed algorithm and the available data.
One pioneering study that used the linear programming method to produce the
pretimed ramp metering rate was by Wattleworth (1963). The core idea of this study was
to compute the volume on each freeway mainline segment using the historical average
upstream volume and then to determine the on-ramp metering rate, with the control
objective of maximizing the total entering flow rate within the freeway capacity
constraints. Papageorgiou (1980) extended the same basic concept on formulating the
interrelations between ramp flows and mainline flows with the linear programming
method that incorporated a constant travel time for each freeway segment and produced
the optimal metering rate with a decomposition approach. Similar studies along this line,
but with different objective functions, are also available in the literature (Yuan and Kreer;
Tabac, 1972; Wang, 1972; Wang and May, 1973; Chen, Cruz et al., 1974; Chen, Cruz et
al., 1974; Schwartz and Tan, 1977).
Note that pretimed ramp metering strategies aim to optimize ramp metering rates
under stable traffic patterns. Hence, they often lead to underutilization of the freeway
mainline capacity under time-varying traffic conditions.
In view of the deficiencies inherent to all pretimed metering strategies, some
researchers have proposed the use of automated metering strategies to optimize metering
rates based on real-time measured traffic volumes and occupancies. Most of such studies
belong to one of the following categories: (1) local responsive control, where the ramp
metering rate is determined solely by mainline traffic volumes on the adjacent freeway;
and (2) coordinated ramp metering control, which computes the set of time-varying
10
metering rates for ramps within the control boundaries, based on the detected systemwide
traffic conditions.
Some early studies in the former category include the demand-capacity strategy
by Masher, Ross et al. (1975); the zone-based control strategies by Stephanedes (1994);
Xin, and Michalopoulos et al. (2004); and the congested pattern control approach by
Kerner (2005). The demand-capacity strategy attempts to fully utilize the downstream
capacity of the freeway mainline by reducing the ramp flow to its minimum level if the
downstream occupancy exceeds the critical level. This control algorithm follows an open-
loop disturbance-rejection policy and is quite sensitive to disturbances caused by either
traffic or measurement errors.
The zone-based control strategy, employed by the Minnesota DOT for many
years, seeks to maintain a target level of traffic volume within each freeway zone, defined
as a segment containing only one ramp. This strategy’s effectiveness varies with the
accuracy of the estimates for all associated control parameters, including the number of
divided zones, the estimated bottleneck capacity, and the entering and leaving volumes of
each zone over the control period. Xin et al. (2004) later extended this algorithm to
stratified ramp control, which considers both the ramp demand and its queue size. The
congested pattern control approach by Kerner (2005) employs a three-phase traffic flow
concept to keep the on-ramp bottleneck at the minimum possible level that will not
propagate its congestion patterns to upstream segments.
The occupancy-based control strategy determines the ramp metering rate based
on the occupancy of the downstream freeway mainline, using feedback regulation to
maintain a prespecified occupancy. Examples of occupancy-based strategies include
ALINEA (Papageorgiou, Hadj-Salem et al., 1991), the neural control algorithm (Zhang
and Ritchie, 1997; Xin, Michalopoulos et al., 2004), and the iterative-learning approach
(Hou, Xu et al., 2008). The ALINEA algorithm proposed by Papageorgiou et al.
(Papageorgiou, Hadj-Salem et al., 1991) is a closed-loop ramp metering strategy that uses
classical feedback theory and dynamically adjusts the metering rates in response to
detected differences between the target and measured occupancies. The local artificial
neural network model attempted by Zhang and Ritchie (1997) employs a multilayer feed-
forward control structure, based on the fundamental diagram of traffic flow theory. Both
ALINEA and neural control algorithms are reasonably effective for moderate congestion
11

but not for heavy congestion where queue spillback may occur. The core concept of the
iterative-learning approach (Hou, Xu et al., 2008) is to formulate the density-based ramp
metering control as an output-tracking and disturbance-rejection problem; this approach
then employs an iterative learning algorithm along with the error-feedback method to
yield a robust metering rate.
In view of the myopic nature of local control, some researchers have devoted
tremendous efforts over the past decades to various coordinated metering strategies,
including cooperative ramp metering, competitive ramp metering, and integrated ramp
metering. An extensive summary of these strategies can be found elsewhere (Jacobson, et
al., 1989; Nihan, 1991; Bogenberger, 1999; Zhang, et al., 2001). The literature includes
some field experiments and extensive simulations of such strategies (Bogenberger, 1999).
The main control objective of a cooperative ramp metering system is to prevent
the formation of both freeway mainline congestion and ramp spillback by adjusting the
metering rate based on local traffic conditions and information about the spatial
distribution of traffic volume over the entire system. The helper ramp metering algorithm
by Lipp et al. (1991), which belongs to this category, consists of a local traffic-responsive
metering algorithm and a centralized, coordinated operational override feature. The local
responsive algorithm selects one of six predefined metering rates, based on each on-
ramp’s upstream mainline occupancy. If a meter rate reaches its critical status, the
coordinated control begins to exercise its override function. The linked-ramp algorithm
(Banks, 1993), another example in the same category, is based on the demand-capacity
concept and uses the upstream volume to determine the local metering rate.
Unlike the cooperative metering models, the core logic of competitive algorithms
involves computing two sets of metering rates based on both local and systemwide
conditions and then selecting the more restrictive one to implement. The bottleneck
algorithm (Jacobson, Henry et al., 1989) and the systemwide adaptive ramp metering
model (SWARM) (Paesani, Kerr et al., 1997; Ahn, Bertini et al., 2007) are two such
studies in this category.
The bottleneck algorithm uses upstream occupancy data and bottleneck data to
determine the metering rate for both a local ramp and the freeway bottleneck, and then
selects the more restrictive one. At the local level, it employs historical data to
approximate the volume-occupancy relationships around capacity for each ramp. The
12

local rate is set to be the difference between the estimated capacity and the measured
upstream volume. To obtain the bottleneck metering rate, the algorithm first identifies
bottlenecks and its volume reduction with the classical traffic flow theory, and then
computes the bottleneck metering rate by distributing the reduced volume to upstream
ramps with prespecified weights.
The SWARM algorithm also operates at two control levels. The local level
computes the metering rate based on the local density and its systemwide reduction from
ramps upstream of a critical bottleneck and then uses predetermined weights to distribute
the volume to the upstream ramps. The algorithm identifies the bottlenecks based on the
predicted, rather than measured, traffic conditions. Integrated ramp metering control
directly generates metering rates from systemwide information. METALINE, the fuzzy
local algorithm, and the coordinated artificial neural network algorithm belong to this
category.
METALINE (Papageorgiou, 1990), an extension of ALINEA, is theoretically
sound, but finding the proper control parameter matrices and the target occupancy vector
is difficult. Fuzzy logic algorithms (Sasaki and Akiyama, 1986; Chen, May et al., 1990;
Meldrum and Taylor, 1995; Taylor, Meldrum et al., 1998) convert empirical knowledge
about ramp control into fuzzy rules. The effectiveness of such control algorithms depends
on the accuracy of the embedded fuzzy rules derived from empirical data. The
coordinated artificial neural network algorithm (Wei and Wu, 1996) divides the freeway
segment under control into several zones and computes the metering rate based on the
collected volume-to-capacity ratios upstream and downstream of the ramp and the queue
length within each zone.
One common feature of all adaptive ramp metering algorithms is that they
explicitly specify an objective function, such as minimizing total travel time, maximizing
system throughput, etc., to govern the selection of metering rates for all ramps within the
control boundaries. The Hanshin algorithm by Yoshino et al. (1995) pioneered the use of
such algorithms. They employed a linear programming model to maximize the total
number of vehicles entering the system while preventing traffic congestion in any
segment of the expressway and the surrounding road networks. Lovell and Daganzo
(2000) proposed an improved time-dependent control strategy for freeway networks with
bottlenecks and a computationally efficient greedy heuristic algorithm for solving the
13

metering rate. Recognizing the complexity of model formulations and the difficulty in
obtaining real-time OD information, Zhang and Levinson (2004) formulated a similar
linear program that uses only variables directly measurable from detectors. Gomes and
Horowitz (2006) also presented a similar linear control model, but used the asymmetric
cell transmission method (ACTM) to minimize the total freeway travel time.
The dynamic metering control algorithm by Chen et al. (1997) represents another
cluster of studies. This algorithm generally consists of four operational elements: state
estimation, OD prediction, local metering control, and area-wide metering control. At
their core, such algorithms form a hierarchical structure with a local feedback control
module (ALINEA) and a systemwide control model. The latter employs a linear-
quadratic feedback control to produce nominal metering for local controllers, which then
compensate the nominal set of metering rates based on the detected local traffic
disturbances and prediction errors.
The linear-quadratic (LQ) feedback control algorithm is one of the most
commonly studied methods within the automatic control theory for coordinated freeway
ramp metering (Yuan and Kreer, 1971; Kaya, 1972; Papageorgiou, 1983; Payne, Brown
et al., 1985; Papageorgiou, Blosseville et al., 1990). The key logic of such LQ feedback
strategies is to convert the nonlinear traffic state equations around a certain desirable
trajectory, employing a quadratic penalty function in the objective function to represent
the state and control deviations from the desired trajectory.
The successive optimization algorithm represents another school of methods for
solving the ramp metering rates for large-scale networks. Chang et al. (1994) presented
such an algorithm to solve the complex control model that captures the dynamic
evolution of traffic with a two-segment linear flow-density relationship. An example of
such a model with a rolling time horizon for freeway corridors can be found in the
literature (Wu and Chang, 1999).
In summary, ramp metering is one of the most direct and efficient means to
mitigate freeway local congestion if appropriately implemented. The benefits include an
increase in freeway mainline throughput and a reduction in travel time or delay.
However, these are achieved at the cost of excessive on-ramp queues, which may spill
back and block neighboring urban arterials (Levinson and Zhang, 2006). To achieve
14

better performance for the entire corridor, the control boundaries should include both the
freeway and its neighboring arterials.
2.5 Arterial Traffic Signal Control Strategies
Signal control is an essential control strategy used to increase arterial capacity and
to mitigate daily congestion. Webster and Cobbe (1967) first introduced a formula to
optimize the signal timing plans for an isolated intersection. Building on Webster’s work,
some researchers later proposed pretimed signal control models that employed phase-
based strategies to optimize the splits, cycle length, and phasing in order to minimize the
total delay. Examples of such studies are SIGSET (Allsop, 1971) and SIGCAP (Allsop,
1976). SIGSET applied Webster’s nonlinear total delay function for undersaturated
conditions (1958) as the objective function and imposed some linear constraints on key
control parameters. SIGCAP is mainly used to minimize delay for multiple demand
patterns under the same constraints. A similar model, but using the binary-mixed-integer
programming method, also appeared later in the literature (Improta and Cantarella, 1984).
Some researchers have extended the core concept of SIGCAP to formulate a so-called
reserve capacity model (Wong and Yang, 1997; Wong, Wong et al., 2007).
All of the aforementioned example models are used only to control
undersaturated, isolated intersections, neglecting the interrelationships of traffic flow
evolution between intersections. Hence, optimizing the progression of all intersections in
the same arterial emerged as a popular research subject (Morgan and Little, 1964). One
pioneering study by Little et al. (1966; 1981) following this line of inquiry proposed the
use of mixed-integer linear programming. Their model, named MAXBAND, aimed to
provide the optimal set of offsets for all signals on the same arterial so as to maximize its
inbound and outbound progression bandwidths. This mixed-integer linear programming
model was solved with the traditional branch-and-bound algorithm; later, Chaudhary et
al. improved its efficiency (1991). Several researchers later extended this pioneering
arterial model to multiband phasing plans, including optimizing the left-turn phase
sequence (Chang et al., 1988), the weighted bandwidth for each directional road section
(Gartner et al., 1991; 1996), and the time-varying demand conditions (Han, 1996).
Instead of maximizing the progression band, TRANSYT (Robertson, 1969)
offered an alternative signal control objective of minimizing a performance index
consisting of prespecified MOEs, such as delay, number of stops, or queue length. This
15

signal design software is one of the most popular programs among both the research and
application communities, and its results are often used as the baseline for evaluating
various new signal control strategies (Papageorgiou, Diakaki et al., 2003). The core logic
of TRANSYT was used later in a responsive signal network control system, SCOOT
(Split, Cycle, Offset Optimization Technique) by Hunt et al. (1982).
Note that, due to the emergence of new sensor technologies and to the necessity
of responding to traffic conditions in real time, the focus of traffic control researchers has
evolved from optimizing pretimed arterial signals to developing real-time adaptive or
semi-adaptive systems. Some popular real-time signal control systems include: SCAT
(Sims and Dobinson, 1980), OPAC (Gartner, 1983), PRODYN (Henry, Farges et al.,
1984), CRONOS (Boillot, Blosseville et al., 1992), RHODES (Sen and Head, 1997), and
ARTC (Kim, Liu et al., 1993). The advent of intelligent transportation systems has turned
the design and implementation of these real-time control systems into a popular task.
Their effectiveness in contending with saturated traffic conditions and the resulting costs
and benefits, however, remain on-going research issues.
2.6 Signal Control Models for Oversaturated Conditions
Oversaturation refers to conditions where traffic queues persist from one cycle to
the next, due either to insufficient green splits or to lane-blockage. In such conditions,
traffic queues along signalized arterials may block upstream intersections, thus
exacerbating already congested conditions. Gazis et al. (1963) were the pioneer
researchers who employed a graphic method to optimize two closely spaced and
oversaturated intersections.
In 1997, Abu-Lebdeh and Benekohal (1997) developed an algorithm to optimize
the signal timing for oversaturated arterials with a queue polygon approach, which
assumed the existence of a continuous queue and a link blockage. They later extended
their proposed GA-based solution to include a disutility function for evaluating a variety
of traffic management scenarios (Abu-Lebdeh and Benekohal, 2000, 2003). Along the
same lines, Abu-Lebdeh, et al. (2007) further developed several models that could
capture the interactions of traffic streams between neighboring lanes and among
successive signals under oversaturated traffic demand levels.
In the same vein, Chang and Lin (2000) analyzed queue evolution at an isolated
intersection cycle by cycle, based on the assumptions of a constant arrival rate and the
16

continuous formation of the traffic queue. Their study employed two objective functions:
one, in a quadratic form, was for the delay of each cycle during the entire oversaturated
period; the other, a performance index, accounted for the total delay and stop penalty.
Chang and Sun (2004) later extended this model to optimize an oversaturated signalized
network.
Hadi and Wallace (1995) proposed an enhancement function to TRANSYT-7F
that could optimize signal-timing plans under congested conditions. TRANSYT-7F,
Release 8 (Li and Gan, 1999), also offers a function to model link spillback and lane
blockage by reducing the corresponding link saturation flow. For the same oversaturated
intersection, Park, Messer et al. (1999) employed the queue polygon method to compute
the queue delay and to track the link blockage by continually checking the end-of-queue
vehicle. They presented both a preliminary and an enhanced solution algorithms for
signal control at congested intersections based on the core logic of GAs (Park, Messer et
al., 2000).
17
CHAPTER 3: OVERALL SYSTEM FRAMEWORK
3.1 Introduction
This chapter presents the overall structure of the proposed integrated off-ramp
control system for managing recurrent congestion under various traffic conditions. This
chapter also illustrates the interrelationships between its principle components, along
with critical control factors and underlying assumptions.
The remaining sections of this chapter are organized as follows: Section 3.2
presents the major research issues and challenges involved in developing a system
capable of contending with recurrent congestion at urban freeway interchanges, including
off-ramp overflow, on-ramp queue spillback, and intersection lane blockage. Section 3.3
illustrates the control flowchart of the proposed integrated control system, based on the
research scope and intended applications. Finally, Section 3.4 discusses the proposed
functions for each principle control component and their operational interrelationships.
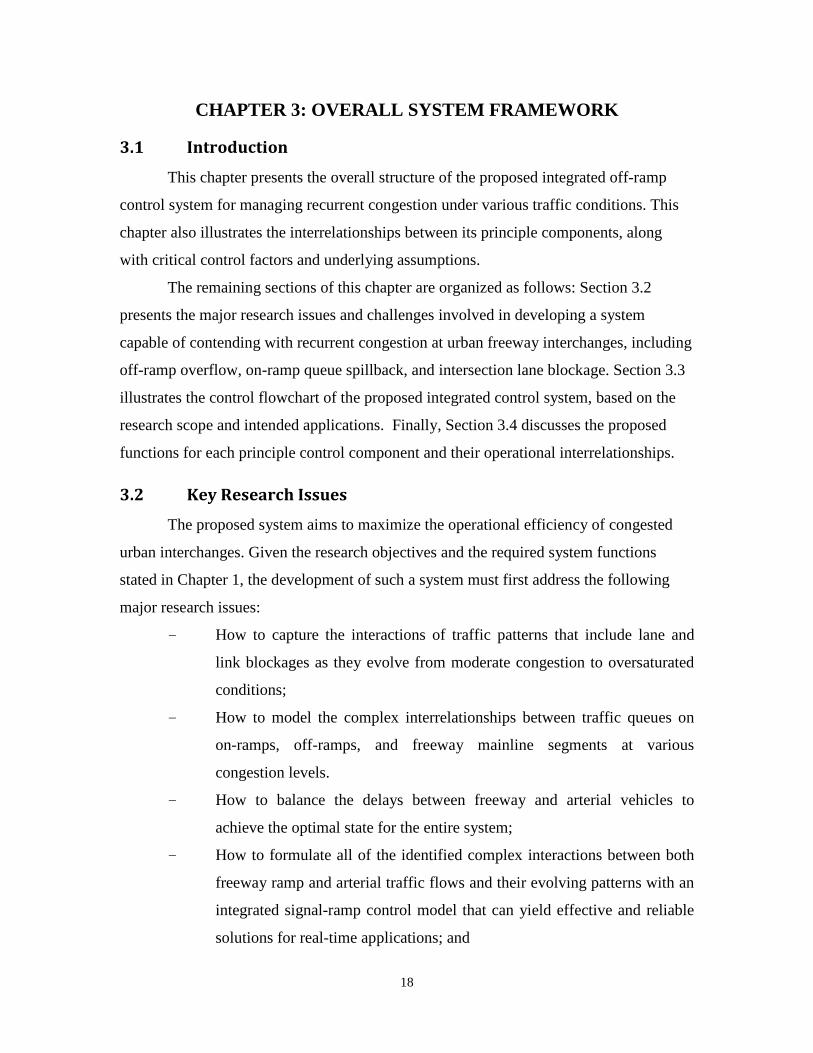
3.2 Key Research Issues
The proposed system aims to maximize the operational efficiency of congested
urban interchanges. Given the research objectives and the required system functions
stated in Chapter 1, the development of such a system must first address the following
major research issues:
— How to capture the interactions of traffic patterns that include lane and
link blockages as they evolve from moderate congestion to oversaturated
conditions;
— How to model the complex interrelationships between traffic queues on
on-ramps, off-ramps, and freeway mainline segments at various
congestion levels.
— How to balance the delays between freeway and arterial vehicles to
achieve the optimal state for the entire system;
— How to formulate all of the identified complex interactions between both
freeway ramp and arterial traffic flows and their evolving patterns with an
integrated signal-ramp control model that can yield effective and reliable
solutions for real-time applications; and
18

— How to contend with the occurrence of traffic measurement errors and still
yield robust solutions for field operations.
To handle the above issues, the research team divided the entire study into the
following tasks:
Task 1: Modeling the interrelationships between the off-ramp queue and lane
blockages at neighboring intersections, as well as on-ramp spillback at various congestion
levels. This task focused on contending with recurrent congestion patterns in which
saturated local traffic conditions may cause the formation of off-ramp queues without
affecting the operational capacity of the mainline segment.
Task 2: Formulating an integrated interchange control model that can account for
the trade-off between delays on local arterials and the freeway mainline, yielding optimal
systemwide congestion control. The proposed model is expected to concurrently optimize
the on-ramp and off-ramp metering plans, as well as signal timing plans for the adjacent
local arterials.
Task 3: Developing a generalized interchange control model to contend with
recurrent or nonrecurrent congestion scenarios where off-ramp queue may spill back into
the freeway mainline and interfere with the merging traffic flow from one or more
upstream ramps. This task tackled the severe congestion pattern where both the freeway
and local arterial are oversaturated and the off-ramp queue may significantly reduce the
mainline capacity, spilling back to upstream ramps.
Task 4: Designing efficient solution algorithms for both the base model for off-
ramp control and the extended model for integrated interchange system optimization. The
algorithm needs to be capable of generating efficient control parameters in response to
information deficiencies and dynamic traffic flow interactions between the freeway and
arterials at various congestion levels.
Task 5: Evaluating the effectiveness of the proposed system and its embedded
models with extensive numerical experiments and field tests. The primary focus of this
task was to ensure the applicability of the developed system to the target I-495
interchange, which often experiences off-ramp queue spillback during daily commuting
hours. Extensive numerical experiments were used, along with traffic scenarios observed
in the field, to assess the potential and constraints of implementing the integrated control
system under various traffic conditions.
19

3.3 System Control Structure and Key modules
To ensure that the results from each of the above tasks can be integrated into a
seamless control structure and can be activated based on the detected congestion level,
this study developed an overall control architecture for the proposed system with the
following three levels:
Level 1: The off-ramp queue spills back to the freeway mainline. The control
action for such a scenario will consider the mainline traffic delay in optimizing the signal
timings at the off-ramp and intersections on the neighboring arterial.
Level 2: The on-ramp queue spills back to its upstream intersection. Note that
insufficient metering rate may cause the queue vehicles to block one or more arterial
through lane(s), consequently causing the through traffic to spill back to upstream
intersections if the arterial through demand is larger than its remaining capacity. The
control strategy at this level will activate its oversaturated intersection module to
maximize the total throughput within the control boundaries.
Level 3: The freeway mainline in the interchange area experiences a moving
queue and spills back to the upstream interchange. This level of control is designed for
congested scenarios where both freeway and local arterial volumes at the interchange
have reached the saturation level. The on-ramp queue has spilled back to nearby arterial
through lanes, and the off-ramp vehicles have propagated to the freeway mainline lanes
and to an upstream on-ramp.
Due to the need to investigate the driver compliance behavior given multiple
detour routes in the Level-3 congested scenario, the study excluded its control strategy
development from the research scope, and focused on resolving all complex modeling
issues in Level-1 and Level-2 scenarios. Future field implementation results of the level-1
and level-2 control strategies can serve as the basis for developing the Level-3 control
methods.
20

Input
Off-ramp spillback?
Yes → Model 4: Integrated multi-interchange control (not included in this research)
No → Model 3: Integrated single interchange control
No → Model 2: Integrated off-ramp control
Yes → Model 1: Integrated on-ramp control
No → Do nothingYesFreeway Mainline
Spillback to upstream?
NoOn-ramp spillback?
YesOn-ramp spillback?
Figure 3-1 System Control Flowchart
Figure 3-1 illustrates the feedback process for the proposed integrated interchange
control operations, which takes traffic demand and the existing signal timings as inputs
and then executes the simulation model to check whether or not queue spillback is
occurring at on- and off-ramps.
On-ramp metering and arterial signals (including off-ramp signals) will be
operated independently if neither experiences any queue spillback. If queue spillback
occurs only at off-ramps, the system will execute the off-ramp integrated control model
to maximize system performance. Likewise, if only on-ramps exhibit excessive queues,
the proposed system should activate just the on-ramp control model to balance freeway
and arterial delays. All modules in the proposed integrated system will be activated if
both on-ramps and off-ramps are suffering from long queue spillbacks. The simulation
21

module also needs to check freeway mainline spillback and then execute the multi-
interchange model to coordinate all control plans activated at the two neighboring
interchanges.
Note that the entire system illustrated in Figure 3-2 requires various inputs for its
online operations, including
— Roadway geometric features, such as the number of ramps, the distance
between ramps and intersections, and the lengths of the left-turn bay, the
deceleration lane, and the on-ramp acceleration lane;
— Traffic volumes on the freeway’s mainline and ramps, as well as on the
arterials and their intersections;
— Turning proportions at both neighboring intersections and off-ramps;
— Operational constraints for signal timing and metering plans; and
— Traffic flow parameters that reflect local driving characteristics.
To provide the aforementioned operational functions in response to various levels
of saturated and oversaturated traffic congestion, the proposed integrated interchange
control system has the following modules: an arterial signal timing optimization module,
an off-ramp integrated control module, an on-ramp integrated control module, a single-
interchange integrated control module, and an extended interchange control module. The
interrelationships between those modules are illustrated in Figure 3-2.
Note that the arterial signal timing module aims to optimize the cycle length,
offset, and green split for all signals within the control boundaries under both under- and
oversaturated conditions. The proposed module has the capability to take into account the
blockage between lanes and spillback between intersections.
The off-ramp integrated control module will incorporate ramp queue delay and its
impact on freeway mainline traffic into the arterial signal timing module to ensure the
proper balance between these two roadway systems. The on-ramp integrated control
module extends the functions of the local arterial signal optimization module and
concurrently account for on-ramp flow delays in the systemwide signal control process.
All of the aforementioned modules with a prespecified overall control objective naturally
form the single-interchange integrated operational module.
22

The single interchange control system can be extended to cover multiple
interchanges if the freeway queue, due to both heavy mainline volume and off-ramp
spillback, reaches upstream on-ramps. Effectively controlling such congestion patterns,
however, is a much more complex problem. The performance of the entire traffic system
must be maximized from the corridor management perspective, and potential detour
routes might also require identification to balance the traffic volume between the primary
commuting freeway and alternative routes. Since the compliance of drivers with control
strategies and guidance information is one of the most critical issues determining the
effectiveness of corridor-level operational strategies, this study cannot cover this level of
development and will leave such an extension for a future project.
Figure 3-2 Key System Modules
Off-ramp integrated control
On-ramp spillback & capacity module
Multi-interchange integrated control
Freeway mainline spillback module
Link blockage module
Lane blockage module
Signal module
Off-ramp spillback module
On-ramp integrated control Single-interchange integrated control
Arterial signal timing optimization
23

CHAPTER 4: ARTERIAL TRAFFIC FLOW AND SIGNAL MODELS
4.1 Introduction
This chapter presents the methodology for modeling the complex traffic flow
interactions between intersections and the potential blockage between neighboring lanes
due to oversaturated demand. Its focus is on formulations for signal optimization and the
control process under different congestion levels. Since queue spillback and its resulting
blockage to through movements often occur on local arterials receiving off-ramp flows
from congested interchanges, the model formulations detailed in this chapter offer the
foundation for developing an integrated arterial signal optimization system that can take
full account of the channelization effects on turning traffic and also capture the
movement blockage between lanes.
The remaining sections of this chapter are organized as follows: Section 4.2 will
discuss the modeling methodology for arterial traffic dynamics under oversaturated
traffic conditions. Section 4.3 will focus on the signal optimization model and its
solution algorithm developed with the commonly-used Generic-Algorithm (GA). Section
4.4 will report the conclusions.
4.2 Modeling Traffic Flow Interactions at Signalized Intersections
To model the temporal and spatial interactions of traffic flows at a signalized
intersection, one can conceptually divide each link into the following four zones: the
merging, propagation, diverging and departure zones (see Figure 4-1). Vehicles entering
such a link will move over these four zones and then bound to their respective
destinations. Notably, vehicles for left-turn and through movements could block each
other due to spillback if the bay length and signal timings are not adequate for the time-
varying traffic volume. The traffic queue caused by lane-blockage could spill back to
upstream intersections under oversaturated traffic conditions.
24

Figure 4-1 The traffic dynamic of a signalized intersection approach
To optimize the signal plans for arterials experiencing lane-blockage conditions at
some intersections, the research team employed the Cell Transmission concept (CTM) by
Daganzo (1994, 1995b) to formulate the flow interactions in the above four zones. CTM
is a finite difference approximation of the traffic flow model by Lighthill and Whitham
(1955) and Richards (Richards 1956). Its core concept is to divide the target roadway into
a number of homogeneous sections (named cells), and each has its length equal to the
distance traveled by a vehicle at the free-flow speed during one unit time interval.
Any model developed with CTM can track the states of the traffic system at any
time instant by the number of vehicles in each cell, denoted as nit. In addition, CTM
employs the following commonly-used parameters in representing the key traffic flow
variables, where time t represents the time interval [t, t + 1]:
• Nit is the buffer capacity, defined as the maximum number of vehicles that can
be presented in cell at time , which is the product of cell length multiplied by
the jam density;
• Qit is the flow capacity in time t, defined as the maximum number of vehicles
that can flow into cell , which is the product of the cell’s saturated flow
multiplied by the length of time interval;
• yijt defines the number of vehicles leaving cell and entering cell at time t.
Any CTM model generally consists of three types of cells: the ordinary cell, the
merging cell, and the diverging cell. The ordinary cell can have only one upstream and
25

one downstream cells; the merging cell has multiple upstream cells but one downstream
cell; the diverging cell can have only one upstream cell but multiple downstream cells.
The following two expressions illustrate the recursive relationships between these three
types of cell:
𝑛𝑖𝑡+1 = 𝑛𝑖𝑡 + 𝑦𝑖,𝑖𝑛𝑡 + yi,outt (4-1)
𝑦𝑖,𝑖𝑛𝑡 = ∑ 𝑦𝑘𝑖𝑡 ,𝑘∈𝛤(𝑖) 𝑎𝑛𝑑 𝑦𝑖,𝑜𝑢𝑡𝑡 = ∑ 𝑦𝑖𝑗𝑡𝑗∈𝛤−(𝑖) (4-2)
Equation (4-1) represents the flow conservation relationship at the cell level,
which means that the number of vehicles within a cell in the next time interval equals the
vehicle number of this interval and the difference between all entering and departing
vehicles. The second and third terms in Equation (4-1) vary with the cell category, where
yijt needs to be computed with a traffic flow-density relationship.
To represent the complex traffic behavior such as lane-blockage, it is necessary to
track the vehicle number for each movement. Thus, this study employs the following
recursive relationship at the movement level for each cell, in additional to the flow
conservation at the cell level:
𝑛𝑖,𝑚𝑡+1 = 𝑛𝑖,𝑚𝑡 + 𝑦𝑖,𝑚,𝑖𝑛𝑡 − yi,m,out
t (4-3)
where 𝑛𝑖,𝑚𝑡 is the vehicle number for movement m of Cell 𝑖; 𝑦𝑖,𝑚,𝑖𝑛𝑡 is the number of
those vehicle that travel from upstream cell (i.e., Cell s) to Cell 𝑖 and will stay in the
movement 𝑚 of Cell I; and 𝑦𝑖,𝑚,𝑜𝑢𝑡𝑡 is the number of vehicles that depart from movement
m of Cell i.
4.2.1 Merging zone
In the merging zone, vehicles from different upstream approaches will join
together to form a new traffic stream. During oversaturated traffic conditions, the large
volume of vehicles from this aggregate traffic stream could cause long queue spillback
and thus block the upstream traffic as shown in Figure 4-2.
26

Figure 4-2 Link spillback blockage at the merging zone
The merging cell is best suited for modeling the traffic flow interactions in the
merging zone. As illustrated in Figure 4-3, Cell-C represents the merging zone; Cell-A,
Cell-B, Cell-D represent the upstream through, right-turn, and left-turn approaches. At
signalized intersections, since upstream vehicles will be given different priorities to enter
the merging zone based on the signal phasing plan, one can then use Equations (4-4) to
capture their relationships.
Figure 4-3 The merging zone represented by a merging cell
propagation diverging departuremerging
L
T
Left turn vehicle
Through vehicle
L LL
L LL
L
LL
T T T T
T T
T T T TT T
L
T
L
L T T T
T T
T T
C
B
yACt
A
yBCt
D
yDCt
propagationmerging
L
L
T T
L
T
L
L
……
……
……
……
L
T
Left turn vehicle
Through vehicle
27

𝑦𝑖𝐶𝑡 = min{𝑛𝑖𝑡,𝑄𝑖𝑡, 𝛿[𝑁𝐶 − 𝑛𝐶𝑡 ]}, 𝑖 = 𝐴,𝐵,𝐷 (4-4)
Where δ = 1, if nit ≤ Qit, and δ = w
v, if nit > Qi
t, in which w represents the
backward propagating speed of the disturbances and is the free-flow speed. When the
merging zone represented by Cell-C is full (i.e., the vehicle number in Cell-C, nct , equal
its buffer capacity, Nct), no vehicle can enter the merging zone (i.e., Nc
t − nct = 0 which
implies yiCt = 0).
Hence, with the given turning percentage from each movement, one can update
the number of vehicles for each movement during each time interval with the following
expression:
𝑦𝐶,𝑚,𝑖𝑛𝑡 = 𝑟𝑙𝑚𝑡 (�𝑦𝑖𝑐𝑡 )
𝑖
, 𝑖 = 𝐴,𝐵,𝐷 𝑓𝑜𝑟 𝑒𝑎𝑐ℎ 𝑚𝑜𝑣𝑒𝑚𝑒𝑛𝑡 𝑚 (4-5)
Where 𝑟𝑙𝑚𝑡 denotes the percentage of vehicles joining each movement; 𝑙,𝑚 represent the
link identity number and movement, respectively.
4.2.2 Propagation zone
In the propagation zone, the interactions between vehicles increase with the traffic
volume. From the aggregate perspective, the flow-density relationship can best represent
such interactions. Hence, to compute the optimal signal plan for an arterial, one needs to
realistically formulate the temporal and spatial relations of vehicles evolving over the link
between neighboring intersections.
28

Figure 4-4 The propagation zone represented with ordinary cells
To tackle this issue, this study employs the ordinary cell to capture this type of
vehicle interactions in the propagation zone. As illustrated in Figure 4-4, the number of
cells in the propagation zone may vary with the link length. Each ordinary cell has one
upstream cell and one downstream cell. Equation 4-6 computes the number of vehicles
exiting cell i and entering cell i+1 in time t, (yi,i+1t ), a simplified flow-density relationship
proposed by Daganzo (1956) to capture the traffic dynamics under various traffic
conditions.
𝑦𝑖,𝑜𝑢𝑡𝑡 = 𝑦𝑖+1,𝑖𝑛𝑡 = min{𝑛𝑖𝑡,𝑄𝑖𝑡, 𝛿[𝑁𝑖+1 − 𝑛𝑖+1𝑡 ]} (4-6)
If one defines Sit(= min{Qit, nit}) as the sending capacity, and
Rit(= min{Qi
t, δ(Nit − nit)}) as the receiving capacity of cell i, then Equation (4-6)
naturally evolves to Equation (4-7).
𝑦𝑖,𝑖+1𝑡 = min{𝑆𝑖𝑡,𝑅𝑖+1𝑡 } (4-7)
𝑦𝑖,𝑚,𝑜𝑢𝑡𝑡 = 𝑦𝑖,𝑜𝑢𝑡𝑡 ×
𝑛𝑖,𝑚𝑡
𝑛𝑖𝑡 𝑓𝑜𝑟 𝑒𝑎𝑐ℎ 𝑚𝑜𝑣𝑒𝑚𝑒𝑛𝑡 𝑚 (4-8)
propagation diverging departuremerging
Nit, ni
t, QitNi-1
t, ni-1t, Qi-1
t
Cell i-1 Cell i
yi-1,it
yi,i+1t…
…
yi-1,it
L
T
Left turn vehicle
Through vehicle
T
L
LL
L TT
T
T
T
T
29

4.2.3 Diverging zone – a new set of formulations
In the diverging zone, vehicles bound to different destinations may have to join
different queues in order to be at their target movements. Hence, under oversaturated
conditions, it is likely to incur blockage between different movements due to queue
spillback in some movements. For instance, depending on the bay length and its
incoming volume, the left-turn queue could spill back to block the through traffic.
Note that although there are several different types of lane blockage at an
oversaturated intersection, the presentation hereafter will focus only on the formulations
for interaction between left-turn and through vehicles. One can apply the identical
concept to model all other types of blockage between lanes. Figure 4-5 and Figure 4-6
show two possible types of blockage between left-turn and through lanes at an
intersection.
Figure 4-5 Left-turn vehicles block through traffic
Figure 4-6 Through vehicles block left-turn traffic
propagation diverging departure
L T TL
L L
LL
L
T
Left turn vehicle
Through vehicle
L T TL L
LT T
T T T
propagation diverging departure
L T T
L L
L
L
T
Left turn vehicle
Through vehicle
L T T
LT T
T T T
T
T T T
T
30

Figure 4-7 The sub-cell concept illustration
To realistically capture these two types of queue and lane blockage effect on
neighboring movements, this study proposes a sub-cell modeling concept, an
enhancement to the existing CTM methodology. Figure 4-7 illustrates the use of the
proposed sub-cell concept to the diverging zone link that consists of a diverging cell, Cell
i+1, which has two sub-cells: sub-cell L for left-turning vehicles and sub-cell T for
through traffic.
Figure 4-8 The sub-cell representation of a diverging signalized cell
propagation diverging departure
L T T
L L
L
L
T
Left turn vehicle
Through vehicle
L T T
LT T
T T T
T
T T T
T T T
L L
T T
Cell L:Sub-cell for left turn
Cell T: Sub-cell for ThroughNi
t, nit, Qi
t
Cell i
yi,i+1t…
Cell i+1
……
…
propagation diverging departure
Through: N2t
Left-turn: N1t
Shared: N3t
Sub-Cell L: NLt = N1
t+N3t
Sub-Cell T : NTt = N2
t+N3t
Cell i+1: Nl+1t = N1
t+N3t+N3
t
yi,i+1t
31

Figure 4-8 illustrates the use of three sub-zones to model the vehicle interactions
in the diverging zone, where Zone 1, denoted by N1t , is the space exclusively for left-turn
traffic; Zone 2, N2t , is the space only for through traffic; and Zone 3, N3
t , is the space to
share by left-turn and through traffic. Equations (4-9) and (4-10) presented below are for
computing the buffer capacity of each sub-cell:
𝑁𝐿𝑡 = 𝑁1𝑡 + 𝑁3𝑡 (4-9)
𝑁𝑇𝑡 = 𝑁2𝑡 + 𝑁3𝑡 (4-10)
𝑁𝑖+1𝑡 = 𝑁1𝑡 + 𝑁2𝑡 + 𝑁3𝑡 (4-11)
Equation (4-11) captures the physical buffer capacity of diverging cell i+1. Note that one
can divide these zones based on the channelization at the signalized approach. The buffer
capacity of these sub cells explicitly reflects the turning bay effect. One can compute the
flow capacity of each sub-cell, based on its number of lanes and the saturation flow rate.
Based on the above definitions, the study presents the following linear
programming formulations to represent the time-varying status of such sub-cells:
𝑚𝑎𝑥�𝑦𝑖,𝑚,𝑜𝑢𝑡𝑡
𝑚
(4-12)
∑𝑦𝑖,𝑚,𝑜𝑢𝑡𝑡 ≤ 𝑅𝑖+1𝑡 (4-13)
𝑦𝑖,𝑚,𝑜𝑢𝑡𝑡 ≤ 𝛿(𝑁𝑖,𝑚𝑡 − 𝑛𝑖+1,𝑚
𝑡 ) (4-14)
∑𝑦𝑖,𝑚,𝑜𝑢𝑡𝑡 ≤ 𝑆𝑖𝑡 (4-15)
𝑦𝑖,𝑚,𝑜𝑢𝑡𝑡 ≤ 𝑆𝑖𝑡 ×
𝑛𝑖,𝑚𝑡
𝑛𝑖𝑡 (4-16)
𝑦𝑖,𝑚,𝑜𝑢𝑡𝑡 ≤ 𝑄𝑖,𝑚𝑡 (4-17)
Equation (4-12) assumes that drivers always intend to fully utilize the available
capacity and space. For instance, as shown in Figure 4-9, when the left-turn queue
spillback occurs, the coming left-turn vehicles will inevitably occupy all the shared zone
space if the volume continues to increase.
32

Figure 4-9 An illustration of left-turn queue blocking through traffic
The new diverging model developed in this research can explicitly reflect the
effect of the turning bay, and capture some lane blockage relations with Equations (4-12),
(4-13), and (4-17). The third term in the parenthesis of Equation (4-12) is the minimum
of these three terms, which implies wit = RL
t /rLt . By substituting it into Equations (4-13)
and (4-17), it leads to the following results: yiLt = RLt and yiTt = RL
t × rTt /rLt . If RLt
decreases, yiLt and yiTt will also decrease. When RLt = 0, it indicates that left-turn vehicles
have blocked through traffic completely. In the scenario of through blocking left-turn
traffic, one can perform the same analysis to formulate their relationships.
The segment in the departure zone is modeled with a signalized cell, and its flow
capacity 𝑄𝑖𝑡 is defined as follows:
𝑄𝑖𝑡 = Qi,max git (4-18)
where git is the green time in time interval t.
4.2.4 An optimization model for oversaturated arterial signals
Objective functions
Depending on the traffic conditions, one can set the control objective function as
maximizing the total system throughput or minimizing the total delay. Using the above
formulations, this study has set the objective function of maximizing the system
throughput as follows:
𝑀𝑎𝑥 (𝑇ℎ𝑟𝑜𝑢𝑔ℎ𝑝𝑢𝑡 = �� � 𝑦ij𝑡
𝑖∈Γ−(𝑗)𝑗∈𝑆
𝑇
𝑡=0
) (4-19)
propagation diverging departure
L
T
Left turn vehicle
Through vehicleLLLL
LLLL
L L L L
TT
T TTT
T L
33

where S is the sink cell set; Γ−(𝑗) is the upstream cell set of cell j; and T is total
operating time period.
In CTM, the length of each cell is set to be the free-flow travel distance over a
pre-specified unit, which means that the vehicles at each unit time in each cell can either
stay or move to the downstream cells. Hence, one can approximate the delay as the
difference between a vehicle’s actual and its free-flow travel times over a given distance.
For instance, if some vehicles staying in the same cell over n consecutive unit intervals,
then it implies that they have experienced n unit delay times.
More specifically, one can define the delay over each cell for time interval t
as dit = �nit−1 − ∑ yijtj∈Γ(i) � × τ, where Γ(i) is the downstream cell set of cell i and is
the time period length. Thus, one can formulate an alternative objective function of
minimizing the total system delay as follows:
𝑀𝑖𝑛 [𝑡𝑜𝑡𝑎𝑙 𝑑𝑒𝑙𝑎𝑦 = 𝜏��(𝑛𝑖𝑡 − � 𝑦𝑖𝑗𝑡
𝑗∈Γ(𝑖)𝑖
𝑇
𝑡=0
] (4-20)
As is a constant, the objective function of minimizing the system delay is
identical to the follow expression:
𝑀𝑖𝑛 [𝑡𝑜𝑡𝑎𝑙 𝑑𝑒𝑙𝑎𝑦 = ��(𝑛𝑖𝑡 − � 𝑦𝑖𝑗𝑡
𝑗∈Γ(𝑖)𝑖
𝑇
𝑡=0
] (4-21)
Signal timing operation
Figure 4-10 illustrates a typical four-leg intersection and the NEMA (National
Electrical Manufacturers Association) eight-phase structure, where the right-turn on red
is assumed to be permitted.
Using the NEMA phase system has two advantages: (1) it can model all possible
phases for a signal by switching the sequence of some provided phases (see Figure 4-10);
and (2) it offers the flexibility to accommodate exclusive left-turning traffic with the
leading-lagging phases. Hence, through the sixteen NEMA phases, one can find the
optimal one from all possible combinations of the candidate signal phasing plans.
34

Figure 4-10 NEMA eight-phase signal timing structure
The following equations illustrate the two-ring eight-phase structure:
𝑔𝑘1 + 𝑔𝑘2 = 𝑔𝑘5 + 𝑔𝑘6 (4-22)
𝑔𝑘3 + 𝑔𝑘4 = 𝑔𝑘7 + 𝑔𝑘8 (4-23)
𝑔𝑘1 + 𝑔𝑘2 + 𝑔𝑘3 + 𝑔𝑘4 = 𝐶𝑘 (4-24)
𝐶𝑘 = 𝐶/2ℎ𝑘 (4-25)
ℎ𝑘 = �1, 𝑠𝑖𝑔𝑛𝑎𝑙 𝑘 ℎ𝑎𝑠 ℎ𝑎𝑙𝑓 𝑐𝑜𝑚𝑚𝑜𝑛 𝑐𝑦𝑐𝑙𝑒 𝑙𝑒𝑛𝑔𝑡ℎ0, 𝑜𝑡ℎ𝑒𝑟𝑤𝑖𝑠𝑒 (4-26)
𝑔𝑘𝑗 ≥ 𝑀𝐺𝑘𝑗 , 𝑗 = 1, … , 8 (4-27)
𝑀𝑖𝑛𝐶 ≤ 𝐶𝑘 ≤ 𝑀𝑎𝑥𝐶 (4-28)
0 ≤ 𝑜𝑓𝑓𝑠𝑒𝑡𝑘 < 𝐶𝑘 (4-29)
𝑔𝑘𝑗,𝐶𝑘, 𝑜𝑓𝑓𝑠𝑒𝑡𝑘 𝑎𝑟𝑒 𝑖𝑛𝑡𝑒𝑔𝑒𝑟𝑠 (4-30)
Where, gkj is the green time for Phase j of signal k, Ck is the cycle length of
signal k; MGkj is the minimum green time of signal k at phase j; MinC is the minimum
cycle length; MaxC is the maximum cycle length; C is the common signal cycle length;
hk is a binary variable that indicates whether signal k has a half common cycle length or
not based the relation defined by Equation (4-26); and offsetk represents the offset of
2Ring 1
Ring 2
16
5
7
2
38
41 3 4
5 6 7 8
barrier barrier barrier
Ring 1
Ring 2
1 2 3 4
5 6 7 8
barrier barrier barrier
1
2
… …
35

signal k. Equations (4-22) and (4-23) indicate the existence of the signal barrier.
Equations (4-24) and (4-25) enforce the cycle length constraints. Equation (4-27)
confines the green time of each phase to be less than its minimal green time; and
Equation (4-28) specifies a user-defined minimal and maximal cycle lengths. Equation
(4-29) requires that the offset of signal k lie between 0 and its cycle length.
To compute the green time for each interval t of the departure cell, it is essential
to convert the green time of each phase as follows:
𝐺𝑘0 = 𝐺𝑘4 = 0; 𝐺𝑘𝑖 = �𝑔𝑘𝑗 ,𝑖−1
𝑗=0
𝑓𝑜𝑟 𝑖 = 1, 2, 3 (4-31)
𝐺𝑘𝑖 = �𝑔𝑘𝑗
𝑖−1
𝑗=4
,𝑓𝑜𝑟 𝑖 = 5, 6,7 (4-32)
Where 𝐺𝑘𝑖 is the total green time in the signal cycle illustrated in Figure 4-10.
4.3 Solution Algorithm
In the proposed system and its embedded models, the decision variables are the
cycle length, green time split, and the offset of each signal. Due to the nature of those
decision variables this study employed a Genetic-Algorithm (GA)-based solution method
for the proposed model. GA is a search technique that has been successfully applied to
optimize signal timings under various traffic conditions (Daganzo 1995b). To speed up
the computing process of convergence, this study applied the elitist selection method to
optimize all decision variables (Ceylan 2006; Ceylan and Bell 2004; Lo and Chow 2004;
Park et al. 1999; Zhou et al. 2007).
The most critical part of developing a GA-based algorithm is to derive a good
encoding scheme, i.e., how to represent possible solutions of the target problem by a gene
series of 0-1 bits. This study employed an encoding scheme which includes the
constraints (4-22) to (4-30), i.e., the signal timing decoded from the scheme will be
feasible to constraints (4-22) to (4-30). The fraction-based decoding scheme, based on the
NEMA phase’s structure proposed by Park, Messer et al. (1994) can satisfy all those
36

constraints except Equation (4-25). Hence, this study has grounded on their work, and
extended its schema with the half common cycle length for certain signals.
Figure 4-11 An enhanced fraction-based decoding scheme for signal design
A detailed description of the original scheme can be found in the literature. As
illustrated in Figure 4-11, the proposed scheme sets the cycle length of signal k to half of
a common cycle length if the half-cycle binary variable, 𝐼𝑘, is 1. Otherwise, the cycle
length is set to be the full common cycle length.
4.4 Conclusions
This study presented an enhanced Cell-Transmission Model for optimizing signal
plans at intersections along a congested arterial. The proposed model with its innovative
sub-cell modeling methodology is capable of capturing traffic flow interactions between
neighboring lane groups due to queue spillback under high volume conditions. The
arterial signal optimization model reported in the chapter can optimize the cycle length,
split, and offset, under the presence of the link and lane group blockages.
0 MinC C MaxC
C=MinC + (MaxC-MinC) X f1
Ck = C / 2Ik
MGk1 MGk2 MGk3 MGk4
MGk5 MGk6 MGk7 MGk8
Pk1 = max(MGk1+MGk2, MGk5+MGk6) + [Ck – max(MGk1+MGk2, MGk5+MGk6) - max(MGk3+MGk4, MGk7+MGk8) ]X f2
Pk1 Pk2=Ck – Pk1
gk1 gk2=Pk1-gk1 gk3 gk4=Pk2-gk3
gk5 gk7
gk1=MGk1+(Pk1-MGk1-MGk2)xf3 gk3=MGk2+(Pk2-MGk3-MGk4)xf4
gk5=MGk5+(Pk1-MGk5-MGk6)xf5 gk7=MGk7+(Pk2-MGk7-MGk8)xf6
gk6=Pk1-gk5 gk8=Pk2-gk7
Offsetk=Ck X f8
37

CHAPTER 5: AN INTEGRATED INTERCHANGE CONTROL MODEL
5.1 Introduction
This chapter presents an integrated optimal control model that grounds on the
arterial signal optimization model, but extends its formulations to capture the impact of
off-ramp queue spillback to the freeway mainline at the interchange. The proposed
interchange control model includes the freeway mainline traffic delays caused directly
and indirectly by the moving queue at the off-ramp, and thus allows traffic engineers to
assess the tradeoff between the freeway and its neighboring arterial delays under various
traffic conditions.
Figure 5-1 illustrates a signalized interchange, which includes two closely spaced
signals and two on- and two off-ramps. The distance between these two signals typically
ranges from 500 ft in urban areas to 800 ft in suburbs. The short distance between these
two intersections for receiving freeway traffic offers a very limited queue storage
capacity, and thus often causes queue spillback between them under oversaturated
conditions. For instance, insufficient signal timing for the off-ramp at intersection-2 may
cause its queue to spill back to the rightmost lane of the freeway mainline segment, and
consequently increase its lane-changing density in the traffic flow. Conversely,
inadequate green duration for the arterial through traffic could create a link blockage
between two intersections. Thus, it is essential to have an integrated control system that
can best allocate the signal timings for all control points under various congestion levels
from the perspective of the system optimization.
38

Figure 5-1 Graphical illustration of a signalized interchange
This chapter hereafter focuses on illustrating the formulation of a freeway model
and its integration with the optimal arterial signal model presented in the previous chapter.
The developed freeway traffic model aims to capture the following two types of complex
traffic flow interrelationships: (1) the impacts of arterial traffic volume on the off-ramp
queue length; and (2) the spillback of ramp queue vehicles on the delay and operational
capacity of its neighboring freeway travel lanes.
The remaining sections of this chapter are organized as follows. Section 5.2
presents the core logic of the freeway traffic flow model. Section 5.3 illustrates the
mathematical formulations for complex interactions between traffic flows and the model
solution algorithm. Section 5.4 summarizes the concluding comments.
5.2 Modeling Methodology for Freeways
Figure 5-2 illustrates a typical freeway mainline that consists of two different
segments, named Type-A and Type-B. Vehicles in the Type-A segment can head to
either the downstream freeway mainline or the off-ramp, where all vehicles in the Type-B
segment will move only to the downstream mainline segment.
Freeway
E
E
E
EE
T T
Exiting vehicleThrough vehicle
E
T
Right-turn vehicleR
Left-turn vehicleL
T T
T
T T
T
T
T
T
T T
T T
T E
ET
T
1 signal
39
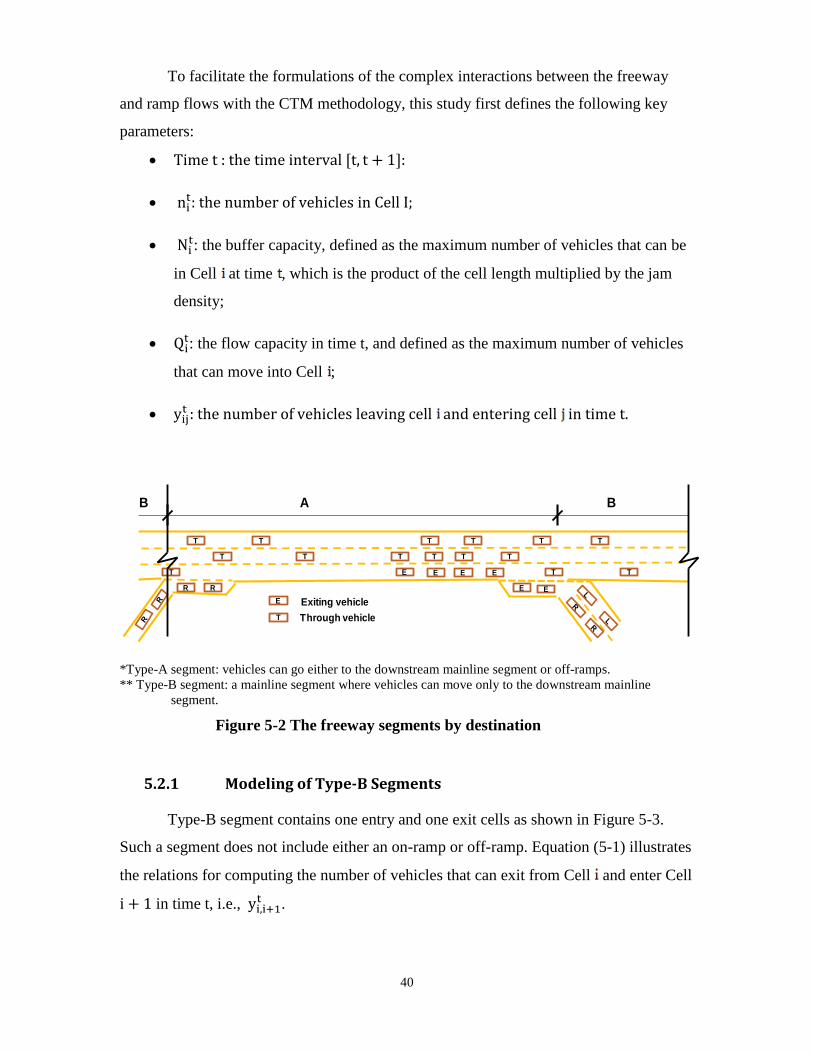
To facilitate the formulations of the complex interactions between the freeway
and ramp flows with the CTM methodology, this study first defines the following key
parameters:
• Time t : the time interval [t, t + 1]:
• nit: the number of vehicles in Cell I;
• Nit: the buffer capacity, defined as the maximum number of vehicles that can be
in Cell at time , which is the product of the cell length multiplied by the jam
density;
• Qit: the flow capacity in time t, and defined as the maximum number of vehicles
that can move into Cell ;
• yijt : the number of vehicles leaving cell and entering cell in time t.
*Type-A segment: vehicles can go either to the downstream mainline segment or off-ramps. ** Type-B segment: a mainline segment where vehicles can move only to the downstream mainline
segment.
Figure 5-2 The freeway segments by destination
5.2.1 Modeling of Type-B Segments
Type-B segment contains one entry and one exit cells as shown in Figure 5-3.
Such a segment does not include either an on-ramp or off-ramp. Equation (5-1) illustrates
the relations for computing the number of vehicles that can exit from Cell and enter Cell
i + 1 in time t, i.e., yi,i+1t .
EE
EE
T
T
Exiting vehicleThrough vehicle
E
T
EE
T TT
TT T
T
T
T
T
TT
R R
T
A BB
40

𝑦𝑖,𝑖+1𝑡 = min{𝑛𝑖𝑡,𝑄𝑖𝑡, 𝛿[𝑁𝑖+1 − 𝑛𝑖+1𝑡 ]} (5-1)
Where 𝛿 = 1, 𝑖𝑓 𝑛𝑖𝑡 ≤ 𝑄𝑖𝑡, and 𝛿 = 𝑤𝑣
, 𝑖𝑓 𝑛𝑖𝑡 > 𝑄𝑖𝑡, in which 𝑤 represents the disturbances
propagate backward speed, and 𝑣 is the free-flow speed. Type-A is a two-stream section
where vehicles in the traffic flow can come from either two origins or move toward two
destinations.
Let 𝑆𝑖𝑡(= min{𝑄𝑖𝑡,𝑛𝑖𝑡}) be the sending capacity, and 𝑅𝑖𝑡 = min {𝑄𝑖𝑡,𝛿(𝑁𝑖𝑡 − 𝑛𝑖𝑡)}
as the receiving capacity of Cell 𝑖, then one can rewrite Equation (5-1) as follows:
𝑦𝑖,𝑖+1𝑡 = min{𝑆𝑖𝑡,𝑅𝑖+1𝑡 } (5-2)
*one-stream section: all vehicles have the same origin and destination (Type-B segment). ** two-stream section: vehicles in the traffic flow come from either two origins or move toward two destinations (Type-A segment).
Figure 5-3 Modeling the traffic flow interactions in a Type-B segment by CTM
Equation (5-3) represents the flow conservation relationship in the cell level,
implying that the vehicle number of a cell in the next time interval equals the number of
vehicles present in this interval and all entering vehicles but subtracting all leaving
vehicles.
EE
T T
Exiting vehicleThrough vehicle
ET
E
T T
T
T
T
T
Two-stream section
R R
Two-stream sectionone-stream section
Nit, ni
t, QitNi-1
t, ni-1t, Qi-1
t
Cell i-1 Cell i
yi-1,it
yi,i+1t…
…
41

𝑛𝑖𝑡+1 = 𝑛𝑖𝑡 + 𝑦𝑖−1,𝑖𝑡 − 𝑦𝑖,𝑖+1𝑡 (5-3)
5.2.2 Modeling of Type-A Segments
To model Type-A freeway segment (see Figure 5-4), it is necessary to add one
additional state variable, nE,it , and track the exiting number of vehicles with the following
expression:
𝑦𝐸,𝑖,𝑖+1𝑡 = min {𝛾𝐸,𝑖
𝑡 × min{𝑛𝑖𝑡,𝑄𝑖𝑡, 𝛿(𝑁𝑖+1 − 𝑛𝑖+1𝑡 )} ,𝑁𝐸,𝑖+1𝑡 − 𝑛𝐸,𝑖+1
𝑡 } (5-4)
Where 𝑦𝐸,𝑖,𝑖+1𝑡 denotes the exit number of vehicles from Cell i to Cell i+1; 𝑟𝐸,𝑖
𝑡 is the
exiting percentage of vehicles in Cell i for time interval t, which can be computed as
𝛾𝐸,𝑖𝑡 = 𝑛𝐸,𝑖
𝑡 /𝑛𝑖𝑡; 𝑁𝐸,𝑖+1𝑡 is the buffer capacity for exiting traffic, i.e., the maximum number
of exiting vehicles that can stay in cell i.
Figure 5-4 Modeling of the two-stream interaction in a Type-A segment by cell
𝑦𝑖,𝑖+1𝑡 = �1 − 𝛾𝐸,𝑖𝑡 � × 𝑚𝑖𝑛{𝑛𝑖𝑡 ,𝑄𝑖𝑡, 𝛿[𝑁𝑖+1 − 𝑛𝑖+1𝑡 ]} + 𝑦𝐸,𝑖,𝑖+1
𝑡 (5-5)
Equation (5-5) determines the total vehicle number from Cell i+1 to its
downstream cell (Cell i). The underlying assumption is that the two different traffic
streams are well mixed.
𝑛𝐸,𝑖𝑡+1 = 𝑛𝐸,𝑖
𝑡 + 𝑦𝐸,𝑖−1,𝑖𝑡 − 𝑦𝐸,𝑖,𝑖+1
𝑡 (5-6)
Exiting vehicleThrough vehicle
E
T
Nit, ni
t, Qit ,
nTh,it , nE,i
tNi-1
t, ni-1t, Qi-1
t , nTh, i-1
t , nE, i-1t
Cell i-1 Cell i
yi-1,it yi,i+1
t……
EE
EE
T
T
EE
T TT
TT T
T
T
T
T
TT
R R
T
Two-stream section One-streamOne-stream
yE,i-1,it
42

Equation (5-3) illustrates the flow conservation relationship within each two-stream cell.
In addition, Equation (5-6) also represents the conservation law of the exiting flows if
without queue.
Figure 5-5 Type-A segment traffic dynamics
As shown in Figure 5-5, one can further divide the Type-A segment into merging
zone, propagation zone and diverging zone. Among these three zones, the propagation
zone can be represented with the ordinary two-stream cells to capture the traffic
dynamics. The modeling methodologies for merging zone and diverging zone are
presented below.
Merging zone
As illustrated in Figure 5-6, one can use a merging cell (Cell C) to represent the
merging zone, which consists of one entry cell for the upstream freeway segment and the
other for the on-ramp. As the on-ramp traffic should yield to the freeway mainline flow,
it is natural to determine the mainline entry volume (yBCt ) first, and then the on-ramp
entry volume after updating the merging cell vehicle number nct by adding the entry
vehicle number from the upstream freeway mainline cell (yACt ). Therefore, one can use
Equations (5-7) and (5-8) to determine the entry flow from upstream freeway mainline
and on-ramp.
EE
EE
T
T
EE
T TT
TT T
T
T
T
T
T
T
propagation divergingmerging
R R
T
Exiting vehicleThrough vehicle
ET
Two-stream section One-streamOne-stream
E
43

𝑦𝐴𝐶𝑡 = min{𝑛𝐴𝑡 ,𝑄𝐴𝑡 ,𝛿[𝑁𝐶 − 𝑛𝐶𝑡 ]} (5-7)
𝑦𝐵𝐶𝑡 = min{𝑛𝐵𝑡 ,𝑄𝐵𝑡 , 𝛿[𝑁𝐶 − 𝑛𝐶𝑡 − 𝑦𝐴𝐶𝑡 ]} (5-8)
𝑦𝐸,𝑖𝐶𝑡 = 𝑦𝑖𝐶𝑡 × 𝜉𝐸𝑡 , 𝑖 = 𝐴,𝐵 (5-9)
Where 𝜉𝐸𝑡 is the predetermined exiting volume percentage of the downstream freeways
segment at time interval t.
Figure 5-6 On-ramp traffic characteristics
The entry capacity of on-ramp, QBt , is determined by the traffic dynamics in the
merging zone as shown in Figure 5-6. The length of the acceleration lane and the traffic
stream characteristics in the adjacent freeway lane are the two primary factors that may
affect QBt . In this study, QB
t is determined with Equation (5-10).
𝑄𝐵𝑡 = (𝑄𝐴𝑡 − 𝑦𝐴𝐶𝑡 ) × 𝑝𝐶𝑡 (5-10)
Where 𝑝𝐶𝑡 is the vehicle proportion which is on the right-most lane at time interval t.
Equation (5-10) assumes that the on-ramp traffic could take all the remaining capacity of
the right-most freeway lane.
merging area
merging zone
yACt
yBCt
NAt, nA
t, QAt NC
t, nCt, QC
t , nTh, C
t , nE, Ct
Cell A:upstream freeway mainline Cell C:merging cell…
…
44

Diverging zone
Under congested conditions, it is quite often that the off-ramp queue could spill
back to the upstream freeway mainline, and occupy one or two through lanes. Also, the
speed of the neighboring mainline lanes may also be reduced due to a high frequency of
lane-changing maneuvers.
Figure 5-7 Exiting-queue effect in a diverging zone
To reflect the impact of such complex flow interactions on the freeway mainline
capacity, one can model the diverging zone with a diverging cell (named Cell A) and let
its two downstream cells (Cell B and Cell C) represent the downstream off-ramp and
freeway mainline segment, respectively (see Figure 5-8). The diverging zone under the
proposed methodology consists of three sub-areas, denoted as TH, TE, and E. In sub-
zone TH, all vehicles will head to the downstream mainline, whereas vehicles in sub-
zone E will exit mainly to the adjacent off-ramp. In contrast, both through and exiting
vehicles can share the space in sub-zone TE.
Figure 5-8 illustrates the concept of modeling each diverging cell with two sub-
cells (Sub-cell TH and Sub-cell E) to represent its two different outgoing traffic streams.
One can thus approximate the buffer capacity of Sub-cell TH, denoted as NTht , with the
equation NTht = N1
t + N2t . Likewise, the buffer capacity of Sub-cell E, denoted as NE
t , is
equal to the sum of N2t + N3
t , where N1, N2 and N3 are the maximum number of vehicles
that can stay in each sub-zone.
divergingpropagation
Slow down area
Exiting queue
E
T
E E E E E E E E E
E E E E E
E
T
T
T
T
T
T
T
T
T
T
T
T
T
T
T
T
TT
Exiting vehicleThrough vehicle
E
T
E E
45
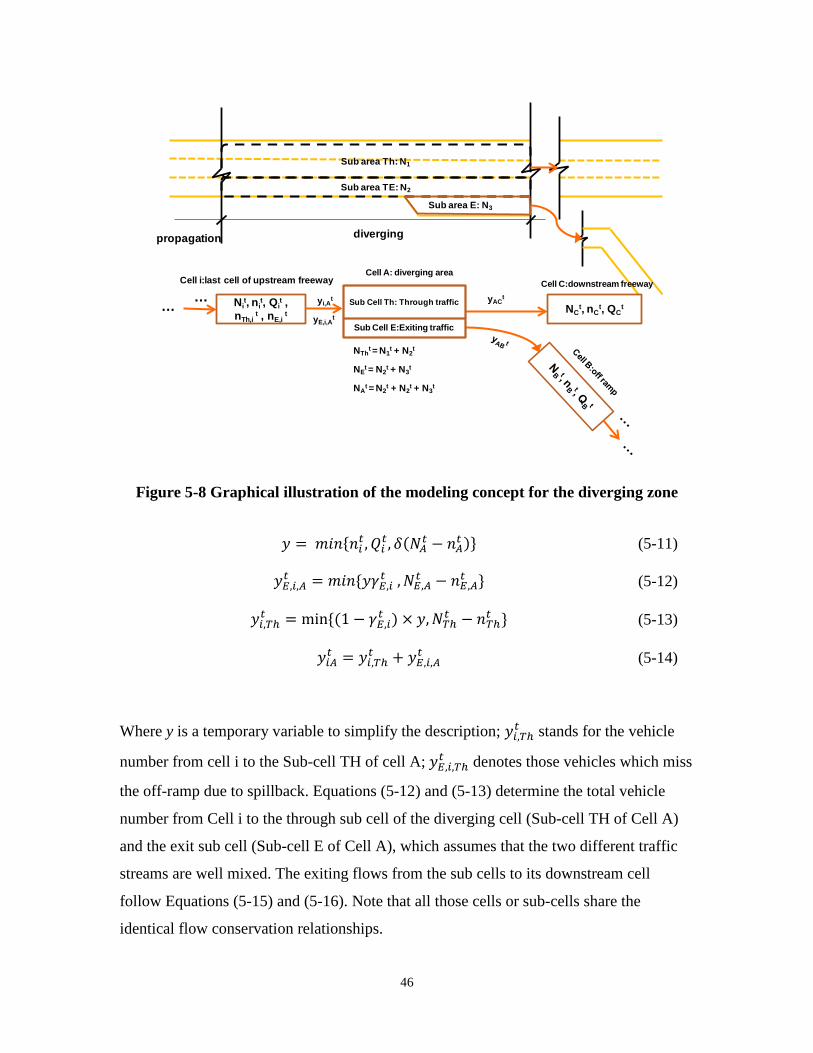
Figure 5-8 Graphical illustration of the modeling concept for the diverging zone
𝑦 = 𝑚𝑖𝑛{𝑛𝑖𝑡,𝑄𝑖𝑡, 𝛿(𝑁𝐴𝑡 − 𝑛𝐴𝑡 )} (5-11)
𝑦𝐸,𝑖,𝐴𝑡 = 𝑚𝑖𝑛 {𝑦𝛾𝐸,𝑖
𝑡 ,𝑁𝐸,𝐴𝑡 − 𝑛𝐸,𝐴
𝑡 } (5-12)
𝑦𝑖,𝑇ℎ𝑡 = min {(1 − 𝛾𝐸,𝑖𝑡 ) × 𝑦,𝑁𝑇ℎ𝑡 − 𝑛𝑇ℎ𝑡 } (5-13)
𝑦𝑖𝐴𝑡 = 𝑦𝑖,𝑇ℎ𝑡 + 𝑦𝐸,𝑖,𝐴𝑡 (5-14)
Where y is a temporary variable to simplify the description; 𝑦𝑖,𝑇ℎ𝑡 stands for the vehicle
number from cell i to the Sub-cell TH of cell A; 𝑦𝐸,𝑖,𝑇ℎ𝑡 denotes those vehicles which miss
the off-ramp due to spillback. Equations (5-12) and (5-13) determine the total vehicle
number from Cell i to the through sub cell of the diverging cell (Sub-cell TH of Cell A)
and the exit sub cell (Sub-cell E of Cell A), which assumes that the two different traffic
streams are well mixed. The exiting flows from the sub cells to its downstream cell
follow Equations (5-15) and (5-16). Note that all those cells or sub-cells share the
identical flow conservation relationships.
divergingpropagation
Sub area Th: N1
yACt
NCt, nC
t, QCt
Cell A: diverging areaCell C:downstream freeway
… … Sub Cell Th: Through traffic
Sub Cell E:Exiting traffic
Sub area TE: N2
Sub area E: N3
NTht = N1
t + N2t
NEt = N2
t + N3t
NAt = N2
t + N2t + N3
t
Nit, ni
t, Qit ,
nTh,it , nE,i
t
Cell i:last cell of upstream freeway
yi,At
yE,i,At
46

𝑦𝐴𝐶𝑡 = 𝑚𝑖𝑛{𝑛𝑇ℎ𝑡 ,𝑄𝑇ℎ𝑡 ,𝛿(𝑁𝐶𝑡 − 𝑛𝐶𝑡 )} (5-15)
𝑦𝐴𝐵𝑡 = 𝑚𝑖𝑛{𝑛𝐸𝑡 ,𝑄𝐸𝑡 , 𝛿(𝑁𝐵𝑡 − 𝑛𝐵𝑡 )} (5-16)
The saturated flow rate of the exiting sub-cell (sub-cell E) is clearly equal to the
off-ramp saturated flow rate. However, computing the saturated flow rate for the through
sub-cell (Sub-cell TH) is relatively complex. As mentioned previously, when the exiting
queue from an off-ramp spills back to the freeway mainline, some length of mainline
lanes neighboring to the off-ramp will become a slow-speed zone due to the
rubbernecking and lane-changing effects. Equation 5-17 illustrates such an impact and
the interrelationships between all contributing variables:
𝑄𝑇ℎ𝑡 = 𝑄𝐴 × �1 − 𝐿𝐴,𝐸
𝐿𝐴� × [1 − 𝛼𝐴 ×
𝑛𝐸,𝐴𝑡
𝑁𝐸,𝐴𝑡 ] (5-17 )
Where 𝐿𝐴,𝐸 𝑖𝑠 the number of lanes occupied by the exiting queue; 𝐿𝐴 is total lane number
of the freeway mainline; 𝑄𝐴 × (1 − 𝐿𝐴,𝐸/𝐿𝐴) is the capacity of the unblocked through
lane(s); 𝛼𝐴 is the maximal saturated flow deduction proportion, which is the reduced
percentage of capacity when the exiting vehicles occupy all available buffer space of the
freeway; 𝑛𝐸,𝐴𝑡 /𝑁𝐸,𝐴
𝑡 is the proportion of the exiting buffer capacity occupied by the
exiting vehicles. Equation (5-17 ) assumes that the through saturated flow rate equals the
capacity of remaining though lane(s) subjected to a reduction factor that increases with
the exit queue length.
5.3 An integrated single-interchange control model
Objective function
Depending on the traffic conditions, one can set the control objective to maximize
the total system throughput or minimize the total delay. With the above cell-based
formulations, the objective function of maximizing the system throughput can be
expressed as follows:
𝑀𝑎𝑥 (𝑇ℎ𝑟𝑜𝑢𝑔ℎ𝑝𝑢𝑡 = �� � 𝑦ij𝑡
𝑖∈Γ−(𝑗)𝑗∈𝑆
𝑇
𝑡=1
) (5-18)
47
Where S is the sink cell set, Γ−(𝑗) is the upstream cell set of cell j, and T is total
operating time period.
As mentioned in Chapter 4, the length of each cell is set to be the free-flow travel
distance during a pre-specified time unit, which implies that vehicles in each cell can
either stay or move to the downstream cells during each time interval. Hence, one can
approximate the delay as the difference between a vehicle’s actual travel time and its
free-flow travel time over a given travel distance. For instance, if some vehicles staying
in the same cell over n consecutive unit intervals, then it implies that they all have
experienced the delay of n unit times. More specifically, one can define the delay for
each cell for time interval t as dit = �nit−1 − ∑ yijtj∈Γ(i) �τ, where Γ(i) is the downstream
cell set of Cell i and is the length of one time unit. The alternative objective function of
minimizing the total system delay can be expressed as follows:
𝑀𝑖𝑛 �𝑡𝑜𝑡𝑎𝑙 𝑑𝑒𝑙𝑎𝑦 = 𝜏�� � �𝑛𝑖𝑡 − 𝑦𝑖𝑗𝑡 �𝑗∈Γ(𝑖)𝑖
𝑇
𝑡=1
� (5-19)
As 𝜏 is a constant, the minimal system delay objective function can further be stated as:
𝑀𝑖𝑛 𝑍 = �� � �𝑛𝑖𝑡 − 𝑦𝑖𝑗𝑡 �𝑗∈Γ(𝑖)𝑖
𝑇
𝑡=1
(5-20)
The formulations for signal control and the solution algorithm are identical to
those presented in Chapter 4, except the inclusion of freeway related constraints.
5.4 Conclusions
This chapter presented an interchange integrated control model with the Cell-
Transmission concept. The developed formulations reflect the complex interactions
between ramp queue and mainline vehicles in the merging, propagation, and diverging
zones at a typical freeway interchange. By integrating the arterial signal models with the
freeway formulations, one can operate the ramp and signal control plan from the
perspective of optimizing the efficiency of the entire interchange, including the tradeoff
48

between freeway and arterial delays. Due to the embedded relations for capturing the
queue spillback impacts on neighboring traffic flow movements, the proposed
interchange model is able to generate the optimal control strategies for oversaturated
traffic conditions during congested peak commuting hours.
49

CHAPTER 6: EXPERIMENTAL ANALYSES
6.1 Introduction
This chapter presents the experimental results with the proposed arterial and off-
ramp control models using field data from a congested interchange on the I-495 Capital
Beltway. The performance evaluation first focuses on the delay and throughput of the
entire arterial within the control boundaries, and then compares the tradeoff between
freeway and arterial delays that take into account the ramp queue impacts on the freeway
mainline traffic. To assess the effectiveness of all developed models, this chapter also
presents their comparison results with TRANSYT-7F, one of the state-of-the-art software
for arterial signal optimization.
The remaining sections of this chapter is organized as follows: Section 6.2
describes the target interchange on the I-495 Capital Beltway for experimental design,
including its geometric features, traffic demand patterns, and selected measures of
effectiveness (MOE) for performance comparison. Section 6.3 reports the evaluation
results for the arterial signal optimization model and its performance comparison with
TRANSYT-7F. Section 6.4 analyzes the effectiveness of the interchange control model
for concurrent minimization of both the freeway and intersection delays within the
control boundaries.
6.2 Experimental Design
Figure 6-1 shows the network configuration of the interchange between the
Capital Beltway (I-495) and Georgia Avenue (MD97), including four signalized
intersections from Forest Glen Road (MD192) to Seminary Road, and four major
congested highway segments: I-495 Outer Loop (I-495 OL), I-495 Inner Loop (I-495 IL),
MD 97 Southbound (MD 97 SB), and MD 97 Northbound (MD97 NB).
50

Figure 6-1 Graphical illustration of the target interchange
Parameters for the solution algorithm
All experimental scenarios in Table 6-1 employ the specially-designed GA
algorithm to compute the parameters for the optimal systemwide control. Each
experimental scenario also applies TRANSYT-7F (Release 10), one of the most advanced
signal optimization programs for both research and practice, to generate the alternate set
of control parameters. To be on the same basis for comparison, this study selected the
same GA algorithm embedded in TRANSYT-7F to all experimental scenarios, and also
used the same set of parameters such as 200 generations with a population size of 50, the
crossover probability of 0.3, and a mutation probability of 0.01. The widely used
corridor simulation program, CORSIM, was used to simulate all traffic scenarios listed in
each experiment, and generated their MOEs under the optimal control strategies produced
by TRANSYT-7F and the signal control model developed in this study.
51

6.3 Experimental Results of the Arterial Signal Optimization Model
Control boundaries
Figure 6-2 illustrates the control boundaries in each experimental scenario, which
includes four intersection signals and two arterial segments of MD97 Southbound (SB)
and MD97 Northbound (NB).
Figure 6-2 Control boundaries of the case study for arterial signal optimization
Traffic demand patterns
Table 6-1 summarizes the distribution of volume data for performing the
numerical experiments and analyses, based on the day–to-day variation of field data from
each entry and exit within the control boundaries. Note that the volume used in the
experimental scenarios is increased at the rate of 10 percent from the low, medium, and
high levels, based on the field data. Figure 6-2 shows each key location within the control
boundaries.
D f2
4
1
2
579vph
983vph
3484vph
324vph
2715vph
543vph
31200vph
350
1123 vph
934vph
650vph
700 vph
B
A
C
D
E F
G
H
MD9
7 N
B
MD97 SB
MD9
7 N
B
MD97 SB
52

Table 6-1 Demand scenarios for arterial signal optimization model (vehicle per hour)
Entrance Movements Demand Scenario Low Medium* High
A Through 3,044 3,382 3,720 Right 101 112 123
B Left 40 44 48
Through 91 101 111 Right 161 179 197
C Left 536 596 656
Through 306 340 374 Right 42 47 52
D Left 284 315 347 Right 204 227 250
E Right 1,080 1,200 1,320 F Right 315 350 385
G Left 498 553 608 Right 23 25 28
H Through 2,444 2,715 2,987 Total ----- 9,167 10,186 11,204
*The field-measured AM peak volume
Overall system performance comparison
Table 6-2 summarizes the MOEs of each experimental scenario under two
candidate control strategies for the low, medium, and high demand scenarios defined in
Table 6-1. All MOEs were the average of 50 simulation runs over the duration of one
hour with CORSIM. The selected MOEs from simulation output include: network-wide
total delay and system throughput. The results presented in Table 6-2 indicate that the
arterial optimization model developed from this study outperforms TRANSYT-7F under
all scenarios at the system level.
53

Table 6-2 Overall model performance comparison
Demand Scenarios
Simulation Results from CORSIM (One hour)
The
Proposed
Model
TRANSY
T-7F
Improvement
* Improvement
* (%) Improvement
(95% CI*)
Low
Total Delay (vehicle-hour) 122.34 178.50 56.16 31% [28.8,83.5] Total Throughput (vehicle) 9107.36 8990.10 117.26 1% [54.5, 180.0]
Med
ium
Total Delay (vehicle-hour) 174.20 276.01 101.81 37% [68.6,135.1]
Total Throughput (vehicle) 10047.50 9870.52 176.98 2% [78.1, 275.8]
Hig
h Total Delay (vehicle-hour) 259.11 426.14 167.03 39% [135.7,198.3] Total Throughput (vehicle) 10846.28 10192.18 654.10 6% [567.7, 740.5]
* Delay improvement = TRANSYT-7F Delay – The Proposed Model Delay Throughput improvement = The Proposed Model Throughput - TRANSYT-7F Throughput Delay Improvement (%) = (TRANSYT-7F Delay – The Proposed Model Delay) / the Proposed Model Delay × 100% Throughput Improvement (%) = (The Proposed Model Throughput - TRANSYT-7F Throughput) / TRANSYT-7F Throughput × 100%
C.I. = confidence Interval
For example, at the high congestion level, the target set of arterial intersections
with the signal optimization model yields a total delay of 259 vehicle-hours, about 39
percent less than if using TRANSYT-7F. The same range of improvement also exists at
the low and medium volume levels as shown in Table 6-2. The 95% confidence intervals
for each scenario also confirms that the improvements are statistically significant, and
increase with the congestion level or the total volume entering the control boundaries.
The overall results seem to imply that the proposed arterial model with its explicit
consideration of queue spillback and lane-blockage due to overflow is especially
applicable for optimizing signals under congested conditions.
Table 6-3 presents the delay incurred at those four intersections on MD 97 within
the control boundaries. Based on the improvement at the local arterial, it is clear that the
proposed signal control model, in comparison with TRANSYT-7F, can better redistribute
the delays among all intersections, and significantly reduce the queue at the most
congested location at the modest cost of other less congested intersections at the
relatively low demand level. Similar redistribution patterns also exist among all
intersections at the medium and high demand levels. As discussed previously, this is
likely due to the fact that the signal control model takes into account the possible queue
54

spillback at all congested intersection approaches, and offers sufficient signal timings to
accommodate such flow patterns that in turn prevent the queue formation and
propagation to its upstream links.
At the arterial level, the signal control model yields a significantly lower total
delay than TRANSYT-7F for MD 97 southbound (SB), a highly congested segment. The
performance of these two models for MD 97 Northbound, however, are comparable
because its volume is relatively low, and does not to cause any lane blockage or queue
spillback.
In summary, the arterial signal optimization model developed from this study
clearly outperforms the state-of-the-art program, TRANSYT-7F, at all different demand
levels for the congested I-495/Georgia Avenue interchange, regardless of the total delay
or system throughput. The mechanism embedded in the proposed model to capture the
delay caused by blockage between lanes and queue spillback has proved its effectiveness
in redistributing the delays from the most congested one to the remaining intersections,
thereby minimizing the likelihood of having local bottlenecks at all demand levels.
55

Table 6-3 Total delay comparison by intersection (vehicle minutes)
Demand Scenarios
Simulation Results from CORSIM (One hour)
The Proposed Model
TRANSYT
-7F Improvement*
Improvement
* (%) Improvement (95% confidence interval)
Low
Intersection 1 2242.41 6112.78 3870.37 63% [5483.4, 2257.4] Intersection 2 588.20 443.24 -144.95 -33% [-109.1, -180.8] Intersection 3 1815.50 1703.63 -111.87 -7% [-32.1, -191.7] Intersection 4 1235.07 1064.19 -170.88 -16% [-67.5, -274.2] MD 97 SB
3951.1 7207.9 3256.8 45% [1668.9, 4844.7] MD 97 NB 1475.1 1637.7 162.6 10% [101.4, 223.7]
Med
ium
Intersection 1 3771.26 9376.52 5605.26 60% [7742.7, 3467.9] Intersection 2 537.45 640.41 102.97 16% [161.3, 44.6] Intersection 3 1992.82 2183.95 191.13 9% [277.0, 105.2] Intersection 4 2318.74 1960.66 -358.09 -18% [-221.3, -494.8]
MD 97 SB 4261.0 11943.5 7682.5 64% [5843.2, 9521.8] MD 97 NB 2011.0 2010.3 -0.7 -0% [-84.7, 83.3]
Hig
h
Intersection 1 5967.06 16664.37 10697.31 64% [12008.3, 9386.3] Intersection 2 964.92 895.53 -69.39 -8% [284.9, -423.7] Intersection 3 2992.88 2779.33 -213.55 -8% [57.8, -484.9] Intersection 4 2689.92 2590.17 -99.75 -4% [-8.0, -191.5]
MD 97 SB 6671.8 17109.8 10438.0 61% [8845.1, 12031.0] MD 97 NB 2854.6 2961.3 106.7 4% [-73.4, 286.9]
* Delay improvement = TRANSYT-7F Delay – The Proposed Model Delay Delay Improvement (%) = (TRANSYT-7F Delay – The Proposed Model Delay) / the Proposed Model Delay × 100% C.I. = confidence Interval
56

6.4 Results of the Integrated Interchange Control Model
Control boundaries
Figure 6-3 illustrates the boundaries of the integrated interchange control model,
including four arterial signals and two freeway segments (i.e., I-495WB and I-495EB).
Figure 6-3 A graphical illustration of the example interchange
Traffic demand patterns
Table 6-4 presents the volume for each control points based on the field data, and
Table 6-5 defines the demand from Ramp-H for analyzing its impact on the overall
system performance.
I495 OL
4
1
2
3
B
A
C
DE
F
G
I495 LL
MD9
7 N
B
MD97 SB
IJ
H
L K MN
57

Table 6-4 Basic demand for entrances and ramps (vehicle per hour)
Entrance Movements Demand Ramp Movements Demand
A Through 3,382
H
Right 670
Right 112
Left 930
B Left
44 Total
1600
Through 101 I Enter
825
Right 179 J Enter
1402
C Left
596 K Enter 829
Through 340 L Exit
1179
Right 47 M Exit
299
D Through 7025 N Enter
654
E Through 6879
F Left
553
Right
25
G Through 2,715
Total ----- 21998
Table 6-5 Experimental scenarios (vehicle per hour)
Entrance Movements Exit Volume Scenario (H Ramp) Low Medium High
Ram
p
H Right 586 670 754 Left 814 930 1046 Total 1400 1600 1800
Table 6-6 Overall model performance comparison
Demand
Scenarios MOEs
Simulation Results from CORSIM (One hour)
ICIC* TY7F* Improvement* Improvement *
(%) Improvement
(95% CI*)
Low
Total Delay (vehicle-
hour) 545.6 617.1 71.4 12% [33.2, 109.6] Total Throughput
(vehicle) 20591 20473 117 1% [-67, 302]
Medium
Total Delay (vehicle-
hour) 542.8 931.5 388.7 42% [336.3, 441.0] Total Throughput
(vehicle) 20735 18098 2637 15% [2295, 2979]
High
Total Delay (vehicle-
hour) 455.9 943.2 487.3 52% [402.4, 572.2] Total Throughput
(vehicle) 20887 19057 1831 10% [1241, 2421] * ICIC: the proposed Interchange Integrated Control Model
TY7F: TRANSYT-7F Delay improvement = TRANSYT-7F Delay – The Proposed Model Delay
Throughput improvement = The Proposed Model Throughput - TRANSYT-7F Throughput Delay Improvement (%) = (TRANSYT-7F Delay – The Proposed Model Delay) / the Proposed Model Delay × 100%
58
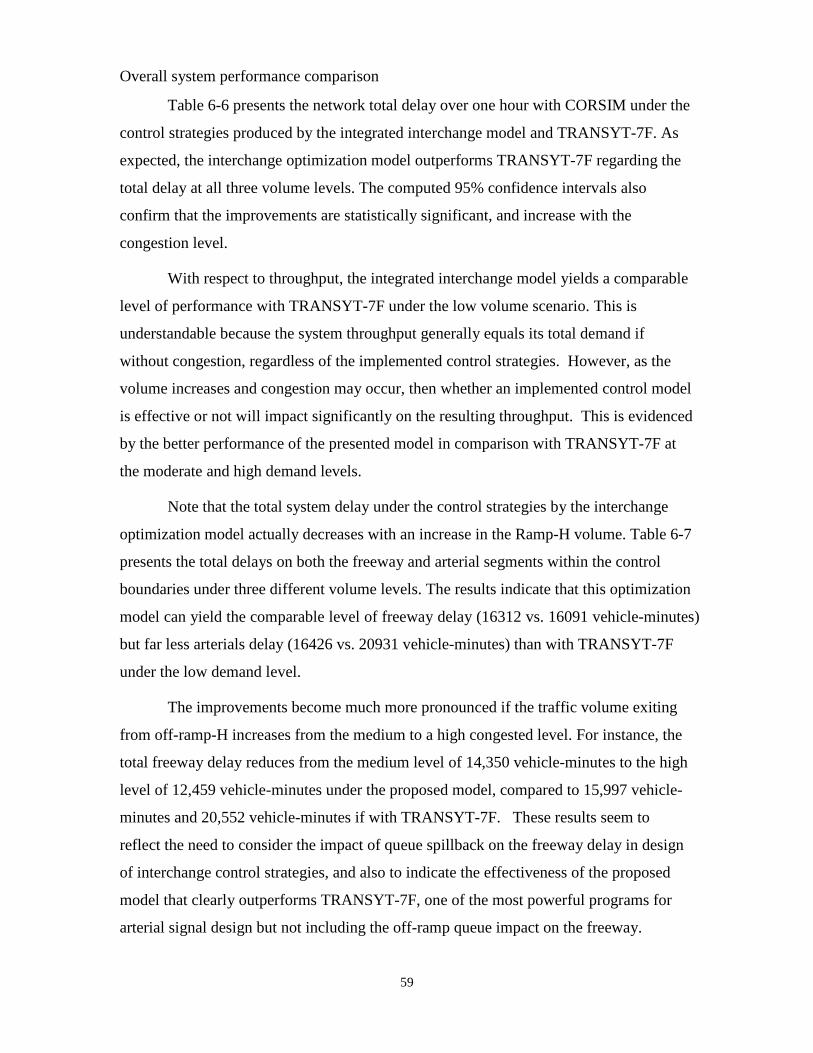
Overall system performance comparison
Table 6-6 presents the network total delay over one hour with CORSIM under the
control strategies produced by the integrated interchange model and TRANSYT-7F. As
expected, the interchange optimization model outperforms TRANSYT-7F regarding the
total delay at all three volume levels. The computed 95% confidence intervals also
confirm that the improvements are statistically significant, and increase with the
congestion level.
With respect to throughput, the integrated interchange model yields a comparable
level of performance with TRANSYT-7F under the low volume scenario. This is
understandable because the system throughput generally equals its total demand if
without congestion, regardless of the implemented control strategies. However, as the
volume increases and congestion may occur, then whether an implemented control model
is effective or not will impact significantly on the resulting throughput. This is evidenced
by the better performance of the presented model in comparison with TRANSYT-7F at
the moderate and high demand levels.
Note that the total system delay under the control strategies by the interchange
optimization model actually decreases with an increase in the Ramp-H volume. Table 6-7
presents the total delays on both the freeway and arterial segments within the control
boundaries under three different volume levels. The results indicate that this optimization
model can yield the comparable level of freeway delay (16312 vs. 16091 vehicle-minutes)
but far less arterials delay (16426 vs. 20931 vehicle-minutes) than with TRANSYT-7F
under the low demand level.
The improvements become much more pronounced if the traffic volume exiting
from off-ramp-H increases from the medium to a high congested level. For instance, the
total freeway delay reduces from the medium level of 14,350 vehicle-minutes to the high
level of 12,459 vehicle-minutes under the proposed model, compared to 15,997 vehicle-
minutes and 20,552 vehicle-minutes if with TRANSYT-7F. These results seem to
reflect the need to consider the impact of queue spillback on the freeway delay in design
of interchange control strategies, and also to indicate the effectiveness of the proposed
model that clearly outperforms TRANSYT-7F, one of the most powerful programs for
arterial signal design but not including the off-ramp queue impact on the freeway.
59
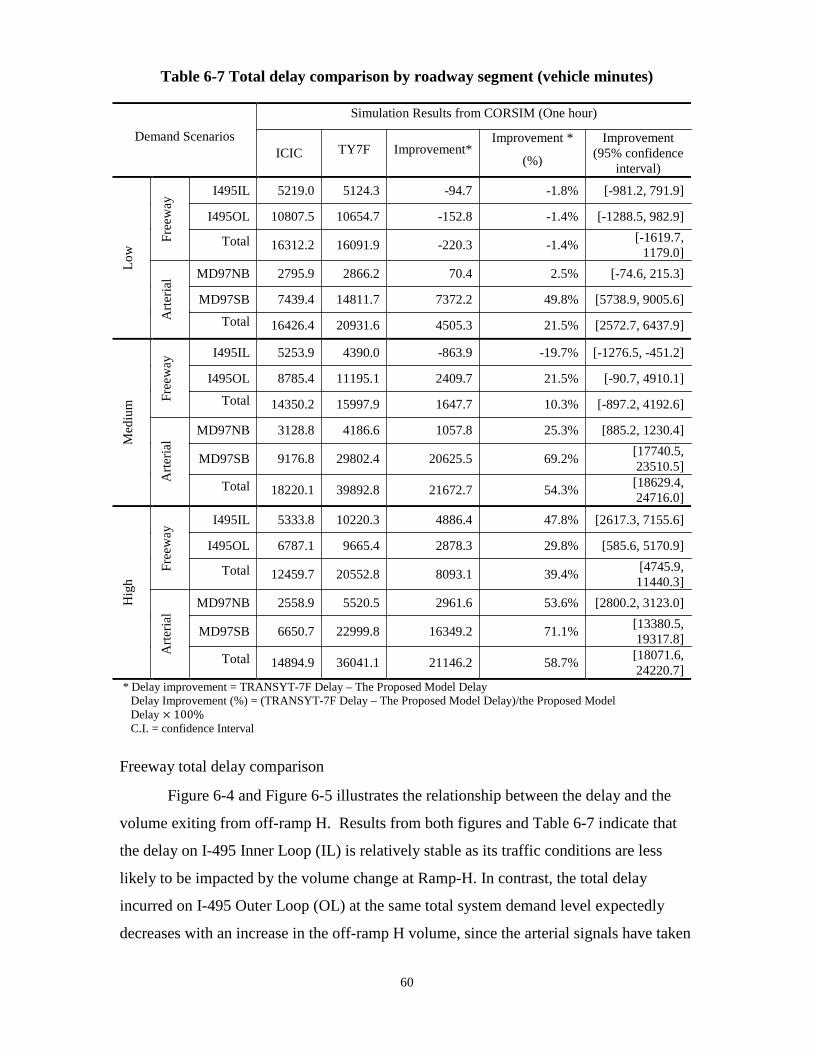
Table 6-7 Total delay comparison by roadway segment (vehicle minutes)
Demand Scenarios
Simulation Results from CORSIM (One hour)
ICIC TY7F Improvement* Improvement *
(%)
Improvement (95% confidence
interval)
Low
Free
way
I495IL 5219.0 5124.3 -94.7 -1.8% [-981.2, 791.9]
I495OL 10807.5 10654.7 -152.8 -1.4% [-1288.5, 982.9]
Total 16312.2 16091.9 -220.3 -1.4% [-1619.7, 1179.0]
Arte
rial MD97NB 2795.9 2866.2 70.4 2.5% [-74.6, 215.3]
MD97SB 7439.4 14811.7 7372.2 49.8% [5738.9, 9005.6]
Total 16426.4 20931.6 4505.3 21.5% [2572.7, 6437.9]
Med
ium
Free
way
I495IL 5253.9 4390.0 -863.9 -19.7% [-1276.5, -451.2]
I495OL 8785.4 11195.1 2409.7 21.5% [-90.7, 4910.1]
Total 14350.2 15997.9 1647.7 10.3% [-897.2, 4192.6]
Arte
rial
MD97NB 3128.8 4186.6 1057.8 25.3% [885.2, 1230.4]
MD97SB 9176.8 29802.4 20625.5 69.2% [17740.5, 23510.5]
Total 18220.1 39892.8 21672.7 54.3% [18629.4, 24716.0]
Hig
h
Free
way
I495IL 5333.8 10220.3 4886.4 47.8% [2617.3, 7155.6]
I495OL 6787.1 9665.4 2878.3 29.8% [585.6, 5170.9]
Total 12459.7 20552.8 8093.1 39.4% [4745.9, 11440.3]
Arte
rial
MD97NB 2558.9 5520.5 2961.6 53.6% [2800.2, 3123.0]
MD97SB 6650.7 22999.8 16349.2 71.1% [13380.5, 19317.8]
Total 14894.9 36041.1 21146.2 58.7% [18071.6, 24220.7]
* Delay improvement = TRANSYT-7F Delay – The Proposed Model Delay Delay Improvement (%) = (TRANSYT-7F Delay – The Proposed Model Delay)/the Proposed Model Delay × 100% C.I. = confidence Interval
Freeway total delay comparison
Figure 6-4 and Figure 6-5 illustrates the relationship between the delay and the
volume exiting from off-ramp H. Results from both figures and Table 6-7 indicate that
the delay on I-495 Inner Loop (IL) is relatively stable as its traffic conditions are less
likely to be impacted by the volume change at Ramp-H. In contrast, the total delay
incurred on I-495 Outer Loop (OL) at the same total system demand level expectedly
decreases with an increase in the off-ramp H volume, since the arterial signals have taken
60
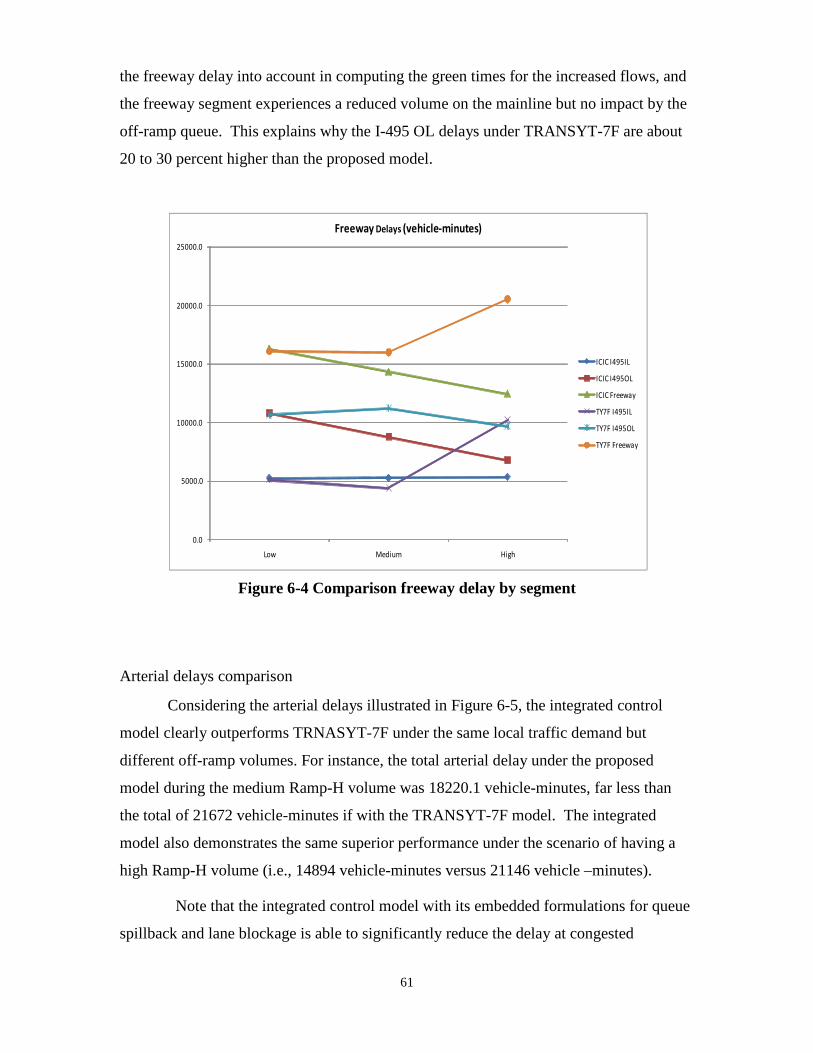
the freeway delay into account in computing the green times for the increased flows, and
the freeway segment experiences a reduced volume on the mainline but no impact by the
off-ramp queue. This explains why the I-495 OL delays under TRANSYT-7F are about
20 to 30 percent higher than the proposed model.
Figure 6-4 Comparison freeway delay by segment
Arterial delays comparison
Considering the arterial delays illustrated in Figure 6-5, the integrated control
model clearly outperforms TRNASYT-7F under the same local traffic demand but
different off-ramp volumes. For instance, the total arterial delay under the proposed
model during the medium Ramp-H volume was 18220.1 vehicle-minutes, far less than
the total of 21672 vehicle-minutes if with the TRANSYT-7F model. The integrated
model also demonstrates the same superior performance under the scenario of having a
high Ramp-H volume (i.e., 14894 vehicle-minutes versus 21146 vehicle –minutes).
Note that the integrated control model with its embedded formulations for queue
spillback and lane blockage is able to significantly reduce the delay at congested
0.0
5000.0
10000.0
15000.0
20000.0
25000.0
Low Medium High
Freeway Delays (vehicle-minutes)
ICIC I495IL
ICIC I495OL
ICIC Freeway
TY7F I495IL
TY7F I495OL
TY7F Freeway
61
intersections, as evidenced by the resulting total delay in MD 97 SB that is a near-
oversaturated segment during the peak commuting period (i.e., 4,538 vehicles per hour).
Figure 6-5 reflects an interesting relationship between the MD97 SB delay and the
receiving volume at off-ramp-H, where its total delay increased from 7439 vehicle-
minutes at the low off-ramp volume to 9176.8 vehicle-minutes at the medium off-ramp
volume, and then reduced to 6650.7 vehicle-minutes when the off-ramp volume reached
the high level. This pattern existed regardless of using the integrated model or
TRANSYT-7F. It is due to the fact that both models are able to adjust the signal timing
and cycle length to accommodate the increased volume from the increased off-ramp
flows. For instance, the volume increase in MD97 SB from Intersection 2 to Intersection
4 demands an increase in their common cycle length and green split. The cycle lengths
from the proposed model are 114 seconds, 142 seconds, and 164 seconds for low,
medium, and high ramp volume, respectively. However, for drivers from all other
intersection approaches, the increased volume on MD97 SB and the longer cycle length
actually cause them to experience the higher total delay.
For MD 97 NB, the traffic volume stayed at the constant level, but its total delay
exhibited an increase because of the reduced green time at signal 2 and the increased
right-turn traffic from off-ramp H which generally result in an increased share of the total
green duration.
62

Figure 6-5 Comparison of arterial delay by segment
6.5 Conclusion
This chapter presents the evaluation results of the integrated control models
developed from this research with both field data from the interchange between I-495 and
Georgia Avenue and the simulation experiments. The results of extensive experimental
analyses clearly indicate that our proposed models with its embedded formulations to
capture the traffic interactions between congested flow movements can yield effective
signal control plans to prevent the formation of lane blockage and queue spillback during
near oversaturated traffic conditions. In fact, the proposed models significantly
outperform state-of-the-art signal model, TRANSYT-7F, with respect to all different
MOEs at both moderate and congested volume levels, regardless of including the freeway
segment delay due to the off-ramp queue in the control objection function or not. With
the integrated interchange control model, potential users can decide the control objective
based on the length of off-ramp queue spillback, and effectively mitigate the congestion
level at all arterial intersections within the interchange impact boundaries.
0.0
5000.0
10000.0
15000.0
20000.0
25000.0
30000.0
35000.0
40000.0
45000.0
Low Medium High
Arterial Delays (vehicle-minutes)
ICIC MD97NB
ICIC MD97SB
ICIC Arterial
TY7F MD97NB
TY7F MD97SB
TY7F Arterial
63

CHAPTER 7: CONCLUSIONS AND RECOMMENDATIONS
7.1 Research findings
This study presented an integrated control system and its optimal computing
models to contend with the impact of off-ramp queue spillback on both the freeway and
arterials within the interchange control boundaries. The proposed system consists of two
levels that compute the optimal coordinated signal strategies for intersections and off-
ramps. Whereas the first level primarily handles oversaturated flows and blockage
between lanes at congested intersections, the second level deals with the freeway
mainline delays caused by the excessive off-ramp queue spillback; these components
work together to produce the optimal systemwide signal and ramp control plan.
Since one or a few oversaturated intersection approaches on the congested arterial
receiving freeway traffic could spill their queues either into neighboring lanes or back
into their upstream intersections, the integrated model with its embedded formulations
can redistribute the congestion among all intersections within the control boundaries,
minimizing both the average and longest delays. Such a tool will allow responsible traffic
agencies to design coordinated signal optimization plans for all intersections within an
interchange’s impact boundaries and to decide if freeway delay should be included in the
optimization process. Thus, the tool makes it possible to prevent freeway bottlenecks
caused by off-ramp queues from propagating through upstream segments, consequently
paralyzing the entire freeway network.
In addition to developing control modules for oversaturated arterials and
excessive off-ramp queues, the study also conducted some experimental analyses using
field data from the interchange at I-495 and Georgia Avenue. The remainder of this
section summarizes some key research findings from the extensive numerical results:
— The interchange’s high off-ramp volume, in conjunction with the peak-hour
arterial flow rates, will likely cause some intersection approaches to become
oversaturated, consequently paralyzing traffic movements along the entire arterial.
— An oversaturated arterial adjacent to the interchange can cause different levels of
congestion spillback at different intersection approaches; this oversaturation may
64

also cause off-ramp queue lengths to extend beyond their auxiliary lanes, blocking
the freeway’s mainline lanes.
— State-of-the-art signal optimization programs, such as TRANSYT-7F, cannot
yield effective signal control plans for oversaturated arterials that often experience
lane blockage between neighboring lanes and queue spillback to their upstream
segments.
— The integrated control model, with its embedded formulations — capable of
capturing interactions between turning and through traffic flows, as well as
congestion propagation between neighboring intersections — can effectively
prevent the formation of local bottlenecks caused by queue spillback or lane
blockage.
— This study shows that, by accounting for how off-ramp queues impact delays of
both freeway and arterial traffic, the interchange system optimal control can yield
the best use of a roadway’s overall capacity and prevent the formation of freeway
queues in the interchange area caused by the overflow of off-ramp traffic.
— The integrated control model developed from this study can serve as an effective
tool for responsible highway agencies to exercise the proper level of control based
on the distribution of traffic volumes on freeway and arterials, as well as ramp
queue lengths.
7.2 Recommendations for future studies
Building on the results of this study, we recommend that the following future
tasks be conducted to effectively contend with the severe congestion patterns found
around most urban freeway interchange areas:
— Extend the integrated interchange model to include coordinated on-ramp metering
control, as on-ramp queues could spill back into the local arterial when freeway
volume approaches or exceeds its capacity;
— Enhance the computing efficiency of the current GA-based solution to ensure its
applicability to a real-time control environment;
65
— Generalize the formulations for the existing control model to handle multiple
interchanges — which will include one freeway segment, several parallel or
connected arterials, and multiple on- and off- ramps — since freeway congestion
caused by excessively long off-ramp queues could spill back to an upstream
interchange during peak hours;
— Develop a robust control algorithm capable of producing reasonably reliable
results under the constraints of real-time data deficiencies, such as insufficient
sensor information for input needs or measurement errors embedded in
surveillance systems for computing the optimal control strategies;
— Integrate with advanced travel information systems to guide the distribution of
traffic during congested peak periods, and
— Conduct field experiments to test the effectiveness of the proposed integrated
control system under various real-world information constraints and uncertainty
of driver responses to any implemented control strategies or guidance.
66

REFERENCES
1. Abu-Lebdeh, G. and R. Benekohal (1997). "Development of traffic control and
queue management procedures for oversaturated arterials." Transportation
Research Record: Journal of the Transportation Research Board 1603(-1): 119-
127.
2. Abu-Lebdeh, G. and R. Benekohal (2000). "Genetic algorithms for traffic signal
control and queue management of oversaturated two-way arterials."
Transportation Research Record: Journal of the Transportation Research Board
1727(-1): 61-67.
3. Abu-Lebdeh, G. and R. Benekohal (2003). "Design and evaluation of dynamic
traffic management strategies for congested conditions." Transportation Research
Part A 37(2): 109-127.
4. Abu-Lebdeh, G., H. Chen, et al. (2007). "Modeling Traffic Output for Design of
Dynamic Multi-Cycle Control in Congested Conditions." Journal of Intelligent
Transportation Systems 11(1): 25-40.
5. Ahn, S., R. Bertini, et al. (2007). "Evaluating Benefits of Systemwide Adaptive
Ramp-Metering Strategy in Portland, Oregon." Transportation Research Record:
Journal of the Transportation Research Board 2012(-1): 47-56.
6. Allsop, R. (1971). "SIGSET: A computer program for calculating traffic capacity
of signal-controlled road junctions." Traffic Eng. Control 12: 58–60.
7. Allsop, R. (1976). "SIGCAP: A computer program for assessing the traffic
capacity of signal-controlled road junctions." Traffic Engineering & Control 17:
338-341.
8. Banks, J. (1993). "Effect of response limitations on traffic-responsive ramp
metering." Transportation Research Record 1394: 17-25.
9. Binning, J. C., G. Burtenshaw, et al. (2008). TRANSYT 13 User Guide, Transport
Research Laboratory, UK.
10. Bogenberger, K. and A. May (1999). "Advanced coordinated traffic responsive
ramp metering strategies." California PATH Paper UCB-ITS-PWP-99-19.
11. Boillot, F., J. M. Blosseville, et al. (1992). Optimal signal control of urban traffic
networks. Road Traffic Monitoring, 1992 (IEE Conf. Pub. 355).
67

12. Cassidy, M. J., S. B. Anani, et al. (2002). "Study of freeway traffic near an off-
ramp." Transportation Research Part A: Policy and Practice 36(6): 563-572.
13. Ceylan, H. (2006). "Developing Combined Genetic Algorithm—Hill-Climbing
Optimization Method for Area Traffic Control." Journal of Transportation
Engineering 132: 663.
14. Ceylan, H. and M. G. H. Bell (2004). "Traffic signal timing optimization based
on genetic algorithm approach, including drivers’ routing." Transportation
Research Part B 38(4): 329-342.
15. Ceylan, H., S. Haldenbilen, et al. (2010). "Development of delay models with
quasi-Newton method resulting from TRANSYT traffic model." Journal of
Scientific & Industrial Research 69(2): 87-93.
16. Chang, E., S. Cohen, et al. (1988). "MAXBAND-86: program for optimizing
left turn phase sequence in multiarterial closed networks." Transportation
Research Record 1181: 61-67.
17. Chang, G.-L., W. Jifeng, et al. (1994). "Integrated real-time ramp metering
modeling for non-recurrent congestion: framework and preliminary results."
Transportation Research Record 1446: 56-65.
18. Chang, G., P. Ho, et al. (1993). "A dynamic system-optimum control model for
commuting traffic corridors." Transportation Research Part C: Emerging
Technologies 1(1): 3-22.
19. Chang, T.-H. and J.-T. Lin (2000). "Optimal signal timing for an oversaturated
intersection." Transportation Research Part B 34(6): 471-491.
20. Chang, T. and G. Sun (2004). "Modeling and optimization of an oversaturated
signalized network." Transportation Research Part B 38(8): 687-707.
21. Chaudhary, N., A. Pinnoi, et al. (1991). "Proposed Enhancements to
MAXBAND 86 Program." Transportation Research Record 1324: 98-104.
22. Chen, C., J. B. Cruz, et al. (1974). "Entrance ramp control for travel rate
maximization in expressways." Transportation Research 8: 503-508.
23. Chen, C. I., J. B. Cruz, et al. (1974). "ENTRANCE RAMP CONTROL FOR
TRAVEL RATE MAXIMIZATION IN EXPRESSWAYS." Transportation
Research 8(6): 503-508.
68

24. Chen, L., A. May, et al. (1990). "Freeway ramp control using fuzzy set theory
for inexact reasoning." Transportation research. Part A: general 24(1): 15-25.
25. Chen, O., A. Hotz, et al. (1997). Development and evaluation of a dynamic
ramp metering control model. 8th IFAC(International Federation of Automatic
Control)/IFIP/IFORS Symposium on Transportation Systems Chania, Greece.
26. Chlewicki, G. (2003). New Interchange and Intersection Designs: The
Synchronized Split-Phasing Intersection and the Diverging Diamond
Interchange. 2nd Urban Street Symposium: Uptown, Downtown, or Small
Town: Designing Urban Streets That Work, Anaheim, CA.
27. Cremer, M. and S. Schoof (1989). "On control strategies for urban traffic
corridors." Proceedings of IFAC/IFIP/IFORS Symposium: 213-219.
28. Daganzo, C. F. (1994). "The cell transmission model: a dynamic representation
of highway traffic consistent with the hydrodynamic theory." Transportation
research. Part B: methodological 28(4): 269-287.
29. Daganzo, C. F. (1995). "The cell transmission model. II: Network traffic."
Transportation research. Part B: methodological 29(2): 79-93.
30. Dorothy, P., T. Maleck, et al. (1998). "Operational aspects of the Michigan
urban diamond interchange." Transportation Research Record: Journal of the
Transportation Research Board 1612(-1): 55-66.
31. Engelbrecht, R. and K. Barnes (2003). "Advanced Traffic Signal Control for
Diamond Interchanges." Transportation Research Record: Journal of the
Transportation Research Board 1856(-1): 231-238.
32. Fang, F. and L. Elefteriadou (2006). "Development of an Optimization
Methodology for Adaptive Traffic Signal Control at Diamond Interchanges."
Journal of Transportation Engineering 132: 629.
33. Farzaneh, M. and H. Rakha (2006). "Procedures for Calibrating TRANSYT
Platoon Dispersion Model." Journal of Transportation Engineering 132(7):
548-554.
34. Gartner, N. (1983). "OPAC: A demand-responsive strategy for traffic signal
control." Transportation Research Record 906: 75-81.
69

35. Gartner, N., S. Assman, et al. (1991). "A multi-band approach to arterial traffic
signal optimization." Transportation Research Part B: Methodological 25(1):
55-74.
36. Gazis, D. C. and R. B. Potts (1963). The oversaturated intersection. 2th
International Symposium on Traffic Theory, London, Organisation for
Economic Co-operation and Development.
37. Gomes, G. and R. Horowitz (2006). "Optimal freeway ramp metering using the
asymmetric cell transmission model." Transportation research. Part C,
Emerging technologies 14(4): 244-262.
38. Hadi, M. and C. Wallace (1995). "Treatment of Saturated Conditions Using
TRANSYT-7F. ITE 65th Annual Meeting." Compendium of Technical Papers:
463–466.
39. Han, B. (1996). "Optimising traffic signal settings for periods of time-varying
demand." Transportation Research Part A: Policy and Practice 30(3): 207-230.
40. Henry, J., J. Farges, et al. (1984). The PRODYN real time traffic algorithm.
Proceedings of the 4th IFAC, Transportation Systems, Pergamon.
41. Hou, Z., J.-X. Xu, et al. (2008). "An iterative learning approach for density
control of freeway traffic flow via ramp metering." Transportation Research
Part C: Emerging Technologies 16(1): 71-97.
42. Hunt, P., R. Bretherton, et al. (1982). "SCOOT on-line traffic signal
optimisation technique." Traffic Engineering and Control 23: 190-2.
43. Improta, G. and G. E. Cantarella (1984). "Control system design for an
individual signalized junction." Transportation Research Part B:
Methodological 18(2): 147-167.
44. Jacobson, L., K. Henry, et al. (1989). "Real-time metering algorithm for
centralized control." Transportation Research Board 1232: 17-26.
45. Jacobson, L., K. Henry, et al. (1989). "Real-time metering algorithm for
centralized control." Transportation Research Board 1232.
46. Jia, B., R. Jiang, et al. (2004). "Traffic behavior near an off ramp in the cellular
automaton traffic model." Physical Review E 69(5): 56105.
47. Kashani, H. and G. Saridis (1983). "Intelligent control for urban traffic
systems." Automatica 19(2): 191-197.
70

48. Kaya, A. (1972). Computer and optimization techniques for efficient utilization
or urban freeway systems.
49. Kerner, B. (2005). "Control of spatiotemporal congested traffic patterns at
highway bottlenecks." Physica A: Statistical Mechanics and its Applications
355(2-4): 565-601.
50. Kim, J., J. Liu, et al. (1993). "The areawide real-time traffic control(ARTC)
system: a new traffic control concept." IEEE Transactions on Vehicular
Technology 42(2): 212-224.
51. Kotsialos, A. and M. Papageorgiou (2004). "Efficiency and equity properties of
freeway network-wide ramp metering with AMOC." Transportation Research
Part C 12(6): 401-420.
52. Kovvali, V., C. Messer, et al. (2002). "Program for optimizing diamond
interchanges in oversaturated conditions." Transportation Research Record:
Journal of the Transportation Research Board 1811(-1): 166-176.
53. Lee, S., C. Messer, et al. (2006). "Actuated Signal Operations of Congested
Diamond Interchanges." Journal of Transportation Engineering 132: 790.
54. Levinson, D. and L. Zhang (2006). "Ramp meters on trial: Evidence from the
Twin Cities metering holiday." TRANSPORTATION RESEARCH PART A-
POLICY AND PRACTICE 40(10): 810-828.
55. Li, M. and A. Gan (1999). "Signal timing optimization for oversaturated
networks using TRANSYT-7F." Transportation Research Record: Journal of
the Transportation Research Board 1683: 118-126.
56. Li, Z., G.-L. Chang, et al. (2009). Integrated Off-Ramp Control Model for
Freeway Traffic Management, Transportation Research Board.
57. Lighthill, M. and G. Whitham (1955). "On kinematic waves. II. A theory of
traffic flow on long crowded roads." Proceedings of the Royal Society of
London. Series A, Mathematical and Physical Sciences: 317-345.
58. Lin, W. and D. Ahanotu (1995). "Validating the basic cell transmission model
on a single freeway link." PATH Technical Note 3.
59. Lipp, L., L. Corcoran, et al. (1991). "Benefits of central computer control for
Denver ramp-metering system." Transportation Research Record 1320: 3-6.
71

60. Little, J., M. Kelson, et al. (1981). "MAXBAND: A program for setting signals
on arteries and triangular networks." Transportation Research Record 795: 40-
46.
61. Little, J. D. C. (1966). "The Synchronization of Traffic Signals by Mixed-
Integer Linear Programming." OPERATIONS RESEARCH 14(4): 568-594.
62. Lo, H. K. (1999). "A novel traffic signal control formulation." Transportation
Research Part A 33(6): 433-448.
63. Lo, H. K., E. Chang, et al. (2001). "Dynamic network traffic control."
Transportation Research Part A 35(8): 721-744.
64. Lo, H. K. and A. H. F. Chow (2004). "Control Strategies for Oversaturated
Traffic." Journal of Transportation Engineering 130(4): 466.
65. Lovell, D. and C. Daganzo (2000). "Access control on networks with unique
origin–destination paths." Transportation Research Part B 34(3): 185-202.
66. Lovell, D. J. (1997). Traffic control on metered networks without route choice,
University of California, Berkeley.
67. Masher, D., D. Ross, et al. (1975). "Guidelines for design and operation of
ramp control systems." NCHRP Project 3-22 Final Report.
68. McCoy, P., E. Balderson, et al. (1983). "Calibration of Transyt Platoon
Dispersion Model for Passenger Cars under Low-Friction Traffic Flow
Conditions (Abridgment)." transportation Research Record 905: 48-52.
69. Meldrum, D. and C. Taylor (1995). "Freeway traffic data prediction using
artificial neural networks and development of a fuzzy logic ramp metering
algorithm." Report No. WA-RD 365.
70. Messer, C. and D. Berry (1975). "Effects of design alternatives on quality of
service at signalized diamond interchanges." Transportation Research Record
538: 20-31.
71. Messer, C., D. Fambro, et al. (1977). "Optimization of pretimed signalized
diamond interchanges." Transportation Research Record 664: 78-84.
72. Morgan, J. and J. Little (1964). "Synchronizing traffic signals for maximal
bandwidth." OPERATIONS RESEARCH 12(6): 896-912.
73. Munjal, P. (1971). An Analysis of Diamond Interchange Signalization,
Highway Research Board.
72
74. Nihan, N. and D. Berg (1991). "Predictive Algorithm Improvements for a Real-
Time Ramp Control System." Final Report GC8286 (16), WA-RD 213.
75. Paesani, G., J. Kerr, et al. (1997). System wide adaptive ramp metering in
southern California. ITS America 7th Annual Meeting.
76. Papageorgiou, M. (1980). "A new approach to time-of-day control based on a
dynamic freeway traffic model." Transportation Research Part B:
Methodological 14(4): 349-360.
77. Papageorgiou, M. (1983). "A hierarchical control system for freeway traffic."
Transportation Research Part B: Methodological 17(3): 251-261.
78. Papageorgiou, M. (1990). "Modelling and real-time control of traffic flow on
the southern park of Boulevard Peripherique in Paris: Part II: Coordinated on-
ramp metering." TRANSP. RES. 24A(5): 361-370.
79. Papageorgiou, M. (1995). "An Integrated Control Approach for Traffic
Corridors." Transpn. Research. Part C, Emerging Technologies. 3(1): 19-30.
80. Papageorgiou, M., J. M. Blosseville, et al. (1990). "Modelling and real-time
control of traffic flow on the southern part of Boulevard Peripherique in Paris:
Part I: Modelling." TRANSP. RES. 24A(5): 345-359.
81. Papageorgiou, M., C. Diakaki, et al. (2003). "Review of Road Traffic Control
Strategies." Proceedings of the IEEE 91(12): 2043-2067.
82. Papageorgiou, M., H. Hadj-Salem, et al. (1991). "ALINE A: a local feedback
control law for on-ramp metering."
83. Papageorgiou, M. and A. Kotsialos (2002). "Freeway ramp metering: An
overview." IEEE Transactions on Intelligent Transportation Systems 3(4): 271-
281.
84. Park, B., C. Messer, et al. (2000). "Enhanced genetic algorithm for signal-
timing optimization of oversaturated intersections." Transportation Research
Record: Journal of the Transportation Research Board 1727(-1): 32-41.
85. Park, B., C. J. Messer, et al. (1999). "Traffic Signal Optimization Program for
Oversaturated Conditions: Genetic Algorithm Approach." Transportation
Research Record 1683: 133-42.
73

86. Payne, H., D. Brown, et al. (1985). Demand-responsive strategies for
interconnected freeway ramp control systems. Volume 1: metering strategies,
FHWA/RD-85/109, VERSAC Incorporated, San Diego, California.
87. Pooran, F. and R. Sumner (1996). Coordinated operation of ramp metering and
adjacent traffic signal control systems, Report FHWA-RD-95-130. Federal
Highway Administration, Washington DC, 1996.
88. Radwan, A. and R. Hatton (1990). "Evaluation Tools of Urban Interchange
Design and Operation."
89. Reiss, R. A. (1981). "Algorithm development for corridor traffic control."
Traffic, Transportation, and Urban Planning 2.
90. Richards, P. (1956). "Shock waves on the highway." OPERATIONS
RESEARCH: 42-51.
91. Robertson, D. (1969). "TANSYT: method for area traffic control." Traffic
Engineering and Control 11(6): 278-281.
92. Rudolph, G. (1994). "Convergence analysis of canonical genetic algorithms."
IEEE transactions on neural networks 5(1): 96-101.
93. Sasaki, T. and T. Akiyama (1986). Development of fuzzy traffic control system
on urban expressway. Control in Transportation Systems, Vienna, Austria,
Pergamon Press, Engl & New.
94. Schwartz, S. and H. Tan (1977). Integrated control of freeway entrance ramps
by threshold regulation.
95. Seddon, P. (1972). "Another look at platoon dispersion: 3. The recurrence
relationship." Traffic Engineering+ Control 13: 442–444.
96. Sen, S. and K. Head (1997). "Controlled optimization of phases at an
intersection." TRANSPORTATION SCIENCE 31(1): 5-17.
97. Sims, A. and K. Dobinson (1980). "The Sydney coordinated adaptive traffic
(SCAT) system philosophy and benefits." IEEE Transactions on Vehicular
Technology 29(2): 130-137.
98. Stamatiadis, C. and N. Gartner (1996). "MULTIBAND-96: a program for
variable-bandwidth progression optimization of multiarterial traffic networks."
Transportation Research Record: Journal of the Transportation Research Board
1554: 9-17.
74

99. Stephanedes, Y. (1994). Implementation of on-line zone control strategies for
optimal ramp metering in the minneapolis ring road, Institution of Electrical
Engineers.
100. Stevanovic, A., P. Martin, et al. (2007). "VisSim-Based Genetic Algorithm
Optimization of Signal Timings." Transportation Research Record: Journal of
the Transportation Research Board 2035(-1): 59-68.
101. Stringer, S. M. (2006) "Thinking outside the box: an analysis of Manhattan
gridlock and spillback enforcement."
102. Tabac, D. (1972). A linear programming model of highway traffic control.
103. Taylor, C., D. Meldrum, et al. (1998). "Fuzzy ramp metering: design overview
and simulation results." Transportation Research Record: Journal of the
Transportation Research Board 1634(-1): 10-18.
104. TIAN, Z. (2007). "Modeling and Implementation of an Integrated Ramp
Metering-Diamond Interchange Control System." Journal of Transportation
Systems Engineering and Information Technology 7(1): 61-69.
105. Tian, Z., K. Balke, et al. (2002). "Integrated control strategies for surface street
and freeway systems." Transportation Research Record: Journal of the
Transportation Research Board 1811(-1): 92-99.
106. Tian, Z., C. Messer, et al. (2004). "Modeling Impact of Ramp Metering Queues
on Diamond Interchange Operations." Transportation Research Record:
Journal of the Transportation Research Board 1867(-1): 172-182.
107. Van Aerde, M. and S. Yagar (1988). "Dynamic integrated freeway/traffic
signal networks: Problems and proposed solutions." Transportation research.
Part A: general 22(6): 435-443.
108. van den Berg, M., B. De Schutter, et al. (2004). Model predictive control for
mixed urban and freeway networks. Proceedings of the 83rd Annual Meeting
of the Transportation Research Board. Washington, DC. 19: Paper 04-3327.
109. van den Berg, M., A. Hegyi, et al. (2003). A macroscopic traffic flow model
for integrated control of freeway and urban traffic networks. Decision and
Control, 2003. Proceedings. 42nd IEEE Conference on.
75

110. Venglar, S., P. Koonce, et al. (1998). "PASSER III-98 Application and User’s
Guide." Texas Transportation Institute, Texas A&M Univ., College Station,
Tex.
111. Wang, C. F. (1972). "On a ramp-flow assignment problem."
TRANSPORTATION SCIENCE 6(2): 114-130.
112. Wang, J. and A. May (1973). Computer model for optimal freeway on-ramp
control, Highway Research Board.
113. Wattleworth, J. (1963). "Peak-period control of a freeway system–some
theoretical considerations." Chicago area expressway surveillance project.
114. Webster, F. (1958). Traffic signal settings, HMSO.
115. Webster, F. V. and B. M. Cobbe (1967). Traffic Signals, HMSO.
116. Wei, C.-H. and K.-Y. Wu (1996). "Applying an artificial neural network model
to freeway ramp metering control." Transportation Planning Journal 25(3):
335-356.
117. Wong, C. K., S. C. Wong, et al. (2007). "Reserve Capacity of a Signal-
controlled Network Considering the Effect of Physical Queuing."
Transportation and Traffic Theory 2007: Papers Selected for Presentation at
ISTTT17, a Peer Reviewed Series Since 1959: 533.
118. Wong, S. C. and H. Yang (1997). "Reserve capacity of a signal-controlled road
network." Transportation Research Part B 31(5): 397-402.
119. Wu, J. and G. Chang (1999). "An integrated optimal control and algorithm for
commuting corridors." International Transactions in Operational Research 6(1):
39-55.
120. Xin, W., P. Michalopoulos, et al. (2004). "Minnesota's New Ramp Control
Strategy: Design Overview and Preliminary Assessment." Transportation
Research Record: Journal of the Transportation Research Board 1867(-1): 69-
79.
121. Yoshino, T., T. Sasaki, et al. (1995). "The Traffic-Control System on the
Hanshin Expressway." Interfaces 25(1): 94-108.
122. Yuan, L. and J. Kreer "Adjustment of freeway ramp metering rates to balance
entrance ramp queues."
76

123. Yuan, L. S. and J. B. Kreer (1971). "Adjustment Of Freeway Ramp Metering
Rates To Balance Entrance Ramp Queues." Transportation Research 5(2): 127-
137.
124. Yun, I. and B. B. Park (2006). Application of stochastic optimization method
for an urban corridor. Winter Simulation Conference, Monterey, California.
125. Zhang, H., J. Ma, et al. (2009). "Local Synchronization Control Scheme for
Congested Interchange Areas in Freeway Corridor." Transportation Research
Record: Journal of the Transportation Research Board 2128(-1): 173-183.
126. Zhang, H. and S. Ritchie (1997). "Freeway ramp metering using artificial
neural networks." Transportation Research Part C 5(5): 273-286.
127. Zhang, M., T. Kim, et al. (2001). "Evaluation of on-ramp control algorithms."
UC Berkeley: California Partners for Advanced Transit and Highways (PATH).
Retrieved from: http://www. escholarship. org/uc/item/83n4g2rq.
128. Zhou, G., A. Gan, et al. (2007). "Optimization of Adaptive Transit Signal
Priority Using Parallel Genetic Algorithm." Tsinghua Science & Technology
12(2): 131-140.
77