Embed Size (px)
Citation preview
R E P O RT
State-level Indicators for Social-emotional DevelopmentBuilding Better Systems
Elizabeth A. Isakson | Leslie L. Davidson February 2011 Louisa B. Higgins | Janice L. Cooper
State-level InDIcatorS for SocIal-emotIonal Development Building Better SystemsElizabeth Isakson, Leslie L. Davidson, Louisa B. Higgins, Janice L. Cooper
AutHors
Elizabeth A. Isakson, MD, is a candidate for an MPH in the Department of sociomedical sciences at Columbia university Mailman school of Public Health. Dr. Isakson trained at Children’s Hospital of New York where she was Chief resident. Prior to continuing her studies, Dr. Isakson practiced at a federally-funded community health center in New York City.
Leslie L. Davidson, MD, is a professor of Clinical Epidemiology and director of Center for Child and Family Life Epidemiology at Columbia university Mailman school of Public Health. Dr. Davidson is senior health advisor to Project thrive at NCCP.
Louisa B. Higgins, MA, is a research analyst at NCCP for early childhood and health and mental health. she is currently the coordinator for Project thrive.
Janice L. Cooper, PhD, was interim director at NCCP and assistant clinical professor, Health Policy and Management at Columbia university Mailman school of Public Health. Dr. Cooper directed unclaimed Children revisited, a series of policy and impact analyses of mental health services for children, adolescents, and their families.
ACkNowLEDgEMENts
this publication was supported by the Maternal and Child Health Bureau, of the Health resources services Administration (MCHB) of the u.s. Department of Health and Human services under funding to Project thrive. we gratefully acknowledge the support of our project officer Dr. Phyllis stubbs-winn.
we would like to thank shannon stagman and David gottesman of NCCP for their assistance with the manuscript. we also gratefully acknowledge the participation of our state partners in the survey and follow-up phone calls. special thanks to Jackie Counts of kansas, Judy walruff and Amy kemp of Arizona, Cindy wilkinson of Missouri, Deborah Nelson of North Carolina and Catherine walsh of rhode Island who shared their experiences that helped guide this publication. thank you to NCCP’s communications team for their work: Morris Ardoin, Amy Palmisano, and telly Valdellon.
Copyright © 2011 by the National Center for Children in Poverty
the national center for children in poverty (nccp) is a leading public policy center
dedicated to promoting the economic security, health, and well-being of america’s
low-income families and children. Using research to inform policy and practice, nccp
seeks to advance family-oriented solutions and the strategic use of public resources
at the state and national levels to ensure positive outcomes for the next generation.
founded in 1989 as a division of the mailman School of public Health at columbia
University, nccp is a nonpartisan, public interest research organization.
State-level Indicators for Social-emotional Development: Building Better Systems 3
State-level Indicators for Social-emotional DevelopmentBuilding Better SystemsElizabeth Isakson | Leslie L. Davidson | Louisa B. Higgins | Janice L. Cooper February 2011
Introduction
Research repeatedly suggests that experiences and skills acquired early in life have a long lasting effect.1 Many interventions promoting social-emotional well-being and preventing mental health problems in children and their caregivers are clinically sound and cost effective.2 Social-emotional well-being is also seen as a crucial determinant of school readi-ness while school readiness is critical to educa-tional and health outcomes.3 Research evaluating appropriate interventions and investigating the importance of school readiness makes a strong case for creating a system to monitor social-emotional development in the effort to improve the well-being of young children. Indicators are a key part of this monitoring system and promote accountability by providing decision-makers and researchers with information they need to understand and meet local and state needs, to assess the provision and quality of interventions, and to address gaps in services to young children and families.
The ability to track and assess social-emotional development of young children in a community poses a special challenge to policymakers. For many other areas within early childhood it is possible to under-stand the status and trends for child well-being at the population level. For instance, data on infant mortal-ity, immunizations, and child welfare at the local, state and national level can be accessed to inform health promotion and prevention efforts. Currently, such multi-level data on social-emotional development for young children is not easily available. The challenge to quantify social-emotional wellness at a popula-tion level stems in part from the lack of universally accepted indicators and infrastructure for collecting information in this domain of child development.
This report addresses the process of creating a system of indicators for social-emotional wellness, examines recent state experiences in this area, and describes a framework for moving forward in the development of social-emotional indicators for state policymakers.
4 National Center for Children in Poverty
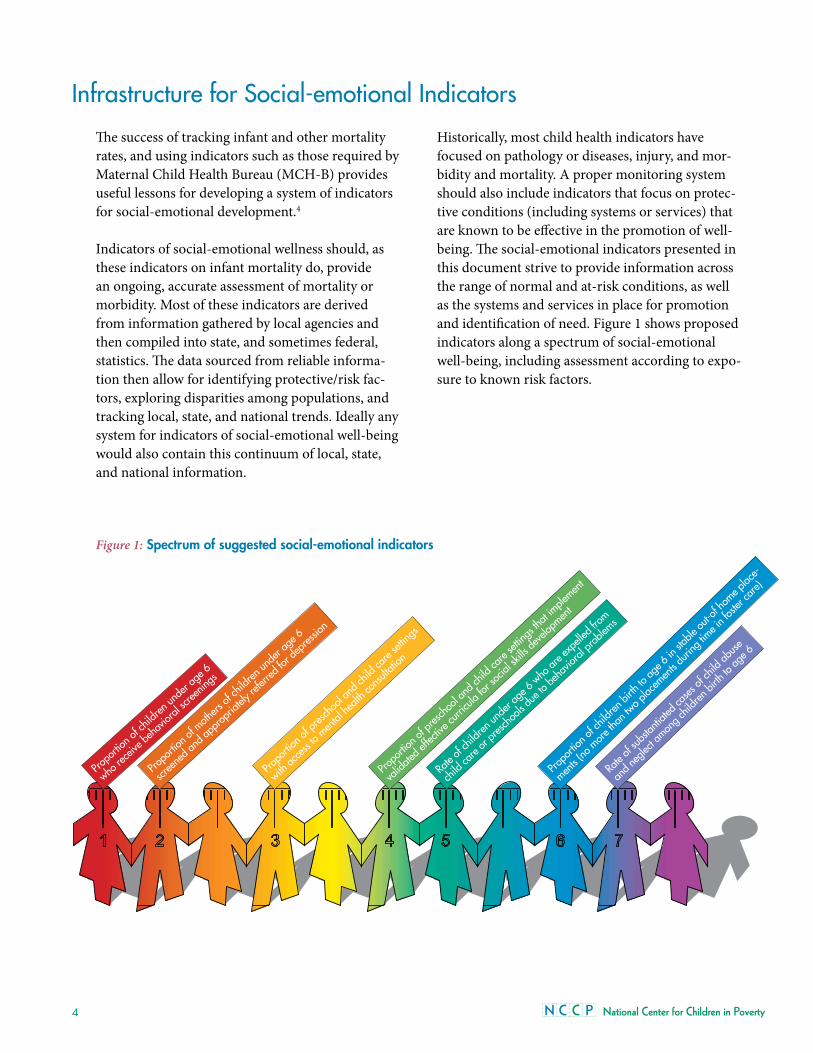
propo
rtion o
f chil
dren u
nder
age 6
who re
ceive
beha
vioral
scree
nings
propo
rtion o
f moth
ers of
child
ren un
der a
ge 6
scree
ned a
nd ap
propri
ately
referr
ed fo
r dep
ressio
n
propo
rtion o
f pres
choo
l and
child
care
settin
gs
with ac
cess
to men
tal he
alth c
onsul
tation
propo
rtion o
f pres
choo
l and
child
care
settin
gs th
at im
plemen
t
valid
ated e
ffecti
ve cu
rricu
la for
socia
l skills
deve
lopmen
t
rate
of ch
ildren
unde
r age
6 who
are e
xpell
ed fro
m
child
care
or pre
schoo
ls due
to be
havio
ral pr
oblem
s
propo
rtion o
f chil
dren b
irth to
age 6
in st
able
out-o
f hom
e plac
e-
ments
(no m
ore th
an tw
o plac
emen
ts du
ring t
ime i
n fos
ter ca
re)
rate
of sub
stanti
ated c
ases
of ch
ild ab
use
and n
eglec
t amon
g chil
dren b
irth to
age 6
Figure 1: Spectrum of suggested social-emotional indicators
Infrastructure for Social-emotional Indicators
The success of tracking infant and other mortality rates, and using indicators such as those required by Maternal Child Health Bureau (MCH-B) provides useful lessons for developing a system of indicators for social-emotional development.4
Indicators of social-emotional wellness should, as these indicators on infant mortality do, provide an ongoing, accurate assessment of mortality or morbidity. Most of these indicators are derived from information gathered by local agencies and then compiled into state, and sometimes federal, statistics. The data sourced from reliable informa-tion then allow for identifying protective/risk fac-tors, exploring disparities among populations, and tracking local, state, and national trends. Ideally any system for indicators of social-emotional well-being would also contain this continuum of local, state, and national information.
Historically, most child health indicators have focused on pathology or diseases, injury, and mor-bidity and mortality. A proper monitoring system should also include indicators that focus on protec-tive conditions (including systems or services) that are known to be effective in the promotion of well-being. The social-emotional indicators presented in this document strive to provide information across the range of normal and at-risk conditions, as well as the systems and services in place for promotion and identification of need. Figure 1 shows proposed indicators along a spectrum of social-emotional well-being, including assessment according to expo-sure to known risk factors.
State-level Indicators for Social-emotional Development: Building Better Systems 5
States have used different vehicles to develop monitoring systems that examine the promotion of optimal child development. School readiness initiatives and Children’s Cabinets instituted by governors have presented indicator guidelines, some of which include promoting social-emotional well-being.5 Guidelines for the State Early Childhood Comprehensive System (ECCS) grantees, funded by the Maternal and Child Health Bureau (MCHB), recommend developing indicators across five domains, including social-emotional health, to be used as a guide to implement and evaluate cross system initiatives in ECCS states.6
All of these efforts provide a foundation for building a monitoring system for child development, includ-ing social-emotional development, that can be as robust and meaningful as other well-established public health monitoring systems.
In 2009, the Project Thrive working group pub-lished Indicators for Social-emotional Development in Early Childhood: A Guide for Local Stakeholders7 which may serve as a companion piece to this report. States may wish to use these two documents together because integration of state and local indi-cators is crucial to developing a meaningful and useful system of monitoring the social-emotional well-being of young children across the population. For an example of low localities and states can work together to develop and use indicators, see the box on Arizona to the right.
ARizOnA
How Local Entities and States Can Partner to Develop indicators
First Things First, Arizona’s early childhood initiative, provides other states with an example of how to coor-dinate local and statewide indicator development. Early in the initiative key measures were identified that the state and individual regions* would use to measure the success of the initiative. One of these key indicators in the health domain was the total number and percentage of children with insurance coverage, including dental and mental health. The First Things First model was decentralized with regions of the state planning and allocating funds based on local needs. Regional planners found that they had very little infor-mation on whether this key indicator was being met in their region.
This spurred regional and statewide planning to iden-tify the best method to obtain needed data. St. Luke’s Health Initiatives, a Phoenix-based public founda-tion, conducted the Arizona Health Survey to inform Arizona health policy and support strength-based community development. To provide data for the key indicator, First Things First’s board and regions partnered with St. Luke’s Health Initiatives to allocate some of its statewide and regional funds and gather representative data for local areas. Collaborating with an entity that already collected data, the First Things First project gained information by building on an established process. St.Luke’s Health Initiatives expanded their sample to include a population not previously examined and ensured quality measure-ments. By partnering on an existing survey, the early childhood initiative was able to collect data while minimizing costs, frequency and duplication often associated with data collection. __________
*For this initiative Arizona was divided into regions based on service utilization, not county or other government entity.
6 National Center for Children in Poverty
Identifying Indicators in the Social-emotional Domain
In 2008 Project Thrive reviewed initial state experi-ences in developing indicators and published Short Take No. 7 “State Indicators for Early Childhood.” Short Take No. 7 recommended 36 indicators across the five domains of ECCS as examples of a compre-hensive set of indicators that states could assemble from existing sources to monitor their state early childhood initiatives.8 In this report we take a closer look at state effort to develop indicators that address one of those domains: social and emotional well-being of young children. We attempt to describe the strengths and limitations of states’ efforts to support the social-emotional well-being of young children at the individual child and family, community, and state levels for children served by multiple systems (health, early care and education, child welfare). The critical questions that we asked were:
1. What indicators of social-emotional development are states using?
2. How were these indicators chosen?
3. What factors facilitated their selection?
In addition to finding out which indicators states chose to reflect well-being in the social-emotional domain, we were also interested is the process for selecting these indicators, which often included the rationale behind the choices. We were guided by questions such as:
◆ How did states chose these indicators and what facilitated or hindered their selection in light of limited resources and the range of choices available?
◆ Did states develop a new indicator rather than choose an existing indicator?
◆ Did some states choose a composite measure (combination of indicators as a means to more accurately reflect social-emotional development)?
Efforts to select indicators will prove most valuable if they utilize resources efficiently, produce mean-ingful information and provide a degree of stan-dardization to facilitate comparisons across com-munities, states and the nation.
In creating this list of indicators for social-emo-tional development, Project Thrive researchers built on the Thrive Short Take No. 7, using the recom-mended indicators relevant for social-emotional development. The investigators then added indica-tors in areas where research suggested there may be relevance to social-emotional development and for which data was readily available and feasible to col-lect at multiple levels. After considering the signifi-cance and meaning of the indicator, a list of seven indicators was compiled (see suggested indicators box on page 7). This list reflects research finding on the factors that might impact social-emotional development and might consequently serve as useful benchmarks for assessing system function-ing, disparities, and implementing intervention strategies. Each indicator is derived from available research. Although this list is not exhaustive for the assessment of early childhood social-emotional development at the population level, it provides examples of possible sources from which states could draw. The approach builds significantly on the work of the School Readiness Project and Mark Friedman.9
◆ Research shows that maternal depression poses increased risks not only for young children’s social-emotional development, including behavioral outcomes, but also their cognitive and language development and their health outcomes.10 Screening and subsequent treatment for maternal depression where indicated and, when fully integrated into settings where parents frequent, are associated with improved outcomes for both mothers and their children.11
State-level Indicators for Social-emotional Development: Building Better Systems 7
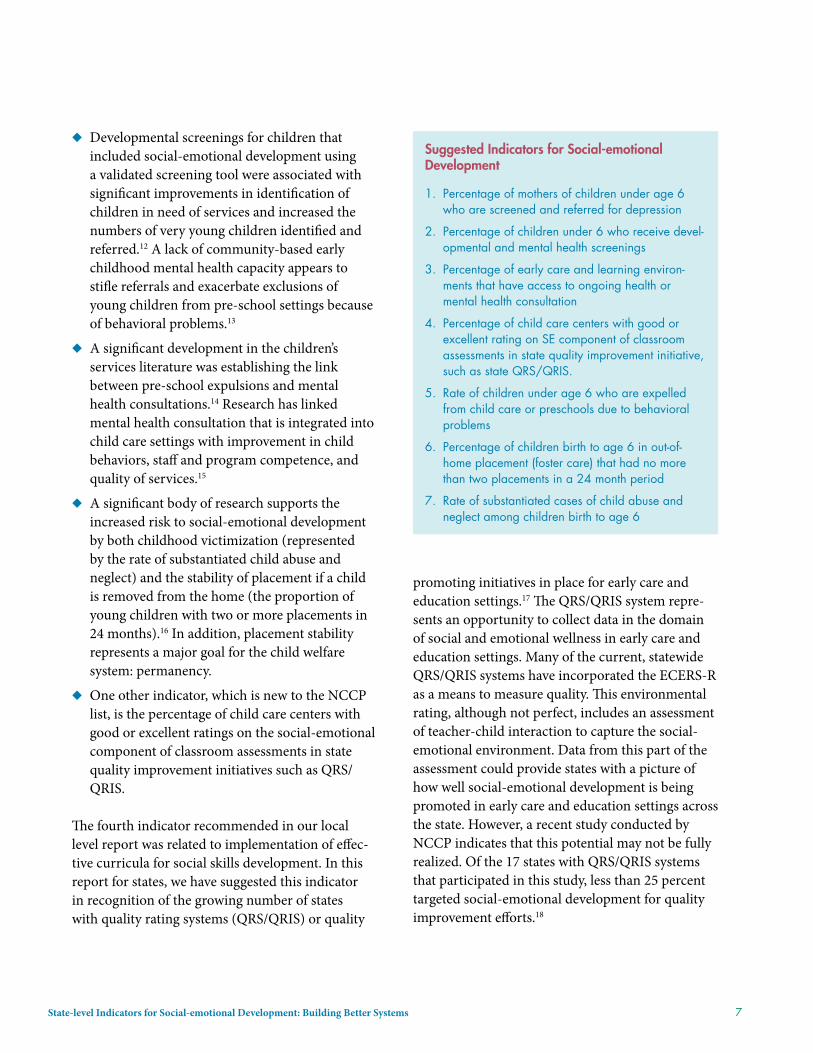
◆ Developmental screenings for children that included social-emotional development using a validated screening tool were associated with significant improvements in identification of children in need of services and increased the numbers of very young children identified and referred.12 A lack of community-based early childhood mental health capacity appears to stifle referrals and exacerbate exclusions of young children from pre-school settings because of behavioral problems.13
◆ A significant development in the children’s services literature was establishing the link between pre-school expulsions and mental health consultations.14 Research has linked mental health consultation that is integrated into child care settings with improvement in child behaviors, staff and program competence, and quality of services.15
◆ A significant body of research supports the increased risk to social-emotional development by both childhood victimization (represented by the rate of substantiated child abuse and neglect) and the stability of placement if a child is removed from the home (the proportion of young children with two or more placements in 24 months).16 In addition, placement stability represents a major goal for the child welfare system: permanency.
◆ One other indicator, which is new to the NCCP list, is the percentage of child care centers with good or excellent ratings on the social-emotional component of classroom assessments in state quality improvement initiatives such as QRS/QRIS.
The fourth indicator recommended in our local level report was related to implementation of effec-tive curricula for social skills development. In this report for states, we have suggested this indicator in recognition of the growing number of states with quality rating systems (QRS/QRIS) or quality
promoting initiatives in place for early care and education settings.17 The QRS/QRIS system repre-sents an opportunity to collect data in the domain of social and emotional wellness in early care and education settings. Many of the current, statewide QRS/QRIS systems have incorporated the ECERS-R as a means to measure quality. This environmental rating, although not perfect, includes an assessment of teacher-child interaction to capture the social-emotional environment. Data from this part of the assessment could provide states with a picture of how well social-emotional development is being promoted in early care and education settings across the state. However, a recent study conducted by NCCP indicates that this potential may not be fully realized. Of the 17 states with QRS/QRIS systems that participated in this study, less than 25 percent targeted social-emotional development for quality improvement efforts.18
Suggested indicators for Social-emotional Development
1. Percentage of mothers of children under age 6 who are screened and referred for depression
2. Percentage of children under 6 who receive devel-opmental and mental health screenings
3. Percentage of early care and learning environ-ments that have access to ongoing health or mental health consultation
4. Percentage of child care centers with good or excellent rating on SE component of classroom assessments in state quality improvement initiative, such as state QRS/QRIS.
5. Rate of children under age 6 who are expelled from child care or preschools due to behavioral problems
6. Percentage of children birth to age 6 in out-of-home placement (foster care) that had no more than two placements in a 24 month period
7. Rate of substantiated cases of child abuse and neglect among children birth to age 6
8 National Center for Children in Poverty
current State of progress
In spring 2009 Project Thrive conducted an inter-net-based survey to see how ECCS grantees were progressing in their goal to develop indicators. Fifty three states and territories received grants from the Maternal and Child Health Bureau of the Department of Health and Human Services to plan, coordinate and support efforts to develop strate-gies to ensure the health and well-being of young children.19
Methodology
An initial email was sent with the invitation to the survey to all ECCS coordinators current email addresses. Subsequently, two email reminders to
complete the survey were sent. The response rate for the survey was 71 percent.
The survey consisted of 12 content areas that cov-ered the state’s experience in developing indica-tors with a specific focus on the social-emotional domain. Questions about the coordinator’s experi-ence and role were asked and space was provided for respondents to share their experiences with indi-cator development.
The survey was successfully sent to 51 ECCS grant-ees (state and territorial) via email with a link to an on-line survey program. Fifty individuals opened the survey and 36 (71 percent) completed the survey.
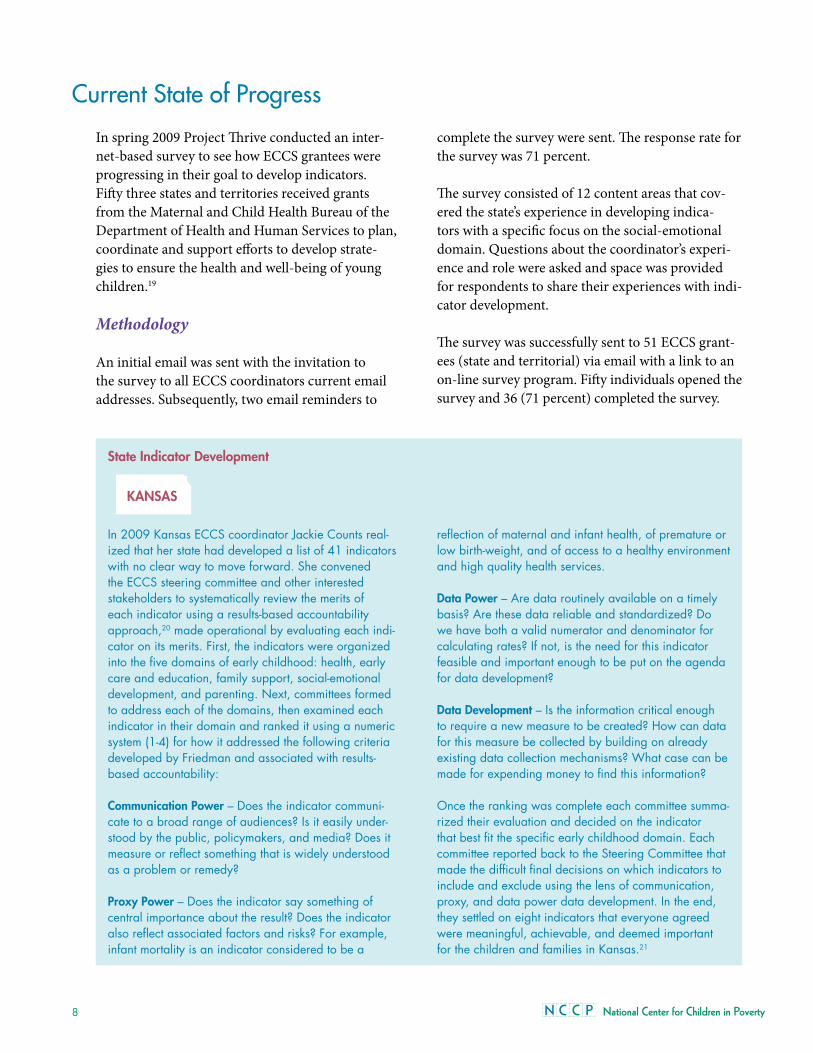
In 2009 Kansas ECCS coordinator Jackie Counts real-ized that her state had developed a list of 41 indicators with no clear way to move forward. She convened the ECCS steering committee and other interested stakeholders to systematically review the merits of each indicator using a results-based accountability approach,20 made operational by evaluating each indi-cator on its merits. First, the indicators were organized into the five domains of early childhood: health, early care and education, family support, social-emotional development, and parenting. Next, committees formed to address each of the domains, then examined each indicator in their domain and ranked it using a numeric system (1-4) for how it addressed the following criteria developed by Friedman and associated with results-based accountability:
Communication Power – Does the indicator communi-cate to a broad range of audiences? Is it easily under-stood by the public, policymakers, and media? Does it measure or reflect something that is widely understood as a problem or remedy?
Proxy Power – Does the indicator say something of central importance about the result? Does the indicator also reflect associated factors and risks? For example, infant mortality is an indicator considered to be a
reflection of maternal and infant health, of premature or low birth-weight, and of access to a healthy environment and high quality health services.
Data Power – Are data routinely available on a timely basis? Are these data reliable and standardized? Do we have both a valid numerator and denominator for calculating rates? If not, is the need for this indicator feasible and important enough to be put on the agenda for data development?
Data Development – Is the information critical enough to require a new measure to be created? How can data for this measure be collected by building on already existing data collection mechanisms? What case can be made for expending money to find this information?
Once the ranking was complete each committee summa-rized their evaluation and decided on the indicator that best fit the specific early childhood domain. Each committee reported back to the Steering Committee that made the difficult final decisions on which indicators to include and exclude using the lens of communication, proxy, and data power data development. In the end, they settled on eight indicators that everyone agreed were meaningful, achievable, and deemed important for the children and families in Kansas.21
State indicator Development
KAnSAS
State-level Indicators for Social-emotional Development: Building Better Systems 9
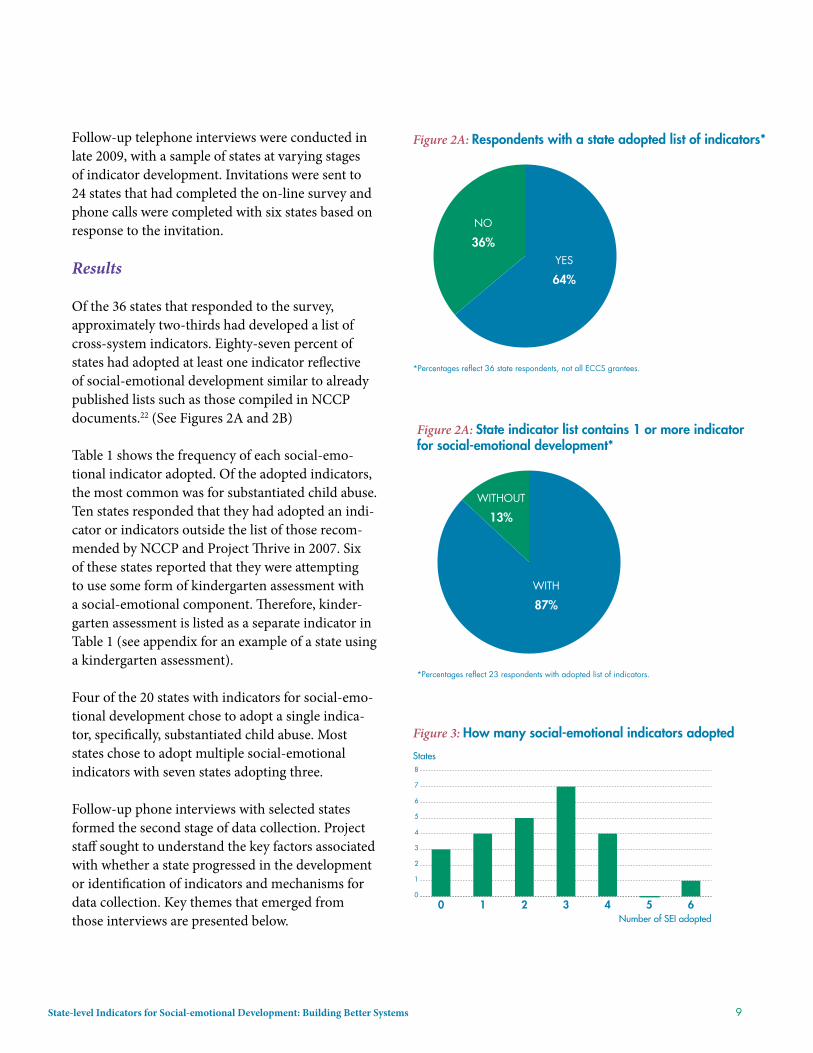
Follow-up telephone interviews were conducted in late 2009, with a sample of states at varying stages of indicator development. Invitations were sent to 24 states that had completed the on-line survey and phone calls were completed with six states based on response to the invitation.
Results
Of the 36 states that responded to the survey, approximately two-thirds had developed a list of cross-system indicators. Eighty-seven percent of states had adopted at least one indicator reflective of social-emotional development similar to already published lists such as those compiled in NCCP documents.22 (See Figures 2A and 2B)
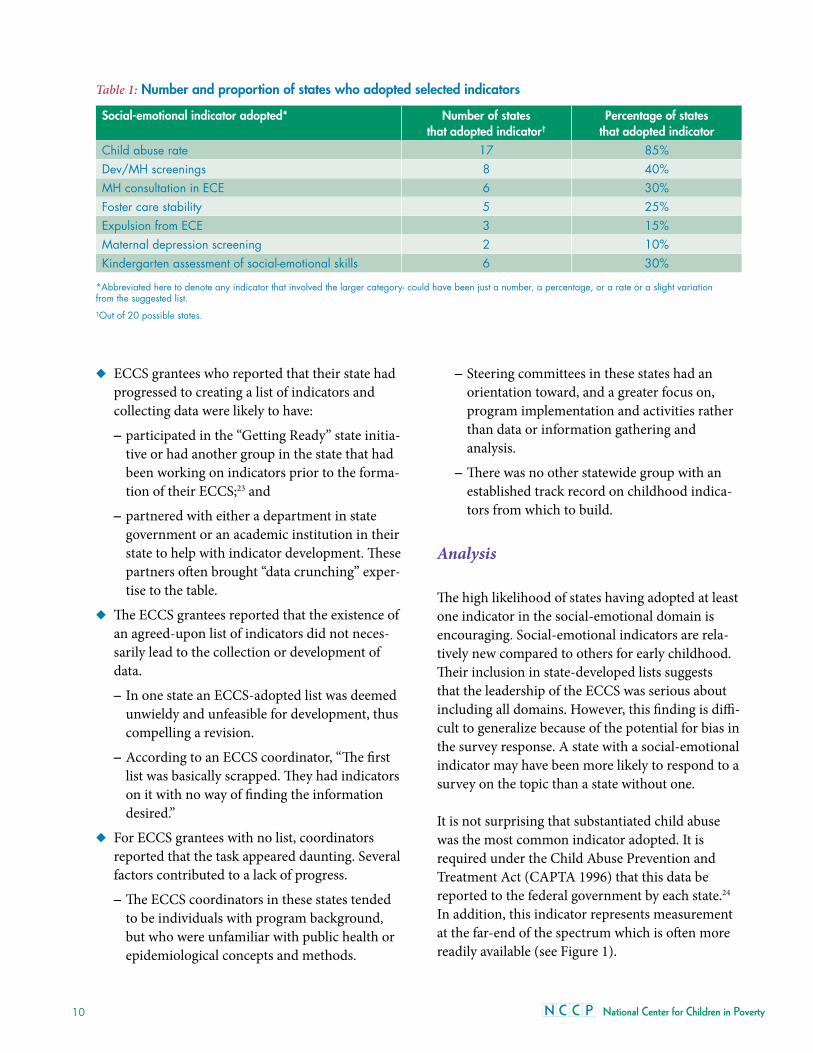
Table 1 shows the frequency of each social-emo-tional indicator adopted. Of the adopted indicators, the most common was for substantiated child abuse. Ten states responded that they had adopted an indi-cator or indicators outside the list of those recom-mended by NCCP and Project Thrive in 2007. Six of these states reported that they were attempting to use some form of kindergarten assessment with a social-emotional component. Therefore, kinder-garten assessment is listed as a separate indicator in Table 1 (see appendix for an example of a state using a kindergarten assessment).
Four of the 20 states with indicators for social-emo-tional development chose to adopt a single indica-tor, specifically, substantiated child abuse. Most states chose to adopt multiple social-emotional indicators with seven states adopting three.
Follow-up phone interviews with selected states formed the second stage of data collection. Project staff sought to understand the key factors associated with whether a state progressed in the development or identification of indicators and mechanisms for data collection. Key themes that emerged from those interviews are presented below.
Figure 3: How many social-emotional indicators adopted
States
0
1
2
3
4
5
6
7
8
6543210Number of SEI adopted
Figure 2A: Respondents with a state adopted list of indicators*
*Percentages reflect 36 state respondents, not all ECCS grantees.
NO
36%YES
64%
Figure 2A: State indicator list contains 1 or more indicator for social-emotional development*
*Percentages reflect 23 respondents with adopted list of indicators.
WITHOUT
13%
WITH
87%
10 National Center for Children in Poverty
◆ ECCS grantees who reported that their state had progressed to creating a list of indicators and collecting data were likely to have:
– participated in the “Getting Ready” state initia-tive or had another group in the state that had been working on indicators prior to the forma-tion of their ECCS;23 and
– partnered with either a department in state government or an academic institution in their state to help with indicator development. These partners often brought “data crunching” exper-tise to the table.
◆ The ECCS grantees reported that the existence of an agreed-upon list of indicators did not neces-sarily lead to the collection or development of data.
– In one state an ECCS-adopted list was deemed unwieldy and unfeasible for development, thus compelling a revision.
– According to an ECCS coordinator, “The first list was basically scrapped. They had indicators on it with no way of finding the information desired.”
◆ For ECCS grantees with no list, coordinators reported that the task appeared daunting. Several factors contributed to a lack of progress.
– The ECCS coordinators in these states tended to be individuals with program background, but who were unfamiliar with public health or epidemiological concepts and methods.
– Steering committees in these states had an orientation toward, and a greater focus on, program implementation and activities rather than data or information gathering and analysis.
– There was no other statewide group with an established track record on childhood indica-tors from which to build.
Analysis
The high likelihood of states having adopted at least one indicator in the social-emotional domain is encouraging. Social-emotional indicators are rela-tively new compared to others for early childhood. Their inclusion in state-developed lists suggests that the leadership of the ECCS was serious about including all domains. However, this finding is diffi-cult to generalize because of the potential for bias in the survey response. A state with a social-emotional indicator may have been more likely to respond to a survey on the topic than a state without one.
It is not surprising that substantiated child abuse was the most common indicator adopted. It is required under the Child Abuse Prevention and Treatment Act (CAPTA 1996) that this data be reported to the federal government by each state.24 In addition, this indicator represents measurement at the far-end of the spectrum which is often more readily available (see Figure 1).
Table 1: number and proportion of states who adopted selected indicators
Social-emotional indicator adopted* number of states that adopted indicator†
Percentage of states that adopted indicator
Child abuse rate 17 85% Dev/MH screenings 8 40%MH consultation in ECE 6 30% Foster care stability 5 25% Expulsion from ECE 3 15% Maternal depression screening 2 10% Kindergarten assessment of social-emotional skills 6 30%
*Abbreviated here to denote any indicator that involved the larger category- could have been just a number, a percentage, or a rate or a slight variation from the suggested list.†Out of 20 possible states.
State-level Indicators for Social-emotional Development: Building Better Systems 11
The finding that states pursued more technically difficult indicators to measure, such as rates of developmental and behavioral screening and the provision of mental health consultation in early care and education, is encouraging. Most states that selected these indicators performed some degree of data development and cross systems work to collect the indicators.
Almost half of the responding states adopted three or more indicators of social-emotional well-being. We interpreted this development as evidence that states were starting to move beyond measures at only the furthest end of the continuum. These additional indicators reflect movement toward a broader, more population-based range of indicators for social-emotional development and health (see Figure 1).
Social-emotional skills at kindergarten entry stand as an example of an additional indicator that states have adopted at the population level and one that also signals child- and family-level outcomes. This indicator holds potential as a way to assess both
social-emotional well-being and opportunities for system responses. Data from child developmental assessments at a population level can identify com-munity strengths and areas for improvement. This provides a mechanism for accountability and qual-ity improvement to optimize child development and fits into an ecological view of health and mental health promotion25 (see Appendices 1 and 2, which describe two state examples of the adoption of such an indicator).
Opportunities and challenges states encountered when developing social-emotional indicators were reported during the phone interview component of the study. The existence of a school readiness initia-tive in a state before the receipt of an ECCS grant proved to be a major facilitator of indicator develop-ment in the social-emotional domain. This finding also suggests that states with no prior initiative in place may need specific technical assistance or addi-tional funding to be successful.
Survey participants also described the challenges associated with indicator development. Challenges ranged from barriers posed by lack of expertise and knowledge on indicator development, to access to appropriate data and data systems, to systems-related obstacles such as financing and account-ability. Specific questions regarding indicator development included the availability of data, lack of clarity about definitions of indicators, and lack of knowledge on how to measure specific markers of progress. States that were most able to address these data challenges had partnered with universi-ties, non-profit institutes, or state agencies that had extensive experience with data collection, interpre-tation, and development. Top systems-related chal-lenges ranged from lack of funding for the develop-ment of indicators, to data being held in different agencies where there may be a reluctance to take a cross-systems approach, to confusion over the purpose and importance of indicator development. Staff turnover, changing environments and chang-ing fiscal conditions within states were also major contributors to the system challenges.
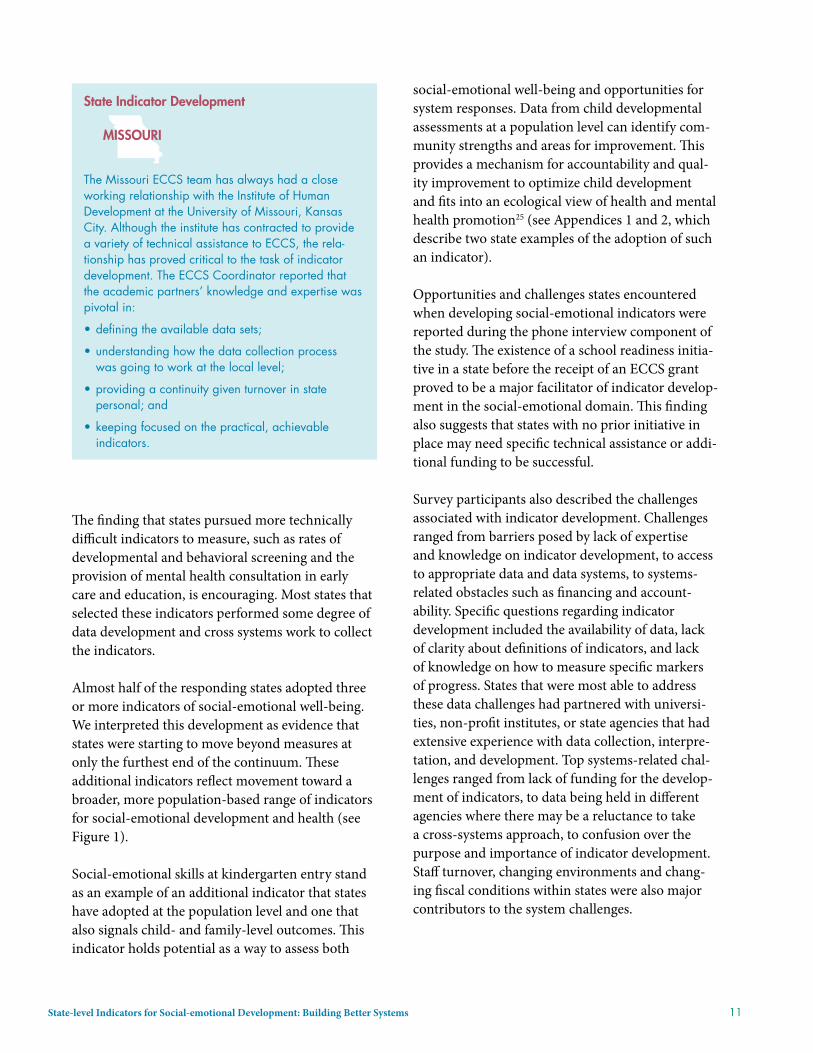
State indicator Development
MiSSOuRi
The Missouri ECCS team has always had a close working relationship with the Institute of Human Development at the University of Missouri, Kansas City. Although the institute has contracted to provide a variety of technical assistance to ECCS, the rela-tionship has proved critical to the task of indicator development. The ECCS Coordinator reported that the academic partners’ knowledge and expertise was pivotal in:
• defining the available data sets;
• understanding how the data collection process was going to work at the local level;
• providing a continuity given turnover in state personal; and
• keeping focused on the practical, achievable indicators.
12 National Center for Children in Poverty
creating Quality Indicators
Many states have challenges when developing indi-cators in the social-emotional domain given the lack of infrastructure in place to gather such informa-tion. Some key steps in choosing indicators and creating a system to collect them include prioritiza-tion, feasibility, and ensuring the quality of the data. Below we review these steps.
Identifying Priorities
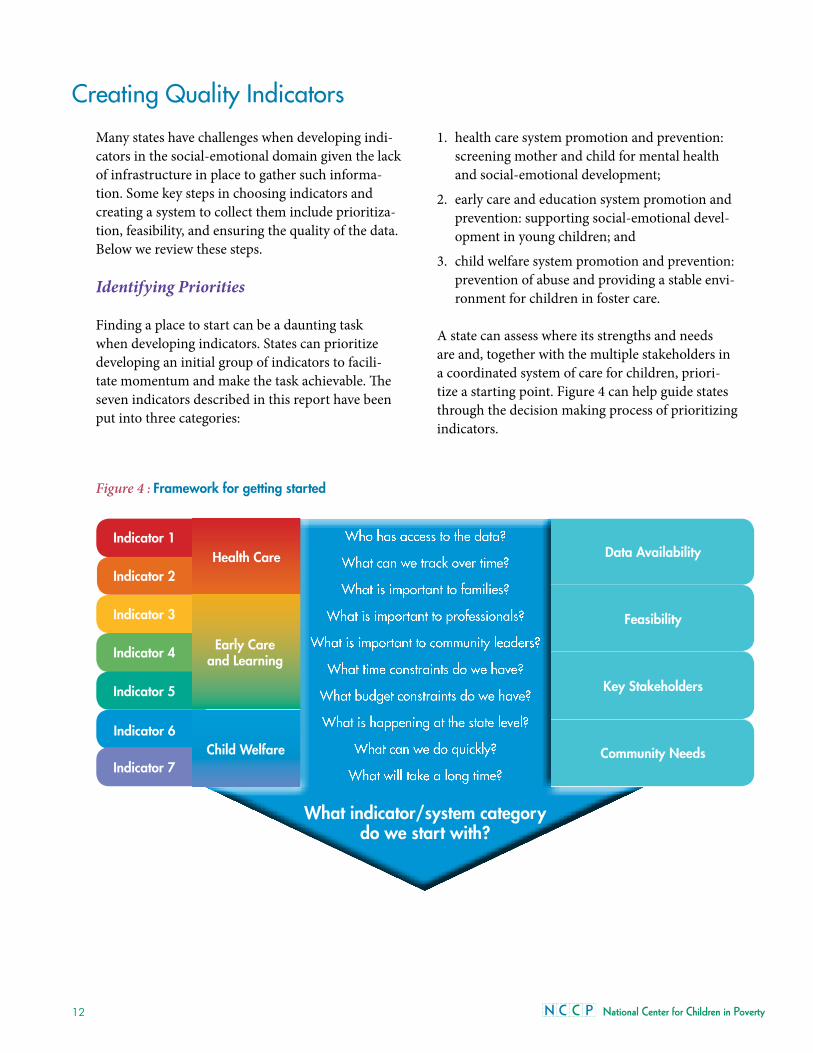
Finding a place to start can be a daunting task when developing indicators. States can prioritize developing an initial group of indicators to facili-tate momentum and make the task achievable. The seven indicators described in this report have been put into three categories:
1. health care system promotion and prevention: screening mother and child for mental health and social-emotional development;
2. early care and education system promotion and prevention: supporting social-emotional devel-opment in young children; and
3. child welfare system promotion and prevention: prevention of abuse and providing a stable envi-ronment for children in foster care.
A state can assess where its strengths and needs are and, together with the multiple stakeholders in a coordinated system of care for children, priori-tize a starting point. Figure 4 can help guide states through the decision making process of prioritizing indicators.
Figure 4 : Framework for getting started
indicator 2
indicator 1 Who has access to the data?
What can we track over time?
What is important to families?
What is important to professionals?
What is important to community leaders?
What time constraints do we have?
What budget constraints do we have?
What is happening at the state level?
What can we do quickly?
What will take a long time?
What indicator/system category do we start with?
Data Availability
Feasibility
Key Stakeholders
Community needs
indicator 3
indicator 4
indicator 5
indicator 6
indicator 7
Early Care and Learning
Health Care
Child Welfare
State-level Indicators for Social-emotional Development: Building Better Systems 13
Finding Data
The next step is to identify where data may be located within local and state governments and public systems. Because each state has various insti-tutions specific to that state, it is difficult to give a road map of exactly how to find the data in a given state. However, it is possible to provide guidelines that can be applied to many different indicators and states.
◆ Look for a population of focus where some information may be found initially.
– Information may be available about Head Start settings due to their national reporting requirements.26
◆ Ask regulatory agencies what information they already have and what information they have the potential to collect.
– Information on early care and educa-tion settings may be accessible through a Department of Health that is responsible for licensing child care settings.
◆ Examine national information data sets or surveys.
– Child and Family Service Reviews (CFSR) can give state level data, but not county level data, for the percentage of children birth to age 6 in out-of-home placement (foster care) with no more than two placements in a 24 month period (Thrive Indicator No. 6).27 The reviews also measure child and family well-being for children in the child welfare system. Ideally, state decision makers would want informa-tion at both levels, but the CFSR can provide a starting point for tracking at the state level.
– The National Children’s Survey gives state level information every other year based on a repre-sentative survey on the use of developmental screening in the health care system.28
◆ Tap available resources within your state for data expertise:
– a department of epidemiology at a state health or mental health department;
– a department or center of a local university or college focused on public health or results based initiatives; and/or
– a non-profit committed to early childhood issues with specific resources in this area.
Ensuring High Quality Indicators
Once a state has prioritized and identified possible sources of information, steps can be taken to ensure high quality indicators. Important markers of high quality include:
◆ a clear definition with delineated population and a set time frame;
◆ representing the indicator as a percentage or rate;
◆ information based on accurate data collection; and
◆ steps in place for calculating and under-standing the baseline, changes over time and interpretation.
Clear indicator definitions are essential so the information used in the baseline, tracking and later decision-making process is valid and accurate.
Resources for Developmental Screening indicators
The Commonwealth Fund has led efforts to improvedevelopmental screening for children through theirABCD initiative. They recently published a frameworkdeveloped by researchers from the UCLA Center forHealthier Children, Families and Communities tomeasure developmental services at the state, county,local, provider, and even individual level. This methodmay be of keen interest to state ECCS directors whoare grappling with the concept of measuring thedevelopmental services provided in their state.29
14 National Center for Children in Poverty
Indicators are most useful when they can be fol-lowed over time and used to compare across dif-ferent communities or states. If the values used are listed as the number of occurrences and not in the form of a rate or percentage (with a numerator and a denominator) it becomes more difficult to analyze shifts in populations over time or comparisons of different sized states or counties.
Since indicators are often taken from information gathered for other purposes, it is important to know the accuracy of the original documentation. Birth and death certificates are considered very accurate; school records on history of vaccination may be less so. It is important to understand where the informa-tion originated and how reliable it is before making decisions on using the indicator.
Once an indicator is clearly defined, presented as a percentage or rate, and found to be based on high quality data collection, the next, most difficult, part of indicator development occurs: establishing a baseline and tracking changes. Baselines for an
indicator without prior data available, such as pre-school expulsion rate, may take states a couple years to establish. A more accurate picture is likely to emerge when a state or other entity counts and then averages the number of children who are expelled over four or five years rather than initially compar-ing expulsions in two consecutive years. Other more general population indicators, such as the percent-age of children receiving developmental and mental health screening with a validated tool, are amenable to having an established baseline the first year of collection.
Tracking changes must also be carefully considered for each indicator. For example, if the rate of sub-stantiated child abuse increases by 50 percent, what does this tell us? Is it that more cases of abuse are identified (as in fewer “missed”) or is it that more cases of abuse are occurring, and the same percent of all cases is being reported? Context is important. Knowing and understanding local conditions and history is fundamental to interpreting information at the early stages of data collection.
conclusion
States are progressing towards developing an infra-structure to support data collection and analysis that will help further the social-emotional develop-ment of them and the systems that support young children. The task of developing a robust system to help understand data and inform planning, programming, and policy can be challenging, but ultimately achievable if individuals or entities focus on the spectrum of social-emotional well-being and the quality of indicators. States are taking the initiative and creating new ways to think about indicator development. This report, together with the “Guide for Local Stakeholders: Indicators for Social-emotional Development in Early Childhood,” which contains more details on indicator develop-ment, can assist states as they move forward in this effort. Other approaches are also being tested by some states, including the use of kindergarten assessments, which is a potential new avenue with
the ability to build a system from local, state, and federal information.
Quality indicators will enhance a state’s understand-ing of the well-being of their children. For states that are beginning the process, much can be learned from the experiences of sister states, some of which has been presented in this brief. Also included are an appendix with a glossary of terms used in indica-tor development and a quality indicator check list to help vet each indicator proposed.
By carefully planning the development of the agreed upon indicators, including definition, accuracy, and interpretation, states can start to put these indicators to use. Assessing, tracking, and intervening on the social-emotional domain of early childhood develop-ment can help improve the mental health and learn-ing abilities of young children and future citizens.
State-level Indicators for Social-emotional Development: Building Better Systems 15
1. Shonkoff, J. P.; Boyce, W. T.; McEwen, B. S.; Shonkoff, Jack P.; Boyce, W. Thomas; McEwen, Bruce S. 2009. Neuroscience, Molecular Biology, and the Childhood Roots of Health Disparities: Building a New Framework for Health Promotion and Disease Prevention.[See Comment]. JAMA 301(21): 2252-2259.
2. Bierman, K.; Domitrovich, C.; Nix, R.; Gest, S.; Welsh, J.; Greenberg, M.; Blair, C.; Nelson, K.; Gill, S. 2008. Promoting Academic and Social-emotional School Readiness: The Head Start Redi Program. Child Development 79(6): 1802-1817.
Domitrovich, Celene; Cortes, Rebecca; Greenberg, Mark. 2007. Improving Young Children’s Social and Emotional Competence: A Randomized Trial of the Preschool “Paths” Curriculum. The Journal of Primary Prevention 28(2): 67-91.
O’Connell, M E; Boat, T.; Warner, KE (eds.). 2009. Preventing Mental, Emotional, and Behavioral Disorders among Young People: Progress and Possibilities. Washington, DC: The National Academies Press.
3. Bagdi, Aparna; Vacca, John. 2005. Supporting Early Childhood Social-emotional Well-being: The Building Blocks for Early Learning and School Success. Early Childhood Education Journal 33(3): 145-150.
Briggs-Gowan, Margaret J.; Carter, Alice S. 2008. Social-emotional Screening Status in Early Childhood Predicts Elementary School Outcomes. Pediatrics 121(5): 957-962.
Knitzer, J.; Lefkowitz, J. 2005. Emotional Health and School Readiness in Young Children and Families: A Community Guide. New York: National Center for Children in Poverty, Columbia University Mailman School of Public Health.
4. MCHB requires health status and health systems indicators. The health status indicators include information on low-birth weight births, injury death rates in children, etc. The health systems indicators compare Medicaid and non-Medicaid outcomes for low-birth weight and infant mortality and assess Medicaid and CHIP eligibility levels as well as provide checks and balances on data collection.
Maternal and Child Health Bureau. 2009. Search Title V Information System. Accessed March 1, 2010, from https:// perfdata.hrsa.gov/mchb/TVISReports/NarrativeSearch/ SearchBySection.aspx?Type=NarrativeSearch&Action=S&Sect ion=IVE.
5. State Profiles: School Readiness Indicators and Lessons Learned. 2004. Newport, RI: Rhode Island Kids Count.
Getting Ready: Findings from the National School Readiness Indicators Initiative: A 17 State Partnership. 2005. Rhode Island Kids Count.
Miller, Ruth. 2009. Report to the Governor on the Staus of Early Childhood. Lincoln, NE: Early Childhood Interagency Coordinating Council.
6. For further review of this process see Short Take No. 7 (http://www.nccp.org/publications/pdf/text_822.pdf) and the local indicator guide (http://www.nccp.org/publications/pdf/text_901.pdf)
Johnson, Kay; Davidson, Leslie; Theberge, Suzanne; Knitzer, Jane. 2008. Short Take No. 7: State Indicators for Early Childhood. New York: National Center for Children in Poverty, Columbia University Mailman School of Public Health.
7. This report can be found at http://www.nccp.org/publica-tions/ pub_901.html.
8. See endnote 6.
9. Getting Ready: Findings from the National School Readiness Indicators Initiative: A 17 State Partnership. 2005. Rhode Island Kids Count.
Friedman, M. 2005. Trying Hard Is Not Good Enough: How to Produce Measurable Improvements for Customers and Communities. Victoria, BC: Trafford Publishing.
10. National Research Council (U.S.). Committee on Depression Parenting Practices and the Healthy Development of Children. 2009. Depression in Parents, Parenting, and Children: Opportunities to Improve Identification, Treatment, and Prevention. Washington, DC: National Academies Press.
11. See endnote 10.
Weissman, Myrna M.; Pilowsky, Daniel J.; Wickramaratne, Priya J.; Talati, Ardesheer; Wisniewski, Stephen R.; Fava, Maurizio; Hughes, Carroll W.; Garber, Judy; Malloy, Erin; King, Cheryl A.; Cerda, Gabrielle; Sood, A. Bela; Alpert, Jonathan E.; Trivedi, Madhukar H.; Rush, A. John; Star D. Child Team. 2006. Remissions in Maternal Depression and Child Psychopathology: A Star*D-Child Report 295: 1389-1398.
12. Earls, M. F.; Andrews, J. E.; Hay, S. S. 2009. A Longitudinal Study of Developmental and Behavioral Screening and Referral in North Carolina’s Assuring Better Child Health and Development Participating Practices. Clinical Pediatrics (Philadelphia) 48(8): 824-833.
13. See endnote 12.
Johnston, Kadija; Brinamen, Charles. 2009. Mental Health Consultation: A Transactional Approach in Child Care. In Handbook of Infant Mental Health (3rd ed.: 564-577). New York, NY: Guilford Press; U.S.
14. Gillam, Walter. 2005. Prekindergarteners Left Behind: Expulsion Rates in State Prekindergarten Systems. New Haven, CT: Yale University Child Study Center.
15. Kaufmann, R.; Perry, D.; 2009. Integrating Early Childhood Mental Health Consultation with the Pyramid Model. Accessed October 14, 2010 from http://www.challengingbehavior.org/do/resources/documents/brief_integrating.pdf.
endnotes
16 National Center for Children in Poverty
16. Cooper, J. L.; Banghart, P.; Aratani, Y. 2010. Addressing the Mental Health Needs of Young Children in the Child Welfare System: What Every Policymaker Should Know. New York: National Center for Children in Poverty, Columbia University Mailman School of Public Health.
17. National Child Care Information and Technical Assistance Center. QRIS Definition and Statewide Systems. Accessed Jan., 28, 2010, from http://nccic.acf.hhs.gov/pubs/qrs-defsystems.html.
18. Smith, S.; Schneider, W.; Kreader, J. L. Features of Professional Development and On-site Assistance in Child Care Quality Rating Improvement Systems: A Survey of State-wide Systems. New York: National Center for Children in Poverty, Columbia University Mailman School of Public Health.
19. National Center for Children in Poverty. 2010. Early Childhood Comprehensive Initiatives. Accessed Oct.16, 2010, from http://www.nccp.org/projects/thrive_abouteccs.html.
20. Results Based Accountability is defined as a management style, usually in government, that sets clear goals and then collects information based on that goal to evaluate if the goal is being met. If goals remain unmet changes in funding and structure are then taken to meet the prescribed goal. (see http://www.resultsaccountability.com/ for further details).
21.Please refer to the Project Thrive Webinar to hear more about the Kansas experience in developing indicators (http://nccp.org/projects/events/event_113.html).
22. Due to low response rate, similar results for the territories are unavailable.
23. This finding was validated by returning to the survey results and cross referencing the Getting Ready list with the states that had responded with an indicators list. Half of the responders were Getting Ready states, despite the fact that only a third of all states participating in Getting Ready.
Rhode Island KIDS COUNT. February 2005. Getting Ready: Findings from the National School Readiness Indicators Initiative: A 17 State Partnership.
24. U.S. Department of Health and Human Services, Adminstration for Children and Families, Administration on Children, youth and Families, Children’s Bureau. 2010. Child Maltreatment 2008. Accessed April 27, 2010, from http://www.acf.hhs.gov/programs/cb/pubs/cm08/cm08.pdf.
25. D’Angiulli, A.; Herdman, A.; Stapells, D.; Hertzman, C.; D’Angiulli, Amedeo; Herdman, Anthony; Stapells, David; Hertzman, Clyde. 2008. Children’s Event-related Potentials of Auditory Selective Attention Vary with Their Socioeconomic Status. Neuropsychology 22(3): 293-300.
Lloyd, J. E.; Hertzman, C.; Lloyd, Jennifer E. V.; Hertzman, Clyde. 2009. From Kindergarten Readiness to Fourth-Grade
Assessment: Longitudinal Analysis with Linked Population Data. Social Science & Medicine 68(1): 111-123.
26. Office of Head Start. 2009. 2008-2009 Performance Indicators Version 2.2 - December 16, 2009. Accessed Jan. 28, 2010, from http://eclkc.ohs.acf.hhs.gov/hslc/Program%20Design%20and%20Management/Head%20Start%20Requirements/Progam%20Information%20Report/2008-2009%20PIR%20Performance%20Indicators.pdf
27. Children’s Bureau Website - Child Welfare Monitoring. Accessed June 1, 2010, from http://www.acf.hhs.gov/programs/cb/cwmonitoring/index.htm.
28. U.S. Department of Health and Human Services Health Resources and Service Administration Maternal and Child Health Bureau. 2009. The National Survey of Children’s Health 2007. Rockville, MD: U.S. Department of Health and Human Services, 2009.
29. Halfon, N.; Stanley, L.; DuPlessis, H. 2010. Measuring the Quality of Developmental Services for Young Children: A New Approach. The Commonwealth Fund.
State-level Indicators for Social-emotional Development: Building Better Systems 17
Child and Family Service Review (CFSR): State level review conducted by the Children’s Bureau, within the United States Department of Health and Human Services, to help States improve safety, per-manency, and well-being outcomes for children and families who receive services through the child wel-fare system. The CFSR monitors states’ conformity with the requirements of Title IV-B of the Social Security Act as well as provides a mechanism for quality improvement of services.1
Defined Population: Different indicators will have different populations to be considered as part of the denominator. The defined population could be number of child care settings or it could be all chil-dren under the age of 6, depending on the indicator.
Denominator: The population that could have had an occurrence. Depending on the indicator sug-gested in this document it could be all children in a defined age group that live in a state, or number of early care and education settings in a state.
Developmental Screening: In this document means the use of a validated screening tool to assess child development. The American Academy of Pediatrics (AAP) Guidelines on the use of Developmental Screening can be found on their website.2
Indicator: In results-based accountability terms an indicator, sometimes called a benchmark, is a mea-sure supported by reliable and routinely available data, that helps to quantify the achievement of the desired result.3
Maternal Depression: Mild, moderate, and severe clinical depression in a mother of a minor child. The depression is diagnosed in the mother but the presence of the illness causes significant and lasting effects on the child.
Mental Health Consultation in Early Care and Education: “Early childhood mental health consul-tation aims to improve the ability of staff, families, programs, and systems to prevent, identify, treat and reduce the impact of mental health problems among children from birth to age 6 and their families.”4 This intervention requires collaboration among mental health consultants, parents and/or caregiv-ers, and ECE staff.
Numerator: The number of occurrences. It could be the number of children screened or the number of early care and education settings with mental health consultation, depending on the indicator suggested in this document.
Outcome: The result of an intervention; a measure-ment taken to assess the effectiveness or conse-quence of a specific action or occurrence; or a type of indicator referring to an endpoint status of a child or mother, rather than a program or process.
Quality Rating Improvement Systems: In early care and education a QRIS (sometimes referred to as a QRS) is a system that rewards early care and education settings for achieving set quality goals with recognition of that achievement and provides parents (consumers) with the information to make knowledgeable decisions regarding quality.5
appenDIx 1Glossary of terms and related resources for Developing Social-emotional Indicators
18 National Center for Children in Poverty
Rate: A ratio that is calculated to take time into account. Commonly denoted as occurrences per 100 (or 1,000 or 10,000) per year.
Ratio: The number between zero and one that you calculate by dividing the numerator by the denominator. Multiply the ratio by 100 to obtain percentage.
Social-emotional curriculum: Evidence-based or research informed curriculum for enhancing social-emotional skills in an early educational setting. Examples include but are not limited to Tools of the Mind, REDI-Head Start, and PATHS.6
Social-emotional development: A domain of early child development that describes the acquisition of the skills for interacting and maintaining rela-tionships with others. Important competencies in social-emotional development are self-awareness, self-regulation, empathy, and emotional under-standing. These competencies are essential in devel-oping initiative in learning and leading to quality interactions with adults and peers.
Substantiated cases of child abuse or neglect: Theresult of an investigation in the child welfare systemwhere disposition concludes that the allegation ofmaltreatment or risk of maltreatment was supportedor found by state law or state policy. This isthe highest level of finding by a state agency.7
__________
1. Christian, Steve. 2001. Child and Family Service Reviews: Implications for State Oversight of Local Child Welfare Agencies. National Conference of State Legislatures State Legislative Report 26(5).
Cooper, J. L.; Banghart; P., Aratani, Y. 2010. Addressing the Mental Health Needs of Young Children in the Child Welfare System: What Every Policymaker Should Know. Retrieved Oct. 16, 2010.
2. Committee on Children With Disabilities. 2001. Developmental Surveillance and Screening of Infants and Young Children. Pediatrics 108(1): 192-195.
3. Johnson, Kay; Davidson, Leslie; Theberge, Suzanne; Knitzer, Jane. 2008. Short Take No. 7: State Indicators for Early Childhood. New York: National Center for Children in Poverty.
4. Duran, F.; Hepburn, K.; Irvine, M.; Kaufman, R.; Anthony, B.; Horen, N.; Perry, D. 2009. What Works? A Study of Effective Early Childhood Menal Health Consultation Programs. Retrieved Oct. 14, 2010, from http://gucchd.georgetown.edu/products/FINAL%20formatted%20flyer.pdf.
5. For further details see: http://nccic.acf.hhs.gov/pubs/qrs-defsystems.html.
6. Cooper, Janice L. ; Masi, Rachel; Vick, Jessica. 2009. Social-emotional Development in Early Childhood: What Every Policymaker Should Know. Retrieved Oct.16, 2010.
7. U.S. Department of Health and Human Services, Administration for Children and Families, Administration on Children, youth and Families, Children’s Bureau. 2010. Child Maltreatment 2008. Retrieved April 27, 2010, from http://www.acf.hhs.gov/programs/cb/pubs/cm08/cm08.pdf.
State-level Indicators for Social-emotional Development: Building Better Systems 19
Since 2000, North Carolina, with support from the Commonwealth Fund, has been strategic in their efforts to improve statewide and local ability to identify children with developmental delays, includ-ing delays or difficulties in social and emotional development. The state has implemented a qual-ity improvement effort to support the appropriate use of validated developmental screenings in child health care settings. This strategy has provided a model for the rest of the nation.
North Carolina built on the developmental screen-ing effort already underway to identify a social-emotional indicator. They are one of the states using a type of kindergarten assessment to build a social-emotional indicator. The form of assessment is based on the required medical form completed by health providers for all kindergarteners entering school.
On their Kindergarten Entry Physical Examination form, the state has included a section that requires the child health care provider to record results of a multi-domain developmental screen broken into separate components. The types of developmen-tal screens that a provider can use in order to be reimbursed by Medicaid are limited to designated validated screens. This limit is set by the Medicaid agency and reflects the state’s EPSDT screening standards.
From this kindergarten entry physical examination form with developmental screening information, data can be aggregated. The scores for social-emo-tional development on the screen can create a state-wide population-level indicator.
The effort has not been without challenges. The form is not submitted electronically, because neither the health care nor the education systems can cur-rently support a completely digital format. Therefore the information needs to be entered by hand. This is not unusual for school entry forms used across the country for health care information, such as data onvaccination compliance or weight.
Incomplete forms have also been an issue, where the developmental screen section is omitted by the health care professionals. But local efforts to improve reporting have helped. Anecdotally, local leaders tell of winning health care professionals over when the professionals come to appreciate the abil-ity to communicate their developmental concerns via the form to the school personal. Practitioners are also heartened that the information they are fill-ing out is actually being collected to have meaning and use.
Ideally, once some of the initial operational hurdles in the system are resolved, North Carolina will have an information infrastructure containing a developmental assessment with a validated tool for every kindergartener. One could imagine this sys-tem moving to include preschoolers and children in early care and education settings.
The benefits to be accrued as a result of implement-ing such a system of screening and monitoring are many, given the information being collected both at the individual and population levels. In addi-tion, both the scale of this endeavor and the lessons learned will allow others to replicate the process. Twenty-five states, the District of Columbia and Puerto Rico have worked with the Commonwealth Fund and their ABCD initiative to improve devel-opmental screening. It is possible that all of those states and territories could also work to create a social-emotional indicator based on their develop-mental screening work. By working with the ABCD initiative with these 25 states, ECCS grantees can take advantage of the lessons in data collection methods learned in North Carolina.
appenDIx 2north carolina’s Social-emotional Indicator Development Using Kindergarten entry medical forms
20 National Center for Children in Poverty
appenDIx 3rhode Island’s Social-emotional Indicator Development Using Kindergarten assessment Information
For over 10 years the Department of Education (DOE) of Rhode Island, in conjunction with the Center for School Improvement and Educational Policy at the University of Rhode Island (URI), has conducted a survey of students across multiple grades in the state. They have used the SALT Survey, School Accountability of Learning and Teaching, known nationally as the High Performance Learning Communities (HiPlaces) Assessment.
When the state’s ECCS realized the value of infor-mation within the SALT Survey, they were able to collaborate with the Department of Education and URI to identify components in the teacher assess-ment that reflected the state of children’s social-emotional development upon kindergarten entry.
Rhode Island ECCS teamed with the URI research staff and identified questions in the kindergarten teacher assessment that best fit the development of a social-emotional indicator. Research staff at the university were then able to examine the reliability and accuracy of pulling out the specific data. ECCS and research staff worked together on a yearly basis to track changes at the population level across all kindergarteners entering school in Rhode Island.
This arrangement had no additional overhead cost, only that which was already in place for the administration of the SALT survey and the ECCS team. Because it encompassed all children in Rhode Island, there were no concerns regarding represen-tativeness of the findings.
As a result of this collaboration, Rhode Island
adopted the following social-emotional indicators:
◆ Rate of kindergarten students who have difficulty working with others;
◆ Rate of kindergarten students who are disruptive in class; and
◆ Rate of kindergarten students who are overly aggressive to peers.
This example speaks strongly to the importance of communication and knowledge of the many systems that serve and collect data on children. In larger states, it may not be feasible to survey every child or use such an extensive evaluation as the SALT Survey. The take home message is to find out if another department or system may already be col-lecting information that can be accessed and used in a different manner. Through collaboration and cross-system work, the information in the DOE was accessed and utilized by the Rhode Island ECCS grantees working across health, early education and social care.