Embed Size (px)
Citation preview

1
State Lotteries at the Turn of the Century: Report to the National Gambling Impact Study Commission1 Charles T. Clotfelter, Philip J. Cook,
Julie A. Edell and Marian Moore2 Duke University June 1, 1999
This report provides an overview of lottery operations, with particular attention to who
plays the lottery, how the lotteries are marketed, and what kinds of policy alternatives exist for
state and federal policymakers. Section I of the report provides a descriptive overview of state
lotteries, a statistical profile, and a description of the distribution and size of their revenues.
Section II discusses the findings from the national survey of gambling conducted by NORC for
the Commission. Section III presents a preliminary analysis of data available to marketers as well
as an initial assessment of marketing plans. The final section of the report discusses the prominent
policy issues involved in the legalization and operation of state lotteries.
I. Overview and Description
Until 1964, lotteries were illegal in every state in this country. Today they are operated in
37 states and the District of Columbia. They are also a worldwide phenomenon: there are 100
countries where lotteries are legal.
History
Although we mark the beginning of the “modern” lotteries in 1964, when New Hampshire
launched its game, lotteries actually enjoy an honored place in American history as a device for
raising funds for public purposes. They provided funding for such projects as the Jamestown
settlement, Harvard College, and the Continental Army, as well as public works projects
throughout the Colonies and early States. Lotteries fell into disrepute after the Civil War, and,
following the demise of the scandal-plagued Louisiana Lottery in 1894, they ceased to exist for
the next seven decades.
Since 1964 their numbers have grown rapidly, along with their popularity. While only one

2
other state joined the ranks of lottery states during the 1960s (New York), 12 states adopted
lotteries during the 1970s, and another 18 states did so during the 1980s. That only six states
adopted lotteries in the 1990s is testament less to waning enthusiasm than to the dwindling
number of non-lottery states. As of February 1999, 37 states plus the District of Columbia
operated lotteries.3
Growth in Sales
As a way of showing how lotteries have grown and evolved over time, Table 1 presents
summary sales data for three representative years: 1973, 1987, and 1997. While the number of
lottery states increased from seven to 38 over this period, total state-lottery sales increased from
$2.0 billion in 1973, to $17.6 billion in 1987, to $34 billion (not counting video lottery game
sales) in 1997. This rapid growth is attributable not only to the expansion of lotteries into new
states, but also to the increase in per capita sales, from $35 per capita in 1973 to $150 in 1997.
Not counting the VLT’s, whose sales figures are not comparable to the other lottery games,4 the
growth in per capita lottery sales slowed considerably from the first period shown in the table to
the second. Whereas per capita sales grew at an annual rate of 9.2 percent between 1973 and
1987, they grew at only 1.6 percent a year from 1987 to 1997.5
The Lottery Products
The “product line” of state lotteries deserves some description, in part because it has
continued to evolve over time. The lotteries of today consist of five principal games: instant
games, daily numbers games, lotto, keno, and games utilizing video lottery terminals, although
none of these were in evidence when New Hampshire inaugurated the modern lottery era. Thus it
is helpful to begin with that earliest game, passive drawings.
Passive drawings. The lottery game introduced by New Hampshire in 1964 was not unlike
the lotteries of Colonial times. It was a sweepstakes, essentially a raffle in which bettors bought
tickets and waited days or weeks to see if their ticket was drawn. Today this old-fashioned game
is virtually extinct, having been replaced by games with quicker payoff, bigger prizes, and greater
intrinsic “play value.”
Scratch-off instant games. The lotteries’ first major innovation, introduced in the early
1970s, was the instant game, which utilized a paper ticket with spaces that could be scratched,
revealing beneath the covering numbers or words indicating whether the ticket was a winning one.

3
This game offered the attraction of immediate gratification and, in most cases, an immediate cash
payoff from the authorized sales representative. Made possible by cheat-proof materials and
elaborate security measures, these games offered lotteries the opportunity to make regular
changes to the product line by varying the themes and game details. They also provide new
lottery agencies with an easy way to begin operations before they have installed a network of
computerized terminals, which are needed for the more advanced lottery products. One feature
that may become increasingly important is that instant tickets can easily be sold in vending
machines, thus freeing the retail outlet from using its staff to sell tickets. Such machines open up
the possibility that minors might have easy access to lottery tickets, which means they must be
placed in stores where they can be observed by employees or used in bars and lounges, where
minors will presumably not congregate.
Daily numbers games. The second innovation was a daily numbers game, a computerized
imitation of the illegal game that has long been popular in many urban areas. Designed to appeal
largely to this pre-existing market, this game, like its illegal counterpart, allows players to choose
their own three- or four-digit numbers, thus giving bettors the sense that they are “players,”
actively involved in the gambling process. Further enhancing this “play value,” and also
emphasizing its urban and illegal pedigree, is the variety of types of bets that the bettor can choose
to make, each with a different probability and payout. The game makes it easy for bettors to
choose and stick with a favorite number and a certain type of bet on that number.
Lotto. Without a doubt, the “signature” lottery product is lotto, another game that
requires computers and communication networks. Again allowing bettors to choose their own
numbers, this game asks them to pick a handful of numbers from a much larger set. For example,
bettors might pick six numbers from a field of 44. Drawings of winning numbers typically take
place twice a week. Unlike the 1,000 to 1 chance of correctly picking a three-digit numbers
drawing, the odds of correctly picking the combination of numbers drawn in a lotto game can be
astronomical. In the 6/44 format noted above, for example, the probability of picking all six
numbers correctly is 1 in 7.1 million. Although part of the proceeds in lotto games are paid to
those who pick almost all of the numbers correctly, the jackpots reserved for the winning
combinations have garnered most of the attention in this game, especially when several
consecutive drawings occur with no winner and the prize fund is “rolled over.” Since sales
typically rise when jackpots are large, designers of lotto games attempt to choose formats that
produce occasional rollovers, which means tailoring the format (and probability of having a
winner) to the size of the betting population. Choosing a probability that is too low results in
having too many consecutive drawings without a winner, which causes players to become

4
discouraged. Choosing a probability that is too high results in very few rollovers, and multiple
winners, thus diluting the size of grand prizes. In the design of lotto games, there is an inherent
advantage in drawing from a large population, which makes it possible for the game designer to
choose small-probability formats, thus producing large jackpots. To offset the disadvantage of
small size, some states have banded together in several multi-state consortia to run lotto games.
The largest of these is the Multi-State Lottery Association, which runs the Powerball lotto game,
a game that produced in 1998 jackpots of $195 and $295 million.6 Jackpots such as these are
usually stated as the undiscounted sum of 20 or more annual payments from an annuity purchased
at the time of the drawing, a number much larger than the cash value of the prize.7
Keno. Similar to lotto, keno is a game long associated with casinos that requires bettors
to choose a few numbers -- how many is up to the player -- out of a larger group of numbers,
with drawings held quite often, often several times an hour. The payoff to a winning bet is a
function of how many numbers the bettor chose, which corresponds to the probability of winning
in each case. Like video lottery games, described below, keno seems best suited for bars and
lounges, where bettors make multiple bets over the course of a single session. Keno was the
center of controversy in California in 1996, when the state’s supreme court ruled that state’s keno
game unconstitutional, arguing that the game’s fixed payouts violated the state’s prohibition
against “banked” games, wherein the gambling operator (“the house”) stands to lose if bettors are
very lucky. In response to the decision, the game was quickly altered, putting its payouts on a
parimutuel basis.8
Video lottery games. The fifth distinct type of game now being operated by state lottery
agencies is, like keno, akin to betting that takes place in casinos. Like arcade video machines,
video lottery terminals (VLT’s) can be programmed to carry a wide variety of games; video poker
is a common game used in VLT’s. Like conventional slot machines, they offer bettors the chance
to play a game and receive immediate payouts for winning bets. These games have grown
dramatically in a few states, but have not been adopted in others, in part due to concerns that this
type of action may entice some to play more than they can afford.
Change in Product Mix
Table 1 demonstrates how the “product mix” has changed over time. In 1973, when
instant scratch-off tickets were just being introduced, passive drawings accounted for 99 percent
of lottery sales. By 1987, however, they had virtually disappeared, having been replaced by three
games: the instant scratch-off, daily numbers, and lotto, having market shares of 24, 37, and 40
5
percent, respectively. The product mix continued to evolve, with the addition of keno and video
lottery games. In the decade between 1987 and 1997, daily numbers games grew hardly at all,
lotto showed solid growth, and instant games grew at a fever pace. By 1997, instant scratch-off
games accounted for 42 percent of sales, almost twice the share they held in 1987. Lotto was
second, taking 30 percent of total non-VLT sales. Keno, which was available in 12 states,
weighed in with a 5 percent market share. VLT=s, available in only five states, sold a remarkable
$2.3 billion, or about $313 per capita in those states. Table 2 shows sales by game by state.
While every state offers instant scratch-off games and lotto and most offer daily numbers games,
keno and VLT=s, as noted above, are offered in only a few states.
A Summary of Operations: 1997
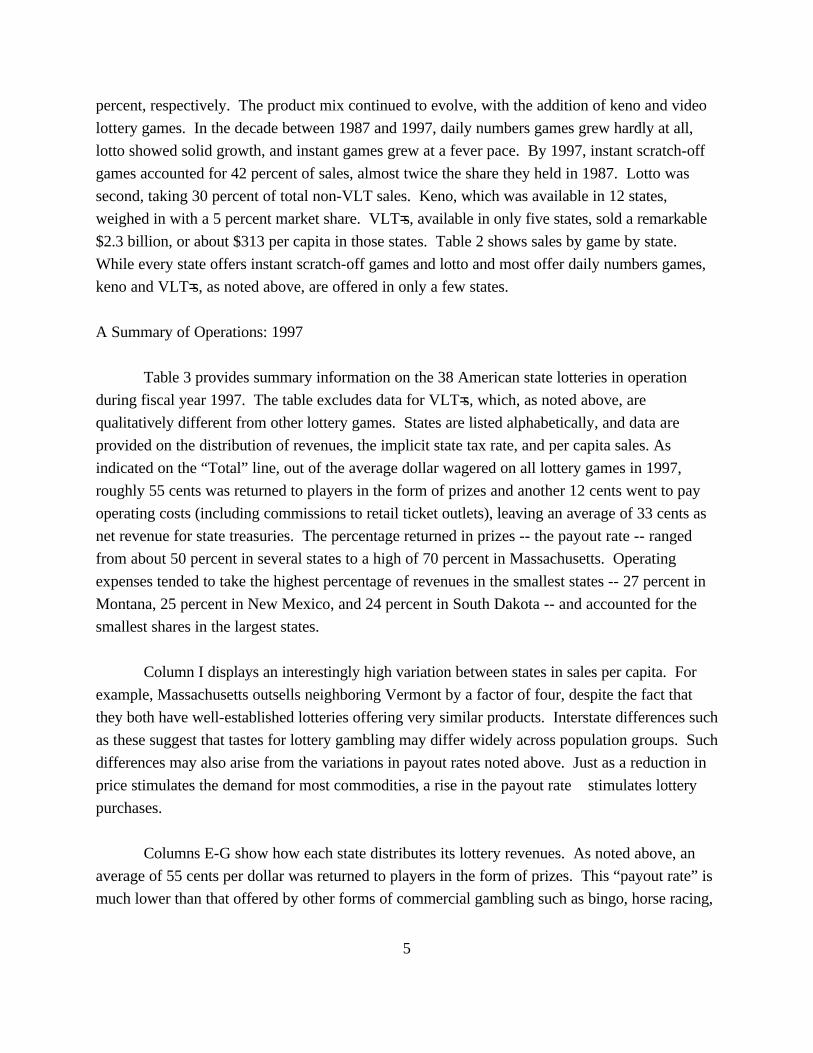
Table 3 provides summary information on the 38 American state lotteries in operation
during fiscal year 1997. The table excludes data for VLT=s, which, as noted above, are
qualitatively different from other lottery games. States are listed alphabetically, and data are
provided on the distribution of revenues, the implicit state tax rate, and per capita sales. As
indicated on the “Total” line, out of the average dollar wagered on all lottery games in 1997,
roughly 55 cents was returned to players in the form of prizes and another 12 cents went to pay
operating costs (including commissions to retail ticket outlets), leaving an average of 33 cents as
net revenue for state treasuries. The percentage returned in prizes -- the payout rate -- ranged
from about 50 percent in several states to a high of 70 percent in Massachusetts. Operating
expenses tended to take the highest percentage of revenues in the smallest states -- 27 percent in
Montana, 25 percent in New Mexico, and 24 percent in South Dakota -- and accounted for the
smallest shares in the largest states.
Column I displays an interestingly high variation between states in sales per capita. For
example, Massachusetts outsells neighboring Vermont by a factor of four, despite the fact that
they both have well-established lotteries offering very similar products. Interstate differences such
as these suggest that tastes for lottery gambling may differ widely across population groups. Such
differences may also arise from the variations in payout rates noted above. Just as a reduction in
price stimulates the demand for most commodities, a rise in the payout rate stimulates lottery
purchases.
Columns E-G show how each state distributes its lottery revenues. As noted above, an
average of 55 cents per dollar was returned to players in the form of prizes. This “payout rate” is
much lower than that offered by other forms of commercial gambling such as bingo, horse racing,

6
or slot machines.9 It is important to note, however, that payout rates are not strictly comparable
from one game to the next. Games such as these three forms of commercial gambling typically
involve a sequence of multiple bets in a given betting “session.” When dollars are cycled through
several times a day, the expected prize per dollar will be less than the payout for a single bet.10
Among all the lottery products, VLT=s appear to be qualitatively different from the rest. This type
of game typically involves multiple bets, wherein winnings are “recycled” several times per
session. For this reason, the higher payout rates recorded for VLT sales appear not to be strictly
comparable to the payout rates for the other games sold by lotteries.11
Lotteries as a Revenue Source
A principal justification, if not the only one, given for the adoption of state lotteries is
revenue. The revenue arises from the “profit” that a state makes, the amount left over after prizes
are awarded and retailer commissions and other operating expenses are paid. For all practical
purposes, this profit amounts to an “implicit tax,” and is comparable to an excise tax levied at a
certain rate on the purchases of a particular product. So, while a lottery is not a tax, one
important component of it is indeed comparable to a tax. In the same way analysts would be
interested in conventional taxes, it is useful here to note three aspects of this implicit tax: the
earmarking of it for specific purposes, its importance to state revenues, and its rate.
Earmarking. Just as gasoline taxes are often reserved for use in highway construction, the
revenues from many state lotteries are earmarked for certain purposes. Of the 38 state lotteries
(as above, the D.C. lottery is treated as a state lottery), the revenue from only 10 go into their
general funds. Of the remaining states, 16 earmark all or part of their lottery revenues for
education, making that the most common use of lottery funds. Other uses range from the broad
(parks and recreation, tax relief, and economic development) to the narrow (Mariners Stadium in
Washington and police and fireman pensions in Indiana).12 While earmarking might be an excellent
device for engendering political support for a lottery, there is reason to doubt if earmarked lottery
revenues in fact have the effect of increasing funds available for the specified purpose. When
expenditures on the earmarked purpose far exceed the revenues available from the lottery, as is
the case with the general education budget, there is no practical way of preventing a legislature
from allocating general revenues away from earmarked uses, thus blunting the purpose of the
earmarking.13 Empirical studies of this question are in fact consistent with this kind of
reallocation.14
Amount. The lotteries’ contributions to state budgets are modest, as shown in Table 4. In

7
1997, total revenues from the 38 state lotteries amounted to only about 2.2 percent of the own-
source general revenue for those same states. By contrast, state general-sales taxes and income
taxes each averaged one quarter of all own-source general revenue collected by states.15 However,
the amount raised per capita differed greatly by state, as indicated in Column (J) in Table 3.
Averaging $49 per capita in 1997, this per capita figure ranged from $7 in Montana to $120 in the
District of Columbia.
Implicit tax rate. It is highly instructive to compare the lottery’s implicit rate of tax to
excise taxes that might be thought of as comparable. It turns out that the implicit tax rates on
lotteries are quite high compared to tax rates on other commodities that states tax, such as
alcoholic beverages and tobacco products. Calculations we made for 1985 allowed one to
compare the implicit tax rate on lotteries to the excise tax rates on several commonly-taxed
products, all expressed as ad valorem taxes as a percentage of the net-of-tax price. The average
excise tax rates on four products, counting federal, state and local taxes, were: beer, 15 percent;
wine, 17 percent; liquor, 43 percent; tobacco products, 49 percent. By contrast, the comparable
implicit tax rate on lotteries was 85 percent.16 Since that time, these rates have tended to
converge. The percentage of lottery sales going to state net revenues has declined since 1985,
from about 41 to 33 percent, making the implicit tax rate on lotteries in 1997 something like 61
percent.17 Over the same period, excise tax rates on alcohol and tobacco products have increased.
Lotteries as an Activity of State Government
A state lottery is an enterprise operated (as a monopoly) by the state, producing a service and
selling it directly to citizens. As such, lotteries are noteworthy on at least two counts. First is the
sheer size of the operation. The second is the marketing in which it engages.
Size. In terms of dollars spent on them, they have become one of the largest operations
run by state governments. In 1997 individual citizens spent some $36 billion on them. As an
activity undertaken by state government, this amount was exceeded only by education, public
welfare, highways, and health, and it was greater than the total that all states -- including states
without lotteries -- spent on corrections, or on parks and natural resources (U.S. Bureau of the
Census, 1998, Table 514, p. 317).
Marketing. In lotteries as in no other state function (with the possible exception of
tourism), the states have adopted the tools of commercial marketing, including product design,
promotions, and advertising. In 1997 state lotteries spent a total of $400 million to advertise their

8
products, which amounted to about 0.9 percent of total sales in that year.18 This does not count
the free exposure provided by newspaper coverage of winners and winning numbers. Harder to
measure but potentially more important is product design. With the assistance of vendors who
sell lottery products to states, the state lottery agencies worry about modifying existing products
and developing new products that will reinvigorate sagging sales without “cannibalizing” existing
products.19 Using conventional techniques of modern marketing, the managers of state lotteries
appear to be motivated by a desire to maximize the revenues they turn over to their states.
But concerns have been raised when some of those conventional approaches are evaluated
alongside other aims of state government. For example, some lottery advertising has been
criticized as being insufficiently forthcoming about important aspects of the games. In particular,
the probability of winning various prizes in a game -- information that must be provided in
commercial sweepstakes games regulated by the Federal Trade Commission is often not provided
by state lotteries, and certainly not publicized as much as the size of prize jackpots (see Section
III). Another source of concern relates to the themes used in advertising, particularly ones that
exalt luck over hard work as an avenue to financial success, as in New York’s “All you need is a
dollar and a dream” ad campaign. In response to concerns such as these, several states placed
restrictions on what kind of advertising its lottery agency could do. In particular, Virginia,
Minnesota, and Wisconsin ban ads designed to induce people to play. A few other states require
odds of winning to be displayed or ads to be accurate and not misleading.20
Legal Status and Form of State Lottery Agencies
In establishing their lottery agencies, the states and the District of Columbia have differed
in the degree to which the lottery agency is differentiated administratively from the rest of state
government. While some states placed their lotteries within the existing administrative structure,
a majority of states established a separate agency, many bound by different rules from the rest of
state government. Table 5 summarizes information gathered from the lottery agencies about the
administrative status of state lottery agencies in 1998. Fourteen of the 38 agencies are part of a
department of state government, most often the state’s revenue department. In all but one of
those cases, the lottery is subject to state regulations covering the employment and compensation
of state employees and procurement. In the remaining 24 jurisdictions, separate agencies have
been established. In a few of these cases, the lottery agency is an independent, quasi-public entity,
not bound by the states’ civil service requirements or their rules for procurement. Such
independence, it is argued, allows the lottery to operate more “like a business,” including the
ability to pay its top managers salaries that would exceed those permissible to otherwise similar

9
state workers. The amount of oversight and control the state legislature has over each lottery no
doubt differs for a variety of reasons not reflected in the table. A fuller understanding of those
differences would require a careful analysis of the governing structure of each agency, which is
beyond the scope of the present report.
II. Results for Lottery Play from the 1998 National Survey on Gambling
Much of the public concern about lotteries is the result of the belief that lottery spending
places a real burden on household budgets of poor and minority households. A recent survey, the
first of its kind since 1975, provides relevant data on this and other issues.
Survey Design
The survey was conducted by the National Opinion Research Corporation (NORC). The
details on survey design are included in a report from that organization.21 We use the combined
survey, which included a random-digit-dial (RDD) sample and a patron sample. The RDD survey
was conducted during the Summer and Fall months of 1998, and included 4,358 households.
NORC interviewers successfully screened 3,281 of these households to establish the number of
adults residing there (age 18 or over) and select one at random. Interviews were completed with
2,425 adults, of which 2,406 were included in the survey data examined here. A second survey of
patrons of gambling establishments was conducted between November and January, and included
over 500 respondents; we were able to use data from 461 of them. Sample weights were
calculated for each respondent based on age group, sex, ethnic/racial group, and state, so that the
final sample composition, when weighted, would match the composition of the US adult
population in these dimensions.22 On average, each respondent represented about 70,000 adults.
The survey questionnaire included items about all types of gambling. In what follows we
report some of the results from the module that was addressed to lottery play. It should be noted
that the lottery module was limited to three types of games: instant scratch-off, numbers (pick-3
or pick-4) and lotto (including the multi-state version). The casino-type games offered by some
lotteries, including video poker and keno, were consigned to another part of the survey.

10
Estimation
Respondents were asked whether and how often they had played the lottery in the
previous year. Those who had played were asked whether they had purchased a ticket in the
previous 7 days, or, if not, the previous 30 days. The answer to this question establishes a
reference period. (For those who had played in the last year but not the last 30 days, the
reference was to the “last day that you bought one or more lottery tickets.”) They were then
asked what types of lottery games they had played during that reference period, and how much
they had spent on each type of game when they played that game during the reference period.23
They were not asked for their total expenditure on lottery tickets during the reference period (or
for the year), and there is some ambiguity: If they played several times during the reference
period, and they say they played more than one game, we don’t know whether they played all
games every time, or rather played different games on different occasions. In order to develop
estimates of expenditure patterns, then, we had to make some assumptions that would allow us to
project from respondent answers to an estimate of their total expenditure for the year.
First we estimated the frequency of play during the previous year by imputing numerical
frequencies to the qualitative response categories that were used in the relevant survey question.
We used numerical frequencies of 300 (“about every day”), 100 (“1 to 3 times per week”), 18
(“once or twice a month”), 8 (“a few days all year”), or 1 (“only one day in the past year”).
Then we estimated the amount respondents played on average each day they played during
the past year. Here are our assumptions:
*If they played only one type of game during the reference period, we used their per-
occasion expenditure on that game during the reference period as our estimate of average
play for the year;
*If they played both instant and numbers during the reference period, we assumed that
they played both on every occasion, and used the total of the two as our estimate of
average play for the year;
*If they played more than one type of game during the reference period, including the
multi-state game and/or lotto, we assumed that the respondent played lotto and/or multi-
state games no more than once each week.24 We used numerical frequencies of 52 (“about
every day” or “1 to 3 times per week”), 12 (“once or twice a month”), or 1 (“a few days

11
all year” or “only one day in the past year.”). But in these cases we used the same
assumption as before about how often they played instant and/or numbers.
These procedures allow us to estimate the amount spent in the previous year by each
respondent. We estimated total national expenditures for the year by calculating a weighted sum
of these individual estimates, using the population weights provided by NORC. Under certain
assumptions our estimate of total expenditure is unbiased. These assumptions include:
*The sample, adjusted by the given weights, is representative of the U.S. adult population;
*The months in which the survey was conducted were representative of the year;
*The procedures used to estimate individual expenditures (outlined above) are accurate on
the average.
Table 6 provides the results of this exercise, together with the official sales statistics for
fiscal year 1998. Our survey-based estimates of national expenditures total $27 billion, 86 percent
of recorded sales ($32 billion). The underestimate stems from instant-game expenditures, where
our survey-based estimate is only 51% of sales. We suspect that players buy instant-game tickets
on a more haphazard basis than they do numbers or lotto, which makes accurate recall difficult.
The numbers estimate actually overstates sales.25
In what follows, we adjust the survey-based estimates of individual play by the
“adjustment ratios” presented in Table 6, using a different ratio for each of the three types of
games. If based on her responses we would estimate that a respondent spent $100 on instant
games and $150 on lotto during the year, our adjusted estimate is $100(1.96) + $150(.98), or
$343. Respondents who say they did not play the lottery are taken at their word. This procedure
will provide a valid representation of lottery play if reported play is proportional to actual play for
each type of game. For example, in comparing average per capita play by racial group, our results
are valid if white respondents, black respondents, and other respondents each report, on the
average, 129 percent of their numbers play, 51 percent of their instant-game purchases, and 102
percent of their lotto purchases.
Lottery vs. Non-lottery States
As a start, we compute the difference in participation rates and average play between

12
residents of lottery states and residents of states that do not have a lottery. Currently about 87
percent of the adult population resides in one of the 38 lottery states (including Washington DC).
Residents of non-lottery states have various opportunities to purchase lottery tickets, either when
they travel or on the gray market in their own state, so it is not surprising that they are not entirely
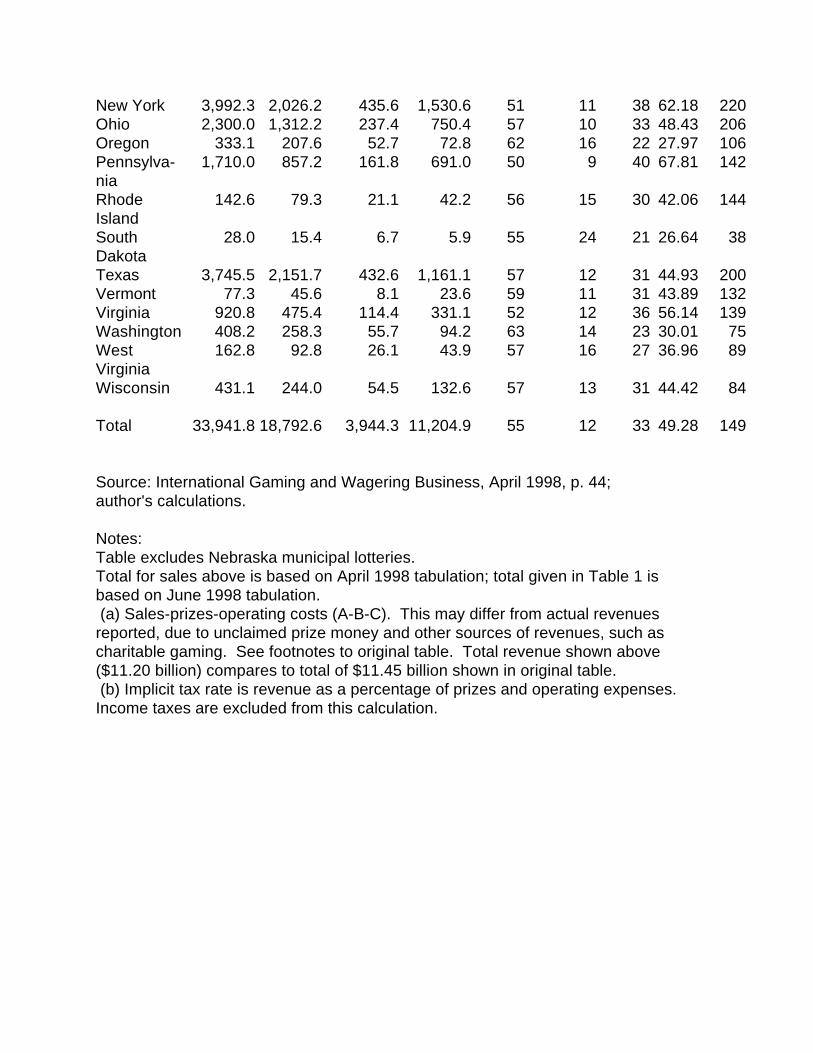
out of the lottery picture. Table 7 presents estimates of total spending by residents of lottery
states and non-lottery states by game. Table 8 reports the participation rates and per capita play
using the adjusted figures. As shown, annual lottery participation for lottery-state residents (55
percent) is twice that of residents from states without lotteries (27 percent). Per capita play in
lottery states is three times as great as for non-lottery states.
Demographic and Socioeconomic Patterns
Lottery play is common -- about half the adult population play the lottery in any one year -
- but the degree of involvement is highly heterogeneous. Among those who played in the last
year, we find that the top 5 percent of players (who played $1,040 or more) accounted for 54
percent of total sales, the top 10 percent (who played $520 or more) accounted for 68 percent of
total sales, and the top 20 percent (who played $208 or more) accounted for fully 82 percent.
The median player, who might be considered “typical,” is in fact of little interest from the revenue
perspective. To illustrate that point, consider what would happen if all players spent the same as
this “typical” median player, $40 a year. The answer is that sales would fall 87% percent to $4.1
billion. Clearly it is the relatively small group of atypically heavy players who cause average sales
to be as large as they are.
Lottery play differs systematically among groups. To explore demographic patterns of
play, we calculate the participation rates and adjusted average play by gender, race, marital status
and age. These results are presented in Table 9 and also Figures 1-4. Overall we estimate that
51.5 percent of the adult public played in the previous year, and that their average expenditure
was $313. Multiplying these two statistics together provides the per capita play of $162. In is
interesting to note in reviewing the statistics in this table (and the subsequent table on
socioeconomic characteristics) that the differences among groups are much greater with respect
to amount played than with respect to participation rate. Indeed, with a few exceptions there is
remarkable uniformity in participation.
Reviewing the demographic categories, we see first that men are a bit more likely to play,
and play somewhat more on the average, than women. For the race/ethnicity category,
participation rates are nearly identical across groups. However, average spending by blacks who

13
play is much larger than for other categories, and hence per capita spending by blacks is higher
than for other categories. Across marital categories, singles spend less than married or divorced
people. With respect to age, we find that participation is lowest for those over 64, and
spending/player tends to increase with age; per capita spending is highest for those of middle age,
45-64.
Table 10 provides the same information by education and income (see also Figures 5 and
6). Participation rates do not differ much by education, but spending by players drops sharply as
we move up through the education categories. The result is that the education category with the
highest per capita spending is those who did not complete high school, and the college graduates
have the lowest. With respect to household income, we see that participation rates increase up to
$100,000. But players with incomes less than $50,000 spend more than others, and the lower-
income categories have the highest per capita spending.
To develop a clearer idea of how household income relates to lottery play, we need to
adjust for the fact that many households have more than one adult in them, and that higher-
income households tend to have more adults per household. Table 11 reports the average
number of adults per household and the implied result for per-household lottery play, by income
category. (Each entry in the last column of Table 11 is equal to the per-capita play for adults in
that income category multiplied by the number of adults per household in that income category.)
The basic qualitative result is as before: Income has little relationship to lottery play overall up to
$50,000, and drops off sharply at higher incomes. Hence lottery expenditures represent a much
larger burden on the household budget for those with low incomes than for those with high
incomes.
Finally, Table 12 offers some data on the demographic characteristics of those who are the
heaviest lottery players. Given the results reported above, it is not surprising that males, blacks,
high-school dropouts, and people in the lowest-income category are heavily over-represented
among those who are in the top 20 percent of lottery players.
Perception of Winnings and of Payout Rate
The popularity of the lottery does not appear to be the result of a mistaken belief that it
offers a good bet. The survey asks respondents “How much of the ticket price of your favorite
game do you think is returned...in the form of prize money?” By way of comparison, the true
average payout rate is 55 percent for lottery games in the U.S. Yet 63 percent of the respondents

14
who had played the lottery in the last month thought that the correct answer was “25 cents or
less.” Only 7.5 percent of players had an exaggerated notion of the lottery's generosity.
Players also seemed to have a realistic notion of how they were doing. All told, 86
percent of those who had played in the last year, and 82 percent of those who had played in the
last week, said that they had lost more than they won during the previous year. Only about 8
percent said that they were ahead, and the rest thought they had broken even.
Section III. Marketing Lottery Products
Effective marketing of any product or service requires a sound marketing strategy based
on specific goals and objectives. The marketing of state lotteries is no exception. Each state
lottery agency must make a series of marketing decisions concerning product offerings, price,
promotion, and distribution. While the states engage in all aspects of marketing for lottery
products, this section of the report focuses on how states define their target customers for lottery
products and the particular communications choices--both media and advertising themes--used to
reach and attract those customers.
Twenty-five lottery commissions provided marketing plans for our review. These plans
were coded to examine the nature of the customer analysis and resulting segmentation and target
market definition, the advertising themes used, and the basis for media selection.
Customer Analysis, Segmentation, and Targeting
A key marketing activity in any product category is identifying and understanding the
motivations of those consumers who are likely to purchase the product. Customer analysis
usually involves identifying and grouping those customers on a number of dimensions.
Demographic characteristics, lifestyle or psychographic characteristics, and usage or volume
characteristics (e.g., for lotteries, the frequency of play or the amount wagered) are three of the
most common ways to define segments, and are reflected in the 1998 National Survey on
Gambling discussed in Section II. Data are also available from various media sources (e.g.,
Mediamark Research, Inc.) that produce demographic, lifestyle, and product-category-usage
information for the audiences of various media so that marketers can choose the media that best
reaches their target audience. For instance, Mediamark’s Spring 1997 survey reports that heavy
purchasers of lottery tickets (i.e., those who purchased more than five tickets in the last 30 days)

15
account for 82 percent of the lottery ticket volume, are much more likely than the general
population to listen to Golden Oldies and watch TV Police docu-dramas and are much less likely
to listen to NPR or watch Black Entertainment TV.
Thirteen of the 25 marketing plans (52%) did not report any customer analysis. Four of
the plans (16%) described their target customers only in terms of age, often using broad age
categories such as 24-65 years. Four (16%) of the plans described their target audience on a
more complete range of demographics and three (12%) of the plans have separate demographic
descriptions for the customers of each of the lottery products (instant games, lotto, etc). Four
plans (16%) had psychographic profiles for their lottery products; three had specific profiles for
each lottery product. Thus, it appears that some lottery agencies are more systematic than others
in doing market research. The more sophisticated the description of the target customer, the
more targeted the communications message and media choice can be.
Advertising Themes
Once target customers are identified, communications messages can be designed to appeal
to those customers. The better defined the profile of a potential consumer, the easier it is to
design a communication that will get the consumer's attention, get customers to process the
communication, and act on the message. For lottery products the agency’s aim may be to
motivate non-players to play, to encourage players to play more often or to play more types of
games, or to encourage lapsed players to start playing again. Communications may be designed
to influence public opinion about lotteries generally, rather than to encourage consumers to
participate in any particular game.
There are many ways to communicate these basic messages to potential and current lottery
customers. Twenty-two of the 25 marketing plans mentioned advertising themes specifically.
The themes reflected in the marketing plans are listed in Table 13 from the most commonly used
themes to the least common. The three most common themes were 1) size-of-the-prize or
jackpot, 2) the fun and excitement of playing, and 3) winner awareness. The aggressiveness and
styles of communicating with potential lottery customers varied tremendously across states. For
example, Indiana has the following advertising creative code of conduct:
Commercials will treat the talent, players and customers with class and dignity. No children will be used in advertising nor will advertising be directed toward them.
The Lottery will not be promoted as an alternative to work and terms like checking account, savings account and references to financial institutions will be avoided.
Ads will be careful not to sell the dream of a “way out” of their current financial situation or

16
flash big signs of extreme wealth. Odds of winning will be clearly stated in advertising where appropriate.
This was the only example of an explicit statement that could be used to guide the advertising
creative process. Other states, as noted earlier, do place some restrictions on advertising content
(Virginia, Minnesota, and Wisconsin) banning ads that are designed to induce people to play.
Size of the prize. Fifty-six percent of the plans use a size-of-the-prize message in at least
one of their campaigns. There is a great deal of variety in how the message is delivered. Some
ads focus almost exclusively on the jackpot. A print campaign from Colorado, for example,
used 80 percent of the space in a print ad to show “$10,000,000,” 10 percent of the space for the
lottery logo, 5 percent of the space for the tag line, “What WILL You Do with It All?” and 1.25
percent of the space to present the odds of winning (1:5,245,786). Another campaign, from
Arizona, used 60 percent of the ad space to show a bank deposit slip with a deposit of
$175,000,000 on it. The text of that ad, which accounted for 10 percent of the space, went on to
elaborate that “you could bank on receiving $7 million every year for the next 25 yearsY that=s
$583,333 every monthY or a $134,615 paycheck every week!” The fine print (34 characters per
inch) indicated, “Overall odds of winning a cash prize are 1 in 35,” but did not specify the odds of
winning $175,000,000. Clearly, the allocation of space in these ads indicates that the goal is to
focus the attention of the reader on the prize and away from the odds.
Not all campaigns that focus on the jackpot do so to the exclusion of other information. A
print campaign from Virginia devoted 75 percent of the space to the title of the game, 9 percent
to the jackpot amount, and 6 percent to the odds of winning the jackpot and the overall odds.
Another, from Indiana, used only 5 percent of the space to focus on the prize, “Win Up To $ 1
MILLION Every Day!” and used a chart in the body of the ad to show the odds of winning from
$2 (1:11), $5 (1:99), $100 (1:1911), $5,000 (1:81,237) to $1 million (1:9,261,000).
In radio and television ads it is more difficult to assess the relative allocation of “space"
devoted to the size-of-the-prize. Many TV and radio campaigns repeat the size of the games big
prize numerous times in a thirty-second spot. For example when Arizona introduced a new bingo
game, the focus was on the grand prize of $10,000 even though the odds (1:5) stated in the audio
portion of the ad were for winning any prize, not the grand prize. This focus on the grand prize
was amplified by supporting statements such as, “Chances are good that you can be $10,000
richer” and “two dollars gives you three chances per ticket to be $10,000 richer.” Other examples
abound, including these two from Colorado: “$7 million, collect your share” and “win $20,000 in
a heartbeat.”

17
As with print ads, there are examples of TV and radio campaigns that focus on the
jackpot. For instance, Wisconsin had a campaign that had nine different executions. Each
advertising execution included only one line focused on the top prize, e.g., “Introducing a new
one dollar instant scratch game, where you can win $ 2,000 instantly.” In all nine of the
campaign’s advertising executions, the odds of winning both the top prize and various other
prizes were shown in the video portion of the ad for about five seconds (in a thirty-second spot).
Fun and Excitement. Tied with a size-of-the-prize or jackpot for most commonly used
theme, is the fun and excitement of playing the lottery. Ads with this theme are much more likely
to be TV ads than print ads. Frequently, the fun and excitement of playing was tied to the fun and
excitement of winning. For example, a Kentucky ad showed a couple in an exclusive restaurant
with the accompanying audio: “There’s a place where the steaks are big enough to get their own
zip code and the lobsters are the size of small appliances, the meals are four-course and the
service is five-star. Which credit card do they accept? Who cares? You’ve got cash. The big
cash you won playing Easy Street, the new three-dollar instant game from the lottery where you
can win $10,000 per month for a year. Play Easy Street. Somebody’s going to win B it might as
well be you.” No odds were stated or shown. An ad campaign in Colorado showed what it was
like to win using a series of ten-second spots. The spots had no audio, and did not state the odds.
The spots consisted of a series of images such as a collection of vintage Rolls Royces, a mansion
with a Lambourgini in front, a huge boat sailing in the Caribbean, a person getting his golf clubs
from the trunk of a Porsche and putting them in a Lear jet. The tag line was simple: “Another
reason to play Lotto.” An Oregon campaign emphasized the fun of playing instead of the fun of
winning: “that feeling you have when you know something good just might happen,” and assured
players that the lottery “can do that.”
Winner Awareness. Nearly half of the states with a marketing plan had an advertising
campaign that was focused on making potential buyers aware of former winners. These
campaigns took a variety of forms, some focusing on real winners, while others emphasized that
anyone could be a winner. The winner awareness campaign in Texas focused on real winners of
the Texas Lotto. Each of the winners told the story of how they came to be a millionaire: a man
who lost his ticket and was a millionaire for 147 days before he knew it; the $7.4 million dollar
winner who uses a lucky penny system to pick his numbers; the man who bought his Lotto ticket
four minutes before the drawing and thirty minutes later was the winner of $23.6 million; and the
4.8 million dollar winner who only bought one ticket in his entire life. Each of these winners’
stories was upbeat and the audience could feel the excitement of playing the lottery.

18
The winner awareness campaign of the Virginia lottery had a different feel entirely. This
campaign used a “detective” to tell of the events leading up to the purchase of the ticket and
winning of the lottery. The scenes were often dark and the story was presented in a way that
emphasized the mysteriousness of the happenings. For example, the detective said, “On Friday,
September 4, 1994, the freezer belonging to Gloria and Steve Kanoy of Weere’s Cove, suddenly
and mysteriously broke down. Distraught, the couple set off the next day in search of a new one.
Stopping for gas at Lake Raceway, 607 Main Avenue, they spontaneously decided to by a Lotto
ticket. That night they won half of the eight million-dollar jackpot. This has been a true story
from the files of the Virginia Lottery.” Others in the series told of a man playing the date of his
house fire for two years before winning the lottery, and of another who played the numbers from
a fortune cookie.
Other states emphasize how anyone can win and the huge number of people that win,
rather than focusing on the stories of winners of large sums of money. Arizona ran a series of
radio ads stating, “Every single second, the lottery makes someone very happy. Every single
second, someone is cashing a winning ticket.” Another state showed the names and cities of
lottery winners on the screen of the television ad, while the voice over stated, “The list of instant
game winners is growing at the average rate of two per second.” By the time the thirty-second ad
was complete, the screen was so covered with names that nothing could be read, reinforcing the
idea that there are many, many winners.
Media Choices
Most of the marketing plans that we reviewed contained detailed descriptions of the media
schedule. However, in all of the plans except five (20%), the media choices appeared to be driven
by the schedule of the products and costs rather than reaching particular consumers. Most of the
states used a mix of television, radio, billboards, and point-of-sale communications. In five of the
marketing plans there were indications that media vehicles (particular programs, newspaper
sections, dayparts, etc.) were being chosen to efficiently reach the target consumer. Examples
from these plans are, “Media was (sic) strategically chosen to reach the target,” “We are using
cable networks to reach specific targets and have specified dayparts for ads to air,” “Both media
and messages are tailored to fit target player attitudes,” and “We selected programs for ad
placements based upon the target definitions.”

19
IV. Public Policy Issues Regarding State Lotteries
The importance of lotteries goes far beyond their contribution to the treasury. While
lotteries typically raise less than 3 percent of state revenues, selling lottery tickets is one of the
most visible and readily identified activity of state government. The lottery is in a sense the state
governments’ biggest business venture, and a rather problematic one given widespread ethical and
pragmatic concerns about gambling. These concerns are compounded by the fact that state
lottery agencies adopt marketing practices that are intended to persuade people to spend more on
this form of gambling than they otherwise would. While most state lotteries are operated to
make as much money as possible for the state, there is in fact more than one way to run a lottery.
Lotteries as a New Kind of Government Agency
Owing to its structure and management orientation, the typical state lottery authority has
evolved into a new breed of government agency. Virtually all state lotteries conform to a single
basic model: a state-run monopoly paying out only about half of its revenues in prize money and
marketing its products aggressively to stimulate demand. Most of these agencies are set up as
separate bureaus under a weak state commission, free of the close scrutiny and some of the hiring
restrictions of other government agencies. This autonomy allows the typical lottery agency to
behave in most respects as a private business, responding to the constant pressure to bring in
more and more revenue for the state.
Whether or not they say so explicitly, the clear objective implicit in the structure and
behavior of lottery agencies is to maximize net revenue.26 Two features of lotteries are particularly
important in pursuing this end: a high profit rate and aggressive marketing.
High profit rate. As a business, a lottery has the great advantage of being a legal
monopoly. Every state that has established a lottery has granted itself the sole right to engage in
this business within its borders. And while the lotteries do face increasing competition from other
forms of commercial gambling and from other state lotteries (given the possibility of buying out-
of-state), this monopoly position has made possible an impressive profit margin. As noted above,
for every dollar spent on tickets, lottery agencies pay out about 55 cents in prizes, a percentage
that differs little from one state to another but is substantially less than the payout rate for other
forms of commercial gambling. Of the remainder, 12 cents go to pay commissions to retailers and
operating expenses, leaving a profit of 33 cents for the state's treasury. Viewed as an implicit tax,
this transfer to the treasury is comparable to a 61 percent excise tax.

20
Systematic marketing. The second feature shared by virtually all lotteries today is
systematic marketing. Like private firms, lottery authorities want to increase the sales of their
product. To do so, they have adopted many of the methods of modern marketing. First, this
means lotteries are constantly searching for ways to modify their existing games or for altogether
new lottery products that will appeal to players. Much of the growth in lottery sales has been
fueled by the development and introduction of new products, as noted in section I. In the last
decade a number of states have added two new types of games, keno and video lottery machines,
to their product line. There is reason to believe, however, that the fast action they provide will be
especially tempting for problem gamblers.
Aggressive marketing also means ubiquitous advertising, which makes lotteries the most
visible government program. While such marketing methods are common in the commercial
marketplace, they may be problematic when utilized by government. In its promotion of the
lottery, the government is encouraging the consumption of a specific product, one long viewed by
many people as a vice and which for most of this century was provided only by criminal
syndicates. Its primary if not sole public virtue is that it generates revenue.
Not only does the fact of lottery promotion raise troubling questions, so too do some of
the techniques used in that promotion. First, lottery ads are often misleading. For example,
advertised lotto jackpots usually refer to the sum of 20 or more annual payments rather than the
annuity value of the jackpot, and no mention is made of taxes. In a recent highly publicized Big
Money game the advertised jackpot of $197 million had a lump sum equivalent (an optimal form
of payment that the winner did in fact choose) of only $70.2 million after taxes.27 Only a few
states require that the odds of winning be posted or advertised. Indeed, the federal government
requires private sweepstakes operators to offer more information about prizes and probabilities
than most state-run lotteries provide. In addition, the effect of lottery advertising is to create an
impression that winning is easy, a message that we previously documented in a survey of lottery
advertising.28
Promoting lotteries does more than persuade the public that playing is a good investment.
At one level, the sales job may be viewed as values education, teaching that gambling is a benign
or even virtuous activity that offers a desirable escape from dreariness of work and the confines of
limited means. Not only does lottery advertising endorse gambling per se, it may also endorse the
dream of easy wealth that motivates most gambling. Many ads are unabashedly materialistic, with
winners basking in luxury and lives transformed. Yet this is not the materialism of hard work and

21
perseverance but rather of genies and magic lamps, rooted in hopes, dreams and superstition.
And every lottery manager knows that many of his or her best customers base their bets on
personal superstitions, astrological tables, self-styled seers, and the venerable “dream books” that
list numbers corresponding to names, dates, and dreams. Rather than emphasizing that all
numbers have the same probability of being selected and that playing popular numbers will reduce
a person's expected payoff in parimutuel games, lottery agencies have chosen to encourage
players to choose (and stick with) personally significant numbers.
It is probably not an exaggeration to say that the message of lottery advertising is a
subversive one -- that success lies in picking the right number. This perverse “education”
initiative being promulgated by the lottery agencies may have the ironic effect of reducing
government revenues over the long run, by reducing economic growth. Specifically, if the lottery
promotion erodes the propensities to work, save, and self-invest in education and training, the
consequence will eventually attenuate growth in productivity. In any case, betting on a miracle is
not the formula for success we usually teach to our children. Indeed, one straightforward test of
the acceptability of the message might be to imagine using lottery ads in the public school
curriculum. Few school boards across the country would endorse teaching children lessons such
as, “Play your hunch. You could win a bunch.”
Policy Choices
Ignored in virtually all of the debate on this issue has been the fact that there really is more
than one way to run a lottery. Which approach a state should choose depends on a rather obvious
question, but one that has likewise been given little attention in public debate: What is the state's
ultimate objective in having a lottery? In virtually all states, the operational answer to this
question has been that the lottery should be run so as to maximize revenue. We refer to this high-
tax, heavy-promotion model as the Revenue Lottery. But this is not the only model that a state
could choose. There are at least two alternative answers worth serious consideration. One
derives from a primary concern for the social costs of gambling and state promotion efforts, while
the other sees lotteries as a more or less harmless form of recreation. Both of them are oriented
to serving lottery players and the citizenry at large, rather than exploiting players for the sake of
financing state government.
We call the first alternative model the Sumptuary Lottery. The objective here is to
accommodate the widespread interest in betting on long-shots without encouraging that interest.
Obviously, the first thing to go under this plan would be the promotional advertising now used.

22
Instead of pushing its product, the state would simply make it available to those who want to
play, in effect selling lottery products in a plain brown wrapper. Information would be provided
regarding the types of games available, the locations of retail outlets, the rules of play, and the
odds of winning, but always in a dispassionate manner -- take it or leave it. While the Sumptuary
Lottery would dispense with most of the Revenue Lottery's advertising, it would retain the high
implicit tax rate as a brake on consumption. The Sumptuary approach would also require limits
on the types of lottery games made available; games with a high intrinsic "play value," such as
video lottery machines and sports cards, would be prohibited precisely because they would prove
too enticing. Another feature of the Sumptuary Lottery would be limitations of the number and
kinds of retail outlets, so that the public would not be subjected to the temptation created by
omnipresent availability. Purchases by high school-aged youths would be prohibited, as they are
now, and the prohibition would be rigorously enforced. In sum, the Sumptuary Lottery would be
the gambling analog to the state liquor store.
A second alternative to lotteries as we know them is what we call the Consumer Lottery,
designed simply to serve the interests of players as the players themselves define them. In
contrast to the Sumptuary Lottery, this approach would begin with the premise that for most
people lottery play is no more harmful than, say, eating cookies or drinking a beer at dinner.
From this point of view, the most serious offense of the current Revenue Lottery is its
extraordinarily low payout rate. Whether it is run by the government, an independent
corporation, or by several competing suppliers, a Consumer Lottery would offer products with
payout rates much higher than the current 55 percent. After all, if lottery play is a benign activity,
there is no valid justification for taxing lottery products more heavily than liquor or tobacco, as
they are, in effect, now. Offering guilt-free fun, lotteries would then be made available at
reasonably competitive prices, with consumers being allowed to be the final judge of what
purchases are best for them. Sales would be higher than currently as a result of the higher payout
rate, but state profits would probably fall for the same reason. Such a lottery would also have the
effect of making the revenue structure less regressive. Since low income citizens on average
spend a higher percentage of their incomes on lotteries, a cut in the implicit tax rate would lessen
their implicit tax burden.
While there has been little political support for raising the payout rates, as suggested by
the Consumer Lottery, the Sumptuary Lottery has garnered some interest. Several state
legislatures have signaled that they are uncomfortable with the state's role in the promotion of
gambling. For example, the legislation which created lotteries in Virginia and Wisconsin
prohibited all but informational advertising. Minnesota also places severe restrictions on the

23
content of their ads.29 And a number of state legislatures have resisted introduction of keno and
video terminals. Still, the quest for ever-increasing revenue from lotteries tends to undercut
resistance to promotion and expansion.
States therefore have several choices -- over and above the initial decision of whether to
institute a lottery -- concerning the design and operation of the lottery. The two most important
have to do with pricing and marketing. If it operates its lottery as a monopoly, a state can choose
just about any payout rate under 85 percent (assuming 15 cents per dollar is needed to operate the
games and distribute the tickets). As shown in section I of the report, payout rates do differ, but
most are clustered in the range from 50% to 60%. Experience suggests that higher payout rates
will boost sales. But from the state-revenue perspective, the question is whether sales will
increase by enough to make this increase profitable. The answer may have changed in recent
years, as the market environment has become more competitive; the fact that payout rates have
been drifting upward suggests that increasing competition from other types of gambling and from
neighboring state lotteries have forced the states to be more “generous.” Revenues aside, the
higher the payout rate, the more attractive the games (and “fairer”) the games will be to potential
customers.
The second important choice is marketing. As we have seen, most lotteries have chosen
to actively market their products. This marketing takes two forms: product design and promotion.
The product design part of active marketing means a continual effort to fine-tune existing lottery
products as well as a willingness to consider introducing new products. States with lotteries face
choices about which games they will introduce. If some games, such as video poker, are thought
to appeal excessively to problem gamblers, states have the option of placing them off limits.
Given the high likelihood that the lottery industry will continue to develop new games, with ever
more sophisticated applications of developing technology, choices about products will continue to
be important. What a lottery’s ultimate objective is will determine how aggressively it pursues
these new products.
The other part of marketing is promotion, which includes both advertising and other
means of spreading the word about lottery games. Here again, lottery agencies have non-trivial
choices to make. How heavy should advertising be? Should it be coordinated with times of the
day and week, or focused on the media, to maximize its impact on sales, no matter what groups
end up being targeted? Should there be any limits on the themes used in making the appeal? How
prominently should information on odds or actual prize values be presented?

24
Other choices are less crucial, but still significant. One is whether the state should give
itself a monopoly on the production and distribution of lottery products, as all states to date have
done. A state could certainly choose to license more than one supplier. However, the monopoly
model appears to have worked well in keeping out unsavory elements from lottery operations. If
it chooses to distribute lottery games itself, the state can choose one of several organizational
models, from putting the lottery agency into an existing department of government to establishing
it as a quasi-government independent corporation. Presumably, the practical difference among
these approaches would differ from state to state, depending on laws related to procurement by
government agencies and civil service employees. An independent corporation might also allow
the lottery to be separated in people’s minds from the rest of state government, if that is
considered to be important. Probably more important than the form of the agency is the form and
composition of the agency’s governing board. If the board contains on it representatives who can
reasonably be expected to address questions of public impact such as the rate of implicit taxation
and the appropriateness of advertising themes, and not just revenue performance, one would
anticipate behavior different from that seen in the Revenue Lottery.
Earmarking of revenues is also a design choice, though, as we note above, earmarking
probably has little effect on the pattern and level of state spending in most cases. Only where the
object of spending is small relative to what would have been spent in the absence of the lottery is
it likely to make a big difference.
A final choice worth noting applies more to non-lottery states, but could apply to states
with lotteries as well. States could make it simpler to purchase lottery tickets from other states by
authorizing their sale. At the same time, perhaps through agreements with other states, they
could tax the purchase of these tickets. In this way, a non-lottery state might collect some of the
lottery revenue its citizens contribute to other states when they buy those other states’ lottery
products.
The most important choice, for states with lotteries, is whether to adopt the high implicit
tax rate and aggressive marketing of the Revenue Lottery. States must ask whether the desire for
greater government revenues justifies the effort to entice people to gamble more than they would
otherwise want. If they choose one of the alternative models we outline above, revenues will
surely be smaller than they would be under the Revenue Lottery. If it is believed that the costs of
excessive gambling warrant a somewhat restrictive policy, though not an outright prohibition,
then a Sumptuary Lottery, with high implicit tax rates but little advertising, would be called for.
If gambling in the form of lotteries is thought to be more or less harmless, then a Consumer

25
Lottery would be appropriate.

Table 1
Growth and Change in U.S. Lottery Sales, 1973, 1987, and 1997
(Sales totals in billions of 1997 dollars)
1973 1987 1997
Number of state lotteries 7 23 38
Sales by type of game Passive drawings 1,946 1 0 Instant games 24 4,196 14,435 Daily numbers 0 6,418 7,731 Lotto 0 6,937 10,088 Keno 0 0 1,791 Other 0 0 34Total without VLT's 1,970 17,553 34,079
VLT's 0 0 2,318
Per capita sales without VLT's 35 127 150
Source: Clotfelter and Cook, "Redefining 'Success' in the State Lottery Business," Journal of Policy Analysis and Management 9 (1990), Table 1, p. 100; International Gaming & Wagering Business, April 1998, p. 44; June 1998, pp. 48-49.

Table 2 State Lottery Sales by Game and Sales per Capita, FY 1997 (totals in millions of
dollars)
Popula-tion
Per capita sales
State Instant Lotto Num-bers
Keno Other Non-VLTs
VLTs Total sales
(000s) w/o VLTs
w/ VLTs
Arizona 105.6 144 0.2 249.8 249.8 4,218 59 59 California 527 1247 71 200 18 2063 2063 31,589 65 65 Colorado 212.2 142.8 5.8 360.8 360.8 3,747 96 96 Connecticut 396.2 187.5 188.1 771.8 771.8 3,275 236 236 Delaware 20.3 33.1 49.8 103.2 255.9 359.2 717 144 501 District of Columbia
23.9 41.5 137.5 202.9 202.9 554 366 366
Florida 705.5 993.7 460.5 2,159.7 2,159.7 14,166 152 152 Georgia 633.7 348 662 76.5 1720.2 1,720.2 7,201 239 239 Idaho 63.2 23.8 87 87 1,163 75 75 Illinois 636.2 506.7 480.7 1623.6 1623.5 11,830 137 137 Indiana 319.8 205.9 53.2 578.9 578.9 5,803 100 100 Iowa 117 55.6 1 173.6 173.7 2,842 61 61 Kansas 81.9 62 5 36.5 185.4 185.4 2,565 72 72 Kentucky 317.9 133.5 117.6 569 569.1 3,860 147 147 Louisiana 113.6 125.3 41.7 280.6 280.7 4,342 65 65 Maine 104.4 33.8 8 146.2 146.3 1,241 118 118 Maryland 161.5 134.5 506 233.8 1035.8 1,035.7 5,042 205 205 Massachu-setts
2074.8 302.8 378.9 432.5 3189 3189 6,074 525 525
Michigan 563.9 358.5 663 14 1599.4 1,599.3 9,549 167 167 Minnesota 272.5 83.1 12.9 368.5 368.5 4,610 80 80 Missouri 250.8 140.4 48.4 439.6 439.6 5,324 83 83 Montana 6.1 22.1 28.2 28.2 870 32 32 Nebraska 41.3 35.3 76.6 76.6 1,637 47 47 New Hampshire
111 57.6 8.1 176.7 176.8 1,148 154 154
New Jersey 383.3 450.8 722 1,556.1
1,556.1 7,945 196 196
New Mexico 56.7 25.3 82 82.1 1,685 49 49 New York 1,056.6 1,215.6 1,095.4 618.7 5.9 3,992.2 3,992.3 18,136 220 220 Ohio 1195 552.9 552.1 2,300.
0 2300 11,151 206 206
Oregon 150.5 69 3.2 101.5 8.9 333.1 798.3 1,131.4 3,141 106 360 Pennsylvania 409.2 442.1 858.6 1709.9 1710 12,072 142 142 Rhode Island
27.4 44 29.4 41.8 142.6 406.1 548.7 990 144 554
South Dakota
15.5 12.5 28 505.2 533.2 729 38 731
Texas 2357.6 1229.2 158.5 3745.3 3,745.4 18,724 200 200 Vermont 62.6 12.7 2 77.3 77.3 585 132 132 Virginia 300.3 267.3 353.3 920.9 920.8 6,618 139 139

Washington 206.4 171.6 17.5 12.8 408.3 408.2 5,431 75 75 West Virginia
80.3 49.5 16 17 162.8 352.6 515.4 1,828 89 282
Wisconsin 273.3 127.4 30.4 431.1 431.1 5,123 84 84
Total 14,435 10,088 7,730.8 1,790.9 34 34,079 2,318.1 36,398 227525 150 160
Note: Table excludes Nebraska municipal lotteries. Source: International Gaming and Wagering Business, April 1998, p. 44; June 1998, pp. 48-49; author's calculations.

Table 3
State Lottery Sales, Prizes, Expenses, and Government Revenue, FY1997 (Excludes VLTs) ---------Dollar amounts in millions------
---As percent of sales----
State
Sales
Prizes
Operating
Revenue
Prizes
Operating
Reve-
Implicit tax
Per capita
expenses (A-C)(a) Expenses nue rate(b) Sales (A) (B) (C) (D) (E) (F) (G) (H) (I)
Arizona 249.8 130.1 40.0 79.7 52 16 32 46.82 59 California 2,063.1 1,030.5 320.7 711.9 50 16 35 52.69 65 Colorado 360.9 215.1 53.0 92.7 60 15 26 34.58 96 Connecticut 769.8 450.7 66.5 252.6 59 9 33 48.83 235 Delaware 103.3 53.8 15.4 34.2 52 15 33 49.41 144 District of Columbia
202.9 101.6 34.6 66.7 50 17 33 48.97 366
Florida 2,070.1 1,027.5 240.2 802.4 50 12 39 63.29 146 Georgia 1720.2 926.6 235.2 558.5 54 14 32 48.08 239 Idaho 87.0 53.3 15.9 17.7 61 18 20 25.63 75 Illinois 1,569.4 827.4 170.9 571.2 53 11 36 57.22 133 Indiana 578.9 322.9 84.1 172.0 56 15 30 42.26 100 Iowa 173.7 96.9 34.2 42.5 56 20 24 32.43 61 Kansas 185.4 98.3 31.1 55.9 53 17 30 43.21 72 Kentucky 569.1 339.9 77.1 152.0 60 14 27 36.46 147 Louisiana 280.7 139.8 42.5 98.4 50 15 35 54.00 65 Maine 146.3 82.2 24.1 40.0 56 16 27 37.69 118 Maryland 1,043.6 551.7 99.6 392.3 53 10 38 60.23 207 Massachu-setts
3,189.0 2,236.8 256.2 696.0 70 8 22 27.92 525
Michigan 1,599.3 866.5 169.5 563.4 54 11 35 54.38 167 Minnesota 368.5 224.4 59.9 84.1 61 16 23 29.59 80 Missouri 439.6 241.9 66.4 131.3 55 15 30 42.60 83 Montana 28.2 14.3 7.6 6.3 51 27 22 28.78 32 Nebraska 76.6 40.4 16.8 19.5 53 22 25 34.08 47 New Hampshire
176.7 100.1 25.2 51.3 57 14 29 40.88 154
New Jersey 1,556.1 812.7 131.0 612.4 52 8 39 64.89 196 New Mexico 82.1 41.4 20.2 20.5 50 25 25 33.24 49
New York 3,992.3 2,026.2 435.6 1,530.6 51 11 38 62.18 220 Ohio 2,300.0 1,312.2 237.4 750.4 57 10 33 48.43 206 Oregon 333.1 207.6 52.7 72.8 62 16 22 27.97 106 Pennsylva-nia
1,710.0 857.2 161.8 691.0 50 9 40 67.81 142
Rhode Island
142.6 79.3 21.1 42.2 56 15 30 42.06 144
South Dakota
28.0 15.4 6.7 5.9 55 24 21 26.64 38
Texas 3,745.5 2,151.7 432.6 1,161.1 57 12 31 44.93 200 Vermont 77.3 45.6 8.1 23.6 59 11 31 43.89 132 Virginia 920.8 475.4 114.4 331.1 52 12 36 56.14 139 Washington 408.2 258.3 55.7 94.2 63 14 23 30.01 75 West Virginia
162.8 92.8 26.1 43.9 57 16 27 36.96 89
Wisconsin 431.1 244.0 54.5 132.6 57 13 31 44.42 84
Total 33,941.8 18,792.6 3,944.3 11,204.9 55 12 33 49.28 149
Source: International Gaming and Wagering Business, April 1998, p. 44; author's calculations.
Notes: Table excludes Nebraska municipal lotteries. Total for sales above is based on April 1998 tabulation; total given in Table 1 is based on June 1998 tabulation. (a) Sales-prizes-operating costs (A-B-C). This may differ from actual revenues reported, due to unclaimed prize money and other sources of revenues, such as charitable gaming. See footnotes to original table. Total revenue shown above ($11.20 billion) compares to total of $11.45 billion shown in original table. (b) Implicit tax rate is revenue as a percentage of prizes and operating expenses. Income taxes are excluded from this calculation.

Table 4
State Own-source Revenues and Lottery Revenues, 1997 (amounts in millions of dollars)
Own-source Lottery Lotterygeneral revenue (b)as percent
State revenue (a) of total
Arizona 8,262 79.7 0.96%California 73,584 711.9 0.97%Colorado 7,349 92.7 1.26%Connecticut 10,071 252.6 2.51%DC* 2,986 34.2 1.14%Delaware 2,797 66.7 2.38%Florida 25,984 802.4 3.09%Georgia 13,707 558.5 4.07%Idaho 2,552 17.7 0.70%Illinois 23,355 571.2 2.45%Indiana 12,132 172.0 1.42%Iowa 6,352 42.5 0.67%Kansas 5,425 55.9 1.03%Kentucky 8,967 152.0 1.70%Louisiana 9,200 98.4 1.07%Maine 2,760 40.0 1.45%Maryland 11,388 392.3 3.44%Massachusetts 18,002 696.0 3.87%Michigan 25,590 563.4 2.20%Minnesota 13,581 84.1 0.62%Missouri 10,054 131.3 1.31%Montana 1,920 6.3 0.33%Nebraska 3,576 19.5 0.54%New Hampshire 1,807 51.3 2.84%New Jersey 20,600 612.4 2.97%New Mexico 4,990 20.5 0.41%New York 44,912 1,530.6 3.41%Ohio 21,799 750.4 3.44%Oregon 7,768 72.8 0.94%Pennsylvania 25,792 691.0 2.68%Rhode Island 2,392 42.2 1.76%South Dakota 1,247 5.9 0.47%Texas 31,746 1,161.1 3.66%Vermont 1,386 23.6 1.70%Virginia 14,545 331.1 2.28%Washington 14,101 94.2 0.67%West Virginia 3,998 43.9 1.10%Wisconsin 13,012 132.6 1.02%
TOTAL 509,691 11,205 2.20%
(a) General revenues minus intergovernmental transfers. (b) Sales-prizes-operating expenses. See Table 2.
Source: Table 2 and Bureau of the Census Web Site, State Finances 1997, Excel file. www.census.gov/govs/www/st97.html.

Table 5 Organizational Status of State Lottery Agencies, 1998
State Lottery Agency Name Independent agency?
If not, part of what department?
Governed by same rules as state agencies?
AZ Arizona Lottery Comm. Yes Yes CA California Lottery Yes Yes CO Colorado Lottery No Revenue Yes CT Connecticut Lottery Corp. Yes Yes-Employees, No-Hiring &
Procurement DC D.C. Lottery & Charitable
Games Control Board Yes Yes-under control of Chief
Financial Officer, DC Control Board
DE Delaware State Lottery No Finance Yes FL Department of the Lottery Yes Yes-Employees, Hiring, No-
Procurement (may waive rules given certain conditions)
GA Georgia Lottery Corp. Yes No-Governed by Procedures set in Lottery for Education Act
ID Idaho State Lottery Yes (b) Yes IL Illinois Lottery Yes Yes IN Indiana State Lottery
Comm. Yes No-Employees are not state
employees. IA Iowa Lottery No Revenue and
Finance Yes-Employees, Hiring, No-Procurement
KS Kansas Lottery Comm. Yes Yes KY Kentucky Lottery Corp. Yes No LA Louisiana Lottery Corp. Yes No-Employees though
"public" are not subject to civil service rules.
ME State Liquor & Lottery Comm.
No Administration and Finance
Yes
MD Maryland State Lottery Agency
No Attorney General
Yes
MA Massachusetts State Lottery Comm.
No Treasury Yes
MI Michigan Bureau of State Yes Yes

Lottery MN Minnesota State Lottery Yes Yes MO Missouri State Lottery
Comm. No (c) Revenue Yes
MT Montana Lottery Comm. Yes Yes NE Nebraska Lottery No Revenue Yes NH New Hampshire
Sweepstakes Comm. No Education Yes
NJ Division of State Lottery No Treasury Yes NM New Mexico Lottery
Authority Yes No-Authority is separate
entity, independent of state rules.
NY Division of the State Lottery
No Taxation and Finance
Yes
OH Ohio Lottery Comm. Yes Yes OR Oregon Lottery Comm. Yes No-Exempt from certain laws
governing procurement, hiring, and employment.
PA Pennsylvania Lottery No Revenue Yes RI Rhode Island Lottery Yes Yes SD South Dakota Lottery Yes Yes TX Texas Lottery
Commission Yes Yes-Employees, Hiring, No-
Procurement VT Vermont Lottery Comm. Yes Yes VA State Lottery Department Yes Yes WA Washington State Lottery Yes Yes WV West Virginia Lottery No Taxation and
Revenue Yes
WI Wisconsin Lottery No Revenue Yes
(a) Independent means not housed within an existing executive branch department. It may be its own executive department, agency or quasi-public corporation. (b) The state lottery is part of the Department of Self-Governing Agencies. (c)Though housed in the Dept of Revenue, according to statute the Director of the Revenue Department has no control of the Commission.
Source: Survey of state lottery agencies conducted by the National Gambling Impact Study Commission, September 1998.

Table 6. Actual Sales vs. Survey-reported Purchases.
Game
FY98 Sales $billion
Survey Sales
$billion
Adjustment Ratio
Multi-State/Lotto
9.82
10.04
0.98
Numbers
7.87
10.15
0.78
Instant
14.21
7.26
1.96
TOTAL
31.89
27.45
1.16
Sources: FY98 Sales Figures-LaFleur’s Lottery World, FY98 Lottery Sales, available online at www.lafleurs.com; Survey sales figures-National Survey on Gambling Behavior, National Opinion Research Center, University of Chicago, 1999.

Table 7. Total Play in Lottery vs. Non-lottery States.
Spending by Lottery State
Residents $billion (Adjusted)
Spending by Non-Lottery State
Residents $billion (Adjusted)
Game
Sales
(adjusted)Ad
% of Total
Sales
% of Total
Multi-state/Lotto
8.88
90.4
0.83
8.5
Numbers
7.61
96.7
0.08
1.0
Instant
13.66
96.1
0.52
3.7
TOTAL
30.15
94.5
1.43
4.5
Notes: Sales figures adjusted for under-reporting using ratios in Table 6. Total spending is less than total sales because for a few survey respondents the state of residence is missing. Source: National Survey on Gambling Behavior, National Opinion Research Center, University of
Chicago, 1999.
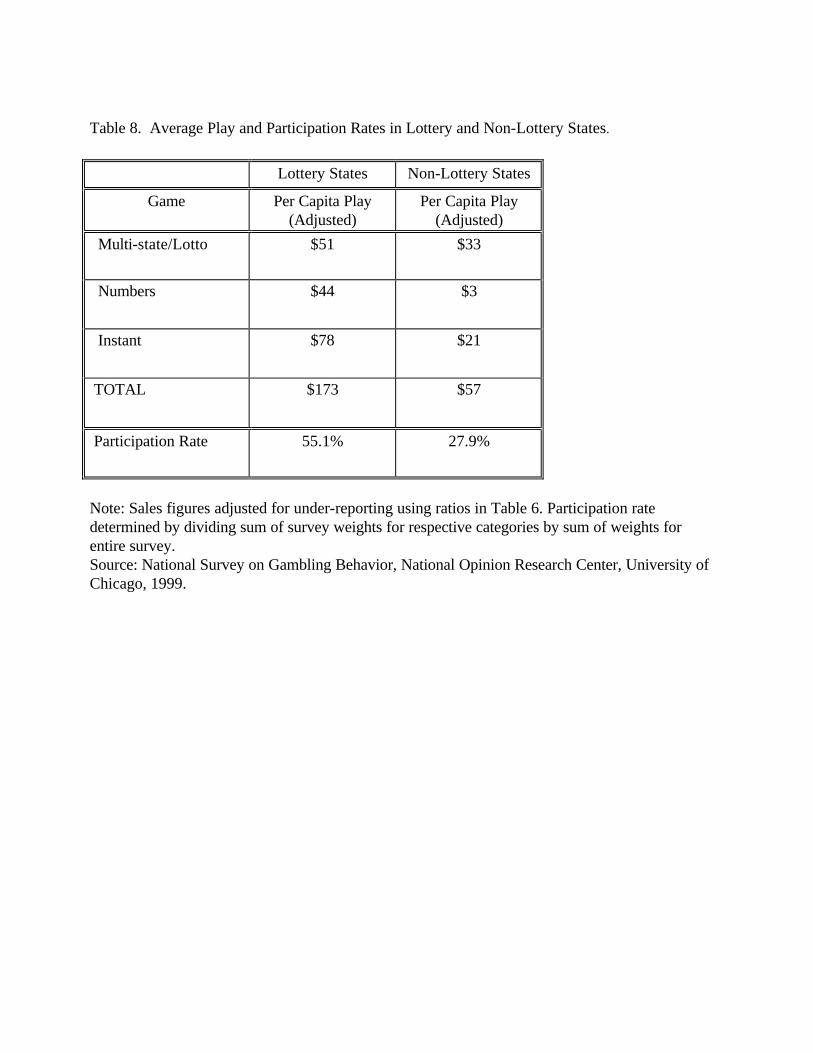
Table 8. Average Play and Participation Rates in Lottery and Non-Lottery States.
Lottery States Non-Lottery States
Game
Per Capita Play
(Adjusted)
Per Capita Play
(Adjusted) Multi-state/Lotto
$51
$33
Numbers
$44
$3
Instant
$78
$21
TOTAL
$173
$57
Participation Rate
55.1%
27.9%
Note: Sales figures adjusted for under-reporting using ratios in Table 6. Participation rate determined by dividing sum of survey weights for respective categories by sum of weights for entire survey. Source: National Survey on Gambling Behavior, National Opinion Research Center, University of Chicago, 1999.

Table 9. Demographic Patterns in Participation and Per Capita Play.
Demographic Characteristic
Participation
Rate
Annual Per Capita
Play-Lottery Players (Adjusted)
Annual Per Capita
Play-Overall (Adjusted)
Overall
51.5%
$313
$162
Male
55.3%
$368
$204
Female
47.9%
$254
$122
White
52.0%
$210
$109
Black
48.2%
$998
$481
Hispanic
53.6%
$289
$155
Other
49.8%
$295
$147
Single
52.8%
$281
$149
Married
49.7%
$304
$151
Divorced/Widowed
56.7%
$387
$220
Age 18-29
49.2%
$152
$75
Age 30-44
55.8%
$280
$156
Age 45-64
56.0%
$413
$231
Age 65+
38.6%
$475
$183
Note: Sales figures adjusted for under-reporting using ratios in Table 6. Source: National Survey on Gambling Behavior, National Opinion Research Center, University of Chicago, 1999.

Table 10. Socioeconomic Patterns in Participation and Per Capita Play.
Socioeconomic Characteristics
Participation
Rate
Annual Per Capita
Play-Lottery Players (Adjusted)
Annual Per Capita
Play-Overall (Adjusted)
Dropout
47.7%
$700
$334
High school graduate
52.4%
$409
$214
Some college
55.6%
$210
$117
College graduate
48.0%
$178
$86
HH Income<$10,000
48.5%
$597
$289
$10,000-24,999
46.7%
$569
$266
$25,000-49,999
57.9%
$382
$221
$50,000-99,999
61.2%
$225
$137
Over $100,000
51.0%
$289
$147
Don’t Know/Refused
43.0%
$196
$84
Note: Sales figures adjusted for under-reporting using ratios in Table 6. Source: National Survey on Gambling Behavior, National Opinion Research Center, University of Chicago, 1999.

Table 11. Household Income and Per-Household Lottery Expenditures.
Household Income
Number of Adults Per Household
Annual Per
Household Play-Overall (Adjusted)
<$10,000
1.8
$520
$10,000-24,999
1.9
$505
$25,000-49,999
2.1
$464
$50,000-99,999
2.2
$301
Over $100,000
2.3
$338
Note: Sales figures adjusted for under-reporting using ratios in Table 6. Source: National Survey on Gambling Behavior, National Opinion Research Center, University of Chicago, 1999.

Table 12. Characteristics of Heaviest Lottery Players. Demographic Group
Percentage of Heaviest
Players
Percentage of US Adults
Male
61.4%
48.5%
Black
25.4%
12.2%
HS Dropouts
20.3%
12.3%
HH Income Under $10,000
9.7%
5.0%
Median Age
47.5
43.0
Note: Heaviest lottery players defined as those in the top 20% of lottery purchasers. Source: National Survey on Gambling Behavior, National Opinion Research Center, University of Chicago, 1999.

Table 13. Advertising Themes Identified in Marketing Plans of Lottery Agencies, 1998.
Percent of plans using theme Size of the prize or the jackpot 56 Fun and excitement of playing the lottery 56 Winner Awareness 46 Benefits to state of lottery dollars 28 Sports themes 28 Product Awareness 24 How to Play 20 Playing responsibly 16 Odds of winning 16 Tie-in with fairs and festivals 12 Play more often 12 Emotions of Winning 12 Answer to your Dream 12 Benefits of Winning 8 Instant gratification 8 Social interaction of playing 4 Low Price 4

Figure 1. 1998 Per Capita Sales by Gender.
Annual Per Capita Lottery Sales, by Gender
122
204
254
368
0 100 200 300 400
Female
Male
Per Capita Sales ($)
Players
Total
Overall-Total Overall-Players

Figure 2. 1998 Per Capita Sales by Race/Ethnicity
Annual Per Capita Lottery Sales, by Race/Ethnicity
147
155
481
109
295
289
998
210
0 200 400 600 800 1000 1200
Other
Hispanic
Black
White
Per Capita Sales ($)
Players
Total
Overall-Total Players

Figure 3. Per Capita Sales by Age
Annual Per Capita Lottery Sales, by Age Group
183
231
156
75
475
413
280
152
0 100 200 300 400 500
65+
45-64
30-44
18-29
Per Capita Sales ($)
Players
Total
Overall-Total Overall-Players
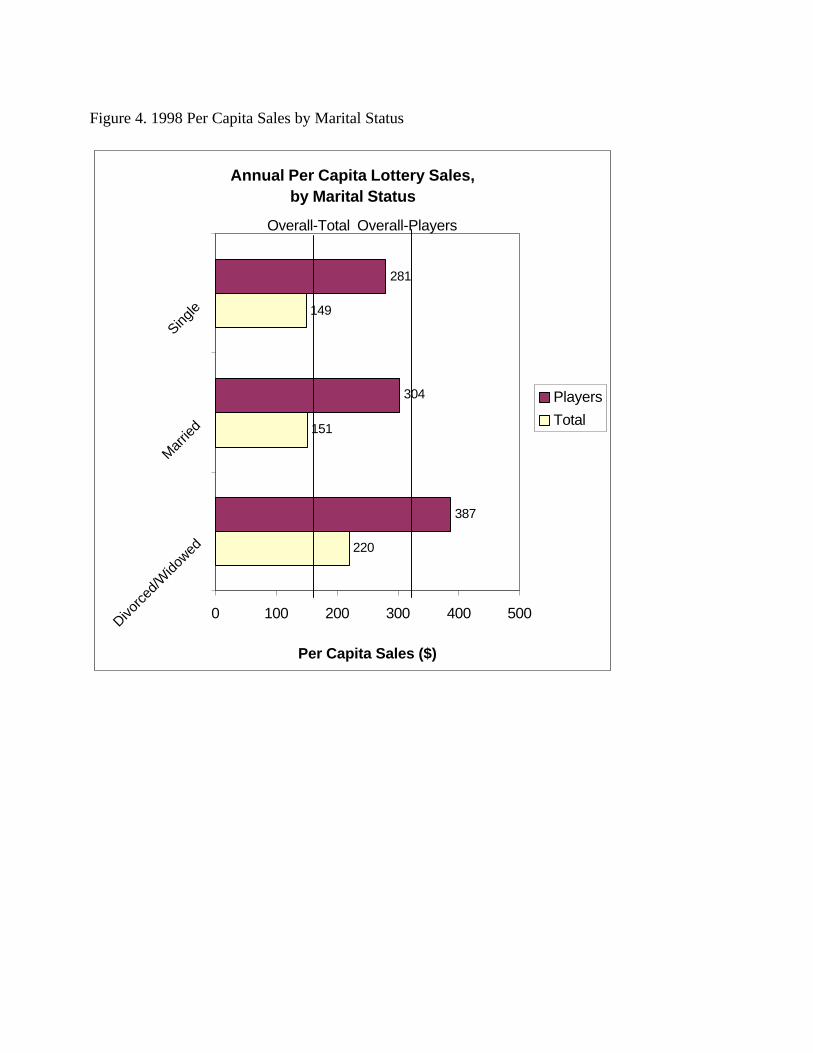
Figure 4. 1998 Per Capita Sales by Marital Status
Annual Per Capita Lottery Sales, by Marital Status
220
151
149
387
304
281
0 100 200 300 400 500Divo
rced
/Wido
wed
Mar
ried
Single
Per Capita Sales ($)
Players
Total
Overall-Total Overall-Players

Figure 5. 1998 Per Capita Sales by Educational Attainment
Figure 6. 1998 Per Capita Sales, by HH Income
Annual Per Capita Lottery Sales, by Educational Attainment
86
117
214
334
178
210
409
700
0 200 400 600 800
College Grad
Some College
HS Grad
Less than HS
Per Capita Sales ($)
Players
Total
Overall-Total Players

Annual Per Capita Lottery Sales, by HH Income
84
147
137
221
266
289
196
289
225
382
569
597
0 200 400 600 800
DK/Refused
Over $100,000
$50-99,999
$25-49,999
$10,-24,999
Under $10,000
Per Capita Sales ($)
Players
Total
Overall-Total Players

Notes
1. Pursuant to contract SPS No. 100897, signed August 26, 1998.
2. The authors thank Robert Malme for his assistance in research and data processing.
3. Lottery games were also operated by municipalities in Nebraska, but we do not consider them here.
4. The sales figures provided by the states on video lottery operations are neither comparable to other lottery games, nor to each other. Three states report “net machine income,” sales minus prizes, one state as sales minus prizes and operator payments, and one as total cash received. See International Gaming and Wagering Business, April 1998, p. 48.
5. The exponential growth rate is g in the equation X2 = X1egt, where X1 and X2 are
expenditures in years 1 and 2 and t is the number of years between them. Thus g = ln(X2/X1)/t.
6. In 1998 the Association included 21 state lotteries. McQueen (1998b, p. 1).
7. In recent years, as the decline in interest rates has reduced the undiscounted sum of 20 annual payments from an annuity, some states have sought to offset this effect by lengthening the period of payment, to as many as 30 years. Lottery agencies continue to state jackpots as a sum of annuity payments despite a strong tendency of prize winners to choose to receive their winnings in one lump sum (“Winner Take All,” International Gaming and Wagering Business, December 1998, p. 39).
8. Besides the temporary cessation of keno and an apparent drop-off in demand following the change, the principal effect of this decision in California was to prevent Indian tribes from offering slot machines, which they argued were no different than the former version of keno. See, for example, Maura Dolan and Max Vanzi, “State Court Bans Keno; Says It’s Not True Lottery,” Los Angeles Times, June 25, 1996.
9. Clotfelter and Cook (1989, Table 2.1).
10. Where p is the payout rate for a single bet, the expected prize per dollar from N consecutive bets is pN. Thus, when the payout rate is 0.81 on an individual bet, the expected prize per dollar bet after five successive bets is 0.35.
11. To a lesser extent, keno shares this recycling feature, implying that its sales figures are also somewhat noncomparable.
12. LaFleur=s Lottery World, http://www.lafleurs.com, 1/11/99.
13. For a discussion, see Clotfelter and Cook (1989, p. 227).
14. In a recent study of lottery revenues earmarked for education, Spindler (1995, p. 60) concludes: “Despite the earmarking of net lottery revenues, there is no guarantee that state

legislatures will not substitute lottery revenues for general education funding.”
15. Own-source general revenue excludes intergovernmental grants as well as special sources of revenue such as that generated by utilities or liquor stores. U.S. Bureau of the Census (1998, Table 515, p. 318).
16. See Clotfelter and Cook (1989, p. 231). To illustrate the calculation, federal, state and local taxes accounted for 30 cents of every dollar paid for liquor, leaving 70 cents the net-of-tax portion. Taxes were 30/70 = 43 percent of the net-of-tax cost of the product. The tax rate for lotteries includes estimated average federal income taxes on prizes of 5 percent.
17. With a 5 percent average income tax, prizes would be 50.4 percent of sales. Taxes would then be 38/62 = 61 percent of the net cost of prizes and operating costs.
18. McQueen (1998a, p. 48). The author notes that figures on advertising should be treated with caution since reporting differs significantly among states.
19. As an illustration of lotteries’ attention to product design, consider Colorado lottery
spokesman Todd Greco’s description of the lottery’s Perfecto games, which can be varied to feature different themes, prize structures, and numbers or symbols used in playing: “We’re trying to see what drives players to the games. Do players like symbols or numbers? Do they like high top prizes, or a lot of low prizes?” McQueen (1998c, p. 39). Also, see Tosh (1996, p. 48). Charles Strutt, director of the Multi-State Lottery Association, said, about product design: “As competition comes from casinos, riverboats, horse tracks and those other gaming sources, lotteries are going to have work harder. I see multi-state games as offering more opportunities to develop products and not just big jackpot games.” Also: “What I think Powerball has done is give us a shot in the arm, making the other lottery products more visible and the customers more aware of them.”
20. See LaFleur’s Lottery World web site for February 1998, http://www.lafleurs.com/english/lotworld/feb98.htm
21. Dean Gerstein et al., 1999, Gambling Impact and Behavior Study, Appendix B “Sampling and Weighting Methodology and Pilot Studies for the Random-Digit-Dial and Combined Surveys, and the Community Data Base” National Opinion Research Center Web Site.
22. It should be noted that the sampling procedure differs from a simple random sample of the adult population in several respects. Only adults with telephones are included in the sampling frame, and adults in households with more than one residential line are proportionately more likely to be selected. Further, an adult living in a single-adult household is twice as likely to be selected for the survey as one living in a two-adult household. Finally, the likelihood of successfully completing an interview differs systematically with the characteristics of the household and the selected individual. The weighting procedure is intended to help correct the biases introduced by these sampling problems.
23. If they had not played in the last 30 days they were not asked how much they had played on the last occasion. For those cases we assume that they had spent $1 one each type of

game they said they played.
24. The rhythm of play is likely to be different for lotto because drawings are only held once or twice each week. Numbers players may play most every day to ensure that they never miss the daily drawing, and instant games also lend themselves to frequent play since they are available any time and pay off immediately regardless when they are purchased.
25. A perfectly accurate survey of adult residents would produce an estimate of purchases that was less than actually sales, since minors and foreigners purchase some fraction of the total.
26. The Michigan law, for example, states that the "lottery shall produce the maximum amount of net revenues for the state consonant with the general welfare of the people" (Clotfelter and Cook 1989, p. 167).
27. The Big Money Game is a multi-state jackpot played in 6 states: Georgia, Illinois, Maryland, Massachusetts, Michigan and Virginia. See Chiu (1999).
28. This survey--which included more than 275 ads from 13 of the largest state lotteries -- was a sample of convenience generated by our requests to a number of lotteries and their ad agencies during the mid-1980s. We looked specifically at the kinds of information the ads provided about the chances of winning. Only 12 percent of the 151 television and radio ads in our sample provided any information about these odds. When the ads did give information on probabilities, it was invariably the probability of winning any prize, not the probability of winning the grand prize. In contrast, the dollar amounts of prizes were mentioned much more often, in half the TV and radio ads. And when prize amounts were mentioned, it was usually the amount of the grand prize that was cited. While eschewing explicit references to probabilities, lottery ads nevertheless send a consistent message about one's chances of winning. Out of the 52 television ads in our sample that portrayed anyone who plays or has played the lottery, fully two thirds showed at least one lottery winner. See Clotfelter and Cook (1989, ch.10).
29. LaFleur=s Lottery World, February 1998; web site www.lafleurs.com/english/lotworld/feb98.html.
References

Chiu, Alexis, ABaby Sitter Comes Forward to Claim $197m Lottery Prize,@ AP Newswire, April 14, 1999.
Clotfelter, Charles T. and Philip J. Cook, Selling Hope: State Lotteries in America
(Cambridge, MA: Harvard University Press, 1989).
McQueen, Patricia A., AInvesting in Tomorrow,@ International Gaming and Wagering
Business (January 1998a).
McQueen, Patricia A., APowerball Gets Star Treatment,@ International Gaming and
Wagering Business (September 1998b).
McQueen, Patricia A., APerfecto Games in Testing Stage,@ International Gaming and
Wagering Business (December 1998c).
Mediamark Research, Sports and Recreation Report Vol. P-13, (New York: Mediamark
Research, Inc.,1997), 223-228.
National Opinion Research Center, National Survey on Gambling Behavior, (Chicago:
National Opinion Research Center, University of Chicago, 1999).
Spindler, Charles J., AThe Lottery and Education: Robbing Peter to Pay Paul?@ Public
Budgeting and Finance 15 (Fall 1995), 54-62.
Tosh, Mark, AThe Cuddly Cannibal,@ International Gaming and Wagering Business
(December 1996).
U.S. Bureau of the Census, Statistical Abstract of the United States 1998 (Washington:
Government Printing Office, 1998).