Embed Size (px)
Citation preview

Grades 4 and 8 Public Schools
State Mathematics 2011
New Jersey
State-level results in mathematics are available for nine assessment years (at grade 8 in 1990; and at both grades 4 and 8 in 1992, 1996, 2000, 2003, 2005, 2007, 2009, and 2011), although not all states may have participated or met the criteria for reporting in every year. All 50 states, the District of Columbia, and the Department of Defense schools participated in the 2011 mathematics assessment at grades 4 and 8.
For more information about the assessment, see the NAEP website http://nces.ed.gov/nationsreportcard/ which contains
• The Nation's Report Card, Mathematics 2011 • The full set of national and state results in an interactive database • Released test questions, scoring guides, and question-level performance data
NAEP is a project of the National Center for Education Statistics (NCES), reporting on the academic achievement of elementary and secondary students in the United States.
This report provides selected results for New Jersey's public school students at grades 4 and 8 from the National Assessment of Educational Progress (NAEP) assessment in mathematics. Results are reported by average scale scores and by achievement levels (Basic, Proficient, and Advanced).
Page 1 of 65

KEY FINDINGS FOR 2011
Grade 4:
In 2011, the average mathematics score for fourth-grade students in New Jersey was 248. This was higher than that of the nation's public schools (240).
The average score for students in New Jersey in 2011 (248) was higher than that in 1992 (227) and was not significantly different from that in 2009 (247).
In 2011, the percentage of students in New Jersey who performed at or above Proficient was 51 percent. This was greater than that for the nation's public schools (40 percent).
The percentage of students in New Jersey who performed at or above Proficient in 2011 (51 percent) was greater than that in 1992 (25 percent) and was not significantly different from that in 2009 (49 percent).
In 2011, the percentage of students in New Jersey who performed at or above Basic was 89 percent. This was greater than that for the nation's public schools (82 percent).
The percentage of students in New Jersey who performed at or above Basic in 2011 (89 percent) was greater than that in 1992 (68 percent) and was not significantly different from that in 2009 (88 percent).
Grade 8:
In 2011, the average mathematics score for eighth-grade students in New Jersey was 294. This was higher than that of the nation's public schools (283).
The average score for students in New Jersey in 2011 (294) was higher than that in 1990 (270) and was not significantly different from that in 2009 (293).
In 2011, the percentage of students in New Jersey who performed at or above Proficient was 47 percent. This was greater than that for the nation's public schools (34 percent).
The percentage of students in New Jersey who performed at or above Proficient in 2011 (47 percent) was greater than that in 1990 (21 percent) and was not significantly different from that in 2009 (44 percent).
In 2011, the percentage of students in New Jersey who performed at or above Basic was 82 percent. This was greater than that for the nation's public schools (72 percent).
The percentage of students in New Jersey who performed at or above Basic in 2011 (82 percent) was greater than that in 1990 (58 percent) and was not significantly different from that in 2009 (80 percent).
NAEP 2011 Mathematics Report for New Jersey
Page 2 of 65

Introduction
What Was Assessed?
The content for each NAEP assessment is determined by the National Assessment Governing Board. The framework for each assessment documents the content and process areas to be measured and sets guidelines for the types of questions to be used. The mathematics frameworks were developed with the guidance of the Council of Chief State School Officers (CCSSO) and under the direction of the Governing Board. The current framework is available at the Governing Board's website http://www.nagb.org/publications/frameworks/math-2011-framework.pdf.
For grades 4 and 8, the mathematics framework for the 2011 assessment is similar to earlier versions that guided the 1990, 1992, 1996, 2000, 2003, 2005, 2007, and 2009 mathematics assessments. Although the frameworks are updated periodically, the mathematics content objectives for grades 4 and 8 have not changed, allowing students' performance in 2011 to be compared with previous years.
Content Areas and Mathematical Complexity
The 2011 mathematics framework classifies assessment questions in two dimensions, content area and mathematical complexity, that are used to guide the assessment. Each question is designed to measure one of the five content areas. However, certain aspects of mathematics, such as computation, occur in all content areas. Although the names of the content areas (as well as some topics in those areas) have changed from one framework to the next, a consistent focus has remained on measuring student performance in all five content areas. The distribution of questions among each content area differs by grade to reflect the knowledge and skills appropriate for each grade level.
Number properties and operations measures students' understanding of ways to represent, calculate, and estimate with numbers.
Measurement measures students' knowledge of measurement attributes, such as capacity and temperature, and geometric attributes, such as length, area, and volume.
Geometry measures students' knowledge and understanding of shapes in a plane and in space. Data analysis, statistics, and probability measures students' understanding of data representation,
characteristics of data sets, experiments and samples, and probability. Algebra measures students' understanding of patterns, using variables, algebraic representation, and
functions.
The mathematical complexity of a question refers to the level of cognitive demand it places on students. Each level of complexity includes aspects of knowing and doing mathematics, such as performing procedures, understanding concepts, or solving problems.
Low complexity questions typically specify what a student is to do, which is often to carry out a routine mathematical procedure.
Moderate complexity questions involve more flexibility of thinking and often require a response with multiple steps.
High complexity questions make heavier demands and often require abstract reasoning or analysis in a novel situation.
NAEP 2011 Mathematics Report for New Jersey
Page 3 of 65

Assessment Design
Because of the breadth of the content covered in the NAEP mathematics assessment, each student took just a portion of the test, consisting of two 25-minute sections. Most student's testing time was divided evenly between multiple-choice and constructed-response questions. Short constructed-response questions asked students to provide the answer for a numerical problem or to briefly describe the solution to a problem. Longer constructed-response questions required students to write both a solution and its justification, explanation, or interpretation. Released test questions, along with student performance data by state, are available on the NAEP website at http://nces.ed.gov/nationsreportcard/itmrls/.
Some questions in the 2011 assessment incorporated the use of calculators (four-function calculators at grade 4 and scientific or graphing calculators at grade 8), rulers, protractors (at grade 8), or manipulatives such as spinners and geometric shapes. Calculator use at all grades was permitted on approximately one-third of the assessment.
NAEP 2011 Mathematics Report for New Jersey
Page 4 of 65

Who Was Assessed?
All 50 states, the District of Columbia, and the Department of Defense Schools participated in the 2011 mathematics assessment at grades 4 and 8. The overall participation rates for schools and students must meet guidelines established by the National Center for Education Statistics (NCES) and the National Assessment Governing Board for assessment results to be reported publicly. A participation rate of at least 85 percent for schools in each subject and grade was required. Participation rates for the 2011 mathematics assessment are available on the NAEP website at http://nationsreportcard.gov/math_2011/participation.asp.
The schools and students participating in NAEP assessments are selected to be representative both nationally and for public schools at the state level. The comparisons between national and state results in this report present the performance of public school students only. In NAEP reports, the category "nation (public)" does not include Department of Defense or Bureau of Indian Education schools.
NAEP 2011 Mathematics Report for New Jersey
Page 5 of 65

How Is Student Mathematics Performance Reported?
The 2011 state results are compared to results from seven earlier assessments at grade 4 and from eight earlier assessments at grade 8.
Scale Scores: Student performance is reported as an average score based on the NAEP mathematics scale, which ranges from 0 to 500 for grades 4 and 8. Because NAEP scales are developed independently for each subject and for each content area within a subject, the scores cannot be compared across subjects or across content areas within the same subject. Results are also reported at five percentiles (10th, 25th, 50th, 75th, and 90th) to show trends in performance for lower-, middle-, and higher-performing students.
Achievement Levels: Based on recommendations from policymakers, educators, and members of the general public, the Governing Board has set specific achievement levels for each subject area and grade. Achievement levels are performance standards indicating what students should know and be able to do. They provide another perspective with which to interpret student performance. NAEP results are reported in terms of three achievement levels—Basic, Proficient, and Advanced—and are expressed in terms of the percentage of students who attained each level. The three achievement levels are defined as follows:
Basic denotes partial mastery of prerequisite knowledge and skills that are fundamental for proficient work at each grade.
Proficient represents solid academic performance for each grade assessed. Students reaching this level have demonstrated competency over challenging subject matter, including subject-matter knowledge, application of such knowledge to real-world situations, and appropriate analytical skills.
Advanced represents superior performance.
The achievement levels are cumulative; therefore, students performing at the Proficient level also display the competencies associated with the Basic level, and students at the Advanced level also demonstrate the competencies associated with both the Basic and the Proficient levels.
As provided by law, NCES, upon review of congressionally mandated evaluations of NAEP, has determined that achievement levels are to be used on a trial basis and should be interpreted with caution. The NAEP achievement levels have been widely used by national and state officials. The mathematics achievement-level descriptions are summarized in figures 1-A and 1-B.
NAEP 2011 Mathematics Report for New Jersey
Page 6 of 65

Fourth-graders performing at the Basic level should be able to estimate and use basic facts to perform simple computations with whole numbers, show some understanding of fractions and decimals, and solve some simple real-world problems in all NAEP content areas. Students at this level should be able to use—although not always accurately—four-function calculators, rulers, and geometric shapes. Their written responses are often minimal and presented without supporting information.
Fourth-graders performing at the Proficient level should be able to use whole numbers to estimate, compute, and determine whether results are reasonable. They should have a conceptual understanding of fractions and decimals; be able to solve real-world problems in all NAEP content areas; and use four-function calculators, rulers, and geometric shapes appropriately. Students performing at the Proficient level should employ problem-solving strategies such as identifying and using appropriate information. Their written solutions should be organized and presented both with supporting information and explanations of how they were achieved.
Fourth-graders performing at the Advanced level should be able to solve complex and nonroutine real-world problems in all NAEP content areas. They should display mastery in the use of four-function calculators, rulers, and geometric shapes. These students are expected to draw logical conclusions and justify answers and solution processes by explaining why, as well as how, they were achieved. They should go beyond the obvious in their interpretations and be able to communicate their thoughts clearly and concisely.
NOTE: The scores in parentheses in the shaded boxes indicate the lowest point on the 0-500 scale at which the achievement-level range begins. SOURCE: National Assessment Governing Board. (2010). Mathematics Framework for the 2011 National Assessment of Educational Progress. Washington, DC: Author.
NAEP 2011 Mathematics Report for New Jersey
Figure 1-A
The Nation's Report Card 2011 State Assessment
Descriptions of fourth-grade achievement levels for 2011 NAEP mathematics assessment
Basic Level (214)
Fourth-grade students performing at the Basic level should show some evidence of understanding the mathematical concepts and procedures in the five NAEP content areas.
Proficient Level (249)
Fourth-grade students performing at the Proficient level should consistently apply integrated procedural knowledge and conceptual understanding to problem solving in the five NAEP content areas.
Advanced Level (282)
Fourth-grade students performing at the Advanced level should apply integrated procedural knowledge and conceptual understanding to complex and nonroutine real-world problem solving in the five NAEP content areas.
Page 7 of 65
Eighth-graders performing at the Basic level should complete problems correctly with the help of structural prompts such as diagrams, charts, and graphs. They should be able to solve problems in all NAEP content areas through the appropriate selection and use of strategies and technological tools—including calculators, computers, and geometric shapes. Students at this level also should be able to use fundamental algebraic and informal geometric concepts in problem solving.
As they approach the Proficient level, students at the Basic level should be able to determine which of the available data are necessary and sufficient for correct solutions and use them in problem solving. However, these eighth-graders show limited skill in communicating mathematically.
Eighth-graders performing at the Proficient level should be able to conjecture, defend their ideas, and give supporting examples. They should understand the connections among fractions, percents, decimals, and other mathematical topics such as algebra and functions. Students at this level are expected to have a thorough understanding of Basic level arithmetic operations—an understanding sufficient for problem solving in practical situations.
Quantity and spatial relationships in problem solving and reasoning should be familiar to them, and they should be able to convey underlying reasoning skills beyond the level of arithmetic. They should be able to compare and contrast mathematical ideas and generate their own examples. These students should make inferences from data and graphs, apply properties of informal geometry, and accurately use the tools of technology. Students at this level should understand the process of gathering and organizing data and be able to calculate, evaluate, and communicate results within the domain of statistics and probability.
Eighth-graders performing at the Advanced level should be able to probe examples and counterexamples in order to shape generalizations from which they can develop models. Eighth-graders performing at the Advanced level should use number sense and geometric awareness to consider the reasonableness of an answer. They are expected to use abstract thinking to create unique problem-solving techniques and explain the reasoning processes underlying their conclusions.
NOTE: The scores in parentheses in the shaded boxes indicate the lowest point on the 0-500 scale at which the achievement-level range begins. SOURCE: National Assessment Governing Board. (2010). Mathematics Framework for the 2011 National Assessment of Educational Progress. Washington, DC: Author.
NAEP 2011 Mathematics Report for New Jersey
Figure 1-B
The Nation's Report Card 2011 State Assessment
Descriptions of eighth-grade achievement levels for 2011 NAEP mathematics assessment
Basic Level (262)
Eighth-grade students performing at the Basic level should exhibit evidence of conceptual and procedural understanding in the five NAEP content areas. This level of performance signifies an understanding of arithmetic operations—including estimation—on whole numbers, decimals, fractions, and percents.
Proficient Level (299)
Eighth-grade students performing at the Proficient level should apply mathematical concepts and procedures consistently to complex problems in the five NAEP content areas.
Advanced Level (333)
Eighth-grade students performing at the Advanced level should be able to reach beyond the recognition, identification, and application of mathematical rules in order to generalize and synthesize concepts and principles in the five NAEP content areas.
Page 8 of 65

Assessing Students With Disabilities and/or English Language Learners
Testing accommodations, such as extra testing time or individual (rather than group) administration, are provided for students with disabilities (SD) or English language learners (ELL) who could not fairly and accurately demonstrate their abilities without modified test administration procedures. In 1996, administration procedures were introduced at the national level allowing certain accommodations for students requiring such accommodations to participate.
In state NAEP mathematics assessments prior to 2000, no testing accommodations or adaptations were permitted for SD or ELL students. In 2000, NAEP was administered using a split sample of schools—one sample in which accommodations were permitted for special-needs students who normally received them and another sample in which accommodations were not permitted. Therefore, there were two different sets of results available for 2000, and both are shown in the tables in this report. Results for the assessment years when accommodations were not permitted in state NAEP assessments (1990, 1992, 1996) are reported in the same tables as the results when accommodations were permitted (2000, 2003, 2005, 2007, 2009, 2011).
Even with the availability of accommodations, however, some students may still be excluded from the NAEP assessment. Due to differences in policies and practices regarding the identification and inclusion of SD and ELL students, variations in exclusion and accommodation rates should be considered when comparing students' performance over time and across states. The types of accommodations used in the 2011 NAEP mathematics assessment are available on the NAEP website at http://nationsreportcard.gov/math_2011/type_accomm.asp
NAEP 2011 Mathematics Report for New Jersey
Page 9 of 65

Interpreting Results
The scores and percentages in this report are estimates based on samples of students rather than on entire populations. In addition, the collection of questions used at each grade level is only a sample of the many questions that could have been asked to assess the skills and abilities described in the NAEP framework. Comparisons over time or between groups are based on statistical tests that consider both the size of the differences and the standard errors of the two statistics being compared. Standard errors are margins of error, and estimates based on smaller groups are likely to have larger margins of error. The size of the standard errors may also be influenced by other factors such as how representative the assessed students are of the entire population. Statistical tests that factor in these standard errors are used to determine whether the differences between average scores or percentages are significant. All differences were tested for statistical significance at the .05 level using unrounded numbers.
NAEP sample sizes have increased since 2002 compared to previous years, resulting in smaller standard errors. As a consequence, smaller differences are detected as statistically significant than were detected in previous assessments. In addition, estimates based on smaller groups are likely to have relatively large standard errors. Thus, some seemingly large differences may not be statistically significant. That is, it cannot be determined whether these differences are due to sampling error, or to true differences in the population of interest.
Differences between scores or between percentages are discussed in this report only when they are significant from a statistical perspective. Significant differences between 2011 and prior assessments are marked with a notation (*) in the tables. Any differences in scores within a year or across years that are mentioned in the text as "higher," "lower," "greater," or "smaller" are statistically significant.
Score or percentage differences or gaps cited in this report are calculated based on differences between unrounded numbers. Therefore, the reader may find that the score or percentage difference cited in the text or tables may not be identical to the difference obtained from subtracting the rounded values shown in the accompanying tables or figures.
The reader is cautioned against making simple causal inferences between student performance and the other variables (e.g., race/ethnicity, gender, and type of school location) discussed in this report. A statistically significant relationship between a variable and measures of student performance does not imply that the variable causes differences in how well students perform. The relationship may be influenced by a number of other variables not accounted for in this report, such as family income, parental involvement, or student attitudes.
NAEP 2011 Mathematics Report for New Jersey
Page 10 of 65

NAEP 2011 Mathematics Overall Average Score and Achievement-Level Results for Public School Students
Overall mathematics results for public school students from New Jersey are reported in this section, as well as regional and national results. The regions defined by the U.S. Census Bureau are Northeast, South, Midwest, and West (http://nces.ed.gov/nationsreportcard/hsts/tabulations/regions.asp).Trend data by region are not provided for assessment years prior to 2003.
Prior to 2000, testing accommodations were not provided for students with special needs in NAEP state mathematics assessments. For 2000, results are displayed for both the sample in which accommodations were permitted and the sample in which they were not permitted. Subsequent assessment results were based on the more inclusive samples. In the text of this report, comparisons to 2000 results refer only to the sample in which accommodations were permitted.
Overall Scale Score Results
Student performance is reported as an average score based on the NAEP mathematics scale, which ranges from 0 to 500 for grades 4 and 8.
Tables 1-A and 1-B show the overall performance results of grades 4 and 8 public school students in New Jersey, the nation (public), and the region. Prior to 2003, the list of states that comprise a given region for NAEP differed from the list used by the U.S. Census Bureau, which has been used in NAEP from 2003 onward. Therefore, the data for the state's region are given only for 2003, 2005, 2007, 2009, and 2011. The first column of results presents the average score on the NAEP mathematics scale. The remaining columns show the scores at selected percentiles. Percentiles indicate the percentages of students whose scores fell at or below a particular score. For example, the 25th percentile demarks the cut point for the lowest 25 percent of students within the distribution of scale scores.
Grade 4 Scale Score Results
In 2011, the average scale score for students in New Jersey was 248. This was higher than that of students across the nation (240).
In New Jersey, the average scale score for students in 2011 was not significantly different from that in 2009 (247). However, the average scale score for students in public schools across the nation in 2011 was higher than that in 2009 (239).
In New Jersey, the average scale score for students in 2011 was higher than the scores in 1992, 1996, 2003, and 2005. However, it was not significantly different from the scores in 2007 and 2009.
Grade 8 Scale Score Results
In 2011, the average scale score for students in New Jersey was 294. This was higher than that of students across the nation (283).
In New Jersey, the average scale score for students in 2011 was not significantly different from that in 2009 (293). However, the average scale score for students in public schools across the nation in 2011 was higher than that in 2009 (282).
In New Jersey, the average scale score for students in 2011 was higher than the scores in 1990, 1992, 2003, 2005, and 2007. However, it was not significantly different from the score in 2009.
NAEP 2011 Mathematics Report for New Jersey
Page 11 of 65

NAEP 2011 Mathematics Report for New Jersey
Table
1-A
The Nation's Report Card 2011 State Assessment
Average scale scores and selected percentile scores in NAEP mathematics for fourth-grade public school students, by year and jurisdiction: Various years, 1992–2011
* Value is significantly different (p < .05) from the value for the same jurisdiction in 2011.1 Accommodations were not permitted for this assessment.2 Region in which jurisdiction is located. Regional data are not provided for years prior to 2003 to be consistent with the U.S. Census Bureau defined
regions.NOTE: The NAEP grade 4 mathematics scale ranges from 0 to 500. All differences were calculated and tested using unrounded numbers.SOURCE: U.S. Department of Education, Institute of Education Sciences, National Center for Education Statistics, National Assessment of Educational Progress (NAEP), various years, 1992–2011 Mathematics Assessments.
19921 Nation (public) 219 176 197 220 241 259New Jersey 227 187 207 229 249 265
19961 Nation (public) 222 180 201 224 244 261New Jersey 227 186 207 229 249 266
2003 Nation (public) 234 196 215 235 254 270Northeast2 238 200 219 239 258 272
New Jersey 239 199 220 241 260 2742005 Nation (public) 237 199 219 239 257 272
Northeast2 241 204 224 243 261 275New Jersey 244 207 227 246 263 278
2007 Nation (public) 239 201 221 241 259 274Northeast2 245 209 228 247 264 279
New Jersey 249 213 232 250 267 2812009 Nation (public) 239 201 221 241 259 275
Northeast2 244 208 226 246 264 279New Jersey 247 210 229 248 266 280
2011 Nation (public) 240 202 222 242 260 276Northeast2 244 206 226 246 264 280
New Jersey 248 212 231 250 267 282
Year and jurisdictionAverage
scale score10th
percentile25th
percentile50th
percentile75th
percentile90th
percentile
Page 12 of 65

NAEP 2011 Mathematics Report for New Jersey
Table
1-B
The Nation's Report Card 2011 State Assessment
Average scale scores and selected percentile scores in NAEP mathematics for eighth-grade public school students, by year and jurisdiction: Various years, 1990–2011
* Value is significantly different (p < .05) from the value for the same jurisdiction in 2011.1 Accommodations were not permitted for this assessment.2 Region in which jurisdiction is located. Regional data are not provided for years prior to 2003 to be consistent with the U.S. Census Bureau defined
regions.NOTE: The NAEP grade 8 mathematics scale ranges from 0 to 500. All differences were calculated and tested using unrounded numbers.SOURCE: U.S. Department of Education, Institute of Education Sciences, National Center for Education Statistics, National Assessment of Educational Progress (NAEP), various years, 1990–2011 Mathematics Assessments.
19901 Nation (public) 262 214 237 263 288 307New Jersey 270 223 245 270 294 316
19921 Nation (public) 267 219 242 268 293 314New Jersey 272 223 248 274 297 317
2003 Nation (public) 276 228 253 278 301 321Northeast2 281 233 258 283 306 325
New Jersey 281 232 258 284 307 3262005 Nation (public) 278 230 254 279 303 323
Northeast2 282 235 259 284 307 327New Jersey 284 234 261 286 310 331
2007 Nation (public) 280 234 257 281 305 325Northeast2 285 239 262 287 310 330
New Jersey 289 241 265 291 314 3342009 Nation (public) 282 235 258 283 307 328
Northeast2 288 240 265 290 314 334New Jersey 293 244 269 294 319 340
2011 Nation (public) 283 236 259 284 308 329Northeast2 287 240 263 288 312 333
New Jersey 294 248 272 296 319 339
Year and jurisdictionAverage
scale score10th
percentile25th
percentile50th
percentile75th
percentile90th
percentile
Page 13 of 65

Overall Achievement-Level Results
Student results are reported as the percentages of students performing relative to performance standards set by the National Assessment Governing Board. These performance standards for what students should know and be able to do were based on the recommendations of broadly representative panels of educators and members of the public.
Tables 2-A and 2-B show the percentage of students at grades 4 and 8 who performed below Basic, at or above Basic, at or above Proficient, and at Advanced. Because the percentages are cumulative from Basic to Proficient to Advanced, they may sum to more than 100 percent. Only the percentage of students performing at or above Basic (which includes the students at Proficient and Advanced) plus the students below Basic will sum to 100 percent.
Grade 4 Achievement-Level Results
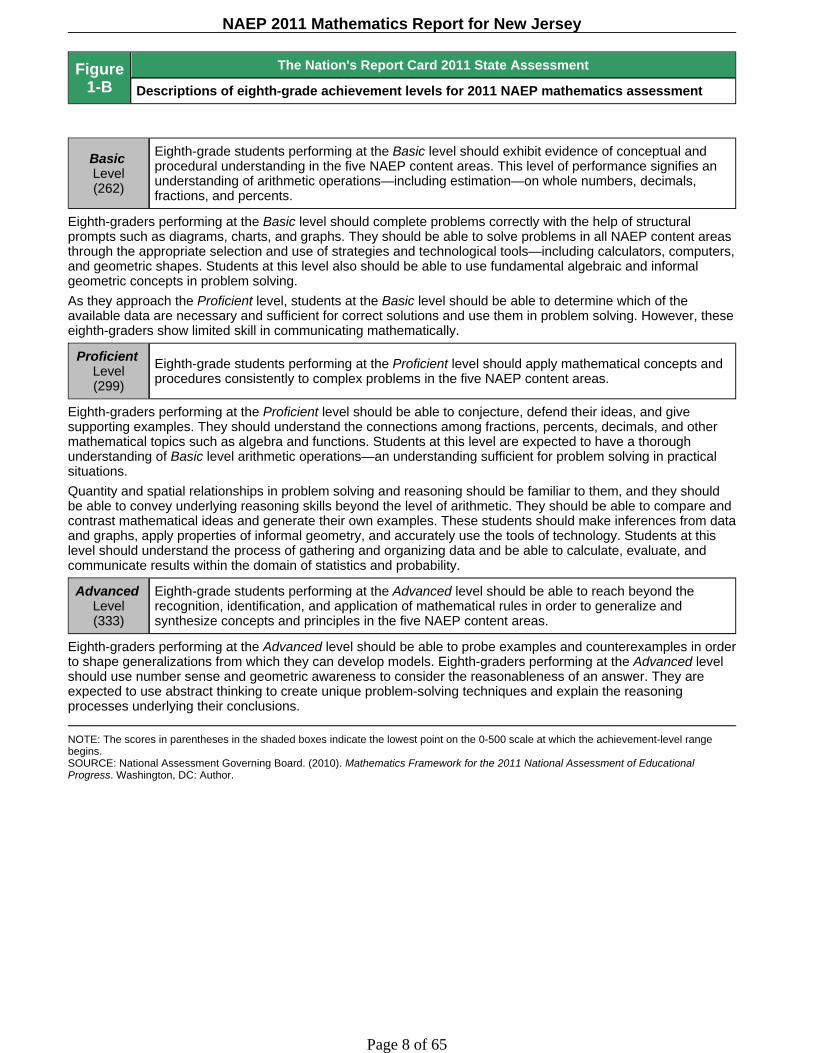
In 2011, the percentage of New Jersey's students who performed at or above Proficient was 51 percent. This was greater than the percentage of the nation's public school students who performed at or above Proficient (40 percent).
In New Jersey, the percentage of students who performed at or above Proficient in 2011 was greater than the percentages in 1992, 1996, 2003, and 2005, but was not significantly different from the percentages in 2007 and 2009.
In 2011, the percentage of New Jersey's students who performed at or above Basic was 89 percent. This was greater than the percentage of the nation's public school students who performed at or above Basic (82 percent).
In New Jersey, the percentage of students who performed at or above Basic in 2011 was greater than the percentages in 1992, 1996, 2003, and 2005, but was not significantly different from the percentages in 2007 and 2009.
Grade 8 Achievement-Level Results
In 2011, the percentage of New Jersey's students who performed at or above Proficient was 47 percent. This was greater than the percentage of the nation's public school students who performed at or above Proficient (34 percent).
In New Jersey, the percentage of students who performed at or above Proficient in 2011 was greater than the percentages in 1990, 1992, 2003, 2005, and 2007, but was not significantly different from the percentage in 2009.
In 2011, the percentage of New Jersey's students who performed at or above Basic was 82 percent. This was greater than the percentage of the nation's public school students who performed at or above Basic (72 percent).
In New Jersey, the percentage of students who performed at or above Basic in 2011 was greater than the percentages in 1990, 1992, 2003, 2005, and 2007, but was not significantly different from the percentage in 2009.
NAEP 2011 Mathematics Report for New Jersey
Page 14 of 65
NAEP 2011 Mathematics Report for New Jersey
Table
2-A
The Nation's Report Card 2011 State Assessment
Percentage of fourth-grade public school students at or above NAEP mathematics achievement levels, by year and jurisdiction: Various years, 1992–2011
* Value is significantly different (p < .05) from the value for the same jurisdiction in 2011.1 Accommodations were not permitted for this assessment.2 Region in which jurisdiction is located. Regional data are not provided for years prior to 2003 to be consistent with the U.S. Census Bureau
defined regions.NOTE: The NAEP grade 4 mathematics scale ranges from 0 to 500. Achievement levels correspond to the following points on the NAEP mathematics scales: below Basic, 213 or lower; Basic, 214—248; Proficient, 249—281; and Advanced, 282 and above. At or above Basic includes Basic, Proficient, and Advanced. At or above Proficient includes Proficient and Advanced. Detail may not sum to totals because of rounding. All differences were calculated and tested using unrounded numbers.SOURCE: U.S. Department of Education, Institute of Education Sciences, National Center for Education Statistics, National Assessment of Educational Progress (NAEP), various years, 1992–2011 Mathematics Assessments.
19921 Nation (public) 43 57 17 2New Jersey 32 68 25 2
19961 Nation (public) 38 62 20 2New Jersey 32 68 25 3
2003 Nation (public) 24 76 31 4Northeast2 20 80 36 5
New Jersey 20 80 39 52005 Nation (public) 21 79 35 5
Northeast2 16 84 41 6New Jersey 14 86 45 8
2007 Nation (public) 19 81 39 5Northeast2 13 87 47 8
New Jersey 10 90 52 92009 Nation (public) 19 81 38 6
Northeast2 14 86 46 8New Jersey 12 88 49 9
2011 Nation (public) 18 82 40 6Northeast2 15 85 46 8
New Jersey 11 89 51 10
Year and jurisdictionBelow Basic
At or above Basic
At or above Proficient
At Advanced
Page 15 of 65

NAEP 2011 Mathematics Report for New Jersey
Table
2-B
The Nation's Report Card 2011 State Assessment
Percentage of eighth-grade public school students at or above NAEP mathematics achievement levels, by year and jurisdiction: Various years, 1990–2011
* Value is significantly different (p < .05) from the value for the same jurisdiction in 2011.1 Accommodations were not permitted for this assessment.2 Region in which jurisdiction is located. Regional data are not provided for years prior to 2003 to be consistent with the U.S. Census Bureau
defined regions.NOTE: The NAEP grade 8 mathematics scale ranges from 0 to 500. Achievement levels correspond to the following points on the NAEP mathematics scales: below Basic, 261 or lower; Basic, 262—298; Proficient, 299—332; and Advanced, 333 and above. At or above Basic includes Basic, Proficient, and Advanced. At or above Proficient includes Proficient and Advanced. Detail may not sum to totals because of rounding. All differences were calculated and tested using unrounded numbers.SOURCE: U.S. Department of Education, Institute of Education Sciences, National Center for Education Statistics, National Assessment of Educational Progress (NAEP), various years, 1990–2011 Mathematics Assessments.
19901 Nation (public) 49 51 15 2New Jersey 42 58 21 3
19921 Nation (public) 44 56 20 3New Jersey 38 62 24 3
2003 Nation (public) 33 67 27 5Northeast2 29 71 33 6
New Jersey 28 72 33 62005 Nation (public) 32 68 28 6
Northeast2 27 73 33 7New Jersey 26 74 36 9
2007 Nation (public) 30 70 31 7Northeast2 25 75 37 9
New Jersey 23 77 40 102009 Nation (public) 29 71 33 7
Northeast2 22 78 40 11New Jersey 20 80 44 14
2011 Nation (public) 28 72 34 8Northeast2 24 76 39 10
New Jersey 18 82 47 14
Year and jurisdictionBelow Basic
At or above Basic
At or above Proficient
At Advanced
Page 16 of 65

Comparisons Between New Jersey, the Nation, and Participating States and Jurisdictions
All 50 states, the District of Columbia, and the Department of Defense Schools participated in the 2011 mathematics assessment at grades 4 and 8. References to "jurisdictions" in the results statements may include states, the District of Columbia, and Department of Defense Schools.
Comparisons by Scale Scores
Figures 2-A and 2-B compare New Jersey's 2011 overall mathematics scale scores at grades 4 and 8 with those of public schools in the nation and all other participating states and jurisdictions. The different shadings indicate whether the average score of the nation (public), a state, or a jurisdiction was found to be higher than, lower than, or not significantly different from that of New Jersey in the NAEP 2011 mathematics assessment.
Grade 4 Scale Score Comparison Results
The average score for students in New Jersey was higher than the scores in 43 jurisdictions, not significantly different from those in 6 jurisdictions, and lower than those in 2 jurisdictions.
Grade 8 Scale Score Comparison Results
The average score for students in New Jersey was higher than the scores in 44 jurisdictions, not significantly different from those in 6 jurisdictions, and lower than those in 1 jurisdiction.
NAEP 2011 Mathematics Report for New Jersey
Page 17 of 65

NAEP 2011 Mathematics Report for New Jersey
Figure
2-A
The Nation's Report Card 2011 State Assessment
New Jersey's average scale score in NAEP mathematics for fourth-grade public school students compared with scores for the nation and other participating jurisdictions: 2011
1 Department of Defense Education Activity (overseas and domestic schools).
NOTE: Significance tests used a multiple-comparison procedure based on all jurisdictions that participated. SOURCE: U.S. Department of Education, Institute of Education Sciences, National Center for Education Statistics, National Assessment of Educational Progress (NAEP), 2011 Mathematics Assessment.
Focal state/jurisdiction (New Jersey)
Higher average scale score than New Jersey (2 jurisdictions)
Not significantly different from New Jersey (6 jurisdictions)
Lower average scale score than New Jersey (nation and 43 jurisdictions)
Page 18 of 65

NAEP 2011 Mathematics Report for New Jersey
Figure
2-B
The Nation's Report Card 2011 State Assessment
New Jersey's average scale score in NAEP mathematics for eighth-grade public school students compared with scores for the nation and other participating jurisdictions: 2011
1 Department of Defense Education Activity (overseas and domestic schools).
NOTE: Significance tests used a multiple-comparison procedure based on all jurisdictions that participated. SOURCE: U.S. Department of Education, Institute of Education Sciences, National Center for Education Statistics, National Assessment of Educational Progress (NAEP), 2011 Mathematics Assessment.
Focal state/jurisdiction (New Jersey)
Higher average scale score than New Jersey (1 jurisdiction)
Not significantly different from New Jersey (6 jurisdictions)
Lower average scale score than New Jersey (nation and 44 jurisdictions)
Page 19 of 65

Comparisons by Achievement Levels
Figures 3-A and 3-B permit comparisons of all jurisdictions (and the nation) participating in the NAEP 2011 mathematics assessment in terms of percentages of grades 4 and 8 students performing at or above Proficient. The participating states and jurisdictions are grouped into categories reflecting whether the percentage of their students performing at or above Proficient (including Advanced) was found to be higher than, not significantly different from, or lower than the percentage in New Jersey.
Note that the selected state is listed first in its category, and the other states and jurisdictions within each category are listed alphabetically; statistical comparisons among jurisdictions in each of the three categories are not included in this report. However, statistical comparisons among states by achievement level can be calculated online by using the NAEP Data Explorer at http://nces.ed.gov/nationsreportcard/naepdata/.
Grade 4 Achievement-Level Comparison Results
The percentage of students performing at or above the Proficient level in New Jersey was greater than the percentage in 42 jurisdictions, not significantly different from those in 7 jurisdictions, and smaller than those in 2 jurisdictions.
The percentage of students performing at or above the Basic level in New Jersey was greater than the percentage in 36 jurisdictions, not significantly different from those in 13 jurisdictions, and smaller than those in 2 jurisdictions (data not shown).
Grade 8 Achievement-Level Comparison Results
The percentage of students performing at or above the Proficient level in New Jersey was greater than the percentage in 44 jurisdictions, not significantly different from those in 6 jurisdictions, and smaller than those in 1 jurisdiction.
The percentage of students performing at or above the Basic level in New Jersey was greater than the percentage in 39 jurisdictions, not significantly different from those in 11 jurisdictions, and smaller than those in 1 jurisdiction (data not shown).
NAEP 2011 Mathematics Report for New Jersey
Page 20 of 65

NAEP 2011 Mathematics Report for New Jersey
Figure
3-A
The Nation's Report Card 2011 State Assessment
Average scale scores in NAEP mathematics for fourth-grade public school students, percentage within each achievement level, and New Jersey's percentage at or above Proficient compared with the nation and other participating states/jurisdictions: 2011
1 Department of Defense Education Activity (overseas and domestic schools).
NOTE: The bars above contain percentages of students in each NAEP mathematics achievement level. Achievement levels corresponding to each population of students are aligned at the point where the Proficient category begins, so that they may be compared at Proficient and above. Detail may not sum to totals because of rounding. All differences were calculated and tested using unrounded numbers. The shaded bars are graphed using unrounded numbers. Significance tests used a multiple-comparison procedure based on all jurisdictions that participated. SOURCE: U.S. Department of Education, Institute of Education Sciences, National Center for Education Statistics, National Assessment of Educational Progress (NAEP), 2011 Mathematics Assessment.
Page 21 of 65

NAEP 2011 Mathematics Report for New Jersey
Figure
3-B
The Nation's Report Card 2011 State Assessment
Average scale scores in NAEP mathematics for eighth-grade public school students, percentage within each achievement level, and New Jersey's percentage at or above Proficient compared with the nation and other participating states/jurisdictions: 2011
1 Department of Defense Education Activity (overseas and domestic schools).
NOTE: The bars above contain percentages of students in each NAEP mathematics achievement level. Achievement levels corresponding to each population of students are aligned at the point where the Proficient category begins, so that they may be compared at Proficient and above. Detail may not sum to totals because of rounding. All differences were calculated and tested using unrounded numbers. The shaded bars are graphed using unrounded numbers. Significance tests used a multiple-comparison procedure based on all jurisdictions that participated. SOURCE: U.S. Department of Education, Institute of Education Sciences, National Center for Education Statistics, National Assessment of Educational Progress (NAEP), 2011 Mathematics Assessment.
Page 22 of 65

Mathematics Performance of Selected Student Groups
This section of the report presents trend results for public school students in New Jersey and the nation by demographic characteristics. Student performance data are reported for
race/ethnicity gender student eligibility for the National School Lunch Program type of school location (for 2007, 2009, and 2011) parents' highest level of education
Results for each of the variables are reported in tables that include the percentage of students in each group in the first column, and the average scale score in the second column. The columns to the right show the percentage of students below Basic and at or above each achievement level.
Results by students' race/ethnicity and gender include statements about score point differences between student groups (e.g., between White and Black or White and Hispanic students, or between male and female students) in 2011 and in the first assessment year. Because these differences are calculated using unrounded values, they may differ slightly from what would be obtained by subtracting the rounded values that appear in the tables. Statements indicating a narrowing or widening of the gap in students' scores are only made if the change in the gap from the first assessment year to 2011 was found to be statistically significant.
The reader is cautioned against making simple causal inferences about group differences, as a complex mix of educational and socioeconomic factors may affect student performance. NAEP collects information on many additional variables, including school and home factors related to achievement. This information is in an interactive database available on the NAEP website http://nces.ed.gov/nationsreportcard/naepdata/.
NAEP 2011 Mathematics Report for New Jersey
Page 23 of 65

Race/Ethnicity
Prior to 2011, student race/ethnicity was obtained from school records and reported for the six mutually exclusive categories shown below:
White Black Hispanic Asian/Pacific Islander American Indian/Alaska Native Unclassified (not shown in tables)
Students who identified with more than one of the other five categories were classified as "Other" and were included as part of the "Unclassified" category along with students who had a background other than the ones listed or whose race/ethnicity could not be determined.
In compliance with new standards from the U.S. Office of Management and Budget for collecting and reporting data on race/ethnicity, additional information was collected in 2011 so that results could be reported separately for Asian students, Native Hawaiian/Other Pacific Islander students, and students identifying with two or more races. Beginning in 2011, all of the students participating in NAEP were identified as one of the seven racial/ethnic categories listed below:
White Black or African American Hispanic Asian Native Hawaiian or other Pacific Islander American Indian or Alaska Native Two or more races
As in earlier years, students identified as Hispanic were classified as Hispanic in 2011 even if they were also identified with another racial/ethnic group. Students who identified with two or more of the other racial/ethnic groups (e.g., White and Black) would have been classified as "Other" and reported as part of the "Unclassified" category prior to 2011, and classified as "Two or more races" in 2011.
When comparing the results for racial/ethnic groups from 2011 to earlier assessment years, the 2011 data for Asian and Native Hawaiian/Other Pacific Islander students were combined into a single Asian/Pacific Islander category.
Tables 3-A and 3-B show average scale scores and percentage of students by achievement-level data for public school students at grades 4 and 8 in New Jersey and the nation, by race/ethnicity.
NAEP 2011 Mathematics Report for New Jersey
Page 24 of 65

Grade 4 Scale Score Results by Race/Ethnicity
In 2011, White students in New Jersey had an average scale score that was higher than the average scores of Black and Hispanic students, but lower than the average score of Asian/Pacific Islander students.
In 2011, the average scale scores of White and Black students in New Jersey were higher than their respective scores in 1992, 1996, 2003, and 2005, but not significantly different from their respective scores in 2007 and 2009.
In 2011, the average scale scores of Hispanic and Asian/Pacific Islander students in New Jersey were higher than their respective scores in 1992, 1996, and 2003, but not significantly different from their respective scores in 2005, 2007, and 2009.
In 2011, Black students in New Jersey had an average score that was lower than that of White students by 25 points. This performance gap was narrower than that of 1992 (38 points).
In 2011, Hispanic students in New Jersey had an average score that was lower than that of White students by 22 points. This performance gap was narrower than that of 1992 (32 points).
Grade 4 Achievement-Level Results by Race/Ethnicity
In 2011 in New Jersey, the percentage of White students performing at or above Proficient was greater than the corresponding percentages of Black and Hispanic students, but smaller than the percentage of Asian/Pacific Islander students.
In 2011, the percentage of White students in New Jersey performing at or above Proficient was greater than the percentages of their respective peers in 1992, 1996, 2003, and 2005, but not significantly different from the percentages of their respective peers in 2007 and 2009.
In 2011, the percentages of Black, Hispanic, and Asian/Pacific Islander students in New Jersey performing at or above Proficient were greater than the percentages of their respective peers in 1992, 1996, and 2003, but not significantly different from the percentages of their respective peers in 2005, 2007, and 2009.
NAEP 2011 Mathematics Report for New Jersey
Page 25 of 65

NAEP 2011 Mathematics Report for New Jersey
Table
3-A
The Nation's Report Card 2011 State Assessment
Percentage of fourth-grade public school students, average scale score, and percentage at or above achievement levels in NAEP mathematics, by race/ethnicity, year, and jurisdiction: Various years, 1992–2011
See notes at end of table.
White19921 Nation (public) 72 227 32 68 22 2
New Jersey 69 236 19 81 31 319961 Nation (public) 71 230 27 73 25 3
New Jersey 60 239 16 84 35 32003 Nation (public) 58 243 13 87 42 5
New Jersey 58 248 10 90 51 72005 Nation (public) 57 246 11 89 47 7
New Jersey 57 251 7 93 55 82007 Nation (public) 55 248 9 91 51 8
New Jersey 57 255 5 95 63 112009 Nation (public) 54 248 10 90 50 8
New Jersey 55 255 5 95 63 122011 Nation (public) 52 249 9 91 52 9
New Jersey 54 256 5 95 64 12Black
19921 Nation (public) 18 192 78 22 2 #New Jersey 16 198 72 28 3 #
19961 Nation (public) 17 199 70 30 4 #New Jersey 23 204 65 35 3 #
2003 Nation (public) 17 216 46 54 10 #New Jersey 18 217 45 55 11 1
2005 Nation (public) 17 220 40 60 13 1New Jersey 18 224 33 67 17 1
2007 Nation (public) 17 222 37 63 15 1New Jersey 14 232 22 78 25 2
2009 Nation (public) 16 222 37 63 15 1New Jersey 16 228 27 73 19 2
2011 Nation (public) 16 224 34 66 17 1New Jersey 14 231 23 77 24 2
Race/ethnicity, year, and jurisdiction
Percentage ofstudents
Average scale score
Below Basic
At or above Basic
At or above
ProficientAt
Advanced
Page 26 of 65

NAEP 2011 Mathematics Report for New Jersey
Table
3-A
The Nation's Report Card 2011 State Assessment
Percentage of fourth-grade public school students, average scale score, and percentage at or above achievement levels in NAEP mathematics, by race/ethnicity, year, and jurisdiction: Various years, 1992–2011—Continued
See notes at end of table.
Hispanic19921 Nation (public) 7 201 68 32 5 #
New Jersey 11 204 61 39 5 #19961 Nation (public) 9 204 63 37 7 #
New Jersey 11 206 62 38 5 12003 Nation (public) 19 221 38 62 15 1
New Jersey 16 224 33 67 18 12005 Nation (public) 20 225 33 67 19 1
New Jersey 15 230 26 74 25 12007 Nation (public) 21 227 31 69 22 1
New Jersey 20 234 21 79 29 32009 Nation (public) 22 227 30 70 21 1
New Jersey 21 232 23 77 25 22011 Nation (public) 24 229 28 72 24 2
New Jersey 23 234 21 79 28 2Asian/Pacific Islander
19921 Nation (public) 3 231 26 74 27 4New Jersey 5 241 16 84 40 4
19961 Nation (public) 3 225 35 65 20 5New Jersey 5 243 12 88 41 5
2003 Nation (public) 4 246 13 87 48 10New Jersey 7 256 5 95 61 15
2005 Nation (public) 4 251 11 89 54 14New Jersey 9 264 3 97 74 26
2007 Nation (public) 5 254 9 91 59 16New Jersey 8 267 2 98 78 26
2009 Nation (public) 5 255 9 91 61 18New Jersey 8 261 5 95 72 22
2011 Nation (public) 5 256 9 91 62 20New Jersey 8 265 4 96 75 29
Race/ethnicity, year, and jurisdiction
Percentage ofstudents
Average scale score
Below Basic
At or above Basic
At or above
ProficientAt
Advanced
Page 27 of 65

NAEP 2011 Mathematics Report for New Jersey
Table
3-A
The Nation's Report Card 2011 State Assessment
Percentage of fourth-grade public school students, average scale score, and percentage at or above achievement levels in NAEP mathematics, by race/ethnicity, year, and jurisdiction: Various years, 1992–2011—Continued
# Rounds to zero.‡ Reporting standards not met.* Value is significantly different (p < .05) from the value for the same jurisdiction and student group in 2011.1 Accommodations were not permitted for this assessment.
NOTE: The NAEP grade 4 mathematics scale ranges from 0 to 500. Achievement levels correspond to the following points on the NAEP mathematics scales: below Basic, 213 or lower; Basic, 214—248; Proficient, 249—281; and Advanced, 282 and above. At or above Basic includes Basic, Proficient, and Advanced. At or above Proficient includes Proficient and Advanced. Black includes African American, Hispanic includes Latino, and Pacific Islander includes Native Hawaiian. Race categories exclude Hispanic origin. Detail may not sum to totals because of rounding. All differences were calculated and tested using unrounded numbers.SOURCE: U.S. Department of Education, Institute of Education Sciences, National Center for Education Statistics, National Assessment of Educational Progress (NAEP), various years, 1992–2011 Mathematics Assessments.
American Indian/Alaska Native19921 Nation (public) 1 ‡ ‡ ‡ ‡ ‡
New Jersey # ‡ ‡ ‡ ‡ ‡19961 Nation (public) 1 ‡ ‡ ‡ ‡ ‡
New Jersey # ‡ ‡ ‡ ‡ ‡2003 Nation (public) 1 224 35 65 18 1
New Jersey 1 ‡ ‡ ‡ ‡ ‡2005 Nation (public) 1 227 31 69 22 2
New Jersey # ‡ ‡ ‡ ‡ ‡2007 Nation (public) 1 229 28 72 26 3
New Jersey # ‡ ‡ ‡ ‡ ‡2009 Nation (public) 1 227 32 68 23 2
New Jersey # ‡ ‡ ‡ ‡ ‡2011 Nation (public) 1 227 32 68 24 2
New Jersey # ‡ ‡ ‡ ‡ ‡
Race/ethnicity, year, and jurisdiction
Percentageof students
Average scale score
Below Basic
At or aboveBasic
At or above
ProficientAt
Advanced
Page 28 of 65

Grade 8 Scale Score Results by Race/Ethnicity
In 2011, White students in New Jersey had an average scale score that was higher than the average scores of Black and Hispanic students, but lower than the average score of Asian/Pacific Islander students.
In 2011, the average scale scores of White and Black students in New Jersey were higher than their respective scores in 1990, 1992, 2003, 2005, and 2007, but not significantly different from their respective score in 2009.
In 2011, the average scale scores of Hispanic and Asian/Pacific Islander students in New Jersey were higher than their respective scores in 1990, 1992, 2003, and 2005, but not significantly different from their respective scores in 2007 and 2009.
In 2011, Black students in New Jersey had an average score that was lower than that of White students by 33 points. In 1990, the average score for Black students was lower than that of White students by 38 points.
In 2011, Hispanic students in New Jersey had an average score that was lower than that of White students by 30 points. In 1990, the average score for Hispanic students was lower than that of White students by 37 points.
Grade 8 Achievement-Level Results by Race/Ethnicity
In 2011 in New Jersey, the percentage of White students performing at or above Proficient was greater than the corresponding percentages of Black and Hispanic students, but smaller than the percentage of Asian/Pacific Islander students.
In 2011, the percentage of White students in New Jersey performing at or above Proficient was greater than the percentages of their respective peers in 1990, 1992, 2003, 2005, and 2007, but not significantly different from the percentage in 2009.
In 2011, the percentages of Black and Hispanic students in New Jersey performing at or above Proficient were greater than the percentages of their respective peers in 1990, 1992, 2003, and 2005, but not significantly different from the percentages of their respective peers in 2007 and 2009.
In 2011, the percentage of Asian/Pacific Islander students in New Jersey performing at or above Proficient was greater than the percentages of their respective peers in 1990, 1992, and 2003, but not significantly different from the percentages of their respective peers in 2005, 2007, and 2009.
NAEP 2011 Mathematics Report for New Jersey
Page 29 of 65

NAEP 2011 Mathematics Report for New Jersey
Table
3-B
The Nation's Report Card 2011 State Assessment
Percentage of eighth-grade public school students, average scale score, and percentage at or above achievement levels in NAEP mathematics, by race/ethnicity, year, and jurisdiction: Various years, 1990–2011
See notes at end of table.
White19901 Nation (public) 73 269 41 59 18 3
New Jersey 69 279 30 70 26 419921 Nation (public) 72 276 34 66 25 3
New Jersey 64 283 24 76 30 42003 Nation (public) 62 287 21 79 36 7
New Jersey 61 292 16 84 42 82005 Nation (public) 60 288 21 79 37 7
New Jersey 57 295 15 85 47 122007 Nation (public) 58 290 19 81 41 9
New Jersey 57 298 13 87 51 142009 Nation (public) 56 292 18 82 43 10
New Jersey 59 302 11 89 54 172011 Nation (public) 54 293 17 83 43 10
New Jersey 56 304 9 91 59 17Black
19901 Nation (public) 16 236 79 21 5 #New Jersey 17 241 77 23 4 #
19921 Nation (public) 17 236 81 19 2 #New Jersey 19 242 74 26 3 #
2003 Nation (public) 17 252 61 39 7 #New Jersey 18 253 59 41 7 #
2005 Nation (public) 17 254 59 41 8 1New Jersey 20 260 50 50 11 1
2007 Nation (public) 17 259 53 47 11 1New Jersey 17 264 45 55 14 1
2009 Nation (public) 16 260 51 49 12 1New Jersey 16 267 42 58 17 2
2011 Nation (public) 16 262 50 50 13 1New Jersey 16 272 37 63 21 3
Race/ethnicity, year, and jurisdiction
Percentage ofstudents
Average scale score
Below Basic
At or above Basic
At or above
ProficientAt
Advanced
Page 30 of 65

NAEP 2011 Mathematics Report for New Jersey
Table
3-B
The Nation's Report Card 2011 State Assessment
Percentage of eighth-grade public school students, average scale score, and percentage at or above achievement levels in NAEP mathematics, by race/ethnicity, year, and jurisdiction: Various years, 1990–2011—Continued
See notes at end of table.
Hispanic19901 Nation (public) 7 245 67 33 7 1
New Jersey 9 242 75 25 4 #19921 Nation (public) 8 247 67 33 6 #
New Jersey 11 245 69 31 4 #2003 Nation (public) 15 258 53 47 11 1
New Jersey 14 262 50 50 14 22005 Nation (public) 17 261 50 50 13 1
New Jersey 15 264 42 58 15 12007 Nation (public) 19 264 46 54 15 2
New Jersey 19 271 37 63 20 22009 Nation (public) 21 266 44 56 17 2
New Jersey 17 272 37 63 22 32011 Nation (public) 23 269 40 60 20 3
New Jersey 20 274 33 67 24 3Asian/Pacific Islander
19901 Nation (public) 2 275 36 64 30 6New Jersey 4 296 16 84 53 11
19921 Nation (public) 2 290 25 75 43 14New Jersey 5 299 13 87 52 12
2003 Nation (public) 4 289 23 77 42 12New Jersey 6 306 10 90 61 21
2005 Nation (public) 5 294 19 81 46 16New Jersey 7 309 8 92 63 24
2007 Nation (public) 5 296 18 82 49 17New Jersey 7 314 7 93 69 30
2009 Nation (public) 5 300 16 84 53 20New Jersey 8 323 5 95 77 43
2011 Nation (public) 6 302 15 85 55 22New Jersey 8 318 6 94 73 36
Race/ethnicity, year, and jurisdiction
Percentage ofstudents
Average scale score
Below Basic
At or above Basic
At or above
ProficientAt
Advanced
Page 31 of 65

NAEP 2011 Mathematics Report for New Jersey
Table
3-B
The Nation's Report Card 2011 State Assessment
Percentage of eighth-grade public school students, average scale score, and percentage at or above achievement levels in NAEP mathematics, by race/ethnicity, year, and jurisdiction: Various years, 1990–2011—Continued
# Rounds to zero.‡ Reporting standards not met.* Value is significantly different (p < .05) from the value for the same jurisdiction and student group in 2011.1 Accommodations were not permitted for this assessment.
NOTE: The NAEP grade 8 mathematics scale ranges from 0 to 500. Achievement levels correspond to the following points on the NAEP mathematics scales: below Basic, 261 or lower; Basic, 262—298; Proficient, 299—332; and Advanced, 333 and above. At or above Basic includes Basic, Proficient, and Advanced. At or above Proficient includes Proficient and Advanced. Black includes African American, Hispanic includes Latino, and Pacific Islander includes Native Hawaiian. Race categories exclude Hispanic origin. Detail may not sum to totals because of rounding. All differences were calculated and tested using unrounded numbers.SOURCE: U.S. Department of Education, Institute of Education Sciences, National Center for Education Statistics, National Assessment of Educational Progress (NAEP), various years, 1990–2011 Mathematics Assessments.
American Indian/Alaska Native19901 Nation (public) 1 ‡ ‡ ‡ ‡ ‡
New Jersey # ‡ ‡ ‡ ‡ ‡19921 Nation (public) 1 ‡ ‡ ‡ ‡ ‡
New Jersey # ‡ ‡ ‡ ‡ ‡2003 Nation (public) 1 265 46 54 16 2
New Jersey # ‡ ‡ ‡ ‡ ‡2005 Nation (public) 1 266 45 55 14 2
New Jersey # ‡ ‡ ‡ ‡ ‡2007 Nation (public) 1 265 44 56 17 2
New Jersey # ‡ ‡ ‡ ‡ ‡2009 Nation (public) 1 267 43 57 20 3
New Jersey # ‡ ‡ ‡ ‡ ‡2011 Nation (public) 1 266 45 55 17 4
New Jersey # ‡ ‡ ‡ ‡ ‡
Race/ethnicity, year, and jurisdiction
Percentageof students
Average scale score
Below Basic
At or aboveBasic
At or above
ProficientAt
Advanced
Page 32 of 65

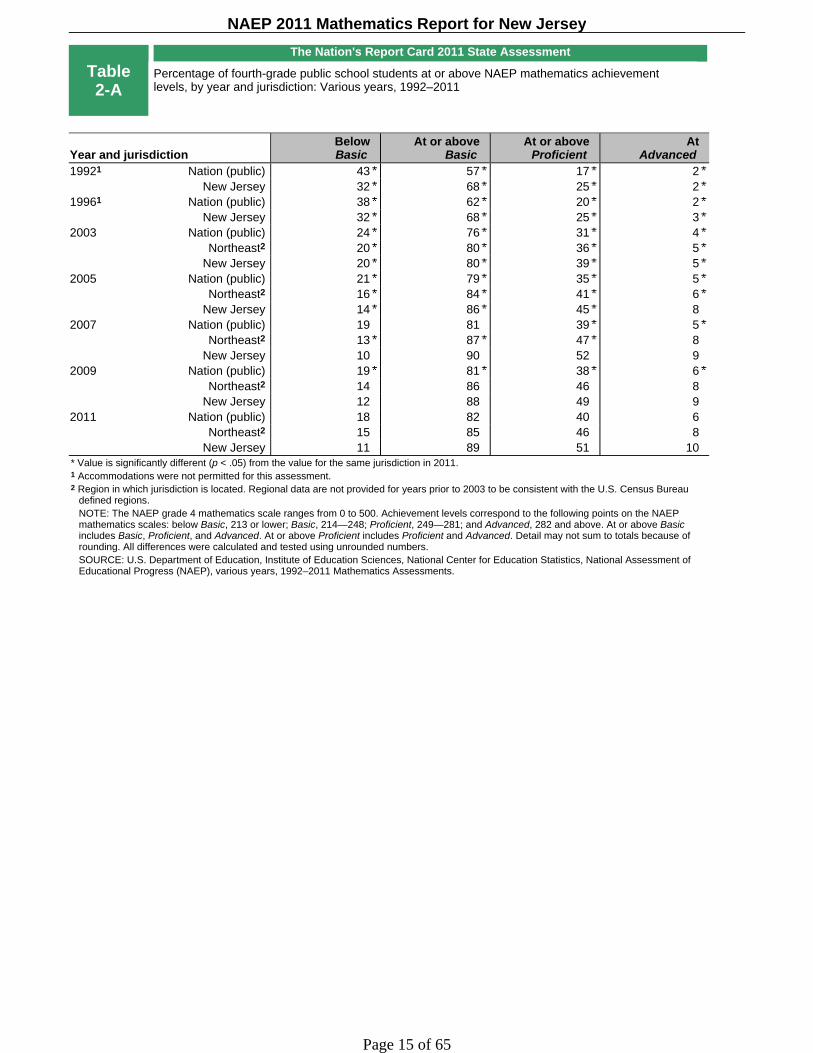
Tables 4-A and 4-B show average scale scores and percentage of students by achievement-level data for the seven racial/ethnic categories used in 2011: White, Black, Hispanic, Asian, Native Hawaiian/Other Pacific Islander, American Indian/Alaska Native, and Two or More Races at grades 4 and 8 in New Jersey and the nation, by race/ethnicity.
NAEP 2011 Mathematics Report for New Jersey
Page 33 of 65

NAEP 2011 Mathematics Report for New Jersey
Table
4-A
The Nation's Report Card 2011 State Assessment
Percentage of fourth-grade public school students, average scale score, and percentage at or above achievement levels in NAEP mathematics, by race/ethnicity, year, and jurisdiction: 2011
# Rounds to zero.‡ Reporting standards not met.* Value is significantly different (p < .05) from the value for the same group in New Jersey.
NOTE: The NAEP grade 4 mathematics scale ranges from 0 to 500. Achievement levels correspond to the following points on the NAEP mathematics scales: below Basic, 213 or lower; Basic, 214—248; Proficient, 249—281; and Advanced, 282 and above. At or above Basic includes Basic, Proficient, and Advanced. At or above Proficient includes Proficient and Advanced. Black includes African American and Hispanic includes Latino. Race categories exclude Hispanic origin. Detail may not sum to totals because of rounding. All differences were calculated and tested using unrounded numbers.SOURCE: U.S. Department of Education, Institute of Education Sciences, National Center for Education Statistics, National Assessment of Educational Progress (NAEP), 2011 Mathematics Assessment.
White2011 Nation (public) 52 249 9 91 52 9
New Jersey 54 256 5 95 64 12Black
2011 Nation (public) 16 224 34 66 17 1New Jersey 14 231 23 77 24 2
Hispanic2011 Nation (public) 24 229 28 72 24 2
New Jersey 23 234 21 79 28 2Asian
2011 Nation (public) 5 257 8 92 64 21New Jersey 8 266 4 96 75 29
American Indian/Alaska Native2011 Nation (public) 1 227 32 68 24 2
New Jersey # ‡ ‡ ‡ ‡ ‡Native Hawaiian/Other Pacific Islander
2011 Nation (public) # 235 24 76 33 7New Jersey # ‡ ‡ ‡ ‡ ‡
Two or more races2011 Nation (public) 2 244 15 85 43 9
New Jersey 1 ‡ ‡ ‡ ‡ ‡
Race/ethnicity, year, and jurisdiction
Percentageof students
Average scale score
BelowBasic
At or aboveBasic
At or above
ProficientAt
Advanced
Page 34 of 65
NAEP 2011 Mathematics Report for New Jersey
Table
4-B
The Nation's Report Card 2011 State Assessment
Percentage of eighth-grade public school students, average scale score, and percentage at or above achievement levels in NAEP mathematics, by race/ethnicity, year, and jurisdiction: 2011
# Rounds to zero.‡ Reporting standards not met.* Value is significantly different (p < .05) from the value for the same group in New Jersey.
NOTE: The NAEP grade 8 mathematics scale ranges from 0 to 500. Achievement levels correspond to the following points on the NAEP mathematics scales: below Basic, 261 or lower; Basic, 262—298; Proficient, 299—332; and Advanced, 333 and above. At or above Basic includes Basic, Proficient, and Advanced. At or above Proficient includes Proficient and Advanced. Black includes African American and Hispanic includes Latino. Race categories exclude Hispanic origin. Detail may not sum to totals because of rounding. All differences were calculated and tested using unrounded numbers.SOURCE: U.S. Department of Education, Institute of Education Sciences, National Center for Education Statistics, National Assessment of Educational Progress (NAEP), 2011 Mathematics Assessment.
White2011 Nation (public) 54 293 17 83 43 10
New Jersey 56 304 9 91 59 17Black
2011 Nation (public) 16 262 50 50 13 1New Jersey 16 272 37 63 21 3
Hispanic2011 Nation (public) 23 269 40 60 20 3
New Jersey 20 274 33 67 24 3Asian
2011 Nation (public) 5 305 12 88 58 24New Jersey 8 318 6 94 74 36
American Indian/Alaska Native2011 Nation (public) 1 266 45 55 17 4
New Jersey # ‡ ‡ ‡ ‡ ‡Native Hawaiian/Other Pacific Islander
2011 Nation (public) # 265 45 55 19 3New Jersey # ‡ ‡ ‡ ‡ ‡
Two or more races2011 Nation (public) 2 286 24 76 37 10
New Jersey # ‡ ‡ ‡ ‡ ‡
Race/ethnicity, year, and jurisdiction
Percentageof students
Average scale score
BelowBasic
At or aboveBasic
At or above
ProficientAt
Advanced
Page 35 of 65

Gender
Information on student gender is reported by the student's school when rosters of the students eligible to be assessed are submitted to NAEP.
Tables 5-A and 5-B show average scale scores and percentage of students by achievement-level data for public school students at grades 4 and 8 in New Jersey and the nation, by gender.
Grade 4 Scale Score Results by Gender
In 2011, male students in New Jersey had an average score in mathematics (249) that was not significantly different from that of female students (247). In 1992, male students in New Jersey had an average score in mathematics (228) that was not significantly different from that of female students (226).
In 2011, male students in New Jersey had an average scale score in mathematics (249) that was higher than that of male students in public schools across the nation (241). Similarly, female students in New Jersey had an average scale score (247) that was higher than that of female students across the nation (239).
In New Jersey, the average scale score of male students in 2011 was higher than the scores of male students in 1992, 1996, and 2003, but not significantly different from the scores of male students in 2005, 2007, and 2009.
In New Jersey, the average scale score of female students in 2011 was higher than the scores of female students in 1992, 1996, 2003, and 2005, but not significantly different from the scores of female students in 2007 and 2009.
Grade 4 Achievement-Level Results by Gender
In the 2011 assessment, 53 percent of male students and 49 percent of female students performed at or above Proficient in New Jersey. The difference between these percentages was not statistically significant.
The percentage of male students in New Jersey's public schools who were at or above Proficient in 2011 (53 percent) was greater than that of male students in the nation (41 percent).
The percentage of female students in New Jersey's public schools who were at or above Proficient in 2011 (49 percent) was greater than that of female students in the nation (39 percent).
In New Jersey, the percentage of male students performing at or above Proficient in 2011 was greater than the corresponding percentages of students in 1992, 1996, and 2003, but not significantly different from the corresponding percentages of students in 2005, 2007, and 2009.
In New Jersey, the percentage of female students performing at or above Proficient in 2011 was greater than the corresponding percentages of students in 1992, 1996, and 2003, but not significantly different from the corresponding percentages of students in 2005, 2007, and 2009.
NAEP 2011 Mathematics Report for New Jersey
Page 36 of 65

NAEP 2011 Mathematics Report for New Jersey
Table
5-A
The Nation's Report Card 2011 State Assessment
Percentage of fourth-grade public school students, average scale score, and percentage at or above achievement levels in NAEP mathematics, by gender, year, and jurisdiction: Various years, 1992–2011
* Value is significantly different (p < .05) from the value for the same jurisdiction and student group in 2011.1 Accommodations were not permitted for this assessment.
NOTE: The NAEP grade 4 mathematics scale ranges from 0 to 500. Achievement levels correspond to the following points on the NAEP mathematics scales: below Basic, 213 or lower; Basic, 214—248; Proficient, 249—281; and Advanced, 282 and above. At or above Basic includes Basic, Proficient, and Advanced. At or above Proficient includes Proficient and Advanced. Detail may not sum to totals because of rounding. All differences were calculated and tested using unrounded numbers.SOURCE: U.S. Department of Education, Institute of Education Sciences, National Center for Education Statistics, National Assessment of Educational Progress (NAEP), various years, 1992–2011 Mathematics Assessments.
Male19921 Nation (public) 50 220 41 59 19 2
New Jersey 51 228 31 69 26 319961 Nation (public) 51 224 37 63 22 3
New Jersey 49 231 28 72 30 32003 Nation (public) 51 235 23 77 34 5
New Jersey 52 240 19 81 41 62005 Nation (public) 51 238 20 80 37 6
New Jersey 52 246 13 87 47 92007 Nation (public) 51 240 18 82 41 7
New Jersey 50 250 10 90 55 112009 Nation (public) 51 240 19 81 40 7
New Jersey 51 248 12 88 51 112011 Nation (public) 51 241 18 82 41 7
New Jersey 51 249 11 89 53 11Female
19921 Nation (public) 50 218 44 56 16 1New Jersey 49 226 33 67 23 2
19961 Nation (public) 49 221 39 61 17 1New Jersey 51 223 36 64 20 2
2003 Nation (public) 49 233 25 75 29 3New Jersey 48 237 20 80 36 4
2005 Nation (public) 49 236 21 79 33 4New Jersey 48 242 16 84 43 6
2007 Nation (public) 49 238 19 81 36 4New Jersey 50 247 11 89 49 8
2009 Nation (public) 49 238 19 81 37 5New Jersey 49 245 13 87 46 7
2011 Nation (public) 49 239 18 82 39 6New Jersey 49 247 11 89 49 9
Gender, year, and jurisdictionPercentageof students
Average scale score
Below Basic
At or aboveBasic
At or above
ProficientAt
Advanced
Page 37 of 65

Grade 8 Scale Score Results by Gender
In 2011, male students in New Jersey had an average score in mathematics (294) that was not significantly different from that of female students (294). In 1990, male students in New Jersey had an average score in mathematics (271) that was not significantly different from that of female students (268).
In 2011, male students in New Jersey had an average scale score in mathematics (294) that was higher than that of male students in public schools across the nation (283). Similarly, female students in New Jersey had an average scale score (294) that was higher than that of female students across the nation (282).
In New Jersey, the average scale score of male students in 2011 was higher than the scores of male students in 1990, 1992, 2003, 2005, and 2007, but not significantly different from the score of male students in 2009.
In New Jersey, the average scale score of female students in 2011 was higher than the scores of female students in 1990, 1992, 2003, 2005, and 2007, but not significantly different from the score of female students in 2009.
Grade 8 Achievement-Level Results by Gender
In the 2011 assessment, 48 percent of male students and 46 percent of female students performed at or above Proficient in New Jersey. The difference between these percentages was not statistically significant.
The percentage of male students in New Jersey's public schools who were at or above Proficient in 2011 (48 percent) was greater than that of male students in the nation (34 percent).
The percentage of female students in New Jersey's public schools who were at or above Proficient in 2011 (46 percent) was greater than that of female students in the nation (33 percent).
In New Jersey, the percentage of male students performing at or above Proficient in 2011 was greater than the corresponding percentages of students in 1990, 1992, 2003, 2005, and 2007, but not significantly different from the percentage of students in 2009.
In New Jersey, the percentage of female students performing at or above Proficient in 2011 was greater than the corresponding percentages of students in 1990, 1992, 2003, 2005, and 2007, but not significantly different from the percentage of students in 2009.
NAEP 2011 Mathematics Report for New Jersey
Page 38 of 65

NAEP 2011 Mathematics Report for New Jersey
Table
5-B
The Nation's Report Card 2011 State Assessment
Percentage of eighth-grade public school students, average scale score, and percentage at or above achievement levels in NAEP mathematics, by gender, year, and jurisdiction: Various years, 1990–2011
* Value is significantly different (p < .05) from the value for the same jurisdiction and student group in 2011.1 Accommodations were not permitted for this assessment.
NOTE: The NAEP grade 8 mathematics scale ranges from 0 to 500. Achievement levels correspond to the following points on the NAEP mathematics scales: below Basic, 261 or lower; Basic, 262—298; Proficient, 299—332; and Advanced, 333 and above. At or above Basic includes Basic, Proficient, and Advanced. At or above Proficient includes Proficient and Advanced. Detail may not sum to totals because of rounding. All differences were calculated and tested using unrounded numbers.SOURCE: U.S. Department of Education, Institute of Education Sciences, National Center for Education Statistics, National Assessment of Educational Progress (NAEP), various years, 1990–2011 Mathematics Assessments.
Male19901 Nation (public) 51 262 49 51 17 2
New Jersey 51 271 40 60 23 419921 Nation (public) 52 266 45 55 20 3
New Jersey 49 275 34 66 26 42003 Nation (public) 50 277 33 67 29 6
New Jersey 51 282 28 72 34 72005 Nation (public) 51 278 32 68 30 6
New Jersey 51 286 25 75 39 102007 Nation (public) 51 281 29 71 33 8
New Jersey 51 290 23 77 43 122009 Nation (public) 51 283 28 72 34 8
New Jersey 50 295 19 81 47 162011 Nation (public) 51 283 28 72 34 9
New Jersey 51 294 19 81 48 15Female
19901 Nation (public) 49 261 49 51 14 2New Jersey 49 268 43 57 20 3
19921 Nation (public) 48 267 44 56 20 3New Jersey 51 269 41 59 21 3
2003 Nation (public) 50 275 34 66 26 4New Jersey 49 281 29 71 33 6
2005 Nation (public) 49 277 33 67 27 5New Jersey 49 282 27 73 33 7
2007 Nation (public) 49 279 30 70 29 6New Jersey 49 288 22 78 38 9
2009 Nation (public) 49 281 29 71 31 7New Jersey 50 290 20 80 42 12
2011 Nation (public) 49 282 28 72 33 7New Jersey 49 294 17 83 46 12
Gender, year, and jurisdictionPercentageof students
Average scale score
Below Basic
At or aboveBasic
At or above
ProficientAt
Advanced
Page 39 of 65

Student Eligibility for the National School Lunch Program
NAEP collects data on eligibility for the federal program providing free or reduced-price school lunches. The free/reduced-price lunch component of the National School Lunch Program (NSLP) offered through the U.S. Department of Agriculture (USDA) is designed to ensure that children near or below the poverty line receive nourishing meals. Eligibility is determined through the USDA's Income Eligibility Guidelines, and data for this category of students are included as an indicator of lower family income. NAEP first collected information on participation in this program in 1996; therefore, cross-year comparisons to assessments prior to 1996 cannot be made.
Tables 6-A and 6-B show average scale scores and percentage of students by achievement-level data for public school students at grades 4 and 8 in New Jersey and the nation, by student eligibility for the NSLP.
Grade 4 Scale Score Results by Free/Reduced-Price School Lunch Eligibility
In 2011, students in New Jersey eligible for free/reduced-price lunch had an average mathematics scale score of 233. This was lower than that of students in New Jersey not eligible for this program (257).
In 2011, students in New Jersey who were eligible for free/reduced-price school lunch had an average score that was lower than that of students who were not eligible by 24 points. This performance gap was narrower than that of 1996 (32 points).
Students in New Jersey eligible for free/reduced-price lunch had an average scale score (233) in 2011 that was higher than that of students in the nation who were eligible (229).
In New Jersey, students eligible for free/reduced-price lunch had an average mathematics scale score in 2011 that was higher than that of eligible students in 1996, 2003, and 2005, but not significantly different from that of eligible students in 2007 and 2009.
Grade 4 Achievement-Level Results by Free/Reduced-Price School Lunch Eligibility
In New Jersey, 27 percent of students who were eligible for free/reduced-price lunch and 64 percent of those who were not eligible for this program performed at or above Proficient in 2011. These percentages were significantly different from one another.
For students in New Jersey in 2011 who were eligible for free/reduced-price lunch, the percentage at or above Proficient (27 percent) was not significantly different from the corresponding percentage for their counterparts around the nation (24 percent).
In New Jersey, the percentage of students eligible for free/reduced-price lunch who performed at or above Proficient in 2011 was greater than the corresponding percentages in 1996 and 2003, but not significantly different from the corresponding percentages in 2005, 2007, and 2009.
NAEP 2011 Mathematics Report for New Jersey
Page 40 of 65

NAEP 2011 Mathematics Report for New Jersey
Table
6-A
The Nation's Report Card 2011 State Assessment
Percentage of fourth-grade public school students, average scale score, and percentage at or above achievement levels in NAEP mathematics, by National School Lunch Program eligibility status, year, and jurisdiction: Various years, 1996–2011
See notes at end of table.
Eligible19961 Nation (public) 34 207 59 41 8 #
New Jersey 33 206 60 40 5 #2003 Nation (public) 44 222 38 62 15 1
New Jersey 29 221 40 60 15 12005 Nation (public) 46 225 33 67 19 1
New Jersey 29 227 31 69 23 22007 Nation (public) 46 227 30 70 22 1
New Jersey 29 233 22 78 26 22009 Nation (public) 48 228 29 71 22 1
New Jersey 32 229 27 73 22 12011 Nation (public) 52 229 27 73 24 2
New Jersey 36 233 22 78 27 2Not eligible
19961 Nation (public) 52 231 27 73 25 3New Jersey 65 238 19 81 35 4
2003 Nation (public) 52 244 12 88 45 6New Jersey 63 247 11 89 49 7
2005 Nation (public) 52 248 10 90 50 8New Jersey 65 252 7 93 56 11
2007 Nation (public) 53 249 9 91 53 9New Jersey 69 255 6 94 62 12
2009 Nation (public) 51 250 9 91 54 10New Jersey 66 255 6 94 62 13
2011 Nation (public) 47 252 8 92 57 12New Jersey 63 257 5 95 64 14
Eligibility status, year, and jurisdiction
Percentage ofstudents
Average scale score
Below Basic
At or above Basic
At or above
ProficientAt
Advanced
Page 41 of 65

NAEP 2011 Mathematics Report for New Jersey
Table
6-A
The Nation's Report Card 2011 State Assessment
Percentage of fourth-grade public school students, average scale score, and percentage at or above achievement levels in NAEP mathematics, by National School Lunch Program eligibility status, year, and jurisdiction: Various years, 1996–2011—Continued
# Rounds to zero.‡ Reporting standards not met.* Value is significantly different (p < .05) from the value for the same jurisdiction and student group in 2011.1 Accommodations were not permitted for this assessment.
NOTE: The NAEP grade 4 mathematics scale ranges from 0 to 500. Achievement levels correspond to the following points on the NAEP mathematics scales: below Basic, 213 or lower; Basic, 214—248; Proficient, 249—281; and Advanced, 282 and above. At or above Basic includes Basic, Proficient, and Advanced. At or above Proficient includes Proficient and Advanced. Detail may not sum to totals because of rounding. All differences were calculated and tested using unrounded numbers.SOURCE: U.S. Department of Education, Institute of Education Sciences, National Center for Education Statistics, National Assessment of Educational Progress (NAEP), various years, 1996–2011 Mathematics Assessments.
Information not available19961 Nation (public) 13 230 28 72 28 3
New Jersey 2 ‡ ‡ ‡ ‡ ‡2003 Nation (public) 4 235 23 77 34 4
New Jersey 8 242 18 82 44 52005 Nation (public) 2 237 21 79 36 5
New Jersey 6 241 15 85 39 42007 Nation (public) 1 243 17 83 44 8
New Jersey 2 258 6 94 62 182009 Nation (public) 1 240 22 78 42 7
New Jersey 1 ‡ ‡ ‡ ‡ ‡2011 Nation (public) # 247 12 88 49 10
New Jersey 1 ‡ ‡ ‡ ‡ ‡
Eligibility status, year, and jurisdiction
Percentageof students
Average scale score
Below Basic
At or aboveBasic
At or above
ProficientAt
Advanced
Page 42 of 65

Grade 8 Scale Score Results by Free/Reduced-Price School Lunch Eligibility
In 2011, students in New Jersey eligible for free/reduced-price lunch had an average mathematics scale score of 274. This was lower than that of students in New Jersey not eligible for this program (303).
In 2011, students in New Jersey who were eligible for free/reduced-price school lunch had an average score that was lower than that of students who were not eligible by 29 points. In 2003, the average score for students in New Jersey who were eligible for free/reduced-price school lunch was lower than the score of those not eligible by 34 points.
Students in New Jersey eligible for free/reduced-price lunch had an average scale score (274) in 2011 that was higher than that of students in the nation who were eligible (269).
In New Jersey, students eligible for free/reduced-price lunch had an average mathematics scale score in 2011 that was higher than that of eligible students in 2003, 2005, and 2007, but not significantly different from that of eligible students in 2009.
Grade 8 Achievement-Level Results by Free/Reduced-Price School Lunch Eligibility
In New Jersey, 24 percent of students who were eligible for free/reduced-price lunch and 57 percent of those who were not eligible for this program performed at or above Proficient in 2011. These percentages were significantly different from one another.
For students in New Jersey in 2011 who were eligible for free/reduced-price lunch, the percentage at or above Proficient (24 percent) was greater than the corresponding percentage for their counterparts around the nation (19 percent).
In New Jersey, the percentage of students eligible for free/reduced-price lunch who performed at or above Proficient in 2011 was greater than the corresponding percentages in 2003, 2005, and 2007, but not significantly different from the percentage in 2009.
NAEP 2011 Mathematics Report for New Jersey
Page 43 of 65

NAEP 2011 Mathematics Report for New Jersey
Table
6-B
The Nation's Report Card 2011 State Assessment
Percentage of eighth-grade public school students, average scale score, and percentage at or above achievement levels in NAEP mathematics, by National School Lunch Program eligibility status, year, and jurisdiction: Various years, 2003–2011
See notes at end of table.
Eligible2003 Nation (public) 36 258 53 47 11 1
New Jersey 24 256 56 44 10 12005 Nation (public) 39 261 49 51 13 1
New Jersey 27 262 46 54 14 12007 Nation (public) 41 265 45 55 15 2
New Jersey 27 266 43 57 17 22009 Nation (public) 43 266 43 57 17 2
New Jersey 27 270 39 61 20 32011 Nation (public) 48 269 41 59 19 2
New Jersey 30 274 34 66 24 4Not eligible
2003 Nation (public) 58 287 22 78 37 7New Jersey 68 290 19 81 41 8
2005 Nation (public) 59 288 21 79 39 8New Jersey 68 292 19 81 44 11
2007 Nation (public) 58 291 19 81 42 10New Jersey 71 297 14 86 50 14
2009 Nation (public) 56 293 17 83 45 12New Jersey 71 300 13 87 53 18
2011 Nation (public) 52 295 16 84 47 13New Jersey 70 303 11 89 57 18
Eligibility status, year, and jurisdiction
Percentage ofstudents
Average scale score
Below Basic
At or above Basic
At or above
ProficientAt
Advanced
Page 44 of 65

NAEP 2011 Mathematics Report for New Jersey
Table
6-B
The Nation's Report Card 2011 State Assessment
Percentage of eighth-grade public school students, average scale score, and percentage at or above achievement levels in NAEP mathematics, by National School Lunch Program eligibility status, year, and jurisdiction: Various years, 2003–2011—Continued
# Rounds to zero.‡ Reporting standards not met.* Value is significantly different (p < .05) from the value for the same jurisdiction and student group in 2011.
NOTE: The NAEP grade 8 mathematics scale ranges from 0 to 500. Achievement levels correspond to the following points on the NAEP mathematics scales: below Basic, 261 or lower; Basic, 262—298; Proficient, 299—332; and Advanced, 333 and above. At or above Basic includes Basic, Proficient, and Advanced. At or above Proficient includes Proficient and Advanced. Detail may not sum to totals because of rounding. All differences were calculated and tested using unrounded numbers.SOURCE: U.S. Department of Education, Institute of Education Sciences, National Center for Education Statistics, National Assessment of Educational Progress (NAEP), various years, 2003–2011 Mathematics Assessments.
Information not available2003 Nation (public) 6 278 32 68 29 6
New Jersey 8 284 26 74 37 72005 Nation (public) 3 277 34 66 28 6
New Jersey 6 292 17 83 42 112007 Nation (public) 1 274 36 64 28 6
New Jersey 2 ‡ ‡ ‡ ‡ ‡2009 Nation (public) 1 284 28 72 35 10
New Jersey 2 ‡ ‡ ‡ ‡ ‡2011 Nation (public) # 275 37 63 26 6
New Jersey # ‡ ‡ ‡ ‡ ‡
Eligibility status, year, and jurisdiction
Percentageof students
Average scale score
Below Basic
At or aboveBasic
At or above
ProficientAt
Advanced
Page 45 of 65

Type of Location
Schools that participated in the assessment were classified as being located in four mutually exclusive types of communities: city, suburb, town, and rural. These categories indicate the geographic locations of schools. "City" is a geographical term meaning the principal city of a U.S. Census Bureau-defined Core-Based Statistical Area and is not synonymous with "inner city." The criteria for classifying schools with respect to type of location changed for 2007; therefore, only comparisons between 2007, 2009, and 2011 are available. More detail on the changes for the classification of type of location is available at http://nces.ed.gov/ccd/Rural_Locales.asp.
Tables 7-A and 7-B show average scale scores and percentage of students by achievement-level data for public school students at grades 4 and 8 in New Jersey and the nation, by type of location (for 2007, 2009, and 2011 only).
Grade 4 Scale Score Results by Type of Location
In 2011, the average scale score of students in New Jersey attending public schools in city locations was lower than the scores of students in suburban and rural schools.
In 2011, students attending public schools in city locations in New Jersey had an average scale score that was not significantly different from the average scale score of students in city locations in the nation.
In 2011, students attending public schools in suburban and rural locations in New Jersey had average scale scores that were higher than the average scale scores of students in suburban and rural locations in the nation.
In 2011, students attending public schools in city, suburban, and rural locations in New Jersey had average scale scores that were not significantly different from the average scale scores of students in city, suburban, and rural locations in 2007 and 2009 in New Jersey.
Grade 4 Achievement-Level Results by Type of Location
In 2011, the percentage of students in New Jersey's public schools in city locations who performed at or above Proficient was smaller than the corresponding percentages of students in suburban and rural schools.
The percentage of students in New Jersey's public schools in city locations who performed at or above Proficient in 2011 was not significantly different from those of students in city locations in the nation.
The percentages of students in New Jersey's public schools in suburban and rural locations who performed at or above Proficient in 2011 were greater than those of students in suburban and rural locations in the nation.
The percentages of students in New Jersey's public schools in city, suburban, and rural locations who performed at or above Proficient in 2011 were not significantly different from those of students in city, suburban, and rural locations in 2007 and 2009 in New Jersey.
NAEP 2011 Mathematics Report for New Jersey
Page 46 of 65

NAEP 2011 Mathematics Report for New Jersey
Table
7-A
The Nation's Report Card 2011 State Assessment
Percentage of fourth-grade public school students, average scale score, and percentage at or above achievement levels in NAEP mathematics, by type of location, year, and jurisdiction: 2007, 2009 and 2011
‡ Reporting standards not met.* Value is significantly different (p < .05) from the value for the same jurisdiction and student group in 2011.
NOTE: The NAEP grade 4 mathematics scale ranges from 0 to 500. Achievement levels correspond to the following points on the NAEP mathematics scales: below Basic, 213 or lower; Basic, 214—248; Proficient, 249—281; and Advanced, 282 and above. At or above Basic includes Basic, Proficient, and Advanced. At or above Proficient includes Proficient and Advanced. Detail may not sum to totals because of rounding. All differences were calculated and tested using unrounded numbers.SOURCE: U.S. Department of Education, Institute of Education Sciences, National Center for Education Statistics, National Assessment of Educational Progress (NAEP), 2007, 2009 and 2011 Mathematics Assessments.
City2007 Nation (public) 29 233 26 74 32 5
New Jersey 9 235 27 73 34 72009 Nation (public) 30 234 25 75 32 5
New Jersey 10 233 24 76 29 42011 Nation (public) 29 235 24 76 33 5
New Jersey 11 235 22 78 34 6Suburb
2007 Nation (public) 37 243 15 85 44 7New Jersey 77 249 10 90 52 9
2009 Nation (public) 36 243 16 84 44 7New Jersey 80 248 12 88 51 10
2011 Nation (public) 36 244 15 85 45 8New Jersey 76 249 10 90 52 10
Town2007 Nation (public) 12 238 18 82 36 4
New Jersey 3 ‡ ‡ ‡ ‡ ‡2009 Nation (public) 12 237 19 81 35 4
New Jersey 2 ‡ ‡ ‡ ‡ ‡2011 Nation (public) 13 237 19 81 35 4
New Jersey 3 ‡ ‡ ‡ ‡ ‡Rural
2007 Nation (public) 22 240 16 84 39 5New Jersey 11 259 2 98 68 15
2009 Nation (public) 22 240 16 84 39 5New Jersey 8 251 7 93 55 10
2011 Nation (public) 23 243 15 85 42 6New Jersey 11 255 6 94 62 14
Type of location, year, and jurisdiction
Percentageof students
Average scale score
Below Basic
At or aboveBasic
At or above
ProficientAt
Advanced
Page 47 of 65

Grade 8 Scale Score Results by Type of Location
In 2011, the average scale score of students in New Jersey attending public schools in city locations was lower than the scores of students in suburban and rural schools.
In 2011, students attending public schools in city locations in New Jersey had an average scale score that was not significantly different from the average scale score of students in city locations in the nation.
In 2011, students attending public schools in suburban and rural locations in New Jersey had average scale scores that were higher than the average scale scores of students in suburban and rural locations in the nation.
In 2011, students attending public schools in suburban locations in New Jersey had an average scale score that was higher than the average scale score of students in suburban locations in 2007 in New Jersey, but not significantly different from the average scale score of students in suburban locations in 2009 in New Jersey.
In 2011, students attending public schools in city and rural locations in New Jersey had average scale scores that were not significantly different from the average scale scores of students in city and rural locations in 2007 and 2009 in New Jersey.
Grade 8 Achievement-Level Results by Type of Location
In 2011, the percentage of students in New Jersey's public schools in city locations who performed at or above Proficient was not significantly different from the corresponding percentages of students in suburban and rural schools.
The percentage of students in New Jersey's public schools in city locations who performed at or above Proficient in 2011 was not significantly different from those of students in city locations in the nation.
The percentages of students in New Jersey's public schools in suburban and rural locations who performed at or above Proficient in 2011 were greater than those of students in suburban and rural locations in the nation.
The percentage of students in New Jersey's public schools in suburban locations who performed at or above Proficient in 2011 was greater than that of students in suburban locations in 2007 in New Jersey, but not significantly different from that of students in suburban locations in 2009 in New Jersey.
The percentages of students in New Jersey's public schools in city and rural locations who performed at or above Proficient in 2011 were not significantly different from those of students in city and rural locations in 2007 and 2009 in New Jersey.
NAEP 2011 Mathematics Report for New Jersey
Page 48 of 65

NAEP 2011 Mathematics Report for New Jersey
Table
7-B
The Nation's Report Card 2011 State Assessment
Percentage of eighth-grade public school students, average scale score, and percentage at or above achievement levels in NAEP mathematics, by type of location, year, and jurisdiction: 2007, 2009 and 2011
# Rounds to zero.‡ Reporting standards not met.* Value is significantly different (p < .05) from the value for the same jurisdiction and student group in 2011.
NOTE: The NAEP grade 8 mathematics scale ranges from 0 to 500. Achievement levels correspond to the following points on the NAEP mathematics scales: below Basic, 261 or lower; Basic, 262—298; Proficient, 299—332; and Advanced, 333 and above. At or above Basic includes Basic, Proficient, and Advanced. At or above Proficient includes Proficient and Advanced. Detail may not sum to totals because of rounding. All differences were calculated and tested using unrounded numbers.SOURCE: U.S. Department of Education, Institute of Education Sciences, National Center for Education Statistics, National Assessment of Educational Progress (NAEP), 2007, 2009 and 2011 Mathematics Assessments.
City2007 Nation (public) 28 273 38 62 25 5
New Jersey 5 273 41 59 30 102009 Nation (public) 27 276 36 64 28 6
New Jersey 5 265 46 54 18 52011 Nation (public) 29 277 34 66 29 7
New Jersey 10 278 31 69 28 7Suburb
2007 Nation (public) 36 285 26 74 36 9New Jersey 83 289 22 78 40 10
2009 Nation (public) 36 286 25 75 37 10New Jersey 81 294 18 82 45 15
2011 Nation (public) 36 286 25 75 37 9New Jersey 79 296 17 83 49 15
Town2007 Nation (public) 13 280 29 71 29 5
New Jersey # ‡ ‡ ‡ ‡ ‡2009 Nation (public) 14 279 30 70 29 5
New Jersey 2 ‡ ‡ ‡ ‡ ‡2011 Nation (public) 13 281 28 72 31 6
New Jersey 1 ‡ ‡ ‡ ‡ ‡Rural
2007 Nation (public) 22 282 26 74 32 6New Jersey 11 295 17 83 47 13
2009 Nation (public) 23 284 25 75 33 7New Jersey 11 296 16 84 49 12
2011 Nation (public) 23 286 23 77 35 7New Jersey 10 296 12 88 47 11
Type of location, year, and jurisdiction
Percentageof students
Average scale score
Below Basic
At or aboveBasic
At or above
ProficientAt
Advanced
Page 49 of 65

Parents' Highest Level of Education
Eighth-grade students who participated in the NAEP 2011 assessment were asked to indicate the highest level of education they thought their father and their mother had completed. Five response options—did not finish high school, graduated from high school, some education after high school, graduated from college, and "I don't know"—were offered. The highest level of education reported for either parent was used in the analysis. Fourth-graders were not asked about their parents' education level because their responses in previous NAEP assessments were not reliable, and a large percentage of them chose the "I don't know" option.
The results by highest level of parental education are shown in table 8.
Grade 8 Scale Score Results by Parents' Highest Level of Education
In 2011, students in New Jersey who reported that a parent had graduated from college had an average scale score that was higher than the average scores of students with a parent in any of the following education categories: some education after high school, graduated from high school, and did not finish high school.
In 2011, the average scale scores for students in New Jersey who reported that a parent had graduated from college, had graduated from high school, or had not finished high school were higher than the corresponding scores of students in the nation.
In 2011, the average scale score for students in New Jersey who reported that a parent had some education after high school was not significantly different from the score of students in the nation.
In 2011, the average scale score for students in New Jersey who reported that a parent had graduated from college was higher than the score of students in 1990, 1992, 2003, 2005, and 2007, but not significantly different from the score of students in 2009.
In 2011, the average scale scores for students in New Jersey who reported that a parent had some education after high school or had not finished high school were higher than the corresponding scores of students in 1990, 1992, and 2003, but not significantly different from the corresponding scores of students in 2005, 2007, and 2009.
In 2011, the average scale score for students in New Jersey who reported that a parent had graduated from high school was higher than the score of students in 1990, 1992, 2003, and 2005, but not significantly different from the score of students in 2007 and 2009.
Grade 8 Achievement-Level Results by Parents' Highest Level of Education
In 2011, the percentage of students performing at or above Proficient in New Jersey who reported that a parent had graduated from college was greater than the percentage for students whose parents' highest level of education was in any of the following education categories: some education after high school, graduated from high school, and did not finish high school.
In 2011, the percentages of students in New Jersey reporting that a parent had graduated from college, had graduated from high school, or had not finished high school and who performed at or above Proficient were greater than the corresponding percentages of students in the nation.
In 2011, the percentage of students in New Jersey reporting that a parent had some education after high school and who performed at or above Proficient was not significantly different from the percentage of students in the nation.
In 2011 in New Jersey, the percentage of students reporting that a parent had graduated from college and who performed at or above Proficient was greater than the percentage of students in 1990, 1992, 2003, and 2005, but was not significantly different from the percentage of students in 2007 and 2009.
In 2011 in New Jersey, the respective percentages of students reporting that a parent had some education after high school, had graduated from high school, or had not finished high school and who performed at or above Proficient were greater than the corresponding percentages of students in 1990, 1992, and 2003, but were not significantly different from the corresponding percentages of students in 2005, 2007, and 2009.
NAEP 2011 Mathematics Report for New Jersey
Page 50 of 65

NAEP 2011 Mathematics Report for New Jersey
Table
8
The Nation's Report Card 2011 State Assessment
Percentage of eighth-grade public school students, average scale score, and percentage at or above achievement levels in NAEP mathematics, by highest parental education level, year, and jurisdiction: Various years, 1990–2011
See notes at end of table.
Did not finish high school19901 Nation (public) 10 241 76 24 3 #
New Jersey 7 250 65 35 5 119921 Nation (public) 8 249 66 34 6 1
New Jersey 7 254 59 41 6 12003 Nation (public) 7 256 56 44 9 1
New Jersey 3 260 50 50 9 22005 Nation (public) 8 259 52 48 11 1
New Jersey 4 266 44 56 16 22007 Nation (public) 8 263 48 52 12 1
New Jersey 4 270 38 62 17 #2009 Nation (public) 8 265 45 55 14 1
New Jersey 4 270 39 61 18 22011 Nation (public) 8 265 44 56 15 2
New Jersey 5 273 34 66 25 3Graduated from high school
19901 Nation (public) 25 255 59 41 8 #New Jersey 24 260 53 47 11 1
19921 Nation (public) 25 257 55 45 10 1New Jersey 23 260 50 50 10 1
2003 Nation (public) 18 267 42 58 16 2New Jersey 16 269 39 61 17 2
2005 Nation (public) 18 267 42 58 17 2New Jersey 16 272 37 63 22 4
2007 Nation (public) 18 270 40 60 19 2New Jersey 16 276 31 69 27 4
2009 Nation (public) 17 270 38 62 19 2New Jersey 14 277 30 70 25 4
2011 Nation (public) 17 271 38 62 20 2New Jersey 13 280 29 71 29 6
Highest parental education level, year, and jurisdiction
Percentage ofstudents
Average scale score
Below Basic
At or above Basic
At or above
ProficientAt
Advanced
Page 51 of 65

NAEP 2011 Mathematics Report for New Jersey
Table
8
The Nation's Report Card 2011 State Assessment
Percentage of eighth-grade public school students, average scale score, and percentage at or above achievement levels in NAEP mathematics, by highest parental education level, year, and jurisdiction: Various years, 1990–2011—Continued
See notes at end of table.
Some education after high school19901 Nation (public) 17 267 43 57 15 3
New Jersey 16 270 39 61 18 219921 Nation (public) 18 270 40 60 20 3
New Jersey 18 275 32 68 24 22003 Nation (public) 18 280 27 73 28 4
New Jersey 16 280 28 72 27 32005 Nation (public) 18 280 27 73 28 4
New Jersey 15 283 24 76 32 52007 Nation (public) 17 283 24 76 32 5
New Jersey 15 288 18 82 38 62009 Nation (public) 17 283 24 76 32 5
New Jersey 15 292 16 84 42 102011 Nation (public) 16 285 22 78 33 5
New Jersey 14 287 20 80 36 8Graduated from college
19901 Nation (public) 39 274 34 66 25 4New Jersey 45 281 29 71 33 6
19921 Nation (public) 40 279 30 70 31 5New Jersey 45 284 26 74 36 6
2003 Nation (public) 45 287 23 77 39 8New Jersey 55 292 19 81 45 10
2005 Nation (public) 45 289 22 78 41 10New Jersey 53 294 18 82 47 13
2007 Nation (public) 46 291 20 80 43 11New Jersey 55 298 16 84 51 16
2009 Nation (public) 46 294 18 82 46 13New Jersey 57 302 14 86 55 20
2011 Nation (public) 47 294 18 82 46 13New Jersey 60 304 11 89 58 19
Highest parental education level, year, and jurisdiction
Percentage ofstudents
Average scale score
Below Basic
At or above Basic
At or above
ProficientAt
Advanced
Page 52 of 65

NAEP 2011 Mathematics Report for New Jersey
Table
8
The Nation's Report Card 2011 State Assessment
Percentage of eighth-grade public school students, average scale score, and percentage at or above achievement levels in NAEP mathematics, by highest parental education level, year, and jurisdiction: Various years, 1990–2011—Continued
# Rounds to zero.* Value is significantly different (p < .05) from the value for the same jurisdiction and student group in 2011.1 Accommodations were not permitted for this assessment.
NOTE: The NAEP grade 8 mathematics scale ranges from 0 to 500. Achievement levels correspond to the following points on the NAEP mathematics scales: below Basic, 261 or lower; Basic, 262—298; Proficient, 299—332; and Advanced, 333 and above. At or above Basic includes Basic, Proficient, and Advanced. At or above Proficient includes Proficient and Advanced. Detail may not sum to totals because of rounding. All differences were calculated and tested using unrounded numbers.SOURCE: U.S. Department of Education, Institute of Education Sciences, National Center for Education Statistics, National Assessment of Educational Progress (NAEP), various years, 1990–2011 Mathematics Assessments.
Unknown19901 Nation (public) 9 240 71 29 5 #
New Jersey 8 250 65 35 7 119921 Nation (public) 9 251 62 38 9 #
New Jersey 8 251 61 39 9 #2003 Nation (public) 11 258 53 47 12 1
New Jersey 10 258 53 47 13 12005 Nation (public) 11 260 51 49 13 1
New Jersey 11 263 44 56 17 22007 Nation (public) 12 263 48 52 15 2
New Jersey 10 266 44 56 18 32009 Nation (public) 12 264 47 53 16 2
New Jersey 9 274 37 63 24 62011 Nation (public) 12 265 46 54 16 2
New Jersey 8 275 36 64 27 7
Highest parental education level, year, and jurisdiction
Percentageof students
Average scale score
Below Basic
At or aboveBasic
At or above
ProficientAt
Advanced
Page 53 of 65

A More Inclusive NAEP: Students With Disabilities and English Language Learners
To ensure that the samples are representative, NAEP has established policies and procedures to maximize the inclusion of all students in the assessment. Every effort is made to ensure that all selected students who are capable of participating meaningfully in the assessment are assessed. While some students with disabilities (SD) and/or English language learners (ELL) can be assessed without any special procedures, others require accommodations to participate in NAEP. Still other SD and/or ELL students selected by NAEP may not be able to participate. Local school staff who are familiar with these students are asked a series of questions to help them decide whether each student should participate in the assessment and whether the student needs accommodations.
Within any assessment year, exclusion and accommodation rates may vary across jurisdictions. In addition, exclusion and accommodation rates may increase or decrease between assessment administrations, making it difficult to interpret comparisons over time within jurisdictions. Since SD and/or ELL students tend to score below average on assessments, the exclusion of students from these groups may result in a higher average score than if those students had taken the assessment. On the other hand, providing appropriate testing accommodations (e.g., providing extended time for some SD and/or ELL students to take the assessment) removes barriers that would otherwise prevent them from demonstrating their knowledge and skills.
Prior to 2000, testing accommodations were not provided for students with special needs in NAEP state mathematics assessments. For 2000, results are displayed for both the sample in which accommodations were permitted and the sample in which they were not permitted. Subsequent assessment results were based on the more inclusive samples.
Tables 9-A and 9-B display data for 4 and 8 grade students in New Jersey who were identified as SD and/or ELL, by whether they were excluded, assessed with accommodations, or assessed under standard conditions, as a percent of all 4 or 8 grade students in the state.
Tables 10-A and 10-B show the percentages of students assessed in New Jersey by disability status and their performance on the NAEP assessment in terms of average scores and percentages performing below Basic, at or above Basic, at or above Proficient, and at Advanced for grades 4 and 8 .
Tables 11-A and 11-B present the percentages of students assessed in New Jersey by ELL status, their average scores, and their performance in terms of the percentages below Basic, at or above Basic, at or above Proficient, and at Advanced for grades 4 and 8 .
Tables 12-A and 12-B present the total number of grades 4 and 8 students assessed in each of the participating states and the percentage of students sampled who were excluded.
NAEP 2011 Mathematics Report for New Jersey
th th
th th
Page 54 of 65

NAEP 2011 Mathematics Report for New Jersey
Table
9-A
The Nation's Report Card 2011 State Assessment
Percentage of fourth-grade public school students identified as students with disabilities (SD) and/or English language learners (ELL) excluded and assessed in NAEP mathematics as a percentage of all students, by assessment year and testing status: Various years, 1992–2011
# Rounds to zero.1 Accommodations were not permitted for this assessment year.
NOTE: Students identified as both SD and ELL were counted only once under the combined SD and/or ELL category, but were counted separately under the SD and ELL categories. Detail may not sum to totals because of rounding.SOURCE: U.S. Department of Education, Institute of Education Sciences, National Center for Education Statistics, National Assessment of Educational Progress (NAEP), various years, 1992–2011 Mathematics Assessments.
19921 Identified 11 10 8 7 4 3Excluded 6 7 3 5 2 2
Assessed without accommodations 6 4 5 3 1 1
19961 Identified 11 16 9 12 2 4Excluded 6 6 5 5 1 2
Assessed without accommodations 5 9 4 7 1 2
2003 Identified 18 22 14 14 4 11Excluded 2 4 2 3 1 1
Assessed without accommodations 1 10 1 4 1 7Assessed with accommodations 14 8 12 7 3 2
2005 Identified 18 23 15 14 3 10Excluded 3 3 2 3 1 1
Assessed without accommodations 4 10 3 4 1 7Assessed with accommodations 11 10 10 8 1 3
2007 Identified 18 23 14 14 4 11Excluded 2 3 2 3 # 1
Assessed without accommodations 2 10 1 3 # 7Assessed with accommodations 14 10 11 8 3 3
2009 Identified 19 23 16 13 4 10Excluded 3 2 2 2 1 1
Assessed without accommodations 2 9 2 3 # 6Assessed with accommodations 14 11 12 8 3 4
2011 Identified 20 23 17 13 3 11Excluded 3 2 3 2 # #
Assessed without accommodations 2 9 2 3 # 6Assessed with accommodations 14 12 12 9 3 4
Year and testing status
SD and/or ELL SD ELLNew
JerseyNation
(public)New
JerseyNation
(public)New
JerseyNation
(public)
Page 55 of 65

NAEP 2011 Mathematics Report for New Jersey
Table
9-B
The Nation's Report Card 2011 State Assessment
Percentage of eighth-grade public school students identified as students with disabilities (SD) and/or English language learners (ELL) excluded and assessed in NAEP mathematics as a percentage of all students, by assessment year and testing status: Various years, 1990–2011
— Not available.# Rounds to zero.1 Accommodations were not permitted for this assessment year.
NOTE: Students identified as both SD and ELL were counted only once under the combined SD and/or ELL category, but were counted separately under the SD and ELL categories. Detail may not sum to totals because of rounding.SOURCE: U.S. Department of Education, Institute of Education Sciences, National Center for Education Statistics, National Assessment of Educational Progress (NAEP), various years, 1990–2011 Mathematics Assessments.
19901 Identified 12 — 10 — 2 —
Excluded 7 — 5 — 2 —
Assessed without accommodations 5 — 4 — 1 —
19921 Identified 14 10 12 8 3 2Excluded 7 6 6 5 1 2
Assessed without accommodations 7 4 6 3 1 1
19961 Identified 13 11 10 9 3 3Excluded 7 5 5 4 2 1
Assessed without accommodations 6 7 5 5 1 2
2003 Identified 18 19 15 14 3 6Excluded 2 4 1 3 1 1
Assessed without accommodations 2 8 2 5 # 4Assessed with accommodations 14 7 12 6 2 1
2005 Identified 18 19 16 13 2 6Excluded 4 4 3 3 1 1
Assessed without accommodations 2 7 2 3 # 4Assessed with accommodations 12 8 12 7 1 1
2007 Identified 18 18 14 13 4 7Excluded 3 4 3 4 1 1
Assessed without accommodations 2 6 1 2 1 4Assessed with accommodations 12 8 11 6 2 2
2009 Identified 18 18 16 13 2 6Excluded 2 3 2 3 # #
Assessed without accommodations 2 5 1 2 # 3Assessed with accommodations 14 10 13 8 2 2
2011 Identified 19 18 17 13 2 6Excluded 4 3 4 2 # #
Assessed without accommodations 1 5 1 2 # 3Assessed with accommodations 14 10 12 9 2 2
Year and testing status
SD and/or ELL SD ELLNew
JerseyNation
(public)New
JerseyNation
(public)New
JerseyNation
(public)
Page 56 of 65
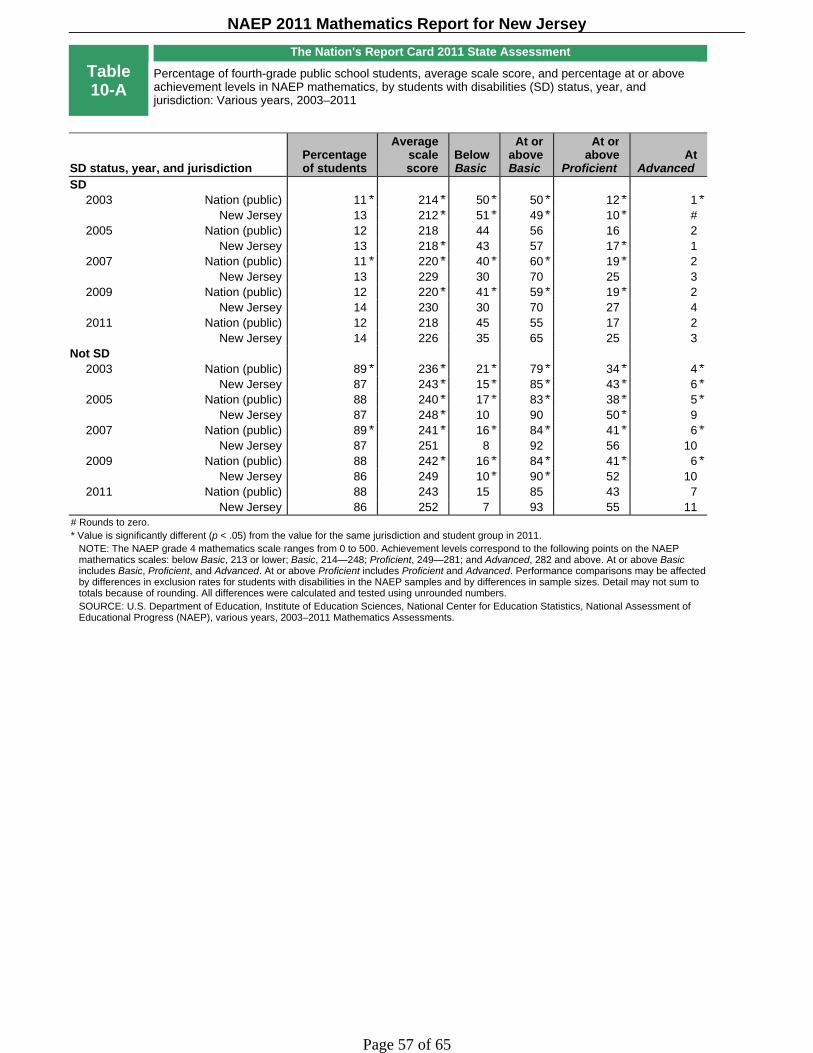
NAEP 2011 Mathematics Report for New Jersey
Table
10-A
The Nation's Report Card 2011 State Assessment
Percentage of fourth-grade public school students, average scale score, and percentage at or above achievement levels in NAEP mathematics, by students with disabilities (SD) status, year, and jurisdiction: Various years, 2003–2011
# Rounds to zero.* Value is significantly different (p < .05) from the value for the same jurisdiction and student group in 2011.
NOTE: The NAEP grade 4 mathematics scale ranges from 0 to 500. Achievement levels correspond to the following points on the NAEP mathematics scales: below Basic, 213 or lower; Basic, 214—248; Proficient, 249—281; and Advanced, 282 and above. At or above Basic includes Basic, Proficient, and Advanced. At or above Proficient includes Proficient and Advanced. Performance comparisons may be affected by differences in exclusion rates for students with disabilities in the NAEP samples and by differences in sample sizes. Detail may not sum to totals because of rounding. All differences were calculated and tested using unrounded numbers.SOURCE: U.S. Department of Education, Institute of Education Sciences, National Center for Education Statistics, National Assessment of Educational Progress (NAEP), various years, 2003–2011 Mathematics Assessments.
SD2003 Nation (public) 11 214 50 50 12 1
New Jersey 13 212 51 49 10 #2005 Nation (public) 12 218 44 56 16 2
New Jersey 13 218 43 57 17 12007 Nation (public) 11 220 40 60 19 2
New Jersey 13 229 30 70 25 32009 Nation (public) 12 220 41 59 19 2
New Jersey 14 230 30 70 27 42011 Nation (public) 12 218 45 55 17 2
New Jersey 14 226 35 65 25 3Not SD
2003 Nation (public) 89 236 21 79 34 4New Jersey 87 243 15 85 43 6
2005 Nation (public) 88 240 17 83 38 5New Jersey 87 248 10 90 50 9
2007 Nation (public) 89 241 16 84 41 6New Jersey 87 251 8 92 56 10
2009 Nation (public) 88 242 16 84 41 6New Jersey 86 249 10 90 52 10
2011 Nation (public) 88 243 15 85 43 7New Jersey 86 252 7 93 55 11
SD status, year, and jurisdictionPercentageof students
Average scale score
Below Basic
At or above Basic
At or above
ProficientAt
Advanced
Page 57 of 65

NAEP 2011 Mathematics Report for New Jersey
Table
10-B
The Nation's Report Card 2011 State Assessment
Percentage of eighth-grade public school students, average scale score, and percentage at or above achievement levels in NAEP mathematics, by students with disabilities (SD) status, year, and jurisdiction: Various years, 2003–2011
# Rounds to zero.* Value is significantly different (p < .05) from the value for the same jurisdiction and student group in 2011.
NOTE: The NAEP grade 8 mathematics scale ranges from 0 to 500. Achievement levels correspond to the following points on the NAEP mathematics scales: below Basic, 261 or lower; Basic, 262—298; Proficient, 299—332; and Advanced, 333 and above. At or above Basic includes Basic, Proficient, and Advanced. At or above Proficient includes Proficient and Advanced. Performance comparisons may be affected by differences in exclusion rates for students with disabilities in the NAEP samples and by differences in sample sizes. Detail may not sum to totals because of rounding. All differences were calculated and tested using unrounded numbers.SOURCE: U.S. Department of Education, Institute of Education Sciences, National Center for Education Statistics, National Assessment of Educational Progress (NAEP), various years, 2003–2011 Mathematics Assessments.
SD2003 Nation (public) 11 242 71 29 6 1
New Jersey 15 247 66 34 7 12005 Nation (public) 11 244 69 31 7 1
New Jersey 14 242 68 32 4 #2007 Nation (public) 9 246 67 33 8 1
New Jersey 12 251 62 38 9 12009 Nation (public) 10 249 64 36 9 1
New Jersey 14 259 53 47 13 32011 Nation (public) 11 249 65 35 9 2
New Jersey 14 261 52 48 18 4Not SD
2003 Nation (public) 89 280 29 71 30 5New Jersey 85 287 22 78 38 7
2005 Nation (public) 89 281 28 72 31 6New Jersey 86 291 19 81 41 10
2007 Nation (public) 91 284 26 74 33 7New Jersey 88 294 17 83 45 12
2009 Nation (public) 90 285 24 76 35 8New Jersey 86 298 14 86 50 16
2011 Nation (public) 89 287 23 77 36 9New Jersey 86 299 12 88 51 15
SD status, year, and jurisdictionPercentageof students
Average scale score
Below Basic
At or above Basic
At or above
ProficientAt
Advanced
Page 58 of 65

NAEP 2011 Mathematics Report for New Jersey
Table
11-A
The Nation's Report Card 2011 State Assessment
Percentage of fourth-grade public school students, average scale score, and percentage at or above achievement levels in NAEP mathematics, by English language learner (ELL) status, year, and jurisdiction: Various years, 2003–2011
# Rounds to zero.* Value is significantly different (p < .05) from the value for the same jurisdiction and student group in 2011.
NOTE: The NAEP grade 4 mathematics scale ranges from 0 to 500. Achievement levels correspond to the following points on the NAEP mathematics scales: below Basic, 213 or lower; Basic, 214—248; Proficient, 249—281; and Advanced, 282 and above. At or above Basic includes Basic, Proficient, and Advanced. At or above Proficient includes Proficient and Advanced. Performance comparisons may be affected by differences in exclusion rates for English language learners in the NAEP samples and by differences in sample sizes. Detail may not sum to totals because of rounding. All differences were calculated and tested using unrounded numbers.SOURCE: U.S. Department of Education, Institute of Education Sciences, National Center for Education Statistics, National Assessment of Educational Progress (NAEP), various years, 2003–2011 Mathematics Assessments.
ELL2003 Nation (public) 9 214 51 49 9 #
New Jersey 4 213 52 48 7 12005 Nation (public) 10 216 46 54 11 1
New Jersey 3 222 38 62 17 22007 Nation (public) 10 217 44 56 13 1
New Jersey 4 218 45 55 14 12009 Nation (public) 10 218 43 57 12 1
New Jersey 3 216 51 49 10 12011 Nation (public) 11 219 42 58 14 1
New Jersey 3 216 45 55 8 #Not ELL
2003 Nation (public) 91 236 21 79 34 4New Jersey 96 240 18 82 40 5
2005 Nation (public) 90 239 18 82 38 5New Jersey 97 245 14 86 46 8
2007 Nation (public) 90 242 16 84 42 6New Jersey 96 250 9 91 53 10
2009 Nation (public) 90 242 16 84 41 6New Jersey 97 247 11 89 50 9
2011 Nation (public) 89 243 15 85 43 7New Jersey 97 249 10 90 52 10
ELL status, year, and jurisdictionPercentageof students
Average scale score
Below Basic
At or above Basic
At or above
ProficientAt
Advanced
Page 59 of 65

NAEP 2011 Mathematics Report for New Jersey
Table
11-B
The Nation's Report Card 2011 State Assessment
Percentage of eighth-grade public school students, average scale score, and percentage at or above achievement levels in NAEP mathematics, by English language learner (ELL) status, year, and jurisdiction: Various years, 2003–2011
# Rounds to zero.‡ Reporting standards not met.* Value is significantly different (p < .05) from the value for the same jurisdiction and student group in 2011.
NOTE: The NAEP grade 8 mathematics scale ranges from 0 to 500. Achievement levels correspond to the following points on the NAEP mathematics scales: below Basic, 261 or lower; Basic, 262—298; Proficient, 299—332; and Advanced, 333 and above. At or above Basic includes Basic, Proficient, and Advanced. At or above Proficient includes Proficient and Advanced. Performance comparisons may be affected by differences in exclusion rates for English language learners in the NAEP samples and by differences in sample sizes. Detail may not sum to totals because of rounding. All differences were calculated and tested using unrounded numbers.SOURCE: U.S. Department of Education, Institute of Education Sciences, National Center for Education Statistics, National Assessment of Educational Progress (NAEP), various years, 2003–2011 Mathematics Assessments.
ELL2003 Nation (public) 5 241 74 26 5 1
New Jersey 2 ‡ ‡ ‡ ‡ ‡2005 Nation (public) 6 244 71 29 6 1
New Jersey 1 ‡ ‡ ‡ ‡ ‡2007 Nation (public) 6 245 70 30 6 1
New Jersey 3 257 55 45 11 #2009 Nation (public) 6 243 72 28 5 1
New Jersey 2 241 72 28 11 22011 Nation (public) 6 244 72 28 5 1
New Jersey 2 244 67 33 12 4Not ELL
2003 Nation (public) 95 278 31 69 29 5New Jersey 98 282 27 73 34 7
2005 Nation (public) 94 280 30 70 30 6New Jersey 99 285 25 75 36 9
2007 Nation (public) 94 282 27 73 33 7New Jersey 97 290 21 79 41 11
2009 Nation (public) 94 284 26 74 34 8New Jersey 98 294 19 81 45 14
2011 Nation (public) 94 285 25 75 35 8New Jersey 98 295 17 83 48 14
ELL status, year, and jurisdictionPercentageof students
Average scale score
Below Basic
At or above Basic
At or above
ProficientAt
Advanced
Page 60 of 65

NAEP 2011 Mathematics Report for New Jersey
Table
12-A
The Nation's Report Card 2011 State Assessment
Number of fourth-grade public school students assessed in NAEP mathematics and weighted percentage excluded, by state/jurisdiction: 2011
1 Department of Defense Education Activity (domestic and overseas schools).NOTE: The number of students assessed is rounded to the nearest hundred.SOURCE: U.S. Department of Education, Institute of Education Sciences, National Center for Education Statistics, National Assessment of Educational Progress (NAEP), 2011 Mathematics Assessment.
Nation (public) 198,900 2Alabama 3,000 1Alaska 2,700 3Arizona 3,700 1Arkansas 3,500 1California 9,100 2
Colorado 3,500 1Connecticut 3,000 1Delaware 3,400 4Florida 7,100 2Georgia 5,300 2
Hawaii 3,300 2Idaho 3,600 1Illinois 5,000 2Indiana 3,400 2Iowa 3,300 1
Kansas 3,100 2Kentucky 4,800 3Louisiana 3,300 2Maine 3,200 2Maryland 4,400 6
Massachusetts 5,000 3Michigan 4,100 2Minnesota 3,600 1Mississippi 3,000 1Missouri 3,400 2
Montana 3,100 2Nebraska 3,100 2Nevada 3,800 2New Hampshire 3,300 2New Jersey 3,300 3
New Mexico 4,100 3New York 4,700 1North Carolina 5,300 2North Dakota 3,000 4Ohio 4,200 2
Oklahoma 2,900 8Oregon 3,600 3Pennsylvania 4,600 1Rhode Island 3,200 1South Carolina 3,300 1
South Dakota 3,200 2Tennessee 3,400 3Texas 9,600 4Utah 4,000 2Vermont 2,700 2
Virginia 3,600 2Washington 3,900 2West Virginia 3,000 2Wisconsin 4,500 2Wyoming 2,900 2
Other jurisdictionsDistrict of Columbia 2,000 5DoDEA1 3,100 3
State/jurisdiction Number assessed Weighted percentage excluded
Page 61 of 65

NAEP 2011 Mathematics Report for New Jersey
Table
12-B
The Nation's Report Card 2011 State Assessment
Number of eighth-grade public school students assessed in NAEP mathematics and weighted percentage excluded, by state/jurisdiction: 2011
1 Department of Defense Education Activity (domestic and overseas schools).NOTE: The number of students assessed is rounded to the nearest hundred.SOURCE: U.S. Department of Education, Institute of Education Sciences, National Center for Education Statistics, National Assessment of Educational Progress (NAEP), 2011 Mathematics Assessment.
Nation (public) 164,400 3Alabama 2,800 1Alaska 2,400 3Arizona 2,800 1Arkansas 2,800 1California 7,300 1
Colorado 2,800 1Connecticut 2,800 1Delaware 2,800 3Florida 6,200 2Georgia 4,100 3
Hawaii 2,900 2Idaho 3,000 1Illinois 4,200 2Indiana 2,700 3Iowa 2,700 1
Kansas 2,800 1Kentucky 3,900 3Louisiana 2,600 1Maine 2,700 2Maryland 3,500 6
Massachusetts 3,800 4Michigan 4,000 4Minnesota 3,000 2Mississippi 2,700 1Missouri 2,600 1
Montana 2,600 2Nebraska 2,600 4Nevada 2,800 3New Hampshire 2,700 2New Jersey 2,600 4
New Mexico 3,400 2New York 4,200 1North Carolina 4,400 2North Dakota 2,300 4Ohio 3,500 5
Oklahoma 2,400 10Oregon 2,900 1Pennsylvania 3,800 2Rhode Island 2,700 1South Carolina 2,700 4
South Dakota 3,100 2Tennessee 2,800 4Texas 7,500 5Utah 2,900 3Vermont 2,100 1
Virginia 2,700 3Washington 3,200 2West Virginia 2,800 2Wisconsin 3,600 2Wyoming 2,100 1
Other jurisdictionsDistrict of Columbia 2,400 4DoDEA1 1,700 3
State/jurisdiction Number assessed Weighted percentage excluded
Page 62 of 65

Where to Find More Information
The NAEP Mathematics Assessment The latest news about the NAEP 2011 mathematics assessment and the results can be found on the NAEP website at http://nces.ed.gov/nationsreportcard/mathematics. The individual snapshot reports for each participating state and other jurisdictions are also available in the state results section of the website at http://nces.ed.gov/nationsreportcard/states/.
The Nation's Report Card: Mathematics 2011 may be ordered or downloaded at the NAEP website.
The Mathematics Framework for the 2011 National Assessment of Educational Progress, on which this assessment is based, is available at the National Assessment Governing Board website at http://www.nagb.org/publications/math-2011-framework.pdf.
The NAEP Data Explorer (NDE) The interactive database at http://nces.ed.gov/nationsreportcard/naepdata/ includes student, teacher, and school variables for all participating districts, the nation, and public schools in large cities. Data tables are also available for districts, with all contextual questions cross-tabulated with the major demographic variables. Users can design and create tables and can perform tests of statistical significance at this website.
Technical Documentation on the Web (TDW) Technical documentation section of the NAEP website http://nces.ed.gov/nationsreportcard/tdw/ contains information about the technical procedures and methods of NAEP. The TDW site is organized by topic (from Item Development through Analysis and Scaling) with subtopics, including information specific to a particular assessment. The content is written for researchers and assumes knowledge of educational measurement and testing.
Publications on the inclusion of students with disabilities and English language learners References for a variety of research publications related to the assessment of students with special needs may be found at http://nces.ed.gov/nationsreportcard/about/inclusion.asp#research.
To order publications Recent NAEP publications related to mathematics are listed on the mathematics page of the NAEP website and are available electronically. Publications can also be ordered from
Education Publications Center (ED Pubs) U.S. Department of Education P.O. Box 22207 Alexandria, VA 22304 Call toll free: 1-877-4ED-Pubs (1-877-433-7827) TTY/TDD: 1-877-576-7734 FAX: 1-301-470-1244 Order online at: http://www.edpubs.gov.
NAEP 2011 Mathematics Report for New Jersey
The NAEP State Report Generator was developed for the NAEP 2011 reports by Phillip Leung, Bobby Rampey, Rebecca Moran, Rick Hasney, and Ming Kuang.
Page 63 of 65

What is the Nation's Report CardTM?
The Nation's Report Card™ informs the public about the academic achievement of elementary and secondary students in the United States. Report cards communicate the findings of the National Assessment of Educational Progress (NAEP), a continuing and nationally representative measure of achievement in various subjects over time.
Since 1969, NAEP assessments have been conducted periodically in reading, mathematics, science, writing, U.S. history, civics, geography, and other subjects. NAEP collects and reports information on student performance at the national, state, and local levels, making the assessment an integral part of our nation's evaluation of the condition and progress of education. Only academic achievement data and related background information are collected. The privacy of individual students and their families is protected.
NAEP is a congressionally authorized project of the National Center for Education Statistics (NCES) within the Institute of Education Sciences of the U.S. Department of Education. The Commissioner of Education Statistics is responsible for carrying out the NAEP project. The National Assessment Governing Board oversees and sets policy for NAEP.
U.S. Department of Education
The National Assessment Governing Board
NAEP 2011 Mathematics Report for New Jersey
Arne Duncan Secretary U.S. Department of Education
John Q. Easton Director Institute of Education Sciences
Jack Buckley Commissioner National Center for Education Statistics
Peggy Carr Associate Commissioner for Assessment National Center for Education Statistics
Honorable David P. Driscoll, Chair Former Commissioner of Education Melrose, Massachusetts Mary Frances Taymans, Vice Chair Sisters of Notre Dame National Education Office Bethesda, Maryland Andrés Alonso Chief Executive Officer Baltimore City Public Schools Baltimore, Maryland David J. Alukonis Former Chairman Hudson School Board Hudson, New Hampshire Louis M. Fabrizio Data, Research and Federal Policy Director North Carolina Department of Public Instruction Raleigh, North Carolina Honorable Anitere Flores Senator Florida State Senate Miami, Florida Alan J. Friedman Consultant Museum Development and Science Communication New York, New York Shannon Garrison Fourth-Grade Teacher Solano Avenue Elementary School Los Angeles, California Doris R. Hicks Principal and Chief Executive Officer Dr. Martin Luther King, Jr. Charter School for Science and Technology New Orleans, Louisiana
Honorable Terry Holliday Commissioner of Education Kentucky Department of Education Lexington, Kentucky Richard Brent Houston Principal Shawnee Middle School Shawnee, Oklahoma Hector Ibarra Middle School Science Teacher Belin-Blank International Center and Talent Development Iowa City, Iowa Honorable Tom Luna Idaho Superintendent of Public InstructionBoise, Idaho Honorable Jack Markell Governor of Delaware Wilmington, Delaware Tonya Miles General Public Representative Mitchellville, Maryland Dale Nowlin Twelfth-Grade Teacher Columbus North High School Columbus, Indiana Honorable Sonny Perdue Governor of Georgia Atlanta, Georgia Susan Pimentel Educational Consultant Hanover, New Hampshire
W. James Popham Professor Emeritus Graduate School of Education and Information Studies University of California, Los Angeles Wilsonville, Oregon Andrew C. Porter Dean Graduate School of Education University of Pennsylvania Philadelphia, Pennsylvania B. Fielding Rolston Chairman Tennessee Board of Education Kingsport, Tennessee Cary Sneider Associate Reasearch Professor Portland State University Portland, Oregon Blair Taylor President and CEO Los Angeles Urban League Los Angeles, California Honorable Leticia Van de Putte Senator Texas State Senate San Antonio, Texas Eileen L. Weiser General Public Representative Ann Arbor, Michigan John Q. Easton (Ex officio) Director Institute of Education Sciences U.S. Department of Education Washington, D.C. _______________ Cornelia S. Orr Executive Director National Assessment Governing Board Washington, D.C.
Page 64 of 65

Page 65 of 65