Embed Size (px)
Citation preview
1
SSTTAATTEE OOFF AAGGRRIICCUULLTTUURREE IINN MMAANNIITTOOBBAA

2
Manitoba’s agricultural industry is built on the fact that Manitoba has a land base capable of virtually endless sustained farm production. Crop and livestock commodities are produced in: - an environment recognized worldwide for its pollution free quality, - a research network that is clearly focused on future development of the end-product, - a producer knowledge base that is both innovative and aggressive, - policies that are supportive to the growth of the industry, - an infrastructure that facilitates an effective market strategy; and - a cooperative spirit within industry and government that is committed to growth and
prosperity for the province. As the world demand for food continues to increase, opportunities for growth are significant for all sectors of agricultural production in Manitoba. Continued success of agricultural sectors in Manitoba and Canada is to a degree contingent on the ability to establish recognizable standards and regulations for both production, processing and marketing the commodity. These regulations have to be in balance with the economics of production, the realities of provable health claims from utilization and the marketing factors that are characteristic of the industry. It is paramount to recognize the fact that specialty commodities, while rooted in a long history in many parts of the world, are very much in their relative infancy in the North American marketplace and as such, extensive changes can be expected as the industry develops. There must be sufficient speed and flexibility in the regulatory aspects of the industry and the marketing mechanisms to allow for inevitable change in the industry. Manitoba has the opportunity to become a center for new crop production in Canada and North America and the potential to become a major world player in the international marketplace. Success in this sector is dependent on the willingness to be progressive and take action to combine and coordinate research efforts across the Prairies, thus enabling faster development of new new products in the western provinces. Now is the time for industry, government, research, producers, to function and operate as a single force targeting the development of new opportunities in Manitoba.

3
Real GDP (% Change)
MANITOBA’S ECONOMY: DIVERSE, DEVELOPED AND DYNAMIC The Manitoba economy is mature and well balanced, with a variety of industries ranging from resource-based enterprises to leading-edge technology and business services. This wide range of industries shields the economy from boom-and-bust cycles that disrupt less diversified regions. It also means that businesses can count on a full-spectrum economy with all the services needed to succeed. While the Manitoba economy is well developed, it is also dynamic and growing. The provincial economy continues to expand at a stable and modest pace. Despite a sharp decrease in agricultural production, due to wet weather conditions, Manitoba’s real GDP increased by 2.2% in 2011 according to projections from the Manitoba Bureau of Statistics. Statistics Canada estimated that Manitoba’s real GDP increased by 2.4% in 2010, following a 0.3% contraction in 2009; Manitoba has also led all provinces in average annual growth over the last fiveyears (2005‐2010). Manitoba’s economic growth is expected to improve slightly over the next two years. The Manitoba Finance survey of economic forecasters conducted in February 2012, projects that Manitoba’s real GDP will expand 2.3% in 2012, above the national increase of 2.0%. In 2013, Manitoba’s real GDP is expected to increase 2.5%, also above the projected national increase of 2.4%. Despite the steady outlook for Manitoba, the current global economic circumstances remain fragile, with significant downside risks in several key regions of the world. While the employment situation is improving in the U.S., the precarious fiscal austerity measures and financial markets in Europe are weighing down on near-term global demand for goods and services. For Manitoba, the challenges also include the strengthening Canadian dollar and soil moisture conditions for agriculture and related industries. The Manitoba economy was built on resource sectors such as agriculture, forestry, mining and transportation. These traditional resource sectors will continue to play a fundamental role in the economy as they begin to diversify exports and process more commodity goods in the province. The agriculture sector, in particular, is in the midst of dynamic change. Traditionally focussed on the production of grain for export, it is rapidly shifting toward more production of livestock, particularly hogs. The sector is also diversifying into many new commodities such as buffalo, elk and non-traditional crops. While primary agriculture accounts for a small share of the total economy, it is at the heart of the agriculture and agri-food system. Any changes in commodity markets can have impacts on the performance of the primary agriculture industry and the whole supply chain.

4
CONTRIBUTION OF AGRICULTURE In Manitoba, the agricultural industry is a key driver of productivity and prosperity. The diversity of agriculture in the province plays an important role in maintaining economic strength and generating socio-economic stability.
0.0%
1.0%
2.0%
3.0%
4.0%
5.0%
6.0%
7.0%
8.0%
9.0%
10.0%
0
500
1000
1500
2000
2500
2002 2003 2004 2005 2006 2007 2008 2009 2010 2011
% o
f M
an
ito
ba
GD
P
MIL
LIO
NS
OF
DO
LL
AR
S
YEAR
GDP - Agricultural Sector - Manitoba2002 - 2011
Crop and Animal Production Percent of Provincial GDP
Industry Intelligence Section, MAFRISource: Manitoba Bureau of Statistics Agriculture contributes to Manitoba’s Gross Domestic Product (GDP) through net profilts and incomes including wages, depreciation and investment income. Improvements in GDP can be attributed to improved crop prices and production. Historically, agriculture’s direct and indirect contribution to GDP ranges between 4.4% and 4.8%. Food processing represents close to one-quarter of the total manufacturing output and with approximately $4 billion of foods processed, contributes an additional 2 to 4% to provincial GDP. Agriculture supports growth and employment in the rural economy by providing a market for services needed by the industry. Agriculture-connected industries, including food and beverage processing, supply inputs to agriculture, as well as wholesale, retail and other service sector components which supply services to farmers and other agriculture-related workers. When agri-food's indirect contribution to the GDP is added to its direct contribution, an estimated 9% of Manitoba's GDP is attributed to agriculture in 2011. It is estimated that when tierciary level contributions are included, the total impact on GDP may be closer to 12%.
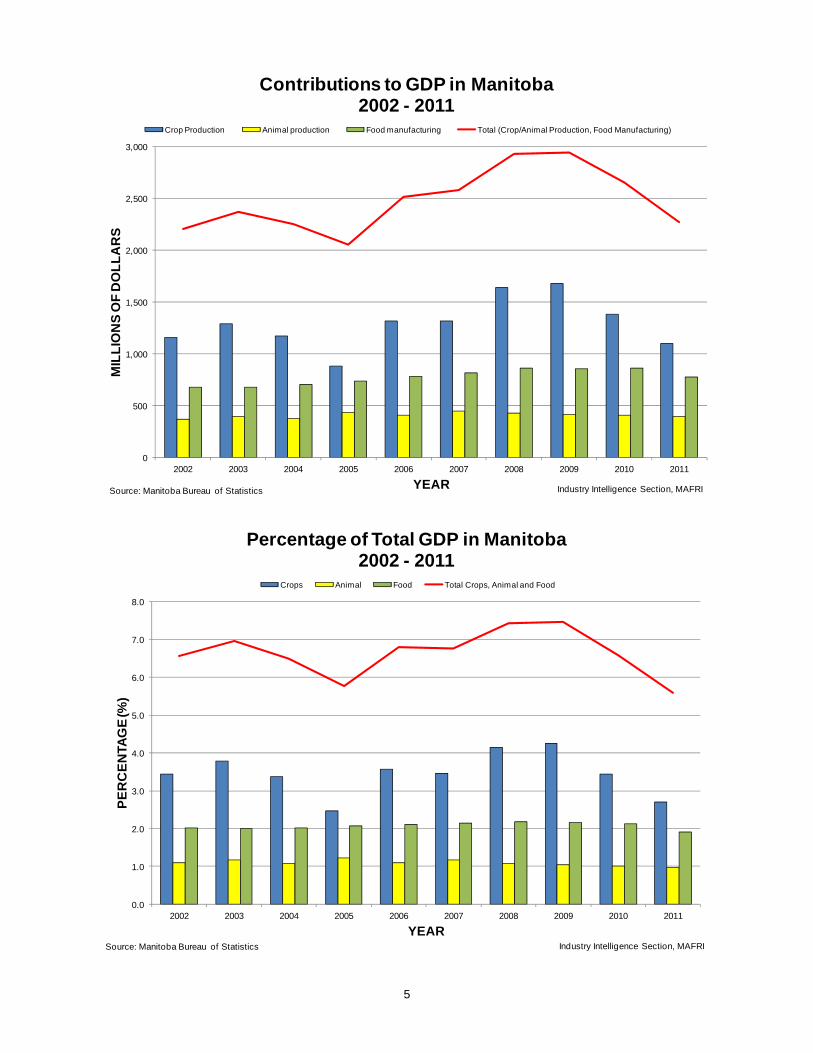
5
0
500
1,000
1,500
2,000
2,500
3,000
2002 2003 2004 2005 2006 2007 2008 2009 2010 2011
MIL
LIO
NS
OF
DO
LL
AR
S
YEAR
Contributions to GDP in Manitoba2002 - 2011
Crop Production Animal production Food manufacturing Total (Crop/Animal Production, Food Manufacturing)
Industry Intelligence Section, MAFRISource: Manitoba Bureau of Statistics
0.0
1.0
2.0
3.0
4.0
5.0
6.0
7.0
8.0
2002 2003 2004 2005 2006 2007 2008 2009 2010 2011
PE
RC
EN
TAG
E (%
)
YEAR
Percentage of Total GDP in Manitoba2002 - 2011
Crops Animal Food Total Crops, Animal and Food
Industry Intelligence Section, MAFRISource: Manitoba Bureau of Statistics

6
Farms contribute directly to the economy by employing people and paying wages and salaries. In Manitoba 36.7% of all farms in the province reported paid labour for the year 2010. The census counted 19,827 paid employees, of whom 44.6% worked year-round in a full or part-time capacity. Business-to-business transactions include purchases from suppliers such as feed, fertilizer, seed and chemicals, veterinary services, trucking services, electricity, insurance, farm and equipment repairs and maintenance, etc. Farm income is spent at retail outlets, pay mortgages or rent, buy vehicles, purchase property insurance, incur medical, financial, legal and other expenses. The economic activity supported by agriculture also supports tax revenues used to fund public services. It is estimated that between 1 in 10 jobs depends on direct and indirect spin-offs from agriculture. In agriculture, GDP growth is a valuable economic indicator to measure progress in terms of the rate of expansion in the economy's capacity of the industry to produce goods and services. Economic growth occurs from accumulating knowledge and skills, investing in buildings, machinery and equipment, and the implementation of new technologies in the production process.
0 5 10 15 20 25 30
Other Services
Trade
Manufacturing
Finance, Insur & Real Estate
Government
Transportation & Warehousing
Construction
Agriculture
Utilities
Info, Culture, Arts, Rec.
Mining & Other Primary
PERCENT
SE
CT
OR
S
Industrial Shares of Manitoba GDP in 2011
Industry Intelligence Section, MAFRISource: Manitoba Bureau of Statistics

7
Overview of Manitoba’s Agriculture Industry
8
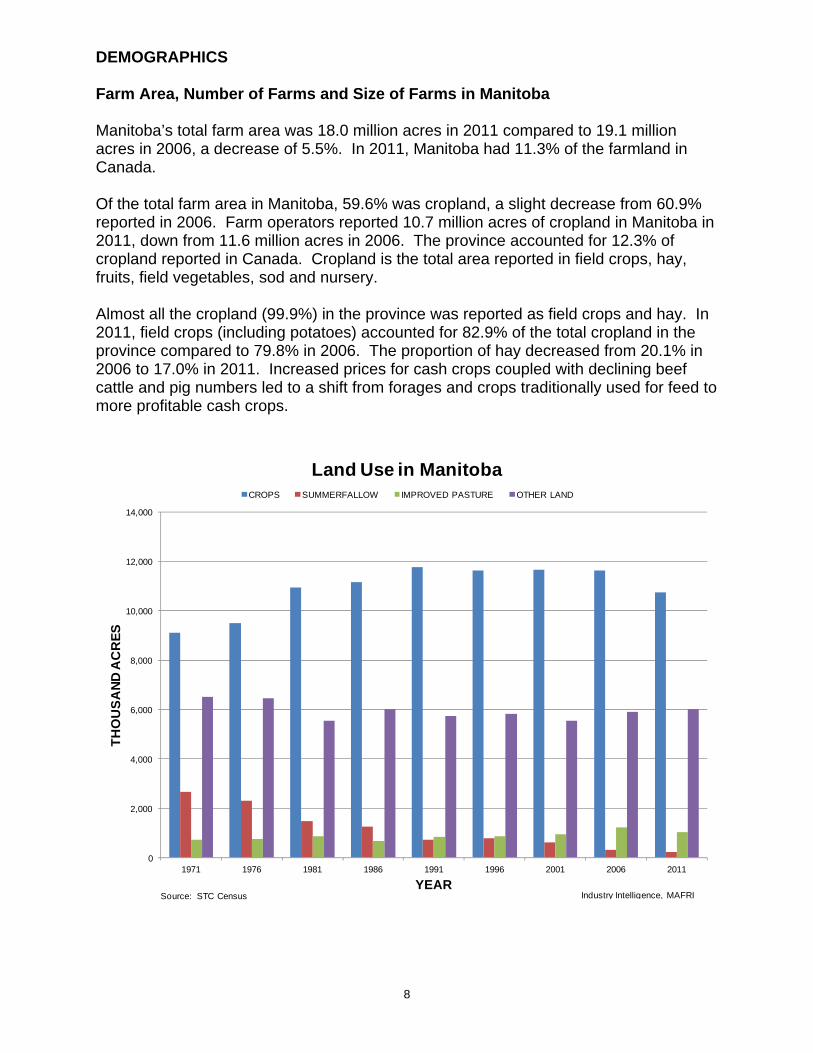
DEMOGRAPHICS Farm Area, Number of Farms and Size of Farms in Manitoba Manitoba’s total farm area was 18.0 million acres in 2011 compared to 19.1 million acres in 2006, a decrease of 5.5%. In 2011, Manitoba had 11.3% of the farmland in Canada. Of the total farm area in Manitoba, 59.6% was cropland, a slight decrease from 60.9% reported in 2006. Farm operators reported 10.7 million acres of cropland in Manitoba in 2011, down from 11.6 million acres in 2006. The province accounted for 12.3% of cropland reported in Canada. Cropland is the total area reported in field crops, hay, fruits, field vegetables, sod and nursery. Almost all the cropland (99.9%) in the province was reported as field crops and hay. In 2011, field crops (including potatoes) accounted for 82.9% of the total cropland in the province compared to 79.8% in 2006. The proportion of hay decreased from 20.1% in 2006 to 17.0% in 2011. Increased prices for cash crops coupled with declining beef cattle and pig numbers led to a shift from forages and crops traditionally used for feed to more profitable cash crops.
0
2,000
4,000
6,000
8,000
10,000
12,000
14,000
1971 1976 1981 1986 1991 1996 2001 2006 2011
TH
OU
SA
ND
AC
RE
S
YEAR
Land Use in ManitobaCROPS SUMMERFALLOW IMPROVED PASTURE OTHER LAND
Industry Intelligence, MAFRISource: STC Census

9
The proportion of pasture (tame or seeded pasture and natural land for pasture), summerfallow and woodlands in total farm area decreased while the proportion of other land increased to 5.7% in 2011 from 2.4% in 2006. Manitoba experienced severe flooding in the spring and summer of 2011 and land reported to the 2011 Census of Agriculture as “too wet to seed” has been categorized as “other land” and not cropland or summerfallow; this land could shift back to cropland when conditions improve. The 2011 Census of Agriculture counted 15,877 census farms in Manitoba, a 16.7% decrease since 2006. This compares to a 10.3% decrease at the national level and reflects the continued out-migration of farm operators, farm consolidation and farm retirements. A census farm is an agricultural operation that produces agricultural products intended for sale. Manitoba accounted for 7.7% of Canada’s 205,730 farms in 2011, lower than its 8.3% share in 2006.
0
200
400
600
800
1,000
1,200
0
10,000
20,000
30,000
40,000
50,000
60,000
70,000
1881
1886
1891
1896
1901
1906
1911
1916
1921
1926
1931
1936
1941
1946
1951
1956
1961
1966
1971
1976
1981
1986
1991
1996
2001
2006
2011
AV
ER
AG
E F
AR
M S
IZE
(ac
res
)N
UM
BE
R O
F F
AR
MS
CENSUS YEAR
FARM NUMBERS AND SIZE IN MANITOBA1881- 2011
NUMBER OF FARMS AVERAGE FARM SIZE (acres)
Industry Intelligence, MAFRISource: Statistics Canada While the overall number of farms in Manitoba has been declining and despite the decrease in total farm area, average area per farm has increased. The average Manitoba farm was 1,001 acres in 2006, up 12.3 % from 891 acres in 2001.
10
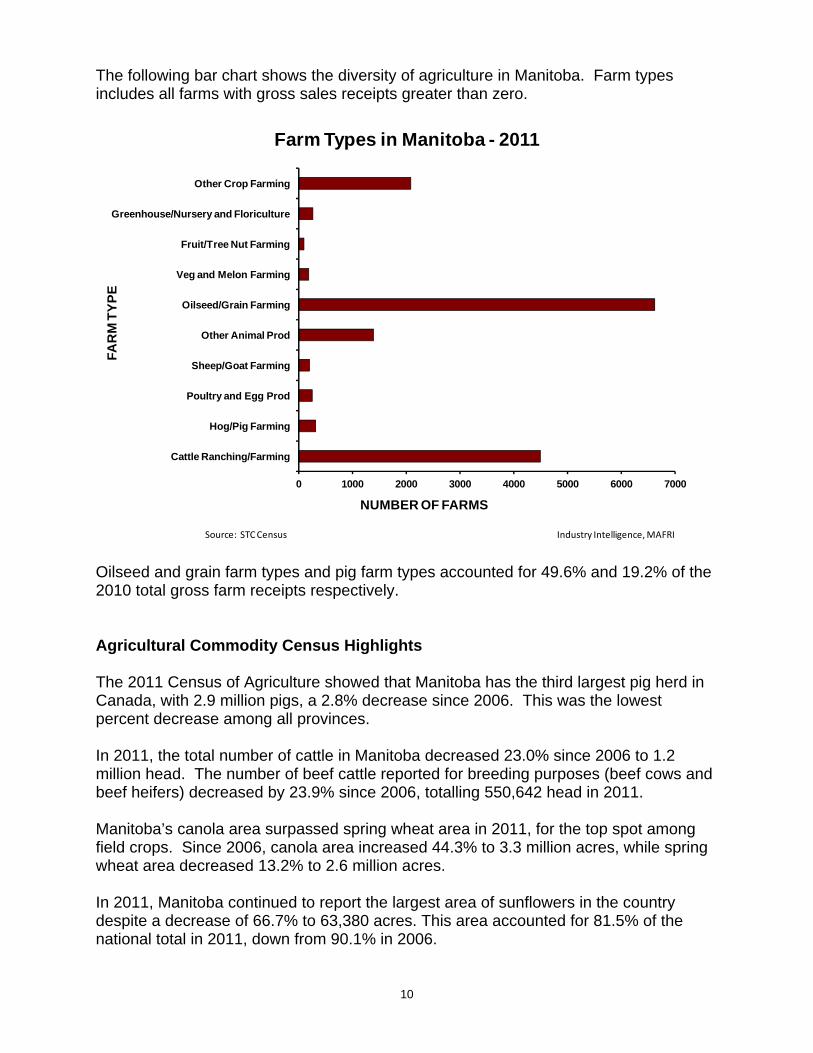
The following bar chart shows the diversity of agriculture in Manitoba. Farm types includes all farms with gross sales receipts greater than zero.
0 1000 2000 3000 4000 5000 6000 7000
Cattle Ranching/Farming
Hog/Pig Farming
Poultry and Egg Prod
Sheep/Goat Farming
Other Animal Prod
Oilseed/Grain Farming
Veg and Melon Farming
Fruit/Tree Nut Farming
Greenhouse/Nursery and Floriculture
Other Crop Farming
NUMBER OF FARMS
FA
RM
TY
PE
Farm Types in Manitoba - 2011
Industry Intelligence, MAFRISource: STC Census Oilseed and grain farm types and pig farm types accounted for 49.6% and 19.2% of the 2010 total gross farm receipts respectively. Agricultural Commodity Census Highlights The 2011 Census of Agriculture showed that Manitoba has the third largest pig herd in Canada, with 2.9 million pigs, a 2.8% decrease since 2006. This was the lowest percent decrease among all provinces. In 2011, the total number of cattle in Manitoba decreased 23.0% since 2006 to 1.2 million head. The number of beef cattle reported for breeding purposes (beef cows and beef heifers) decreased by 23.9% since 2006, totalling 550,642 head in 2011. Manitoba’s canola area surpassed spring wheat area in 2011, for the top spot among field crops. Since 2006, canola area increased 44.3% to 3.3 million acres, while spring wheat area decreased 13.2% to 2.6 million acres. In 2011, Manitoba continued to report the largest area of sunflowers in the country despite a decrease of 66.7% to 63,380 acres. This area accounted for 81.5% of the national total in 2011, down from 90.1% in 2006.
11
According to the 2011 Census of Agriculture, there were 180 farms with certified organic and/or transitional production in Manitoba. This represented 1.1% of all farms in the province. Nationwide, 2.0% of all farms reported certified organic and/or transitional production. The predominant category of certified organic and/or transitional products reported in Manitoba was field crops and hay and it was reported by 88.3% of the province’s 180 certified organic and/or transitional farms. Manitoba reported the second largest area of soybeans in Canada in 2011 with 705,032 acres, an increase of 101.1% since 2006. Areas reported for hay and grains traditionally used for livestock feed decreased in 2011. Hay area decreased 21.8% to 1.8 million acres in 2011. Similarly, oat area decreased 26.4% to 695,945 acres and barley area decreased 42.3% to 483,432 acres. Despite a 10.7% decrease from 2006 to 2011, Manitoba continued to report the second largest potato area in the country with 72,043 acres, behind Prince Edward Island. The total area of corn for grain increased 40.4% to 211,148 acres in 2011. Despite a 56.4% decrease in 2011, Manitoba continued to report the second largest flaxseed area in the country with 167,367 acres, behind Saskatchewan. Total vegetable area decreased 8.4% from 5,641 acres in 2006 to 5,169 acres in 2011. The largest vegetable areas in 2011 in Manitoba were sweet corn, carrots, and onions. Strawberry area decreased 26.4% to 304 acres in 2011, down from 413 acres reported in Manitoba in 2006. The area in saskatoons decreased 27.8% to 267 acres in 2011, down from 370 acres in 2006. The number of pollinating bees (excluding honeybees) decreased by 50.4% to 37,343 gallons in 2011, down from 75,332 gallons in 2006. There were 75,847 honeybee colonies reported in 2011, up from 73,411 colonies in 2006. In Manitoba, no-till methods were used on 24.0% of the land prepared for seeding in 2011, up from 21.3% in 2006. Conventional tillage decreased to 38.3% of land prepared for seeding, from 43.4% five years earlier. Conservation tillage was used on 37.7% of the land prepared for seeding, compared to 35.2% in 2006. The 2011 Census marked the first time farm operators were asked to report the area from which crop residue was baled for bedding or sale. In 2010, crop residue was baled from 747,146 acres in Manitoba.
12
Manitoba Farm Population Within Manitoba’s total population of 1,208,268 inhabitants in 2011, the farm population continued its steady decline in numbers, dropping by 8.1% since 2001 to 62,930 in 2006 (most current data available). Provincially, 1 in 18 Manitobans live on a farm, accounting for 5.5% of Manitoba’s population in 2006 compared to 6.2% five years earlier. In comparison, 1 in 46 Canadians live on a farm, accounting for 2.2% of the national population. Although 19.7% of the total Canadian population lived in rural areas in 2006, about 90% of rural inhabitants were not on farms. Manitoba’s rural population of 327,490 people accounted for 28.5% of the total provincial population in 2006 and 18.6% of the rural population lived on a farm. Farm operators in Manitoba Following the trend in the number of farms, there were 22,315 farm operators managing Manitoba’s 15,877 farms in 2011, a decrease of 16.2% from the 26,625 farm operators managing 19,054 farms in 2006. While the majority of farm operators continued to live on the farm, 3,095 or 13.9% resided off-farm in 2011 compared to 9.9% in 2006. In 2011, 23.6% of Manitoba farm operators were women, while nationally this percentage was 27.4%. The average age of a farm operator in Manitoba in 2011 was 53.1 years compared with 51.2 years in 2006. Nationally, the average age of a farm operator was 54.0 years, up from 52.0 years in 2006. In 2010, 46.6% of all Manitoba farm operators worked more than 40 hours a week on average on their farm operations, compared to 52.6% five years earlier. At the national level this percentage was 40.1% 2010. In 2010, 46.2% of all Manitoba farm operators had an off-farm job or business, compared to 47.7% in 2005. At the national level this percentage was 46.9% in 2010. According to the Census of Agriculture, 24.5% of Manitoba operators who were under the age of 35 on census day worked off the farm for more than 40 hours a week on average in 2010, compared to 20.7% of operators aged 35 to 54, and 9.6% of operators over 55 years of age. In 2011 farm operating arrangements, included 9,041 sole proprietorships, 3,982 partnerships, 2,490 family corporations and 307 other corporate farms, and 57 institutional or other farms. This compares with 2006 which had 10,866 sole proprietorships, 5,467 partnerships, 2,301 family corporations and 361 other corporate farms, and 59 institutional or other farms. High-speed internet access was reported by 43.1% of all Manitoba farms in 2011, while the national average was 44.8%.

13
In 2006 (most current data available), 8.2% of Manitoba farm operators had university degrees, up from 7.1% in 2001, and 11.7% reported apprenticeship or trades certificates or diplomas. In the 2006 Census, about 40% of Manitoba farm operators reported their main occupation as non-agricultural compared to 35.1% in 2001, suggesting that more operators are working off the farm. 58.6% of female operators in the province reported a non-agricultural occupation versus 33.4% for males. The top non-agricultural occupations for Manitoba's male farm operators included transportation equipment operators and related work, while clerical occupations were predominantly reported for women operators. 70.1% of Manitoba's total farm population in 2006 reported English as their mother tongue, 3.4% reported French and the remaining 26.5% reported another language predominantly German followed by Ukrainian. The 2006 Census of Population counted 3,340 immigrants in Manitoba's farm population or 5.3% of the total provincial farm population. The British made up 30.8% of Manitoba's immigrant farm population, while about 15% was from the Germany and the third most common place of birth for Manitoba's immigrant farm population was the United States at 10.5%. Over the past ten years, Manitoba has more than tripled its share of national immigration. Although the province accounts for about 3% of Canada’s population, it attracts nearly 6% of immigrants, more than 15,000 in 2010. The overwhelming majority of these immigrants arrived under the provincial nominee program, which Manitoba was the first province in Canada to adopt in 1998. Manitoba’s retention rate among nominee immigrants of nearly 83% may be due in part to the fact that many immigrants are able to find an ethnic community within the province. In addition, with a median age of 28, provincial nominees tend to belong to a younger age category than those in other immigration streams. The agricultural and manufacturing belt south of Winnipeg, populated by the church-going communities of Winkler, Morden and Altona, was the fastest growing region in the country in 2010. Over the years this area has attracted thousands of newcomers from Germany and Mexico, many of them with large families of seven or more, their adjustment facilitated by local German-speaking families who came to the area in the last century. This is also a region with growing immigration from Kazakhstan and other former Soviet republics as well as Ireland and Belgium. Brandon is another area outside the city of Winnipeg which has welcomed large numbers of immigrants in the last 10 years due to labour needs associated with a major meat-packing plant which spawned a multicultural boom. There are now 57 language groups in Brandon, with workers from countries such as El Salvador, China and Colombia.
14
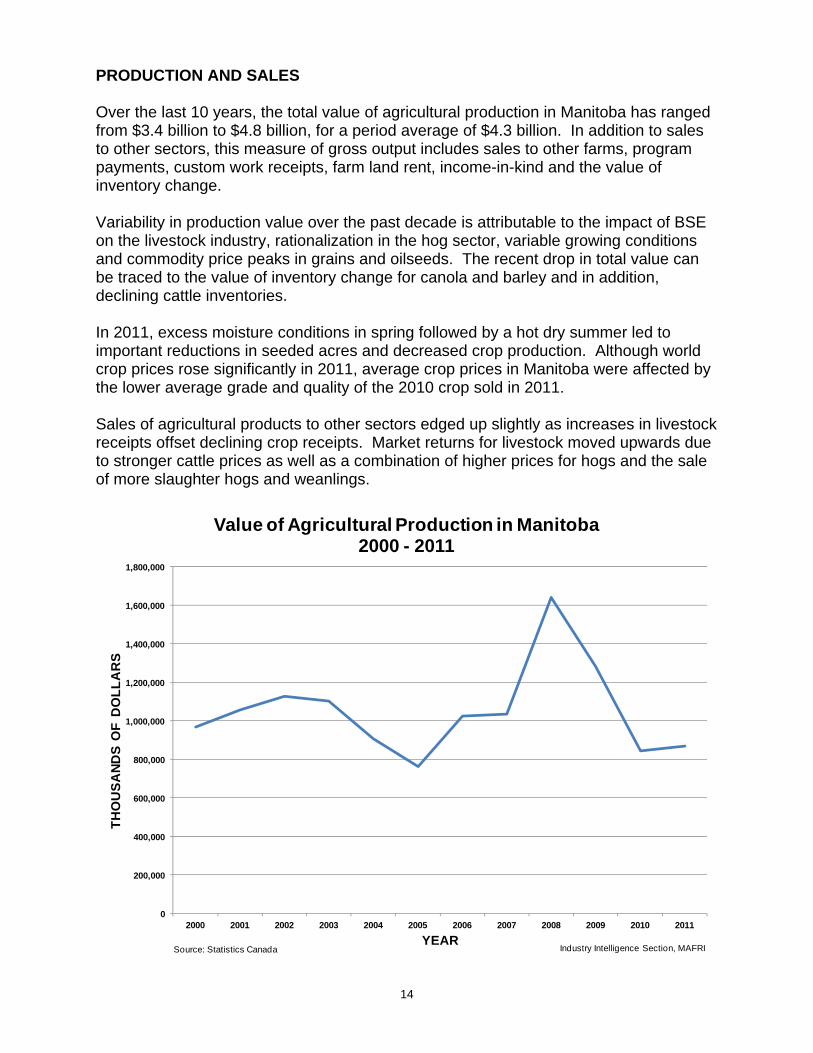
PRODUCTION AND SALES Over the last 10 years, the total value of agricultural production in Manitoba has ranged from $3.4 billion to $4.8 billion, for a period average of $4.3 billion. In addition to sales to other sectors, this measure of gross output includes sales to other farms, program payments, custom work receipts, farm land rent, income-in-kind and the value of inventory change. Variability in production value over the past decade is attributable to the impact of BSE on the livestock industry, rationalization in the hog sector, variable growing conditions and commodity price peaks in grains and oilseeds. The recent drop in total value can be traced to the value of inventory change for canola and barley and in addition, declining cattle inventories. In 2011, excess moisture conditions in spring followed by a hot dry summer led to important reductions in seeded acres and decreased crop production. Although world crop prices rose significantly in 2011, average crop prices in Manitoba were affected by the lower average grade and quality of the 2010 crop sold in 2011. Sales of agricultural products to other sectors edged up slightly as increases in livestock receipts offset declining crop receipts. Market returns for livestock moved upwards due to stronger cattle prices as well as a combination of higher prices for hogs and the sale of more slaughter hogs and weanlings.
0
200,000
400,000
600,000
800,000
1,000,000
1,200,000
1,400,000
1,600,000
1,800,000
2000 2001 2002 2003 2004 2005 2006 2007 2008 2009 2010 2011
TH
OU
SA
ND
S O
F D
OL
LA
RS
YEAR
Value of Agricultural Production in Manitoba2000 - 2011
Industry Intelligence Section, MAFRISource: Statistics Canada

15
The farm product price index measures the prices received by farmers for commodities produced on a constant dollar basis, with 1997 as the base period. Although the total index has trended upwards since mid-2010, there has been a continual slow-down of growth since the last quarter of 2011. For most of 2011, the increase in overall livestock and animal product prices more than offset lower crop prices. Crop prices and grains in particular showed dramatic increases in the range of 30 to 50% from 2006 to 2008 and in the same time period, oilseeds mirrored the increase at a slightly lower level, ranging from 20 to 40%. This increasing trend came to an abrupt end in mid-2008 as prices returned to historical levels. More recently, grain and oilseed prices have trended upward and the International Grains Council and United States Department of Agriculture forecasted an increase in total world grain production for 2011/12. Prices received for cattle improved post-BSE but in 2007 trended downward to levels below the base period of 1997. Hog prices have remained relatively flat until 2006 where a gradual downward trend became evident in part due to weaker market conditions, Country of Origin labeling and the H1N1 issue. In 2011, advances were recorded in all livestock commodities. Lower on-farm inventories of cattle and hogs in North America and higher feed grain costs have supported the year-over-year growth trends.
0
20
40
60
80
100
120
140
160
180
2000 2001 2002 2003 2004 2005 2006 2007 2008 2009 2010 2011
VA
LU
E: 1
99
7=
100
YEAR
Farm Product Price Index - Manitoba 2000 - 2011
Grains Oilseeds Cattle and calves Hogs
Industry Intelligence Section, MAFRISource: Statistics Canada

16
FARM CASH RECEIPTS Gross farm receipts have been rising. Manitoba’s gross farm receipts in 2010, the year prior to the census, increased 7.8% (at 2010 constant prices) to $5.3 billion, from 2005. At the national level there was a 3.9% increase in gross farm receipts between 2005 and 2010.
0
5000
10000
15000
20000
25000
30000
35000
1981 1986 1991 1996 2001 2006 2011
NU
MB
ER
OF
FA
RM
S
YEAR
Farm Numbers by Farm Cash Receipts1981 - 2011
<$50,000 $50,000-$99,999 $100,000+
Industry Intelligence,MAFRISource: STC Census
According to the 2011 Census of Agriculture, the number of farms with $500,000 or more (at 2010 constant prices) of 2010 gross farm receipts increased by 25.7% between censuses, and those with less than $500,000 decreased by 21.6%. There were 2,490 of these larger farms in Manitoba in 2011, and while they represented 15.7% of all farms in the province, they accounted for 73.2% of total provincial gross farm receipts reported for the year 2010. The number of farms with $250,000 and $499,999 in farm cash receipts has steadily declined over the years and now represents 2,039 farms or 13% of total farms in 2011. 2,753 farms (17%) had between $100,000 and $249,999 in farm cash receipts, while 2,063 farms (13%) had between $50,000 and $100,000 in farm cash receipts. In 2011, there were 6,532 farms, or 41.1% of total farms, with less than $50,000 in farm cash receipts. While declining in numbers relative to other income categories, they still represent the single largest grouping of farms in the province. This is particularly significant as it suggests that a large number of farms in the province generate a relatively small cash flow.

17
FARMS CLASSIFIED BY TOTAL GROSS FARM RECEIPTS, 2010 Number of farms reporting
Manitoba 2006 Manitoba 2011Under $10,000 3,426 2,716$10,000 to $24,999 2,779 1,971$25,000 to $49,999 2,516 1,845$50,000 to $99,999 2,813 2,063$100,000 to $249,999 3,875 2,753$250,000 to $499,999 2,058 2,039$500,000 to $999,999 958 1,426$1,000,000 to $1,999,999 341 676$2,000,000 and over 288 388Total farms reporting 19,054 15,877
Total farm cash receipts are estimated at $4.89 billion in 2011, a rise of 0.8% from $4.85 billion in 2010. Net operating expenses after rebates (including depreciation) are estimated at $3.8 billion in 2011, up 2.9% from 2010. Government payments are estimated at $509 million, a rise of 45.8% from $349 million in 2010. The sharp rise in 2011 program payments is due to early season excess moisture which resulted in low production and triggered higher crop insurance payments and assistance under AgriRecovery.
0
1,000
2,000
3,000
4,000
5,000
6,000
MIL
LIO
NS
OF
DO
LL
AR
S
Manitoba Farm Cash Receipts1993 - 2011
CROPS LIVESTOCK DIRECT PAYMENTS
Source: Statistics Canada Industry Intelligence, MAFRI

18
763.5
989.5
848.5
465.4
792.9
494.6
Average Manitoba Farm Cash Receipts(millions of dollars)
2007 - 2011
Wheat
Canola
Other Crops
Cattle and Calves
Hogs
Other Livestock
0 200 400 600 800 1,000 1,200
Sunflower seed
Flaxseed
Dry beans
Barley
Corn
Eggs
Poultry
Oats
Soybeans
Potatoes
Dairy
Cattle/calves
Wheat
Hogs
Canola
MILLIONS OF DOLLARS
CO
MM
OD
ITY
Manitoba Farm Cash Receipts, by Commodities2009 - 2011
2011
2010
2009
Industry Intelligence Section, MAFRISource: Statistics Canada

19
CROP MARKET RECEIPTS In 2011, crop market receipts in Manitoba were $2.5 billion, a drop of 8.9% from $2.7 billion in 2010, led by canola, wheat, soybeans and oats. Production challenges included excess moisture and delaying seeding followed by dry mid-summer conditions in several areas of the province. Tough growing conditions in both 2010 and 2011 led to production declines of more than 20% for both wheat and canola. Canola receipts were $1.02 billion in 2011, down 8.5% from 2010; all wheat receipts were $791 million in 2011, a rise of 7.7% from 2010; receipts for soybeans were $153 million in 2011, up 65.5% from 2010; and receipts for oats were 129 million, down 4.7% from 2010. Grain and oilseed prices in 2011 rose in response to tight global supply relative to use, as demand for feed and biofuels continued to rise while a drought and subsequent export restrictions in Russia and the Ukraine in 2010 constrained supplies well into 2011. Income from barley increased 15.6% to $64 million due in large measure to a 31.6% increase in barley prices. Income from corn was up 46.8% to $83 million mainly due to a 47.8% improvement in corn prices. Flax income dropped 45.6% to $29 million due to a 61.6% decrease in marketings in spite of a 25.6% improvement in flax prices. Income from potatoes was down 18.4% to $166 million primarily resulting from a 17.6% decrease in potato prices.
0
500
1,000
1,500
2,000
2,500
1990 1991 1992 1993 1994 1995 1996 1997 1998 1999 2000 2001 2002 2003 2004 2005 2006 2007 2008 2009 2010 2011
MIL
LIO
NS
OF
DO
LL
AR
S
YEAR
Farm Cash Receipts, Manitoba Principle Crops1990 - 2011
Wheat Oats Barley Flaxseed Canola
Industry Intelligence Section, MAFRISource: Statistics Canada
20
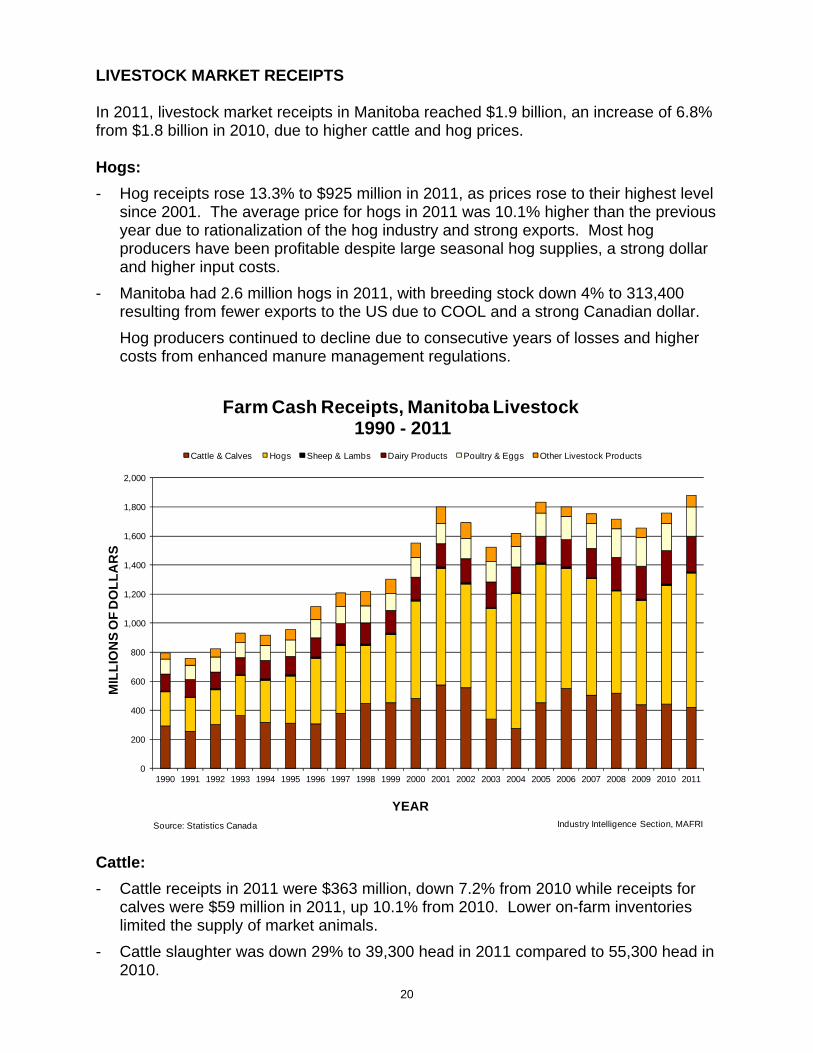
LIVESTOCK MARKET RECEIPTS In 2011, livestock market receipts in Manitoba reached $1.9 billion, an increase of 6.8% from $1.8 billion in 2010, due to higher cattle and hog prices. Hogs:
- Hog receipts rose 13.3% to $925 million in 2011, as prices rose to their highest level since 2001. The average price for hogs in 2011 was 10.1% higher than the previous year due to rationalization of the hog industry and strong exports. Most hog producers have been profitable despite large seasonal hog supplies, a strong dollar and higher input costs.
- Manitoba had 2.6 million hogs in 2011, with breeding stock down 4% to 313,400 resulting from fewer exports to the US due to COOL and a strong Canadian dollar.
Hog producers continued to decline due to consecutive years of losses and higher costs from enhanced manure management regulations.
0
200
400
600
800
1,000
1,200
1,400
1,600
1,800
2,000
1990 1991 1992 1993 1994 1995 1996 1997 1998 1999 2000 2001 2002 2003 2004 2005 2006 2007 2008 2009 2010 2011
MIL
LIO
NS
OF
DO
LL
AR
S
YEAR
Farm Cash Receipts, Manitoba Livestock1990 - 2011
Cattle & Calves Hogs Sheep & Lambs Dairy Products Poultry & Eggs Other Livestock Products
Industry Intelligence Section, MAFRISource: Statistics Canada Cattle:
- Cattle receipts in 2011 were $363 million, down 7.2% from 2010 while receipts for calves were $59 million in 2011, up 10.1% from 2010. Lower on-farm inventories limited the supply of market animals.
- Cattle slaughter was down 29% to 39,300 head in 2011 compared to 55,300 head in 2010.

21
- 327,100 cattle and calves were exported to other provinces in 2011, up 1% from 322,900 in 2010 while 82,400 head were exported internationally, down 50% from 164,300 in 2010. This was due in part to reduced slaughter capacity in the US for Canadian hogs and the impact of COOL.
- Fed steer prices were up 18.6% at $94/cwt; feeder prices rose 24.3% to $137/cwt; and cow prices were up 26.2% at $60/cwt.
Receipts from supply-managed commodities (dairy, poultry, eggs) were $447 million in 2011, up 7.1% from 2010, mainly due to a 6.7% increase in dairy receipts and a 14.4% rise in poultry receipts as egg receipts were relatively unchanged. FARM INCOME Net cash income is estimated at $1.1 billion in 2011, a decrease of 6.0% from $1.2 billion in 2010, led by the crops sector. Realized net farm income adjusted for depreciation is estimated at $525 million in 2011, down 16.9% from one year earlier. Total net income (adjusted for depreciation and inventory change) in 2011 is estimated at $183 million compared to $56 million in 2010 due to a reduction in the value of inventory change from $-576 million in 2010 to $-342 million in 2011. FARM INCOME SUMMARY
millions of dollars 2005 2006 2007 2008 2009 2010 2011Crop Receipts 1,294 1,275 2,198 2,763 2,805 2,743 2,499Livestock Receipts 1,832 1,801 1,752 1,716 1,657 1,760 1,880Market Receipts 3,126 3,076 3,950 4,479 4,461 4,503 4,380Total Payments 699 626 413 350 386 349 509Total Cash Receipts 3,825 3,702 4,363 4,829 4,848 4,852 4,889Net Operating Expenses 3,013 3,211 3,535 3,962 3,812 3,703 3,888Net Cash Income 812 490 828 868 1,036 1,149 1,001Income-In-Kind 4 3 3 3 3 3 3Depreciation Charges 461 467 470 495 527 537 576Realized Net Income 355 27 362 376 512 616 428Value of Inventory Change -234 295 -103 501 32 -578 -445TOTAL NET INCOME 122 322 259 877 544 37 -17
Manitoba farmers have experienced considerable variation in income over the decades with realized net farm income ranging from low of $27 million in 2006 to $612 million in 2010, with an average of $356 million in the past 10 years. This value varies considerably when the value of inventory change is considered. Further, if depreciation is eliminated and cash flow is taken into consideration, net cash income over the last 10 years has averaged $833 million. In 2010 net cash income reached a record high of $1,149 million. The values highlighted indicate that depending upon the measurement selected and the time frame considered, a variety of conclusions can be reached on the economic well-being of the sector within the provincial economy. If a short term perspective is taken, the cash flow to the farm community provides a good indicator of the current financial well-being of agriculture. However, if a longer term perspective is applied, depreciation and allowances for inventory change significantly alter the overall assessment of the economic well-being of the agricultural sector.

22
-1,000
0
1,000
2,000
3,000
4,000
5,000
6,000
2000 2001 2002 2003 2004 2005 2006 2007 2008 2009 2010 2011
MIL
LIO
NS
OF
DO
LL
AR
S
YEARS
Farm Income and Expenses, Manitoba 2000 - 2011
Market Receipts Total Payments Total Cash Receipts
Net Operating Expenses Realized Net Income TOTAL NET INCOME
Industry Intelligence Section, MAFRI Farmers in general are faced with a situation where they exercise only limited control on the aggregate income generated. On an individual basis, futures pricing and effective economic management can have a dramatic influence on farm earnings. As is commonly accepted, weather, changing political conditions, government policy and international exchange rates, weigh heavily on sector returns. Farm Income Terminology Farm cash receipts
----------------------------
measure gross revenue of farm businesses and include revenues from sales of crops and livestock products, program payments from government agencies and payments from private agricultural insurance programs
Market receipts
----------------------------
Include the market sales of crops and livestock products
Farm operating expenses
----------------------------
represent business costs incurred by farm businesses for goods and services used in the production of agricultural commodities
Realized net income
-- -- -- -- -- --
includes net cash income minus depreciation plus income-in-kind. It represents the cash and non-cash financial flows that are attributable to the farm business and does not include changes in stocks
Total net income
----------------------------
includes return to owner's equity, unpaid labour, management, risk and accounts for changes in the total value of inventories
Total payments
----------------------------
Includes government/producer funded program payments

23
The following chart shows average net farm operating income by farm type, defined as market receipts including program payments less operating expenses. It provides insight into sectors within agriculture in Manitoba that hold the greatest potential for profitability. Gains in the potato sector contrast with the cattle industry, the latter of which has the lowest average net operating income of all sectors. This assessment needs to be viewed in context in that the number of enterprises in each category will vary considerably as well as variability for entry into that sector by farmers.
(100,000)
-
100,000
200,000
300,000
400,000
500,000
600,000
Gra
ins
& o
ilse
eds
Po
tato
Gre
enh
ou
se
Oth
er C
rop
s
Cat
tle
Dai
ry
Ho
gs
Po
ult
ry a
nd
eg
gs
Oth
er L
ives
tock
All
farm
s
DO
LL
AR
S
FARM TYPE
Net Farm Operating Income by Farm Type(average per farm) Manitoba, 2007 - 2011
2007 2008 2009 2010 2011
Industry Intelligence Section, MAFRISource: Statistics Canada, AAFC, MAFRI The hog sector is the second most significant industry in the province when viewed on a net farm operating income basis. Within that sector, 2010 recorded considerable increase in net farm income in contrast to 2011 which shows a negative position. The grain and oilseed sector has demonstrated a relatively steady income over the last 3 year period. The high returns in some other sectors relative to grains and oilseeds is reflective of commodity prices for that particular product rather than a measure of enterprise efficiency. With improving market receipts, program payments trend downwards whereas off-farm income revenues have a slight upward trend as farm families continue to improve their economic well-being by supplementing their revenues through non-farm activities. Off-farm income, as a portion of total farm income is most significant for smaller enterprises. Seasonality of farm production also factors into the ability to generate off-farm income. The importance of program payments and non-farm income to farm operations in Manitoba is especially apparent in years when the combined revenues from both of these forms of non-farm income can exceed revenues achieved from net market receipts.

24
FARM OPERATING EXPENSES Net farm operating costs in 2011 were estimated at $3.9 billion, up 5.0% from $3.7 billion the previous year. Although interest costs remained historically low and the prime business rate charged by major banks averaged 3%, interest on debt was $251 million in 2011, up 6.4% from 236 million one year earlier. Property taxes were $85 million in 2011, an increase of 7.3% from $79 million in 2010. Farm fertilizer expenses were estimated at $622 million in 2011, an increase of 15.7% from $537 million in 2010; prices were driven upward in response to high energy costs and strong worldwide demand. Although pesticide usage levels did not change significantly, there was a general decline in pesticide expenses since glyphosate has come off patent protection and pricing reflects a more competitive market. 2011 pesticide expenditures were $263 million, down 16.3% from $314 million the previous year. Machinery and heating fuel expenses in 2011 reached $316 million, up 11.2% from $286 million in 2010. Fuel expenses rose as fuel prices went up 25% due to growing energy demand in emerging economies and slowing growth in supply. This was offset to some degree as the large area of unseeded acreage had a dampening effect on quantities purchased. Commercial feed expenses were $570 million in 2011, an increase of 15.4% from $494 million in 2010 as a result of higher grain and oilseed costs. Seed expenses were $200 million in 2011, down 2.3% from $204 million the previous year.
0
100,000
200,000
300,000
400,000
500,000
600,000
700,000
2000 2001 2002 2003 2004 2005 2006 2007 2008 2009 2010 2011
TH
OU
SA
ND
S O
F D
OL
LA
RS
YEAR
Farm Operating Expenses and Depreciation, 2000 - 2011Machinery Operation & Heating Fuel Depreciation, Bldgs. & Machinery Interest on Debt
Property Taxes Cash Wages Commercial Feed
Commercial Seed Fertilizer and Lime Pesticides
Industry Intelligence Section, MAFRI
25
MANITOBA OUTLOOK 2012 Preliminary forecasts for 2012 suggest an improvement in total net income, projected to reach $521 million as Manitoba producers build up inventories. Grain and oilseed supplies are expected to be more abundant on world markets and domestic cattle and hog herds are expected to stabilize. Expenses will continue to rise, but more slowly as there are no cost spikes anticipated such as the one for fertilizer in 2011. Crop receipts are projected at $2.3 billion as better prices for grains and oilseeds are anticipated to continue in 2012. Internationally, grain and oilseed prices are expected to be lower, although historically very high, as improved harvests loosen the supply-demand situation. Domestically, crop production is expected to increase as acreage affected by excess moisture is brought back into full production. With relatively favourable growing conditions on the Prairies this year, canola will likely emerge as a $10 million crop with record output and prices in 2012-13. Record corn prices due to dry conditions in Ontario and the United States will squeeze profit margins of livestock producers in both Canada and the United States. This will limit herd rebuilding and increase consumer prices for red meat products in the second half of 2012 and first part of 2013. Livestock receipts in 2012 are forecast at $1.9 billion as strong livestock prices are expected to continue. Cattle and hog herd numbers are projected to stabilize and both sectors will continue face challenges associated with high feed costs and the strong Canadian dollar. Strong cattle demand in the U.S. is expected to carry into 2012 along with tight supplies, which will push prices up. Canadian cattle prices are projected to increase modestly given the strong dollar while marketings are expected to remain stable. Market receipts for cattle and calves, driven by price are anticipated to outpace higher expenses. As the hog sector faces the additional challenge of uncertainty surrounding future demand for pork, hog farm income is forecast to be down from 2011 and the largest factor is expected to be increase in expenses. Dairy farm average net operating income is projected to increase as increased market receipts more than offset growth in expenses. Poultry and egg farms are expected to increase from the previous year due to growth in market receipts outpacing rising expenses. Total farm operating expenses are anticipated to return to their normal historic upward trend, climbing to $4.1 billion in 2012, mainly due to costs related to field crops such as interest expenses and fertilizer. Although interest costs will remain low by historical standards, the prime business rate charged by the major banks in Canada is expected to be 3.3% on average in 2012. Fertilizer prices are forecast to climb modestly in 2012 as expected high levels of crop planting, particularly in China, India and Brazil contribute toward maintaining a tight global fertilizer supply and demand balance. Overall, the increase in operating expenses is expected to be rather broad-based, with no significant price surges for particular inputs. With regard to quantities purchased, crop-related inputs such as fertilizer, fuel, pesticides and seed are expected to return to normal levels in 2012 as the large area of unseeded acreage in 2011 returns to production.

26
Program payments in 2012 are estimated at $424 million. The biggest factor in this forecast decline is the absence of an AgriRecovery program, such as the excess moisture payments that took place in 2011; another factor is the decline in AgriStability payments in calendar year 2012. Compared to the previous year, the outlook projected for 2012 indicates restored total net income but a reduction in net cash income to $608 million and a drop in realized net income to $21 million. Both these values reflect structural changes in the livestock sector and the associated impact on income, a return to more normal inventory volumes for grains and oilseeds, an increase in expenditures and depreciation charges. Overall long term trends include greater world-wide demand for feed grains, rising prices for crude oil, the strength of the Canadian dollar and Canada’s population growth of 1.2% per year with its implications for increased domestic food demand.
0
2,000
4,000
6,000
8,000
10,000
12,000
14,000
16,000
18,000
20,000
2000
2001
2002
2003
2004
2005
2006
2007
2008
2009
2010
2011
MIL
LIO
NS
OF
DO
LL
AR
S
YEAR
Value of Farm Capital in Manitoba2000 - 2011
LAND AND BUILDINGS EQUIPMENT LIVESTOCK
Industry Intelligence Section, MAFRISource: Statistics Canada As farms become larger, their capital value moves higher. The continuous trend to fewer numbers of larger, more capital-intensive farms is driven by the need for farm operations to capture economies of specialization and size. In 2006 and 2007, farm land values recorded a dramatic increase, reflective of the overall appreciation of land values in North America. Farm land and buildings account for the largest portion of capital. Farm machinery and equipment have shown a stable, modest growth over time, driven in part by the need for larger, more technologically complex equipment.

27
Livestock values peaked in 2001 at $1.9 billion and fell dramatically in 2003 to $1.4 billion in response to the BSE issue. Livestock value trended downwards due to decreases in hog values/numbers and continued weakness in the cattle/calf sector. The total value of farm capital has increased from $14.9 billion in 2000 to and estimated $23.5 billion in 2011. On average, Manitoba farms have low debt to asset ratios reflecting the fact that a large portion of the wealth of farmers is contained in the land asset. The difficulty with this situation is that land, which has appreciated over time and represents the bulk of the wealth of producers, is not easily liquidated. This has implications in terms of the year to year operations of the farm enterprise and the constant need for debt financing of operating costs. As farms get larger, a strong asset position will become increasingly more important as it will allow producers to leverage assets to debt financing at higher levels in support to these type of enterprises. The ratio of farm equity to total assets is currently 80% and has ranged between 77 and 82% over the last 10 years. In general, highly capitalized industries such as the hog sector and the potato sector have recorded larger capital investments per farm relative to grain enterprises and cattle operations.
0
200,000
400,000
600,000
800,000
1,000,000
1,200,000
1,400,000
1,600,000
1,800,000
2,000,000
2000 2001 2002 2003 2004 2005 2006 2007 2008 2009 2010 2011f
DO
LL
AR
S P
ER
FA
RM
YEAR
Average Farm Assets, Liabilities, Net Worth in Manitoba2000 - 2011
Total Assets Net Worth Total Liabilities
Industry Intelligence Section, MAFRISource: Statistics Canada, AAFC, MAFRI The Chartered Banks continue to be the major source of debt financing for Manitoba farms accounting for $2.3 billion in 2011 while Credit Unions are the second largest lender in rural Manitoba with $2.1 billion outstanding. The current trend suggests a constriction in chartered bank lending partially in response to global and national economic conditions. In contrast, Credit Unions, which tend to be community oriented, have shown a steady increase in debt financing for Manitoba farm operations.

28
Provincial government program funding, which by nature, tends to assume a higher level of risk, remains relatively stable as the sixth largest source of funding for farm enterprises in the province. Federal government funding, the third largest funding agency in the province, has demonstrated a slow, gladual growth in outstanding farm debt.
0
500,000
1,000,000
1,500,000
2,000,000
2,500,000
2000 2001 2002 2003 2004 2005 2006 2007 2008 2009 2010 2011
INS
TIT
UT
ION
YEAR
Outstanding Farm Debt, 2000 - 2011Chartered Banks Federal Gov't Agencies Provincial Gov't Agencies
Credit Unions Insurance, Trust, Loan Companies Private Individuals & Others
Advance Payment Programs
Industry Intelligence Section, MAFRISource: Statistics Canada
0.0
0.1
0.2
0.3
0.4
0.5
0.6
0.7
0.8
0.9
1.0
2000 2001 2002 2003 2004 2005 2006 2007 2008 2009 2010 2011f
EQ
UIT
Y R
AT
IO
YEAR
Manitoba Farm Equity to Total Assets Ratio2000 - 2011
Industry Intelligence Section, MAFRISource: Statistics Canada, AAFC, MAFRI
29
AGRI-FOOD TRADE Manitoba provides a gateway to key exports markets. Given its strategic location at the centre of North America, Manitoba is a natural transportation and distribution axis for the entire mid-continent. The province forms the northern end of a major trade corridor extending through the Midwest U.S. to Mexico, and potentially further south to the emerging markets of Latin America. Well-developed air, rail and road links make Manitoba a hub for the flow of goods destined for markets in North America, Europe and Asia. With its relatively small population, Manitoba has always looked to export markets for growth -- a tradition that stands the province in good stead as markets become more global in nature. The province is the most diversified manufacturing centre in North America, with a strong presence in industries such as farm equipment and machinery, apparel, food processing, bus manufacturing, building products and aerospace. During the past decade, Manitoba manufacturing companies have rapidly increased production and export sales. Other important industries in the province are tourism and business services. Manitoba businesses are also pursuing opportunities in knowledge-driven fields such as information technology, health care products and services, aerospace and telecommunications. Annual exports from the province in 2011 reached more than $11.8 billion, including agri-food exports of more than $4.3 billion. Manitoba acts as a "supermarket to the world," exporting agri-food products around the globe. Agri-food exports are among the largest single sources of foreign exchange earnings in Manitoba with shipments to over 180 countries. The United States is Manitoba's most important trading partner, accounting for close to $1.9 billion of agri-food products in 2011, followed by approximately $484 million of agri-food exports shipped to Japan, $241 million to Mexico and $385 million to China. Wheat is Manitoba's top agri-food export. At a minimum, the province's wheat exports account for 23 per cent of the province's agri-food and fish exports. Unprocessed wheat is exported to more than 70 countries, but the primary importers are the U.S., Iran, Japan and Mexico. Varieties of grains and pulses exported from the province include barley and oats, peas, beans, flax, lucerne (alfalfa) and grasses. Canola seed, used for oil extraction in international markets, is the province's second-largest agri-food export and represents 18 per cent of provincial exports. Following canola seed is canola oil and its fractions that account for 10 per cent of exports. The oil is used in many applications, such as margarine, and as a cooking oil or as a food ingredient or a raw material for biodiesel. Potatoes are Manitoba's fourth-largest agri-food export, and the province is Canada's second-largest potato producer after Prince Edward Island. The versatile potato finds its way into many products, including alcohol, starches, pharmaceuticals and biodegradable plastics.
30
The sole Canadian manufacturer of food-grade potato starch is in Manitoba. The company processes its starch from product recovered from local potato processing operations, to be used as a natural thickener in the production of snack foods, processed meats, baked goods, noodles, pet foods, shredded cheese, sauces, gravies and soups. Potato starches are also used as additives in cosmetics and pharmaceuticals. Manitoba’s commercial fishing industry is well-known for walleye (pickerel) and sauger, which are the most sought-after species in the province's commercial fishery and account for about 33 per cent of Canada's annual commercial catch of freshwater fish. The Manitoba fishery earns about $25 million in annual export sales. Lake Manitoba, Lake Winnipeg, and Lake Winnipegosis have the largest commercial fisheries. From the time of catch, strict quality control measures apply. The fish are packed in ice and expedited to a modern processing plant in Winnipeg. The Orthodox Union provides onsite rabbinical supervision if Kosher certification is required. The province has more than 40 private-sector companies, employing more than 2,300 people in the life-sciences industry. Manitoba has been recognized internationally as a hub of the knowledge economy and in recent years has been among the fastest-growing life-science economies in Canada. The world economy and demand for agriculture greatly impact Manitoba’s trade situation. The slow economic recovery in the United States and the instability of the European Euro in 2011 are likely to keep the Canadian dollar at par or slightly above the U.S. dollar in 2012. The Canadian dollar averaged US$1.011 in 2011, 4.1% above 2010 and its highest annual average in more than forty years. While the stronger Canadian dollar had a negative impact on agricultural product prices, it also resulted in lower costs for imported farm inputs. It is projected that interest rates in Canada are less likely to increase as long as the United States continues its low interest rate policy in 2012 and longer. In 2012, oil prices started strong and are projected to rise above the 2011 average of US$95 per barrel. U.S. corn and wheat prices were record high in 2011. Despite dampening enthusiasm for ethanol and with a small carry-over, U.S. corn prices set the trend at record levels in 2011/12. In the U.S, competition with corn for land help support soybean, barley, oat, flaxseed and canola prices. According to USDA forecasts for the next 5 years, corn prices are projected to average at or below US$4.50 per bushel due to growth in feed use, exports and demand for corn by ethanol producers. Wheat prices are expected to decline through 2013/14 due to near-term market adjustments and are projected to average about US$6 per bushel for the following 5 years. Estimated price increases for wheat in later years are more moderate than those for corn and soybeans. Current economic prospects suggest that grain prices based on normal yields will be lower in 2012, but still high historically. Given improvements in world demand for beef and pork, raising average U.S. cattle and pig prices in 2011 to record levels, livestock prices are projected to remain high in 2012.

31
0
500
1000
1500
2000
2500
3000
3500
4000
4500
5000
2000 2001 2002 2003 2004 2005 2006 2007 2008 2009 2010 2011
MIL
LIO
N D
OL
LA
RS
YEAR
Total Value of Manitoba Agri-Food Trade - WorldIMPORTS EXPORTS
Industry Intelligence, MAFRISource: Industry Canada, AAFC, MAFRI
0
500
1000
1500
2000
2500
3000
3500
4000
4500
5000
2000 2001 2002 2003 2004 2005 2006 2007 2008 2009 2010 2011
MIL
LIO
N D
OL
LA
RS
YEAR
Total Value of Manitoba Agri-Food Trade - U.S.
IMPORTS EXPORTS
Industry Intelligence, MAFRISource: Industry Canada, AAFC, MAFRI
32
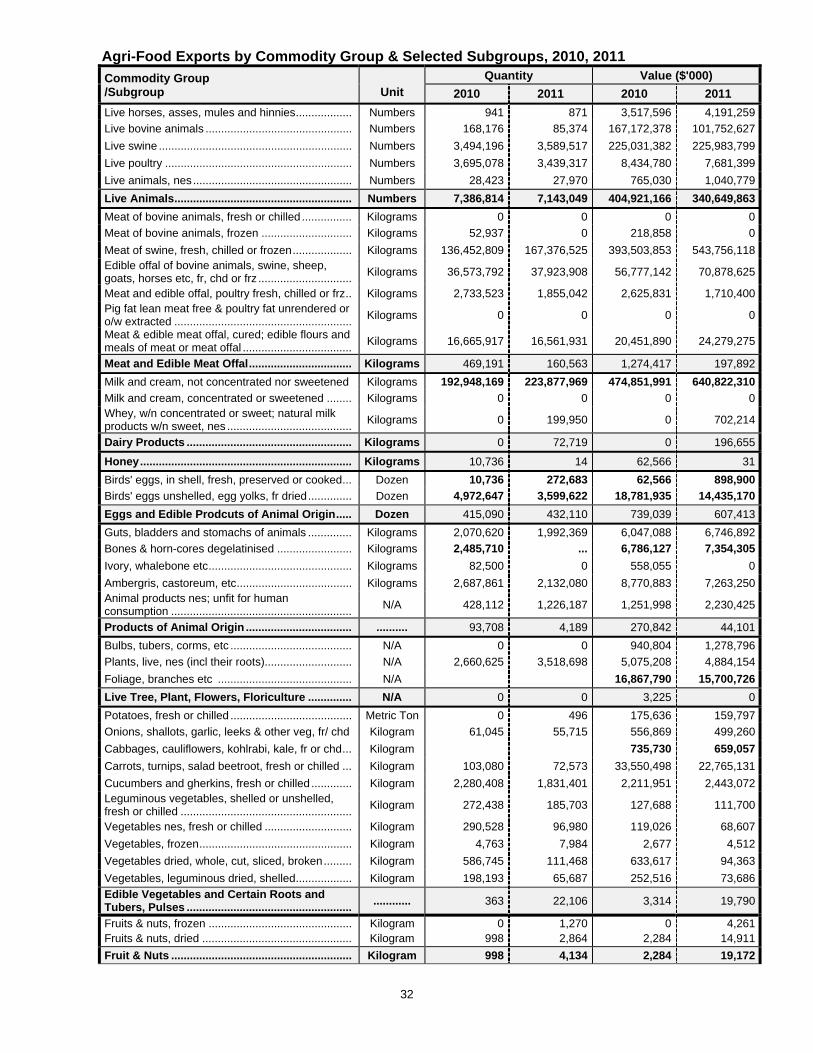
Agri-Food Exports by Commodity Group & Selected Subgroups, 2010, 2011
Commodity Group /Subgroup
Unit
Quantity Value ($'000)
2010 2011 2010 2011
Live horses, asses, mules and hinnies .................. Numbers 941 871 3,517,596 4,191,259
Live bovine animals ............................................... Numbers 168,176 85,374 167,172,378 101,752,627
Live swine .............................................................. Numbers 3,494,196 3,589,517 225,031,382 225,983,799
Live poultry ............................................................ Numbers 3,695,078 3,439,317 8,434,780 7,681,399
Live animals, nes ................................................... Numbers 28,423 27,970 765,030 1,040,779
Live Animals ......................................................... Numbers 7,386,814 7,143,049 404,921,166 340,649,863
Meat of bovine animals, fresh or chilled ................ Kilograms 0 0 0 0
Meat of bovine animals, frozen ............................. Kilograms 52,937 0 218,858 0
Meat of swine, fresh, chilled or frozen ................... Kilograms 136,452,809 167,376,525 393,503,853 543,756,118Edible offal of bovine animals, swine, sheep, goats, horses etc, fr, chd or frz ..............................
Kilograms 36,573,792 37,923,908 56,777,142 70,878,625
Meat and edible offal, poultry fresh, chilled or frz .. Kilograms 2,733,523 1,855,042 2,625,831 1,710,400Pig fat lean meat free & poultry fat unrendered or o/w extracted .........................................................
Kilograms 0 0 0 0
Meat & edible meat offal, cured; edible flours and meals of meat or meat offal ...................................
Kilograms 16,665,917 16,561,931 20,451,890 24,279,275
Meat and Edible Meat Offal ................................. Kilograms 469,191 160,563 1,274,417 197,892
Milk and cream, not concentrated nor sweetened Kilograms 192,948,169 223,877,969 474,851,991 640,822,310
Milk and cream, concentrated or sweetened ........ Kilograms 0 0 0 0Whey, w/n concentrated or sweet; natural milk products w/n sweet, nes ........................................
Kilograms 0 199,950 0 702,214
Dairy Products ..................................................... Kilograms 0 72,719 0 196,655
Honey .................................................................... Kilograms 10,736 14 62,566 31
Birds' eggs, in shell, fresh, preserved or cooked ... Dozen 10,736 272,683 62,566 898,900
Birds' eggs unshelled, egg yolks, fr dried .............. Dozen 4,972,647 3,599,622 18,781,935 14,435,170
Eggs and Edible Prodcuts of Animal Origin ..... Dozen 415,090 432,110 739,039 607,413
Guts, bladders and stomachs of animals .............. Kilograms 2,070,620 1,992,369 6,047,088 6,746,892
Bones & horn-cores degelatinised ........................ Kilograms 2,485,710 ... 6,786,127 7,354,305
Ivory, whalebone etc .............................................. Kilograms 82,500 0 558,055 0
Ambergris, castoreum, etc ..................................... Kilograms 2,687,861 2,132,080 8,770,883 7,263,250Animal products nes; unfit for human consumption ..........................................................
N/A 428,112 1,226,187 1,251,998 2,230,425
Products of Animal Origin .................................. .......... 93,708 4,189 270,842 44,101
Bulbs, tubers, corms, etc ....................................... N/A 0 0 940,804 1,278,796
Plants, live, nes (incl their roots)............................ N/A 2,660,625 3,518,698 5,075,208 4,884,154
Foliage, branches etc ........................................... N/A 16,867,790 15,700,726
Live Tree, Plant, Flowers, Floriculture .............. N/A 0 0 3,225 0
Potatoes, fresh or chilled ....................................... Metric Ton 0 496 175,636 159,797
Onions, shallots, garlic, leeks & other veg, fr/ chd Kilogram 61,045 55,715 556,869 499,260
Cabbages, cauliflowers, kohlrabi, kale, fr or chd ... Kilogram 735,730 659,057
Carrots, turnips, salad beetroot, fresh or chilled ... Kilogram 103,080 72,573 33,550,498 22,765,131
Cucumbers and gherkins, fresh or chilled ............. Kilogram 2,280,408 1,831,401 2,211,951 2,443,072Leguminous vegetables, shelled or unshelled, fresh or chilled .......................................................
Kilogram 272,438 185,703 127,688 111,700
Vegetables nes, fresh or chilled ............................ Kilogram 290,528 96,980 119,026 68,607
Vegetables, frozen ................................................. Kilogram 4,763 7,984 2,677 4,512
Vegetables dried, whole, cut, sliced, broken ......... Kilogram 586,745 111,468 633,617 94,363
Vegetables, leguminous dried, shelled .................. Kilogram 198,193 65,687 252,516 73,686
Edible Vegetables and Certain Roots and Tubers, Pulses .....................................................
............ 363 22,106 3,314 19,790
Fruits & nuts, frozen .............................................. Kilogram 0 1,270 0 4,261Fruits & nuts, dried ................................................ Kilogram 998 2,864 2,284 14,911
Fruit & Nuts .......................................................... Kilogram 998 4,134 2,284 19,172

33
Coffee w/n roast or decaff ..................................... Kilogram 1,946 2,670 18,763 41,704Seeds of anise, badian, fennel, coriander, cumin, caraway or juniper .................................................
Kilogram 437,931 521,899 954,725 969,139
Coffee, Tea, Mate and Spices ............................. Kilogram 439,877 524,569 973,488 1,010,843
Wheat and meslin .................................................. Metric Ton 3,452,529 2,681,082 886,736,957 921,194,871Rye......................................................................... Metric Ton 77,137 55,128 17,267,535 15,775,843
Barley ..................................................................... Metric Ton 189,612 127,307 45,827,520 37,403,703
Oats ....................................................................... Kilogram 513,989,721 536,613,992 111,870,705 137,578,363
Maize (corn) ........................................................... Kilogram 70,995,788 99,825,846 15,182,354 31,354,052
Rice ........................................................................ Kilogram 0 0 0 0
Grain sorghum ....................................................... Kilogram 4,536 17,010 2,534 11,744
Buckwheat, millet and canary seed; other cereals Kilogram 17,605,139 24,161,019 9,730,258 16,786,096
Grains, Bulk or Cereals ....................................... ............ 1,086,617,863 1,160,104,672
Wheat or meslin flour ............................................. Kilogram 5,287,715 4,883,473 3,947,897 3,768,857Cereal flours other than of wheat or meslin........... Kilogram 210,865 211,047 175,208 186,146
Cereal grouts, meal and pellets ............................. Kilogram 86,869,149 88,701,703 35,877,376 44,307,939
Cereal grn o/w worked (ex hulled etc) ................... Kilogram 83,944,768 81,321,936 41,968,533 47,204,349
Flour, meal & pdr of veg ........................................ Kilogram 743,958 1,128,045 825,907 1,204,743
Malt, whether or not roasted .................................. Kilogram 22,611,777 9,066,766 12,747,665 5,554,245
Starches; inulin ...................................................... Kilogram 1,600,956 1,159,085 1,101,263 760,751
Grain Products, Malt, Starches .......................... Kilogram 201,269,188 186,472,055 96,643,849 102,987,030
Soya beans, whether or not broken ...................... Kilogram 337,613,971 355,032,640 126,314,687 171,258,861Linseed, whether or not broken ............................. Kilogram 142,610,828 64,208,428 66,797,032 42,189,618
Rape or colza seeds, whether or not broken......... Kilogram 1,609,158,267 1,320,118,857 732,104,410 768,509,598
Sunflower seeds, whether or not broken ............... Kilogram 44,465,214 41,380,916 32,246,309 32,331,193
Oil seeds and oleaginous frutis nes, w/n broken ... Kilogram 20,703,405 16,335,642 21,370,638 17,869,628
Flour and meals of oil seeds or oleaginous fruits .. Kilogram 3,144,020 10,797,577 1,336,945 3,854,861
Seeds, fruit and spores, for sowing ....................... Kilogram 18,036,916 22,642,003 35,530,963 47,492,887Plants & pts (incl seeds & fruits) for perf, pharm etc, fr, dried ............................................................
Kilogram 2,732 0 12,599 0
Locust beans etc, fr,chd,frz/drd, nes ..................... Kilogram 44,876 80,631 67,362 135,678
Cereal straw & husks, unprepared ........................ Metric Ton 72 901 7,104 117,745Swedes, mangolds, fodder roots, hay, lucerne (alfalfa), clover etc, w/n pellet ................................
Metric Ton 11,237 14,259 2,054,145 2,552,712
Oilseeds, Seeds for Sowing, Fodder ................. ............ 1,017,842,194 1,086,312,781
Lac; natural gums, resins, gum-resins & oleoresins
Kilogram 6,768 0 24,466 0
Vegetable saps & extracts .................................... Kilogram 3,350,573 4,227,816 7,180,145 9,555,713
Lac; Gums, Resins, Saps & Extracts ................. Kilogram 3,357,341 4,227,816 7,204,611 9,555,713
Vegetable products, nes ........................................ N/A 0 0 24,426 35,175Vegetable Plaiting Materials; Other Products .. .......... 24,426 35,175
Pig (incl lard) & poultry fat, rendered ..................... Kilogram 2,209,364 3,934,772 1,235,346 3,495,136Soya-bean oil and its fractions, w/n refined ........... Kilogram 38,179 0 43,476 0Safflower, sunflower or cotton-seed oil & fractions, w/n refined .............................................
Kilogram 822,720 606,700 428,500 303,350
Rape, colza or mustard oil & their fract, w/n ref'd .. Kilogram 291,586,926 306,191,415 284,827,970 396,529,233
Fixed veg fats/oils (incl jojoba oil), fract, w/n ref'd . Kilogram 465,353 811,443 2,101,370 3,580,382
Animal or veg fats, oils & fract, hydrog w/n ref'd ... Kilogram 238,832 214,590 174,350 309,774Margarine; edible mx or prep of animal or veg fats & oils or fractions ...................................................
Kilogram 557,979 218,337 919,910 394,248
Waxes veg (o/t triglycerides) beeswax, insect waxes & spermaceti, w/n ref'd/col .........................
Kilogram 308,212 289,201 1,533,920 1,625,803
Animal - Veg Fats & Oils, Margarine .................. Kilogram 296,227,565 312,266,458 291,264,842 406,237,926
Sausages & sim prod, of meat, meat offal or blood; food prep of these prod...............................
Kilogram 1,845 0 7,353 0
Prepared/preserved meat, meat offal/blood, nes .. Kilogram 13,441 111,587 74,119 448,354Prepared or preserved fish; caviar & caviar subst prepared from fish eggs .........................................
Kilogram 197,627 319,650 1,828,388 2,539,554
Preparations of Meat ........................................... Kilogram 212,913 431,237 1,909,860 2,987,908

34
Sugars, nes ............................................................ Kilogram 8,673 0 4,250 0Sugar confectionery (cntg white choc), not containing cocoa ....................................................
Kilogram 477,891 415,926 2,061,587 1,850,269
Sugars and Sugar Confectionery ...................... Kilogram 2,065,837 1,850,269
Chocolate and other food preparations incl cocoa Kilogram 47,752 31,853 210,352 208,919
Cocoa and Cocoa Preparations ......................... Kilogram 210,352 208,919
Malt extract; food prep of flour ............................... Kilogram 1,273,941 1,158,909 2,881,851 3,165,750
Pasta w/n cooked/stuffed, o/w prep ...................... Kilogram 654 618 648 3,011
Bread, pastry etc w/n cntg cocoa .......................... Kilogram 1,016,550 3,953,171 3,970,660 13,043,775
Preparations of Grains, Pasta ............................ Kilogram 2,291,145 5,112,698 6,853,159 16,212,536
Vegetables nes, prep or presv, frozen .................. Kilogram 337,520,692 203,645,480 300,889,824 169,937,372
Vegetables nes, prep or presv, not frozen ............ Kilogram 167,281 245,158 704,360 1,060,301Jams, fruit jellies, marmalades, fruit or nut purée & pastes, ckd, w/n sweetened ...............................
Kilogram 0 0 0 0
Fruits, nuts & edible pts of plants o/w prep or presv w/n sweetened, nes .....................................
Kilogram 9,510 39,385 37,869 132,989
Preparatons of Vegetables, Fruit & Nuts .......... Kilogram 337,697,483 203,930,023 301,632,053 171,130,662
Sauces & prep nes ................................................ Kilogram 320,686 298,956 563,977 386,307
Soups, broths & prep thereof ................................. Kilogram 16,480 0 65,531 0
Ice cream and other edible ice w/n ctng cocoa Kilogram 55 0 213 0
Food preparations, nes .......................................... Kilogram 2,777,345 186,504 6,093,615 1,831,163
Miscellaneous Edible Preparations ................... Kilogram 3,114,566 485,460 6,723,336 2,217,470
Waters, incl nat or arti min or aerated waters........ Liter 1,752,160 3,919,000 455,034 688,717
Waters, min or aerated, sweet or flav, nonalc bev Liter 301,402 101,956 631,187 149,678
Beer made from malt ............................................. Liter 0 0 0 0
Wine of fresh grapes, incl fortified ......................... Liter 0 0 0 0
Spirits liqueurs & other spirit beverages ................ Liter 3,554,465 368,699 3,031,318 389,483
Beverages, Spirits and Vinegar ......................... Liter 5,608,027 4,389,655 4,117,539 1,227,878
Flours etc of meat, meat offal, fish, crustaceans etc unfit for human cons; greaves .........................
Kilogram 9,563,000 7,817,000 3,493,403 3,229,338
Bran, sharps etc w/n pellet .................................... Kilogram 3,609,037 5,192,131 1,447,469 1,819,461
Starch & sim residues, beet-pulp etc ..................... Kilogram 50,000 22,000 8,184 3,824
Soya-bean oil-cake and other solid residues ........ Kilogram 0 0 0 0
Oil-cake nes ........................................................... Kilogram 330,434,118 328,991,964 71,651,541 79,166,989
Vegetable mat, waste, residues & by-prod nes ..... Kilogram 507,374 1,964,428 134,086 442,224
Animal feed preparations, nes ............................... Kilogram 33,655,509 14,596,155 12,432,264 11,634,876
Food Industry Residues & Waste, Prepared Fodder ...................................................................
Kilogram 377,819,038 358,583,678 89,166,947 96,296,712
Essential Oils ....................................................... Kilogram 0 0 0 0
Albumins, albuminates & other albumin derivs ..... Kilogram 2,045,819 573,708 6,507,156 1,904,579Peptones & derivs; protein substances & derivs, nes; hide powder ...................................................
Kilogram 231,345 222,137 657,160 629,971
Dextrins & other mod starches; glues based on starches, dextrins or other mod starches ..............
Kilogram 0 0 0 0
Caseins & Albumins ............................................ Kilogram 2,277,164 795,845 7,164,316 2,534,550
Raw hides & skins of bov or equ animals .............. Number 16 26,014 696 195,428Raw hides & skins of sheep or lambs w/n with woollen or split ......................................................
Number 103 0 321 0
Raw hides & skins nes, w/n dehaired or split ....... Number 12,151 15,747 244,003 359,680
Raw Hides, Skins ................................................. Number 12,270 41,761 245,020 555,108
Raw furskins & pieces suitable for furriers’ use Number 10,803 52,694 119,981 1,211,091Furskins ................................................................ Number 10,803 52,694 119,981 1,211,091
Flax, raw or processed not spun; flax tow & waste Kilogram 17,643,712 21,352,656 8,297,275 9,975,225True hemp (Cannabis sativa L), raw or processed, not spun; tow & waste of true hemp ...
Kilogram 4,500 11,659 1,184 6,631
Other Textile Fibers ............................................. Kilogram 17,648,212 21,364,315 8,298,459 9,981,856
Fish and Crustaceans ......................................... ............ 52,795,232 51,672,663
TOTAL EXPORTS................................................. ............ 4,063,042,219 4,300,958,667
35
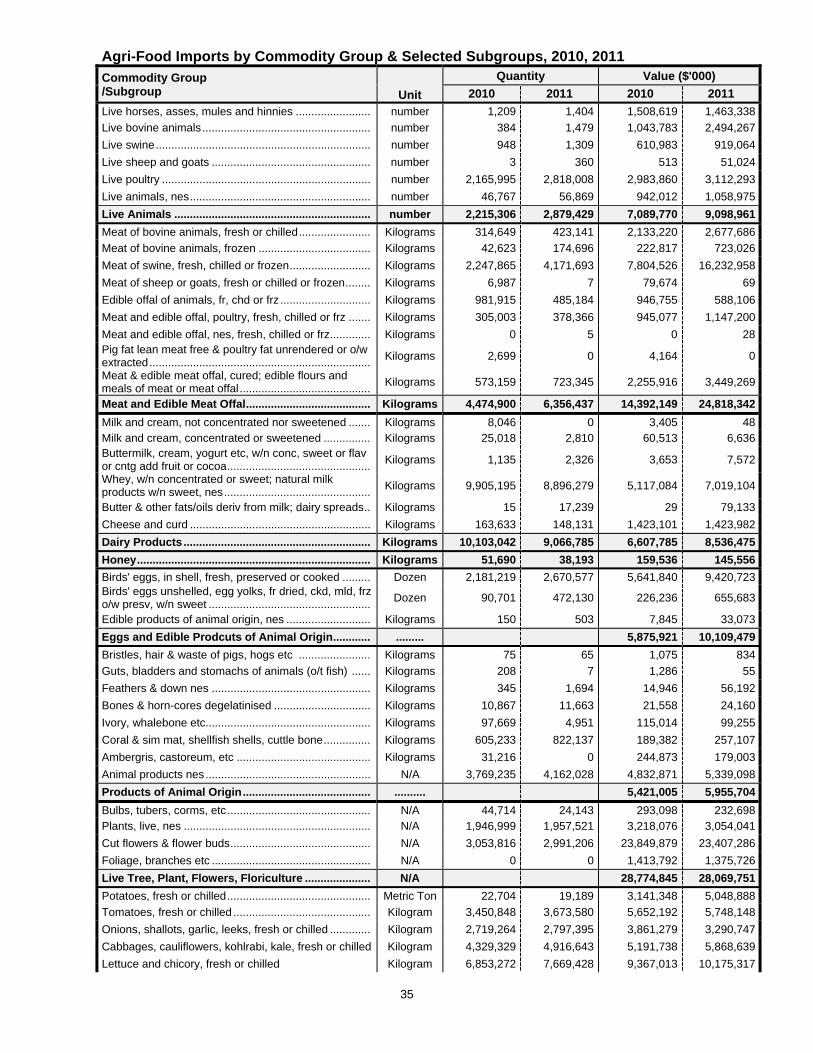
Agri-Food Imports by Commodity Group & Selected Subgroups, 2010, 2011
Commodity Group /Subgroup
Unit
Quantity Value ($'000)
2010 2011 2010 2011
Live horses, asses, mules and hinnies ........................ number 1,209 1,404 1,508,619 1,463,338
Live bovine animals ...................................................... number 384 1,479 1,043,783 2,494,267
Live swine ..................................................................... number 948 1,309 610,983 919,064
Live sheep and goats ................................................... number 3 360 513 51,024
Live poultry ................................................................... number 2,165,995 2,818,008 2,983,860 3,112,293
Live animals, nes .......................................................... number 46,767 56,869 942,012 1,058,975
Live Animals ............................................................... number 2,215,306 2,879,429 7,089,770 9,098,961
Meat of bovine animals, fresh or chilled ....................... Kilograms 314,649 423,141 2,133,220 2,677,686
Meat of bovine animals, frozen .................................... Kilograms 42,623 174,696 222,817 723,026
Meat of swine, fresh, chilled or frozen .......................... Kilograms 2,247,865 4,171,693 7,804,526 16,232,958
Meat of sheep or goats, fresh or chilled or frozen ........ Kilograms 6,987 7 79,674 69
Edible offal of animals, fr, chd or frz ............................. Kilograms 981,915 485,184 946,755 588,106
Meat and edible offal, poultry, fresh, chilled or frz ....... Kilograms 305,003 378,366 945,077 1,147,200
Meat and edible offal, nes, fresh, chilled or frz ............. Kilograms 0 5 0 28Pig fat lean meat free & poultry fat unrendered or o/w extracted .......................................................................
Kilograms 2,699 0 4,164 0
Meat & edible meat offal, cured; edible flours and meals of meat or meat offal ..........................................
Kilograms 573,159 723,345 2,255,916 3,449,269
Meat and Edible Meat Offal ........................................ Kilograms 4,474,900 6,356,437 14,392,149 24,818,342
Milk and cream, not concentrated nor sweetened ....... Kilograms 8,046 0 3,405 48Milk and cream, concentrated or sweetened ............... Kilograms 25,018 2,810 60,513 6,636Buttermilk, cream, yogurt etc, w/n conc, sweet or flav or cntg add fruit or cocoa ..............................................
Kilograms 1,135 2,326 3,653 7,572
Whey, w/n concentrated or sweet; natural milk products w/n sweet, nes ...............................................
Kilograms 9,905,195 8,896,279 5,117,084 7,019,104
Butter & other fats/oils deriv from milk; dairy spreads .. Kilograms 15 17,239 29 79,133
Cheese and curd .......................................................... Kilograms 163,633 148,131 1,423,101 1,423,982
Dairy Products ............................................................ Kilograms 10,103,042 9,066,785 6,607,785 8,536,475
Honey ........................................................................... Kilograms 51,690 38,193 159,536 145,556
Birds' eggs, in shell, fresh, preserved or cooked ......... Dozen 2,181,219 2,670,577 5,641,840 9,420,723Birds' eggs unshelled, egg yolks, fr dried, ckd, mld, frz o/w presv, w/n sweet ....................................................
Dozen 90,701 472,130 226,236 655,683
Edible products of animal origin, nes ........................... Kilograms 150 503 7,845 33,073
Eggs and Edible Prodcuts of Animal Origin ............ ......... 5,875,921 10,109,479
Bristles, hair & waste of pigs, hogs etc ....................... Kilograms 75 65 1,075 834
Guts, bladders and stomachs of animals (o/t fish) ...... Kilograms 208 7 1,286 55
Feathers & down nes ................................................... Kilograms 345 1,694 14,946 56,192
Bones & horn-cores degelatinised ............................... Kilograms 10,867 11,663 21,558 24,160
Ivory, whalebone etc..................................................... Kilograms 97,669 4,951 115,014 99,255
Coral & sim mat, shellfish shells, cuttle bone ............... Kilograms 605,233 822,137 189,382 257,107
Ambergris, castoreum, etc ........................................... Kilograms 31,216 0 244,873 179,003
Animal products nes ..................................................... N/A 3,769,235 4,162,028 4,832,871 5,339,098
Products of Animal Origin ......................................... .......... 5,421,005 5,955,704
Bulbs, tubers, corms, etc .............................................. N/A 44,714 24,143 293,098 232,698Plants, live, nes ............................................................ N/A 1,946,999 1,957,521 3,218,076 3,054,041
Cut flowers & flower buds ............................................. N/A 3,053,816 2,991,206 23,849,879 23,407,286
Foliage, branches etc ................................................... N/A 0 0 1,413,792 1,375,726
Live Tree, Plant, Flowers, Floriculture ..................... N/A 28,774,845 28,069,751
Potatoes, fresh or chilled .............................................. Metric Ton 22,704 19,189 3,141,348 5,048,888
Tomatoes, fresh or chilled ............................................ Kilogram 3,450,848 3,673,580 5,652,192 5,748,148
Onions, shallots, garlic, leeks, fresh or chilled ............. Kilogram 2,719,264 2,797,395 3,861,279 3,290,747
Cabbages, cauliflowers, kohlrabi, kale, fresh or chilled Kilogram 4,329,329 4,916,643 5,191,738 5,868,639
Lettuce and chicory, fresh or chilled Kilogram 6,853,272 7,669,428 9,367,013 10,175,317
36
Commodity Group /Subgroup
Unit
Quantity Value ($'000)
2010 2011 2010 2011
Carrots, turnips, salad beetroot, fresh or chilled .......... Kilogram 1,709,163 2,554,683 2,116,015 2,964,305
Cucumbers and gherkins, fresh or chilled .................... Kilogram 504,837 594,780 911,666 951,337
Leguminous vegetables, shelled/unshelled, fr or chld . Kilogram 380,582 602,775 1,603,967 2,193,441
Vegetables nes, fresh or chilled ................................... Kilogram 9,073,576 10,121,336 12,953,332 14,547,141
Vegetables (uncooked or cooked), frozen Kilogram 91,482 319,503 158,165 816,725Vegetables provisionally preserved but not suitable for immediate consumption ..........................................
Kilogram 135 556 182 688
Vegetables dried, whole, cut, sliced, broken or in pdr, but not further prepr ......................................................
Kilogram 197,202 277,364 1,028,811 1,276,054
Vegs, leguminous dried, shelled w/n skinned or split .. Kilogram 39,781,819 24,023,618 14,513,972 11,356,976
Manioc, arrowroot, salep, etc; sago pitch ..................... Kilogram 948,102 1,222,484 1,047,030 1,141,305
Edible Vegetables and Certain Roots and Tubers, Pulses ..........................................................................
............ 61,546,710 65,379,711
Coconuts, Brazil nuts and cashew nuts, fresh or dried w/n shelled or peeled ...................................................
Kilogram 110,997 116,956 162,776 245,705
Nuts nes, fresh or dried, w/n shelled or peeled ............ Kilogram 176,704 132,660 1,903,005 1,694,585
Bananas, including plantains, fresh or dried ................ Kilogram 21,629,319 17,886,341 15,556,490 13,989,851Dates, figs, pineapples, avocadoes, guavas, mangoes & mangosteens, fr or dried ...........................
Kilogram 2,462,719 4,318,363 3,868,553 5,162,519
Citrus fruit, fresh or dried .............................................. Kilogram 5,136,273 6,215,672 4,986,386 5,464,082
Grapes, fresh or dried .................................................. Kilogram 3,300,406 4,574,166 8,597,880 11,072,156
Melons & papaws (papayas), fresh .............................. Kilogram 7,671,182 8,320,683 5,528,384 5,795,014
Apples, pears and quinces, fresh ................................. Kilogram 1,036,627 740,556 1,338,665 1,004,332Apricots, cherries, peaches, nectarines, plums & sloes, fresh ...................................................................
Kilogram 1,356,565 1,378,390 3,686,715 3,145,401
Fruits nes, fresh ............................................................ Kilogram 3,219,707 4,629,154 10,632,372 14,802,408
Fruits & nuts, frozen, w/n sweetened ........................... Kilogram 97,384 37,232 221,922 78,391
Fruits & nuts prov presv, unfit for imm consumption .... Kilogram 76 288 235 952
Fruit, dried mix of nuts or dried fruits ............................ Kilogram 91,677 71,606 388,913 344,889
Peel of citrus fruit/melons fr, frz, dried or prov presvd . Kilogram 319 314 4,473 565
Fruit & Nuts ................................................................. Kilogram 46,289,955 48,422,381 56,876,769 62,800,850
Coffee w/n roast or decaff ............................................ Kilogram 3,059,349 1,726,184 11,772,938 11,449,276
Tea ................................................................................ Kilogram 26,587 94,887 294,040 482,927
Maté .............................................................................. Kilogram 12,296 31,671 24,427 95,761
Pepper of the genus Piper; dried, crus or grd fruit ....... Kilogram 28,265 48,849 170,962 190,720
Vanilla ........................................................................... Kilogram 1,175 2,786 22,828 27,534
Cinnamon and cinnamon-tree flowers ......................... Kilogram 6,972 5,750 36,601 26,298
Cloves (whole fruit, cloves and stems) ......................... Kilogram 507 324 2,159 1,640
Nutmeg, mace and cardamons .................................... Kilogram 736 600 12,144 8,216Seeds of anise, badian, fennel, coriander, cumin, caraway or juniper ........................................................
Kilogram 4,272 6,293 10,834 22,396
Ginger, saffron, turmeric, thyme, bay leaves, curry etc Kilogram 67,736 58,064 407,322 273,358
Coffee, Tea, Mate and Spices .................................... Kilogram 3,207,895 1,975,408 12,754,255 12,578,126
Wheat and meslin ......................................................... Metric Ton 898 867 352,122 401,739
Rye ............................................................................... Metric Ton 0 47 0 12,167
Barley............................................................................ Metric Ton 5,398 16,200 949,179 4,412,279
Oats .............................................................................. Kilogram 5,646 1,587 1,115,907 423,390
Maize (corn) .................................................................. Kilogram 487,728 255,002 70,076,804 55,436,090
Rice ............................................................................... Kilogram 2,950 4,660 2,331,708 2,820,392
Grain sorghum .............................................................. Kilogram 315 208 57,323 57,060
Buckwheat, millet and canary seed; other cereals ....... Kilogram 4,337,381 5,060,042 1,224,969 1,913,511
Grains, Bulk or Cereals .............................................. ............ 76,108,012 65,476,628
Wheat or meslin flour.................................................... Kilogram 1,486 1,363 587,527 641,643
Cereal flours other than of wheat or meslin ................. Kilogram 592,233 563,032 674,173 805,323
Cereal grouts, meal and pellets .................................... Kilogram 5,086 5,831 2,229,952 1,565,944

37
Commodity Group /Subgroup
Unit
Quantity Value ($'000)
2010 2011 2010 2011
Cereal grn o/w worked, exc rice hd .............................. Kilogram 2,949,314 401,896 726,666 367,172
Flour, meal, pdr, flakes, gran, pellets of potatoes ........ Kilogram 18,047 220,314 49,142 235,981
Flour, meal & pdr of veg roots ...................................... Kilogram 525,420 697,197 193,991 252,516
Malt, whether or not roasted ......................................... Kilogram 32,603 17,991 43,565 32,249
Starches; inulin ............................................................. Kilogram 1,233,099 1,449,926 656,116 1,083,439
Wheat gluten, whether or not dried .............................. Kilogram 7 19,852 29,764 242,082
Grain Products, Malt, Starches ................................. Kilogram 5,357,295 3,377,402 5,190,896 5,226,349
Soya beans, whether or not broken ............................. Kilogram 2,824,374 3,745,345 3,243,661 4,613,776Ground-nuts, not roasted or cooked, w/n shld/broken . Kilogram 555,062 523,772 680,756 738,267
Linseed, whether or not broken .................................... Kilogram 2,819 4,278 1,658,288 3,113,209
Rape or colza seeds, whether or not broken ............... Kilogram 119,269,500 97,345,916 54,859,198 55,305,173
Sunflower seeds, whether or not broken ...................... Kilogram 14,955,655 18,322,870 12,300,237 14,933,088
Oil seeds and oleaginous frutis nes, w/n broken ......... Kilogram 1,440,890 1,930,134 1,221,859 1,761,071
Flour/meals of oilseeds/oleaginous fruits o/t mustard .. Kilogram 4,174,500 4,612,601 1,755,149 2,414,112
Seeds, fruit and spores, for sowing .............................. Kilogram 2,859,035 4,769,157 8,332,036 10,039,270
Hop cones, fr/drd w/n ground, pwd or pelleted; lupulin Kilogram 1,718 1,788 47,181 26,255
Plants & pts (incl seeds & fruits) for perf, pharm etc Kilogram 311,002 154,940 707,354 775,979Locust beans etc, fr, chd, frz/drd, nes; fruit stones, vegetable prod, nes, for hum cons ...............................
Kilogram 91,365 111,047 97,838 225,565
Cereal straw & husks, unprepared, w/n chopped, ground or pressed or pelleted ......................................
Metric Ton 1,279 5,839 119,777 536,016
Swedes, mangolds, fodder roots, hay, lucerne (alfalfa), clover etc, w/n pellet .......................................
Metric Ton 1,646 1,347 103,691 96,549
Oilseeds, Seeds for Sowing, Fodder ........................ ............ 85,127,025 94,578,330
Lac; natural gums, resins, gum-resins & oleoresins .... Kilogram 7,123 10,295 134,008 77,942Veg saps & extracts...................................................... Kilogram 474,425 1,657,556 2,801,822 8,286,926
Lac; Gums, Resins & Vegetable Saps & Extracts ... Kilogram 481,548 1,667,851 2,935,830 8,364,868
Vegetable mat for plait ................................................. N/A 0 0 16,616 10,352Vegetable products, nes ............................................... N/A 260,316 249,707 606,504 871,455
Vegetable Plaiting Materials; Other Products ......... .......... 623,120 881,807
Pig (incl lard) & poultry fat, rendered ............................ Kilogram 15,926 91,411 30,668 130,307Bovine, sheep & goat fats ............................................ Kilogram 201,204 72,950 195,401 105,046Lard stearin & oil, oleostearin & oil & tallow oil not emulsifd/mxd or o/w prepr
Kilogram 0 108 0 65
Fish or marine mammals, fats, oils & fract, w/n ref'd ... Kilogram 116,150 81,876 999,863 356,711
Wool grease and fatty substances derived .................. Kilogram 0 0 0 0
Animal fats & oils & fractions, w/n refined .................... Kilogram 1,212 618 921 470
Soya-bean oil and fractions, w/n refined ...................... Kilogram 5,830,711 5,857,617 6,595,644 8,092,865
Ground-nut oil and fractions, w/n refined ..................... Kilogram 11,901 18,132 24,962 46,056
Olive oil and fractions, w/n refined ............................... Kilogram 151,214 161,021 569,175 779,856
Oils & fract nes, w/n ref'd, incl blends .......................... Kilogram 0 5 0 10
Palm oil & fraction, w/n refined ..................................... Kilogram 220,223 399,688 279,890 556,860
Safflower, sunflower, cotton-seed oil & fract, w/n ref'd Kilogram 732,716 505,552 909,840 970,535
Coconut, palm kernel or babassu oil & fract, w/n ref'd . Kilogram 44,102 29,636 74,177 105,762
Rape, colza or mustard oil & fract, w/n ref'd ................ Kilogram 247,137 353,026 335,930 904,015
Fixed vegetable fats & oils & fract, w/n ref'd ................ Kilogram 53,622 901,125 235,041 2,826,940
Animal or veg fats, oils & fract, hydrog etc w/n ref'd .... Kilogram 1,892,970 1,285,907 3,130,180 3,067,395Margarine; edible mx or prep of animal or veg fats & oils or fract ....................................................................
Kilogram 15,075,871 14,009,961 25,551,350 27,628,998
Animal or veg fats & oils & fract boiled oxid, etc, & ined mx/prep nes ..........................................................
Kilogram 1,141,315 610,998 2,327,720 1,223,686
Waxes veg (o/t triglycerides) beeswax, insect waxes & spermaceti, w/n ref'd/col ...........................................
Kilogram 452,199 410,467 439,414 462,761
Degras; residues from fatty substances or animal or vegetable waxes ...........................................................
Kilogram 0 163,122 0 135,559
Animal - Veg Fats & Oils, Margarine ........................ Kilogram 26,188,473 24,953,220 41,700,176 47,393,897

38
Sausages & sim prod, of meat, meat offal or blood ..... Kilogram 4,879,026 5,257,807 26,911,320 32,314,996Prepared or preserved meat, meat offal or blood, nes Kilogram 3,344,189 3,976,080 24,954,007 31,195,805Extracts & juices of meat, fish or crustaceans, molluscs or other aquatic invert ....................................
Kilogram 7,551 5 28,647 20
Prepared or preserved fish; caviar & caviar subst prepared from fish eggs ...............................................
Kilogram 973,391 920,743 3,959,919 3,769,854
Crustaceans, molluscs and other aquatic invertebrates, prepared or preserved ...........................
Kilogram 79,723 8,381 388,914 47,809
Preparations of Meat .................................................. Kilogram 9,283,880 10,163,016 56,242,807 67,328,484
Cane or beet sugar and chemically pure sucrose, in solid form ......................................................................
Metric Ton 125 125 174,099 130,132
Sugars, nes, incl chem pure lactose etc; sug syrups; arti honey; caramel
Kilogram 29,278,688 36,783,955 9,093,440 13,190,804
Molasses from the extraction or refining of sugar ........ Metric Ton 2,062 1,997 365,447 415,240
Sugar confectionery incl white choc, not contg cocoa . Kilogram 2,686,995 2,062,498 8,131,470 6,367,677
Sugars and Sugar Confectionery ............................. ............ 17,764,456 20,103,853
Cocoa beans, whole or broken, raw or roasted ........... Metric Ton 0 0 1,072 1,944
Cocoa shells, husks, skins and other cocoa waste ...... Kilogram 0 1,267 0 3,352
Cocoa paste, whether or not defatted .......................... Kilogram 0 49 0 430
Cocoa butter, fat and oil ............................................... Kilogram 72 1,141 540 4,670
Cocoa powder, not contg added sugar or sweetening . Kilogram 90,386 17,572 455,728 111,388
Chocolate and other food preparations contg cocoa ... Kilogram 2,070,033 1,760,114 8,432,428 10,189,302
Cocoa and Cocoa Preparations ................................ ........... 8,889,768 10,311,086
Malt extract; food prep of flour w cocoa ....................... Kilogram 8,621,844 10,718,855 15,181,274 20,949,728
Pasta w/n cooked/stuffed, o/w prep, w/n prepared ...... Kilogram 4,990,117 3,309,421 10,363,560 8,055,697
Tapioca & subst prep from starch, in flake, grn, pearl . Kilogram 19,878 22,066 35,739 36,139Prepared foods obt by swelling/roasting of cereals etc; cereals o/t corn grain .............................................
Kilogram 6,410,101 5,242,411 10,559,372 9,657,350
Bread, pastry etc w/n cntg cocoa; comm waf empty cachets for pharm seal waf etc .....................................
Kilogram 14,174,629 13,487,085 39,721,045 39,339,931
Preparations of Grains, Pasta ................................... Kilogram 34,216,569 32,779,838 75,860,990 78,038,845
Vegetable, fruit, nuts, edible pts of plants prep/presv .. Kilogram 2,106,769 5,414,589 2,143,962 5,869,378
Tomatoes prepared or preserved ................................. Kilogram 606,118 685,302 631,635 602,515
Mushrooms & truffles, prep or presv ............................ Kilogram 314,753 147,278 456,288 241,525
Vegetables nes, prep or presv, frozen ......................... Kilogram 5,432,353 3,916,488 7,448,788 6,904,023
Vegetables nes, prep or presv, not frozen ................... Kilogram 5,396,660 6,495,228 13,676,565 18,486,959
Veg, fruits, nuts, fruit-peel & pts of plants presv........... Kilogram 314 1,070 1,101 2,623Jams, fruit jellies, marmalades, fruit or nut purée & pastes, ckd, w/n sweetened .........................................
Kilogram 261,780 186,907 513,271 323,355
Fruits, nuts & other edible pts of plants o/w prep or presv w/n sweetened, nes ............................................
Kilogram 1,594,045 1,594,010 5,194,126 6,698,348
Fruit (incl grape must) & veg juices, unferment, not cntg spirit, w/n sweet
Liter 6,209,679 5,176,855 9,563,579 7,706,693
Preparatons of Vegetables, Fruit & Nuts ................. .............. 39,629,315 46,835,419
Extr, ess & conc of coffee, tea or maté; chic coffee subst roast & prep ........................................................
Kilogram 1,775,579 1,548,892 6,674,079 6,976,381
Yeasts; dead one cell micro-organisms; prep bkg pdr . Kilogram 1,222,624 1,690,379 3,914,703 5,376,991Sauces & prep nes; condiments & seasoning mxd; mustard flour & meal; prep mustard .............................
Kilogram 11,151,886 9,796,353 19,808,955 18,842,535
Soups, broths & prep thereof; ...................................... Kilogram 199,844 137,628 542,080 503,529
Ice cream and other edible ice, w/n contg cocoa ......... Kilogram 30,977 36 66,520 353
Food preparations, nes ................................................ Kilogram 11,180,693 9,229,973 39,249,204 33,375,991
Miscellaneous Edible Preparations .......................... Kilogram 25,561,603 22,403,261 70,255,541 65,075,780
Waters, incl nat or arti min or aerated waters .............. Liter 548,992 500,423 680,264 305,298Waters, min or aerated, sweet or flav, non-alc bev ...... Liter 8,517,935 12,061,056 12,629,738 24,176,585
Beer made from malt .................................................... Liter 6,940,191 7,054,774 6,367,333 7,108,213
Wine of fresh grapes, incl fortified ................................ Liter 4,869,855 5,329,476 26,495,563 30,277,180
Vermouth and other grape wine flavoured ................... Liter 11,040 13,265 47,064 51,591
Fermented beverages, nes .......................................... Liter 73,400 76,216 913,495 914,981

39
Undenat ethyl alc, denat ethyl alc spirits of any str ...... Liter 7,936,765 98,284,650 4,191,547 68,323,283
Undenat ethyl alc, spirits liqueurs & spirit beverages .. Liter 672,078 690,892 14,781,587 17,775,019
Vinegar and substitutes obtained from acetic acid ...... Liter 40,767 47,685 114,029 108,309
Beverages, Spirits and Vinegar ................................ Liter 29,611,023 124,058,437 66,220,620 149,040,459
Flours etc of meat, meat offal, fish, crustaceans etc unfit for human cons .....................................................
Kilogram 2,045,273 1,921,611 2,454,102 2,369,353
Bran, sharps etc w/n pellet, from sifting or wrkg of cereals or leg plants .....................................................
Kilogram 13,161,132 7,128,112 4,037,836 4,562,088
Starch & sim residues, beet-pulp etc, dreg & waste from brew or distil w/n pellet .........................................
Kilogram 225,675,858 205,376,016 27,543,680 39,024,274
Soya-bean oil-cake and other solid residues, w/n ground or pellet .............................................................
Kilogram 205,322,477 223,323,092 66,656,182 77,660,060
Ground-nut oil-cake and other solid residues, w/n ground or pellet .............................................................
Kilogram 535 3,122 75 437
Oil-cake nes, o/t soya-bean or ground nut w/n ground or pellet .........................................................................
Kilogram 1,076,272 1,399,391 219,441 466,745
Vegetable mat, waste, residues & by-prod nes, w/n pellet, used for animal feed ..........................................
Kilogram 137,780 153,110 169,253 125,232
Animal feed preparations, nes ...................................... Kilogram 31,735,603 50,684,997 49,748,333 55,801,304
Food Industry Residues & Waste, Prepared Fodder..........................................................................
Kilogram 479,154,930 489,989,451 150,828,902 180,009,493
Tobacco unmanufactured; tobacco refuse ................... Kilogram 0 1,076 0 3,963
Cigars, cheroots, cigarillos & cig of tobacco sub ......... Thousand 150 105 97,919 78,769
Mfd tobacco & subst nes .............................................. Kilogram 9,551,770 8,241,652 12,834,620 10,948,182
Tobacco and Manufactured Tobacco Substitutes .. ................ 12,932,539 11,030,914
Acyclic Alcohols & Halogenat, Sulfonatd Etc Derivs .... Kilogram 13,282 74,157 47,375 166,433
Organic Chenicals ...................................................... Kilogram 13,282 74,157 47,375 166,433
Essential oils; resinoids; distls of essential oils ............ Kilogram 62,081 258,514 2,262,713 3,667,864
Essential Oils .............................................................. Kilogram 62,081 258,514 2,262,713 3,667,864
Casein, caseinates & other derivs; casein glues ......... Kilogram 31,373 57,473 250,617 583,945
Albumins, albuminates & other albumin derivatives ... Kilogram 1,995,458 1,644,177 5,127,871 7,541,779
Gelatin & derivs; isinglass; glues of animal origin nes . Kilogram 5,447 16,324 25,893 97,456
Peptones & derivs; protein sub & derivs, nes .............. Kilogram 15,934 35,651 194,353 238,574Dextrins & other mod starches; glues based on starches, dextrins or other mod starches .....................
Kilogram 2,679,480 2,699,751 3,402,257 3,713,589
Caseins & Albumins ................................................... Kilogram 4,727,692 4,453,376 9,000,991 12,175,343
Miscellaneous Chemical Products ........................... Kilogram 9,451 19,492 13,158 25,237
Raw hides & skins of bov or equ animals .................... Number 4,236 508 195,341 1,754
Raw skins of sheep or lambs w/n woolen or split etc ... Number 0 17 0 623
Raw hides & skins nes ................................................. Number 0 0 4,168 5,421
Raw Hides, Skins ........................................................ Number 4,236 525 199,509 7,798
Furskins, raw & pieces suitable for furriers' use, nes Number 33,784 68,972 373,554 716,170
Silk, Raw, (not thrown) ................................................ Number 0 0 7 0
Waste of wool or fine or coarse animal hair ................. Kilogram 25 2 90 8
Wool, not carded or combed ........................................ Kilogram 203 1,036 1,218 6,459
Fine or coarse animal hair, not carded or combed ...... Kilogram 10 182 53 579
Wool, Animal Hair ....................................................... Kilogram 238 1,220 1,361 7,046
Cotton, not carded or combed ...................................... Kilogram 1,363 447 2,627 893
Cotton waste (including yarn waste/garnetted stock) .. Kilogram 1,964 2,478 4,165 1,568
Cotton, carded or combed ............................................ Kilogram 2,142 1,664 10,537 7,275
Cotton Raw .................................................................. Kilogram 5,469 4,589 17,329 9,736
Flax, raw or processed but not spun; flax tow & waste Kilogram 62,360 65,010 61,627 59,395True hemp (Cannabis sativa L), raw or processed, not spun; tow & waste of true hemp ...................................
Kilogram 1,247 1,058 3,221 5,195
Other Textile Fibers .................................................... Kilogram 63,607 66,068 64,848 64,590
Fish and Crustaceans ................................................ ................ 404,576 1,334,532
TOTAL IMPORTS* ....................................................... ................ 922,194,163 1,095,363,916
40
0
1,000
2,000
3,000
4,000
5,000
6,000
7,000
8,000
9,000
2002 2003 2004 2005 2006 2007 2008 2009 2010 2011
MIL
LIO
NS
OF
DO
LL
AR
S
YEAR
Selected Agri-Food Exports by Province2002 - 2011
SK AB ONT MB BC QUE NS NB PEI NFL
Industry Intelligence, MAFRISource: Industry Canada
0
1,000
2,000
3,000
4,000
5,000
6,000
2002 2003 2004 2005 2006 2007 2008 2009 2010 2011
MIL
LIO
NS
OF
DO
LL
AR
S
YEAR
Selected Agri-Food Imports by Province2002 - 2011
ON BC QUE AB NB MB SK NS NFL PEI
Industry Intelligence, MAFRISource: Industry Canada
41
OVERVIEW OF THE CANOLA SECTOR IN MANITOBA
Canola is Manitoba’s most
important oilseed crop. Canola production in Manitoba
has grown steadily over the years and it accounts for the greatest amount of seeded area, followed by wheat.
In 2011, Manitoba reported 6,151
canola farms compared to 5,861 in 2006. This represents 17.5% of canola farms in Canada.
Annually, Manitoba produces approximately 17 to 18% of Canada's total canola
production.
Canola is valued throughout the world for its nutritional qualities in the human diet.
Canola oil is the most important component of the seed in terms of market value. Canola meal is an important source of protein in animal feed.
Significant research activity continues to improve the quality characteristics of canola
seed, oil and meal. Ongoing canola breeding efforts focus on quality, disease resistance and agronomic improvements, to develop better varieties and tap the potential of hybrid canola.
New genetics enable growers to realize a higher yield per acre with some of the
strongest canola in the world. The Canola Council of Canada is forecasting production of 15 million tonnes of canola by 2015 as new high-yielding hybrid varieties continue to be adopted by farmers.
Increased crushing capacity in the province is strengthening the commitment of
farmers to grow canola as the demand for seed continues to increase.
Manitoba Manitoba Canada CanadaCanola 2011 2006 2011 2006Number of farms 6,151 5,861 35,073 31,435Acres 3,288,594 2,278,642 19,368,997 12,423,579Hectares 1,330,847 922,134 7,838,354 5,027,643Source: Census of Agriculture 2011

42
CANOLA PROCESSING IN MANITOBA Oilseed processing is one of the most important value-added agribusinesses in
Manitoba and has become a well-established industry. The canola crush margin is an indicator of the economic strength of the oilseed processing sector.
Canola seed is processed for its oil and the resultant 60% of the original seed is
canola meal, the principal protein source produced in western Canada. Canola seed contains approximately 42 percent oil. Raw canola seed is crushed to
release raw crude oil which is then refined and further processed into high quality, high value food products such as margarine, shortenings and frying oils as well as ingredients in salad oils and baked goods.
Canola oil is also used in the production of inedible products such as
pharmaceuticals, cosmetics, suntan oil, detergents and soaps, surfactants, industrial lubricants, greases and hydraulic fuels, fungicides, herbicides, pesticides, plasticisers, inks, lacquers, photographic compounds, and in the anti-static substance for paper and plastic wrap.
Canola meal, a high-protein by-product of oilseed crushing, is a rich source of
vitamins B, E and protein. Along with hulls and screenings, it is used in livestock feed in dairy, beef, swine and poultry rations.
Since 1994, cold-pressed oils (canola and others) have been produced from an
expeller pressing operation (without solvent extraction). Bunge Ltd. operates a plant in Altona and another in Harrowby. They produce bulk
crude and refined oil, high-oleic Nexera canola oil, bulk vegetable oil, retail pack refined oil, hulls and screenings.
Canada is forecast to crush a record 5.5 Mt of canola, due to the expansion of
crushing capacity. The expected rise in crush is supported by the strong international demand for biodiesel and growing US demand for healthy edible oils.
Rapeseed was introduced as an alternative crop during World War II as a substitute
for conventional lubricants that were in short supply. The crop increased in significance after 1968 when Dr Baldur Stefansson of the University of Manitoba used selective breeding to develop a variety of rapeseed low in erucic acid.
In 1974 another variety was produced, low in erucic acid and glucosinolates; the
name “canola” was derived from “Canadian oil, low acid”. A variety developed in 1998 is considered the most disease- and drought-resistant variety of canola to date. This and other recent varieties have been produced by using genetic engineering.
The seeds are used to produce edible oil suitable for human consumption due to low
levels of erucic acid compared to traditional rapeseed oils. Reduced levels of toxin glucosinolates make the by-product canola meal suitable for livestock feed.

43
TRADE Manitoba has extensive experience in servicing foreign markets due to a long history
of exporting canola. Canola oil and meal constitute close to 30% of exports. Major markets include United States, China, Japan, Mexico and United Arab Emirates.
Canola oil exports were valued at $397 million in 2011, mainly as a result of higher
prices. Exports of other processed canola products and bi-products, such as meal and oilcake, amounted to $73 million in 2011.
Demand for canola meal remains strong given the tight world protein supply for
animal feed. Canola and rapeseed meals are the second most widely traded protein ingredients in animal feed after soybean meal.
The major customer of canola oil and meal is the United States where growers do
not produce enough canola to meet domestic demand. The top importing states of Manitoba canola are Tennessee, Illinois, California and Louisiana.
The U.S. dairy industry is a major consumer of Canadian canola meal. As
production of canola increases and more meal is available, it may become more widely used by other livestock sectors such as the poultry and hog industries.
China has become the world's largest importer of oilseeds. Its rapid rise in domestic
demand results from increased urbanization and greater demand for labour saving foods serviced by a growing retail and food processing sector. China is increasing the size of its domestic industrial-scale crush capacity for oilseeds due to rising demand for protein meal from rapidly developing animal and aquaculture sectors.
The long run outlook for canola continues to be positive. Rising per capita demand
for oils and fats along with rising demand for more protein in the diet and the mandated use of biodiesel is expected to support canola prices.
The long-run growth in demand for canola oil and canola meal in countries such as
China, Mexico and Pakistan is expected to grow as incomes and populations rise over the next 10 to 20 years.
Canada is expected to face competition from the growth in soybean production in
South American and from higher palm oil production in Indonesia. However, the production of oilseeds in Russia, Ukraine, Belarus and Kazakhstan is expected to remain relatively stable over the next 10 years as those countries focus on raising cereal output.
Canada continues to search for its agronomic limit on canola production and this
limit is not expected to be reached in the near future. This should be supportive to farmer incomes and to Canada's canola crushers and exporters.
Over the medium term, Canadian exports of seed, oil and meal are expected to
contribute to a positive balance of payments and support economic growth for the country.
44
Canola Outlook for Canada 2012-2013 For 2012-13, seeded area is forecast to increase by 8% to a record high, surpassing
wheat ex-durum as the largest seeded area crop in Canada. The gain is supported by historically strong prices and expected attractive yields. Production is forecast at a record 15.1 Mt, up 7% from 2011-12. However, supply is forecast to decrease slightly due to sharply lower carry-in stocks. Exports are forecast to fall marginally, to slightly under 8.4 Mt, while domestic crush
remains strong at 6.7 Mt. Tight domestic supply will limit Canada's ability to service strong world demand. Carry-out stocks are forecast to remain at 0.6 Mt while prices rise marginally on
higher US soybean and soyoil prices. For 2012-13, world oilseed, vegetable oil and protein meal prices are forecast to
remain strong with US soybean and soyoil prices rising slightly.
Outlook for Canola 2010-2011 2011-2012p 2012-2013f
Area Seeded (kha) 6,806 7,633 8,244
Area Harvested (kha) 6,514 7,471 8,079
Yield (t/ha) 1.96 1.90 1.87
Production (kt) 12,773 14,165 15,100
Imports (kt) 224 125 125
Total Supply (kt) 15,260 16,008 15,825
Exports (kt) 7,105 8,400 8,350
Food & Industrial Use (kt) 6,310 6,700 6,700
Feed, Waste & Dockage (kt) 71 252 126
Total Domestic Use (kt) 6,437 7,008 6,875
Carry-out Stocks (kt) 1,718 600 600
Average Price ($/t) 568 570 to 610 580 to 620 Source: Statistics Canada and Agriculture and Agri-Food Canada, June 2012

45
0
500
1000
1500
2000
2500
3000
3500
4000
2000 2001 2002 2003 2004 2005 2006 2007 2008 2009 2010 2011
TH
OU
SA
ND
AC
RE
S
YEAR
Canola - Seeded Acres in Manitoba2000 - 2011
Industry Intelligence Section, MAFRISource: Statistics Canada
0
500
1000
1500
2000
2500
3000
3500
2000 2001 2002 2003 2004 2005 2006 2007 2008 2009 2010 2011
TH
OU
SA
ND
AC
RE
S
YEAR
Canola - Harvested Acres in Manitoba2000 - 2011
Industry Intelligence Section, MAFRISource: Statistics Canada

46
0
5
10
15
20
25
30
35
40
45
2000 2001 2002 2003 2004 2005 2006 2007 2008 2009 2010 2011
BU
SH
EL
S P
ER
AC
RE
YEAR
Canola - Yield per Acre in Manitoba2000 - 2011
Industry Intelligence Section, MAFRISource: Statistics Canada
0
500
1,000
1,500
2,000
2,500
3,000
3,500
2000 2001 2002 2003 2004 2005 2006 2007 2008 2009 2010 2011
TH
OU
SA
ND
TO
NN
ES
YEAR
Canola - Tonnes Produced in Manitoba2000 - 2011
Industry Intelligence Section, MAFRISource: Statistics Canada
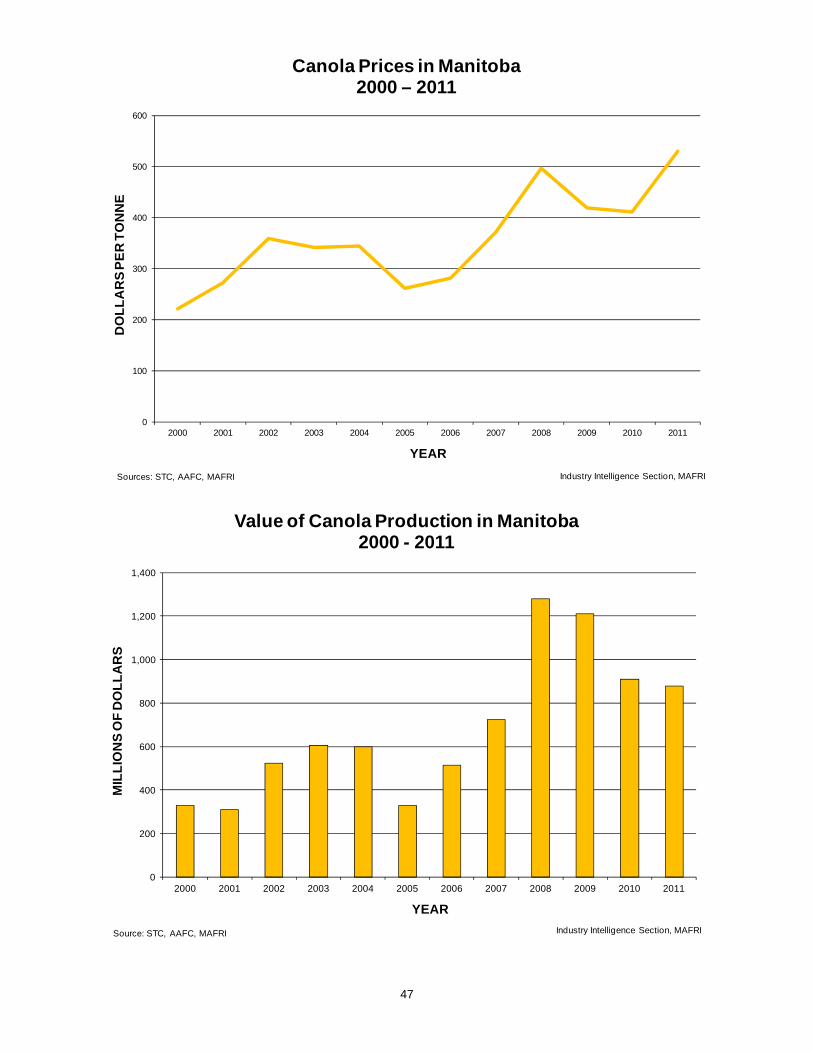
47
0
100
200
300
400
500
600
2000 2001 2002 2003 2004 2005 2006 2007 2008 2009 2010 2011
DO
LL
AR
S P
ER
TO
NN
E
YEAR
Canola Prices in Manitoba2000 – 2011
Industry Intelligence Section, MAFRISources: STC, AAFC, MAFRI
0
200
400
600
800
1,000
1,200
1,400
2000 2001 2002 2003 2004 2005 2006 2007 2008 2009 2010 2011
MIL
LIO
NS
OF
DO
LL
AR
S
YEAR
Value of Canola Production in Manitoba2000 - 2011
Industry Intelligence Section, MAFRISource: STC, AAFC, MAFRI

48
0
50
100
150
200
250
300
350
2000 2001 2002 2003 2004 2005 2006 2007 2008 2009 2010 2011
DO
LL
AR
S P
ER
AC
RE
YEAR
Cost of Canola Production per Acre in Manitoba2000 - 2011
Operating Costs of Production Fixed costs, including labour Total Costs of Production (including labour)
Industry Intelligence Section, MAFRISource: MAFRI
0
200
400
600
800
1,000
1,200
2000 2001 2002 2003 2004 2005 2006 2007 2008 2009 2010 2011
MIL
LIO
NS
OF
DO
LL
AR
S
YEAR
Farm Cash Receipts for Canola in Manitoba2000 - 2011
Industry Intelligence Section, MAFRISource: Statistics Canada

49
0 500 1,000 1,500 2,000 2,500 3,000
2000-01
2001-02
2002-03
2003-04
2004-05
2005-06
2006-07
2007-08
2008-09
2009-10
2010-11
2011-12
THOUSAND TONNES
CR
OP
YE
AR
Marketings of Manitoba Canola2000 - 2011
Industry Intelligence Section, MAFRISource: STC, AAFC, MAFRI
0
100
200
300
400
500
600
700
800
900
2000 2001 2002 2003 2004 2005 2006 2007 2008 2009 2010 2011
MIL
LIO
NS
OF
DO
LL
AR
S
YEAR
Manitoba Canola Exports2000 - 2011
Industry Intelligence Section, MAFRISource: Statistics Canada

50
Farm Supply and Disposition of Manitoba Canola Crop, 2000/01 to 2011/12
000 tonnes 2005-06 2006-07 2007-08 2008-09 2009-10 2010-11 2011-12
Opening Stocks Aug1 166 151 101 65 120 176 120
Production 1,261 1,826 1,950 2,576 2,892 2,216 1,656
Total Supply 1,427 1,977 2,052 2,642 3,012 2,391 1,776
Marketings 1,185 1,793 1,933 2,449 2,610 2,127 1,600
Seed 1 1 1 1 1 1 1
Carry-over 150 101 65 120 176 120 100
Feed/Waste/Dockage 91 82 53 72 225 143 75
Total Disposition 1,427 1,977 2,052 2,642 3,012 2,391 1,776
000 bushels 2005-06 2006-07 2007-08 2008-09 2009-10 2010-11 2011-12
Opening Stocks Aug1 7,319 6,658 4,453 2,866 5,291 7,760 5,291
Production 55,600 80,512 85,979 113,581 127,514 97,708 73,016
Total Supply 62,919 87,170 90,477 116,491 132,805 105,424 78,307
Marketings 52,249 79,057 85,230 107,981 115,080 93,784 70,547
Seed 44 44 44 44 44 44 44
Carry-over 6,614 4,453 2,866 5,291 7,760 5,291 4,409
Feed/Waste/Dockage 4,012 3,616 2,337 3,175 9,921 6,305 3,307
Total Disposition 62,919 87,170 90,477 116,491 132,805 105,424 78,307
CANOLA - Common Conversions 1 metric tonne canola = 44.092 bushels. There are 50 pounds in 1 bushel of canola.

51
Production and Value of Manitoba Canola Seeded Harvested Average Price per Total
Year Area Area Yield Production Tonne Value(hectares) (hectares) (kg per ha) (tonnes) ($/tonne) ($000)
1990 352,100 352,100 1,300 460,400 254 116,9421991 507,776 507,776 1,600 796,100 235 187,0841992 647,500 627,300 1,600 986,600 267 263,4221993 752,700 736,500 1,200 907,200 301 273,0671994 1,031,900 1,011,700 1,500 1,485,500 348 516,9541995 951,000 940,900 1,300 1,227,000 368 451,5361996 635,400 627,300 1,700 1,068,200 385 411,2571997 959,100 951,000 1,600 1,496,900 385 576,3071998 1,112,900 1,104,800 1,600 1,803,000 345 622,0351999 1,003,600 995,500 1,700 1,707,800 230 392,7942000 951,000 934,800 1,600 1,487,800 221 328,4912001 768,900 760,800 1,500 1,134,000 272 308,9132002 890,300 870,100 1,700 1,451,500 360 521,9162003 1,011,700 1,007,700 1,800 1,769,000 342 604,7862004 1,116,900 1,011,700 1,700 1,746,300 344 600,0992005 1,011,700 874,100 1,400 1,261,000 262 329,9412006 1,003,600 1,001,600 1,800 1,825,700 281 513,8802007 1,238,300 1,228,200 1,600 1,950,400 371 723,6182008 1,254,500 1,246,400 2,100 2,576,400 497 1,280,3942009 1,305,100 1,295,000 2,200 2,891,700 419 1,211,6512010 1,363,800 1,258,600 1,800 2,215,800 410 909,3862011 1,102,800 1,064,300 1,600 1,655,600 529 876,524
Seeded Harvested Average Price per TotalYear Area Area Yield Production Bushel Value
(acres) (acres) (bu per acre) (000 bushels) ($/bushel) ($000)1990 870,000 870,000 23.3 20,300 5.76 116,9281991 1,254,742 1,254,742 28.0 35,100 5.35 187,7851992 1,600,000 1,550,000 28.1 43,500 6.05 263,1751993 1,860,000 1,820,000 22.0 40,000 6.80 272,0001994 2,550,000 2,500,000 26.2 65,500 7.90 517,4501995 2,350,000 2,325,000 23.3 54,100 8.35 451,7351996 1,570,000 1,550,000 30.4 47,100 8.73 411,1831997 2,370,000 2,350,000 28.1 66,000 8.73 576,1801998 2,750,000 2,730,000 29.1 79,500 7.82 621,6901999 2,480,000 2,460,000 30.6 75,300 5.22 393,0662000 2,350,000 2,310,000 28.4 65,600 5.44 356,8642001 1,900,000 1,880,000 26.6 50,000 6.18 308,9112002 2,200,000 2,150,000 29.8 64,000 8.15 521,9202003 2,500,000 2,490,000 31.3 78,000 7.75 604,7952004 2,760,000 2,500,000 30.8 77,000 7.79 600,1152005 2,500,000 2,160,000 25.7 55,600 5.93 329,9412006 2,480,000 2,475,000 32.5 80,500 6.38 513,8882007 3,060,000 3,035,000 28.3 86,000 8.41 723,6432008 3,100,000 3,080,000 36.9 113,600 11.27 1,280,4092009 3,225,000 3,200,000 39.8 127,500 9.50 1,211,6432010 3,370,000 3,110,000 31.4 97,700 9.31 909,3952011 2,725,000 2,630,000 27.8 73,000 12.01 876,524SOURCE: Statistics Canada; Agriculture and Agri-Food Canada; Manitoba Agriculture, Food and Rural Initiatives.

52
OVERVIEW OF THE WHEAT SECTOR IN MANITOBA
Wheat is one of Manitoba’s most important crops and occupies the largest area of crop by area.
In 2011, Manitoba reported 5,680 wheat farms
compared to 7,156 in 2006. This represents 10.9% of wheat farms in Canada. Annually, Manitoba produces approximately 14 to 17% of Canada's total wheat production.
Wheat is a mainstay for farmers in Manitoba and it
will remain an integral part of Western Canadian agriculture in the years to come.
Although it is an important foundational rotational
crop and in spite of growing worldwide market demand for wheat, production has declined in Manitoba and Western Canada due in part to a drop in competitive economic returns for wheat.
Wheat is a very durable crop, producing acceptable yields even under extremely
challenging conditions and having high yield potential under optimum growing conditions. It can be grown under zero-, minimum-and conventional-tillage systems.
Manitoba Manitoba Canada Canada
Total wheat 2011 2006 2011 2006Number of farms 5,680 7,156 51,974 60,743Acres 2,807,418 3,298,217 22,876,574 24,266,011Hectares 1,136,122 1,334,741 9,257,820 9,820,105Spring wheat (excluding durum) Number of farms 5,454 6,870 35,541 45,234Acres 2,586,198 2,980,285 16,866,217 18,733,322Hectares 1,046,597 1,206,078 6,825,515 7,581,105Durum wheat Number of farms 48 83 7,276 8,455Acres 8,515 18,769 4,249,193 3,819,552Hectares 3,446 7,596 1,719,587 1,545,718Winter wheat Number of farms 642 1,110 14,595 15,090Acres 212,705 299,163 1,761,164 1,713,137Hectares 86,079 121,067 712,718 693,282Source: Census of Agriculture 201

53
Processing Wheat in Manitoba
Marketing options are many given the wide range of food, fuel and feed end uses for wheat. There are 8 different milling classes of western Canadian wheat, as well as a general purpose wheat for feed and ethanol. With over 60 varieties among milling classes and continued improvements in new varieties, producers can select cultivars based on agronomic characteristics, pest problems, or specific end use.
Wheat processed into flour, cereal food and feed, pasta, bread and bakery products comprises a large component of food processing in Manitoba.
3/4 of all Manitoba grain products are made from wheat flour. Manitoba has 3 flour mills, numerous bakeries and processors of fresh, frozen or dry pasta.
Hard red spring wheat offers superior gluten strength and can be blended with lower protein wheats to improve the quality of bread flours.
While much of the pasta, bread and bakery products are consumed locally; Manitoba exports a substantial amount of flour and feed.
Some wheat is also used to produce ethanol at a plant in Minnedosa, which in turn provides mash for animal feed as a by-product.
An average acre of Prairie farmland can grow enough wheat each season to make 1,650 loaves of bread. One bushel of wheat:
- contains approximately one million individual kernels
- weighs approximately 60 pounds
- yields approximately 42 pounds of white flour or 60 pounds of whole-wheat flour
- makes about 67 sixteen-ounce loaves of bread or 45 twenty-four-ounce loaves
- makes about forty-five 24-ounce boxes of wheat flake cereal
- makes about 42 pounds of pasta or 210 servings of spaghetti
Canada Western Red Spring (CWRS) Wheat
hard wheat with superior milling and baking quality offered at various guaranteed levels of protein content
Canada Western Red Winter (CWRW) Wheat
hard wheat with excellent milling quality used for French bread, flat bread and steamed bread and noodles
Canada Western Extra Strong (CWES) Wheat
has extra gluten suitable for blending purposes and used for hearth and pan breads
Canada Prairie Spring Red (CPSR) Wheat
used for hearth, flat and steamed breads, and noodles
Canada Prairie Spring White (CPSW) Wheat
medium strength wheat used for flat breads, noodles and chapattis
Canada Western Amber Durum (CWAD) Wheat
produces a high yield of semolina with excellent pasta-making quality
Canada Western Soft White Spring (CWSWS) Wheat
soft wheat of medium-to-low protein content used for flat breads, noodles, steamed breads, chapattis, cookies, cakes and pastry
Canada Western Hard White Spring (CWHWS) Wheat
hard white spring wheat with superior milling quality producing flour with excellent colour, suitable for bread and noodle production

54
Trade Manitoba wheat is sold to countries all over the world for use in breads and pastas. The majority of provincial wheat exports are in unprocessed form and over 70
countries import Manitoba wheat, including the United States, Iran, Japan and Mexico.
Western Candian wheat is recognized throughout the world as the highest quality
wheat and it is used to make doughnuts in Japan, pasta in Italy, bread in Mexico, noodles in China.
Canada has consistently been a major producer of high-quality wheat on the world
stage. Manitoba's wheat is subject to the strict quality standards of the Canadian Grain
Commission's grain quality control program, which includes varietal control, licensing of elevators, product inspection and weighing, and sanitation and quality monitoring programs.
By 2050, world wheat production is projected to reach 880 million tonnes from
current levels estimated at 660 million tonnes. Globally wheat is the second most produced crop after maize, ahead of rice.
Together the European Union and China produce close to 40% of the world’s wheat, with almost all of their production used domestically
Market growth for wheat is due, in part, to growth in market demand from emerging
economies with limited capacity for increasing production of wheat. World wheat trade is expected to double, providing tremendous market opportunities
along with challenges for Manitoba wheat farmers. Intense market competition highlights the need for Manitoba producers to seek
cultivars that provide high return and also meet customers’ needs for quality, cost and functionality.
August 2012 marks the end of the Canadian Wheat Board (CWB) monopoly
whereby since the 1940s western Canadian producers were required by federal law to market their wheat through the CWB.
Contracts and options for feed wheat can be traded on the Winnipeg Commodity
Exchange.

55
Wheat Outlook for Canada 2012-2013 For 2012-13, seeded area is forecast to increase by 10% mostly because of drier
soil conditions compared to 2011-12. Area seeded to winter wheat increased by 22%, while the area seeded to spring wheat is forecast to increase by 9%.
Production is expected to increase by 3% to 21.8 Mt, as the higher seeded area is
partly offset by lower yields. Supply is forecast to fall marginally from 2011-12 because of lower carry-in stocks. Exports are expected to increase by 2% to 14.4 Mt due to growing demand for
wheat in the food market. Domestic use is forecast to decrease by 5% as higher food and industrial uses are
more than offset by lower feed use. For 2011-12, feed use was supported by large carry-in of low quality wheat which won't be available for 2012-13.
Carry-out stocks are expected to be the same as for 2011-12 at 4.8 Mt, slightly lower
than the past 10 year average. The average price is forecast to be similar to 2011-12, as support from lower world
supply is offset by higher US supply and the expected stronger Canadian dollar. US wheat production is forecast to increase to 60.8 Mt. Hard red winter wheat
production is expected to increase significantly; hard red spring wheat production increase slightly; soft red winter and white wheat production decrease. Supply is forecast to increase by 4.1 Mt to 85.3 Mt. Domestic use and exports are forecast to increase, resulting in a 0.9 Mt drop in carry-out stocks to 20 Mt.
World wheat production is forecast to decrease to 672 Mt and the supply is expected
to fall by 24 Mt to 868 Mt. Total use is forecast to decrease as higher food and industrial use is more than offset by lower feed use because of the expected higher coarse grains supply. Carry-out stocks are forecast to fall by 10 Mt to 186 Mt.
Outlook for Wheat (ex-durum) 2010-2011 2011-2012p 2012-2013f
Area Seeded (kha) 7,274 7,112 7,845Area Harvested (kha) 7,024 6,953 7,610Yield (t/ha) 2.87 3.03 2.86Production (kt) 20,142 21,089 21,800Imports (kt) 32 20 30Total Supply (kt) 25,295 26,732 26,630Exports (kt) 12,888 14,100 14,400Food & Industrial Use (kt) 3,345 3,450 3,510Feed, Waste & Dockage (kt) 2,733 3,572 3,110Total Domestic Use (kt) 6,815 7,832 7,430Carry-out Stocks (kt) 5,592 4,800 4,800Average Price ($/t) 318 284 270 to 300Source: Statistics Canada and Agriculture and Agri-Food Canada, June 2012
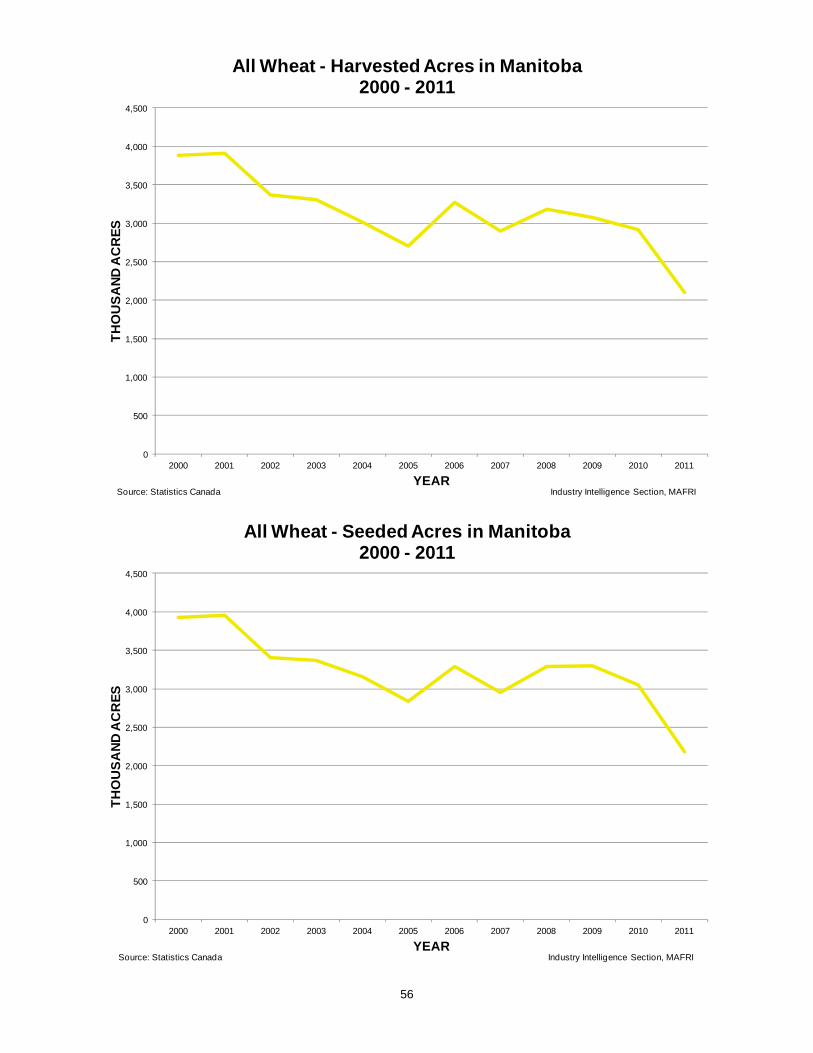
56
0
500
1,000
1,500
2,000
2,500
3,000
3,500
4,000
4,500
2000 2001 2002 2003 2004 2005 2006 2007 2008 2009 2010 2011
TH
OU
SA
ND
AC
RE
S
YEAR
All Wheat - Harvested Acres in Manitoba2000 - 2011
Industry Intelligence Section, MAFRISource: Statistics Canada
0
500
1,000
1,500
2,000
2,500
3,000
3,500
4,000
4,500
2000 2001 2002 2003 2004 2005 2006 2007 2008 2009 2010 2011
TH
OU
SA
ND
AC
RE
S
YEAR
All Wheat - Seeded Acres in Manitoba2000 - 2011
Industry Intelligence Section, MAFRISource: Statistics Canada
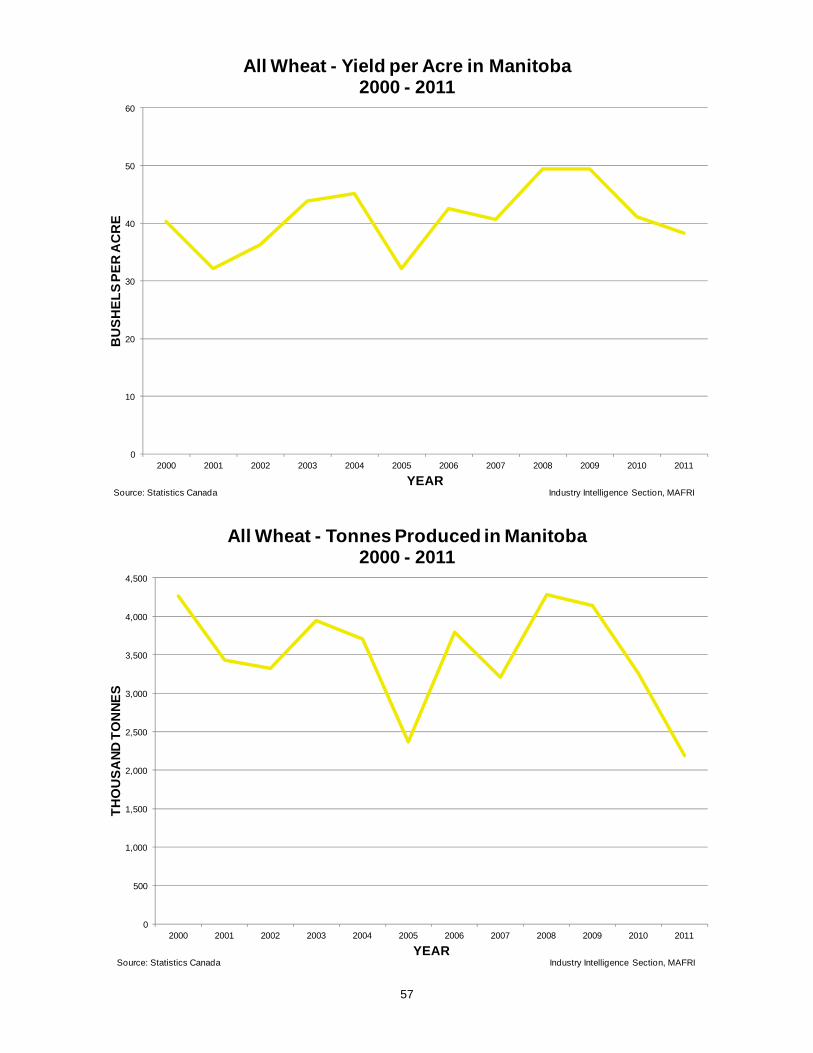
57
0
10
20
30
40
50
60
2000 2001 2002 2003 2004 2005 2006 2007 2008 2009 2010 2011
BU
SH
EL
S P
ER
AC
RE
YEAR
All Wheat - Yield per Acre in Manitoba2000 - 2011
Industry Intelligence Section, MAFRISource: Statistics Canada
0
500
1,000
1,500
2,000
2,500
3,000
3,500
4,000
4,500
2000 2001 2002 2003 2004 2005 2006 2007 2008 2009 2010 2011
TH
OU
SA
ND
TO
NN
ES
YEAR
All Wheat - Tonnes Produced in Manitoba 2000 - 2011
Industry Intelligence Section, MAFRISource: Statistics Canada

58
0
50
100
150
200
250
2000 2001 2002 2003 2004 2005 2006 2007 2008 2009 2010 2011
DO
LL
AR
S P
ER
TO
NN
E
YEAR
All Wheat Prices in Manitoba2000 - 2011
Industry Intelligence Section, Source: Statistics Canada
0
100
200
300
400
500
600
700
800
900
1,000
2000 2001 2002 2003 2004 2005 2006 2007 2008 2009 2010 2011
MIL
LIO
NS
OF
DO
LL
AR
S
YEAR
Value of All Wheat Production in Manitoba2000 - 2011
Industry Intelligence Section, MAFRISource: STC, AAFC, MAFRI
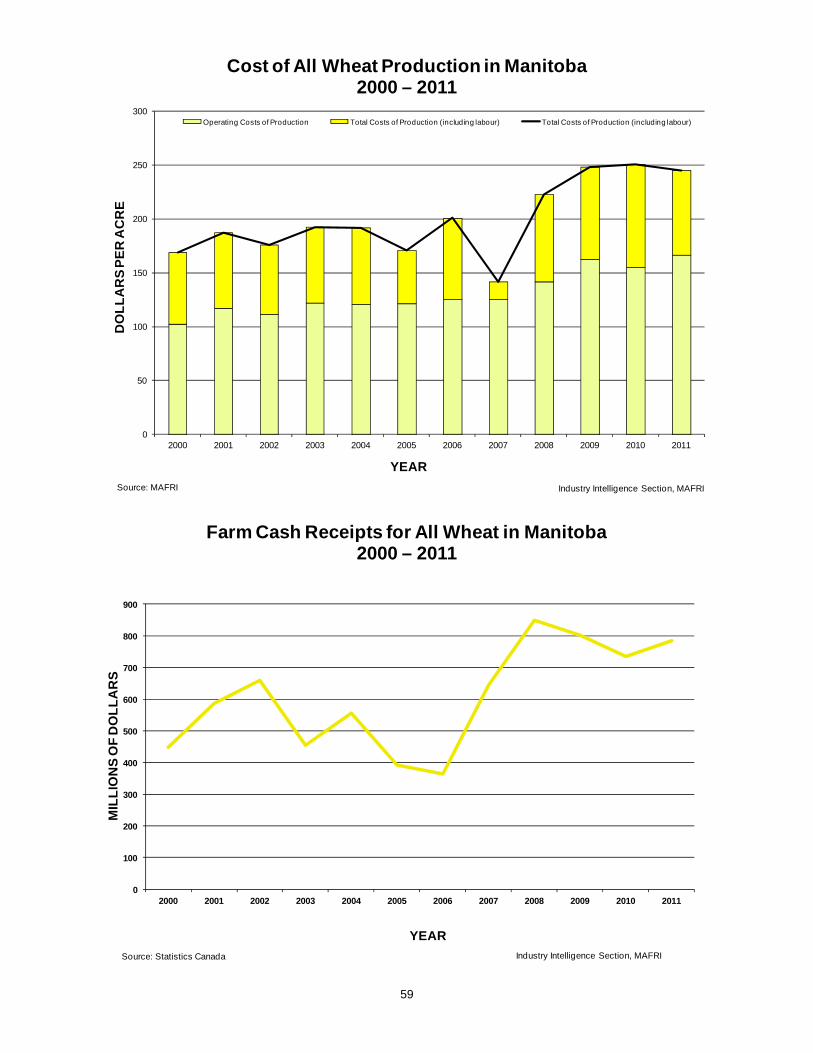
59
0
50
100
150
200
250
300
2000 2001 2002 2003 2004 2005 2006 2007 2008 2009 2010 2011
DO
LL
AR
S P
ER
AC
RE
YEAR
Cost of All Wheat Production in Manitoba2000 – 2011
Operating Costs of Production Total Costs of Production (including labour) Total Costs of Production (including labour)
Industry Intelligence Section, MAFRISource: MAFRI
0
100
200
300
400
500
600
700
800
900
2000 2001 2002 2003 2004 2005 2006 2007 2008 2009 2010 2011
MIL
LIO
NS
OF
DO
LL
AR
S
YEAR
Farm Cash Receipts for All Wheat in Manitoba2000 – 2011
Industry Intelligence Section, MAFRISource: Statistics Canada

60
0 500 1,000 1,500 2,000 2,500 3,000 3,500 4,000 4,500
2000-01
2001-02
2002-03
2003-04
2004-05
2005-06
2006-07
2007-08
2008-09
2009-10
2010-11
2011-12
THOUSAND TONNES
CR
OP
YE
AR
Marketings of Manitoba Wheat2000 - 2011
Industry Intelligence Section, MAFRISource: STC, AAFC, MAFRI
0
200
400
600
800
1,000
1,200
2000 2001 2002 2003 2004 2005 2006 2007 2008 2009 2010 2011
MIL
LIO
NS
OF
DO
LL
AR
S
YEAR
Manitoba All Wheat Exports2000 – 2011
Industry Intelligence Section, MAFRISource: Statistics Canada
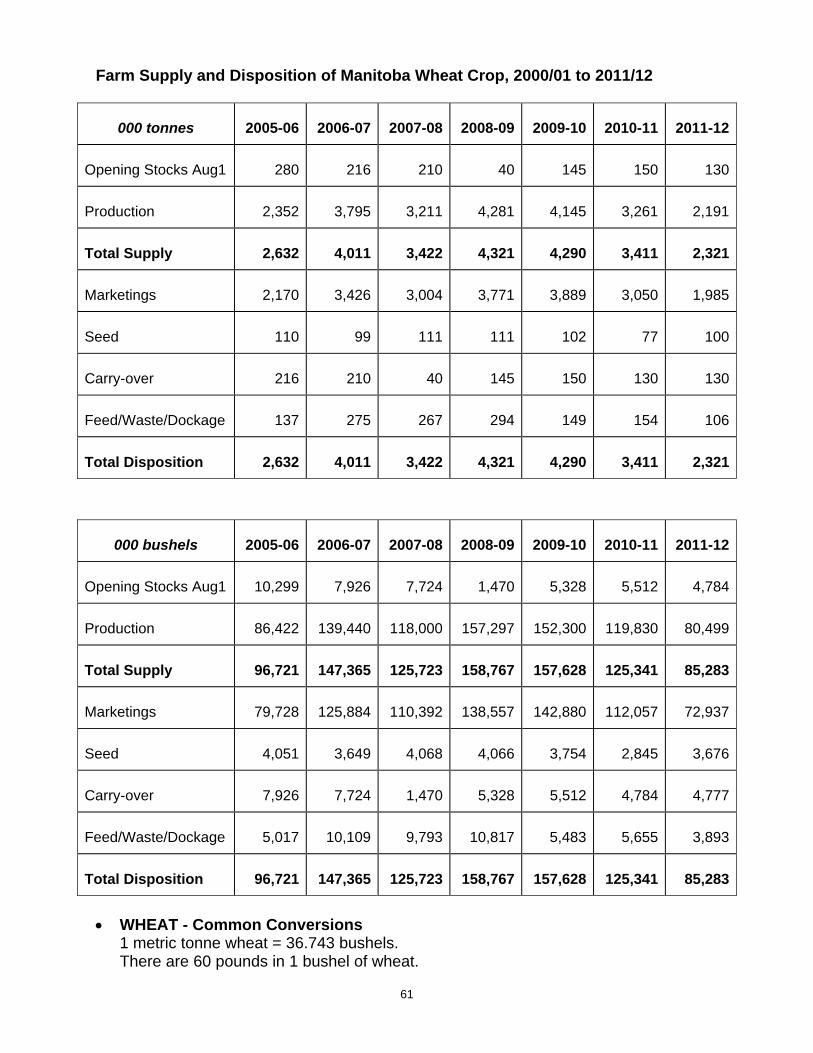
61
Farm Supply and Disposition of Manitoba Wheat Crop, 2000/01 to 2011/12
000 tonnes 2005-06 2006-07 2007-08 2008-09 2009-10 2010-11 2011-12
Opening Stocks Aug1 280 216 210 40 145 150 130
Production 2,352 3,795 3,211 4,281 4,145 3,261 2,191
Total Supply 2,632 4,011 3,422 4,321 4,290 3,411 2,321
Marketings 2,170 3,426 3,004 3,771 3,889 3,050 1,985
Seed 110 99 111 111 102 77 100
Carry-over 216 210 40 145 150 130 130
Feed/Waste/Dockage 137 275 267 294 149 154 106
Total Disposition 2,632 4,011 3,422 4,321 4,290 3,411 2,321
000 bushels 2005-06 2006-07 2007-08 2008-09 2009-10 2010-11 2011-12
Opening Stocks Aug1 10,299 7,926 7,724 1,470 5,328 5,512 4,784
Production 86,422 139,440 118,000 157,297 152,300 119,830 80,499
Total Supply 96,721 147,365 125,723 158,767 157,628 125,341 85,283
Marketings 79,728 125,884 110,392 138,557 142,880 112,057 72,937
Seed 4,051 3,649 4,068 4,066 3,754 2,845 3,676
Carry-over 7,926 7,724 1,470 5,328 5,512 4,784 4,777
Feed/Waste/Dockage 5,017 10,109 9,793 10,817 5,483 5,655 3,893
Total Disposition 96,721 147,365 125,723 158,767 157,628 125,341 85,283
WHEAT - Common Conversions 1 metric tonne wheat = 36.743 bushels. There are 60 pounds in 1 bushel of wheat.

62
Production and Value of Manitoba Wheat Seeded Harvested Average Price per Total
Year Area Area Yield Production Tonne Value(hectares) (hectares) (kg per ha) (tonnes) ($/tonne) ($000)
1990 2,209,600 2,205,500 2,700 5,884,400 109 641,4001991 2,175,084 2,173,054 2,200 4,806,300 109 523,8871992 2,173,000 2,084,100 2,800 5,807,700 121 702,7321993 2,077,200 1,983,000 1,800 3,637,300 104 378,2791994 1,661,200 1,657,200 2,200 3,696,600 160 591,4561995 1,626,700 1,614,500 2,100 3,404,700 205 697,9641996 1,709,700 1,699,600 2,600 4,376,500 163 713,3701997 1,574,200 1,570,200 2,100 3,350,200 145 485,7791998 1,313,200 1,307,100 2,500 3,219,700 145 466,8571999 1,288,800 1,272,700 2,500 3,158,300 120 378,9962000 1,588,300 1,572,100 2,700 4,266,000 114 487,0922001 1,598,400 1,582,200 2,200 3,430,600 127 436,6472002 1,375,800 1,361,700 2,400 3,325,200 141 469,5512003 1,361,800 1,339,500 2,900 3,944,800 138 543,7912004 1,276,600 1,220,000 3,000 3,707,300 113 418,5172005 1,149,300 1,092,700 2,200 2,367,600 93 220,5892006 1,331,500 1,323,300 2,900 3,794,900 104 393,1902007 1,195,800 1,173,500 2,700 3,211,400 127 408,0402008 1,331,500 1,289,000 3,300 4,280,900 215 919,0242009 1,333,400 1,246,400 3,300 4,144,900 170 706,0012010 1,234,200 1,179,600 2,800 3,261,200 154 501,6702011 883,000 849,900 2,600 2,190,800 200 438,160
Seeded Harvested Average Price per TotalYear Area Area Yield Production Bushel Value
(acres) (acres) (bu per acre) (000 bushels) ($/bushel) ($000)1990 5,460,000 5,450,000 39.7 216,200 2.97 641,4001991 5,374,664 5,369,664 32.9 176,600 3.00 523,8871992 5,370,000 5,150,000 41.4 213,400 3.30 702,7321993 5,133,000 4,900,000 27.3 133,650 2.85 378,2791994 4,105,000 4,095,000 33.2 135,830 4.35 591,4561995 4,020,000 3,990,000 31.4 125,100 5.60 697,9641996 4,225,000 4,200,000 38.3 160,800 4.44 713,3701997 3,890,000 3,880,000 31.7 123,100 3.96 485,7791998 3,245,000 3,230,000 36.6 118,300 3.94 466,8571999 3,185,000 3,145,000 36.9 116,050 3.30 378,9962000 3,925,000 3,885,000 40.3 156,750 3.11 487,0922001 3,950,000 3,910,000 32.2 126,050 3.46 436,6472002 3,400,000 3,365,000 36.3 122,180 3.84 469,5512003 3,365,000 3,310,000 43.8 144,950 3.75 543,7912004 3,155,000 3,015,000 45.2 136,220 3.07 418,5172005 2,840,000 2,700,000 32.2 87,000 2.54 220,5892006 3,290,285 3,270,000 42.6 139,435 2.82 393,1902007 2,955,000 2,900,000 40.7 118,000 3.46 408,0402008 3,290,000 3,185,000 49.4 157,300 5.84 919,0242009 3,295,000 3,080,000 49.4 152,300 4.64 706,0012010 3,050,000 2,915,000 41.1 119,830 4.14 501,6702011 2,182,000 2,100,000 38.3 80,500 4.14 438,160Source: Statistics Canada; Agriculture and Agri-Food Canada; Manitoba Agriculture, Food and Rural Initiatives.

63
OVERVIEW OF THE OAT SECTOR IN MANITOBA
Manitoba producers have a long
tradition of growing and producing top quality oats and processed oat products.
The Red River Valley has some of
the highest concentrations of high milling quality oats grown per square kilometre in all of North America.
In 2011, Manitoba reported 3,930 oat farms compared to 5,798 in 2006. This
represents 13.6% of oat farms in Canada. Annually, Manitoba produces approximately 18 to 19% of Canada's total oat production.
Manitoba Manitoba Canada Canada
Oats 2011 2006 2011 2006Number of farms 3,930 5,798 28,994 41,577Acres 695,945 945,847 3,761,367 5,099,298Hectares 281,639 382,771 1,522,171 2,063,612Source: Census of Agriculture 2011
Over the years, trends which influenced the importance of oats included: size and
makeup of the livestock industry, value of pulse and oilseed crops, and increased use of oats in the human food market.
Manitoba’s early settlers, who used horses as the main source of power for farming
and transportation, considered oats as an important feed crop. Oat production in the province peaked in 1921 with over 2 million harvested acres and reached record lows in 1991 with less than 110,000 harvested acres as corn and barley became more popular sources of animal feed.
A slight upward trend in oat production in the past two decades can be attributed to
its benefits for human health and to increased demand from the recreation horse feed market.
More recently, oats have trended as a low volume coarse grain due to cropping options that favour higher value grains and oilseeds, low loan rates and flat consumption patterns.

64
Processing Oats Manitoba has two major facilities that process oats as well as several smaller
facilities. Can-Oat Milling Products, in Portage la Prairie and Manitoba's largest oat processor, processes oats into various products for human consumption including flour, groats, rolled oats and oat bran, and produces oats for animal feed rations.
Emerson Milling, located in Emerson near the Canadian/American border,
processes oats for use in animal feed, including domestic pets, birds and horses. Cultivar development focuses on food and feed quality traits such as plumpness,
test weight, colour, milling yield, hull content, protein, oil and beta-glucan content, for human functional foods and niche markets for hog and cattle feeds.
The health benefits from oats and oat products have been well documented since
the the late 1980s although human consumption demand has slowed. Oats contain high amounts of dietary fibre, beta-glucan, proteins, unsaturated fatty acids, vitamins, minerals and antioxidants.
Oats contain more soluble fibre than any other grain, resulting in slower digestion and an extended sensation of fullness. One type of soluble fibre, beta-glucans, has proven to help lower cholesterol.
In 2010, PepsiCo's Quaker Oats division developed a method of modifying oats
using enzymes to derive a potent natural sweetener with potential market demand from food manufactures seeking a replacement for sucrose. The development of 100% oat flour bread targets targets people suffering from celiac disease.
Oat kernels are milled to produce various products, such as oat groats, thick oats and steel-cut oats. Milling also affects the nutty, robust flavour of oats. Oat groats are oat kernels with the hulls removed; these can be used to make a breakfast porridge but they take a long time to cook.
Oat groats can be heat treated and milled into several types of rolled oats. Thick oats are oat groats that are steamed, rolled, and flaked; cooking time for thick oats can be shortened by soaking them overnight. When oat groats are chopped on a steel mill, the result is steel-cut oats, which are chewy and often used for oatmeal and muesli. Quick oats are steel cut oat groats, flaked to .014 to .018 inches thick; although some of the nutty flavor and texture is lost in this process, they require minimal cooking and are most often used in baking.
Oats are also commonly used as feed for horses when extra carbohydrates, and the subsequent boost in energy, are required. The oat hull must be crushed ("rolled" or "crimped") for the horse to digest the grain, and may be given alone or as part of a blended food pellet. Cattle are also fed oats, either whole, or ground into a coarse flour using a roller mill, burr mill, or hammer mill.
Oat straw can be used by cattle and horse producers as bedding, due to its soft, relatively dust-free, and absorbent nature.

65
Trade Manitoba exports both unprocessed oats and processed oat products. Over the last
few years, the level of unprocessed oats exported has been declining, while processed oats products being exported is on the rise.
Manitoba’s unprocessed oats have long been a popular choice for racehorse feed
and more recently for milling and cereal products in the United States; processed oats exported around the world products include oat bran, rolled oats and oat flour.
While the bulk of Manitoba oats and processed oat products are destined for the
United States, other destinations oats include Japan and several countries in the Far East, Colombia, Chile and several other nations in Latin and South America.
Oat production has remained steady for the past 10 years and world trade in oats
has remained virtually unchanged for the past 2 years. The US is the world's largest importer of oats, on average accounting for 83% of
world oat exports. It is also the world’s 4th largest oat producer, generally using about 1/3 of its total yearly oat supply for food/industrial use and about 2/3 for feed.
Mexico is the world's 2nd largest oat importer at 4%, followed by Japan which
accounts for 3% of world oat imports. Canada, the EU and Australia on average account for 83%, 6% and 6%,
respectively, of world oat exports. Canada is the world’s largest exporter of oats - on average it accounts for 83% of
global oat exports. 92-99% of Canada's oats and oat product are exported to 4 major commercial markets in the US, including: 1) milling and industrial demand for oats with stringent purity good groat yield, 2) performance feed demand from the southern US horse market for high quality
white oats; although there is competition from corn in pelleted complete rations, 3) general feed market for beef cattle and horses; this market is highly competitive
and price-responsive with a high degree of substitutability, 4) specialty demand from organic, birdseed, and health food markets.
The EU is the world's largest oat producing region, on average producing about 1/3
of the world's oats. Finland and Sweden are the main oat producers while Poland and Germany are minor producers. Nearly all of the EU's oat production is used internally and only about 6% is exported.
Oat production in Australia, concentrated mainly in New South Wales and Western
Australia, averages about 6% of total world oat exports, mainly high quality oats for human consumption. Because of location, Australian oats generally are utilized by the Asian markets, mainly India, Japan and Korea.
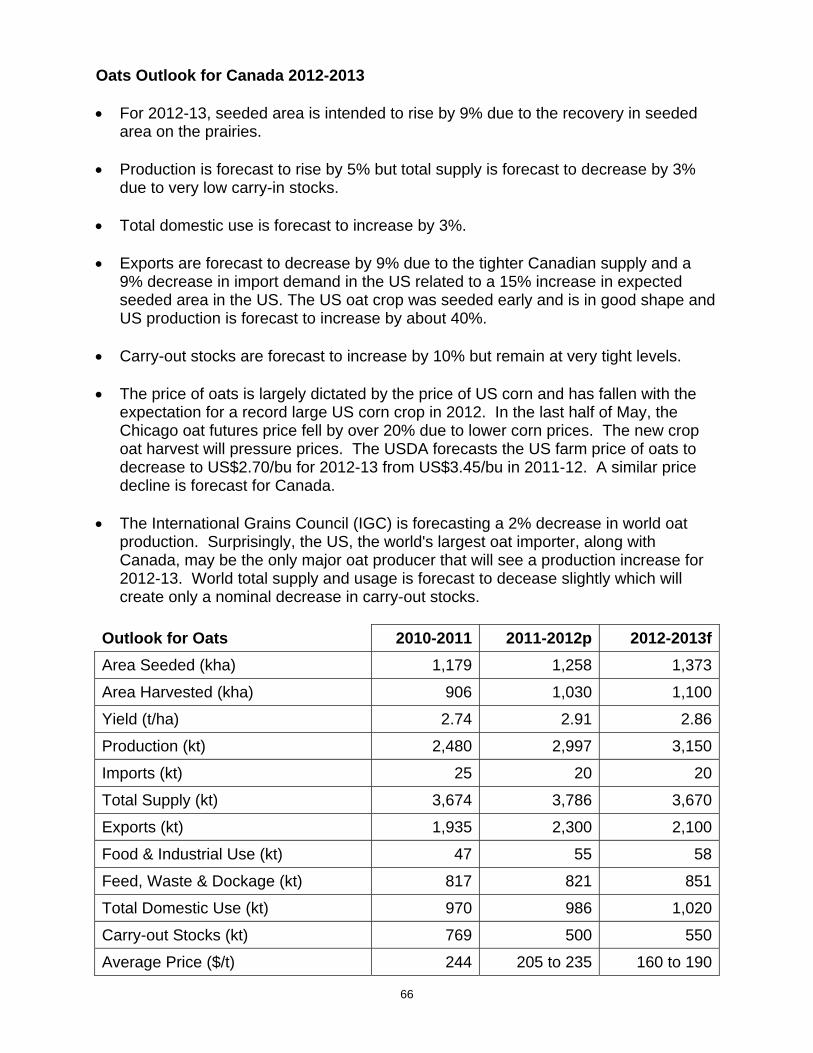
66
Oats Outlook for Canada 2012-2013 For 2012-13, seeded area is intended to rise by 9% due to the recovery in seeded
area on the prairies. Production is forecast to rise by 5% but total supply is forecast to decrease by 3%
due to very low carry-in stocks. Total domestic use is forecast to increase by 3%. Exports are forecast to decrease by 9% due to the tighter Canadian supply and a
9% decrease in import demand in the US related to a 15% increase in expected seeded area in the US. The US oat crop was seeded early and is in good shape and US production is forecast to increase by about 40%.
Carry-out stocks are forecast to increase by 10% but remain at very tight levels. The price of oats is largely dictated by the price of US corn and has fallen with the
expectation for a record large US corn crop in 2012. In the last half of May, the Chicago oat futures price fell by over 20% due to lower corn prices. The new crop oat harvest will pressure prices. The USDA forecasts the US farm price of oats to decrease to US$2.70/bu for 2012-13 from US$3.45/bu in 2011-12. A similar price decline is forecast for Canada.
The International Grains Council (IGC) is forecasting a 2% decrease in world oat production. Surprisingly, the US, the world's largest oat importer, along with Canada, may be the only major oat producer that will see a production increase for 2012-13. World total supply and usage is forecast to decease slightly which will create only a nominal decrease in carry-out stocks.
Outlook for Oats 2010-2011 2011-2012p 2012-2013f
Area Seeded (kha) 1,179 1,258 1,373
Area Harvested (kha) 906 1,030 1,100
Yield (t/ha) 2.74 2.91 2.86
Production (kt) 2,480 2,997 3,150
Imports (kt) 25 20 20
Total Supply (kt) 3,674 3,786 3,670
Exports (kt) 1,935 2,300 2,100
Food & Industrial Use (kt) 47 55 58
Feed, Waste & Dockage (kt) 817 821 851
Total Domestic Use (kt) 970 986 1,020
Carry-out Stocks (kt) 769 500 550
Average Price ($/t) 244 205 to 235 160 to 190

67
Source: Statistics Canada and Agriculture and Agri-Food Canada, June 2012
0
200
400
600
800
1,000
1,200
1,400
2000 2001 2002 2003 2004 2005 2006 2007 2008 2009 2010 2011
TH
OU
SA
ND
AC
RE
S
YEAR
Oats - Seeded Acres in Manitoba2000 - 2011
Industry Intelligence Section, MAFRISource: Statistics Canada
0
200
400
600
800
1,000
1,200
2000 2001 2002 2003 2004 2005 2006 2007 2008 2009 2010 2011
TH
OU
SA
ND
AC
RE
S
YEAR
Oats - Harvested Acres in Manitoba2000 - 2011
Industry Intelligence Section, MAFRISource: Statistics Canada

68
0
10
20
30
40
50
60
70
80
90
100
2000 2001 2002 2003 2004 2005 2006 2007 2008 2009 2010 2011
BU
SH
EL
S P
ER
AC
RE
YEAR
Oats - Yield per Acre in Manitoba2000 - 2011
Industry Intelligence Section, MAFRISource: Statistics Canada
0
200
400
600
800
1,000
1,200
1,400
2000 2001 2002 2003 2004 2005 2006 2007 2008 2009 2010 2011
TH
OU
SA
ND
TO
NN
ES
YEAR
Oats - Tonnes Produced in Manitoba2000 - 2011
Industry Intelligence Section, MAFRISource: Statistics Canada

69
0
50
100
150
200
250
2000 2001 2002 2003 2004 2005 2006 2007 2008 2009 2010 2011
DO
LL
AR
S P
ER
TO
NN
E
YEAR
Oat Prices in Manitoba2000 - 2011
Industry Intelligence Section, Source: Statistics Canada
0
50
100
150
200
250
2000 2001 2002 2003 2004 2005 2006 2007 2008 2009 2010 2011
MIL
LIO
NS
OF
DO
LL
AR
S
YEAR
Value of Oat Production in Manitoba2000 - 2011
Industry Intelligence Section, MAFRISource: STC, AAFC, MAFRI

70
0
50
100
150
200
250
2000 2001 2002 2003 2004 2005 2006 2007 2008 2009 2010 2011
DO
LL
AR
S P
ER
AC
RE
YEAR
Cost of Oat Production in Manitoba2000 – 2011
Operating Costs of Production Total Costs of Production (including labour) Total Costs of Production (including labour)
Industry Intelligence Section, MAFRISource: MAFRI
0
20
40
60
80
100
120
140
160
180
200
2000 2001 2002 2003 2004 2005 2006 2007 2008 2009 2010 2011
MIL
LIO
NS
OF
DO
LL
AR
S
YEAR
Farm Cash Receipts for Oats in Manitoba2000 – 2011
Industry Intelligence Section, MAFRISource: Statistics Canada

71
0 200 400 600 800 1,000 1,200
2000-01
2001-02
2002-03
2003-04
2004-05
2005-06
2006-07
2007-08
2008-09
2009-10
2010-11
2011-12
THOUSAND TONNES
CR
OP
YE
AR
Marketings of Manitoba Oats2000 - 2011
Industry Intelligence Section, MAFRISource: STC, AAFC, MAFRI
0
50
100
150
200
250
2000 2001 2002 2003 2004 2005 2006 2007 2008 2009 2010 2011
MIL
LIO
NS
OF
DO
LL
AR
S
YEAR
Manitoba Oats Exports2000 – 2011
Industry Intelligence Section, MAFRISource: Statistics Canada

72
Farm Supply and Disposition of Manitoba Oat Crop, 2000/01 to 2011/12
000 tonnes 2005-06 2006-07 2007-08 2008-09 2009-10 2010-11 2011-12
Opening Stocks Aug1 120 75 55 100 250 160 130
Production 441 967 1,205 1,117 771 655 416
Total Supply 561 1,042 1,260 1,217 1,021 815 546
Marketings 448 867 1,104 784 824 637 400
Seed 27 30 25 17 17 14 15
Carry-over 75 55 101 250 160 129 100
Feed/ Waste/ Dockge 11 90 30 166 20 35 31
Total Disposition 561 1,042 1,260 1,217 1,021 815 546
000 bushels 2005-06 2006-07 2007-08 2008-09 2009-10 2010-11 2011-12
Opening Stocks Aug1 16,076 11,946 7,808 5,741 10,564 11,483 3,674
Production 27,700 47,551 54,900 51,501 44,001 22,400 12,002
Total Supply 43,776 59,498 62,708 57,243 54,565 33,883 15,676
Marketings 17,001 25,026 35,571 18,980 20,319 17,349 6,890
Seed 1,149 1,400 1,118 960 658 439 219
Carry-over 11,946 7,808 5,741 10,564 11,482 3,674 3,674
Feed/ Waste/ Dockge 13,679 25,264 20,278 26,738 22,105 12,420 4,893
Total Disposition 43,776 59,498 62,708 57,243 54,565 33,883 15,676
OATS - Common Conversions 1 metric tonne oats = 64.841 bushels. There are 34 pounds in 1 bushel of oats.

73
Production and Value of Manitoba Oats Seeded Harvested Average Price per Total
Year Area Area Yield Production Tonne Value(hectares) (hectares) (kg per ha) (tonnes) ($/tonne) ($000)
1990 186,200 145,700 2,300 339,300 67 22,7331991 155,399 109,300 2,000 222,100 84 18,6561992 230,700 194,200 2,900 555,200 98 54,4101993 242,800 202,300 2,400 493,500 97 47,8701994 303,500 263,000 2,500 663,200 98 64,9941995 303,500 263,000 2,400 624,600 146 91,1921996 424,900 388,500 2,700 1,056,400 137 144,7271997 323,700 283,300 2,600 735,600 125 91,9501998 404,700 364,200 2,800 1,030,200 111 114,3521999 327,800 295,400 2,900 854,400 91 77,7502000 384,500 348,000 2,900 1,016,300 89 90,1972001 368,300 323,700 2,300 748,000 129 96,3122002 465,400 404,700 2,500 1,017,900 173 175,6282003 394,600 344,000 3,000 1,033,300 140 145,0862004 337,900 271,100 3,300 889,900 133 118,2942005 285,300 230,700 1,900 440,700 128 56,3482006 382,800 339,900 2,800 967,400 135 130,2802007 424,900 398,600 3,000 1,204,500 170 204,2352008 348,000 323,700 3,400 1,116,600 209 233,7942009 242,800 228,600 3,400 771,100 154 119,0962010 242,800 228,600 2,900 655,400 161 105,3422011 202,300 167,900 2,500 416,400 218 90,642
Seeded Harvested Average Price per TotalYear Area Area Yield Production Bushel Value
(acres) (acres) (bu per acre) (000 bushels) ($/bushel) ($000)1990 460,000 360,000 61.1 22,000 1.03 22,7331991 383,999 270,000 53.3 14,400 1.30 18,6561992 570,000 480,000 75.0 36,000 1.51 54,4101993 600,000 500,000 64.0 32,000 1.50 47,8701994 750,000 650,000 66.2 43,000 1.51 64,9941995 750,000 650,000 62.3 40,500 2.25 91,1921996 1,050,000 960,000 71.4 68,500 2.11 144,7271997 800,000 700,000 68.1 47,700 1.93 91,9501998 1,000,000 900,000 74.2 66,800 1.71 114,3521999 810,000 730,000 75.9 55,400 1.40 77,7502000 950,000 860,000 76.6 65,900 1.37 90,1972001 910,000 800,000 60.6 48,500 1.99 96,3122002 1,150,000 1,000,000 66.0 66,000 2.66 175,6282003 975,000 850,000 78.8 67,000 2.17 145,0862004 835,000 670,000 86.1 57,700 2.05 118,2942005 705,000 570,000 50.1 28,575 1.97 56,3482006 945,847 840,000 74.7 62,730 2.08 130,2802007 1,050,000 985,000 79.3 78,100 2.62 204,2352008 860,000 800,000 90.5 72,400 3.23 233,7942009 600,000 565,000 88.5 50,000 2.38 119,0962010 600,000 565,000 75.2 42,500 2.48 105,3422011 500,000 415,000 65.1 27,000 3.36 90,642Source: Statistics Canada; Agriculture and Agri-Food Canada; Manitoba Agriculture, Food and Rural Initiatives.

74
OVERVIEW OF THE BARLEY SECTOR IN MANITOBA
Barley is one of the oldest crops in the world since it was domesticated thousands of years ago. It is a member of the grass family of plants and is grown worldwide.
Canada is one of the world's largest barley producers and exporters, renowned for its consistent high quality, used in the malt, feed, and food industries.
In 2011, Manitoba reported 2,417 barley farms compared to 4,339 in 2006. This represents 8.1% of barley farms in Canada. Annually, Manitoba produces approximately 7 to 8% of Canada's total barley production.
Production of barley in Manitoba peaked in the early 1980s with over 2 million acres
harvested annually. More recently, barley production in the province has declined, largely due to low barley prices on the world market.
There are two broad categories of barley varieties: two-row and six-row. Both
varieties are used by the malting and livestock feed industries. Over 50 barley varieties are registered for production in Western Canada including 8 hulless, 13 malting and several others ideally suited to feed.
Each year a portion of Manitoba's barley crop is selected for use by either the
domestic or foreign food and beverage industries and the remainder is used domestically for animal feed, mainly in Manitoba's pork industry.
Only about 20% of the total malting barley grown is selected by maltsters, based on
taste and purity; the remainder ends up primarily as livestock feed. The financial premium for malting barley over livestock feed is generally about $50 per tonne and farmers follow highly exacting requirements in every stage of production, harvesting and storage to increase the likelihood that their grain will be selected for malting.
Manitoba Manitoba Canada Canada
Barley 2011 2006 2011 2006Number of farms 2,417 4,339 29,943 43,411Acres 483,432 837,758 6,888,693 9,118,090Hectares 195,638 339,029 2,787,755 3,689,960Source: Census of Agriculture 2011

75
Processing Barley in Manitoba Domestically, barley is processed into malt, used as a food ingredient for human
consumption, and consumed as livestock feed. Malt is the main ingredient for brewing beer. Various specialty malt with particular
colour or flavour intensities can be produced by selecting barley types and by varying the process conditions employed. Manitoba has one major maltster, Dominion Malting Ltd., and the malt is either used by the province's breweries, such as Fort Garry Brewing Co. Ltd., or exported.
Quality trends for malting barley focus on specific quality characteristics that provide
direct economic value to its customers including filterability, head retention, improved shelf life, haze and flavour. The ongoing trend towards tighter specifications is driving higher extract varieties. Selection, on a least cost basis, of varieties based on individual quality characteristics enable maltsters to achieve the specific demands of brewers.
Barley grain can be milled to produce barley flour, flakes, bran and used to make
noodles, breakfast cereals and instant baby formulas. Some of the selected or designated barley is processed into pot or pearl barley, flavourings and extracts, bioproducts and as a sweetener in a variety of foods.
Barley is an excellent source of dietary fibre (soluble and insoluble), protein and
complex carbohydrates, and is a good source of certain vitamins and minerals. Beta-glucan is a major component of barley soluble fibre found throughout the kernel, with slightly higher concentrations in the outer layers. “Waxy” barley varieties are higher in beta-glucans than other barleys. Barley contains a high concentration of tocotrienols and tocopherols (tocols) - oils that act as natural antioxidants. It is a good source of B-vitamins and minerals.
Barley is also used as livestock feed. To improve its digestibility, barley grain is
cracked or rolled for cattle feed and ground to make feed for hogs and chickens. Barley straw is the dried stems of the barley plant after the head that holds the grain
kernels has been removed. Straw is often used as a soft, dry bed for livestock. It can also be made into building materials, paper, newsprint and fibreboard.
To make silage, the entire plant is cut down, piled, compacted, and then allowed to
ferment. Fermentation preserves this highly nutritious feed for beef and dairy cattle. Barley is expected to face increased competition due to greater supplies of ddgs
resulting from the expansion of the ethanol sector in Canada and in the US. While barley cultivars are generally developed for the conventional malting and feed
markets, breeding efforts targeting specialty markets include hull-less barley cultivars for the poultry and hog industries, and cultivars with high beta-glucan content and/or waxy types (special starch composition) for specialty food markets.

76
Trade The majority of Manitoba's exported barley is malting barley in unprocessed form,
while smaller amounts of barley malt and malt extract are also exported. Of the total malting barley destined for alcohol, about three-quarters is brewed in
Canada. The other quarter is exported to international brewers, mostly in China, the United States, South Africa, Colombia, Japan and Mexico.
Canada has consistently been a major producer of high-quality barley on the world
stage. Strict quality standards of the Canadian Grain Commission's grain quality program include varietal control, licensing of elevators, product inspection and weighing, and sanitation and quality monitoring programs.
Contracts and options for feed barley can be traded on the Winnipeg Commodity
Exchange. Barley is grown in about 100 countries with major production centered in the
European Union, North America, the Black Sea region and Australia. In Japan, roughly 80% of barley is consumed as feed where it is used in the
production of compound and mixed feed for the cattle sector. It is particularly important in feeding beef cattle because it produces high quality beef with the white marbling that Japanese consumers favour. The largest non-feed uses are for the production of shochu, a traditionally distilled liquor, and beer. Other uses include miso (soybean paste) and barley tea. Yearly consumption of barley is estimated to be around 1.6 million tonnes but demand for barley is expected to decrease over the next few years as the cattle population continues to shrink.
In China, barley is mostly used for brewing but domestic barley production is
inadequate to supply the expanding brewing industry. The sector's total demand for malting barley is estimated at 4.5 million tonnes annually. The recent sharp declines in international barley prices is expected to mitigate China's practice of substituting feed barley for malting barley in beer production with a subsequent impact on quality. Due to the high barley prices in recent years, brewers had reduced the use of malting barley and lowered the wort density in efforts of marketing beer with a lighter taste. Other ingredients frequently used by brewers as a substitute for malting barley include rice, wheat and syrup.
The global expansion in flour milling and vegetable oil processing is generating
greater quantities of by-product which in turn is increasing the development of feed mills for pelletized feed and other complex feed grain products.
World feed barley trade has declined over the last 10 years, resulting from changing
customer requirements, price sensitiveness and a trend towards least cost formulation feed mixes. Ongoing emphasis on yield is expected to direct more attention on nutritional aspects within the grain mix of feed barley, while the high metabolic energy varieties focus more on quality.

77
Barley Outlook for Canada 2012-2013 For 2012-13, seeded area is forecast to increase by 23% due to good prices and
lower summerfallow, and harvested area is expected to increase by 21%. Production is forecast to increase by 19% and remain at trend levels. Total supply is forecast to increase by only 9% due to lower carry-in stocks. Domestic feed use is forecast to increase only slightly. Total exports are forecast to decrease slightly due to increased competition as larger
world barley crops and malt supplies are expected. Carry-out stocks are forecast to double due to increased supply. The in-store Lethbridge price for feed barley is forecast to decrease from 2011-12
due to the increase in total barley supply and a sharp decline in US corn prices. Lower US corn prices in 2012-13 could make US corn and DDGS imports more competitive against prairie barley. In the 2012-13 crop year, the CWB will market only the single grade of Select 2Row malt barley for its two pools, the Early and Harvest pools, which are six, and 12 months, respectively. Any grades other than Select will be handled through its cash-trading division. If a producer's malt barley goes out-of-condition and gets de-selected they will have the opportunity to deliver the feed barley against a CWB spot feed barley contract.
There are ample old crop malt barley supplies in Australia and good new crop
prospects forecast for Argentina, the EU and US. Although winter barley had suffered setbacks in the EU, larger spring barley area and good conditions will more than offset the winter crop's production decline. World carry-in barley stocks for 2012-13 are 4% lower than in 2011-12. Total world barley production and supply are forecast to increase slightly. Due to lower trade, world barley carry-out stocks are forecast to rise by 5%.
Outlook for Barley 2010-2011 2011-2012p 2012-2013f
Area Seeded (kha) 2,797 2,619 3,225Area Harvested (kha) 2,387 2,365 2,850Yield (t/ha) 3.19 3.28 3.23Production (kt) 7,605 7,756 9,200Imports (kt) 43 42 42Total Supply (kt) 10,231 9,239 10,042Exports (kt) 2,014 1,900 1,800Food & Industrial Use (kt) 144 136 137Feed, Waste & Dockage (kt) 6,406 6,168 6,255Total Domestic Use (kt) 6,776 6,539 6,642Carry-out Stocks (kt) 1,441 800 1,600Average Price ($/t) 188 205 to 235 175 to 205Source: Statistics Canada and Agriculture and Agri-Food Canada, June 2012
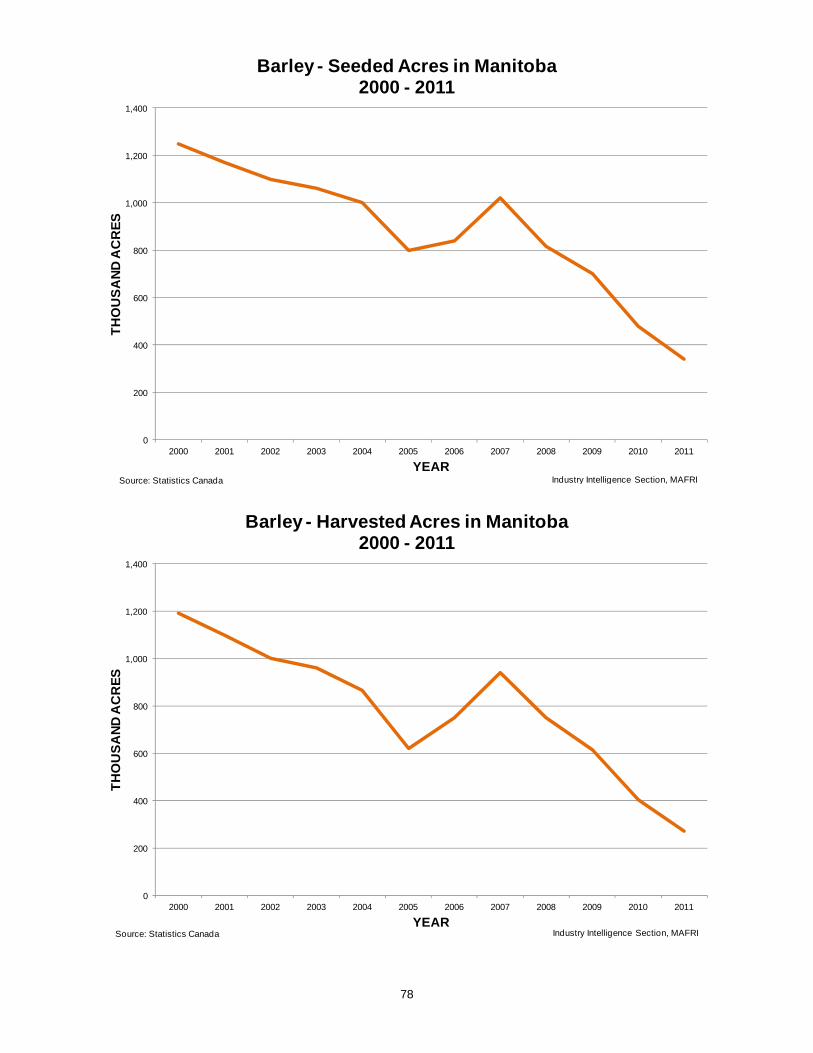
78
0
200
400
600
800
1,000
1,200
1,400
2000 2001 2002 2003 2004 2005 2006 2007 2008 2009 2010 2011
TH
OU
SA
ND
AC
RE
S
YEAR
Barley - Seeded Acres in Manitoba2000 - 2011
Industry Intelligence Section, MAFRISource: Statistics Canada
0
200
400
600
800
1,000
1,200
1,400
2000 2001 2002 2003 2004 2005 2006 2007 2008 2009 2010 2011
TH
OU
SA
ND
AC
RE
S
YEAR
Barley - Harvested Acres in Manitoba2000 - 2011
Industry Intelligence Section, MAFRISource: Statistics Canada
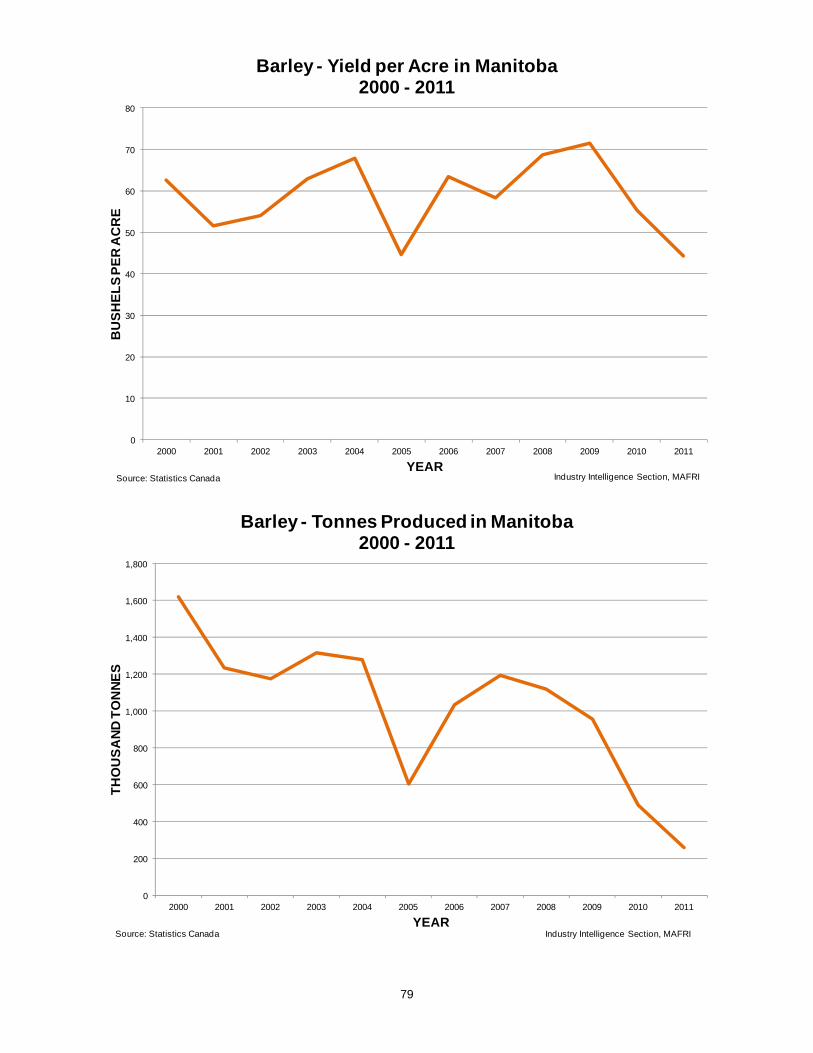
79
0
10
20
30
40
50
60
70
80
2000 2001 2002 2003 2004 2005 2006 2007 2008 2009 2010 2011
BU
SH
EL
S P
ER
AC
RE
YEAR
Barley - Yield per Acre in Manitoba2000 - 2011
Industry Intelligence Section, MAFRISource: Statistics Canada
0
200
400
600
800
1,000
1,200
1,400
1,600
1,800
2000 2001 2002 2003 2004 2005 2006 2007 2008 2009 2010 2011
TH
OU
SA
ND
TO
NN
ES
YEAR
Barley - Tonnes Produced in Manitoba2000 - 2011
Industry Intelligence Section, MAFRISource: Statistics Canada

80
0
20
40
60
80
100
120
140
160
180
200
2000 2001 2002 2003 2004 2005 2006 2007 2008 2009 2010 2011
DO
LL
AR
S P
ER
TO
NN
E
YEAR
Barley Prices in Manitoba2000 - 2011
Industry Intelligence Section, MAFRISources: STC, AAFC, MAFRI
0
50
100
150
200
250
2000 2001 2002 2003 2004 2005 2006 2007 2008 2009 2010 2011
MIL
LIO
NS
OF
DO
LL
AR
S
YEAR
Value of Barley Production in Manitoba 2000 - 2011
Industry Intelligence Section, MAFRISource: STC, AAFC, MAFRI

81
0
50
100
150
200
250
2000 2001 2002 2003 2004 2005 2006 2007 2008 2009 2010 2011
DO
LL
AR
S P
ER
AC
RE
YEAR
Cost of Barley Production per Acre in Manitoba2000 - 2011
Operating costs of production Fixed costs, including labour Total costs of production
Industry Intelligence Section, MAFRISource: Statistics Canada
0
20
40
60
80
100
120
2000 2001 2002 2003 2004 2005 2006 2007 2008 2009 2010 2011
MIL
LIO
NS
OF
DO
LL
AR
S
YEAR
Farm Cash Receipts for Barley in Manitoba2000 – 2011
Industry Intelligence Section, MAFRISource: Statistics Canada
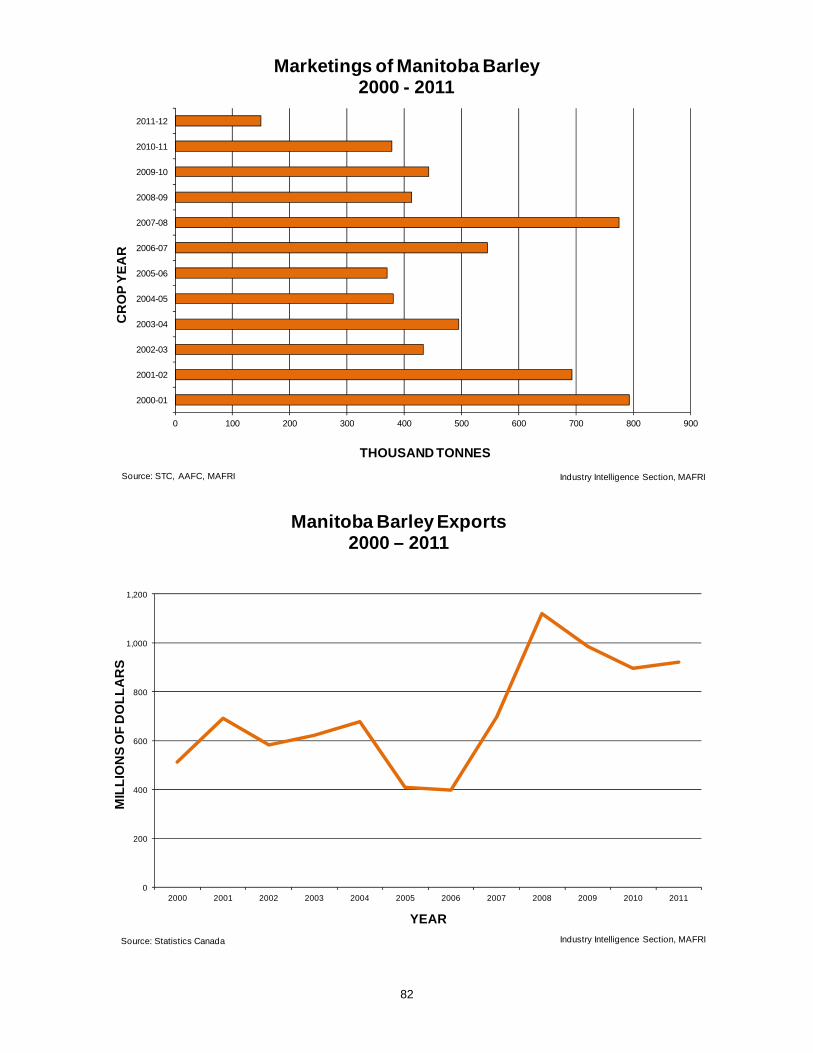
82
0 100 200 300 400 500 600 700 800 900
2000-01
2001-02
2002-03
2003-04
2004-05
2005-06
2006-07
2007-08
2008-09
2009-10
2010-11
2011-12
THOUSAND TONNES
CR
OP
YE
AR
Marketings of Manitoba Barley2000 - 2011
Industry Intelligence Section, MAFRISource: STC, AAFC, MAFRI
0
200
400
600
800
1,000
1,200
2000 2001 2002 2003 2004 2005 2006 2007 2008 2009 2010 2011
MIL
LIO
NS
OF
DO
LL
AR
S
YEAR
Manitoba Barley Exports2000 – 2011
Industry Intelligence Section, MAFRISource: Statistics Canada

83
Farm Supply and Disposition of Manitoba Barley Crop, 2000/01 to 2011/12
000 tonnes 2005-06 2006-07 2007-08 2008-09 2009-10 2010-11 2011-12
Opening Stocks Aug1 350 260 170 125 230 250 80
Production 603 1,035 1,195 1,121 958 488 261
Total Supply 953 1,295 1,365 1,246 1,188 738 341
Marketings 370 545 774 413 442 378 150
Seed 25 30 24 21 14 10 5
Carry-over 260 170 125 230 250 80 80
Feed/Waste/Dockage 298 550 442 582 481 270 107
Total Disposition 953 1,295 1,365 1,246 1,188 738 341
000 bushels 2005-06 2006-07 2007-08 2008-09 2009-10 2010-11 2011-12
Opening Stocks Aug1 16,076 11,946 7,808 5,741 10,564 11,483 3,674
Production 27,700 47,551 54,900 51,501 44,001 22,400 12,002
Total Supply 43,776 59,498 62,708 57,243 54,565 33,883 15,676
Marketings 17,001 25,026 35,571 18,980 20,319 17,349 6,890
Seed 1,149 1,400 1,118 960 658 439 219
Carry-over 11,946 7,808 5,741 10,564 11,482 3,674 3,674
Feed/Waste/Dockage 13,679 25,264 20,278 26,738 22,105 12,420 4,893
Total Disposition 43,776 59,498 62,708 57,243 54,565 33,883 15,676
BARLEY - Common Conversions 1 metric tonne barley = 45.929 bushels. There are 48 pounds in 1 bushel of barley.

84
Production and Value of Manitoba Barley Seeded Harvested Average Price per Total
Year Area Area Yield Production Tonne Value(hectares) (hectares) (kg per ha) (tonnes) ($/tonne) ($000)
1990 635,400 607,000 3,200 1,959,500 79 154,8401991 544,457 505,900 2,800 1,426,100 80 114,7301992 455,300 424,900 3,700 1,567,600 85 132,6801993 465,400 445,200 2,800 1,241,000 80 99,2801994 445,200 424,900 3,100 1,328,100 97 128,8301995 485,600 465,400 2,900 1,328,100 163 216,4801996 627,300 627,300 3,400 2,111,900 118 249,2001997 566,600 546,300 3,100 1,685,200 108 182,0801998 526,100 501,800 3,200 1,630,800 94 153,4401999 429,000 404,700 3,000 1,214,900 94 114,2012000 505,900 481,600 3,400 1,622,000 81 131,2522001 473,500 445,200 2,800 1,234,500 105 129,6352002 445,200 404,700 2,900 1,175,700 133 156,5912003 429,000 388,500 3,400 1,317,200 115 151,0172004 404,700 350,100 3,700 1,278,000 100 128,1962005 323,700 250,900 2,400 603,100 78 46,8672006 339,000 303,500 3,400 1,035,300 84 87,1722007 412,800 380,400 3,100 1,195,300 132 157,3852008 329,800 303,500 3,700 1,121,300 183 205,1532009 283,300 248,900 3,800 958,000 161 154,3052010 194,200 163,900 3,000 487,700 128 62,3572011 137,600 109,300 2,400 261,300 168 43,985
Seeded Harvested Average Price per TotalYear Area Area Yield Production Bushel Value
(acres) (acres) (bu per acre) (000 bushels) ($/bushel) ($000)1990 1,570,000 1,500,000 60.0 90,000 1.72 154,8401991 1,345,382 1,250,000 52.4 65,500 1.75 114,7301992 1,125,000 1,050,000 68.6 72,000 1.84 132,6801993 1,150,000 1,100,000 51.8 57,000 1.74 99,2801994 1,100,000 1,050,000 58.1 61,000 2.11 128,8301995 1,200,000 1,150,000 53.0 61,000 3.55 216,4801996 1,550,000 1,550,000 62.6 97,000 2.57 249,2001997 1,400,000 1,350,000 57.3 77,400 2.35 182,0801998 1,300,000 1,240,000 60.4 74,900 2.05 153,4401999 1,060,000 1,000,000 55.8 55,800 2.05 114,2012000 1,250,000 1,190,000 62.6 74,500 1.76 131,2522001 1,170,000 1,100,000 51.5 56,700 2.29 129,6352002 1,100,000 1,000,000 54.0 54,000 2.90 156,5912003 1,060,000 960,000 63.0 60,500 2.50 151,0172004 1,000,000 865,000 67.9 58,700 2.18 128,1962005 800,000 620,000 44.7 27,700 1.69 46,8672006 837,758 750,000 63.4 47,550 1.83 87,1722007 1,020,000 940,000 58.4 54,900 2.87 157,3852008 815,000 750,000 68.7 51,500 3.98 205,1532009 700,000 615,000 71.5 44,000 3.51 154,3052010 480,000 405,000 55.3 22,400 2.78 62,3572011 340,000 270,000 44.4 12,000 3.67 43,985Source: Statistics Canada; Agriculture and Agri-Food Canada; Manitoba Agriculture, Food and Rural Initiatives.

85
OVERVIEW OF THE RYE SECTOR IN MANITOBA
Rye production in Canada has traditionally been centered in Western Canada, with Saskatchewan usually reporting the highest rye acreage followed by Alberta and Manitoba.
Rye is not a major crop in Canada. This
multiple use crop is used as a cereal grain, forage, and annual pasture, and because the land seeded for forage and pasture is often not reported, production statistics understate the actual area planted to rye.
In 2011, Manitoba reported 376 fall rye farms and 18 spring rye farms compared to
593 and 46 respectively in 2006. This represents 15.4% of fall rye farms and 8.3% of spring rye farms in Canada and approximately 23 to 28% of Canada's total rye production.
Rye Manitoba Manitoba Canada Canada
2011 2006 2011 2006Fall Rye Number of farms 376 593 2,448 4,458Acres 59,774 90,104 262,261 488,275Hectares 24,190 36,464 106,133 197,598Spring Rye Number of farms 18 46 215 482Acres 2,101 5,730 23,864 43,460Hectares 850 2,319 9,657 17,588Source: Census of Agriculture 2011
Rye is a hardy crop with good frost and drought resistance. Although it is versatile
and adapts well to a variety of soil and moisture conditions, production and acreage statistics show that rye is not a major crop anywhere in Canada.
Given low production volumes, elevator companies often find it difficult to ship rye as
often not enough is available to fill a railcar. Fall-seeded rye provides cover for the ground from late fall to early spring, reducing
erosion, and allows the crop to take full advantage of spring moisture and escape disease.

86
Processing Rye in Manitoba Rye has a variety of uses. It is a grain and forage crop. Rye has a characteristic flavor that people enjoy. It is dark in colour, relatively low
level of gluten proteins and high levels of soluble fibre. Rye grain can be milled into flour and used in bread and bakery products. It is the
key ingredient in traditional rye and pumpernickel breads. Rye flour is used alone to produce the “black” bread consumed extensively in eastern Europe and parts of Asia. “Light-rye” breads are made from rye and wheat flours mixed in varying proportions. Small quantities of rye are used in production of baked specialty products, such as flat breads and rye crisps.
Rye grain can also be eaten whole, either as boiled rye berries, or by being rolled,
similar to rolled oats. Substantial quantities of rye grain are used to make beer, rye whiskies and vodka. Other uses of rye include medicinal uses, animal bedding and fruit and vegetable
mulch. Rye starch is frequently used in adhesives, matches and plastics. Small quantities of rye straw are used in the manufacture of strawboard and paper.
In Canada rye is grown mostly for grain and used in livestock feeds with lesser
amounts for distilling and food uses. Farmers in the United States grow rye for both grain and forage. In the US, rye for
grain is used to make flour, animal feed and beer. The adaptability, versatility and quality of fall rye provides producer flexibility while
maintaining a high quality forage program. Fall rye can provide early season grazing in May and June and in many areas fall rye is cut for emergency hay supplies.
Rye is used as a forage in the form of green chop, pasture, haylage or hay. It can
be used alone or mixed with clover or ryegrass. Rye grain is extensively utilized as livestock feed, although in small proportions in
mixtures with other grains. The amount of rye grain that can be included in mixed animal feeds continues to increase with improvements in feed production technology and the use of various enzymes to improve palatability.
Rye straw, which is fibrous and tough, is used extensivley as livestock bedding. Despite its desirable attributes, rye is likely to remain a minor crop. Its utilization in
food products, animal feed and fuel stock for ethanol production, is likely to remain limited until there is better identification of its quality characteristics along with appropriate breeding work and promotion of beneficial effects.

87
Trade The export trade provides a large share of the total market for Canada's rye crop. Canada is the world's largest exporter of rye yet, on average, Canada produces only
about 2% of the world's rye. World rye production is concentrated in Northern Europe - the European Union and
Russia account for about 75% of world rye production. Rye has traditionally been an important component of breads and feed grain in
Germany, Poland and Russia where significant quantities of rye continue to be produced and consumed.
European rye is used almost entirely by its domestic markets, with average
disappearance of 35% food, 17% industrial (mainly ethanol production), 44% feed and 4% residual.
The United States and Japan are Canada's largest export destinations for rye. While the US is a relatively minor player in world rye markets, it is also Canada’s
largest export market for rye. Although rye production and consumption of rye has decreased in both the US and
Canada, the decline has been more significant in the US where the milling industry requires imports of rye.
Rye is not widely traded as a commodity and offers limited potential for expanding
export markets given that it is a relatively minor crop in most of the world, both in terms of production and consumption.
About one third of the rye crop is sold in export markets where it is used mainly for
milling. Supplies for this market are erratic because of variation in sprouting damage from year to year.
The domestic feed market is considered to be a residual market for rye. After the
main markets meet their requirements, the remaining rye moves into the feed market and is priced accordingly.
In speculation of higher prices, farmers who produce rye are often willing to hold it in
storage for considerable periods of time. Rye is anticipated to continue to be an important crop for farmers. The demand for
rye is generally inelastic, given that it is often in tight supply and that there are few substitutes for rye products.

88
Rye Outlook for Canada 2012-2013 For 2012-13, seeded area is forecast to increase by 18% due to good seeding
conditions and a recovery in seedable area. Production is forecast to increase by 36% due to the increase in area. Total supply is forecast to increase by only 16% due to very low carry-in stocks. Total domestic use is forecast to increase by 13% but remain well below average
due to the overall tight supply. Total exports are forecast to increase slightly from 2011-12 as stocks are rebuilt. Carry-out stocks are forecast to increase due to production recovery but remain very
tight.
Canadian rye prices are forecast to decrease from 2011-12 but the very tight supply situation will limit the losses when compared to other coarse grains.
World rye carry-in stocks are about 45% lower than they were in 2011-12 due to the only modest increase in the northern hemisphere's production and an increase in total use. The IGC is forecasting a slight increase in world supply, despite higher production, due to very low carry-in stocks. Total world use is forecast to remain unchanged from 2011-12 but carry-out stocks are forecast to decrease due to lower supply.
Outlook for Rye 2010-2011 2011-2012p 2012-2013f
Area Seeded (kha) 130 122 144
Area Harvested (kha) 95 79 110
Yield (t/ha) 2.45 2.47 2.41
Production (kt) 232 195 265
Imports (kt) 0 1 1
Total Supply (kt) 372 247 286
Exports (kt) 193 154 164
Food & Industrial Use (kt) 42 39 40
Feed, Waste & Dockage (kt) 79 23 32
Total Domestic Use (kt) 129 73 82
Carry-out Stocks (kt) 51 20 40
Average Price ($/t) 147 175-205 165-195
Source: Statistics Canada and Agriculture and Agri-Food Canada, June 2012
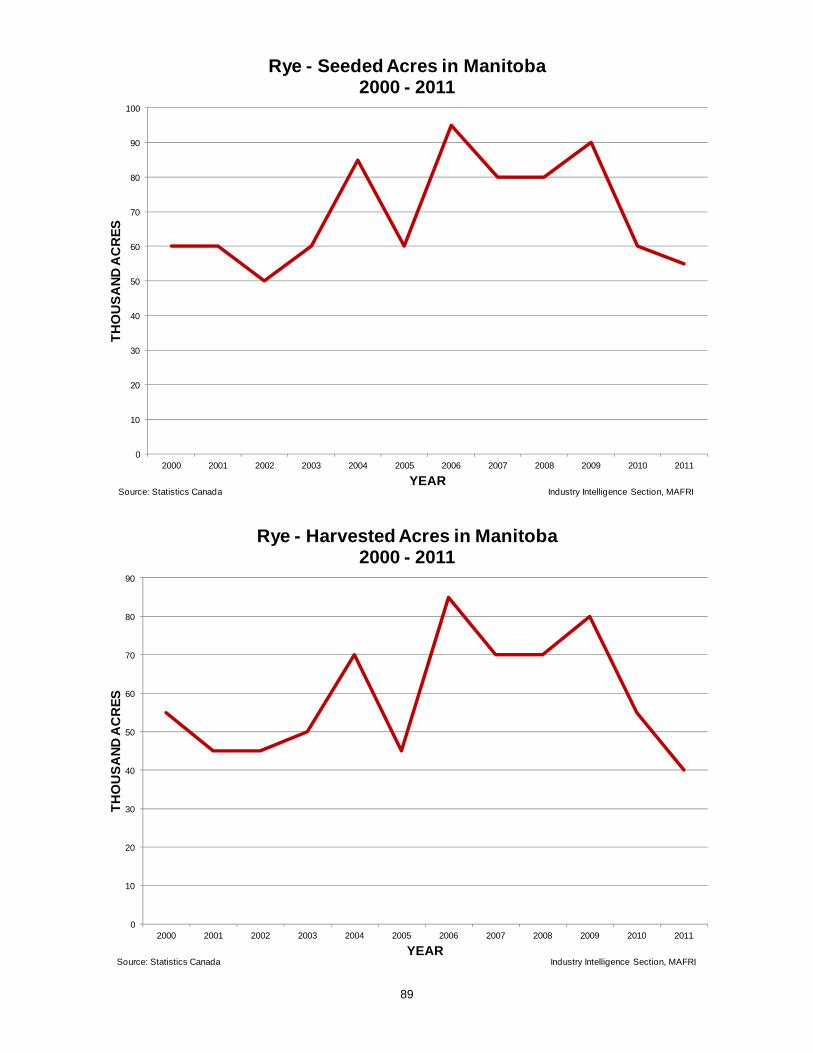
89
0
10
20
30
40
50
60
70
80
90
100
2000 2001 2002 2003 2004 2005 2006 2007 2008 2009 2010 2011
TH
OU
SA
ND
AC
RE
S
YEAR
Rye - Seeded Acres in Manitoba2000 - 2011
Industry Intelligence Section, MAFRISource: Statistics Canada
0
10
20
30
40
50
60
70
80
90
2000 2001 2002 2003 2004 2005 2006 2007 2008 2009 2010 2011
TH
OU
SA
ND
AC
RE
S
YEAR
Rye - Harvested Acres in Manitoba2000 - 2011
Industry Intelligence Section, MAFRISource: Statistics Canada
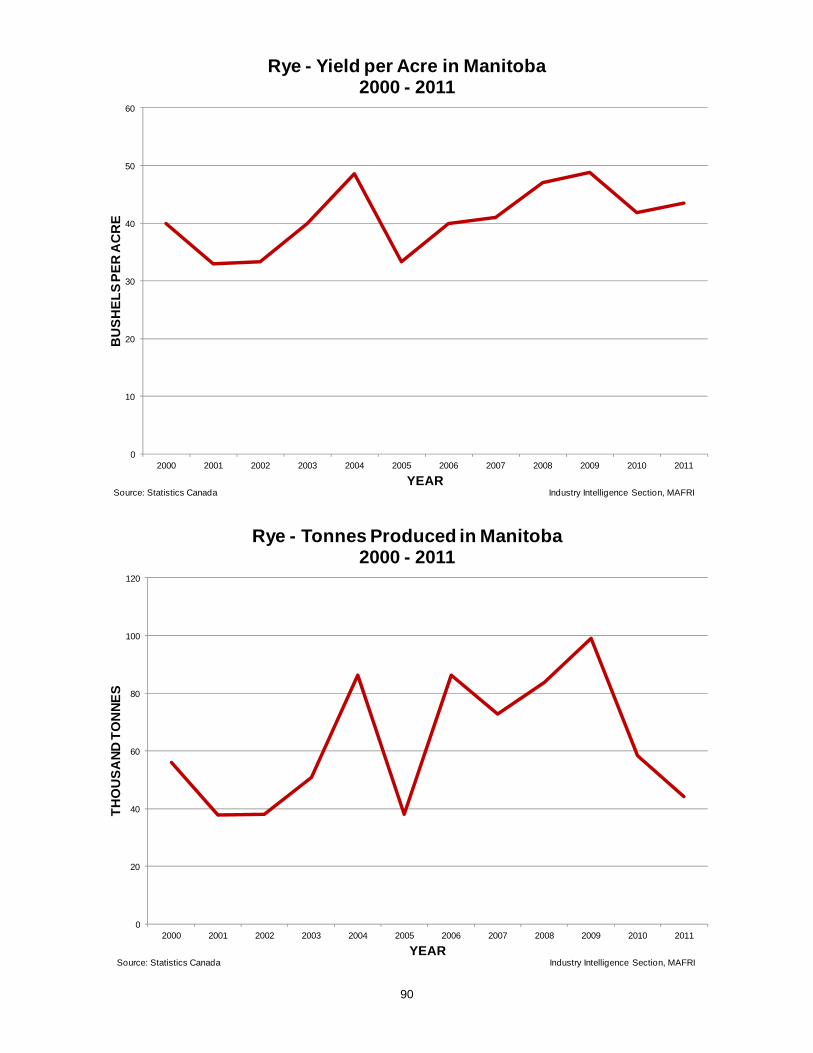
90
0
10
20
30
40
50
60
2000 2001 2002 2003 2004 2005 2006 2007 2008 2009 2010 2011
BU
SH
EL
S P
ER
AC
RE
YEAR
Rye - Yield per Acre in Manitoba2000 - 2011
Industry Intelligence Section, MAFRISource: Statistics Canada
0
20
40
60
80
100
120
2000 2001 2002 2003 2004 2005 2006 2007 2008 2009 2010 2011
TH
OU
SA
ND
TO
NN
ES
YEAR
Rye - Tonnes Produced in Manitoba2000 - 2011
Industry Intelligence Section, MAFRISource: Statistics Canada
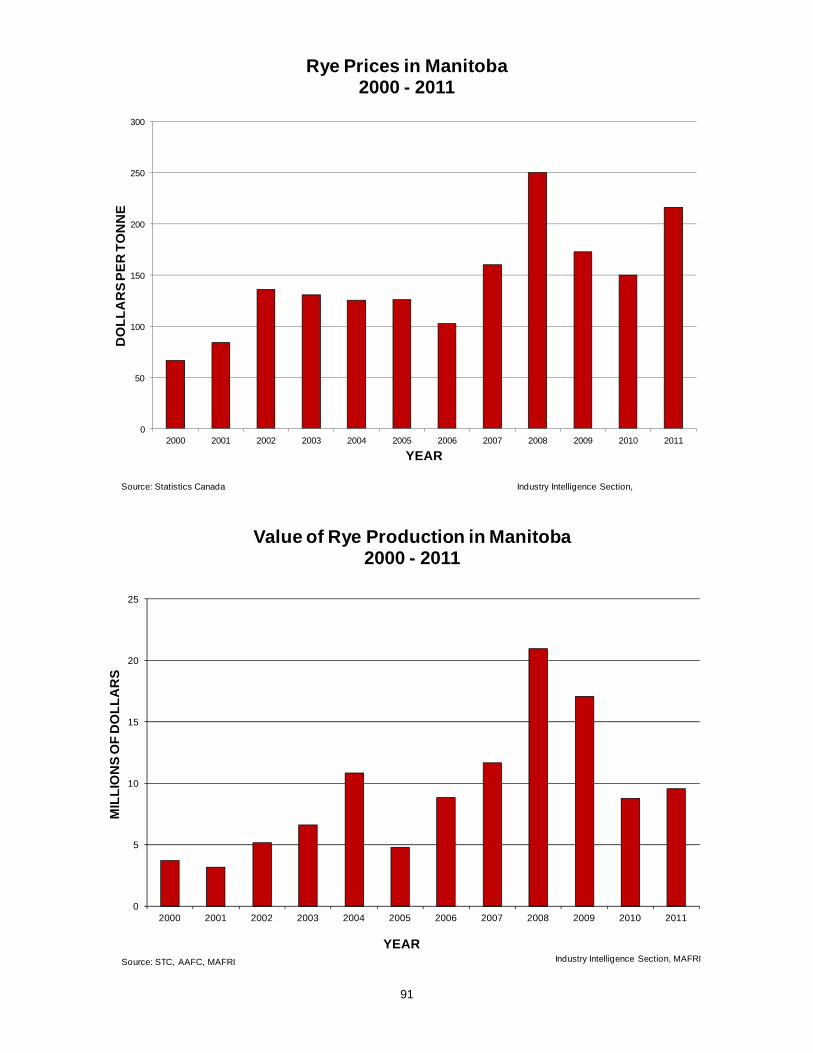
91
0
50
100
150
200
250
300
2000 2001 2002 2003 2004 2005 2006 2007 2008 2009 2010 2011
DO
LL
AR
S P
ER
TO
NN
E
YEAR
Rye Prices in Manitoba2000 - 2011
Industry Intelligence Section, Source: Statistics Canada
0
5
10
15
20
25
2000 2001 2002 2003 2004 2005 2006 2007 2008 2009 2010 2011
MIL
LIO
NS
OF
DO
LL
AR
S
YEAR
Value of Rye Production in Manitoba2000 - 2011
Industry Intelligence Section, MAFRISource: STC, AAFC, MAFRI
92
0
50
100
150
200
250
2000 2001 2002 2003 2004 2005 2006 2007 2008 2009 2010 2011
DO
LL
AR
S P
ER
AC
RE
YEAR
Cost of Rye Production in Manitoba2000 – 2011
Operating Costs of Production Total Costs of Production (including labour) Total Costs of Production (including labour)
Industry Intelligence Section, MAFRISource: MAFRI
0
2
4
6
8
10
12
14
16
2000 2001 2002 2003 2004 2005 2006 2007 2008 2009 2010 2011
MIL
LIO
NS
OF
DO
LL
AR
S
YEAR
Farm Cash Receipts for Rye in Manitoba2000 – 2011
Industry Intelligence Section, MAFRISource: Statistics Canada
93
0 10 20 30 40 50 60 70 80
2000-01
2001-02
2002-03
2003-04
2004-05
2005-06
2006-07
2007-08
2008-09
2009-10
2010-11
2011-12
THOUSAND TONNES
CR
OP
YE
AR
Marketings of Manitoba Rye2000 - 2011
Industry Intelligence Section, MAFRISource: STC, AAFC, MAFRI
0
2
4
6
8
10
12
14
16
18
20
2000 2001 2002 2003 2004 2005 2006 2007 2008 2009 2010 2011
MIL
LIO
NS
OF
DO
LL
AR
S
YEAR
Manitoba Rye Exports2000 – 2011
Industry Intelligence Section, MAFRISource: Statistics Canada
94
Farm Supply and Disposition of Manitoba Rye Crop, 2000/01 to 2011/12
000 tonnes 2005-06 2006-07 2007-08 2008-09 2009-10 2010-11 2011-12
Opening Stocks Aug1 25 15 25 1 15 15 1
Production 38 86 73 84 99 58 44
Total Supply 63 101 98 85 114 73 45
Marketings 32 42 59 61 74 66 30
Seed 2 2 2 2 1 1 2
Carry-over 15 24 1 16 15 0 9
Feed/Waste/Dockage 14 33 36 6 24 6 4
Total Disposition 63 101 98 85 114 73 45
000 bushels 2005-06 2006-07 2007-08 2008-09 2009-10 2010-11 2011-12
Opening Stocks Aug1 984 591 984 39 591 591 39
Production 1,496 3,386 2,874 3,307 3,897 2,299 1,732
Total Supply 2,480 3,976 3,858 3,346 4,488 2,874 1,772
Marketings 1,260 1,653 2,323 2,401 2,913 2,598 1,181
Seed 92 77 77 87 58 53 79
Carry-over 577 946 41 622 572 -14 354
Feed/Waste/Dockage 551 1,299 1,417 236 945 236 157
Total Disposition 2,480 3,976 3,858 3,346 4,488 2,874 1,772
• RYE - Common Conversions 1 metric tonne rye = 39.368 bushels. There are 56 pounds in 1 bushel of rye.

95
Production and Value of Manitoba Rye Seeded Harvested Average Price per Total
Year Area Area Yield Production Tonne Value(hectares) (hectares) (kg per ha) (tonnes) ($/tonne) ($000)
1990 76,900 72,800 2,200 157,500 58 9,1351991 44,500 32,000 1,900 61,000 71 4,3311992 32,400 30,400 2,200 66,000 79 5,2141993 28,300 26,300 1,600 43,200 85 3,6721994 18,200 18,200 2,100 38,100 99 3,7721995 32,400 28,300 1,900 53,300 131 6,9821996 32,400 30,400 2,200 66,000 152 10,0321997 40,500 34,400 1,800 62,200 154 9,5791998 52,600 52,600 2,200 116,800 92 10,7461999 34,400 32,400 2,400 76,200 67 5,1052000 24,300 22,300 2,500 55,900 67 3,7482001 24,300 18,200 2,100 37,700 84 3,1832002 20,200 18,200 2,100 38,100 136 5,1952003 24,300 20,200 2,500 50,800 130 6,6272004 34,400 28,300 3,100 86,400 125 10,8372005 24,300 18,200 2,100 38,100 126 4,8042006 38,400 34,400 2,500 86,400 102 8,8512007 32,400 28,300 2,600 72,900 160 11,6902008 32,400 28,300 3,000 83,800 250 20,9582009 36,400 32,400 3,100 99,100 172 17,0862010 24,300 22,300 2,600 58,400 150 8,7682011 22,300 16,200 2,700 44,200 216 9,542
Seeded Harvested Average Price per TotalYear Area Area Yield Production Bushel Value
(acres) (acres) (bu per acre) (000 bushels) ($/bushel) ($000)1990 190,000 180,000 34.4 6,200 1.47 9,1351991 110,000 79,000 30.4 2,400 1.80 4,3311992 80,000 75,000 34.7 2,600 2.01 5,2141993 70,000 65,000 26.2 1,700 2.16 3,6721994 45,000 45,000 33.3 1,500 2.51 3,7721995 80,000 70,000 30.0 2,100 3.32 6,9821996 80,000 75,000 34.7 2,600 3.86 10,0321997 100,000 85,000 28.8 2,450 3.91 9,5791998 130,000 130,000 35.4 4,600 2.34 10,7461999 85,000 80,000 37.5 3,000 1.70 5,1052000 60,000 55,000 40.0 2,200 1.70 3,7482001 60,000 45,000 33.0 1,485 2.14 3,1832002 50,000 45,000 33.3 1,500 3.46 5,1952003 60,000 50,000 40.0 2,000 3.31 6,6272004 85,000 70,000 48.6 3,400 3.19 10,8372005 60,000 45,000 33.3 1,500 3.20 4,8042006 95,000 85,000 40.0 3,400 2.60 8,8512007 80,000 70,000 41.0 2,870 4.07 11,6902008 80,000 70,000 47.1 3,300 6.35 20,9582009 90,000 80,000 48.8 3,900 4.38 17,0862010 60,000 55,000 41.8 2,300 3.81 8,7682011 55,000 40,000 43.5 1,740 5.48 9,542SOURCE: Statistics Canada; Agriculture and Agri-Food Canada; Manitoba Agriculture, Food and Rural Initiatives.

96
OVERVIEW OF THE GRAIN CORN SECTOR IN MANITOBA
Prior to 1978, Manitoba producers grew very little corn for grain since most corn was produced for silage and fodder. Corn production expanded into non-traditional areas with the development of varieties more suited to the Manitoba climate and availability of improved hybrids.
The steady increase in corn production was due
to a growing need for feed corn by the livestock industry and as input to the fuel ethanol industry.
Dent and Flint are the principal types of corn. In
North America dent is the principal corn type grown. Flint corns were probably grown extensively in Colonial times but are of little importance today.
Ontario, Quebec and Manitoba are the three
main corn producing provinces. In 2011, Manitoba reported 713 corn farms compared to 577 in 2006. This
represents 3.0% of corn farms in Canada and approximately 4 to 6% of Canada's total corn production.
Manitoba Manitoba Canada Canada
Corn 2011 2006 2011 2006Number of farms 713 577 23,472 21,494Acres 211,148 150,420 3,296,587 2,752,716Hectares 85,449 60,873 1,334,081 1,113,984Source: Census of Agriculture 2011
The price of corn in Canada is determined by: the price of corn on the CBoT in the
US, the Canada-US dollar exchange rate, Canadian supply and demand conditions, freight from origin to destination and brokerage fees. Domestic corn is priced on an import basis as Canada has become a corn deficit country. Corn prices are generally lower than in the US in the fall because of ample domestic supplies. As the corn is consumed, prices rise to the point where it becomes economic to import US corn. Consequently, Canadian corn prices are normally discounted to the US and any price increases are capped by US imports.

97
PROCESSING CORN IN MANITOBA The distillery at Gimli uses about 60,000 metric tonnes (2.4 million bushels) of corn
annually. Manitoba producers supply most of the distillery requirements for high quality corn. This market demands a clean sample of screened corn of high test weight (56 lbs./bushel), with 14.5% moisture or lower. Corn is accepted up to 15% moisture, but at a discount. Storage management practices are very important in ensuring that the corn does not have any objectionable odours.
Corn is also processed and used for hog and poultry feed. Corn silage is fed to
dairy and beef cattle. Manitoba corn is used across the Prairies as a livestock feed. Hundreds of edible and non-edible products are made from corn and new uses are
emerging rapidly. Physical and chemical processes used to break down the grain greatly increase the
value of the original product. Wet milling and dry milling techniques are used to separate components, which are
then further processed. Wet milling, with water and heat, produces cornstarch that is used in industrial applications (manufacture of paper and adhesives) or as a food material (thickeners, extenders, corn syrups, and sweeteners).
Dry milling produces corn oil, corn meal (for corn chips, flakes, and tortillas), and
corn grits for brewing. The whole grain is used to produce whisky, gin and vodka, ethanol production
(blended with gasoline to produce a biofuel) and for manufacturing bioplastics. Corncobs are used in the production of solvents, abrasives and absorbents. Cornstarch is an ideal substrate or food for microorganisms that are used in
fermentation processes (pharmaceutical and industrial chemical production). The starches in corn can also be converted using chemical techniques into an assortment of other chemicals.
Corn is a domestic renewable resource with value added properties on processing. Special types of corn are produced under contract; to earn a premium, the grain
must be kept separate from other types until it is delivered to the market. - High-Lysine Corn - High Oil Corn - Low-Phytate Corn - White Corn - High-Starch Corn - Sweet Corn - Popcorn
98
Trade The United States is the world's largest producer and exporter of corn, accounting
for 40% of world output and 60% of world trade. Consequently, world corn prices are largely determined by US corn prices.
US production of Dried Distillers Grains with Solubles (DDGS) rises in tandem with
ethanol production. DDGS are a substitutable source of protein and energy in animal rations and offset some of the decrease in corn consumption by livestock.
Corn accounts for over 70% of the world coarse grain market and about one half of
the growth in coarse grain consumption is expected to occur in the US and China. China is the world's second largest corn producer. Domestic consumption is
expected to rise slightly as higher feed usage is partly offset by lower food, seed and industrial consumption.
World corn consumption is projected to rise as the sharp increase in food and
industrial use more than offsets the decline in feeding. The largest increases in industrial demand are linked to expanded ethanol production.
According to the USDA Agricultural Projections to 2018, US corn area is expected to
rise slowly over the next ten years, and is forecast to peak at 90.5 Mha by 2016-2017 before stabilizing.
Over the medium term, much of the expected increase in production is projected to
occur through higher yields. Total usage of corn is projected to grow over the medium term. Industrial usage of
corn, which rose with the rapid expansion in US ethanol sector, began tapering off in 2009-2010 and is expected to grow at a slower pace until 2018-2019.
Over the medium term, the average annual farm price of corn is projected to decline
slightly until 2013-2014, then begin rising moderately by 2018-2019. US exports are projected to rise slowly on support from the growing livestock sectors
in Asia, Latin America, North Africa and the Middle East. However, most of the expansion in world trade in corn is expected to occur outside the US.
For Canada, production is expected to gradually trend upwards, due to the slow and
steady upward rise in trend yields. By 2018-2019, about 2.84 Mt of corn and 1.09 Mt of wheat, respectively, are
expected to be used to produce ethanol in Canada Feed use of corn in Canada is expected to decline marginally by 2018-2019 due to
fewer market hogs and feedlot cattle and increased supplies of alternative feed ingredients such as DDGS.
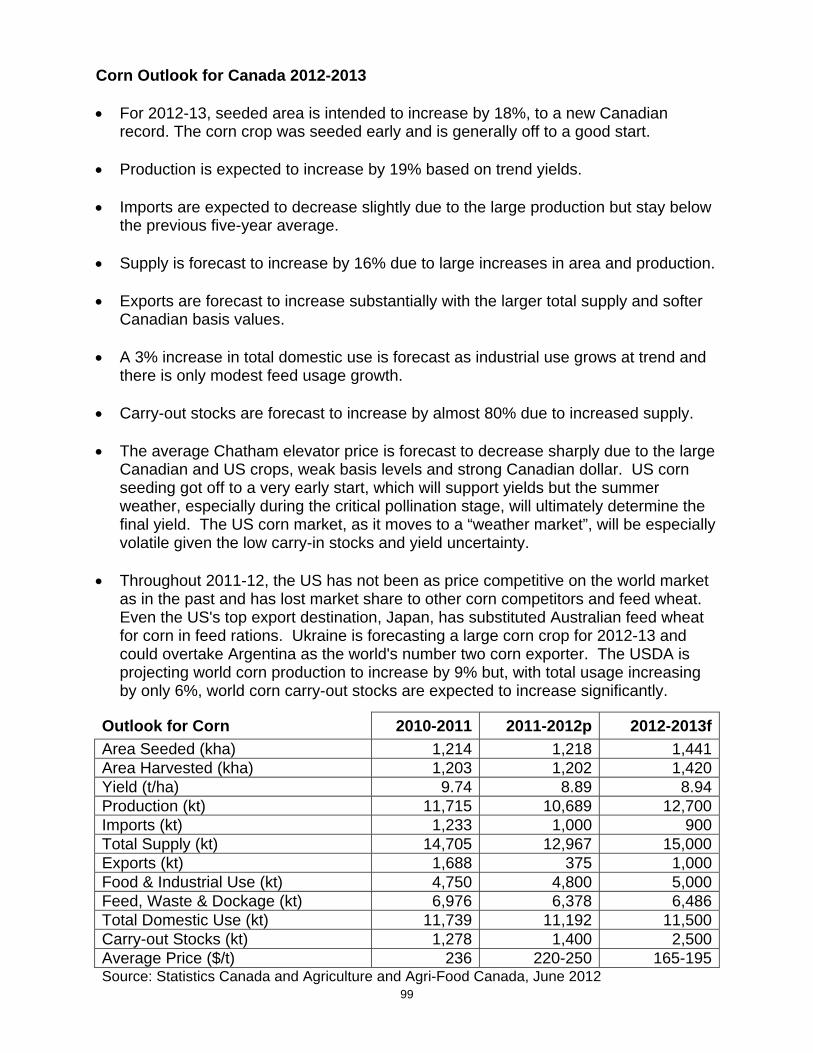
99
Corn Outlook for Canada 2012-2013 For 2012-13, seeded area is intended to increase by 18%, to a new Canadian
record. The corn crop was seeded early and is generally off to a good start. Production is expected to increase by 19% based on trend yields. Imports are expected to decrease slightly due to the large production but stay below
the previous five-year average. Supply is forecast to increase by 16% due to large increases in area and production. Exports are forecast to increase substantially with the larger total supply and softer
Canadian basis values. A 3% increase in total domestic use is forecast as industrial use grows at trend and
there is only modest feed usage growth. Carry-out stocks are forecast to increase by almost 80% due to increased supply. The average Chatham elevator price is forecast to decrease sharply due to the large
Canadian and US crops, weak basis levels and strong Canadian dollar. US corn seeding got off to a very early start, which will support yields but the summer weather, especially during the critical pollination stage, will ultimately determine the final yield. The US corn market, as it moves to a “weather market”, will be especially volatile given the low carry-in stocks and yield uncertainty.
Throughout 2011-12, the US has not been as price competitive on the world market
as in the past and has lost market share to other corn competitors and feed wheat. Even the US's top export destination, Japan, has substituted Australian feed wheat for corn in feed rations. Ukraine is forecasting a large corn crop for 2012-13 and could overtake Argentina as the world's number two corn exporter. The USDA is projecting world corn production to increase by 9% but, with total usage increasing by only 6%, world corn carry-out stocks are expected to increase significantly.
Outlook for Corn 2010-2011 2011-2012p 2012-2013f
Area Seeded (kha) 1,214 1,218 1,441Area Harvested (kha) 1,203 1,202 1,420Yield (t/ha) 9.74 8.89 8.94Production (kt) 11,715 10,689 12,700Imports (kt) 1,233 1,000 900Total Supply (kt) 14,705 12,967 15,000Exports (kt) 1,688 375 1,000Food & Industrial Use (kt) 4,750 4,800 5,000Feed, Waste & Dockage (kt) 6,976 6,378 6,486Total Domestic Use (kt) 11,739 11,192 11,500Carry-out Stocks (kt) 1,278 1,400 2,500Average Price ($/t) 236 220-250 165-195Source: Statistics Canada and Agriculture and Agri-Food Canada, June 2012
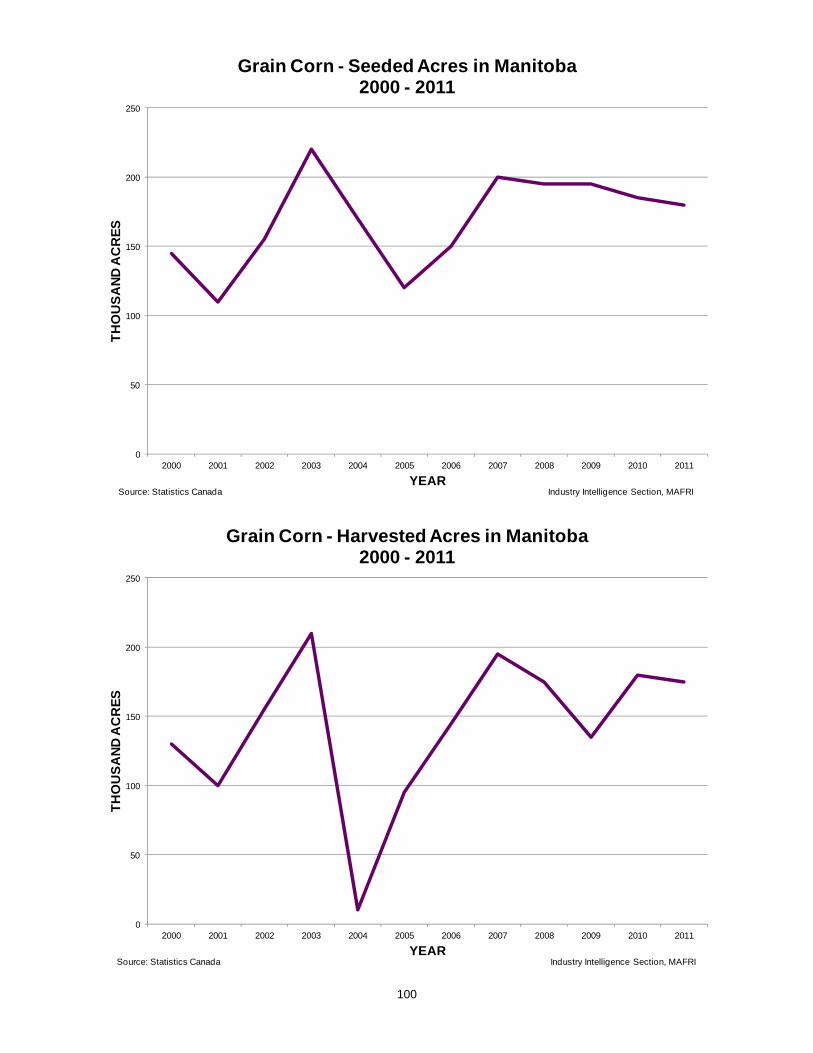
100
0
50
100
150
200
250
2000 2001 2002 2003 2004 2005 2006 2007 2008 2009 2010 2011
TH
OU
SA
ND
AC
RE
S
YEAR
Grain Corn - Seeded Acres in Manitoba2000 - 2011
Industry Intelligence Section, MAFRISource: Statistics Canada
0
50
100
150
200
250
2000 2001 2002 2003 2004 2005 2006 2007 2008 2009 2010 2011
TH
OU
SA
ND
AC
RE
S
YEAR
Grain Corn - Harvested Acres in Manitoba2000 - 2011
Industry Intelligence Section, MAFRISource: Statistics Canada

101
0
20
40
60
80
100
120
2000 2001 2002 2003 2004 2005 2006 2007 2008 2009 2010 2011
BU
SH
EL
S P
ER
AC
RE
YEAR
Grain Corn - Yield per Acre in Manitoba2000 - 2011
Industry Intelligence Section, MAFRISource: Statistics Canada
0
100
200
300
400
500
600
2000 2001 2002 2003 2004 2005 2006 2007 2008 2009 2010 2011
TH
OU
SA
ND
TO
NN
ES
YEAR
Grain Corn - Tonnes Produced in Manitoba2000 - 2011
Industry Intelligence Section, MAFRISource: Statistics Canada

102
0
50
100
150
200
250
2000 2001 2002 2003 2004 2005 2006 2007 2008 2009 2010 2011
DO
LL
AR
S P
ER
TO
NN
E
YEAR
Grain Corn Prices in Manitoba2000 - 2011
Industry Intelligence Section, Source: Statistics Canada
0
20
40
60
80
100
120
2000 2001 2002 2003 2004 2005 2006 2007 2008 2009 2010 2011
MIL
LIO
NS
OF
DO
LL
AR
S
YEAR
Value of Grain Corn Production in Manitoba2000 - 2011
Industry Intelligence Section, MAFRISource: STC, AAFC, MAFRI

103
0
50
100
150
200
250
300
350
400
450
2000 2001 2002 2003 2004 2005 2006 2007 2008 2009 2010 2011
DO
LL
AR
S P
ER
AC
RE
YEAR
Cost of Grain Corn Production in Manitoba2000 – 2011
Operating Costs of Production Total Costs of Production (including labour) Total Costs of Production (including labour)
Industry Intelligence Section, MAFRISource: MAFRI
0
10
20
30
40
50
60
70
80
90
2000 2001 2002 2003 2004 2005 2006 2007 2008 2009 2010 2011
MIL
LIO
NS
OF
DO
LL
AR
S
YEAR
Farm Cash Receipts for Grain Corn in Manitoba2000 – 2011
Industry Intelligence Section, MAFRISource: Statistics Canada
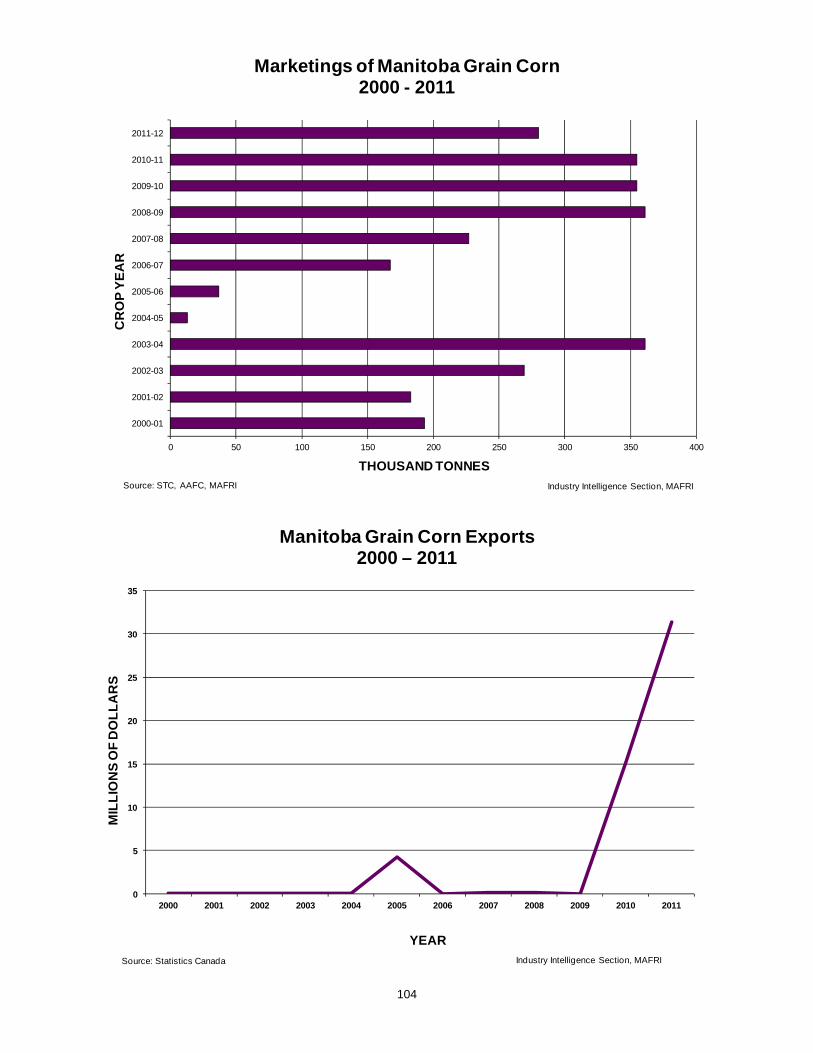
104
0 50 100 150 200 250 300 350 400
2000-01
2001-02
2002-03
2003-04
2004-05
2005-06
2006-07
2007-08
2008-09
2009-10
2010-11
2011-12
THOUSAND TONNES
CR
OP
YE
AR
Marketings of Manitoba Grain Corn2000 - 2011
Industry Intelligence Section, MAFRISource: STC, AAFC, MAFRI
0
5
10
15
20
25
30
35
2000 2001 2002 2003 2004 2005 2006 2007 2008 2009 2010 2011
MIL
LIO
NS
OF
DO
LL
AR
S
YEAR
Manitoba Grain Corn Exports 2000 – 2011
Industry Intelligence Section, MAFRISource: Statistics Canada
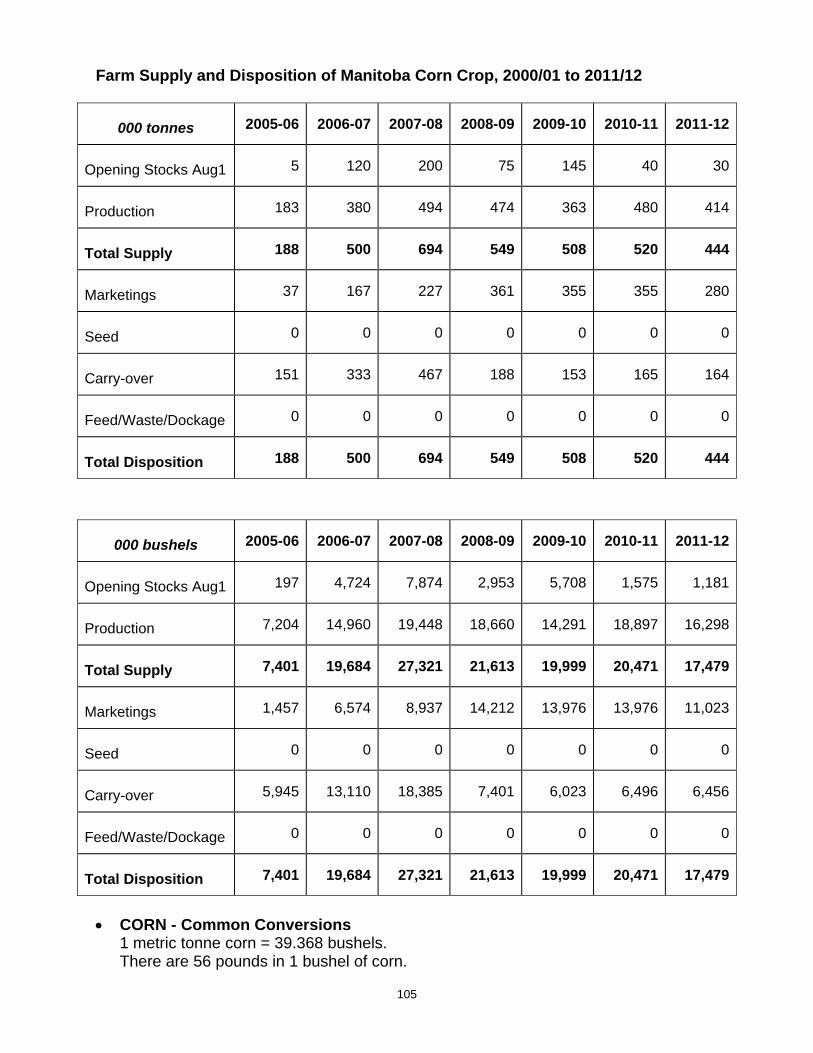
105
Farm Supply and Disposition of Manitoba Corn Crop, 2000/01 to 2011/12
000 tonnes 2005-06 2006-07 2007-08 2008-09 2009-10 2010-11 2011-12
Opening Stocks Aug1 5 120 200 75 145 40 30
Production 183 380 494 474 363 480 414
Total Supply 188 500 694 549 508 520 444
Marketings 37 167 227 361 355 355 280
Seed 0 0 0 0 0 0 0
Carry-over 151 333 467 188 153 165 164
Feed/Waste/Dockage 0 0 0 0 0 0 0
Total Disposition 188 500 694 549 508 520 444
000 bushels 2005-06 2006-07 2007-08 2008-09 2009-10 2010-11 2011-12
Opening Stocks Aug1 197 4,724 7,874 2,953 5,708 1,575 1,181
Production 7,204 14,960 19,448 18,660 14,291 18,897 16,298
Total Supply 7,401 19,684 27,321 21,613 19,999 20,471 17,479
Marketings 1,457 6,574 8,937 14,212 13,976 13,976 11,023
Seed 0 0 0 0 0 0 0
Carry-over 5,945 13,110 18,385 7,401 6,023 6,496 6,456
Feed/Waste/Dockage 0 0 0 0 0 0 0
Total Disposition 7,401 19,684 27,321 21,613 19,999 20,471 17,479
CORN - Common Conversions 1 metric tonne corn = 39.368 bushels. There are 56 pounds in 1 bushel of corn.

106
Production and Value of Manitoba Corn Seeded Harvested Average Price per Total
Year Area Area Yield Production Tonne Value(hectares) (hectares) (kg per ha) (tonnes) ($/tonne) ($000)
1990 34,400 34,400 4,800 165,100 110 18,1611991 40,458 40,458 5,100 205,700 110 22,6271992 48,600 12,100 2,900 35,600 92 3,2751993 20,200 14,200 2,600 36,800 112 4,1221994 26,300 22,300 5,200 116,800 149 17,4031995 18,200 18,200 5,200 94,000 178 16,7321996 28,300 28,300 5,000 142,200 143 20,3351997 30,400 30,400 5,000 152,400 129 19,6601998 38,400 36,400 5,900 215,900 114 24,6131999 44,500 40,500 5,900 238,800 106 25,3132000 58,700 52,600 5,000 264,200 110 29,1682001 44,500 40,500 6,200 250,200 107 26,8112002 62,700 62,700 5,900 368,300 144 53,2162003 89,000 85,000 5,800 495,300 132 65,4982004 68,800 4,000 4,500 17,800 132 2,3422005 48,600 38,400 4,800 182,900 105 19,1152006 60,900 58,700 6,500 379,700 129 49,0042007 80,900 78,900 6,300 493,500 157 77,2522008 78,900 70,800 6,700 473,700 199 94,1762009 78,900 54,600 6,700 363,200 155 56,2382010 74,900 72,800 6,600 480,100 159 76,5282011 72,800 70,800 5,800 414,000 236 97,509
Seeded Harvested Average Price per TotalYear Area Area Yield Production Bushel Value
(acres) (acres) (bu per acre) (000 bushels) ($/bushel) ($000)1990 85,000 85,000 76.5 6,500 2.79 18,1611991 99,973 99,973 81.0 8,100 2.79 22,6271992 120,000 30,000 46.7 1,400 2.34 3,2751993 50,000 35,000 41.4 1,450 2.84 4,1221994 65,000 55,000 83.6 4,600 3.78 17,4031995 45,000 45,000 82.2 3,700 4.52 16,7321996 70,000 70,000 80.0 5,600 3.63 20,3351997 75,000 75,000 80.0 6,000 3.28 19,6601998 95,000 90,000 94.4 8,500 2.90 24,6131999 110,000 100,000 94.0 9,400 2.69 25,3132000 145,000 130,000 80.0 10,400 2.80 29,1682001 110,000 100,000 98.5 9,850 2.72 26,8112002 155,000 155,000 93.5 14,500 3.67 53,2162003 220,000 210,000 92.9 19,500 3.36 65,4982004 170,000 10,000 70.0 700 3.35 2,3422005 120,000 95,000 75.8 7,200 2.65 19,1152006 150,420 145,000 103.1 14,950 3.28 49,0042007 200,000 195,000 99.6 19,430 3.98 77,2522008 195,000 175,000 106.6 18,650 5.05 94,1762009 195,000 135,000 105.9 14,300 3.93 56,2382010 185,000 180,000 105.0 18,900 4.05 76,5282011 180,000 175,000 93.1 16,300 5.98 97,509SOURCE: Statistics Canada; Agriculture and Agri-Food Canada; Manitoba Agriculture, Food and Rural Initiatives.
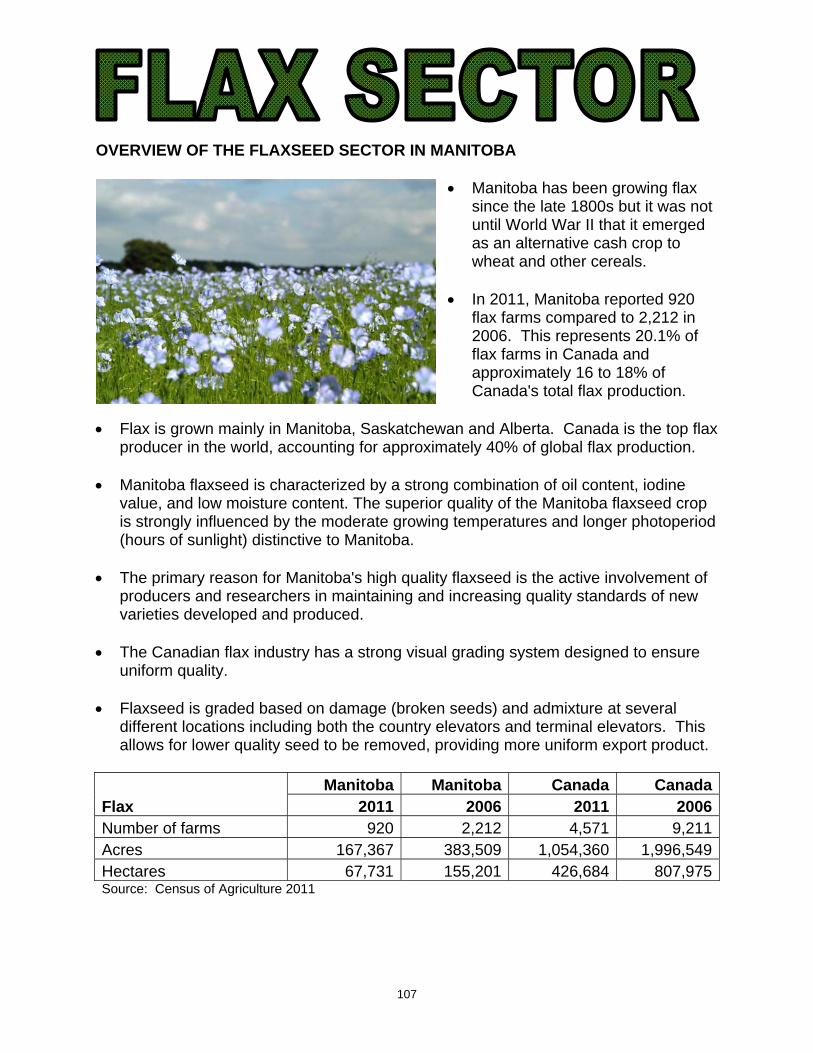
107
OVERVIEW OF THE FLAXSEED SECTOR IN MANITOBA
Manitoba has been growing flax since the late 1800s but it was not until World War II that it emerged as an alternative cash crop to wheat and other cereals.
In 2011, Manitoba reported 920
flax farms compared to 2,212 in 2006. This represents 20.1% of flax farms in Canada and approximately 16 to 18% of Canada's total flax production.
Flax is grown mainly in Manitoba, Saskatchewan and Alberta. Canada is the top flax
producer in the world, accounting for approximately 40% of global flax production. Manitoba flaxseed is characterized by a strong combination of oil content, iodine
value, and low moisture content. The superior quality of the Manitoba flaxseed crop is strongly influenced by the moderate growing temperatures and longer photoperiod (hours of sunlight) distinctive to Manitoba.
The primary reason for Manitoba's high quality flaxseed is the active involvement of
producers and researchers in maintaining and increasing quality standards of new varieties developed and produced.
The Canadian flax industry has a strong visual grading system designed to ensure
uniform quality. Flaxseed is graded based on damage (broken seeds) and admixture at several
different locations including both the country elevators and terminal elevators. This allows for lower quality seed to be removed, providing more uniform export product.
Manitoba Manitoba Canada Canada
Flax 2011 2006 2011 2006Number of farms 920 2,212 4,571 9,211Acres 167,367 383,509 1,054,360 1,996,549Hectares 67,731 155,201 426,684 807,975Source: Census of Agriculture 2011

108
PROCESSING FLAX IN MANITOBA Value-added opportunities for flax include food, feed, fibre, health, and industrial
uses. Global demand for flax in food and beverages, functional foods and dietary
supplements has risen dramatically due to its flavour and nutritional properties. Important human nutritional benefits derived from flax are due to its Omega-3 fatty
acid, alpha-linolenic acid (ALA), lignan and dietary fibre content. Flax also has one of the most nutritious plant protein compositions, a number of important essential minerals and minor amounts of water and fat-soluble vitamins.
Flax oil and meal are recognized as valuable components in animal nutrition,
improving health and productivity of animals themselves and leading to healthier food products for humans such as Omega-3 eggs from flax-fed poultry.
Flax can be incorporated in feed rations for beef, dairy, poultry, swine and
commercial fish feed markets to improve growth as well as lessen disease and stress-related conditions.
Omega-3 enriched eggs are produced by laying hens that are fed a diet containing
10 to 20% milled flax. The 3 eggs look, cook, and taste like regular eggs, and have similar total fat content and cholesterol levels. Flax is higher in the Omega-3 fatty acid, alpha-linolenic acid, and lower in saturated fatty acids than other grains. Current research findings suggest that Omega-3 fatty acids help lower blood triglyceride levels and may play a role in reducing the risk of heart disease.
Flax straw can be transformed into advanced bio-based materials used in industrial
applications. Currently, flax straw is processed primarily for application in the pulp and paper industry. Potential end uses for flax straw include animal bedding, horticultural mulch, particleboard, insulation board, loose-fill insulation, plastic composite filler and heating fuel.
Industrial uses for linseed oil from flax include linoleum flooring, paints, sealants,
coatings, plastics and resins may all contain linseed oil. Demand for bio-products is increasing with green consumerism trends and new
environmental legislation. The biodegradable status of linoleum, along with its natural antimicrobial properties, make it a good option for health care institutions, commercial buildings, educational institutions and kitchens.
Opportunities exist for the development of specialty oleochemical manufacturing and
novel, high-value flax oil applications in fuel bio-additives and polymer resins. Flaxseed contains 21% to 25% protein and 43% to 45% oil, high in linolenic fatty
acid (58%). Solin is a type of flax developed in the late 1980s, with a linolenic fatty acid concentration of 2%, and a linoleic fatty acid concentration of 70%. It it is marketed as an edible vegetable oil. The meal remaining from the crushing of both flax and solin is used as a livestock feed.

109
TRADE Manitoba producers have a long tradition of growing flax and are recognized for the
production of a top quality product and a commitment to meet customer demand domestically and internationally. Processed flax exports include linseed oil, oil-cake, flax fibre, tow and waste.
China has replaced Europe as a key export destination for Canadian flax. It is estimated that Canadian flaxseed exports to China will be up to about 106,000
tonnes at the end of the 2011-12 season, while exports to Europe may only reach between 20,000 and 30,000 tonnes.
Chinese demand for flax is difficult to determine due to a lack of transparency in the
Chinese food reserve policy and since China is a price-sensitive buyer, its oilseed demand varies from year to year.
Exports to Europe have been significantly reduced since 2009 when Canadian flax
shipments to the EU were found to have trace amounts of CDC Triffid, an unapproved genetically modified (GM) type of flax. Due to its zero-tolerance policy toward genetically modified crops, the EU temporarily suspended Canadian flaxseed imports; however it has since resumed those imports under strict guidelines.
Factors influencing the future of Canada’s flax market include its ability to assure
Europe its flax is completely GMO-free, overcome competition from the FSU in Europe and turn China into a reliable and consistent trading partner.
Kazakhstan and Ukraine are forecast to deliver 510,000 tonnes of flaxseed
combined by the end of July 2012, up from only 237,000 tonnes the previous year. Almost 50% of the linseed oil that trades internationally is imported by developing
countries in Asia, Africa and Latin America. As the economies of these countries grow, they will provide long-term potential for a Canadian crusher.
North American demand for flaxseed has tripled in the last 10 years due to the food
industry’s use of flaxseed in breads, bagels and other baked goods. The United States is a net importer of flax. In 2011, the United States imported
201,326 MT of flaxseed valued at $134 million, almost entirely from Canada. U.S. flaxseed production is expected to decrease as producers switch from flax to
wheat or corn due to ongoing wheat demand and strong demand for corn for ethanol production which continue to support elevated U.S. wheat and corn prices.
The majority of flax utilized in North America still is consumed as feed; while in
China and India it is mostly consumed as food.
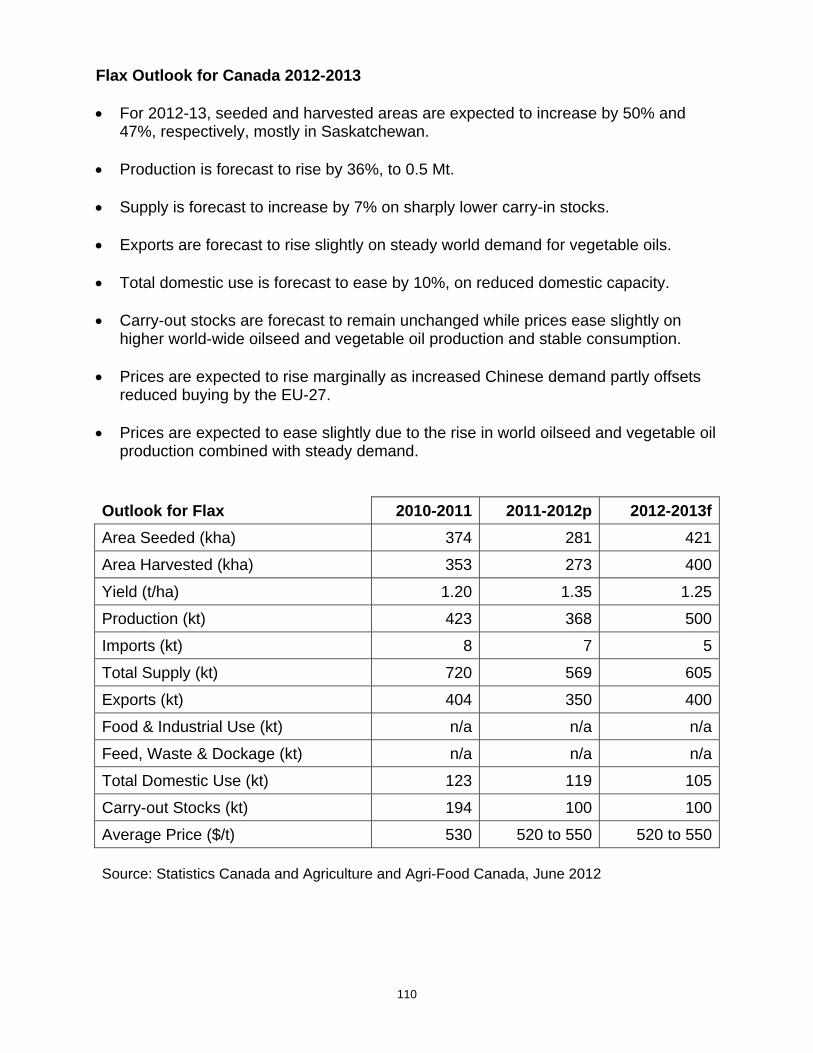
110
Flax Outlook for Canada 2012-2013 For 2012-13, seeded and harvested areas are expected to increase by 50% and
47%, respectively, mostly in Saskatchewan. Production is forecast to rise by 36%, to 0.5 Mt. Supply is forecast to increase by 7% on sharply lower carry-in stocks. Exports are forecast to rise slightly on steady world demand for vegetable oils. Total domestic use is forecast to ease by 10%, on reduced domestic capacity. Carry-out stocks are forecast to remain unchanged while prices ease slightly on
higher world-wide oilseed and vegetable oil production and stable consumption. Prices are expected to rise marginally as increased Chinese demand partly offsets
reduced buying by the EU-27. Prices are expected to ease slightly due to the rise in world oilseed and vegetable oil
production combined with steady demand.
Outlook for Flax 2010-2011 2011-2012p 2012-2013f
Area Seeded (kha) 374 281 421
Area Harvested (kha) 353 273 400
Yield (t/ha) 1.20 1.35 1.25
Production (kt) 423 368 500
Imports (kt) 8 7 5
Total Supply (kt) 720 569 605
Exports (kt) 404 350 400
Food & Industrial Use (kt) n/a n/a n/a
Feed, Waste & Dockage (kt) n/a n/a n/a
Total Domestic Use (kt) 123 119 105
Carry-out Stocks (kt) 194 100 100
Average Price ($/t) 530 520 to 550 520 to 550 Source: Statistics Canada and Agriculture and Agri-Food Canada, June 2012
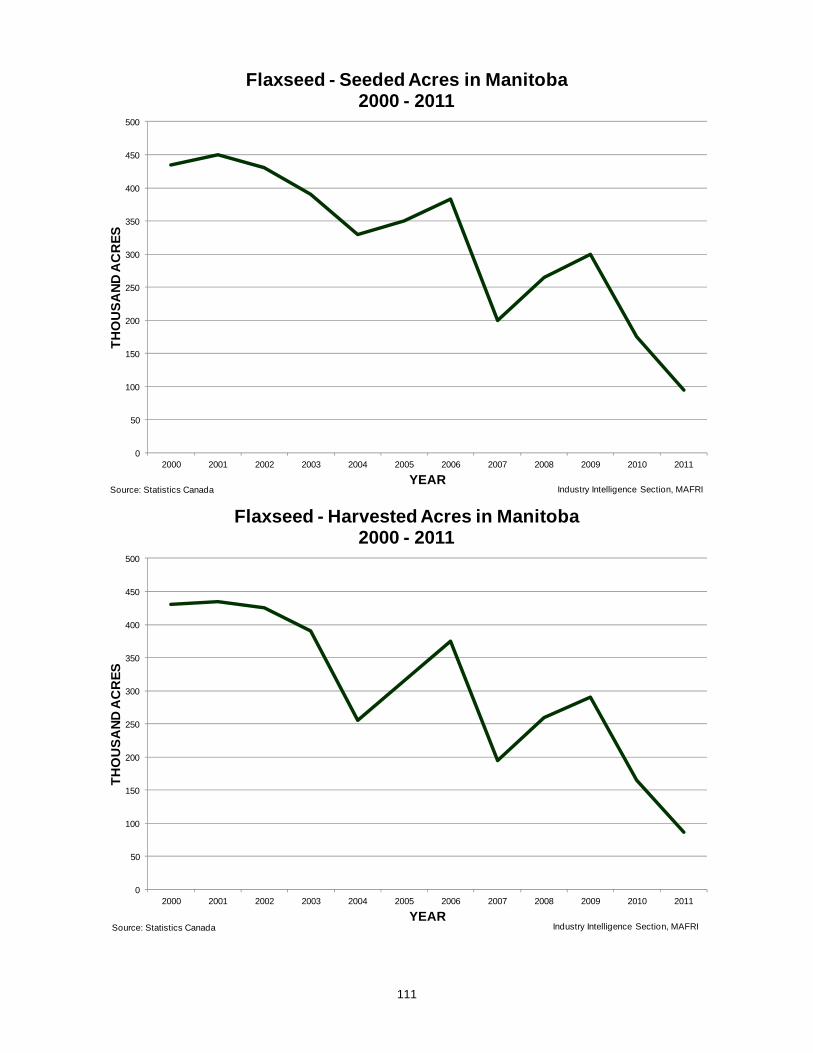
111
0
50
100
150
200
250
300
350
400
450
500
2000 2001 2002 2003 2004 2005 2006 2007 2008 2009 2010 2011
TH
OU
SA
ND
AC
RE
S
YEAR
Flaxseed - Seeded Acres in Manitoba2000 - 2011
Industry Intelligence Section, MAFRISource: Statistics Canada
0
50
100
150
200
250
300
350
400
450
500
2000 2001 2002 2003 2004 2005 2006 2007 2008 2009 2010 2011
TH
OU
SA
ND
AC
RE
S
YEAR
Flaxseed - Harvested Acres in Manitoba2000 - 2011
Industry Intelligence Section, MAFRISource: Statistics Canada
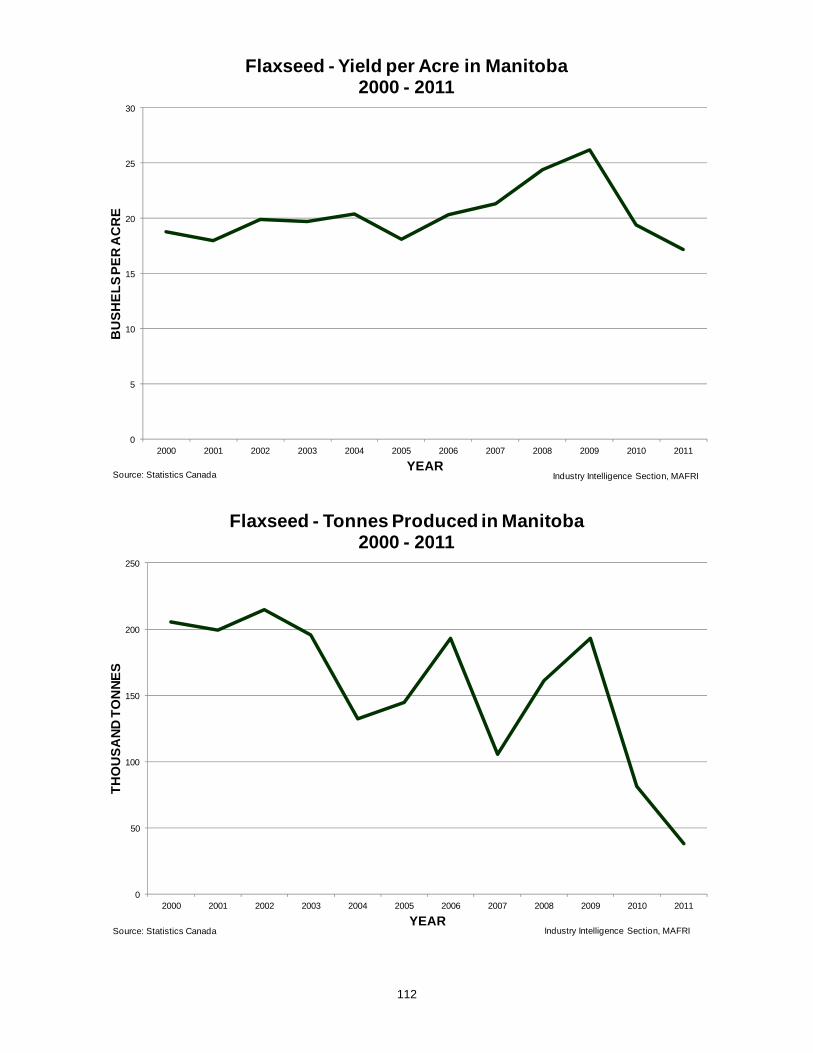
112
0
5
10
15
20
25
30
2000 2001 2002 2003 2004 2005 2006 2007 2008 2009 2010 2011
BU
SH
EL
S P
ER
AC
RE
YEAR
Flaxseed - Yield per Acre in Manitoba2000 - 2011
Industry Intelligence Section, MAFRISource: Statistics Canada
0
50
100
150
200
250
2000 2001 2002 2003 2004 2005 2006 2007 2008 2009 2010 2011
TH
OU
SA
ND
TO
NN
ES
YEAR
Flaxseed - Tonnes Produced in Manitoba2000 - 2011
Industry Intelligence Section, MAFRISource: Statistics Canada

113
0
100
200
300
400
500
600
700
2000 2001 2002 2003 2004 2005 2006 2007 2008 2009 2010 2011
DO
LL
AR
S P
ER
TO
NN
E
YEAR
Flaxseed Prices in Manitoba2000 – 2011
Industry Intelligence Section, MAFRISources: STC, AAFC, MAFRI
0
20
40
60
80
100
120
2000 2001 2002 2003 2004 2005 2006 2007 2008 2009 2010 2011
MIL
LIO
NS
OF
DO
LL
AR
S
YEAR
Value of Flaxseed Production in Manitoba2000 - 2011
Industry Intelligence Section, MAFRISource: STC, AAFC, MAFRI
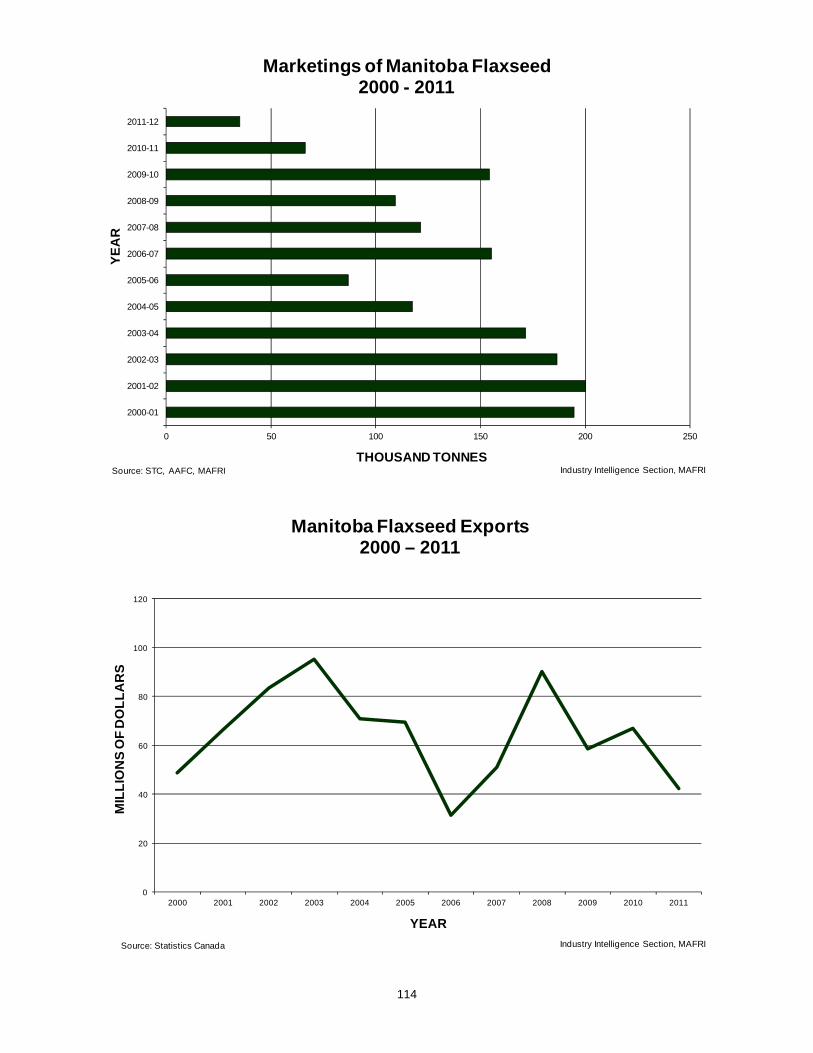
114
0 50 100 150 200 250
2000-01
2001-02
2002-03
2003-04
2004-05
2005-06
2006-07
2007-08
2008-09
2009-10
2010-11
2011-12
THOUSAND TONNES
YE
AR
Marketings of Manitoba Flaxseed2000 - 2011
Industry Intelligence Section, MAFRISource: STC, AAFC, MAFRI
0
20
40
60
80
100
120
2000 2001 2002 2003 2004 2005 2006 2007 2008 2009 2010 2011
MIL
LIO
NS
OF
DO
LL
AR
S
YEAR
Manitoba Flaxseed Exports2000 – 2011
Industry Intelligence Section, MAFRISource: Statistics Canada
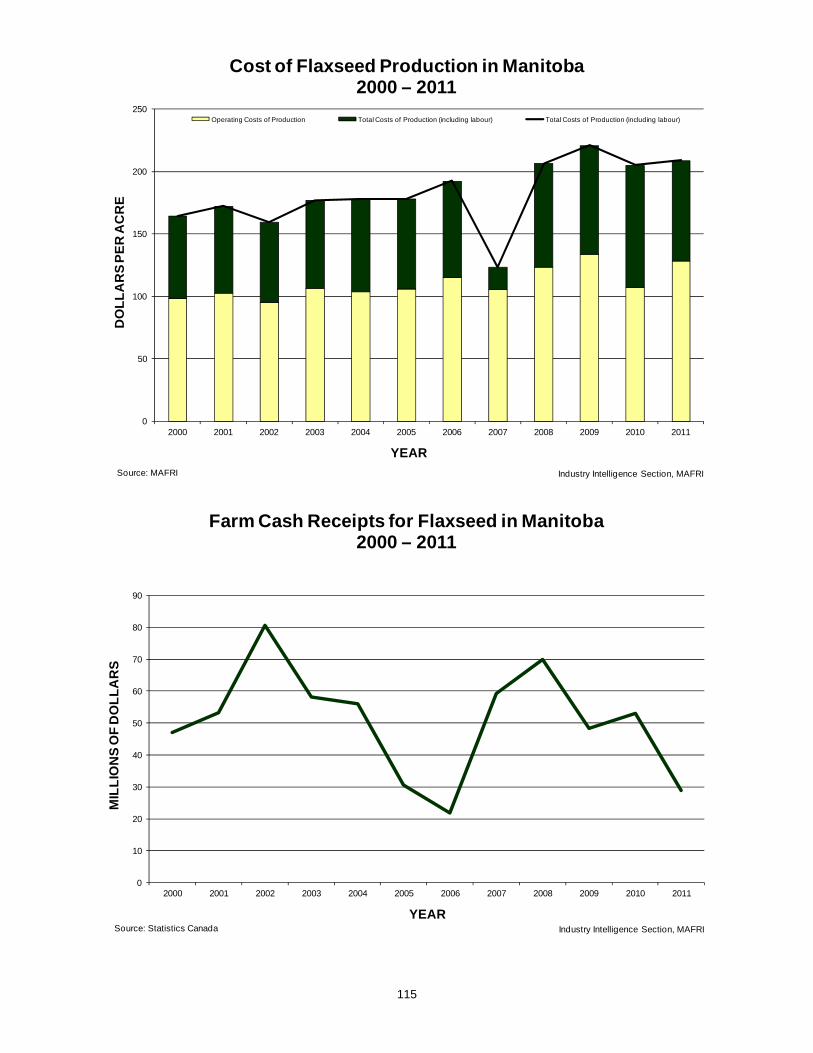
115
0
50
100
150
200
250
2000 2001 2002 2003 2004 2005 2006 2007 2008 2009 2010 2011
DO
LL
AR
S P
ER
AC
RE
YEAR
Cost of Flaxseed Production in Manitoba2000 – 2011
Operating Costs of Production Total Costs of Production (including labour) Total Costs of Production (including labour)
Industry Intelligence Section, MAFRISource: MAFRI
0
10
20
30
40
50
60
70
80
90
2000 2001 2002 2003 2004 2005 2006 2007 2008 2009 2010 2011
MIL
LIO
NS
OF
DO
LL
AR
S
YEAR
Farm Cash Receipts for Flaxseed in Manitoba2000 – 2011
Industry Intelligence Section, MAFRISource: Statistics Canada

116
Farm Supply and Disposition of Manitoba Flaxseed Crop, 2000/01 to 2011/12
000 tonnes 2005-06 2006-07 2007-08 2008-09 2009-10 2010-11 2011-12
Opening Stocks Aug1 0 30 35 0 30 45 15
Production 145 193 105 161 193 81 38
Total Supply 145 223 140 161 223 126 53
Marketings 87 155 121 109 154 66 35
Seed 4 2 3 3 2 1 0
Carry-over 30 35 0 30 45 15 8
Feed/Waste/Dockage 24 31 16 19 22 44 10
Total Disposition 145 223 140 161 223 126 53
000 bushels 2005-06 2006-07 2007-08 2008-09 2009-10 2010-11 2011-12
Opening Stocks Aug1 0 1,181 1,378 0 1,181 1,772 591
Production 5,700 7,598 4,149 6,350 7,598 3,201 1,500
Total Supply 5,700 8,779 5,527 6,350 8,779 4,972 2,090
Marketings 3,416 6,107 4,776 4,298 6,066 2,614 1,378
Seed 170 89 118 133 78 38 0
Carry-over 1,181 1,378 0 1,181 1,771 591 319
Feed/Waste/Dockage 933 1,206 633 738 864 1,730 394
Total Disposition 5,700 8,779 5,527 6,350 8,779 4,972 2,090
FLAX - Common Conversions 1 metric tonne flax = 39.368 bushels. There are 56 pounds in 1 bushel of flax.

117
Production and Value of Manitoba Flaxseed Seeded Harvested Average Price per Total
Year Area Area Yield Production Tonne Value(hectares) (hectares) (kg per ha) (tonnes) ($/tonne) ($000)
1990 295,400 295,400 1,300 381,000 208 79,2481991 250,083 250,083 1,300 330,200 157 51,8411992 149,700 133,500 1,600 208,300 213 44,3681993 232,700 218,500 1,100 243,900 226 55,1211994 279,200 275,200 1,400 381,000 268 102,1081995 313,600 313,600 1,300 403,900 297 119,9581996 230,700 228,600 1,600 358,200 335 119,9971997 267,100 267,100 1,300 355,600 330 117,3481998 283,300 275,200 1,300 360,700 305 110,0141999 210,400 202,300 1,300 271,800 204 55,4502000 176,000 174,000 1,200 205,700 209 42,9522001 182,100 176,000 1,100 199,400 277 55,2062002 174,000 172,000 1,200 214,600 362 77,6292003 157,800 157,800 1,200 195,600 336 65,7512004 133,500 103,200 1,300 132,100 387 51,1292005 141,600 127,500 1,100 144,800 375 54,3162006 155,200 151,800 1,300 193,000 238 45,9032007 80,900 78,900 1,300 105,400 351 37,0192008 107,200 105,200 1,500 161,300 615 99,2172009 121,400 117,400 1,600 193,000 417 80,5332010 70,800 66,800 1,200 81,300 418 34,0052011 38,400 35,200 1,100 38,100 525 20,017
Seeded Harvested Average Price per TotalYear Area Area Yield Production Bushel Value
(acres) (acres) (bu per acre) (000 bushels) ($/bushel) ($000)1990 730,000 730,000 20.5 15,000 5.28 79,2481991 617,968 617,968 21.0 13,000 3.99 51,8411992 370,000 330,000 24.8 8,200 5.41 44,3681993 575,000 540,000 17.8 9,600 5.74 55,1211994 690,000 680,000 22.1 15,000 6.81 102,1081995 775,000 775,000 20.5 15,900 7.54 119,9581996 570,000 565,000 25.0 14,100 8.51 119,9971997 660,000 660,000 21.2 14,000 8.38 117,3481998 700,000 680,000 20.9 14,200 7.75 110,0141999 520,000 500,000 21.4 10,700 5.18 55,4502000 435,000 430,000 18.8 8,100 5.30 42,9522001 450,000 435,000 18.0 7,850 7.03 55,2062002 430,000 425,000 19.9 8,450 9.19 77,6292003 390,000 390,000 19.7 7,700 8.54 65,7512004 330,000 255,000 20.4 5,200 9.83 51,1292005 350,000 315,000 18.1 5,700 9.53 54,3162006 383,509 375,000 20.3 7,600 6.04 45,9032007 200,000 195,000 21.3 4,150 8.92 37,0192008 265,000 260,000 24.4 6,350 15.62 99,2172009 300,000 290,000 26.2 7,600 10.60 80,5332010 175,000 165,000 19.4 3,200 10.63 34,0052011 95,000 87,000 17.2 1,500 13.34 20,017SOURCE: Statistics Canada; Agriculture and Agri-Food Canada; Manitoba Agriculture, Food and Rural Initiatives.

118
OVERVIEW OF THE SOYBEAN SECTOR IN MANITOBA
Soybeans were first introduced in Manitoba in the early 1900s when they were brought up from the United States. Due to the soybean's satisfactory palatability and relatively good yields, early production was used both for human consumption and as a fodder crop for livestock.
In the 1950s, research at the University
of Manitoba began to develop breeds more suitable to Manitoba's growing conditions. From the 1970s until today,
further soybean research and development at the University of Manitoba, eastern Canada and in the United States led to the introduction of early-maturing, high-yielding soybeans with high protein levels, better suited for Manitoba's climate.
This research, in combination with Manitoba farmers continued search for
diversification opportunities, led to a significant increase in soybean acres.
Over the last decade, soybeans have become a success story for agriculture in Manitoba with the arrival of early maturing and glyphosate resistant varieties. The new varieties make it possible to grow soybeans in northern and western areas of the province instead of only in the traditional Red River Valley region.
The ratio of genetically modified (GM) to non‐GM identity preserved (IP) soybeans is
typically 93 to 95% GM and 5 to 7% non‐GM. In 2011, Manitoba reported 1,858 soybean farms compared to 1,321 in 2006. This
represents 6.8% of soybean farms in Canada and approximately 10 to 18% of Canada's total soybean production.
Manitoba Manitoba Canada Canada
Soybeans 2011 2006 2011 2006Number of farms 1,858 1,321 27,215 23,263Acres 705,032 350,567 3,957,772 2,970,449Hectares 285,316 141,869 1,601,653 1,202,098Source: Census of Agriculture 2011

119
PROCESSING SOYBEANS SEED IN MANITOBA Different varieties of soybeans have been developed for different uses; for example,
soybeans intended for use in soy foods have a light-coloured seed coat and hilum. Soybeans intended for crushing or roasting have a high oil or high protein content.
Soybeans are used to make a diverse range of food products including soy milk, tofu, soy sauce, natto, miso, tempeh, oil, margarine, shortening, soy nuts, edamame, simulated meat (eg. artificial bacon bits) and food product ingredients.
Industrial products made with soybeans include printing ink, biodiesel, waxes for crayons and candles, solvents, lubricants, hydraulic fluid, plastics, fibres and textiles, and adhesives.
In agriculture, soybean meal and roasterd soybeans are used in livestock feed.
Canadian food grade soybeans are well suited for manufacturing uses due to high average protein content, high soluble sugar content and a high ratio of sucrose to oligosaccharides, important for tofu and soymilk quality and flavour. The isoflavone content of soybeans is also important depending on the processing end use.
Canadian Generic Food Type Soybean Composition - dry matter (DM), 2011: Chemical composition (g/100 g DM)
Protein content Oil content
41.820.6
Sugar content (g/kg DM) Sucrose Raffinose Stachyose Verbascose Total oligosaccharides 1
66.27.7
38.01.0
46.7Total Isoflavones 2 (mg/kg DM) 2,555.0
1 Sum of raffinose, stachyose and verbascose. 2 Sum of isoflavone aglycones (daidzien, genistein and glycitein), glucosides, malonyl glucosides
and acetyl glucosides. Important Characteristics in Soyfood Manufacturing:
Major Components Minor Components Characteristics AppearanceProtein (quantity and quality)
Oil Sucrose, oligosaccharides, total sugars
Fibre (as okara)
Isoflavones Vitamin E Saponins Lignins, other antioxidants
Anti-nutritionals (heavy metals, allergens)
Size Shape Uniformity Water uptake capacity and rate
Stone seed
Seed coat colour Hilum colour Seed coat sheen and brightness
Seed coat integrity
The main factors that can affect the requirements and specifications for raw
soybeans required by the soyfood manufacturer include industry consolidation, technological progress in manufacturing processes, higher production volumes, food safety requirements, packaging and labeling standards, and food manufacturing waste disposal restrictions.

120
Trade Currently Manitoba exports to the United States, Japan, and several other countries
in both Asia and Europe.
Producers and exporters must ensure proper segregation and management of both genetically modified (GM) and non-GM soybeans. Prior to shipping, the beans are cleaned to export standard and either bagged or shipped in bulk via railcar.
Approximately 35 percent of soybeans grown in Canada are non-GM, of which Japan is the largest customer. Food grade identity preserved (IP) soybeans are used to manufacture products such as soymilk, tofu, miso, natto, soy sauce and other soyfoods. Non-GM soybeans are also exported to several Asian countries and the European Union (E.U.). In addition, over half of the soybeans exported to the E.U. are GM, used in the crush market for biofuel.
In Canada, exporting companies specializing in non-GM soybeans work closely with farmers who grow non-GM soybeans. Contracts are developed based on the needs of the customer and are signed by the IP soybean farmer. Farmers must meet the quality standards specified in the contract to receive an IP premium. The Canadian Identity Preserved Recognition System operated by the Canadian Grain Commission covers all aspects of soybean production and processing from seed to export.
Although Canada is a small player in the international soybean trade, domestic
soybean production.of specialized high-quality, food-grade beans target local and foreign markets. Japan, Singapore and Malaysia are important markets for Canadian food grade soybeans.
Significant amounts of soybean oilcake and meal, valued at $80 million in 2011, are imported from the United States to supplement local feed supplies, mainly for pigs.
Future expectations of the Manitoba soybean industry include greater sizing and
cleaning capacity, additional production for the high-value human food market and further value-added bean processing in the province.
Local developments may include Manitoba livestock producers purchasing roasters
to roast soybeans for use in their livestock operations. Soyfood markets are dynamic and evolve with changing consumer interest in new
products and with nutritional and health concerns. Traditional soyfood markets, including tofu and soymilk, continue to respond to changing preference characteristics such as reduced beany or green flavour. Increasing interest in non-traditional products such as health beverages and snack foods is also generating new opportunities and challenges.
Organic soybean production and trade is relatively stable, estimated to represent less than 1% of Canada’s total soybean production. It is considered a niche opportunity for Canadian soybean growers in the short-term.

121
Soybean Outlook for Canada 2012-2013 For 2012-13, planted and harvested area are expected to rise by 4% and 2%,
respectively. Abandonment is expected to be near normal. Production and supply in Canada is forecast to decrease slightly.
However, higher imports will partly offset the impact of lower carry-in stocks.
Exports are forecast to decline only marginally in the face of solid world demand for
conventional-crush and food-grade soybeans. Total domestic use is forecast to rise slightly on a steady crush pace supported by
stable crush margins.
Carry-out stocks are forecast to decline slightly. Prices are also forecasted to decrease as higher US prices are offset by a slight
strengthening of the Canadian dollar and a widening of the Chicago-Chatham cash price spread.
For 2012-13, the USDA is forecasting the average US farm price of soybeans to increase by almost US$1.00/bu, to US$12.00 to US$14.00/bu despite higher production and supply. While world prices are expected to be strong during the first half of 2012-13, they are expected to ease during the second half, on forecasts of a large US and South American crop, stable Chinese buying and a return to normal yields.
Outlook for Soybeans 2010-2011 2011-2012p 2012-2013f
Area Seeded (kha) 1,483 1,550 1,606
Area Harvested (kha) 1,477 1,542 1,576
Yield (t/ha) 2.94 2.75 2.60
Production (kt) 4,345 4,246 4,100
Imports (kt) 266 200 350
Total Supply (kt) 4,912 4,748 4,800
Exports (kt) 2,757 2,600 2,700
Food & Industrial Use (kt) 1,448 1,450 1,450
Feed, Waste & Dockage (kt) 243 203 255
Total Domestic Use (kt) 1,853 1,798 1,850
Carry-out Stocks (kt) 301 350 250
Average Price ($/t) 447 435 to 465 450 to 480
Source: Statistics Canada and Agriculture and Agri-Food Canada, June 2012

122
0
100
200
300
400
500
600
700
2000 2001 2002 2003 2004 2005 2006 2007 2008 2009 2010 2011
TH
OU
SA
ND
AC
RE
S
YEAR
Soybeans - Seeded Acres in Manitoba2000 - 2011
Industry Intelligence Section, MAFRISource: Statistics Canada
0
100
200
300
400
500
600
2000 2001 2002 2003 2004 2005 2006 2007 2008 2009 2010 2011
TH
OU
SA
ND
AC
RE
S
YEAR
Soybeans - Harvested Acres in Manitoba2000 - 2011
Industry Intelligence Section, MAFRISource: Statistics Canada
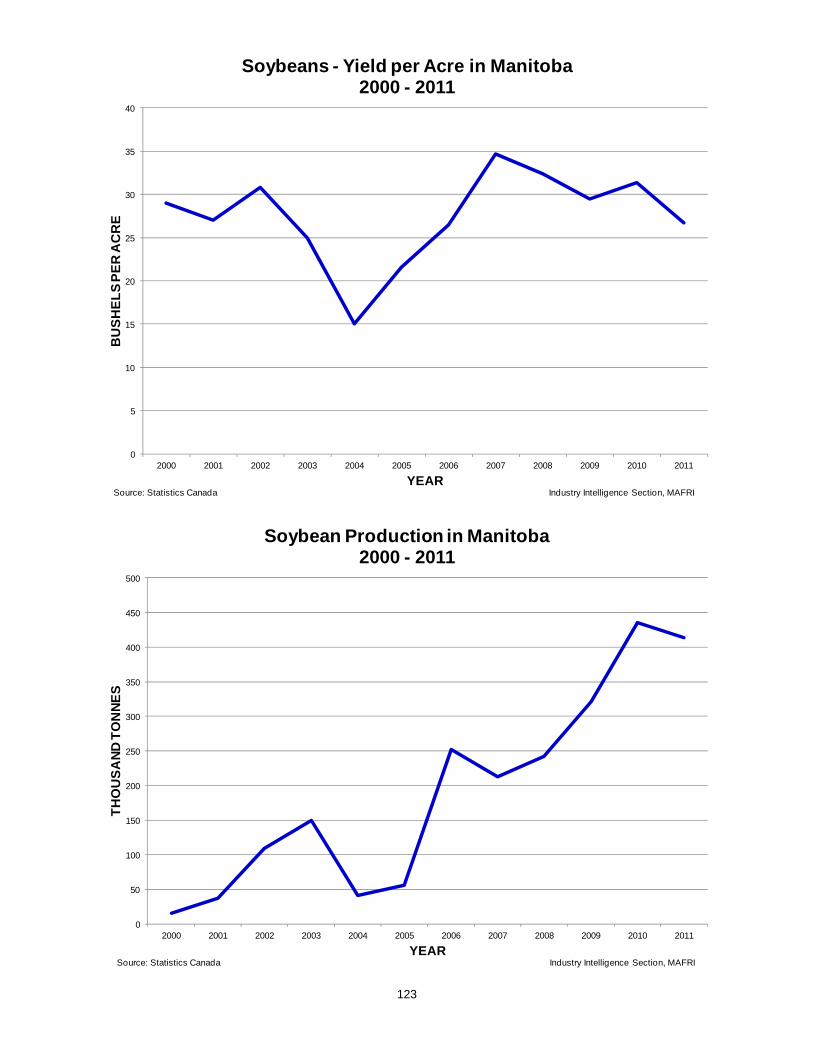
123
0
5
10
15
20
25
30
35
40
2000 2001 2002 2003 2004 2005 2006 2007 2008 2009 2010 2011
BU
SH
EL
S P
ER
AC
RE
YEAR
Soybeans - Yield per Acre in Manitoba2000 - 2011
Industry Intelligence Section, MAFRISource: Statistics Canada
0
50
100
150
200
250
300
350
400
450
500
2000 2001 2002 2003 2004 2005 2006 2007 2008 2009 2010 2011
TH
OU
SA
ND
TO
NN
ES
YEAR
Soybean Production in Manitoba2000 - 2011
Industry Intelligence Section, MAFRISource: Statistics Canada

124
0
50
100
150
200
250
300
350
400
450
2000 2001 2002 2003 2004 2005 2006 2007 2008 2009 2010 2011
DO
LL
AR
S P
ER
TO
NN
E
YEAR
Soybean Prices in Manitoba2000 - 2011
Industry Intelligence Section, Source: Statistics Canada
0
20
40
60
80
100
120
140
160
180
200
2000 2001 2002 2003 2004 2005 2006 2007 2008 2009 2010 2011
MIL
LIO
NS
OF
DO
LL
AR
S
YEAR
Value of Soybean Production in Manitoba2000 - 2011
Industry Intelligence Section, MAFRISource: STC, AAFC, MAFRI

125
0
0
0
1
1
1
1
2000 2001 2002 2003 2004 2005 2006 2007 2008 2009 2010 2011
DO
LL
AR
S P
ER
AC
RE
YEAR
Cost of Soybean Production in Manitoba2000 – 2011
Operating Costs of Production Total Costs of Production (including labour) Total Costs of Production (including labour)
Industry Intelligence Section, MAFRISource: MAFRI
0
100
200
300
400
500
600
700
800
900
2000 2001 2002 2003 2004 2005 2006 2007 2008 2009 2010 2011
MIL
LIO
NS
OF
DO
LL
AR
S
YEAR
Farm Cash Receipts for Soybeans in Manitoba2000 – 2011
Industry Intelligence Section, MAFRISource: Statistics Canada

126
0 50 100 150 200 250 300 350 400
2000-01
2001-02
2002-03
2003-04
2004-05
2005-06
2006-07
2007-08
2008-09
2009-10
2010-11
2011-12
THOUSAND TONNES
CR
OP
YE
AR
Marketings of Manitoba Soybeans2000 - 2011
Industry Intelligence Section, MAFRISource: STC, AAFC, MAFRI
0
20
40
60
80
100
120
140
160
180
2000 2001 2002 2003 2004 2005 2006 2007 2008 2009 2010 2011
MIL
LIO
NS
OF
DO
LL
AR
S
YEAR
Manitoba Soybean Exports2000 – 2011
Industry Intelligence Section, MAFRISource: Statistics Canada

127
Farm Supply and Disposition of Manitoba Soybean Crop, 2000/01 to 2011/12
000 tonnes 2005-06 2006-07 2007-08 2008-09 2009-10 2010-11 2011-12
Opening Stocks Aug1 2 15 35 20 9 10 20
Production 56 252 212 242 321 435 414
Total Supply 58 267 247 262 330 445 434
Marketings 37 200 170 170 207 344 300
Seed 0 0 0 0 0 0 0
Carry-over 15 35 20 9 10 20 30
Feed/Waste/Dockage 6 32 57 83 113 81 104
Total Disposition 58 267 247 262 330 445 434
000 pounds 2005-06 2006-07 2007-08 2008-09 2009-10 2010-11 2011-12
Opening Stocks Aug1 73 551 1,286 735 331 367 735
Production 2,058 9,259 7,790 8,892 11,795 15,984 15,212
Total Supply 2,131 9,811 9,076 9,627 12,126 16,351 15,947
Marketings 1,360 7,349 6,246 6,246 7,606 12,640 11,023
Seed 0 0 0 0 0 0 0
Carry-over 551 1,286 735 331 367 735 1,102
Feed/Waste/Dockage 220 1,176 2,094 3,050 4,152 2,976 3,821
Total Disposition 2,131 9,811 9,076 9,627 12,126 16,351 15,947
SOYBEANS - Common Conversions
1 metric tonne soybeans = 36.744 bushels. There are 60 lbs in 1 bushel of soybeans.

128
Production and Value of Manitoba Soybeans Year Seeded Area Harvested Area Average Yield Production Price/Tonne Total Value
(hectares) (hectares) (kg per ha) (tonnes) ($/tonne) ($000)1998 7,300 7,300 1,980 14,454 259 3,7441999 2,000 2,000 2,040 4,080 173 7062000 8,100 8,100 1,950 15,795 180 2,8432001 20,200 20,200 1,800 36,700 238 8,7272002 52,600 52,600 2,100 108,900 314 34,1892003 89,000 89,000 1,700 149,700 313 46,8492004 78,900 40,500 1,000 40,800 347 14,1372005 40,500 38,400 1,500 55,800 242 13,4772006 141,900 141,600 1,800 252,300 207 52,1232007 93,100 91,100 2,300 212,300 265 56,2932008 113,300 111,300 2,200 242,200 386 93,4502009 167,900 161,900 2,000 321,100 389 124,9622010 210,400 206,400 2,100 435,400 356 155,0462011 232,700 230,700 1,800 413,700 427 176,704
Seeded Harvested Average Price per TotalYear Area Area Yield Production Bushel Value (acres) (acres) (bu per acre) (000 bushels) ($/bushel) ($000)1998 18,000 18,000 29.5 531 7.05 3,7441999 5,000 5,000 30.5 153 4.63 7062000 20,000 20,000 29.0 580 4.90 2,8432001 50,000 50,000 27.0 1,350 6.46 8,7272002 130,000 130,000 30.8 4,000 8.55 34,1892003 220,000 220,000 25.0 5,500 8.52 46,8492004 195,000 100,000 15.0 1,500 9.42 14,1372005 100,000 95,000 21.6 2,050 6.57 13,4772006 350,567 350,000 26.5 9,270 5.62 52,1232007 230,000 225,000 34.7 7,800 7.22 56,2932008 280,000 275,000 32.4 8,900 10.50 93,4502009 415,000 400,000 29.5 11,800 10.59 124,9622010 520,000 510,000 31.4 16,000 9.69 155,0462011 575,000 570,000 26.7 15,200 11.63 176,704 SOURCE: Statistics Canada; Agriculture and Agri-Food Canada; Manitoba Agriculture, Food and Rural Initiatives.

129
OVERVIEW OF THE SUNFLOWER SECTOR IN MANITOBA
Sunflower is the only oilseed native
to the northern Great Plains of North America and has been grown commercially in Manitoba since the early 1940s.
In 2011, Manitoba reported 226
sunflower farms compared to 614 in 2006. This represents 5.0% of sunflower farms in Canada and Manitoba is the principle source of Canada's total sunflower production.
Manitoba is the nation’s largest producer of sunflower seed, producing both
confectionery and oilseed varieties of sunflower seed, and a competitive partner in the growing international market for this special crop.
Sunflower grows best on loam, silty loam, and silty clay loam soils with good drainage and low salinity. It has a deep tap root that can obtain water and nutrients from deep in the soil. Because of this root system, sunflowers are very adaptable and can be harvested even after an early snowfall, without reduction in quality. This adaptability makes them a viable alternative and rotational crop to traditional grains in southern parts of the province.
Shorter season varieties of sunflowers have been developed for areas where
traditional hybrid species cannot be grown. Sunflowers grown for oil are characterized by black hulls and they can be conventional hybrids, dwarf hybrids or open pollinated varieties. With oil-type sunflowers there are 3 different groupings: traditional, mid-oleic (NuSun), and high oleic. These groupings are based according to their specific oil profile. The mid-oleic varieties have an oil profile that is intermediate to the traditional and the high-oleic sunflower varieties.
Manitoba Manitoba Canada CanadaSunflowers 2011 2006 2011 2006Number of farms 226 614 456 905Acres 63,380 190,230 77,788 211,034Hectares 25,649 76,983 31,480 85,402Source: Census of Agriculture 2011

130
PROCESSING SUNFLOWER SEEDS IN MANITOBA The hardy sunflower has a wide range of uses, from the confectionary and baking
industries, to the birdseed industry, and the animal feed industry. Grade standards for both confection and oil type sunflowers are established by the
Canadian Grain Commission. Confection standards are considerably higher than those for oil type sunflowers since they are used for direct human consumption.
Sunflower seeds contain almost every vitamin (except Vitamin C) and substantial amounts of key minerals, including magnesium, iron, copper, and zinc. Given their high protein content, sunflower seeds can serve as a meat substitute.
Non-oil or confectionery type sunflowers have striped hulls and can be roasted and
salted or baked into bread products. Only the largest of confection type sunflowers are used for human consumption, with little tolerance for bird or insect damage.
Confection-type sunflowers have a standard bushel weight of 25 lb/bushel as compared to 30 lb/bushel for oil- type sunflowers. Canadian Grain Commission minimum test weights for No. 1 Canada sunflowers are 155g/0.5L for confection-type sunflowers, 169g/0.5L for oil-type sunflowers
Confectionery sunflower seeds fall into three categories: in shell, kernel, and birdseed. Larger sunflower seeds (in shell) are roasted, salted and packaged for human consumption and are classified as either large or jumbo. Medium-sized seeds (kernel) are de-hulled and primarily used for the bakery industry, as well as traded domestically and exported. Smaller seeds, known as "striped bird food," are sold in North American birdseed markets.
The black-shelled oilseed variety is richer in oil and better suited for the production of sunflower oil. The oil in sunflower seed is very high in polyunsaturated fatty acids. NuSun hybrids, which are less prone to oxidation, do not need hydrogenation to produce stable products with zero trans fatty acids.
The majority of oil sunflower seeds are crushed after the hull is removed. The oil is used for frying or to produce salad dressings, shortening, and margarine. The meal which usually contains about 35% protein, is used in livestock feed.
The birdfood market is comprised of about 85% oilseed sunflowers, however some of the smaller confection seeds are also used for birdseed.
Sunflower seeds provide high-energy feed for livestock due to their high fat content. Cattle producers can replace a part of barley grain/silage with sunflower seeds to enhance conjugated linoleic acids (CLA) content in milk and meat. Feeding whole sunflower seeds to dairy cattle as a way to increase the energy content of the diet of high-producing dairy cows may boost milk production by 3-5%. This can provide sunflower growers with an alternative market outlet for sunflower seeds, in times of low prices or damaged seeds.

131
Trade
Canada is the world's 13th largest exporter and 25th largest grower of sunflower
seeds, producing both confectionery and oilseed varieties.
Over the past 10 years, production of Canadian sunflower seed has more than doubled to meet market demand for confectionery and oilseed varieties.
Although a significant percentage of this market is domestic (North American), processors are increasingly accessing markets in Europe, the Middle East and Asia.
Canada is highly competitive in the international market. Over half of sunflower seed production is shipped, and more than 80% goes to the United States.
The birdseed trade is growing at an annual rate of 10% in North America. Canadian oil sunflower seeds are marketed primarily to the North American birdseed industry and include bulk shipments as well as cleaned and bagged products which are commonly referred to as "blacks".
Since Manitoba does not have a large scale sunflower crushing facility, most oilseed
sunflower production in Manitoba is either processed in Manitoba for the birdfood market or exported as raw a product to crushing facilities in the United States.
Confectionery sunflower seeds are popular in Canada and in many countries in the western hemisphere. Manitoba has been recognized for consistent high quality of both the in-shell confectionery variety and the dehulled kernel for the baking sector.
Dehulled confection type sunflowers are marketed both domestically and internationally. The European countries of Belgium, Germany and The Netherlands are large consumers of dehulled sunflowers as well as China.
In-shell confection type sunflowers are also sold both domestically and into export markets. Within Manitoba there are several secondary processors that roast and flavour the in-shell seed.
Export markets for roasted confectionery sunflower seeds include the United States, Germany, Holland, Belgium, Japan, Mexico, South America and the Middle East.
There are no registered GMO sunflower hybrids grown in Canada. Other factors influencing demand for Canadian sunflower seed include consistently high overall quality, secure supply, and the food and beverage industry’s excellent reputation in food safety and quality.
Sunflower oil, which is one of the highest quality vegetable oils has growing demand from human consumption markets, specifically for the mid-oleic (NuSun) oil profile. As such, a growing percentage of oilseed acres are being planted of the NuSun type in Manitoba. Traditional oil varieties continue to be produced in Manitoba, however market demands for this oil are declining.

132
Sunflower Seed Outlook for Canada 2012-2013 For 2012-13, the area seeded is expected to rise over 70% due higher expected
returns relative to other crops and the excessive moisture conditions which reduced area in 2011-12.
It is expected that area dedicated to confectionery and oilseed types will be similar this year.
Total production is expected to increase but supply is expected to decrease due to low carry-in stocks.
Exports of sunflower seed are forecast to decrease due to the limited supply. The US is forecast to remain the main market for Canadian sunflower seed, with smaller volumes going to the United Arab Emirates.
The premium for confectionery types over oilseed is expected to be about C$110/t, near the long term average.
The average Canadian price for all types is forecast to fall from 2011-12, due to an increase in sunflower seed supply in the US and Canada.
For 2012-13, US sunflower seed area is forecast by the USDA to increase by 17% due to attractive new crop prices compared to alternative crops. US sunflower seed production is expected to increase by 24% to 1.1 million tonnes.
Outlook for Sunflower Seed 2010-2011 2011-2012p 2012-2013f
Area Seeded (kha) 55 14 24
Area Harvested (kha) 51 14 23
Yield (t/ha) 1.32 1.43 1.52
Production (kt) 68 20 35
Imports (kt) 33 30 27
Total Supply (kt) 142 79 67
Exports (kt) 46 35 30
Total Domestic Use (kt) 68 39 32
Carry-out Stocks (kt) 29 5 5
Stocks-to-use ration (%) 26 7 8
Average Price ($/t) 630 700 to 730 695 to 725
Source: Statistics Canada and Agriculture and Agri-Food Canada, June 2012

133
0
50
100
150
200
250
2000 2001 2002 2003 2004 2005 2006 2007 2008 2009 2010 2011
TH
OU
SA
ND
AC
RE
S
YEAR
Sunflower Seed - Seeded Acres in Manitoba2000 - 2011
Industry Intelligence Section, MAFRISource: Statistics Canada
0
50
100
150
200
250
2000 2001 2002 2003 2004 2005 2006 2007 2008 2009 2010 2011
TH
OU
SA
ND
AC
RE
S
YEAR
Sunflower Seed - Harvested Acres in Manitoba2000 - 2011
Industry Intelligence Section, MAFRISource: Statistics Canada

134
0
200
400
600
800
1,000
1,200
1,400
1,600
1,800
2,000
2000 2001 2002 2003 2004 2005 2006 2007 2008 2009 2010 2011
00
0 P
OU
ND
S P
ER
AC
RE
YEAR
Sunflower Seed - Yield per Acre in Manitoba2000 - 2011
Industry Intelligence Section, MAFRISource: Statistics Canada
0
20
40
60
80
100
120
140
160
180
2000 2001 2002 2003 2004 2005 2006 2007 2008 2009 2010 2011
TH
OU
SA
ND
TO
NN
ES
YEAR
Sunflower Seed Production in Manitoba2000 - 2011
Industry Intelligence Section, MAFRISource: Statistics Canada
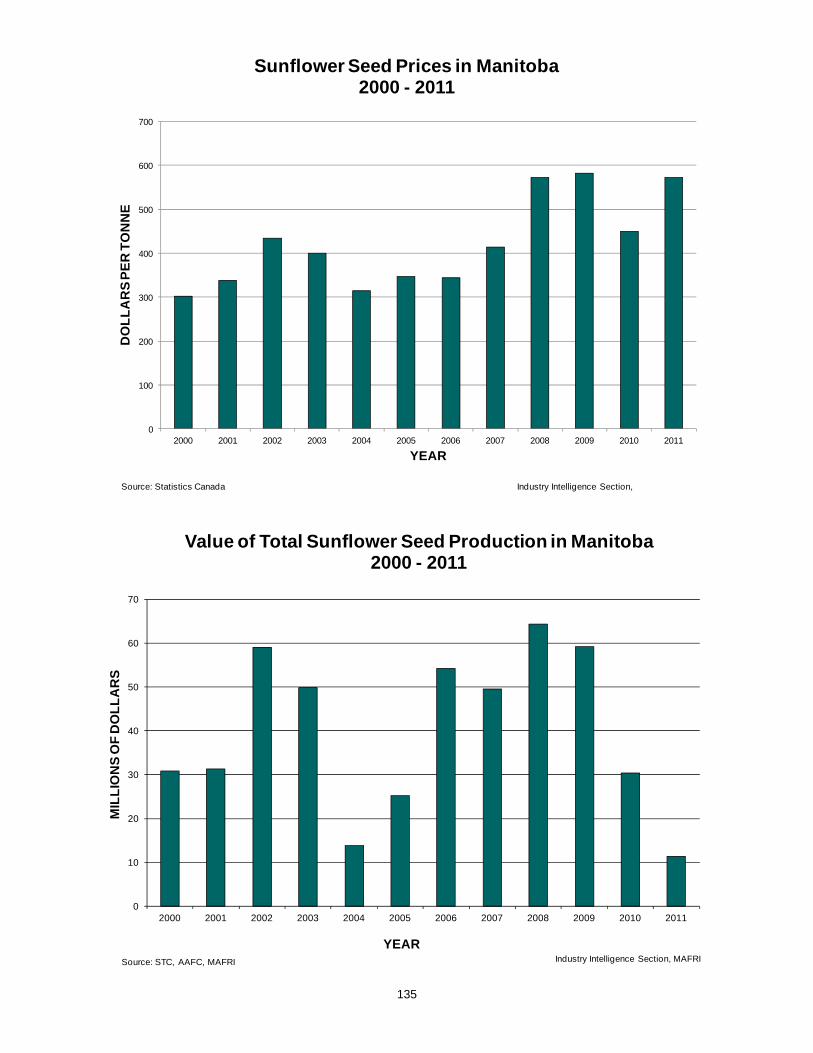
135
0
100
200
300
400
500
600
700
2000 2001 2002 2003 2004 2005 2006 2007 2008 2009 2010 2011
DO
LL
AR
S P
ER
TO
NN
E
YEAR
Sunflower Seed Prices in Manitoba2000 - 2011
Industry Intelligence Section, Source: Statistics Canada
0
10
20
30
40
50
60
70
2000 2001 2002 2003 2004 2005 2006 2007 2008 2009 2010 2011
MIL
LIO
NS
OF
DO
LL
AR
S
YEAR
Value of Total Sunflower Seed Production in Manitoba2000 - 2011
Industry Intelligence Section, MAFRISource: STC, AAFC, MAFRI

136
0
50
100
150
200
250
300
2000 2001 2002 2003 2004 2005 2006 2007 2008 2009 2010 2011
DO
LL
AR
S P
ER
AC
RE
YEAR
Cost of Sunflower Seed Production in Manitoba2000 – 2011
Operating Costs of Production Total Costs of Production (including labour) Total Costs of Production (including labour)
Industry Intelligence Section, MAFRISource: MAFRI
0
10
20
30
40
50
60
70
80
2000 2001 2002 2003 2004 2005 2006 2007 2008 2009 2010 2011
MIL
LIO
NS
OF
DO
LL
AR
S
YEAR
Farm Cash Receipts for Sunflower Seed in Manitoba2000 – 2011
Industry Intelligence Section, MAFRISource: Statistics Canada

137
0 20 40 60 80 100 120 140 160
2000-01
2001-02
2002-03
2003-04
2004-05
2005-06
2006-07
2007-08
2008-09
2009-10
2010-11
2011-12
THOUSAND TONNES
CR
OP
YE
AR
Marketings of Manitoba Sunflower Seed2000 - 2011
Industry Intelligence Section, MAFRISource: STC, AAFC, MAFRI
0
10
20
30
40
50
60
70
80
2000 2001 2002 2003 2004 2005 2006 2007 2008 2009 2010 2011
MIL
LIO
NS
OF
DO
LL
AR
S
YEAR
Manitoba Sunflower Seed Exports2000 – 2011
Industry Intelligence Section, MAFRISource: Statistics Canada
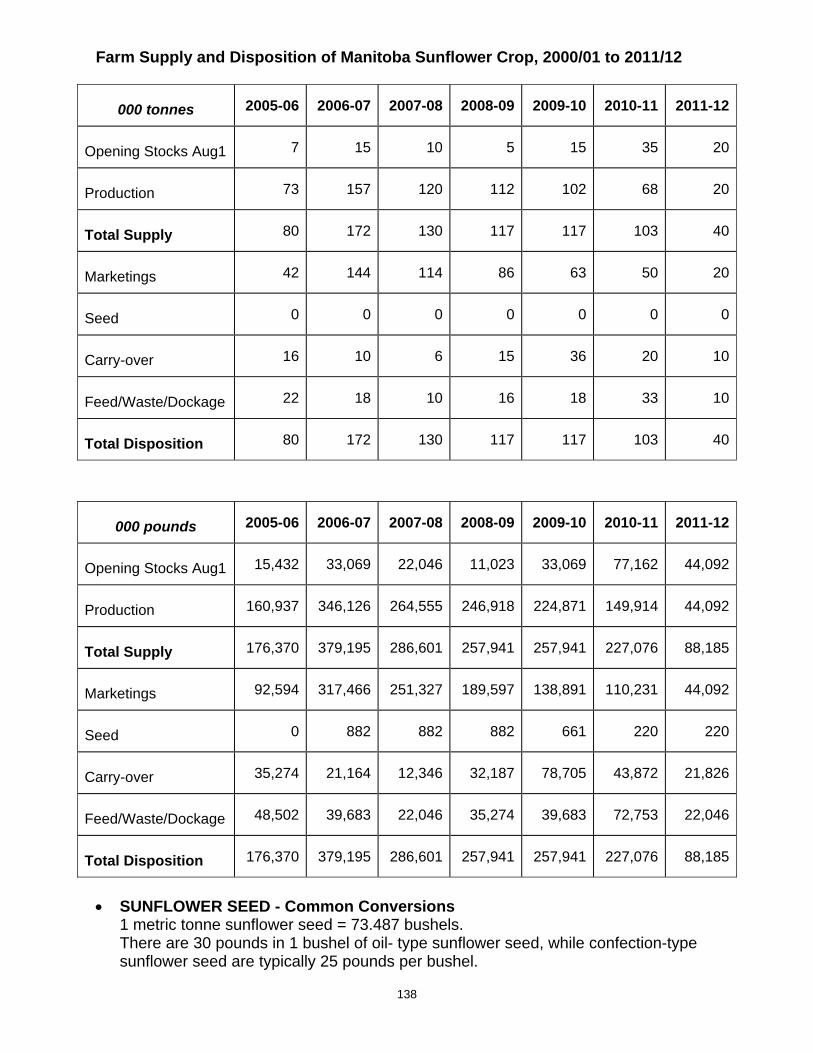
138
Farm Supply and Disposition of Manitoba Sunflower Crop, 2000/01 to 2011/12
000 tonnes 2005-06 2006-07 2007-08 2008-09 2009-10 2010-11 2011-12
Opening Stocks Aug1 7 15 10 5 15 35 20
Production 73 157 120 112 102 68 20
Total Supply 80 172 130 117 117 103 40
Marketings 42 144 114 86 63 50 20
Seed 0 0 0 0 0 0 0
Carry-over 16 10 6 15 36 20 10
Feed/Waste/Dockage 22 18 10 16 18 33 10
Total Disposition 80 172 130 117 117 103 40
000 pounds 2005-06 2006-07 2007-08 2008-09 2009-10 2010-11 2011-12
Opening Stocks Aug1 15,432 33,069 22,046 11,023 33,069 77,162 44,092
Production 160,937 346,126 264,555 246,918 224,871 149,914 44,092
Total Supply 176,370 379,195 286,601 257,941 257,941 227,076 88,185
Marketings 92,594 317,466 251,327 189,597 138,891 110,231 44,092
Seed 0 882 882 882 661 220 220
Carry-over 35,274 21,164 12,346 32,187 78,705 43,872 21,826
Feed/Waste/Dockage 48,502 39,683 22,046 35,274 39,683 72,753 22,046
Total Disposition 176,370 379,195 286,601 257,941 257,941 227,076 88,185
SUNFLOWER SEED - Common Conversions 1 metric tonne sunflower seed = 73.487 bushels. There are 30 pounds in 1 bushel of oil- type sunflower seed, while confection-type
sunflower seed are typically 25 pounds per bushel.

139
Production and Value of Manitoba Sunflower Seed Year Seeded Area Harvested Area Average Yield Production Price/Tonne Total Value
(hectares) (hectares) (kg per ha) (tonnes) ($/tonne) ($000)1990 56,700 56,700 1,780 100,700 235 23,6651991 73,800 73,800 1,684 124,300 229 28,4651992 64,700 42,500 1,301 55,300 244 13,4931993 50,600 44,500 1,061 47,200 329 15,5291994 56,700 56,700 1,527 86,600 320 27,7121995 30,400 26,300 1,654 43,500 350 15,2251996 25,500 24,300 1,551 37,700 310 11,6871997 34,400 34,400 1,380 47,600 350 16,6601998 50,600 50,600 1,700 86,200 320 27,5841999 56,700 50,600 1,640 82,900 300 24,8702000 62,700 58,700 1,730 101,800 303 30,8082001 62,700 56,700 1,640 92,900 338 31,3732002 85,000 80,900 1,680 136,100 434 59,0542003 89,000 87,000 1,430 124,700 400 49,8232004 66,800 44,500 990 44,000 315 13,8382005 74,900 60,700 1,200 72,700 348 25,2652006 77,000 76,900 2,050 157,300 345 54,2182007 76,900 74,900 1,600 119,800 413 49,5092008 68,800 68,800 1,630 112,200 573 64,2632009 64,700 63,500 1,600 101,900 581 59,2132010 54,600 51,400 1,320 67,600 450 30,3962011 14,200 13,800 1,430 19,800 572 11,332
Seeded Harvested Average Price per TotalYear Area Area Yield Production Bushel Value
(acres) (acres) (lb per acre) (000 pounds) ($/pound) ($000)1990 140,000 140,000 1,586.0 222,000 0.107 23,6651991 182,363 182,363 1,502.0 274,000 0.104 28,4651992 160,000 105,000 1,162.0 122,000 0.111 13,4931993 125,000 110,000 945.0 104,000 0.149 15,5291994 140,000 140,000 1,364.0 191,000 0.145 27,7121995 75,000 65,000 1,477.0 96,000 0.159 15,2251996 63,000 60,000 1,387.0 83,200 0.140 11,6871997 85,000 85,000 1,235.0 105,000 0.159 16,6601998 125,000 125,000 1,520.0 190,000 0.145 27,5841999 140,000 125,000 1,462.0 182,800 0.136 24,8702000 155,000 145,000 1,548.0 224,500 0.137 30,8082001 155,000 140,000 1,462.0 204,700 0.153 31,3732002 210,000 200,000 1,500.0 300,000 0.197 59,0542003 220,000 215,000 1,279.0 275,000 0.181 49,8232004 165,000 110,000 882.0 97,000 0.143 13,8382005 185,000 150,000 1,069.0 160,300 0.158 25,2652006 190,230 190,000 1,825.0 346,800 0.156 54,2182007 190,000 185,000 1,428.0 264,100 0.187 49,5092008 170,000 170,000 1,455.0 247,300 0.260 64,2632009 160,000 157,000 1,431.0 224,700 0.264 59,2132010 135,000 127,000 1,173.0 149,000 0.204 30,3962011 35,000 34,000 1,282.0 43,600 0.260 11,332
SOURCE: Statistics Canada; Agriculture and Agri-Food Canada; Manitoba Agriculture, Food and Rural Initiatives.
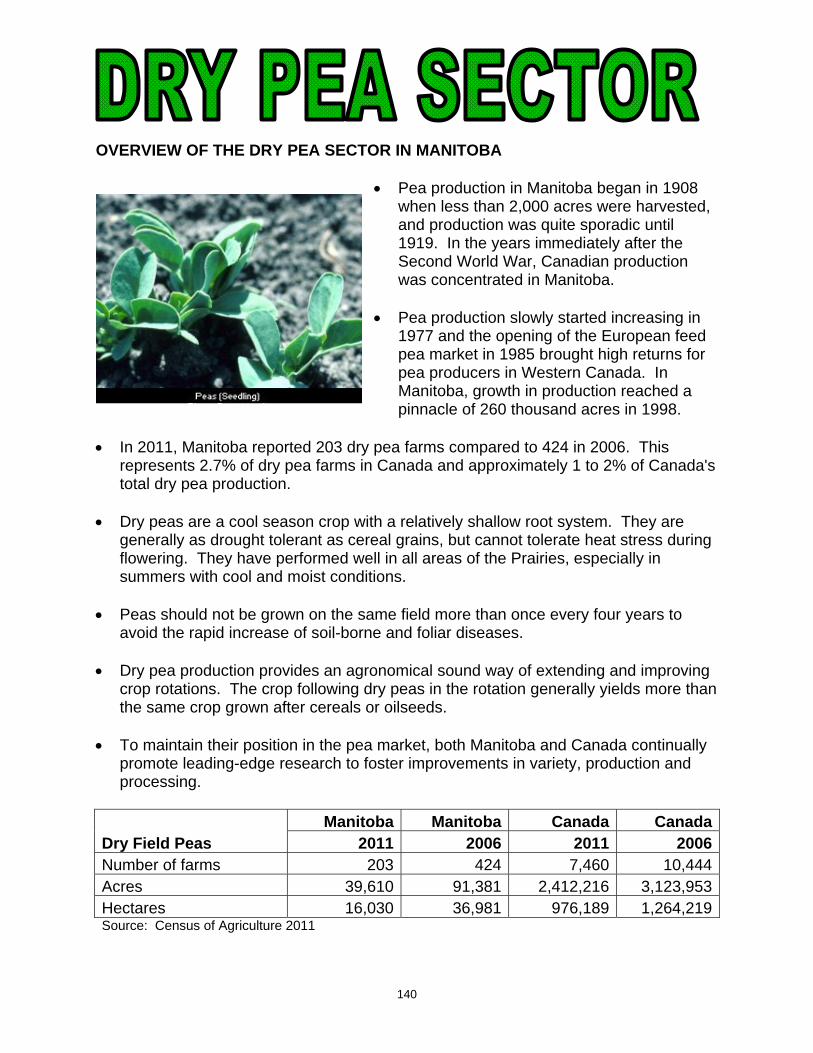
140
OVERVIEW OF THE DRY PEA SECTOR IN MANITOBA
Pea production in Manitoba began in 1908 when less than 2,000 acres were harvested, and production was quite sporadic until 1919. In the years immediately after the Second World War, Canadian production was concentrated in Manitoba.
Pea production slowly started increasing in
1977 and the opening of the European feed pea market in 1985 brought high returns for pea producers in Western Canada. In Manitoba, growth in production reached a pinnacle of 260 thousand acres in 1998.
In 2011, Manitoba reported 203 dry pea farms compared to 424 in 2006. This
represents 2.7% of dry pea farms in Canada and approximately 1 to 2% of Canada's total dry pea production.
Dry peas are a cool season crop with a relatively shallow root system. They are
generally as drought tolerant as cereal grains, but cannot tolerate heat stress during flowering. They have performed well in all areas of the Prairies, especially in summers with cool and moist conditions.
Peas should not be grown on the same field more than once every four years to
avoid the rapid increase of soil-borne and foliar diseases. Dry pea production provides an agronomical sound way of extending and improving
crop rotations. The crop following dry peas in the rotation generally yields more than the same crop grown after cereals or oilseeds.
To maintain their position in the pea market, both Manitoba and Canada continually
promote leading-edge research to foster improvements in variety, production and processing.
Manitoba Manitoba Canada CanadaDry Field Peas 2011 2006 2011 2006Number of farms 203 424 7,460 10,444Acres 39,610 91,381 2,412,216 3,123,953Hectares 16,030 36,981 976,189 1,264,219Source: Census of Agriculture 2011

141
Processing Dry Peas in Manitoba Processing occurs both within Winnipeg and throughout the surrounding region.
There are several companies in Manitoba that clean, split and bag peas for export. Number 2 Yellow is the minimum grade for processing and many export markets.
#1 and #2 Green are required for export markets. Major factors in downgrading peas are pale colour in greens, soil particles, splits, cracked seed coats and shrivelled, immature seed.
Feed peas are mainly used by the hog industry along with poultry and cattle. They
are a good source of energy and contain amounts of digestible energy comparable to wheat. They are high in amino acids and lysine, complementing the amino acid profile of canola meal, which is high in methionine and cystine. The amino acids in feed peas are highly digestible by hogs and poultry. In addition, dry peas do not have to be heat treated to deactivate anti-nutritional factors.
Dry peas are very economical as a feed ingredient and can act as a substitute for
imported corn and soybean meal in western Canada. However, in eastern Manitoba, using dry pea feed is a disadvantage due to lower transportation costs from the U.S mid-west corn and soybean producing areas.
Other processing in Manitoba includes the refinement of pea starch and protein, the
production of fine and coarse pea hull fibre, and the production of consumer packaged goods such as pea soups.
Food use of dry peas includes canning, split, and whole dry markets, as well as
products such as flour, starch, and fibre. These products are then used in baked goods, baking mixes, soup mixes, breakfast cereals, processed meats, health foods, pastas, and purees.
Dry peas are low in sodium, high in protein and are an excellent source of both
soluble and insoluble fibre, complex carbohydrates, B vitamins and minerals such as calcium, iron and potassium.
Reseach at the University of Manitoba reports that dry peas are high in fibre, low in
fat and cholesterol free, with a positive effect on heart health due to demonstrated cholesterol and lipid lowering properties.
The smooth, green- and yellow-seeded varieties are used for human consumption
as dry split field peas. Field peas have high levels of the essential amino acids, lysine and tryptophan.
Field pea flour is a valued vegetable protein source that is gluten free and an excellent source of the B vitamin folate. Its use in the food industry is increasing due to unique functional properties and due to the fact that that peas are already an accepted part of the human diet throughout the world. The viscosity of slurried pea flours makes them useful in aqueous food systems.

142
Trade Canada is expected to continue to be the largest producer and exporter of dry peas
in the world. The majority of dry peas produced by Manitoba producers are yellow peas for food
and livestock feed. Green peas are also produced, although in lesser amounts. Some of the food quality peas are shipped to canneries in Eastern Canada. The majority of food pea exports are shipped to countries such as Spain, Belgium,
the United States and Mexico. Manitoba also exports small amounts of pea flour to the United States, Belgium,
Norway and the United Kingdom. The export human consumption market has been growing as more pulse-consuming
countries, such as India and Colombia, purchase whole or split pea to provide relatively low-cost protein to their growing populations.
Exports to India are expected to continue to increase as a result of an expanding
middle class and the country's inability to meet the increasing population growth driven consumption. In India the deficit between production and imports has been growing over the past 6 years with Canadian share of exports comprising about 50% of the shortfall.
Relatively new large markets such as China, where pea use is increasingly being
incorporated into food use should continue to provide good export growth prospects. New export markets for food peas are expected to be developed as a result of
research and market development focusing on the health aspects of a diet incorporating pulses.
Dry peas (Pisum sativum) have the largest production volume of all special crops in
Canada. The main varieties include yellow, green, maple, green marrowfat, and Austrian winter peas.
The determination of which pea is produced is dependent upon whether the peas
are destined for the feed or food market. The yellow pea is the most widely seeded and produced, with approximately 40 varieties registered in Canada, while the newest type, the green marrowfat, has two registered varieties.
Yellow peas are grown for either human food or animal feed. Green peas are grown
for human consumption; and small amounts of other types are also grown such as marrowfat for snack foods, maple types for bird feed and small-seeded forage types.
Dry pea production is expected to trend moderately upwards due to increasing
demand in the food and feed sectors, the continued development of improved varieties and their fit in rotations with other crops.
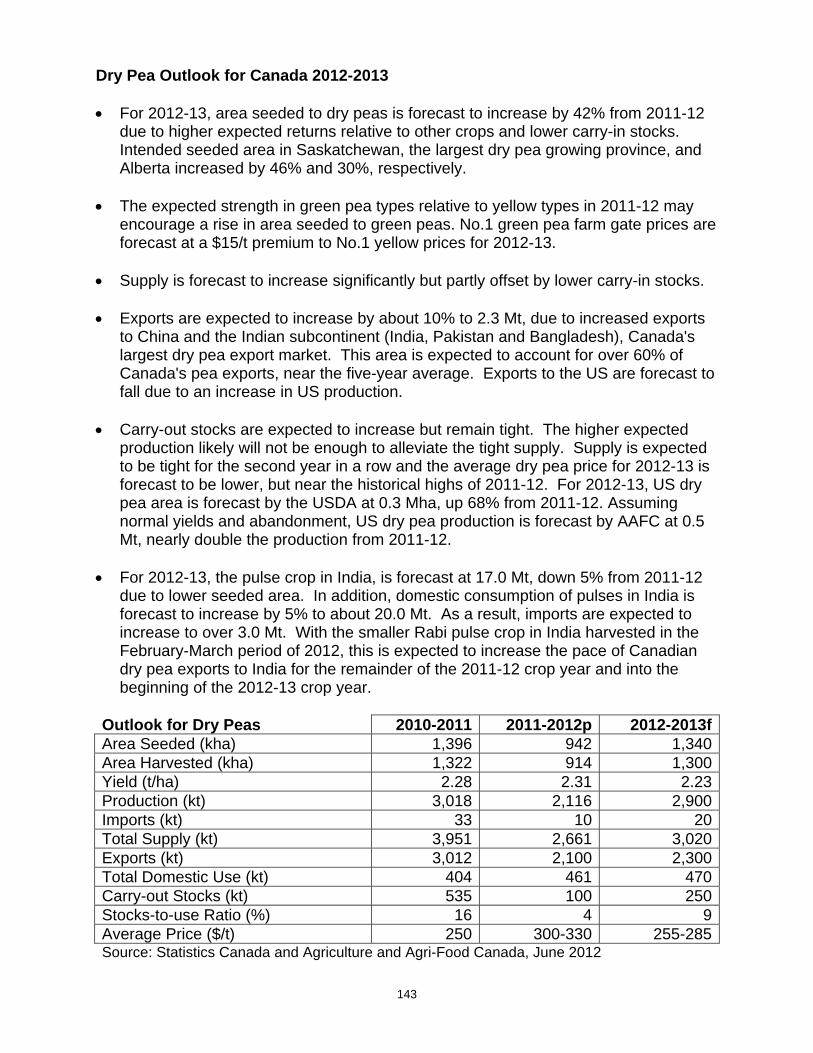
143
Dry Pea Outlook for Canada 2012-2013 For 2012-13, area seeded to dry peas is forecast to increase by 42% from 2011-12
due to higher expected returns relative to other crops and lower carry-in stocks. Intended seeded area in Saskatchewan, the largest dry pea growing province, and Alberta increased by 46% and 30%, respectively.
The expected strength in green pea types relative to yellow types in 2011-12 may
encourage a rise in area seeded to green peas. No.1 green pea farm gate prices are forecast at a $15/t premium to No.1 yellow prices for 2012-13.
Supply is forecast to increase significantly but partly offset by lower carry-in stocks. Exports are expected to increase by about 10% to 2.3 Mt, due to increased exports
to China and the Indian subcontinent (India, Pakistan and Bangladesh), Canada's largest dry pea export market. This area is expected to account for over 60% of Canada's pea exports, near the five-year average. Exports to the US are forecast to fall due to an increase in US production.
Carry-out stocks are expected to increase but remain tight. The higher expected
production likely will not be enough to alleviate the tight supply. Supply is expected to be tight for the second year in a row and the average dry pea price for 2012-13 is forecast to be lower, but near the historical highs of 2011-12. For 2012-13, US dry pea area is forecast by the USDA at 0.3 Mha, up 68% from 2011-12. Assuming normal yields and abandonment, US dry pea production is forecast by AAFC at 0.5 Mt, nearly double the production from 2011-12.
For 2012-13, the pulse crop in India, is forecast at 17.0 Mt, down 5% from 2011-12
due to lower seeded area. In addition, domestic consumption of pulses in India is forecast to increase by 5% to about 20.0 Mt. As a result, imports are expected to increase to over 3.0 Mt. With the smaller Rabi pulse crop in India harvested in the February-March period of 2012, this is expected to increase the pace of Canadian dry pea exports to India for the remainder of the 2011-12 crop year and into the beginning of the 2012-13 crop year.
Outlook for Dry Peas 2010-2011 2011-2012p 2012-2013fArea Seeded (kha) 1,396 942 1,340Area Harvested (kha) 1,322 914 1,300Yield (t/ha) 2.28 2.31 2.23Production (kt) 3,018 2,116 2,900Imports (kt) 33 10 20Total Supply (kt) 3,951 2,661 3,020Exports (kt) 3,012 2,100 2,300Total Domestic Use (kt) 404 461 470Carry-out Stocks (kt) 535 100 250Stocks-to-use Ratio (%) 16 4 9Average Price ($/t) 250 300-330 255-285Source: Statistics Canada and Agriculture and Agri-Food Canada, June 2012
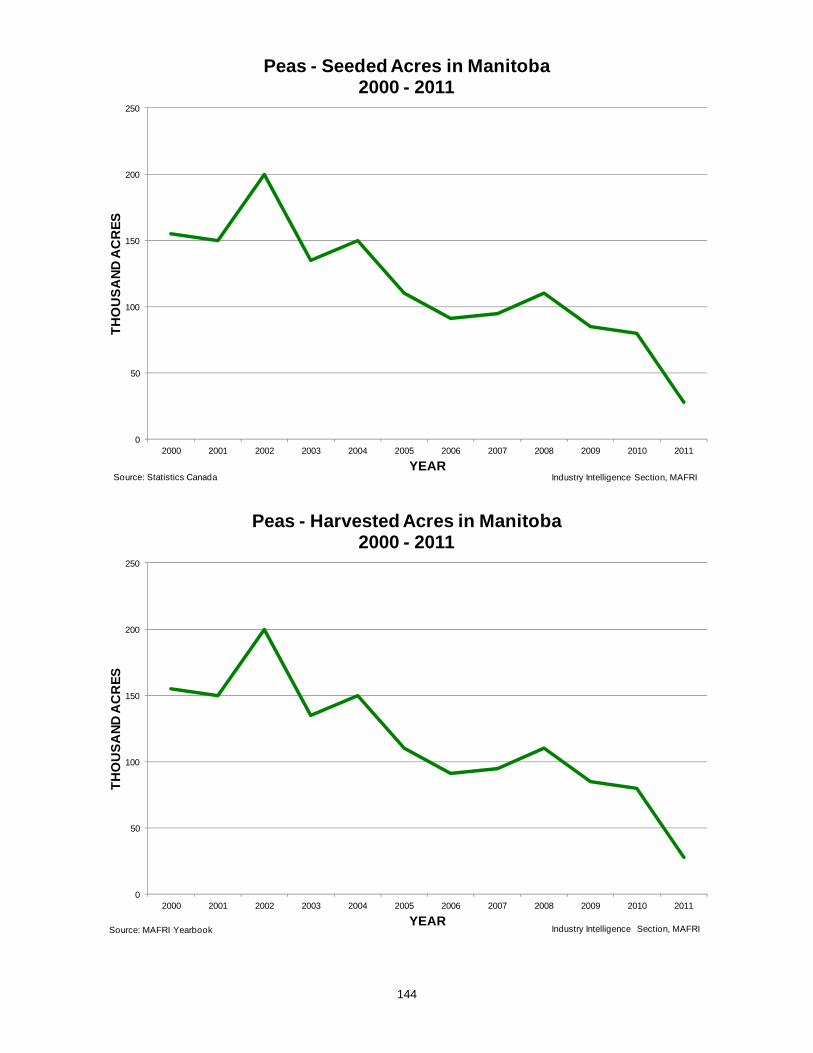
144
0
50
100
150
200
250
2000 2001 2002 2003 2004 2005 2006 2007 2008 2009 2010 2011
TH
OU
SA
ND
AC
RE
S
YEAR
Peas - Seeded Acres in Manitoba2000 - 2011
Industry Intelligence Section, MAFRISource: Statistics Canada
0
50
100
150
200
250
2000 2001 2002 2003 2004 2005 2006 2007 2008 2009 2010 2011
TH
OU
SA
ND
AC
RE
S
YEAR
Peas - Harvested Acres in Manitoba2000 - 2011
Industry Intelligence Section, MAFRISource: MAFRI Yearbook
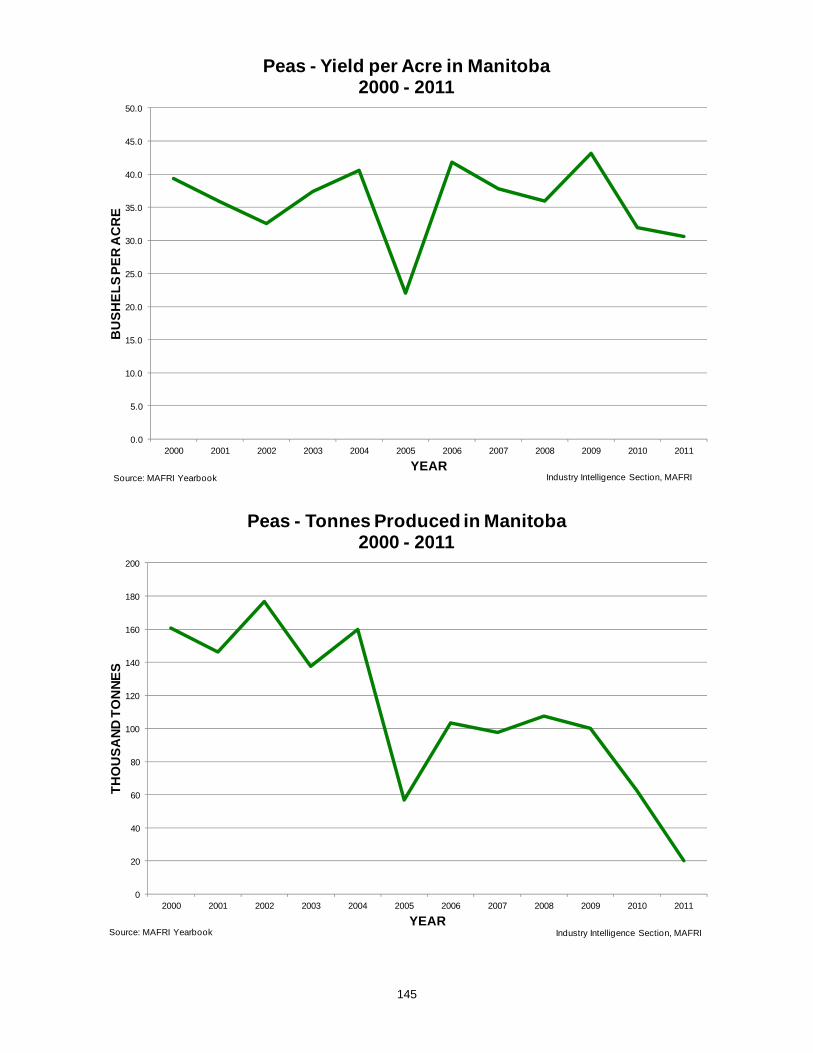
145
0.0
5.0
10.0
15.0
20.0
25.0
30.0
35.0
40.0
45.0
50.0
2000 2001 2002 2003 2004 2005 2006 2007 2008 2009 2010 2011
BU
SH
EL
S P
ER
AC
RE
YEAR
Peas - Yield per Acre in Manitoba2000 - 2011
Industry Intelligence Section, MAFRISource: MAFRI Yearbook
0
20
40
60
80
100
120
140
160
180
200
2000 2001 2002 2003 2004 2005 2006 2007 2008 2009 2010 2011
TH
OU
SA
ND
TO
NN
ES
YEAR
Peas - Tonnes Produced in Manitoba2000 - 2011
Industry Intelligence Section, MAFRISource: MAFRI Yearbook

146
0
50
100
150
200
250
300
350
2000 2001 2002 2003 2004 2005 2006 2007 2008 2009 2010 2011
DO
LL
AR
S P
ER
TO
NN
E
YEAR
Dry Pea Prices in Manitoba2000 – 2011
Industry Intelligence Section, MAFRISource: STC, AAFC, MAFRI
0
5
10
15
20
25
30
35
40
2000 2001 2002 2003 2004 2005 2006 2007 2008 2009 2010 2011
MIL
LIO
NS
OF
DO
LL
AR
S
YEAR
Value of Dry Pea Production in Manitoba2000 - 2011
Industry Intelligence Section, MAFRISource: STC, AAFC, MAFRI
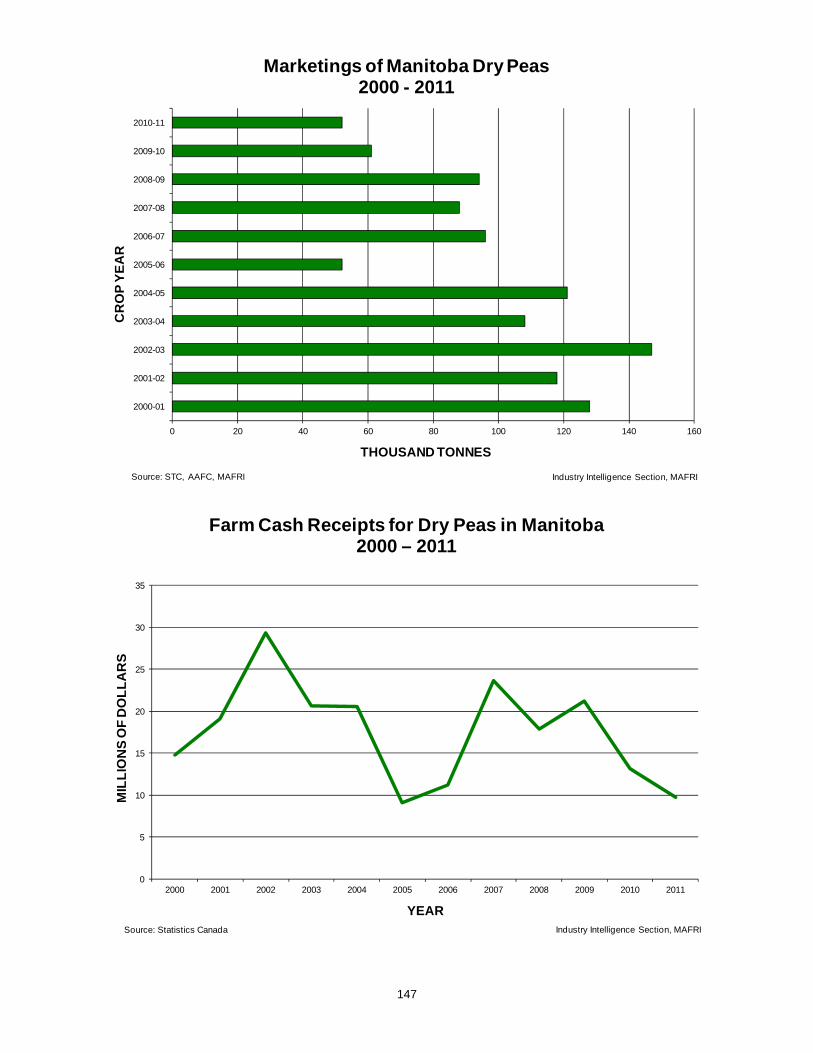
147
0 20 40 60 80 100 120 140 160
2000-01
2001-02
2002-03
2003-04
2004-05
2005-06
2006-07
2007-08
2008-09
2009-10
2010-11
THOUSAND TONNES
CR
OP
YE
AR
Marketings of Manitoba Dry Peas2000 - 2011
Industry Intelligence Section, MAFRISource: STC, AAFC, MAFRI
0
5
10
15
20
25
30
35
2000 2001 2002 2003 2004 2005 2006 2007 2008 2009 2010 2011
MIL
LIO
NS
OF
DO
LL
AR
S
YEAR
Farm Cash Receipts for Dry Peas in Manitoba2000 – 2011
Industry Intelligence Section, MAFRISource: Statistics Canada
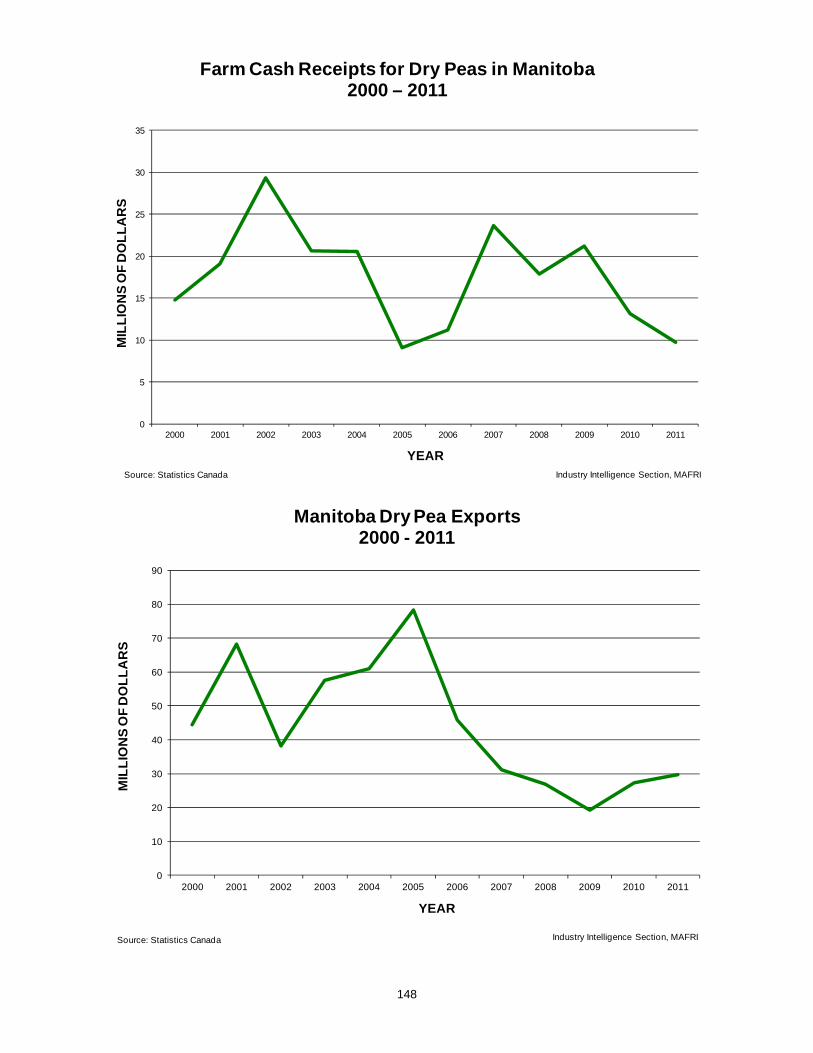
148
0
5
10
15
20
25
30
35
2000 2001 2002 2003 2004 2005 2006 2007 2008 2009 2010 2011
MIL
LIO
NS
OF
DO
LL
AR
S
YEAR
Farm Cash Receipts for Dry Peas in Manitoba2000 – 2011
Industry Intelligence Section, MAFRISource: Statistics Canada
0
10
20
30
40
50
60
70
80
90
2000 2001 2002 2003 2004 2005 2006 2007 2008 2009 2010 2011
MIL
LIO
NS
OF
DO
LL
AR
S
YEAR
Manitoba Dry Pea Exports2000 - 2011
Industry Intelligence Section, MAFRISource: Statistics Canada
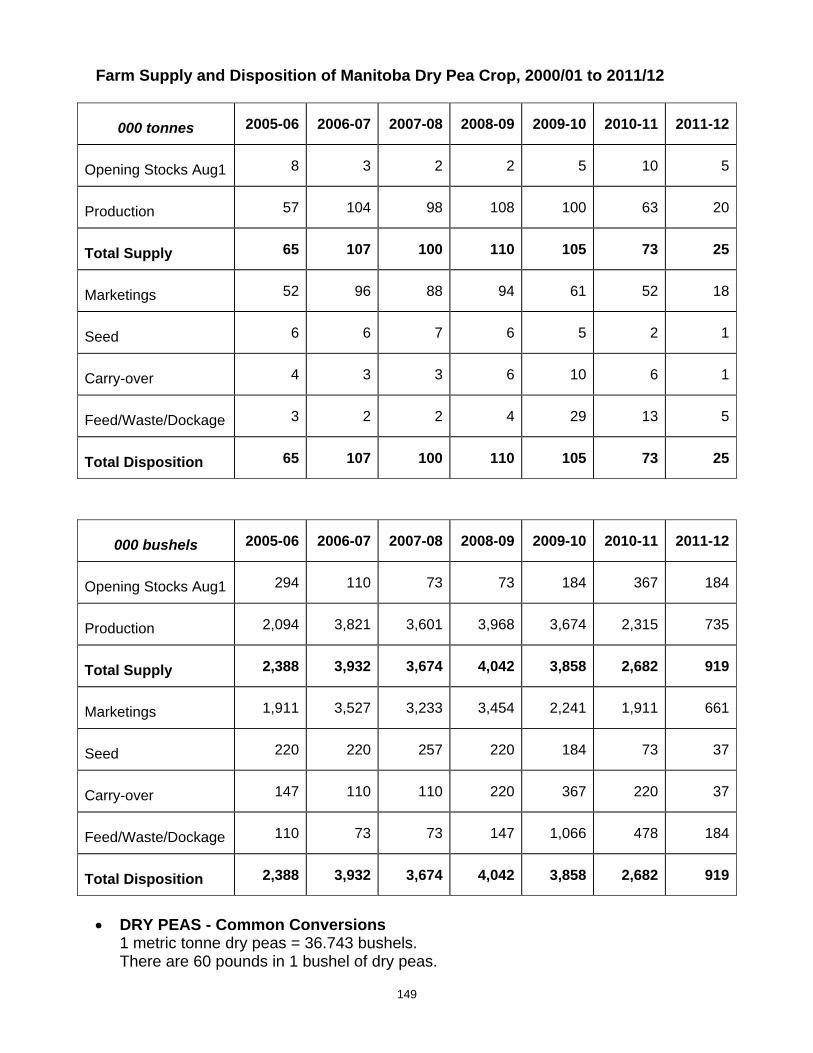
149
Farm Supply and Disposition of Manitoba Dry Pea Crop, 2000/01 to 2011/12
000 tonnes 2005-06 2006-07 2007-08 2008-09 2009-10 2010-11 2011-12
Opening Stocks Aug1 8 3 2 2 5 10 5
Production 57 104 98 108 100 63 20
Total Supply 65 107 100 110 105 73 25
Marketings 52 96 88 94 61 52 18
Seed 6 6 7 6 5 2 1
Carry-over 4 3 3 6 10 6 1
Feed/Waste/Dockage 3 2 2 4 29 13 5
Total Disposition 65 107 100 110 105 73 25
000 bushels 2005-06 2006-07 2007-08 2008-09 2009-10 2010-11 2011-12
Opening Stocks Aug1 294 110 73 73 184 367 184
Production 2,094 3,821 3,601 3,968 3,674 2,315 735
Total Supply 2,388 3,932 3,674 4,042 3,858 2,682 919
Marketings 1,911 3,527 3,233 3,454 2,241 1,911 661
Seed 220 220 257 220 184 73 37
Carry-over 147 110 110 220 367 220 37
Feed/Waste/Dockage 110 73 73 147 1,066 478 184
Total Disposition 2,388 3,932 3,674 4,042 3,858 2,682 919
DRY PEAS - Common Conversions 1 metric tonne dry peas = 36.743 bushels. There are 60 pounds in 1 bushel of dry peas.

150
Production and Value of Manitoba Dry Peas
Seeded Harvested Average Price per TotalYear Area Area Yield Production Tonne Value
(hectares) (hectares) (kg per ha) (tonnes) ($/tonne) ($000)1990 36,400 36,400 2,000.000 73,500 178 13,0831991 51,557 51,557 1,600.000 84,400 171 14,4321992 50,600 48,600 2,200.000 108,900 193 21,0181993 80,900 60,700 1,400.000 85,700 182 15,5971994 85,000 80,900 2,100.000 168,700 182 30,7031995 72,800 72,800 2,000.000 147,000 206 30,2821996 58,700 56,700 2,300.000 132,000 219 28,9081997 82,900 82,900 2,200.000 178,300 177 31,5591998 105,200 103,200 2,200.000 225,900 147 33,2071999 42,400 38,400 2,400.000 92,000 144 13,2482000 62,600 60,600 2,600.000 160,500 131 20,9662001 60,700 60,700 2,400.000 146,100 158 23,1232002 80,800 80,800 2,200.000 176,900 212 37,4232003 54,600 54,600 2,500.000 137,400 174 23,9742004 60,600 58,600 2,700.000 160,000 175 27,9492005 44,500 38,400 1,500.000 56,900 136 7,7202006 37,000 36,800 2,800.000 103,500 142 14,6582007 38,500 38,500 2,500.000 97,700 230 22,4222008 44,400 44,400 2,400.000 107,500 310 33,3052009 34,400 34,400 2,900.000 100,000 245 24,4852010 32,400 29,200 2,100.000 62,600 210 13,1482011 11,300 9,700 2,100.000 20,000 289 5,772
Seeded Harvested Average Price per TotalYear Area Area Yield Production Bushel Value
(acres) (acres) (bu per acre) (000 bushels) ($/bushel) ($000)1990 90,000 90,000 30.0 2,700 4.85 13,0831991 127,401 127,401 24.3 3,100 4.66 14,4321992 125,000 120,000 33.3 4,000 5.25 21,0181993 200,000 150,000 21.0 3,150 4.95 15,5971994 210,000 200,000 31.0 6,200 4.95 30,7031995 180,000 180,000 30.0 5,400 5.61 30,2821996 145,000 140,000 34.6 4,850 5.96 28,9081997 205,000 205,000 32.0 6,550 4.82 31,5591998 260,000 255,000 32.5 8,300 4.00 33,2071999 105,000 95,000 35.6 3,380 3.92 13,2482000 155,000 150,000 39.3 5,900 3.55 20,9662001 150,000 150,000 35.8 5,370 4.31 23,1232002 200,000 200,000 32.5 6,500 5.76 37,4232003 135,000 135,000 37.4 5,050 4.75 23,9742004 150,000 145,000 40.6 5,880 4.75 27,9492005 110,000 95,000 22.0 2,090 3.69 7,7202006 91,381 91,000 41.8 3,800 3.86 14,6582007 95,000 95,000 37.8 3,590 6.25 22,4222008 110,000 110,000 35.9 3,950 8.43 33,3052009 85,000 85,000 43.2 3,675 6.66 24,4852010 80,000 72,000 31.9 2,300 5.72 13,1482011 28,000 24,000 30.6 735 7.85 5,772SOURCE: Statistics Canada; Agriculture and Agri-Food Canada; Manitoba Agriculture, Food and Rural Initiatives.

151
OVERVIEW OF THE CANARY SEED SECTOR IN MANITOBA
Western Canada is the world's largest producer and exporter of canary seed (Phalaris canariensis).
Saskatchewan is the main canary seed
producing province, Manitoba is generally the second largest producer, followed by Alberta.
Canary seed is a cool season crop, well
adapted to the long warm days and cool nights characteristic of the growing season in Manitoba.
In 2011, Manitoba reported 84 canary seed farms compared to 71 in 2006. This
represents 7.4% of canary seed farms in Canada and approximately 5 to 6% of Canada's total canary seed production.
Manitoba Manitoba Canada Canada
Canary Seed 2011 2006 2011 2006Number of farms 84 71 1,132 1,424Acres 16,795 8,989 319,296 338,595Hectares 6,797 3,638 129,214 137,025
Source: Census of Agriculture 2011 Canary seed production was first recorded in Manitoba in 1963 when 1,500 acres
were harvested. The area seeded to canary seed then increased steadily until 1986, when 57,000 acres were harvested.
Since this time, the area seeded to canary seed has varied significantly with the
volatility of the price, reaching levels greater than 60,000 acres, but also declining to levels as low as 15,000 acres.
The 10-year average yield is 965 pounds per acre, with the largest ever yield
occurring in 1990 when over 1,330 pounds per acre were harvested. Canary seed does not fall under a grade standard. Visual appearance is important. It
is usually sold as 99 per cent pure seed, with no more than 4 per cent dehulled seeds.

152
PROCESSING CANARY SEED IN MANITOBA Canary seed is used almost exclusively as birdseed, in commercial bird feed mixes
for domestic and wild birds. Commercial bird feed is made by blending crops such as millet, safflower,
canaryseed, flax and canola. Bird feed is sold into two main markets, indoor and outdoor. No standards exist for mixes or packaging.
Once the canary seed is harvested, it is delivered to cleaning facilities where the
foreign material is removed and the seed is cleaned to 98 percent purity (five percent hulled).
At the present time, canary seed is not graded at the cleaning facilities because it is
not a crop that is regulated under the Canadian Grain Act and therefore it does not fall under a grade standard.
Locally, the seed is cleaned and bagged, or cleaned and mixed with other seed and
bagged for sale as birdseed. Traditionally, the two registered canary seed varieties produced in Canada are Keet
and Elias. Canada developed a new glabrous (hairless) kind of canary seed registered under the trademark CanarioTM.
CanarioTM has the high protein of regular canary seed and is less irritating to the
skin during handling. This makes it the perfect option for birdseed processors and packagers. It will also further enhance Canada's competitive edge in the canary seed market by increasing the volume of seed per shipping container and by eliminating the oiling and polishing steps in processing.
New CanarioTM varieties are subject to strict quality standards. Based on
commercial pedigreed seed standards, CanarioTM varieties must be 97% hairless in order to bear the CanarioTM trademark, which is the processor's guarantee of purity.
Western Canada supplies most of the bird feed ingredients required by both the
indoor and outdoor domestic packaging industry. Packagers distribute bird feed mixes locally through retail and grocery chains and pet stores. Some processors package, label and customize products exclusively for pet, grocery and hardware store chains. Large processors distribute to large and small retail stores and major users such as zoos and wild animal farms.
Canary seed is high in protein and unsaturated edible oil content. Its high starch
content makes it suitable for some industrial uses, such as the cosmetics sector. Research is underway to uncover potential new markets for canaryseed. Possible
human consumption uses are sesame seed replacement, specialty starch, and vermicelli noodles. Other research is being conducted into the potential use of canary seed husks through the extraction of organic silica, a significant health market product.
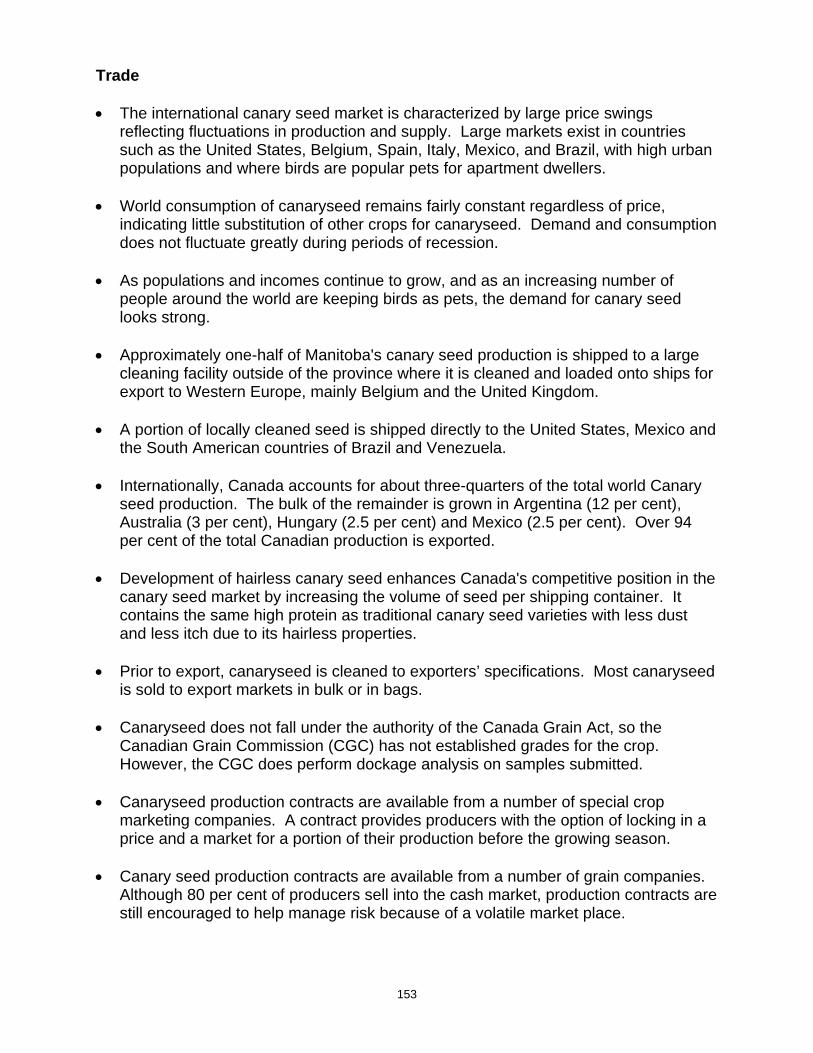
153
Trade The international canary seed market is characterized by large price swings
reflecting fluctuations in production and supply. Large markets exist in countries such as the United States, Belgium, Spain, Italy, Mexico, and Brazil, with high urban populations and where birds are popular pets for apartment dwellers.
World consumption of canaryseed remains fairly constant regardless of price,
indicating little substitution of other crops for canaryseed. Demand and consumption does not fluctuate greatly during periods of recession.
As populations and incomes continue to grow, and as an increasing number of
people around the world are keeping birds as pets, the demand for canary seed looks strong.
Approximately one-half of Manitoba's canary seed production is shipped to a large
cleaning facility outside of the province where it is cleaned and loaded onto ships for export to Western Europe, mainly Belgium and the United Kingdom.
A portion of locally cleaned seed is shipped directly to the United States, Mexico and
the South American countries of Brazil and Venezuela. Internationally, Canada accounts for about three-quarters of the total world Canary
seed production. The bulk of the remainder is grown in Argentina (12 per cent), Australia (3 per cent), Hungary (2.5 per cent) and Mexico (2.5 per cent). Over 94 per cent of the total Canadian production is exported.
Development of hairless canary seed enhances Canada's competitive position in the
canary seed market by increasing the volume of seed per shipping container. It contains the same high protein as traditional canary seed varieties with less dust and less itch due to its hairless properties.
Prior to export, canaryseed is cleaned to exporters’ specifications. Most canaryseed
is sold to export markets in bulk or in bags. Canaryseed does not fall under the authority of the Canada Grain Act, so the
Canadian Grain Commission (CGC) has not established grades for the crop. However, the CGC does perform dockage analysis on samples submitted.
Canaryseed production contracts are available from a number of special crop
marketing companies. A contract provides producers with the option of locking in a price and a market for a portion of their production before the growing season.
Canary seed production contracts are available from a number of grain companies.
Although 80 per cent of producers sell into the cash market, production contracts are still encouraged to help manage risk because of a volatile market place.

154
Canary Seed Outlook for Canada 2012-2013 For 2012-13, the area seeded is forecast to rise despite lower returns relative to
other crops and lower carry-in stocks. Production is expected to rise 18% due to increased area and trend yields. Due to extremely tight carry-in stocks, supply is forecast to fall by 13% and remain
historically tight. Exports are expected to be limited due to the lower supply. The EU-27 and Mexico are forecast to remain the main markets for Canadian canary
seed, with smaller volumes going to the US. Carry-out stocks are expected to continue to remain historically low. The average price is forecast to fall marginally, but remain near the historical high
set in 2011-12.
Outlook for Canary Seed 2010-2011 2011-2012p 2012-2013f
Area Seeded (kha) 158 95 111
Area Harvested (kha) 152 93 108
Yield (t/ha) 1.01 1.10 1.11
Production (kt) 154 102 120
Imports (kt) 0 0 0
Total Supply (kt) 235 143 125
Exports (kt) 179 125 105
Total Domestic Use (kt) 15 13 10
Carry-out Stocks (kt) 41 5 10
Stocks-to-use Ratio (%) 21 4 9
Average Price ($/t) 560 565-595 560-590
Source: Statistics Canada and Agriculture and Agri-Food Canada, June 2012

155
0
20
40
60
80
100
120
2000 2001 2002 2003 2004 2005 2006 2007 2008 2009 2010 2011
TH
OU
SA
ND
AC
RE
S
YEAR
Canary Seed - Seeded Acres in Manitoba2000 - 2011
Industry Intelligence Section, MAFRISource: Statistics Canada
0
20
40
60
80
100
120
2000 2001 2002 2003 2004 2005 2006 2007 2008 2009 2010 2011
TH
OU
SA
ND
AC
RE
S
YEAR
Canary Seed - Harvested Acres in Manitoba2000 - 2011
Industry Intelligence Section, MAFRISource: Statistics Canada
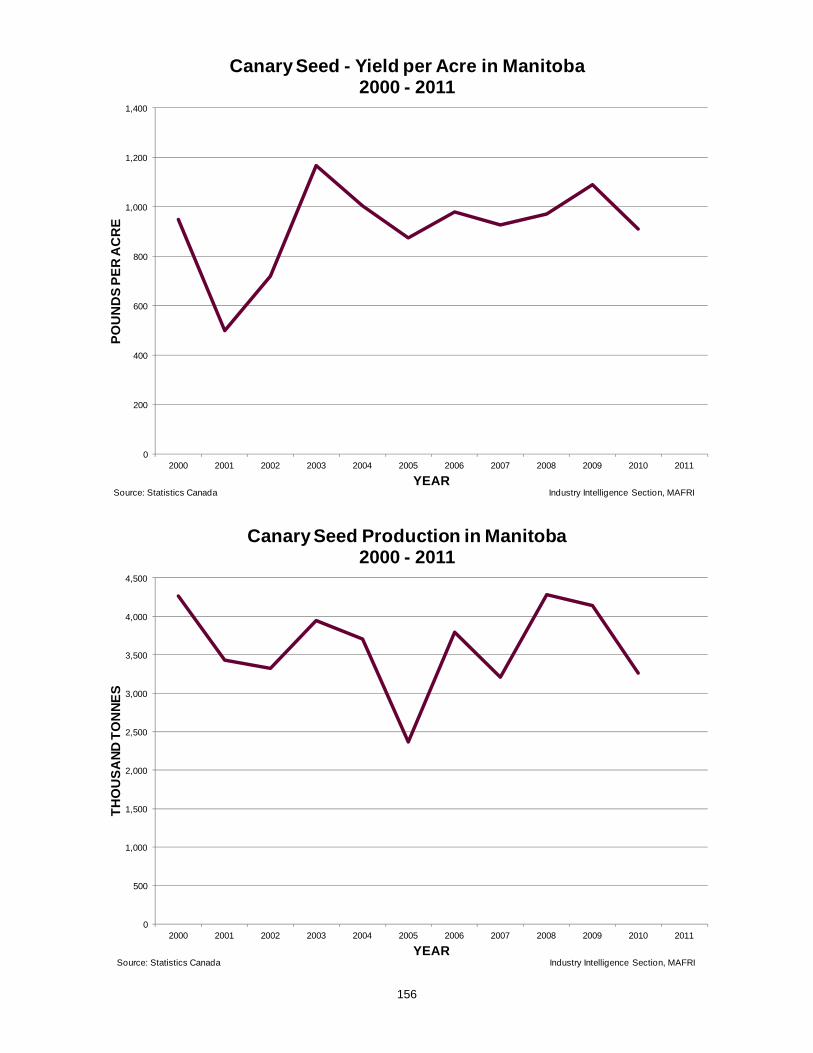
156
0
200
400
600
800
1,000
1,200
1,400
2000 2001 2002 2003 2004 2005 2006 2007 2008 2009 2010 2011
PO
UN
DS
PE
R A
CR
E
YEAR
Canary Seed - Yield per Acre in Manitoba2000 - 2011
Industry Intelligence Section, MAFRISource: Statistics Canada
0
500
1,000
1,500
2,000
2,500
3,000
3,500
4,000
4,500
2000 2001 2002 2003 2004 2005 2006 2007 2008 2009 2010 2011
TH
OU
SA
ND
TO
NN
ES
YEAR
Canary Seed Production in Manitoba2000 - 2011
Industry Intelligence Section, MAFRISource: Statistics Canada

157
0
100
200
300
400
500
600
700
800
2000 2001 2002 2003 2004 2005 2006 2007 2008 2009 2010 2011
DO
LL
AR
S P
ER
TO
NN
E
YEAR
Canary Seed Prices in Manitoba2000 - 2011
Industry Intelligence Section, Source: Statistics Canada
0
5
10
15
20
25
2000 2001 2002 2003 2004 2005 2006 2007 2008 2009 2010 2011
MIL
LIO
NS
OF
DO
LL
AR
S
YEAR
Value of Canary Seed Production in Manitoba2000 - 2011
Industry Intelligence Section, MAFRISource: STC, AAFC, MAFRI
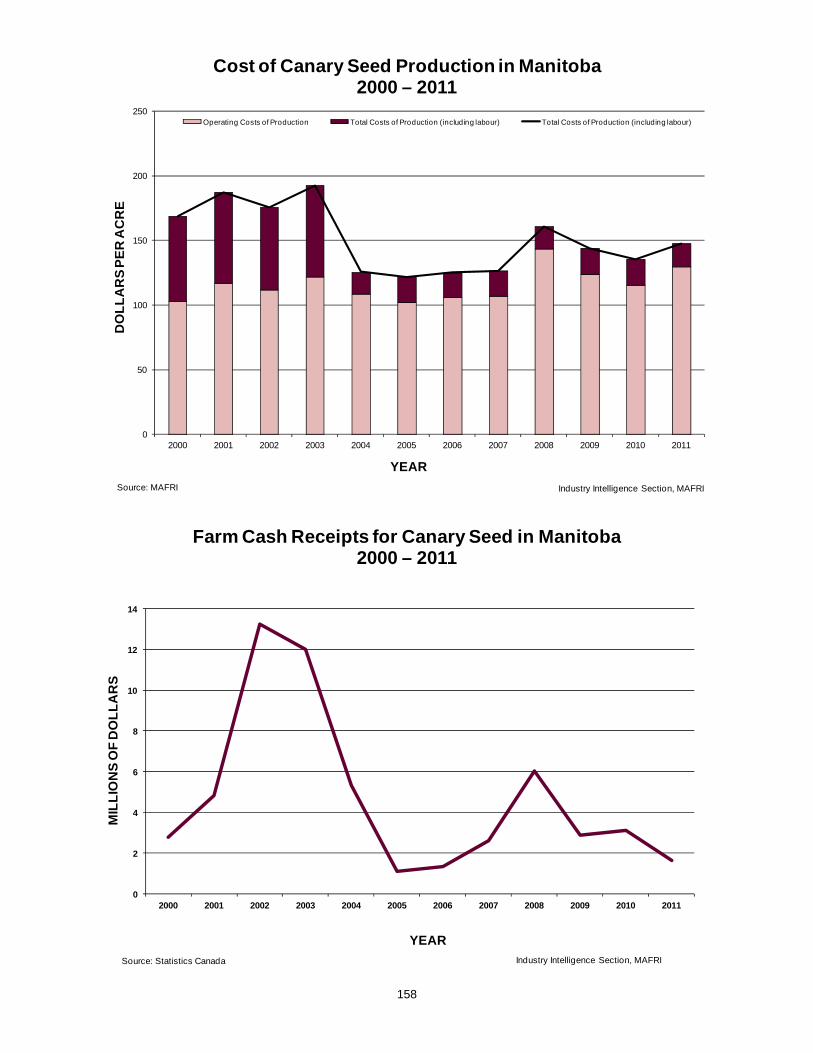
158
0
50
100
150
200
250
2000 2001 2002 2003 2004 2005 2006 2007 2008 2009 2010 2011
DO
LL
AR
S P
ER
AC
RE
YEAR
Cost of Canary Seed Production in Manitoba2000 – 2011
Operating Costs of Production Total Costs of Production (including labour) Total Costs of Production (including labour)
Industry Intelligence Section, MAFRISource: MAFRI
0
2
4
6
8
10
12
14
2000 2001 2002 2003 2004 2005 2006 2007 2008 2009 2010 2011
MIL
LIO
NS
OF
DO
LL
AR
S
YEAR
Farm Cash Receipts for Canary Seed in Manitoba2000 – 2011
Industry Intelligence Section, MAFRISource: Statistics Canada

159
0 5 10 15 20 25 30
2000-01
2001-02
2002-03
2003-04
2004-05
2005-06
2006-07
2007-08
2008-09
2009-10
2010-11
2011-12
THOUSAND TONNES
CR
OP
YE
AR
Marketings of Manitoba Canary Seed2000 - 2011
Industry Intelligence Section, MAFRISource: STC, AAFC, MAFRI
0
5
10
15
20
25
30
2000 2001 2002 2003 2004 2005 2006 2007 2008 2009 2010 2011
MIL
LIO
NS
OF
DO
LL
AR
S
YEAR
Manitoba Canary Seed Exports2000 – 2011
Industry Intelligence Section, MAFRISource: Statistics Canada

160
Farm Supply and Disposition of Manitoba Canary Seed Crop, 2000/01 to 2011/12
000 tonnes 2005-06 2006-07 2007-08 2008-09 2009-10 2010-11 2011-12
Opening Stocks Aug1 5 10 4 0 0 0 1
Production 8 4 6 11 7 10 0
Total Supply 13 14 10 11 7 10 1
Marketings 3 8 9 8 6 6 1
Seed 0 0 0 0 0 0 0
Carry-over 10 5 0 0 0 0 0
Feed/Waste/Dockage 0 1 1 3 1 4 0
Total Disposition 13 14 10 11 7 10 1
000 pounds 2005-06 2006-07 2007-08 2008-09 2009-10 2010-11 2011-12
Opening Stocks Aug1 11,023 22,046 8,818 0 0 0 2,205
Production 17,637 8,818 13,228 24,251 15,432 22,046 0
Total Supply 28,660 30,865 22,046 24,251 15,432 22,046 2,205
Marketings 6,614 17,637 19,842 17,637 13,228 13,228 2,205
Seed 0 0 0 0 0 0 0
Carry-over 22,046 11,023 0 0 0 0 0
Feed/Waste/Dockage 0 2,205 2,205 6,614 2,205 8,818 0
Total Disposition 28,660 30,865 22,046 24,251 15,432 22,046 2,205
CANARY SEED - Common Conversions 1 metric tonne canary seed = 44.092 bushels. There are 50 pounds in 1 bushel of canary seed (itchy varieties), while the glabrous
(itchless) varieties are typically 56 pounds per bushel.

161
Production and Value of Manitoba Canary Seed Year Seeded Area Harvested Area Average Yield Production Price/Tonne Total Value
(hectares) (hectares) (kg per ha) (tonnes) ($/tonne) ($000)1990 12,100 12,100 1,500 18,100 212 3,8371991 8,131 8,131 898 7,300 182 1,3291992 7,300 7,300 1,000 7,300 218 1,5911993 4,900 4,000 775 3,100 260 8061994 10,100 10,100 1,347 13,600 305 4,1481995 10,100 10,100 1,208 12,200 433 5,2831996 28,300 26,300 1,281 33,700 330 11,1211997 8,100 8,100 1,136 9,200 325 2,9901998 20,200 18,200 1,368 24,900 257 6,3991999 6,100 6,100 1,250 7,600 244 1,8542000 16,200 16,200 1,060 17,200 251 4,3112001 22,300 20,200 560 11,300 416 4,7022002 40,500 40,500 810 32,700 706 23,0972003 24,300 24,300 1,310 31,800 477 15,1822004 12,100 10,100 1,130 11,400 323 3,6802005 8,100 8,100 980 7,900 236 1,8652006 3,600 3,600 1,110 4,000 237 9472007 6,100 6,100 1,030 6,300 389 2,4522008 10,100 10,100 1,090 11,000 578 6,3582009 6,100 6,100 1,210 7,400 432 3,1972010 12,100 8,500 1,020 10,300 435 4,4762011 5,700 3,800 970 3,686 589 2,169
Year Seeded Area Harvested Area Average Yield Production Price/Bushel Total Value(acres) (acres) (lb per acre) (000 pounds) ($/pound) ($000)
1990 30,000 30,000 1,333.0 40,000 0.10 3,8371991 20,091 20,091 796.0 16,000 0.08 1,3291992 18,000 18,000 889.0 16,000 0.10 1,5911993 12,000 10,000 680.0 6,800 0.12 8061994 25,000 25,000 1,200.0 30,000 0.14 4,1481995 25,000 25,000 1,080.0 27,000 0.20 5,2831996 70,000 65,000 1,142.0 74,200 0.15 11,1211997 20,000 20,000 1,010.0 20,200 0.15 2,9901998 50,000 45,000 1,218.0 54,800 0.12 6,3991999 15,000 15,000 1,113.0 16,700 0.11 1,8542000 40,000 40,000 950.0 38,000 0.11 4,3112001 55,000 50,000 500.0 25,000 0.19 4,7022002 100,000 100,000 720.0 72,000 0.32 23,0972003 60,000 60,000 1,167.0 70,000 0.22 15,1822004 30,000 25,000 1,004.0 25,100 0.15 3,6802005 20,000 20,000 874.0 17,475 0.11 1,8652006 8,989 8,989 979.0 8,800 0.11 9472007 15,000 15,000 927.0 13,900 0.18 2,4522008 25,000 25,000 972.0 24,300 0.26 6,3582009 15,073 15,073 972.0 16,350 0.20 3,1972010 29,900 21,004 1,084.7 19,120 0.23 4,4762011 14,085 9,390 910.3 8,126 0.40 3,254SOURCE: Statistics Canada; Agriculture and Agri-Food Canada; Manitoba Agriculture, Food and Rural Initiatives.

162
PIG SECTOR
Total Pigs by Census Consolidated Subdivisions
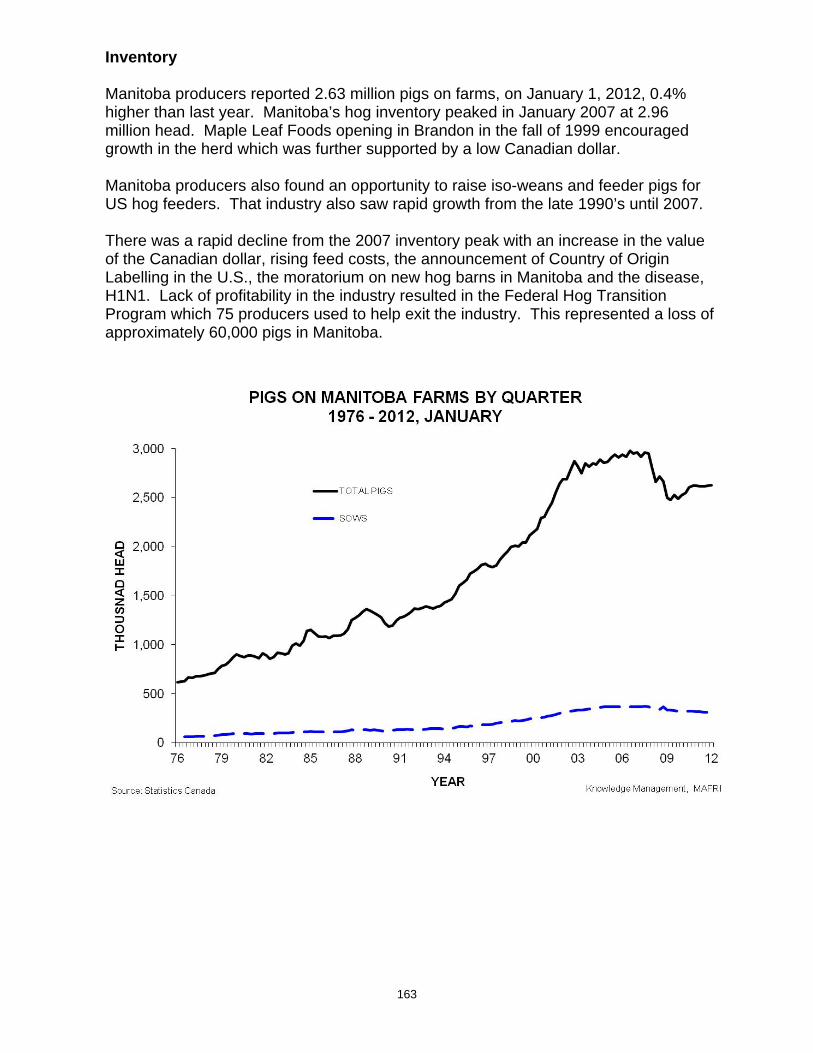
163
Inventory Manitoba producers reported 2.63 million pigs on farms, on January 1, 2012, 0.4% higher than last year. Manitoba’s hog inventory peaked in January 2007 at 2.96 million head. Maple Leaf Foods opening in Brandon in the fall of 1999 encouraged growth in the herd which was further supported by a low Canadian dollar. Manitoba producers also found an opportunity to raise iso-weans and feeder pigs for US hog feeders. That industry also saw rapid growth from the late 1990’s until 2007. There was a rapid decline from the 2007 inventory peak with an increase in the value of the Canadian dollar, rising feed costs, the announcement of Country of Origin Labelling in the U.S., the moratorium on new hog barns in Manitoba and the disease, H1N1. Lack of profitability in the industry resulted in the Federal Hog Transition Program which 75 producers used to help exit the industry. This represented a loss of approximately 60,000 pigs in Manitoba.

164
Manitoba 2.63 million pigs represent 22% of the total pigs in Canada, as of January 1, 2012. Quebec has 33% of the herd with 3.92 million followed by Ontario with 2.85 million pigs, representing 24% of the Canadian herd.

165
Manitoba markets the largest number of hogs and pigs in Canada with 29% of the national total and approximately 8 million pigs, in 2011. Quebec and Ontario had 28% and 22% respectively of the Canadian total.

166
Manitoba’s hog and pig sector earned and estimated $921 million in farm cash receipts in 2011. This represented 24% of the Canadian total. Manitoba ranked second behind Quebec which earned $1,309 million representing 34% of the Canadian total. The hog sector generated the second highest level of receipts in Manitoba, behind canola at $1019.5 million in 2011.
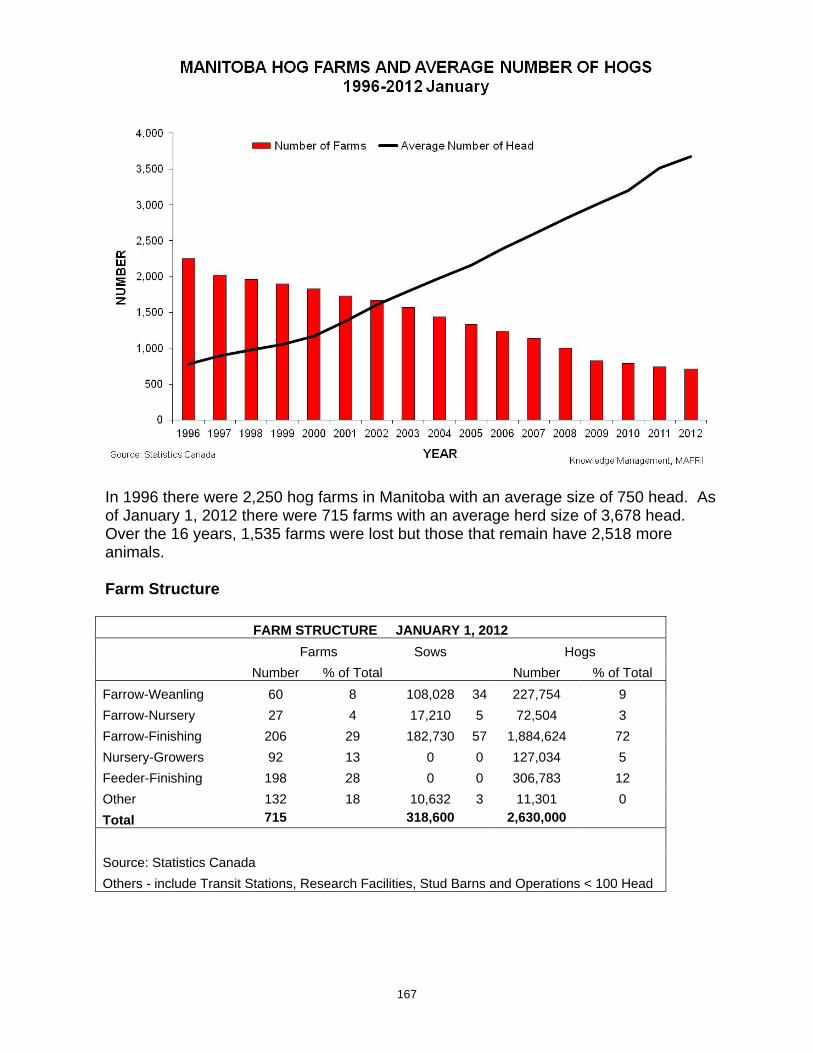
167
In 1996 there were 2,250 hog farms in Manitoba with an average size of 750 head. As of January 1, 2012 there were 715 farms with an average herd size of 3,678 head. Over the 16 years, 1,535 farms were lost but those that remain have 2,518 more animals. Farm Structure
FARM STRUCTURE JANUARY 1, 2012
Farms Sows Hogs
Number % of Total Number % of Total
Farrow-Weanling 60 8 108,028 34 227,754 9
Farrow-Nursery 27 4 17,210 5 72,504 3
Farrow-Finishing 206 29 182,730 57 1,884,624 72
Nursery-Growers 92 13 0 0 127,034 5
Feeder-Finishing 198 28 0 0 306,783 12
Other 132 18 10,632 3 11,301 0
Total 715 318,600 2,630,000
Source: Statistics Canada Others - include Transit Stations, Research Facilities, Stud Barns and Operations < 100 Head

168
Most of the pigs in Manitoba are raised on Farrow-to-Finish operations which represent 72% of the total inventory and 57% of the sows. Feeding-to- Finish operations represent 12% and Farrow-to-Weanling have 9% of the total inventory on January 1, 2012. History
In the mid-1990s, the North American Free Trade Agreement (NAFTA) set the framework for an integrated North American hog industry as the Crow Rate grain transportation subsidy was phasing out. This was a period of relatively low grain prices and favourable exchange rates. Industry and producers responded by increasing investment in hog barns. Larger, efficient profitable farms increased in number and smaller less efficient producers left the industry. The export of iso-wean and feeder pigs grew very rapidly during the mid-1990’s until 2007 to meet the growing demand in the U.S. At that time the U.S. was increasing pork exports and limiting the growth of sow barns in some areas.
There were periods of significant losses during this time such as in 1998 and 1999 when hog slaughter processing did not have the capacity to handle production.
The opening of a state of the art hog processing facility, Maple Leaf, Brandon in 1999 facilitated further growth in Manitoba. At this time producers had the option of marketing directly with the processing plants. Maple Leaf was active producing for both domestic and pork export markets.
Manitoba’s hog inventory peaked in 2007 and contracted until late 2009. Major increases in feed and operating costs resulted in unprofitable production. The Canadian dollar appreciated dramatically and Canadian producers and processors became uncompetitive with the U.S. Exporters realized that Country of Origin labelling would add expenses to Canadian products that would be passed back to Canadian producers. New environmental rules which increased costs and a moratorium on expansion in traditional hog raising areas also contributed to industry contraction. In 2008 the global economic hit and global markets contracted for North American exporters resulting in further losses for producers and processors. The outbreak of H1N1 in 2009 further pressured the industry as market access to North American pork was limited.
Currently the retraction of the North American industry, lower operating costs, particularly for feed and increased export markets have made prices profitable. Canadian herd reduction programs were positive contributors to reducing the large inventory.

169
Production and Marketing
There were approximately 5.36 million hogs slaughtered in Manitoba in 2011, which included hogs from Saskatchewan and Alberta. There were 4.28 million hogs of Manitoba origin slaughtered in Canada, mainly in Manitoba.
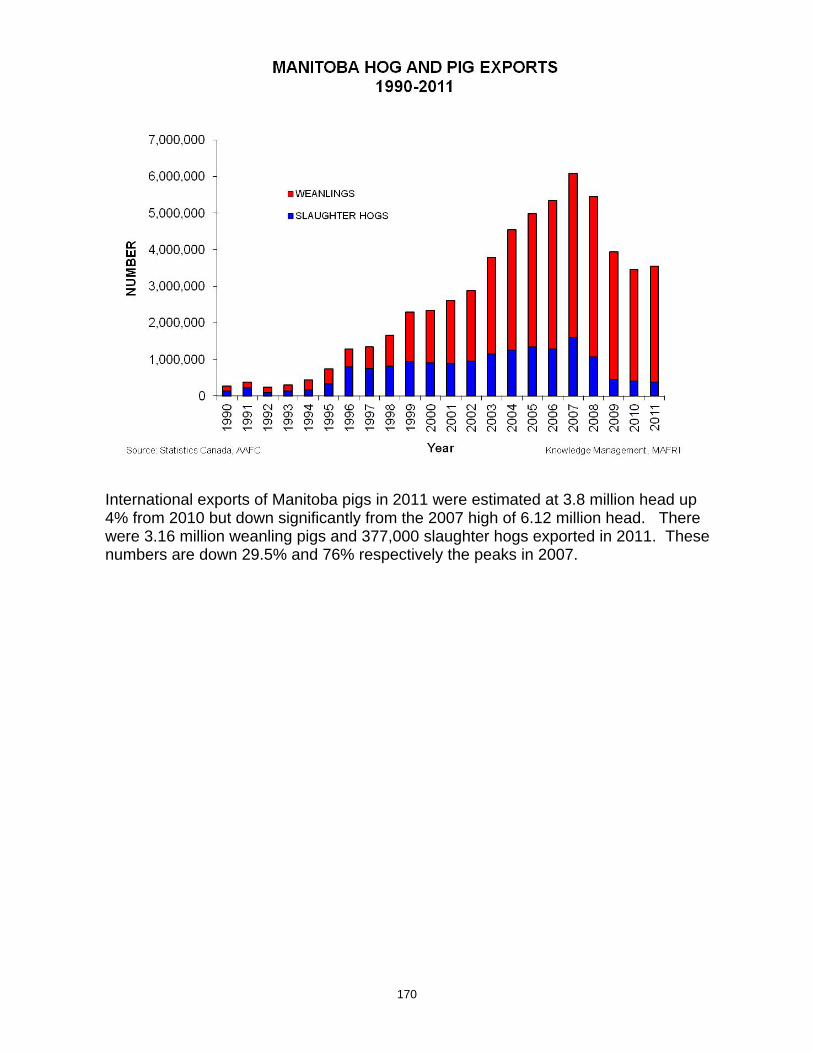
170
International exports of Manitoba pigs in 2011 were estimated at 3.8 million head up 4% from 2010 but down significantly from the 2007 high of 6.12 million head. There were 3.16 million weanling pigs and 377,000 slaughter hogs exported in 2011. These numbers are down 29.5% and 76% respectively the peaks in 2007.

171
Production of hogs and pigs increased 1.2% in 2011 to 7.9 million head compared to 2010. Value of production increased by 12% to $922 million in 2011 due to stronger prices.
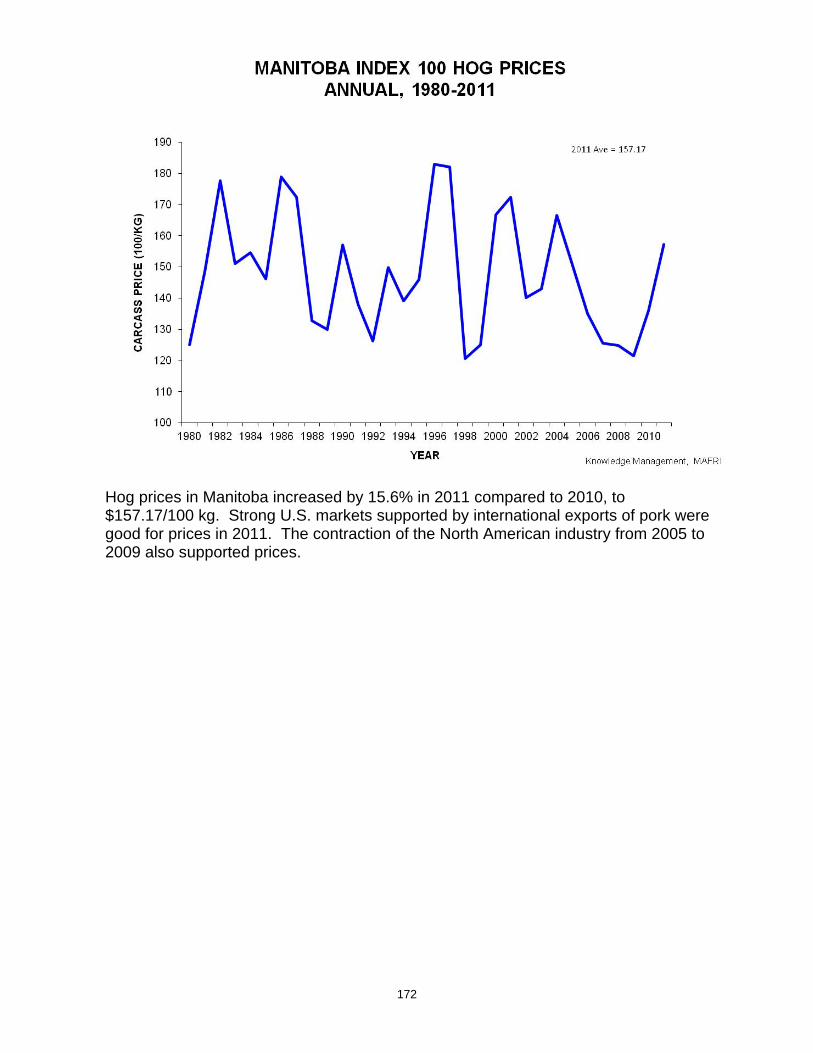
172
Hog prices in Manitoba increased by 15.6% in 2011 compared to 2010, to $157.17/100 kg. Strong U.S. markets supported by international exports of pork were good for prices in 2011. The contraction of the North American industry from 2005 to 2009 also supported prices.
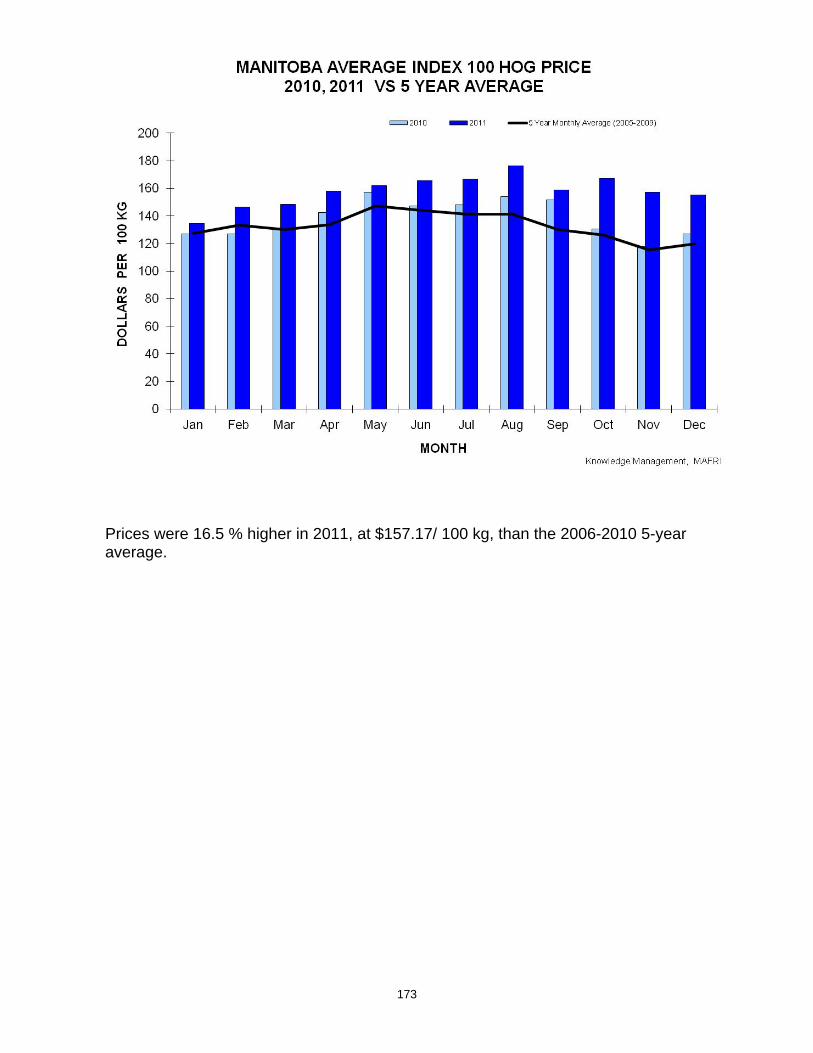
173
Prices were 16.5 % higher in 2011, at $157.17/ 100 kg, than the 2006-2010 5-year average.

174
The hog industry requires large capitalization and investment. Production does not immediately respond to fluctuations in prices.

175
Manitoba prices for iso-weanling pigs, which weigh approximately 5 to 7 kg, were very volatile in 2011 ranging from $66.09/ pig in January to $7.56/pig in July. The annual average was $34.21/pig, which was 22% below the 2010 average.

176
Prices for feeder pigs, weighing approximately 23 kg, were also very volatile in 2011 ranging from $18.83/pig in September to $92.02/pig in March. The average price was $53.96/pig which was 12% lower than in 2010.
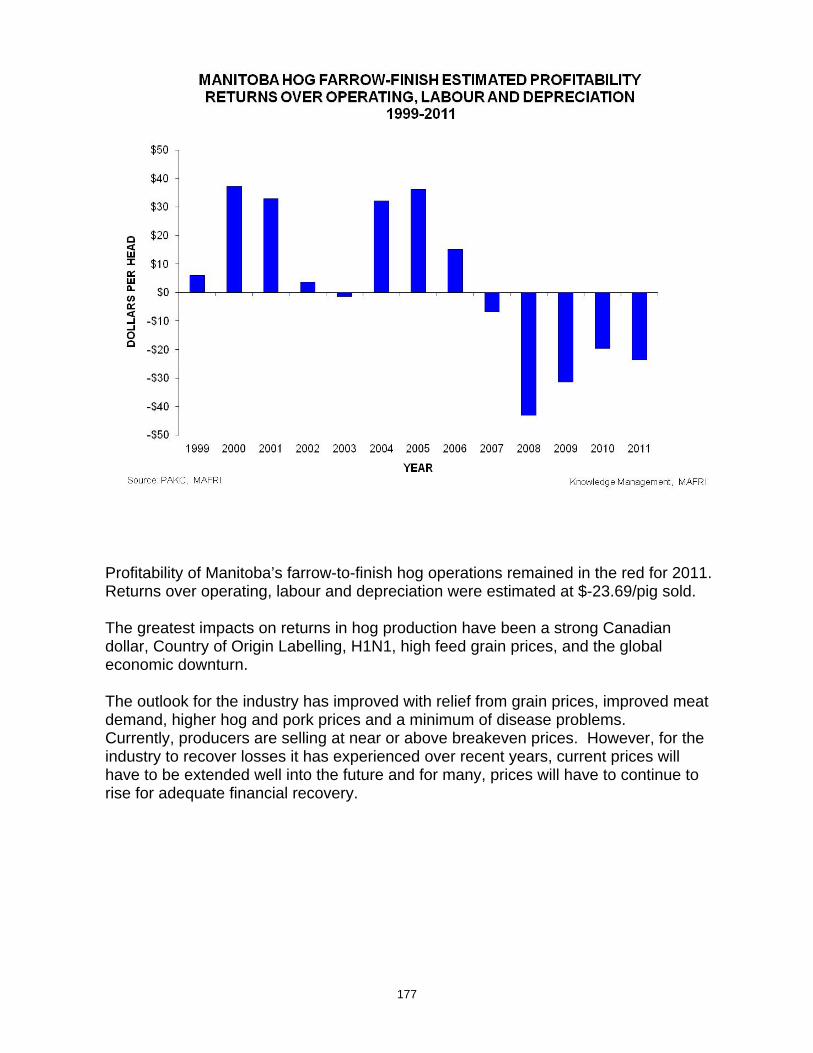
177
Profitability of Manitoba’s farrow-to-finish hog operations remained in the red for 2011. Returns over operating, labour and depreciation were estimated at $-23.69/pig sold. The greatest impacts on returns in hog production have been a strong Canadian dollar, Country of Origin Labelling, H1N1, high feed grain prices, and the global economic downturn. The outlook for the industry has improved with relief from grain prices, improved meat demand, higher hog and pork prices and a minimum of disease problems. Currently, producers are selling at near or above breakeven prices. However, for the industry to recover losses it has experienced over recent years, current prices will have to be extended well into the future and for many, prices will have to continue to rise for adequate financial recovery.
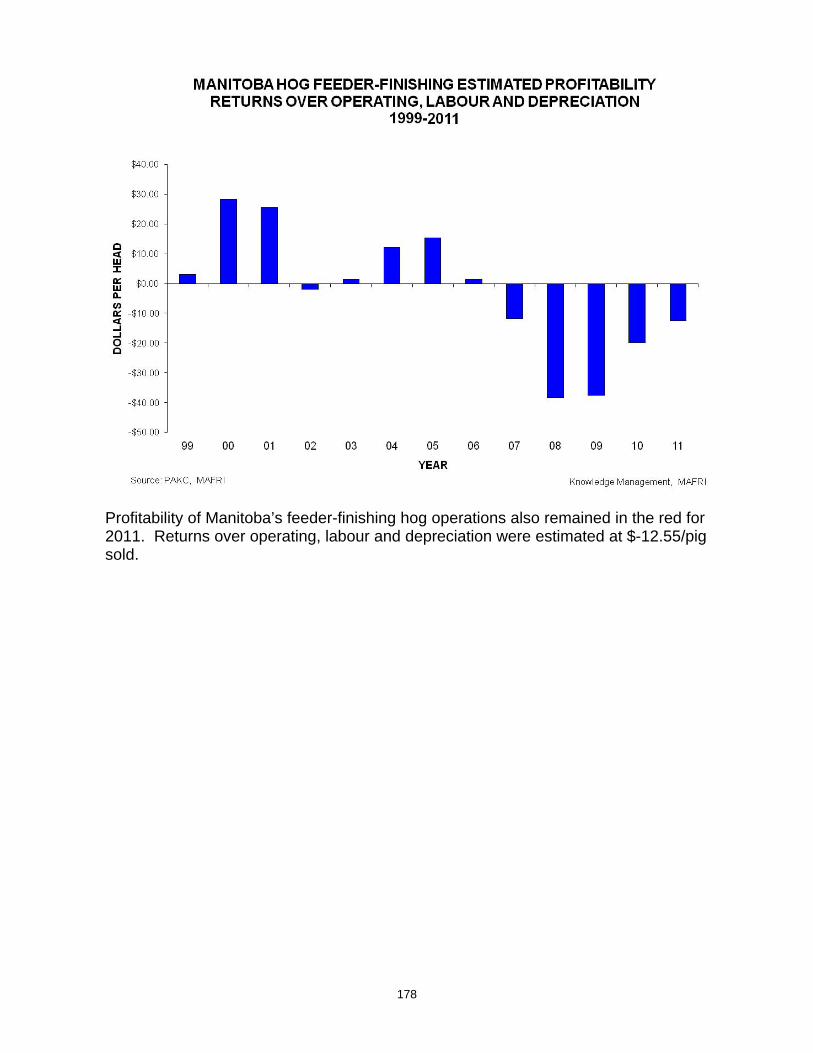
178
Profitability of Manitoba’s feeder-finishing hog operations also remained in the red for 2011. Returns over operating, labour and depreciation were estimated at $-12.55/pig sold.

179
CATTLE SECTOR
Total Cattle by Census Consolidated Subdivisions

180
Inventory Manitoba producers reported 1.17 million beef and dairy cattle on farms on January 1 2012, 0.4% higher than last year. Beef cow numbers were down 1% to 498,300 head while dairy cow numbers were the same at 44,500 head.
Beef cow numbers in Manitoba increased fairly steadily at an average annual rate of about two percent from 1987 until 1992. Cow numbers then rose by an annual average rate of almost six percent to 1997. There were slight declines in 1998 and 1999. Bovine Spongiform Encephalopathy (BSE) was found in a Canadian cow, in May of 2003 resulting in the closure of the U.S. and other markets for Canadian cattle and beef. This resulted in a large build up of cattle on farms, particularly older cows until the border opened to cattle under 30 months of age in 2005. The beef cow herd grew to a record high of 680,000 cows in July of 2006.

181
During the nineties and into 2002 Manitoba’s herd grew despite the contraction of the U.S. herd, supported by factors such as the low Canadian dollar and demand for cattle from the U.S. The North American Free Trade Agreement (NAFTA) supported the integrated North American beef industry just at the time that Canadians abolished their Crow Rate grain transportation subsidy for grain that reduced the transportation cost of getting Western Canadian grain to markets. This was also recognized being supportive of raising livestock on the Prairies. In September 2008 Country of Origin (COOL) labeling came into effect reducing the demand and price of Canadian feeder and slaughter cattle. A stronger Canadian dollar has also contributed to the declining exports in the past few years. Brief History of Alberta Plants:Cargill opened a new plant in High River, AB in 1989. Iowa Beef Processors (IBP) bought the Lakeside Feeders plant in Brooks, AB in 1994 and expanded it. It has been reported that these two plants have 60% of the Canadian beef slaughter capacity and that Alberta has 85% of the slaughter capacity. IBP was bought by Tyson Foods in 2001 which in turn sold the Brooks, AB plant to XL Foods in 2009. Cargill bought the Better Beef plant in Guelph.

182
Manitoba has the third largest beef cow herd in Canada with 498,300 cows or approximately 12 % of the Canadian herd as of January 1, 2012. Alberta has the largest share at 39% and Saskatchewan has 31%.

183
The number of cattle farms in Manitoba declined by 4,165 farms, from 12,680 in 1996 to 8,515 on January 1, 2012. During the same period, the average number of animals per farm increased from 91 head to 148. Farm Type January 1, 2012
Beef Cows
% of Total Cows Total Inventory
% of Total
Inventory Farm's
Reporting
% of Total
Farms Specialized Dairy 0 55,300 4.75 290 3.41 Mixed Dairy and Beef 4,500 0.90 39,700 3.41 135 1.59 Cow-Calf 466,200 93.56 866,400 74.37 6,940 81.50 Cow-Calf - Feeder / Backgrounder 17,900 3.59 70,100 6.02 855 10.04 Cow-Calf - Stocker / Finisher 9,700 1.95 48,500 4.16 155 1.82 Feed Operations 0 85,000 7.30 140 1.64 Total Reported 498,300 100 1,165,000 100.00 8,515 100
Source: Statistics Canada

184
Cow-calf: Manitoba has the land base with large areas of natural grasslands to support cow-calf production. The cow-calf sector remains the most popular type of cattle enterprise in Manitoba with 6,940 farms which represents 81.5% of the industry and 74.4 % of the cattle, as of July 1 2012. Traditionally, most of Manitoba’s cow-calf producers raise calves until they are weaned in the fall. The calves are often sold directly off grass at weaning and marketed through various livestock auction markets throughout rural Manitoba. Most calves weigh between 350-650 lbs when weaned and are then sold to feeder operations in Manitoba, Alberta, Saskatchewan, Ontario and some to the U.S. Cows are generally calved from February to April with a more recent trend to later calving. The major production costs in a cow-calf enterprise are pasture, feed for the cows, veterinary expenses, breeding costs, utilities and insurance. Feeder/Backgrounding: Instead of selling their calves in the fall, many cow-calf producers retain ownership of their calves and place them on a high forage diet after weaning. On July 1 2012 there were 855 operations of this type in Manitoba which represented 10% of total operations and 6% of the cattle. Depending on the size and age of the calves, they are grown over the winter and either sold directly to a feedlot for finishing or put on pasture the next summer and then sold to the feedlot. Finishing enterprise: There were 140 finishing/feedlot enterprises in the province representing 1.6% of the industry and 7.3% of the cattle, compared to 1980 when Manitoba had an estimated feedlot capacity of 100,000 head. Feedlot enterprises require more intense management and are higher risk in nature. This is due to the fluctuating market prices of feed and cattle (bought and sold) and the higher investment costs for facilities and equipment. BSE Canada's first case of BSE in a domestic animal was found in May 2003. The export of beef, cattle and other ruminants was prohibited. Canadian auction markets reacted immediately by halting sales as prices crashed. There were not enough sales in June, July and August 2003 to set official prices in Manitoba. The loss of export markets increased the supply available for the domestic market and depressed the domestic price for fed cattle, feeder cattle calves and cull cows. Cull animals were almost unmarketable as all major Canadian slaughter plants were overwhelmed with deliveries of more profitable high grade, younger animals for slaughter. Producers held on to livestock rather than sell at depressed prices. As animals accumulated in the supply chain, feeding losses increased.
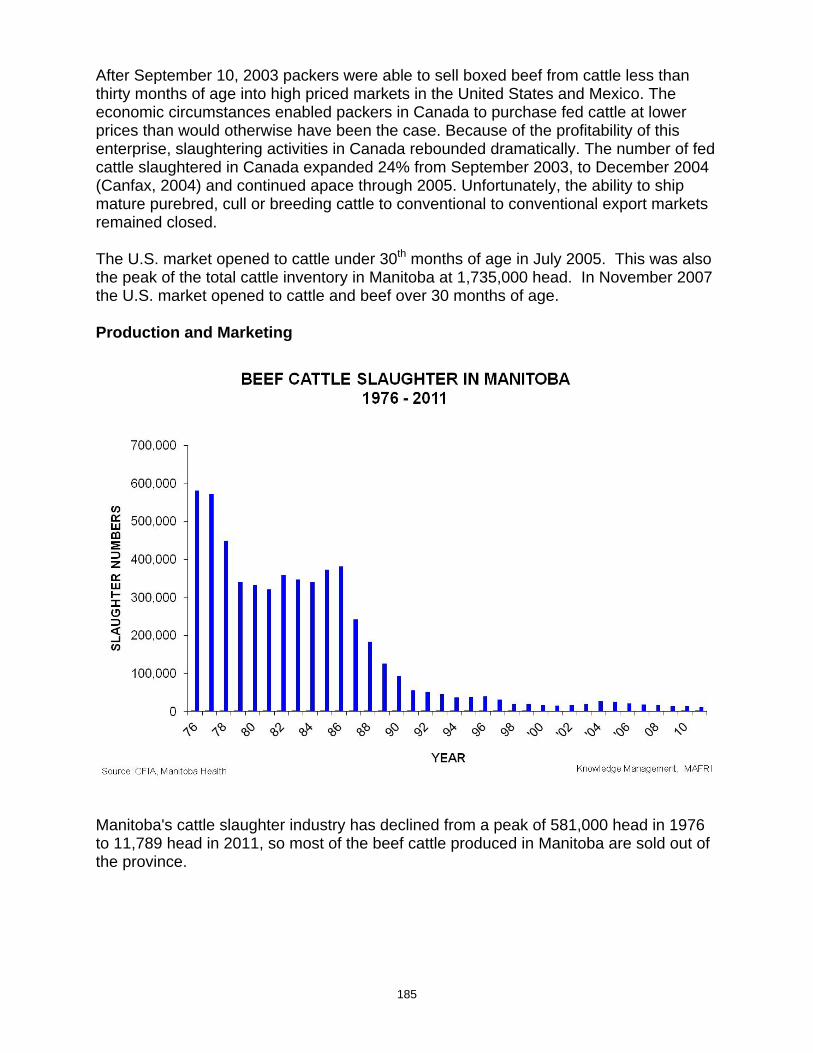
185
After September 10, 2003 packers were able to sell boxed beef from cattle less than thirty months of age into high priced markets in the United States and Mexico. The economic circumstances enabled packers in Canada to purchase fed cattle at lower prices than would otherwise have been the case. Because of the profitability of this enterprise, slaughtering activities in Canada rebounded dramatically. The number of fed cattle slaughtered in Canada expanded 24% from September 2003, to December 2004 (Canfax, 2004) and continued apace through 2005. Unfortunately, the ability to ship mature purebred, cull or breeding cattle to conventional to conventional export markets remained closed. The U.S. market opened to cattle under 30th months of age in July 2005. This was also the peak of the total cattle inventory in Manitoba at 1,735,000 head. In November 2007 the U.S. market opened to cattle and beef over 30 months of age. Production and Marketing
Manitoba's cattle slaughter industry has declined from a peak of 581,000 head in 1976 to 11,789 head in 2011, so most of the beef cattle produced in Manitoba are sold out of the province.

186
Older packing plants in Manitoba decided not to upgrade and compete with the new multi-national packing packing plants in Alberta. Swift's Winnipeg slaughter plant closed in 1979. Canada Packers closed its Winnipeg slaughter plant in early 1987, which reduced Manitoba's cattle slaughter capacity at that time by about 40 percent. Further reduction in cattle and hog slaughter capacity occurred in March 1990 when East West Packers was forced to close. Burns Meats (purchased by Maple Leaf Meats) closed its Brandon cattle slaughter plant in November 1990 and shut down its Winnipeg cattle kill line in late 1997. Manitoba was left with two small federally-inspected plants, which slaughtered about 6,663 cattle in 2002. On January 1, 2003, one of the small federally-inspected plants, Plains Processing Ltd. in Carman, changed to provincial inspection, leaving Winkler Meats Ltd. as the only Federal plant to kill cattle in the province. However Winkler no longer kills cattle. A new packing plant, ProNatur could increase cattle slaughter in Manitoba. The plant is expected to kill 250 cattle per day by the end of 2013 and can be upgraded to 500 head per day if required.
In 2011, Manitoba marketed 20% of cattle and calves in the U.S.; 48% went to Alberta, 9% to Ontario, 8% to Saskatchewan, 12% to Quebec. Only 3% of Manitoba origin cattle were slaughtered in Canada.

187
From 1991 to 2002 (pre-BSE) the largest market for Manitoba cattle was the U.S. During 2003-2006, when there were major restrictions due to BSE, more cattle were shipped to Western and Eastern Canada. When the U.S. border opened to cull cattle producers took advantage of good prices and sent a record 351,300 to the U.S. and other countries in 2008. Marketings to the U.S. declined in 2011 due to trade restrictions of COOL.
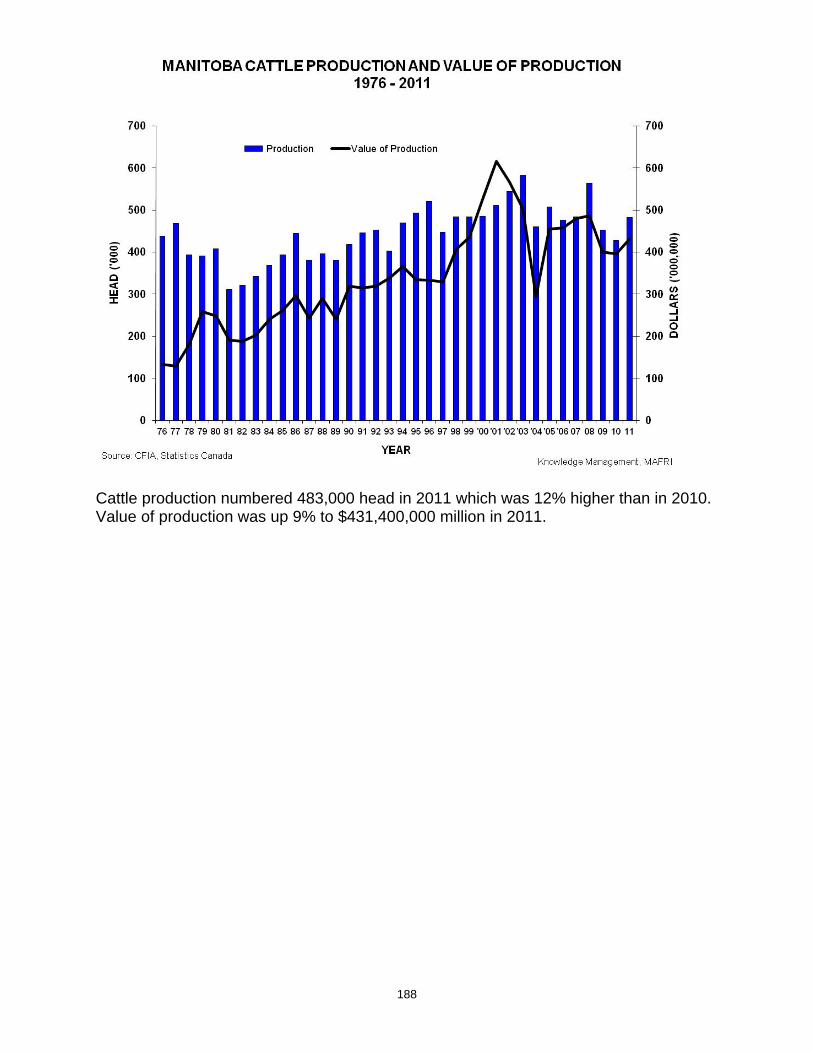
188
Cattle production numbered 483,000 head in 2011 which was 12% higher than in 2010. Value of production was up 9% to $431,400,000 million in 2011.

189
Calf prices increased in 2011 with steers 500-600 lb averaged $147.07/cwt, which was 23.6 % higher than in 2010.

190
Calf prices were approximately 28.8% higher in 2011 than the 5-year average of $114.19/cwt. However the highest price for Manitoba steers 500-600 lb was $161.17/cwt in March 2001.

191
Cow-calf producers realized considerable profits in 2011, earning $247.77/calf. These returns covered operating and labour costs. Returns over total costs were $81.74/calf.

192
The backgrounding sector continued to lose money in 2011, with returns over operating and labour of $$-86.29/calf. This was based on a calf cost of $789 /head and returns of $978.57/head.
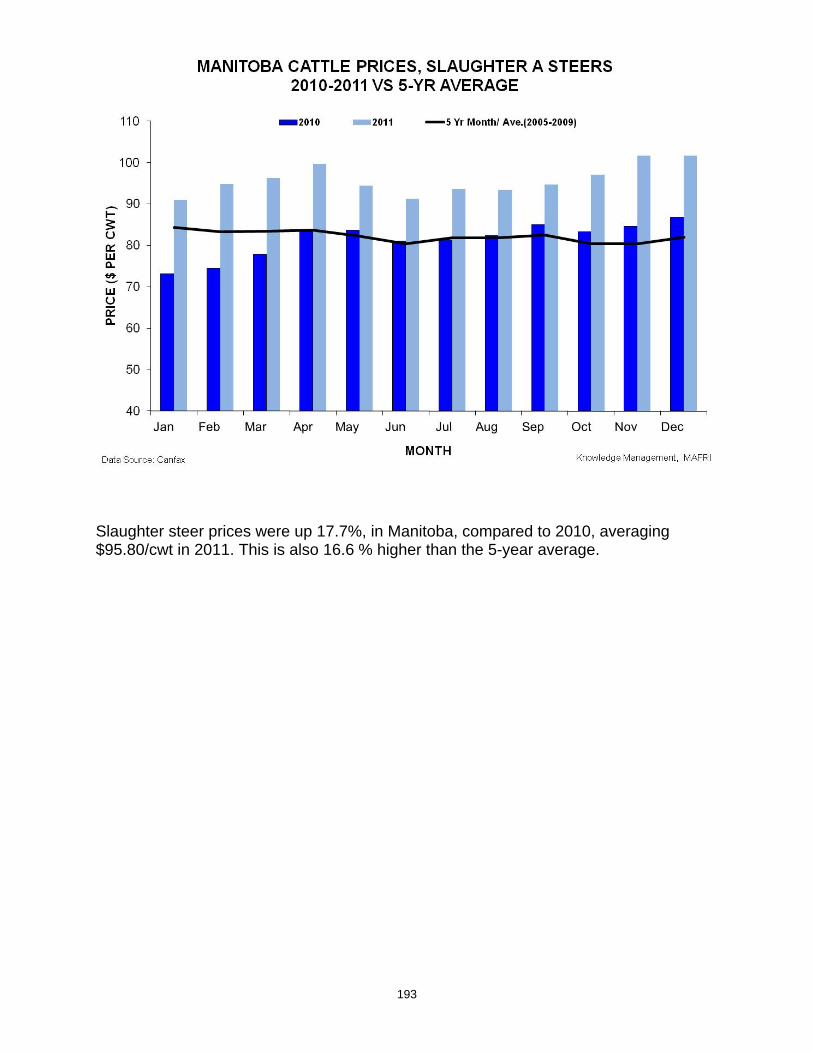
193
Slaughter steer prices were up 17.7%, in Manitoba, compared to 2010, averaging $95.80/cwt in 2011. This is also 16.6 % higher than the 5-year average.

194
The finishing sector continued to lose money in 2011, with returns over operating and labour of $$-64.39/calf. This was based on a feeder cost of $940.90 /head and returns of $1341.20/head.