Embed Size (px)
Citation preview

State of Alabama Ambient Air Monitoring
2012 Consolidated Network Review
2012 Ambient Air Plan.doc 6/1/2012
Page 2 of 58
Table of Contents
Table of Contents…………………………………………………………………………. Definitions and Acronyms Introduction..................................................................................................................................... 6 Public Review and Comment.......................................................................................................... 6 Overview of Alabama’s Air Monitoring Network.......................................................................... 6
Summary of findings of the network review .............................................................................. 7 Population and CBSA............................................................................................................... 11
Types of Monitoring Stations ....................................................................................................... 13 PAMS........................................................................................................................................ 13 SLAMS ..................................................................................................................................... 13 STN........................................................................................................................................... 13 Supplemental Speciation........................................................................................................... 13 NCore........................................................................................................................................ 13 CASNET................................................................................................................................... 13
Alabama’s SLAMS by Pollutant .................................................................................................. 14 Lead Network............................................................................................................................ 14 Carbon Monoxide (CO) Network ............................................................................................. 15 Nitrogen Dioxide (NO2) Network.............................................................................................16 Sulfur Dioxide (SO2) Network.................................................................................................. 17 PM 10 Network......................................................................................................................... 19 Ozone Network ......................................................................................................................... 21
Mobile ............................................................................................................................... 24 Montgomery...................................................................................................................... 24 Tuscaloosa......................................................................................................................... 24 Columbus, Ga.-Phenix City, AL....................................................................................... 24 Birmingham ...................................................................................................................... 24 Dothan............................................................................................................................... 24 Gadsden............................................................................................................................. 24 Huntsville.......................................................................................................................... 25 Decatur.............................................................................................................................. 25 Florence............................................................................................................................. 25 Auburn and Anniston-Oxford ........................................................................................... 25 Sites not located in an MSA.............................................................................................. 25
PM2.5 Network .............................................................................................................................. 26 PM2.5 Monitoring requirements for Alabama MSAs .......................................................... 29
Florence, Dothan, Gadsden and Tuscaloosa..................................................................... 29 Decatur.............................................................................................................................. 29 Huntsville.......................................................................................................................... 29 Birmingham ...................................................................................................................... 29 Mobile ............................................................................................................................... 29 Columbus, Ga.-Phenix City, AL....................................................................................... 29 Montgomery...................................................................................................................... 30 Auburn-Opelika and Anniston-Oxford............................................................................. 30 Monitors not located in MSAs.......................................................................................... 30
2012 Ambient Air Plan.doc 6/1/2012
Page 3 of 58
Quality Assurance......................................................................................................................... 31 Monitoring Equipment Evaluation ............................................................................................... 31 NETWORK DESCRIPTIONS ..................................................................................................... 32
ADEM....................................................................................................................................... 33 PM10..................................................................................................................................... 34 Lead....................................................................................................................................... 34 PM 2.5................................................................................................................................... 35 PM 2.5 continued.................................................................................................................. 36 OZONE................................................................................................................................. 37
JEFFERSON COUNTY DEPARTMENT OF HEALTH (JCDH)........................................... 38 ANNUAL AIR MONITORING NETWORK PLAN............................................................... 38
Proposed Changes to the Network........................................................................................ 38 PAMS (Photochemical Assessment Monitoring Stations)...................................................38 NCore Ambient Air Monitoring Stations ............................................................................. 38 School Air Toxics Program .................................................................................................. 39 SLAMS (State and Local Air Monitoring Stations) ............................................................. 39
Ozone ................................................................................................................................ 39 SO2 .................................................................................................................................... 40 CO..................................................................................................................................... 41 NO2 ................................................................................................................................... 41 Lead................................................................................................................................... 41 PM10.................................................................................................................................. 41 PM2.5 ................................................................................................................................. 42
Continuous PM2.5 SPM (Special Purpose Monitors) .......................................................... 42 Manual PM2.5 STN Speciation Monitors and Supplemental Speciation............................. 42 Network Review Findings .................................................................................................... 42 JCDH AIR MONITORING NETWORK DESCRIPTION.................................................. 43
Ozone ................................................................................................................................ 43 Carbon Monoxide ............................................................................................................. 43 Sulfur Dioxide................................................................................................................... 43 NOy ................................................................................................................................... 43 Manual PM10 Hi-Vol ....................................................................................................... 43 Manual PM10 Lo-Vol for PMCourse Determination....................................................... 44 Manual PM10 Improve Monitor....................................................................................... 44 Continuous PM10 ............................................................................................................. 44 Manual PM2.5.................................................................................................................... 44 Continuous PM2.5 ............................................................................................................ 45 Manual PM2.5 STN Speciation Monitors ........................................................................ 45 Manual PM2.5 Improve Speciation Monitor .................................................................... 45 RadNet Monitor ................................................................................................................ 45
HUNTSVILLE ANNUAL AIR MONITORING NETWORK PLAN..................................... 46 NCore Ambient Air Monitoring Stations ............................................................................. 46 PAMS (Photochemical Assessment Monitoring Stations)...................................................46 SLAMS (State and Local Air Monitoring Stations) ............................................................. 46 SPM (Special Purpose Monitors).......................................................................................... 48 Network Review Findings .................................................................................................... 48
2012 Ambient Air Plan.doc 6/1/2012
Page 4 of 58
AIR MONITORING NETWORK DESCRIPTION............................................................. 49 APPENDIX A............................................................................................................................... 50
Maps.......................................................................................................................................... 50 ADEM Monitoring Sites....................................................................................................... 51 Jefferson County ................................................................................................................... 52 City of Huntsville.................................................................................................................. 53
APPENDIX B ............................................................................................................................... 54 Support for ADEM SO2 Sites ................................................................................................... 54
Wind Rose for Mobile, AL ................................................................................................... 55 Wind Rose for Tuscaloosa, AL............................................................................................. 56 2009 Sources with Actuals SO2 ........................................................................................... 57 Sources with SO2 Potentials >100 tpy ................................................................................. 58
List of Tables Table 1 - 2012 Alabama Monitoring Network ............................................................................... 9 Table 2 - 2011Estimated MSA Population ................................................................................... 11 Table 3 - JCDH CO Monitoring sites ........................................................................................... 15 Table 4 - CBSA’s PWEI and number of monitors required ......................................................... 19 Table 5 - APPENDIX D TO PART 58. PM10 MINIMUM MONITORING REQUIREMENTS....................................................................................................................................................... 20 Table 6 - APPENDIX D TO PART 58. SLAMS MINIMUM O3 MONITORING REQUIREMENTS........................................................................................................................ 21 Table 7 - MSA population with Current Ozone Design Value..................................................... 21 Table 8 - Monitors with Ozone 2009-2011 Design Values .......................................................... 22 Table 9 - APPENDIX D TO PART 58, PM2.5 MINIMUM MONITORING REQUIREMENTS....................................................................................................................................................... 26 Table 10 - MSA population with Current PM2.5 Design Value .................................................... 26 Table 11 - PM2.5 Design Values per Monitor.............................................................................. 27 List of Figures Figure 1 – AL CBSAs and Counties............................................................................................. 12 Figure 2 – Ozone Monitoring Requirements ................................................................................ 23 Figure 3 – PM2.5 Monitoring Requirements................................................................................ 28
2012 Ambient Air Plan.doc 6/1/2012
Page 5 of 58
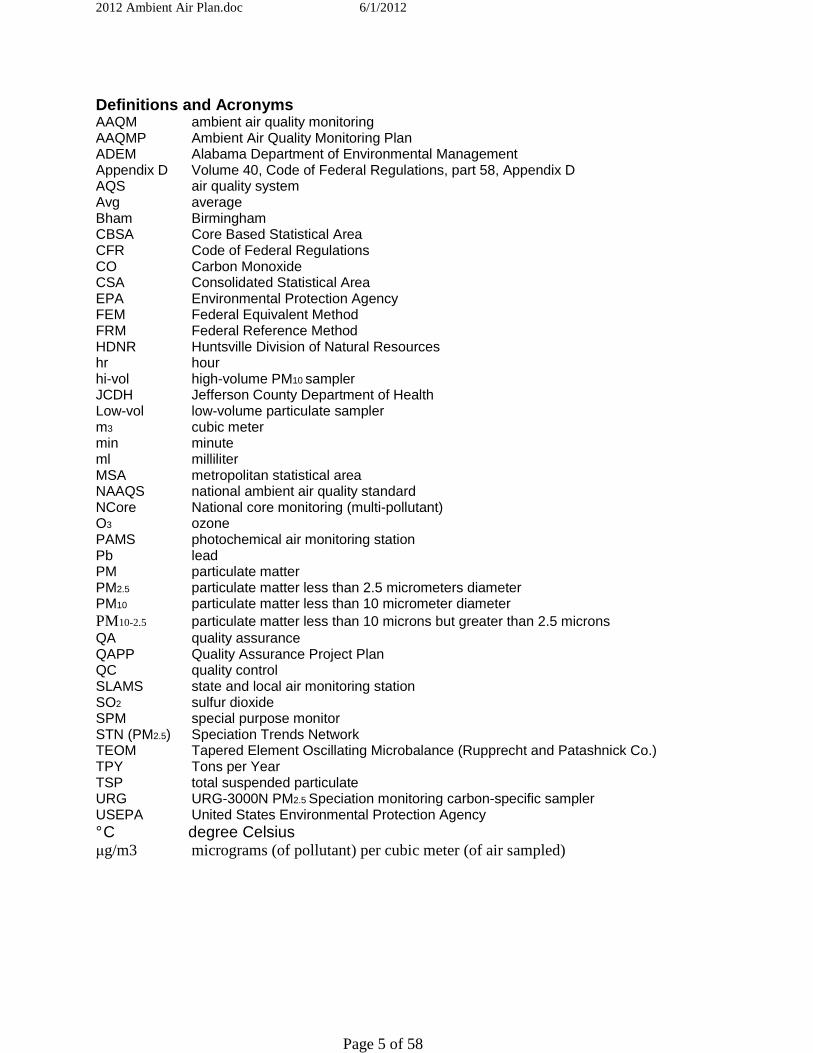
Definitions and Acronyms AAQM ambient air quality monitoring AAQMP Ambient Air Quality Monitoring Plan ADEM Alabama Department of Environmental Management Appendix D Volume 40, Code of Federal Regulations, part 58, Appendix D AQS air quality system Avg average Bham Birmingham CBSA Core Based Statistical Area CFR Code of Federal Regulations CO Carbon Monoxide CSA Consolidated Statistical Area EPA Environmental Protection Agency FEM Federal Equivalent Method FRM Federal Reference Method HDNR Huntsville Division of Natural Resources hr hour hi-vol high-volume PM10 sampler JCDH Jefferson County Department of Health Low-vol low-volume particulate sampler m3 cubic meter min minute ml milliliter MSA metropolitan statistical area NAAQS national ambient air quality standard NCore National core monitoring (multi-pollutant) O3 ozone PAMS photochemical air monitoring station Pb lead PM particulate matter PM2.5 particulate matter less than 2.5 micrometers diameter PM10 particulate matter less than 10 micrometer diameter PM10-2.5 particulate matter less than 10 microns but greater than 2.5 microns QA quality assurance QAPP Quality Assurance Project Plan QC quality control SLAMS state and local air monitoring station SO2 sulfur dioxide SPM special purpose monitor STN (PM2.5) Speciation Trends Network TEOM Tapered Element Oscillating Microbalance (Rupprecht and Patashnick Co.) TPY Tons per Year TSP total suspended particulate URG URG-3000N PM2.5 Speciation monitoring carbon-specific sampler USEPA United States Environmental Protection Agency ° C degree Celsius µg/m3 micrograms (of pollutant) per cubic meter (of air sampled)
2012 Ambient Air Plan.doc 6/1/2012
Page 6 of 58
Introduction In October 2006, the U.S.EPA issued final Federal Regulations (40 CFR 58) concerning state and local agency ambient air monitoring networks. These regulations require states to submit an annual monitoring network review to U.S.EPA. This network plan is required to provide the framework for the establishment and maintenance of an air quality surveillance system and to list any changes that are proposed to take place to the current network during the 2012 season.
Public Review and Comment The annual monitoring network review must be made available for public inspection for thirty (30) days prior to submission to U.S.EPA. For 2012, this document was placed on ADEM’s website on June 1st to begin a 30 day public review period. This document can be accessed on ADEM’s website. Or by contacting:
Michael E. Malaier, Chief Air Assessment Unit
Field Operations Division Alabama Department of Environmental Management
P.O. Box 301463, Montgomery, AL 36130-1463 (Street address: 1350 Coliseum Boulevard, Montgomery, AL 36110-2059)
Or by e-mail at [email protected].
Overview of Alabama’s Air Monitoring Network Monitors in the State of Alabama are operated for a variety of monitoring objectives. These objectives include determining whether areas of the State meet the National Ambient Air Quality Standards (NAAQS), for public information (such as, participation in EPA's AirNow program), Air Quality Index (AQI) reporting for larger Metropolitan Statistical Areas MSAs, for use in Air Quality models and to provide data to Air Quality Researchers. Alabama monitors the six (6) criteria pollutants which have NAAQS identified for them; CO, Lead, NO2, Ozone, particulate matter (PM10 and PM2.5), and SO2. There are other non-criteria pollutants that are also monitored for special purposes (such as PM2.5 speciated compounds). In addition, meteorological data are also collected to support the monitoring and aid in analysis of the data.
2012 Ambient Air Plan.doc 6/1/2012
Page 7 of 58
In Alabama, the air quality surveillance system is operated by the State environmental agency and two local programs. The agencies are the Alabama Department of Environmental Management (ADEM), the Jefferson County Department of Health (JCDH), and the Huntsville Department of Natural Resources (HDNR). Each of these agencies has performed the required annual review of their portion of the current ambient air quality network and developed a proposed network to be implemented during 2012. This document is a compilation of the reports from each agency. Currently, the Air Quality Index (AQI) is reported for Huntsville, Birmingham, Mobile, Montgomery and Phenix City on the Internet at the sites listed below. ADEM http://www.adem.state.al.us/programs/air/airquality/ozone/historical.cnt JCDH http://www.jcdh.org/EH/AnR/AnR03.aspx HDNR http://www.hsvcity.com/NatRes/airdata.php#blank An overview of the 2012 Alabama Monitoring Network can be seen in Figure 1.
Summary of findings of the network review ADEM As discussed in last year’s plan, the continuous PM2.5 monitors at the Florence (01-033-1002), Dothan (01-069-0003), Gadsden (01-055-0010), and Tuscaloosa (01-125-0003) sites were closed as of 12/31/2011. The Lead monitoring site at Pryor Field Airport (01-083-0005) was established and started operating as of 01/01/2012. The SO2 monitoring equipment will be placed at the Chickasaw site (01-097-0003) for the Mobile MSA and at the Tuscaloosa site (01-125-0010) for the Tuscaloosa MSA. The start up date has been set for 01/01/2013 as required by the rule. Due to loss of access, the site at Sumter County (01-119-0002) had to be closed. ADEM is in the process of securing a new site in the area and plans to be operational again in 2012. HDNR There are no changes planned for the Huntsville Air Monitoring Network.

2012 Ambient Air Plan.doc 6/1/2012
Page 8 of 58
JDCH North Birmingham (01-073-0023) and Wylam (01-073-2003) PM 2.5 FRM sampling frequency will be reduced to 1 in 3 day. PM2.5 speciation sampling frequency at Wylam (01-073-2003) will be increasing to follow North Birmingham’s 1 in 3 day alternate schedule. Providence (01-073-1009) and Pinson (01-073-5002) sites will be closed, eliminating Ozone and Continuous PM 2.5 sampling at those sites. Community wide NO2 sampling will be added to the NCore site at North Birmingham (AQS ID 01-073-0023). A Near-Road NO2 monitoring site will be established by January 2014 and CO monitor currently at East Thomas (AQS ID 01-073-0028) will be relocated to this site (required to be operational by January 1, 2017).
2012 Ambient Air Plan.doc 6/1/2012
Page 9 of 58
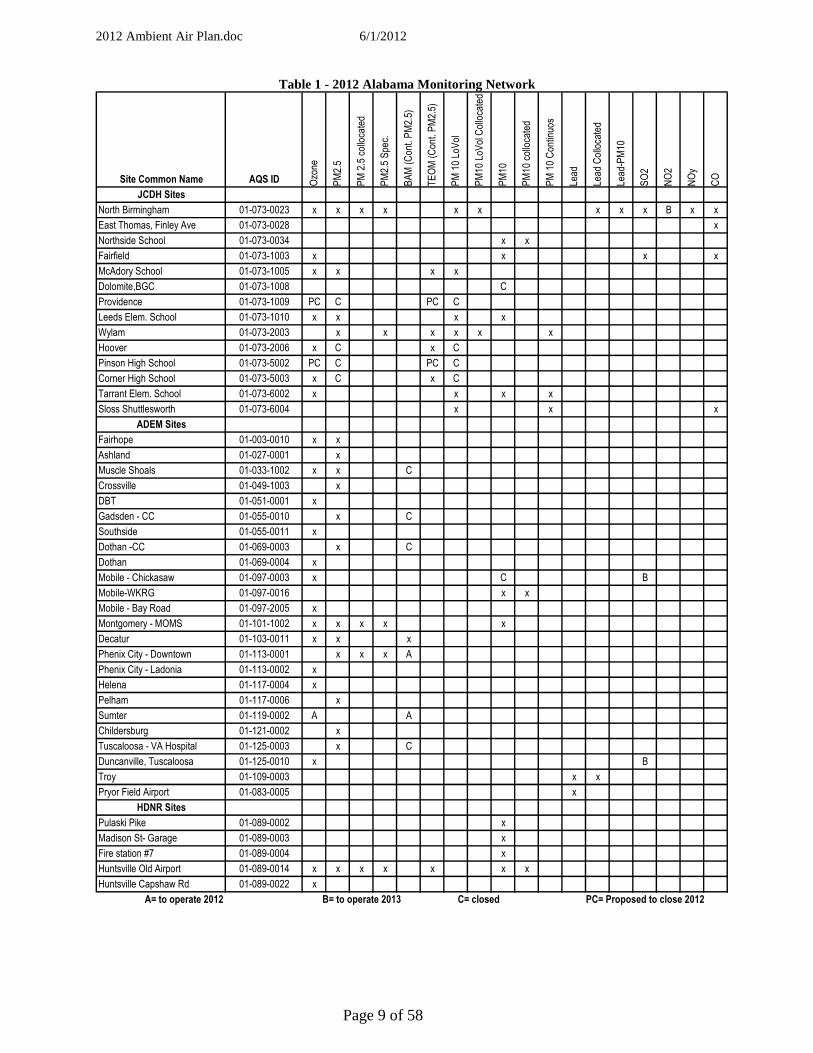
Table 1 - 2012 Alabama Monitoring Network
Site Common Name AQS ID Ozo
ne
PM2.5
PM 2.5 colloca
ted
PM2.5 Spe
c.
BAM (Con
t. PM2.5)
TEOM (Con
t. PM2.5)
PM 10 Lo
Vol
PM10
LoV
ol C
olloca
ted
PM10
PM10
colloca
ted
PM 10 Con
tinuo
s
Lead
Lead
Colloca
ted
Lead
-PM10
SO2
NO2
NOy
CO
JCDH Sites
North Birmingham 01-073-0023 x x x x x x x x x B x x
East Thomas, Finley Ave 01-073-0028 x
Northside School 01-073-0034 x x
Fairfield 01-073-1003 x x x x
McAdory School 01-073-1005 x x x x
Dolomite,BGC 01-073-1008 C
Providence 01-073-1009 PC C PC C
Leeds Elem. School 01-073-1010 x x x x
Wylam 01-073-2003 x x x x x x
Hoover 01-073-2006 x C x C
Pinson High School 01-073-5002 PC C PC C
Corner High School 01-073-5003 x C x C
Tarrant Elem. School 01-073-6002 x x x x
Sloss Shuttlesworth 01-073-6004 x x x
ADEM Sites
Fairhope 01-003-0010 x x
Ashland 01-027-0001 x
Muscle Shoals 01-033-1002 x x C
Crossville 01-049-1003 x
DBT 01-051-0001 x
Gadsden - CC 01-055-0010 x C
Southside 01-055-0011 x
Dothan -CC 01-069-0003 x C
Dothan 01-069-0004 x
Mobile - Chickasaw 01-097-0003 x C B
Mobile-WKRG 01-097-0016 x x
Mobile - Bay Road 01-097-2005 x
Montgomery - MOMS 01-101-1002 x x x x x
Decatur 01-103-0011 x x x
Phenix City - Downtown 01-113-0001 x x x A
Phenix City - Ladonia 01-113-0002 x
Helena 01-117-0004 x
Pelham 01-117-0006 x
Sumter 01-119-0002 A A
Childersburg 01-121-0002 x
Tuscaloosa - VA Hospital 01-125-0003 x C
Duncanville, Tuscaloosa 01-125-0010 x B
Troy 01-109-0003 x x
Pryor Field Airport 01-083-0005 x
HDNR Sites
Pulaski Pike 01-089-0002 x
Madison St- Garage 01-089-0003 x
Fire station #7 01-089-0004 x
Huntsville Old Airport 01-089-0014 x x x x x x x
Huntsville Capshaw Rd 01-089-0022 x
A= to operate 2012 B= to operate 2013 C= closed PC= Proposed to close 2012
2012 Ambient Air Plan.doc 6/1/2012
Page 10 of 58
Network Plan Description As per 40 CFR Part 58.10, an annual monitoring network plan, which provides for the establishment and maintenance of an air quality surveillance system consisting of the air quality monitors in the state, is required to be submitted by all states to U.S.EPA. Specifically §58.10 (a) requires for each existing and proposed monitoring site:
1. A statement of purpose for each monitor. 2. Evidence that siting and operation of each monitor meets the requirements of appendices A, C, D, and E of 40 CFR Part 58, where applicable. 3. Proposals for any State and Local Air Monitoring station (SLAMS) network modifications.
§58.10 (b) requires the plan must contain the following information for each existing and proposed site: 1. The Air Quality System (AQS) site identification number. 2. The location, including street address and geographical coordinates. 3. The sampling and analysis method(s) for each measured parameter. 4. The operating schedules for each monitor. 5. Any proposals to remove or move a monitoring station within a period of 18 months following plan submittal. 6. The monitoring objective and spatial scale of representativeness for each monitor. 7. The identification of any sites that are suitable and sites that are not suitable for comparison against the annual PM2.5 NAAQS as described in §58.30. 8. The Metropolitan Statistical Area (MSA), Core Based Statistical Area (CBSA), Combined Statistical Area (CSA) or other area represented by the monitor. 9. The designation of any Pb monitors as either source-oriented or non-source-oriented according to Appendix D to 40 CFR part 58. 10. Any source-oriented monitors for which a waiver has been requested or granted by the U.S.EPA Regional Administrator as allowed for under paragraph 4.5(a)(ii) of Appendix D to 40 CFR part 58. 11. Any source-oriented or non-source-oriented site for which a waiver has been requested or granted by the U.S.EPA Regional Administrator for the use of Pb-PM10 monitoring in lieu of Pb-TSP monitoring as allowed for under paragraph 2.10 of Appendix C to 40 CFR part 58. Monitoring Requirements Appendix A of 40 CFR Part 58 outlines the Quality Assurance Requirements for SLAMS, SPMs, and PSD Air Monitoring. It details the calibration and auditing procedures used to collect valid air quality data, the minimum number of collocated monitoring sites, the calculation used for data quality assessments, and the reporting requirements. All sites in Alabama operate following the requirements set forth in this appendix.
2012 Ambient Air Plan.doc 6/1/2012
Page 11 of 58
Appendix C of 40 CFR Part 58 specifies the criteria pollutant monitoring methods, which must be used in SLAMS and NCore stations. All criteria pollutant monitoring in Alabama follows the methods specified in this appendix. Appendix D of 40 CFR Part 58 deals with the network design criteria for ambient air quality monitoring. The overall design criteria, the minimum number of sites for each parameter, the type of sites, the spatial scale of the sites, and the monitoring objectives of the sites are detailed. In designing the air monitoring network for Alabama, the requirements of this appendix were followed. The specifics for each pollutant network are in the their individual chapters. Appendix E of 40 CFR Part 58 deals with the placement of the monitoring probe, its spacing from obstructions and what materials the probe can be made of. All monitors operated in Alabama meet Appendix E criteria.
Population and CBSA Alabama has a population of 4,802,740, of which 3,685,414 is located in the 12 MSAs listed in Table 2.
Table 2 - 2011Estimated MSA Population Metropolitan Statistical Areas
Anniston-Oxford, AL 117,797
Auburn-Opelika, AL 143,468
Birmingham-Hoover, AL 1,132,264
Columbus, GA-AL 301,439
Decatur, AL 154,070
Dothan, AL 146,562
Florence-Muscle Shoals, AL 147,293
Gadsden, AL 104,303
Huntsville, AL 425,480
Mobile, AL 412,577
Montgomery, AL 378,608
Tuscaloosa, AL 221,553
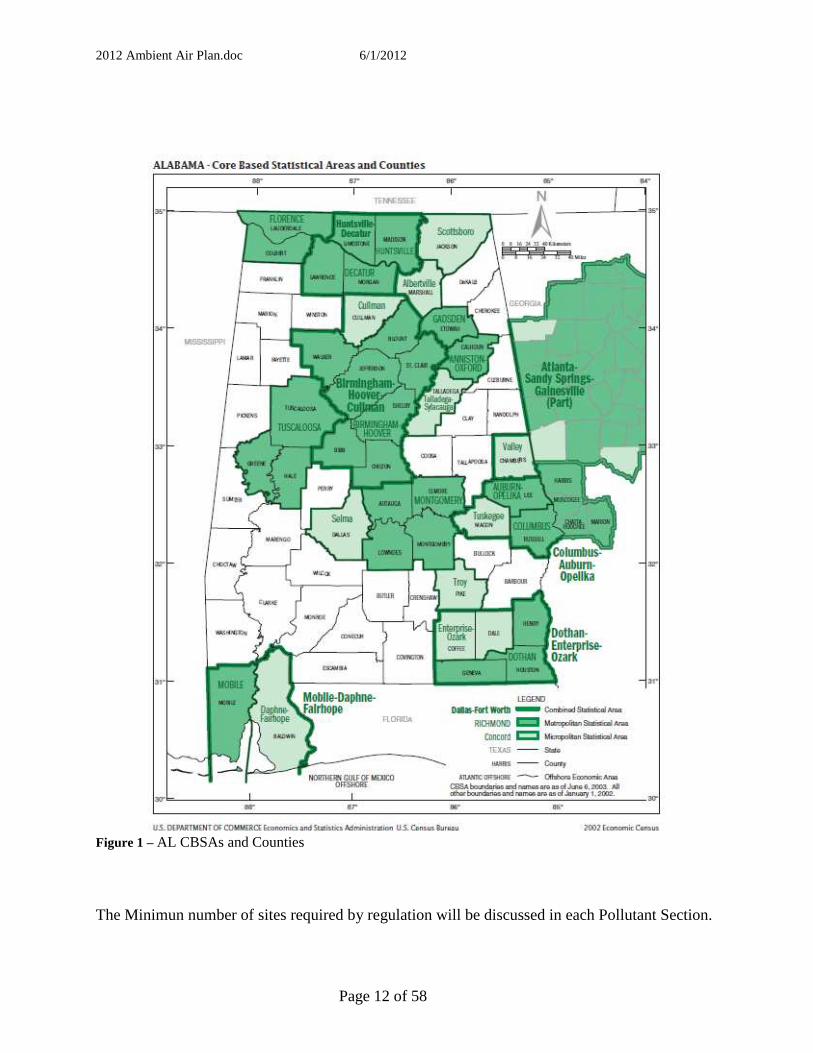
Minimum monitoring requirements vary for each pollutant and can be based on a combination of factors such as population, the level of monitored pollutants and Core Based Statistical Area (CBSA) boundaries as defined in the latest US Census information. The term "Core Based Statistical Area" (CBSA) is a collective term for both Metropolitan Statistical Areas (MSA) and Micropolitan Statistical Areas (µSA). Figure 1 shows a map of the current CBSAs in Alabama.
2012 Ambient Air Plan.doc 6/1/2012
Page 12 of 58
Figure 1 – AL CBSAs and Counties The Minimun number of sites required by regulation will be discussed in each Pollutant Section.
2012 Ambient Air Plan.doc 6/1/2012
Page 13 of 58
Types of Monitoring Stations PAMS – Photochemical Assessment Monitoring Station: Sites established to obtain more comprehensive data of areas with high levels of ozone pollution by also monitoring NOx and VOCs. PAMS monitoring is not required in the state of Alabama. SLAMS - State or Local Ambient Monitoring Station: The SLAMS make up the ambient air quality monitoring sites that are primarily needed for NAAQS comparisons. These will be described in detail by pollutant and Monitoring Agency later. STN – PM2.5 Speciation Trends Network: A PM2.5 speciation station designated to be part of the speciation trends network. This network provides chemical species data of fine particulates. There is currently 1 STN site located in Alabama at the North Birmingham site (01-073-0023). Supplemental Speciation - Any PM2.5 speciation station that is used to gain supplemental data and is not dedicated as part of the speciation trends network. There are currently 4 PM2.5 supplemental speciation sites located in Alabama. These are at Huntsville, Montgomery, Phenix City, and Wylam. NCore – National Core multi-pollutant monitoring station: Sites that measure multiple pollutants at trace levels in order to provide support to integrated air quality management data needs. Each state is required to operate one NCore site. The NCore site for Alabama is located in the Birmingham MSA at the North Birmingham site (01-073-0023) operated by JDCH. Additional information concerning this site can be found in the JCDH portion of the network description. CASNET – Clean Air Status and Trends Network: is a national air quality monitoring network designed to provide data to assess trends in air quality, atmospheric deposition, and ecological effects due to changes in air pollutant emissions. CASTNET provides long-term monitoring of air quality in rural areas to determine trends in regional atmospheric nitrogen, sulfur, and ozone concentrations and deposition fluxes of sulfur and nitrogen pollutants in order to evaluate the effectiveness of national and regional air pollution control programs. There is one CASNET site in Alabama and it is operated by EPA. It is Sand Mountain (AQS ID 01-049-9991) in Dekalb county.
2012 Ambient Air Plan.doc 6/1/2012
Page 14 of 58
Alabama’s SLAMS by Pollutant
Lead Network In 2008, the U.S. EPA revised the National Ambient Air Quality Standard for lead. The lead standard was lowered from 1.5 ug/m3 for a quarterly average to 0.15 ug/m3 based on the highest rolling 3 month average over a 3 year period. EPA set minimum monitoring requirements for source and population oriented monitoring. Source oriented monitoring is required near sources that have emissions greater than or equal to 1 ton per year. Population-oriented monitoring is required for CBSAs greater than 500,000. In December of 2010, EPA revised the lead rule to include sources greater than ½ ton per year and stated that the population oriented monitors would be located at the NCore sites. Based on current emissions data or modeling ADEM has identified 1 source which emits greater than ½ ton of lead per year (Sanders Lead Co.). ADEM has an existing monitor (AQS ID 01-109-0003) near that source. This monitor appears to be sited in the proper location, and ADEM will continue to operate that monitor. To meet QA requirements, collocated Lead monitoring is also occurring at this site. Based on current emission data, JCDH and the City of Huntsville have no sources that would require monitoring. In addition, Pb monitoring is required at any NCore site in each CBSA with a population equal to or greater than 500,000 people. This site is being operated by JDCH and is located at the NCore (North Birmingham AQS ID 01-073-0023) site and has been collecting data since 12-29-2011. Also, in the 2010 rule revision, EPA identified 15 airports across the nation that have significant reciprocating engine aircraft traffic and ambient air within 150 meters of the traffic. A lead monitor is required to be operated at these airports for at least one year. If the lead concentration measured by this monitor exceeds 50 percent of the NAAQS, the monitor will become a permanent monitor. Alabama’s Pryor Field was on this list and a site (AQS ID 01-083-0005) has been established and will continue to operate for one year. The first quarter monitoring is complete for Pryor Field and the design value is 0.009 ug/m3 .
2012 Ambient Air Plan.doc 6/1/2012
Page 15 of 58
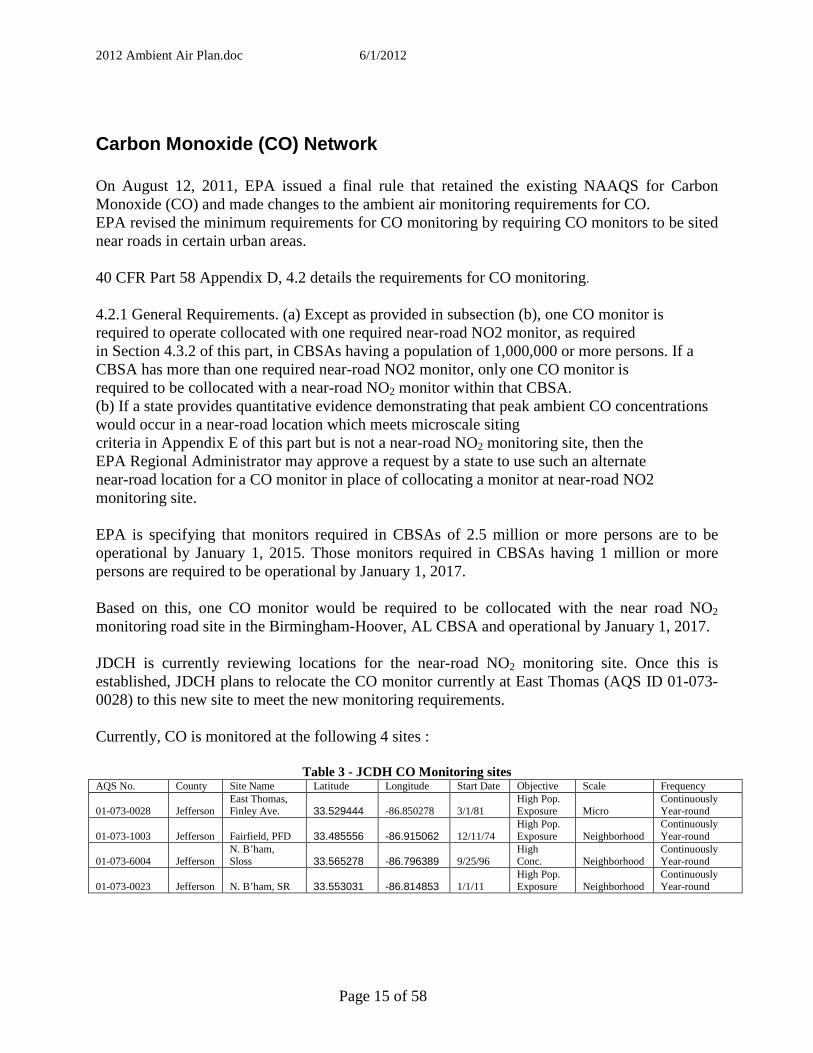
Carbon Monoxide (CO) Network On August 12, 2011, EPA issued a final rule that retained the existing NAAQS for Carbon Monoxide (CO) and made changes to the ambient air monitoring requirements for CO. EPA revised the minimum requirements for CO monitoring by requiring CO monitors to be sited near roads in certain urban areas. 40 CFR Part 58 Appendix D, 4.2 details the requirements for CO monitoring. 4.2.1 General Requirements. (a) Except as provided in subsection (b), one CO monitor is required to operate collocated with one required near-road NO2 monitor, as required in Section 4.3.2 of this part, in CBSAs having a population of 1,000,000 or more persons. If a CBSA has more than one required near-road NO2 monitor, only one CO monitor is required to be collocated with a near-road NO2 monitor within that CBSA. (b) If a state provides quantitative evidence demonstrating that peak ambient CO concentrations would occur in a near-road location which meets microscale siting criteria in Appendix E of this part but is not a near-road NO2 monitoring site, then the EPA Regional Administrator may approve a request by a state to use such an alternate near-road location for a CO monitor in place of collocating a monitor at near-road NO2 monitoring site. EPA is specifying that monitors required in CBSAs of 2.5 million or more persons are to be operational by January 1, 2015. Those monitors required in CBSAs having 1 million or more persons are required to be operational by January 1, 2017. Based on this, one CO monitor would be required to be collocated with the near road NO2 monitoring road site in the Birmingham-Hoover, AL CBSA and operational by January 1, 2017. JDCH is currently reviewing locations for the near-road NO2 monitoring site. Once this is established, JDCH plans to relocate the CO monitor currently at East Thomas (AQS ID 01-073-0028) to this new site to meet the new monitoring requirements. Currently, CO is monitored at the following 4 sites :
Table 3 - JCDH CO Monitoring sites AQS No. County Site Name Latitude Longitude Start Date Objective Scale Frequency 01-073-0028
Jefferson
East Thomas, Finley Ave.
33.529444
-86.850278
3/1/81
High Pop. Exposure
Micro
Continuously Year-round
01-073-1003
Jefferson
Fairfield, PFD
33.485556
-86.915062
12/11/74
High Pop. Exposure
Neighborhood
Continuously Year-round
01-073-6004
Jefferson
N. B’ham, Sloss
33.565278
-86.796389
9/25/96
High Conc.
Neighborhood
Continuously Year-round
01-073-0023
Jefferson
N. B’ham, SR
33.553031
-86.814853
1/1/11
High Pop. Exposure
Neighborhood
Continuously Year-round

2012 Ambient Air Plan.doc 6/1/2012
Page 16 of 58
Nitrogen Dioxide (NO 2) Network On January 22, 2010, the US EPA finalized the monitoring rules for Nitrogen Dioxide. The new rules include new requirements for the placement of new NO2 monitors in urban areas. These include: Near Road Monitoring • At least one monitor must be located near a major road in each CBSA with a population greater than or equal to 500,000 people. A second monitor is required near another major road in areas with either:
(1) CBSA population greater than or equal to 2.5 million people, or (2) one or more road segments with an annual average daily traffic (AADT) count greater
than or equal to 250,000 vehicles. These NO2 monitors must be placed near those road segments ranked with the highest traffic levels by AADT, with consideration given to fleet mix, congestion patterns, terrain, geographic location, and meteorology in identifying locations where the peak concentrations of NO2 are expected to occur. Monitors must be placed no more than 50 meters (about 164 feet) away from the edge of the nearest traffic lane. Community Wide Monitoring • A minimum of one monitor must be placed in any urban area with a population greater than or equal to 1 million people to assess community-wide concentrations. • An additional 53 monitoring sites will be required to assess community-wide levels in urban areas. • Some NO2 monitors already in operation may meet the community-wide monitor siting requirements. Monitoring to Protect Susceptible and Vulnerable Populations • Working with the states, EPA Regional Administrators will site at least 40 additional NO2 monitors to help protect communities that are susceptible and vulnerable to NO2 -related health effects. • All new NO2 monitors must begin operating no later than January 1, 2013. Birmingham-Hoover is the only CBSA in Alabama with a population greater than 500,000. However, the population is less than 2.5 million and there are no road segments with AADT greater than 250,000 vehicles. Therefore, one near road NO2 monitor will need to be located in the Birmingham MSA by 2013. Jefferson County’s meteorologist and engineers are currently researching appropriate sites using the technical assistance document and should have several sites identified by mid-summer. The Birmingham MSA’s population is greater than 1 million, so there will need to be one NO2 monitor located there by 2013 for community wide monitoring. JDCH proposes adding community wide NO2 sampling to the NCore site at North Birmingham (AQS ID 01-073-0023) and begin operation by January 1, 2013.
2012 Ambient Air Plan.doc 6/1/2012
Page 17 of 58
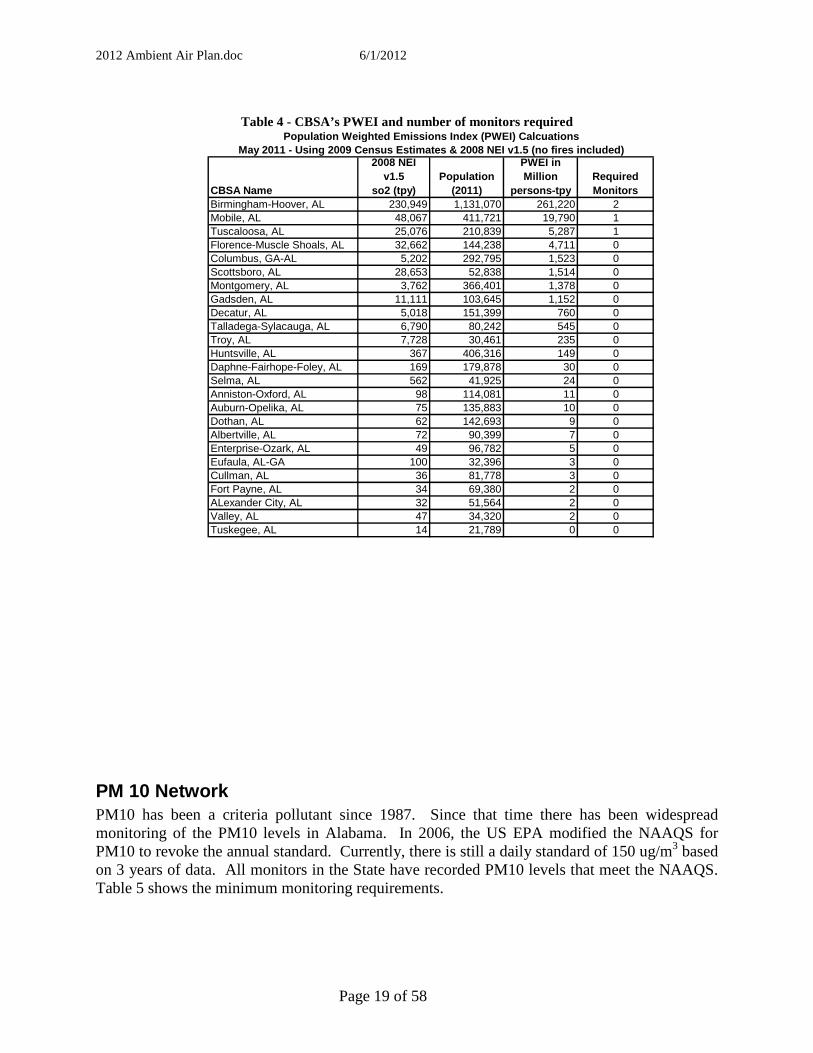
Sulfur Dioxide (SO 2) Network On June 2, 2010, EPA strengthened the primary NAAQS for sulfur dioxide (SO2). EPA is revising the primary SO2 standard by establishing a new 1-hour standard at a level of 75 parts per billion (ppb). The current monitoring regulations require monitors to be placed in CBSAs based on a Population Weighted Emissions Index (PWEI) for the area. The rule requires:
• 3 monitors in CBSAs with index values of 1,000,000 or more; • 2 monitors in CBSAs with index values less than 1,000,000 but greater than 100,000; and • 1 monitor in CBSAs with index values greater than 5,000.
All newly sited SO2 monitors must be operational by January 1, 2013. Based on this the Birmingham-Hoover CBSA will require 2 SO2 monitors. JDCH has two sites at North Birmingham (AQS ID 01-073-0023) and Fairfield (AQS ID 01-073-1003). The Huntsville MSA has a PWEI less than 5,000, so no SO2 monitor is required. Based on PWEI estimates, ADEM will need to establish 2 new SO2 monitoring sites in the Tuscaloosa and Mobile MSAs. ADEM plans to place these monitors at the existing Tuscaloosa County site (AQS ID 01-125-0010) for the Tuscaloosa MSA and at the existing Chickasaw site (AQS ID 01-097-0003) for the Mobile MSA. Below is the reasoning for this. For the Tuscaloosa MSA, we believe the new SO2 monitor can be collocated with the existing monitor in Tuscaloosa:
- Tuscaloosa County is the most populated county by far in the Tuscaloosa MSA (which includes Tuscaloosa, Greene, and Hale Counties).
- The Tuscaloosa wind rose shows a strong southerly to southwesterly component, which would transport SO2 from the area of higher emissions near the Greene/Hale County line.
- The Tuscaloosa wind rose also shows a strong northwesterly to northeasterly component, which would pick up the plumes from the SO2 sources northwest of the monitor in Tuscaloosa County, as well as the plume from a larger SO2 source in Walker County.
2012 Ambient Air Plan.doc 6/1/2012
Page 18 of 58
For the Mobile MSA, we believe the new SO2 monitor can be collocated with the existing monitor in Chickasaw:
- The Chickasaw monitor is to the south of two large SO2 sources in northeastern Mobile County, and there are other additional SO2 sources located to the north and south of the monitor.
- The Bay Road monitor also has SO2 sources nearby, but the Bay Road monitor is more subject to a bay breeze and sea breeze than the Chickasaw monitor.
- The Mobile wind rose has rather strong components both from the north and the south, so the Chickasaw monitor is in a good location to pick up plumes from many of the SO2 sources in Mobile County.
- The Mobile wind rose shows the strongest wind component from the southeast. However, placing the SO2 monitor in an area to the northwest of the SO2 sources would move the monitor further away from the most populated areas in Mobile County. Additionally, the sea or bay breeze probably adds to the southeasterly wind component seen in the Mobile wind rose. Placing a monitor further inland in Mobile County could reduce the southeasterly component. Chickasaw is a good location for the monitor due to these factors.
For the wind roses and emission source maps see Appendix B. For PWEI table see below.
2012 Ambient Air Plan.doc 6/1/2012
Page 19 of 58
Table 4 - CBSA’s PWEI and number of monitors required
CBSA Name
2008 NEI v1.5
so2 (tpy)Population
(2011)
PWEI in Million
persons-tpyRequired Monitors
Birmingham-Hoover, AL 230,949 1,131,070 261,220 2Mobile, AL 48,067 411,721 19,790 1Tuscaloosa, AL 25,076 210,839 5,287 1Florence-Muscle Shoals, AL 32,662 144,238 4,711 0Columbus, GA-AL 5,202 292,795 1,523 0Scottsboro, AL 28,653 52,838 1,514 0Montgomery, AL 3,762 366,401 1,378 0Gadsden, AL 11,111 103,645 1,152 0Decatur, AL 5,018 151,399 760 0Talladega-Sylacauga, AL 6,790 80,242 545 0Troy, AL 7,728 30,461 235 0Huntsville, AL 367 406,316 149 0Daphne-Fairhope-Foley, AL 169 179,878 30 0Selma, AL 562 41,925 24 0Anniston-Oxford, AL 98 114,081 11 0Auburn-Opelika, AL 75 135,883 10 0Dothan, AL 62 142,693 9 0Albertville, AL 72 90,399 7 0Enterprise-Ozark, AL 49 96,782 5 0Eufaula, AL-GA 100 32,396 3 0Cullman, AL 36 81,778 3 0Fort Payne, AL 34 69,380 2 0ALexander City, AL 32 51,564 2 0Valley, AL 47 34,320 2 0Tuskegee, AL 14 21,789 0 0
Population Weighted Emissions Index (PWEI) Calcuati onsMay 2011 - Using 2009 Census Estimates & 2008 NEI v 1.5 (no fires included)
PM 10 Network PM10 has been a criteria pollutant since 1987. Since that time there has been widespread monitoring of the PM10 levels in Alabama. In 2006, the US EPA modified the NAAQS for PM10 to revoke the annual standard. Currently, there is still a daily standard of 150 ug/m3 based on 3 years of data. All monitors in the State have recorded PM10 levels that meet the NAAQS. Table 5 shows the minimum monitoring requirements.
2012 Ambient Air Plan.doc 6/1/2012
Page 20 of 58
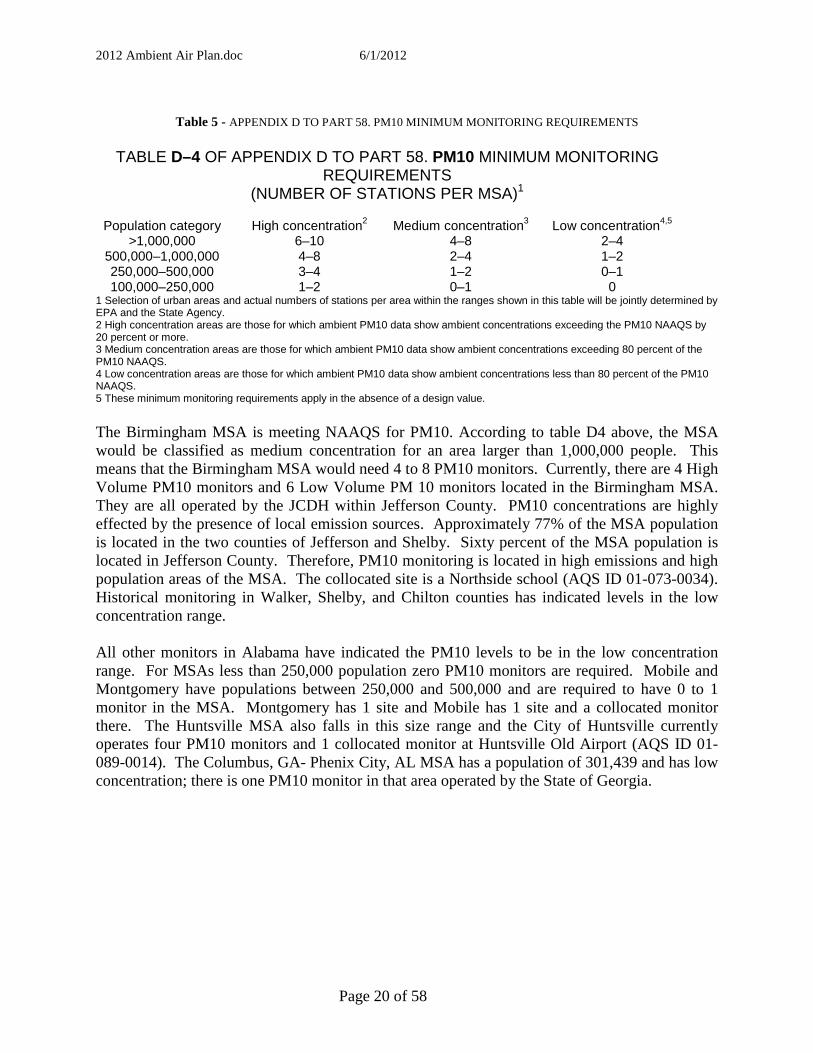
Table 5 - APPENDIX D TO PART 58. PM10 MINIMUM MONITORING REQUIREMENTS
TABLE D–4 OF APPENDIX D TO PART 58. PM10 MINIMUM MONITORING
REQUIREMENTS (NUMBER OF STATIONS PER MSA)1
Population category High concentration2 Medium concentration3 Low concentration4,5
>1,000,000 6–10 4–8 2–4 500,000–1,000,000 4–8 2–4 1–2 250,000–500,000 3–4 1–2 0–1 100,000–250,000 1–2 0–1 0
1 Selection of urban areas and actual numbers of stations per area within the ranges shown in this table will be jointly determined by EPA and the State Agency. 2 High concentration areas are those for which ambient PM10 data show ambient concentrations exceeding the PM10 NAAQS by 20 percent or more. 3 Medium concentration areas are those for which ambient PM10 data show ambient concentrations exceeding 80 percent of the PM10 NAAQS. 4 Low concentration areas are those for which ambient PM10 data show ambient concentrations less than 80 percent of the PM10 NAAQS. 5 These minimum monitoring requirements apply in the absence of a design value.
The Birmingham MSA is meeting NAAQS for PM10. According to table D4 above, the MSA would be classified as medium concentration for an area larger than 1,000,000 people. This means that the Birmingham MSA would need 4 to 8 PM10 monitors. Currently, there are 4 High Volume PM10 monitors and 6 Low Volume PM 10 monitors located in the Birmingham MSA. They are all operated by the JCDH within Jefferson County. PM10 concentrations are highly effected by the presence of local emission sources. Approximately 77% of the MSA population is located in the two counties of Jefferson and Shelby. Sixty percent of the MSA population is located in Jefferson County. Therefore, PM10 monitoring is located in high emissions and high population areas of the MSA. The collocated site is a Northside school (AQS ID 01-073-0034). Historical monitoring in Walker, Shelby, and Chilton counties has indicated levels in the low concentration range. All other monitors in Alabama have indicated the PM10 levels to be in the low concentration range. For MSAs less than 250,000 population zero PM10 monitors are required. Mobile and Montgomery have populations between 250,000 and 500,000 and are required to have 0 to 1 monitor in the MSA. Montgomery has 1 site and Mobile has 1 site and a collocated monitor there. The Huntsville MSA also falls in this size range and the City of Huntsville currently operates four PM10 monitors and 1 collocated monitor at Huntsville Old Airport (AQS ID 01-089-0014). The Columbus, GA- Phenix City, AL MSA has a population of 301,439 and has low concentration; there is one PM10 monitor in that area operated by the State of Georgia.
2012 Ambient Air Plan.doc 6/1/2012
Page 21 of 58
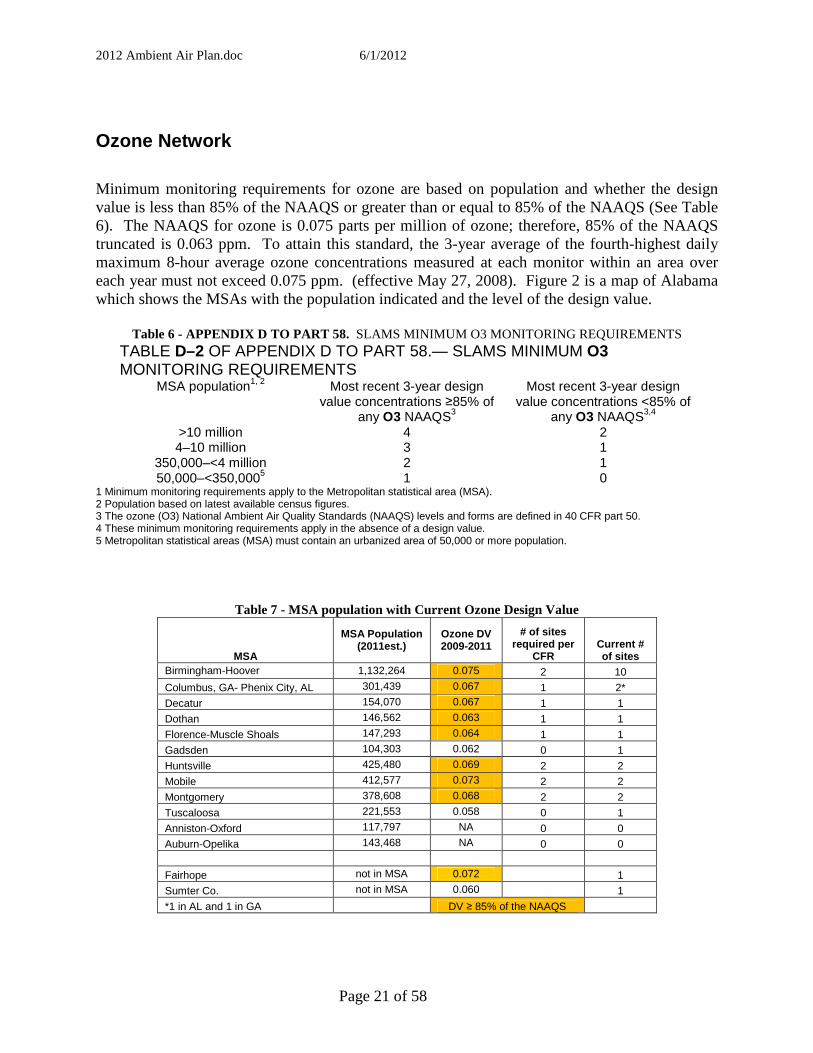
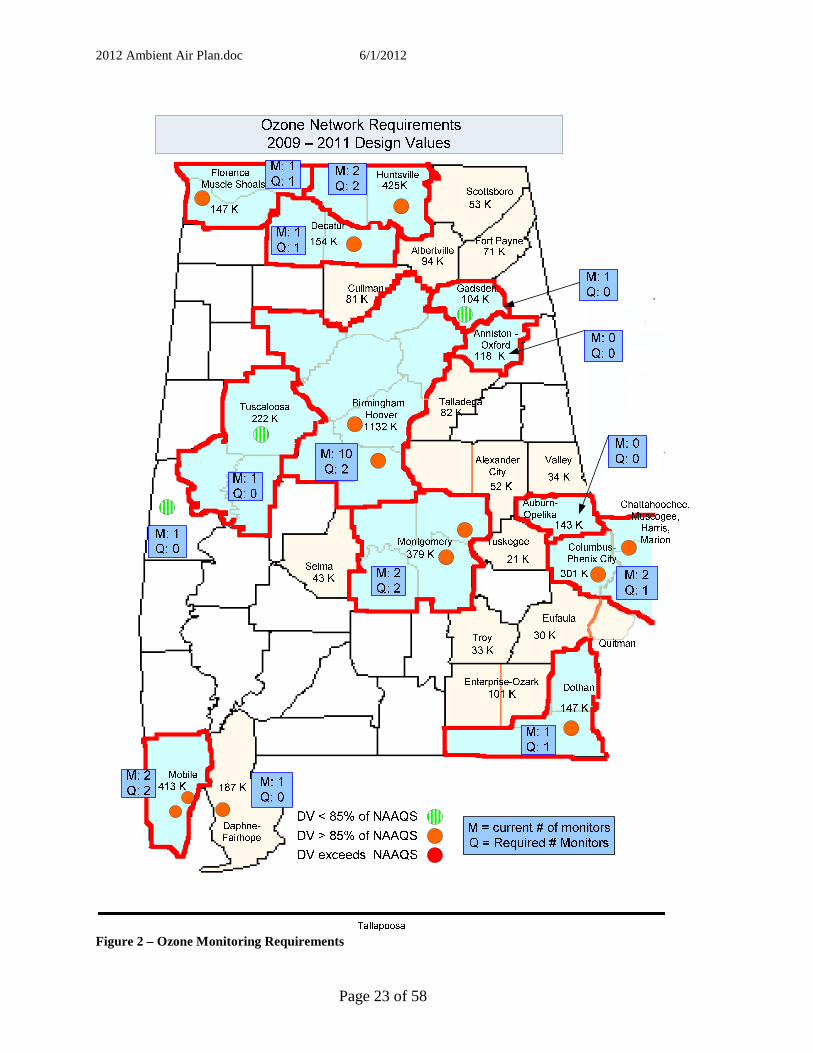
Ozone Network Minimum monitoring requirements for ozone are based on population and whether the design value is less than 85% of the NAAQS or greater than or equal to 85% of the NAAQS (See Table 6). The NAAQS for ozone is 0.075 parts per million of ozone; therefore, 85% of the NAAQS truncated is 0.063 ppm. To attain this standard, the 3-year average of the fourth-highest daily maximum 8-hour average ozone concentrations measured at each monitor within an area over each year must not exceed 0.075 ppm. (effective May 27, 2008). Figure 2 is a map of Alabama which shows the MSAs with the population indicated and the level of the design value.
Table 6 - APPENDIX D TO PART 58. SLAMS MINIMUM O3 MONITORING REQUIREMENTS TABLE D–2 OF APPENDIX D TO PART 58.— SLAMS MINIMUM O3 MONITORING REQUIREMENTS
MSA population1, 2 Most recent 3-year design value concentrations ≥85% of
any O3 NAAQS3
Most recent 3-year design value concentrations <85% of
any O3 NAAQS3,4 >10 million 4 2 4–10 million 3 1
350,000–<4 million 2 1 50,000–<350,0005 1 0
1 Minimum monitoring requirements apply to the Metropolitan statistical area (MSA). 2 Population based on latest available census figures. 3 The ozone (O3) National Ambient Air Quality Standards (NAAQS) levels and forms are defined in 40 CFR part 50. 4 These minimum monitoring requirements apply in the absence of a design value. 5 Metropolitan statistical areas (MSA) must contain an urbanized area of 50,000 or more population.
Table 7 - MSA population with Current Ozone Design Value
MSA
MSA Population (2011est.)
Ozone DV 2009-2011
# of sites required per
CFR Current # of sites
Birmingham-Hoover 1,132,264 0.075 2 10
Columbus, GA- Phenix City, AL 301,439 0.067 1 2*
Decatur 154,070 0.067 1 1
Dothan 146,562 0.063 1 1
Florence-Muscle Shoals 147,293 0.064 1 1
Gadsden 104,303 0.062 0 1
Huntsville 425,480 0.069 2 2
Mobile 412,577 0.073 2 2
Montgomery 378,608 0.068 2 2
Tuscaloosa 221,553 0.058 0 1
Anniston-Oxford 117,797 NA 0 0
Auburn-Opelika 143,468 NA 0 0
Fairhope not in MSA 0.072 1
Sumter Co. not in MSA 0.060 1
*1 in AL and 1 in GA DV ≥ 85% of the NAAQS
2012 Ambient Air Plan.doc 6/1/2012
Page 22 of 58
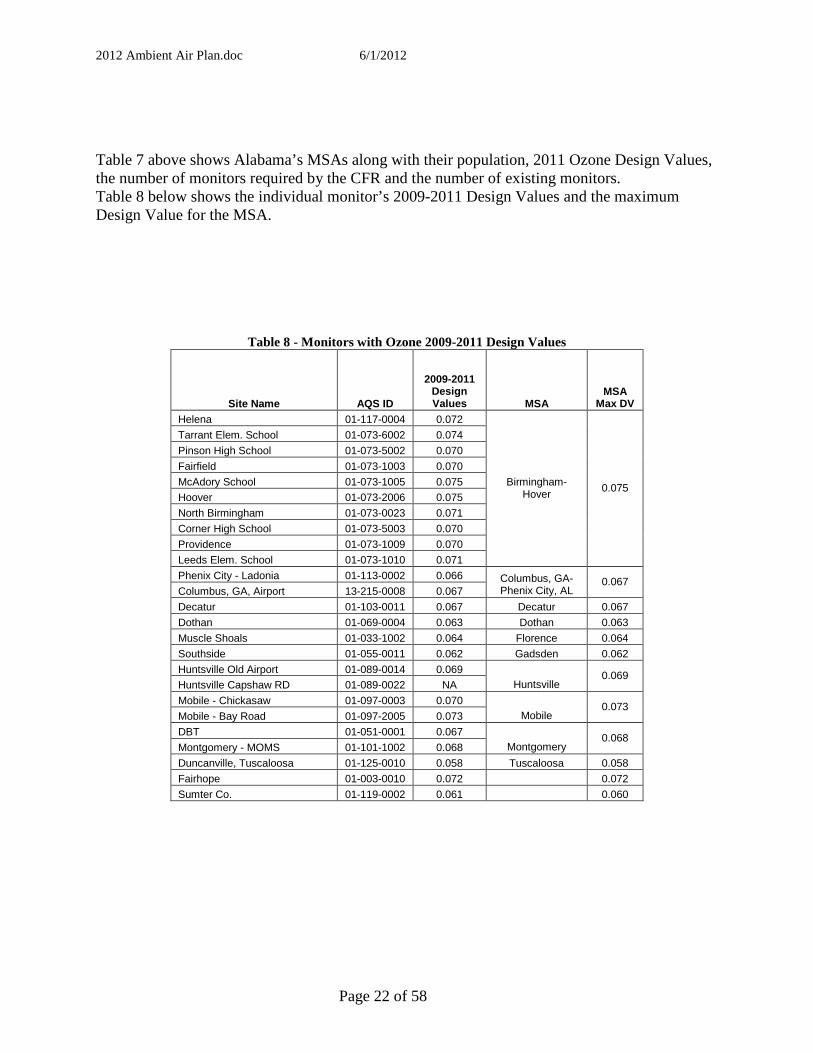
Table 7 above shows Alabama’s MSAs along with their population, 2011 Ozone Design Values, the number of monitors required by the CFR and the number of existing monitors. Table 8 below shows the individual monitor’s 2009-2011 Design Values and the maximum Design Value for the MSA.
Table 8 - Monitors with Ozone 2009-2011 Design Values
Site Name AQS ID
2009-2011 Design Values MSA
MSA Max DV
Helena 01-117-0004 0.072
Tarrant Elem. School 01-073-6002 0.074
Pinson High School 01-073-5002 0.070
Fairfield 01-073-1003 0.070
McAdory School 01-073-1005 0.075
Hoover 01-073-2006 0.075
North Birmingham 01-073-0023 0.071
Corner High School 01-073-5003 0.070
Providence 01-073-1009 0.070
Leeds Elem. School 01-073-1010 0.071
Birmingham-Hover
0.075
Phenix City - Ladonia 01-113-0002 0.066
Columbus, GA, Airport 13-215-0008 0.067 Columbus, GA- Phenix City, AL
0.067
Decatur 01-103-0011 0.067 Decatur 0.067
Dothan 01-069-0004 0.063 Dothan 0.063
Muscle Shoals 01-033-1002 0.064 Florence 0.064
Southside 01-055-0011 0.062 Gadsden 0.062
Huntsville Old Airport 01-089-0014 0.069
Huntsville Capshaw RD 01-089-0022 NA Huntsville 0.069
Mobile - Chickasaw 01-097-0003 0.070
Mobile - Bay Road 01-097-2005 0.073 Mobile 0.073
DBT 01-051-0001 0.067
Montgomery - MOMS 01-101-1002 0.068 Montgomery 0.068
Duncanville, Tuscaloosa 01-125-0010 0.058 Tuscaloosa 0.058
Fairhope 01-003-0010 0.072 0.072
Sumter Co. 01-119-0002 0.061 0.060
2012 Ambient Air Plan.doc 6/1/2012
Page 23 of 58
Figure 2 – Ozone Monitoring Requirements

2012 Ambient Air Plan.doc 6/1/2012
Page 24 of 58
Ozone Monitoring requirements for Alabama MSAs
Mobile The Mobile MSA would be required to have 2 ozone monitoring sites because its population is larger than 350,000, and the design value is greater than 85% of the NAAQS. Mobile County currently has 2 ozone sites.
Montgomery The Montgomery MSA’s population is greater than 350,000, and the design value is greater than 85% of the NAAQS. Two ozone monitors are required for this MSA. There are currently 2 sites, and these will be retained.
Tuscaloosa The population of the Tuscaloosa MSA is between 50,000 and 350,000, and the design value is less than 85% of the NAAQS therefore no monitor is required for that area. There is currently one monitor in the MSA; however, this monitor will be maintained.
Columbus, Ga.-Phenix City, AL The Columbus-Phenix City MSA ozone design value is greater than 85% of the NAAQS and the population is between 50,000 and 350,000; therefore, 1 monitor is required for that area. There is currently 1 site maintained by ADEM, west of Phenix City and 1 site is located in Georgia and operated by the State of Georgia.
Birmingham The population of the Birmingham MSA is between 350,000 and 4,000,000, and the design value is greater than 85% of the NAAQS; therefore, the MSA is required to have 2 Ozone sites. There are currently 10 ozone sites in this MSA. One site is located in Shelby County and is operated by ADEM. Nine sites, operated by the JCDH, are located in Jefferson County. Additional information about these monitors is found in the Network description.
Dothan The Dothan MSA population is between 50,000 and 350,000 and the design value is greater than 85% of the NAAQS. Dothan has one required site. This site will be maintained.
Gadsden The Gadsden MSA population is between 50,000 and 350,000, and the design value is less than 85% of the NAAQS therefore no monitor is required for that area. There is currently one monitor in the MSA and this monitor will be maintained.

2012 Ambient Air Plan.doc 6/1/2012
Page 25 of 58
Huntsville The Huntsville MSA design value is greater than 85% of the NAAQS, and the population is greater than 350,000 so this MSA is required to have 2 ozone sites. There are currently two ozone sites in the Huntsville MSA and they are operated by the City of Huntsville.
Decatur The Decatur MSA design value is greater than 85% of the NAAQS with a population between 50,000 and 350,000. Decatur is required to have 1 site and there is currently 1 site.
Florence The Florence MSA population is between 50,000 and 350,000, and the design value is greater than 85% of the NAAQS and has one required site. This site will be maintained. .
Auburn and Anniston-Oxford Prior to the 2006 changes to the monitoring regulations, ADEM evaluated the ozone monitoring network annually to determine the adequacy of coverage. The MSAs of Auburn and Anniston-Oxford were evaluated and it was determined that due to the close proximity of ozone monitors in neighboring areas, which were below the NAAQS, additional monitors would not be needed. The monitors in the adjacent areas still provide adequate monitoring coverage. Since these areas do not have design values, no monitors are required by Appendix D of 40 CFR 58.
Sites not located in an MSA The Daphne-Fairhope micropolitan statistical area (µSA), which compromises Baldwin County, is not required to have an ozone monitor. An ozone monitor was added to Baldwin County to provide additional information on ozone transport in the area. This monitor also provides input to EPA’s AirNow ozone mapping system. This web-based system provides near-real time ozone concentration data to the public. Daphne-Fairhope µSA is the largest micropolitan area in the State. Sumter County has one ozone monitor that represents rural, background ozone values for the State. The design value for this monitor is less than 85% of the NAAQS. This site is presently being relocated due to logistical reasons.
2012 Ambient Air Plan.doc 6/1/2012
Page 26 of 58
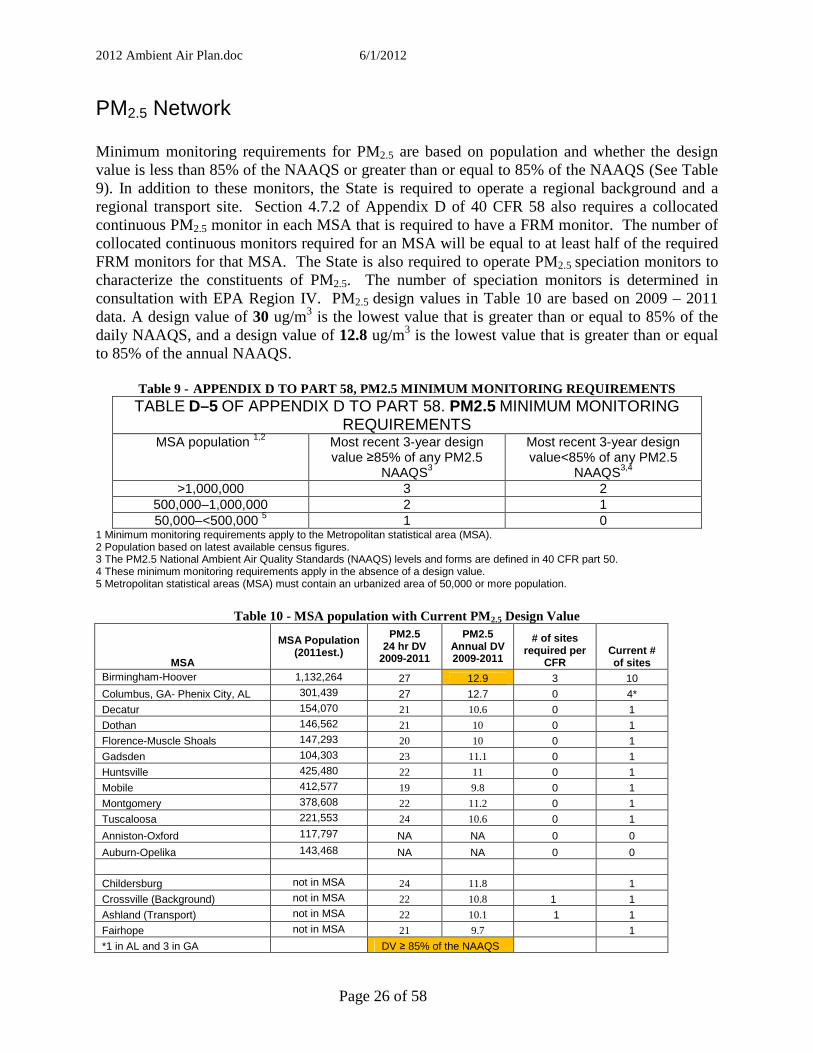
PM2.5 Network Minimum monitoring requirements for PM2.5 are based on population and whether the design value is less than 85% of the NAAQS or greater than or equal to 85% of the NAAQS (See Table 9). In addition to these monitors, the State is required to operate a regional background and a regional transport site. Section 4.7.2 of Appendix D of 40 CFR 58 also requires a collocated continuous PM2.5 monitor in each MSA that is required to have a FRM monitor. The number of collocated continuous monitors required for an MSA will be equal to at least half of the required FRM monitors for that MSA. The State is also required to operate PM2.5 speciation monitors to characterize the constituents of PM2.5. The number of speciation monitors is determined in consultation with EPA Region IV. PM2.5 design values in Table 10 are based on 2009 – 2011 data. A design value of 30 ug/m3 is the lowest value that is greater than or equal to 85% of the daily NAAQS, and a design value of 12.8 ug/m3 is the lowest value that is greater than or equal to 85% of the annual NAAQS.
Table 9 - APPENDIX D TO PART 58, PM2.5 MINIMUM MONITORING REQ UIREMENTS TABLE D–5 OF APPENDIX D TO PART 58. PM2.5 MINIMUM MONITORING
REQUIREMENTS MSA population 1,2 Most recent 3-year design
value ≥85% of any PM2.5 NAAQS3
Most recent 3-year design value<85% of any PM2.5
NAAQS3,4 >1,000,000 3 2
500,000–1,000,000 2 1 50,000–<500,000 5 1 0
1 Minimum monitoring requirements apply to the Metropolitan statistical area (MSA). 2 Population based on latest available census figures. 3 The PM2.5 National Ambient Air Quality Standards (NAAQS) levels and forms are defined in 40 CFR part 50. 4 These minimum monitoring requirements apply in the absence of a design value. 5 Metropolitan statistical areas (MSA) must contain an urbanized area of 50,000 or more population.
Table 10 - MSA population with Current PM 2.5 Design Value
MSA
MSA Population (2011est.)
PM2.5 24 hr DV
2009-2011
PM2.5 Annual DV 2009-2011
# of sites required per
CFR Current # of sites
Birmingham-Hoover 1,132,264 27 12.9 3 10
Columbus, GA- Phenix City, AL 301,439 27 12.7 0 4*
Decatur 154,070 21 10.6 0 1
Dothan 146,562 21 10 0 1
Florence-Muscle Shoals 147,293 20 10 0 1
Gadsden 104,303 23 11.1 0 1
Huntsville 425,480 22 11 0 1
Mobile 412,577 19 9.8 0 1
Montgomery 378,608 22 11.2 0 1
Tuscaloosa 221,553 24 10.6 0 1
Anniston-Oxford 117,797 NA NA 0 0
Auburn-Opelika 143,468 NA NA 0 0
Childersburg not in MSA 24 11.8 1
Crossville (Background) not in MSA 22 10.8 1 1
Ashland (Transport) not in MSA 22 10.1 1 1
Fairhope not in MSA 21 9.7 1
*1 in AL and 3 in GA DV ≥ 85% of the NAAQS
2012 Ambient Air Plan.doc 6/1/2012
Page 27 of 58
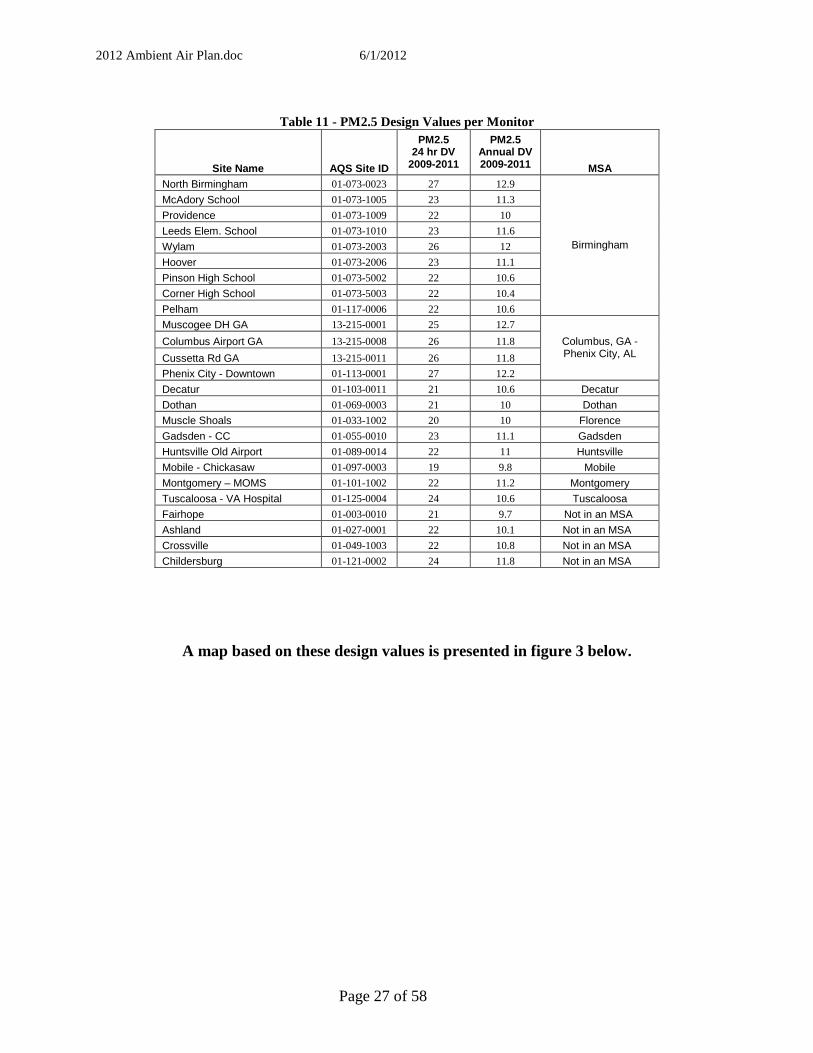
Table 11 - PM2.5 Design Values per Monitor
Site Name AQS Site ID
PM2.5 24 hr DV
2009-2011
PM2.5 Annual DV 2009-2011 MSA
North Birmingham 01-073-0023 27 12.9
McAdory School 01-073-1005 23 11.3
Providence 01-073-1009 22 10
Leeds Elem. School 01-073-1010 23 11.6
Wylam 01-073-2003 26 12
Hoover 01-073-2006 23 11.1
Pinson High School 01-073-5002 22 10.6
Corner High School 01-073-5003 22 10.4
Pelham 01-117-0006 22 10.6
Birmingham
Muscogee DH GA 13-215-0001 25 12.7
Columbus Airport GA 13-215-0008 26 11.8
Cussetta Rd GA 13-215-0011 26 11.8
Phenix City - Downtown 01-113-0001 27 12.2
Columbus, GA - Phenix City, AL
Decatur 01-103-0011 21 10.6 Decatur
Dothan 01-069-0003 21 10 Dothan
Muscle Shoals 01-033-1002 20 10 Florence
Gadsden - CC 01-055-0010 23 11.1 Gadsden
Huntsville Old Airport 01-089-0014 22 11 Huntsville
Mobile - Chickasaw 01-097-0003 19 9.8 Mobile
Montgomery – MOMS 01-101-1002 22 11.2 Montgomery
Tuscaloosa - VA Hospital 01-125-0004 24 10.6 Tuscaloosa
Fairhope 01-003-0010 21 9.7 Not in an MSA
Ashland 01-027-0001 22 10.1 Not in an MSA
Crossville 01-049-1003 22 10.8 Not in an MSA
Childersburg 01-121-0002 24 11.8 Not in an MSA
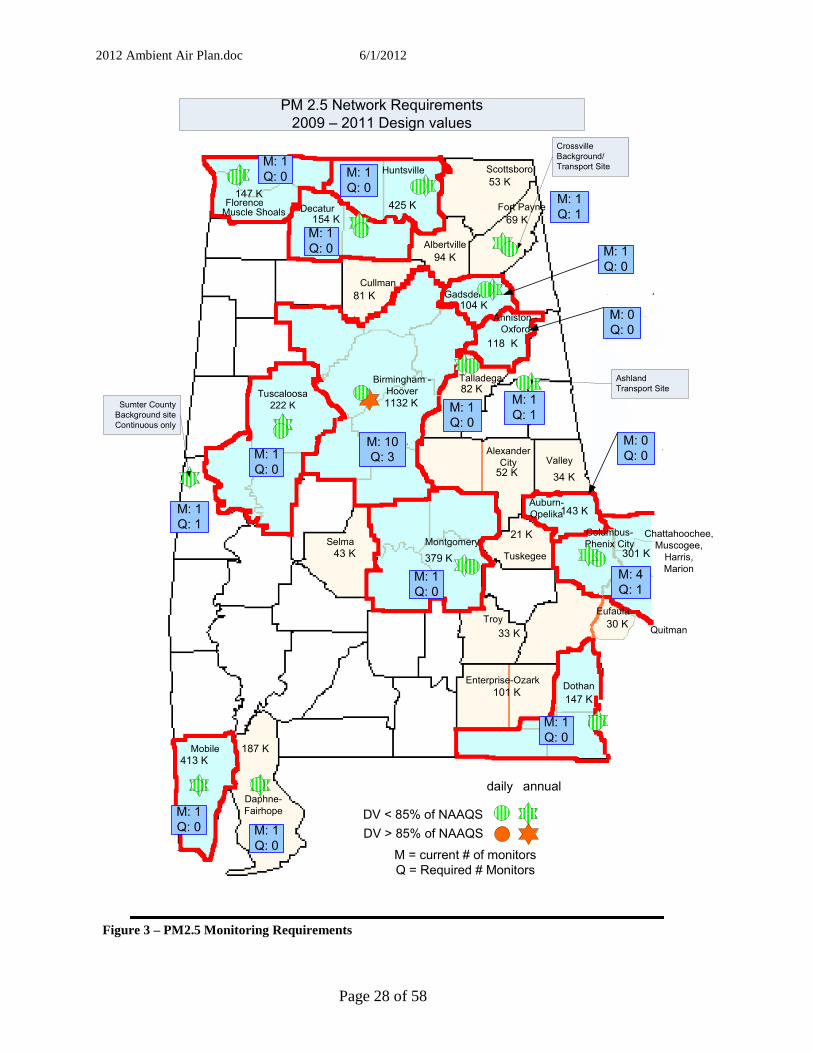
A map based on these design values is presented in figure 3 below.
2012 Ambient Air Plan.doc 6/1/2012
Page 28 of 58
Florence Muscle Shoals
Anniston -
Oxford
Talladega
Gadsden
Fort Payne
Tuscaloosa
222 K
Huntsville Scottsboro
Birmingham -
Hoover
Decatur
Cullman
Mobile
Daphne-
Fairhope
Columbus-
Phenix CityChattahoochee,
Muscogee,
Harris,
Marion
Auburn-
Opelika
Quitman
Montgomery
Tuskegee
Valley
DothanEnterprise-Ozark
DV < 85% of NAAQS
DV > 85% of NAAQS
daily annual
EufaulaTroy
Albertville
Alexander
City
Selma
1132 K
379 K
101 K
21 K
301 K
143 K
52 K 34 K
147 K
413 K187 K
33 K30 K
43 K
82 K
118 K
154 K
425 K147 K
94 K
53 K
69 K
81 K104 K
M = current # of monitors
Q = Required # Monitors
M: 0
Q: 0
M: 1
Q: 0
M: 0
Q: 0
M: 1
Q: 0
M: 1
Q: 0
M: 1
Q: 0
M: 1
Q: 0
M: 10
Q: 3
M: 4
Q: 1
M: 1
Q: 1M: 1
Q: 0
M: 1
Q: 1
M: 1
Q: 0
M: 1
Q: 0
M: 1
Q: 0
M: 1
Q: 0
Sumter County
Background site
Continuous only
Ashland
Transport Site
PM 2.5 Network Requirements
2009 – 2011 Design values
Crossville
Background/
Transport Site
M: 1
Q: 1
Figure 3 – PM2.5 Monitoring Requirements
2012 Ambient Air Plan.doc 6/1/2012
Page 29 of 58
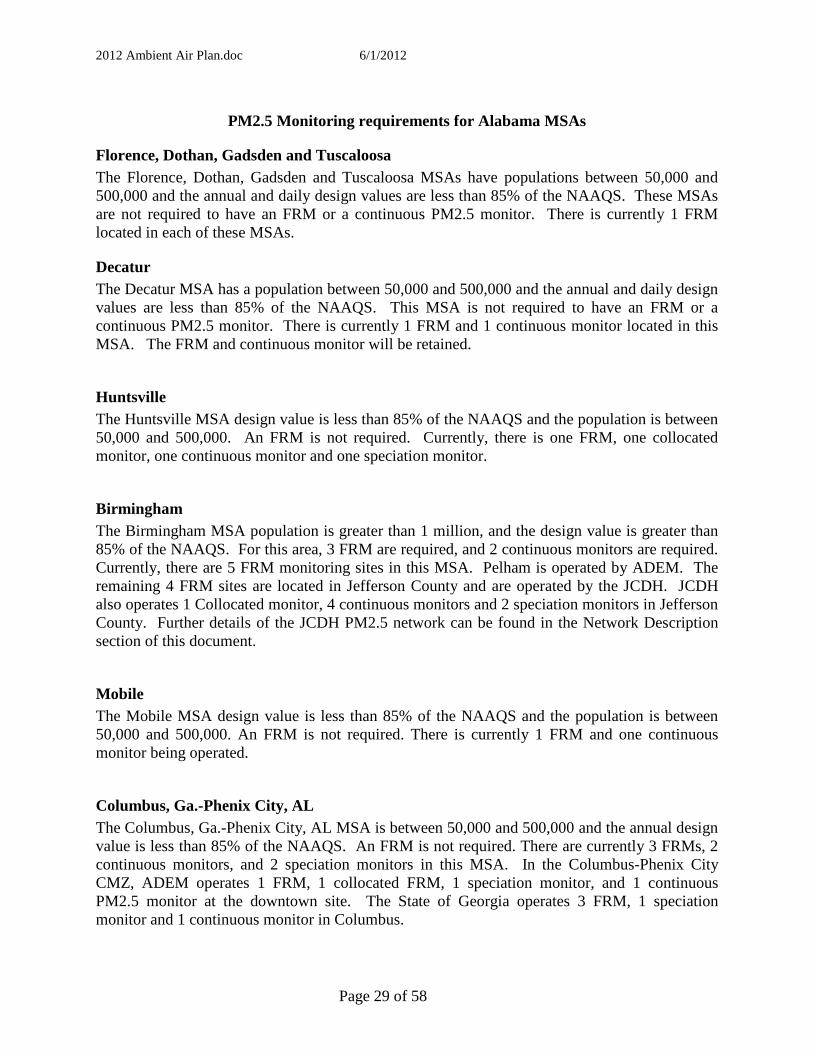
PM2.5 Monitoring requirements for Alabama MSAs
Florence, Dothan, Gadsden and Tuscaloosa The Florence, Dothan, Gadsden and Tuscaloosa MSAs have populations between 50,000 and 500,000 and the annual and daily design values are less than 85% of the NAAQS. These MSAs are not required to have an FRM or a continuous PM2.5 monitor. There is currently 1 FRM located in each of these MSAs.
Decatur The Decatur MSA has a population between 50,000 and 500,000 and the annual and daily design values are less than 85% of the NAAQS. This MSA is not required to have an FRM or a continuous PM2.5 monitor. There is currently 1 FRM and 1 continuous monitor located in this MSA. The FRM and continuous monitor will be retained.
Huntsville The Huntsville MSA design value is less than 85% of the NAAQS and the population is between 50,000 and 500,000. An FRM is not required. Currently, there is one FRM, one collocated monitor, one continuous monitor and one speciation monitor.
Birmingham The Birmingham MSA population is greater than 1 million, and the design value is greater than 85% of the NAAQS. For this area, 3 FRM are required, and 2 continuous monitors are required. Currently, there are 5 FRM monitoring sites in this MSA. Pelham is operated by ADEM. The remaining 4 FRM sites are located in Jefferson County and are operated by the JCDH. JCDH also operates 1 Collocated monitor, 4 continuous monitors and 2 speciation monitors in Jefferson County. Further details of the JCDH PM2.5 network can be found in the Network Description section of this document.
Mobile The Mobile MSA design value is less than 85% of the NAAQS and the population is between 50,000 and 500,000. An FRM is not required. There is currently 1 FRM and one continuous monitor being operated.
Columbus, Ga.-Phenix City, AL The Columbus, Ga.-Phenix City, AL MSA is between 50,000 and 500,000 and the annual design value is less than 85% of the NAAQS. An FRM is not required. There are currently 3 FRMs, 2 continuous monitors, and 2 speciation monitors in this MSA. In the Columbus-Phenix City CMZ, ADEM operates 1 FRM, 1 collocated FRM, 1 speciation monitor, and 1 continuous PM2.5 monitor at the downtown site. The State of Georgia operates 3 FRM, 1 speciation monitor and 1 continuous monitor in Columbus.
2012 Ambient Air Plan.doc 6/1/2012
Page 30 of 58
Montgomery The Montgomery MSA has a population between 50,000 and 500,000 and the design values are less than 85 % of the annual NAAQS. No FRM or continuous monitor is required to be operated in this MSA. There is currently 1 FRM, 1 collocated FRM and 1 continuous monitor operated by ADEM. In addition, ADEM operates a speciation monitor in Montgomery.
Auburn-Opelika and Anniston-Oxford In 1999 when the PM2.5 monitoring program was implemented in Alabama, the MSAs of Auburn and Anniston-Oxford were evaluated to determine the need for monitors. It was determined that due to the close proximity of PM2.5 monitors in neighboring areas, additional monitors would not be needed. This is a reflection of the fact that PM2.5 can be transported long distances and affects large regions. The monitors in the adjacent areas still provide adequate monitoring coverage. Since these areas do not have design values, no monitors are required by Appendix D of 40 CFR 58.
Monitors not located in MSAs ADEM operated a FRM in Sumter County but closed it in 2006. A continuous monitor in Sumter County was being operated as a rural background site in West Alabama until loss of the lease caused it to close. ADEM is in the process of securing a new site and plans to be operational again in 2012. Talladega County is a Micropolitan Statistical Area with a population of 81,664. It is adjacent to the Anniston-Oxford MSA and the Birmingham MSA. There is currently 1 FRM located in Childersburg. The design value for this monitor is less than 85% of the NAAQS. There is an FRM located in Ashland in Clay County to serve as a regional transport site in between the large MSAs of Birmingham and Atlanta. The design value for this monitor is less than 85% of the NAAQS. The Daphne-Fairhope Micropolitan Statistical Area is not required to operate an FRM. 1 FRM is being operated at Fairhope and has design values less than 85% of the NAAQS. Crossville has been a rural background site in northeast Alabama. The data from this site is less than 85% of the NAAQS. ADEM intends to maintain this site.
2012 Ambient Air Plan.doc 6/1/2012
Page 31 of 58
Quality Assurance Each of the three monitoring agencies have U.S. EPA approved Quality Assurance Program Plans that detail the activities used to control and document the quality of the data collected. Part of the EPA required quality control program for particulate monitors is the use of collocated particulate monitors. 40 CFR 58, appendix A requires a percentage of manual particulate monitors to be collocated with FRM monitors so that quality statistics can be calculated. Each agency network includes monitors for this purpose.
Monitoring Equipment Evaluation An evaluation of the condition of ambient monitors and auxiliary equipment was performed by each of the three monitoring agencies. The equipment was categorized as “good” or “poor”. As resources allow equipment in “poor” condition will be replaced.

2012 Ambient Air Plan.doc 6/1/2012
Page 32 of 58
NETWORK DESCRIPTIONS A description of the ambient air monitoring networks for each air pollution agency will be presented in this section.
2012 Ambient Air Plan.doc 6/1/2012
Page 33 of 58
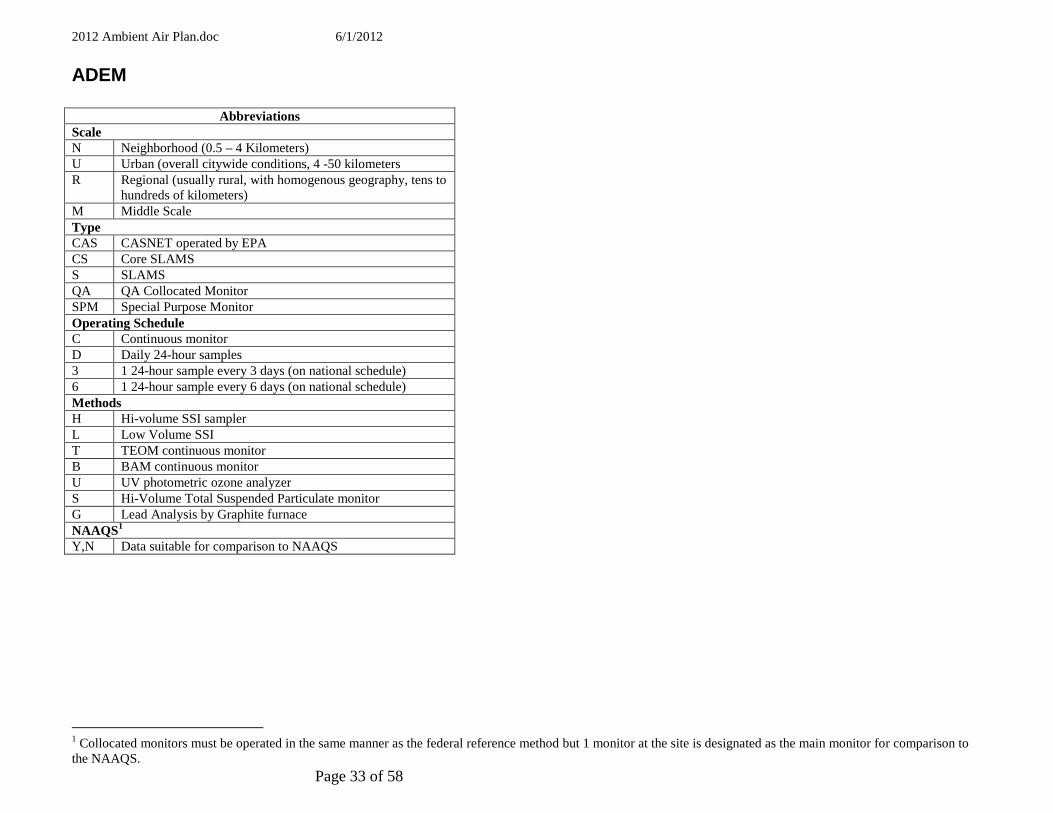
ADEM
Abbreviations Scale N Neighborhood (0.5 – 4 Kilometers) U Urban (overall citywide conditions, 4 -50 kilometers R Regional (usually rural, with homogenous geography, tens to
hundreds of kilometers) M Middle Scale Type CAS CASNET operated by EPA CS Core SLAMS S SLAMS QA QA Collocated Monitor SPM Special Purpose Monitor Operating Schedule C Continuous monitor D Daily 24-hour samples 3 1 24-hour sample every 3 days (on national schedule) 6 1 24-hour sample every 6 days (on national schedule) Methods H Hi-volume SSI sampler L Low Volume SSI T TEOM continuous monitor B BAM continuous monitor U UV photometric ozone analyzer S Hi-Volume Total Suspended Particulate monitor G Lead Analysis by Graphite furnace NAAQS1 Y,N Data suitable for comparison to NAAQS
1 Collocated monitors must be operated in the same manner as the federal reference method but 1 monitor at the site is designated as the main monitor for comparison to the NAAQS.
2012 Ambient Air Plan.doc 6/1/2012
Page 34 of 58
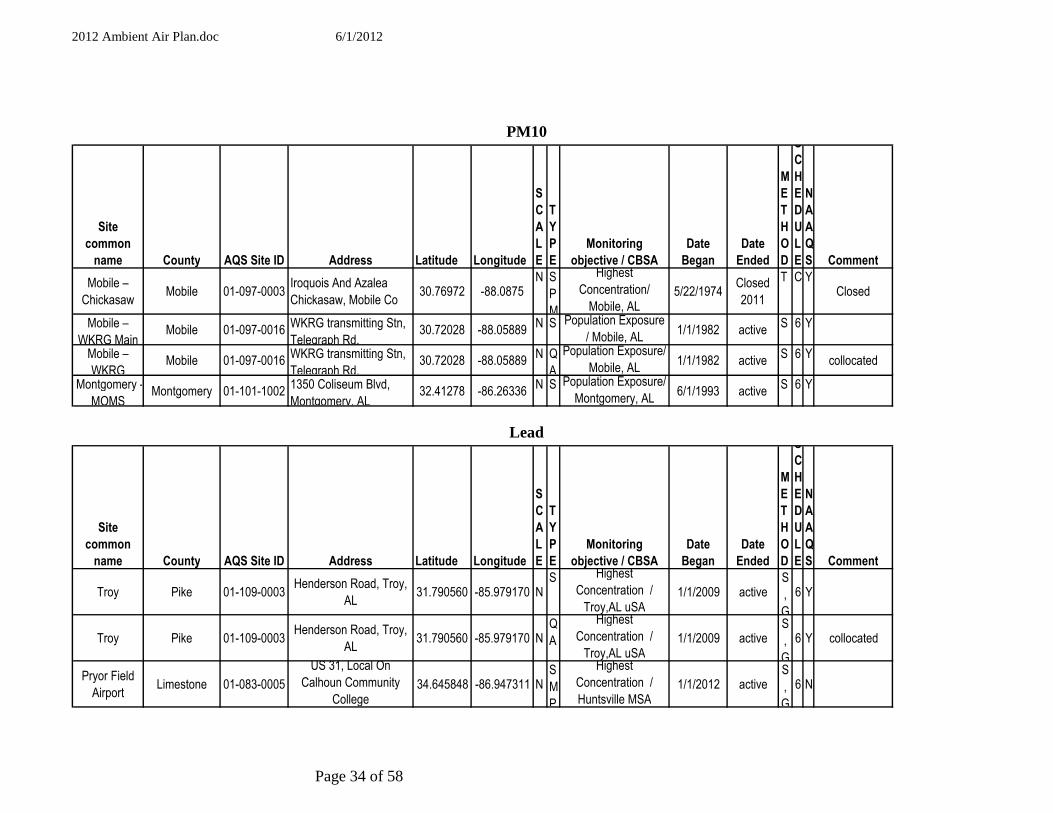
PM10
Site
common
name County AQS Site ID Address Latitude Longitude
S
C
A
L
E
T
Y
P
E
Monitoring
objective / CBSA
Date
Began
Date
Ended
M
E
T
H
O
D
S
C
H
E
D
U
L
E
N
A
A
Q
S Comment
Mobile –
ChickasawMobile 01-097-0003
Iroquois And Azalea
Chickasaw, Mobile Co30.76972 -88.0875
N S
P
M
Highest
Concentration/
Mobile, AL5/22/1974
Closed
2011
T C YClosed
Mobile –
WKRG MainMobile 01-097-0016
WKRG transmitting Stn,
Telegraph Rd. 30.72028 -88.05889
N S Population Exposure
/ Mobile, AL1/1/1982 active
S 6 Y
Mobile –
WKRG Mobile 01-097-0016
WKRG transmitting Stn,
Telegraph Rd.30.72028 -88.05889
N Q
A
Population Exposure/
Mobile, AL1/1/1982 active
S 6 Ycollocated
Montgomery -
MOMSMontgomery 01-101-1002
1350 Coliseum Blvd,
Montgomery, AL32.41278 -86.26336
N S Population Exposure/
Montgomery, AL6/1/1993 active
S 6 Y
Lead
Site
common
name County AQS Site ID Address Latitude Longitude
S
C
A
L
E
T
Y
P
E
Monitoring
objective / CBSA
Date
Began
Date
Ended
M
E
T
H
O
D
S
C
H
E
D
U
L
E
N
A
A
Q
S Comment
Troy Pike 01-109-0003Henderson Road, Troy,
AL31.790560 -85.979170 N
S Highest
Concentration /
Troy,AL uSA1/1/2009 active
S
,
G
6 Y
Troy Pike 01-109-0003Henderson Road, Troy,
AL31.790560 -85.979170 N
Q
A
Highest
Concentration /
Troy,AL uSA1/1/2009 active
S
,
G
6 Y collocated
Pryor Field
AirportLimestone 01-083-0005
US 31, Local On
Calhoun Community
College34.645848 -86.947311 N
S
M
P
Highest
Concentration /
Huntsville MSA1/1/2012 active
S
,
G
6 N
2012 Ambient Air Plan.doc 6/1/2012
Page 35 of 58
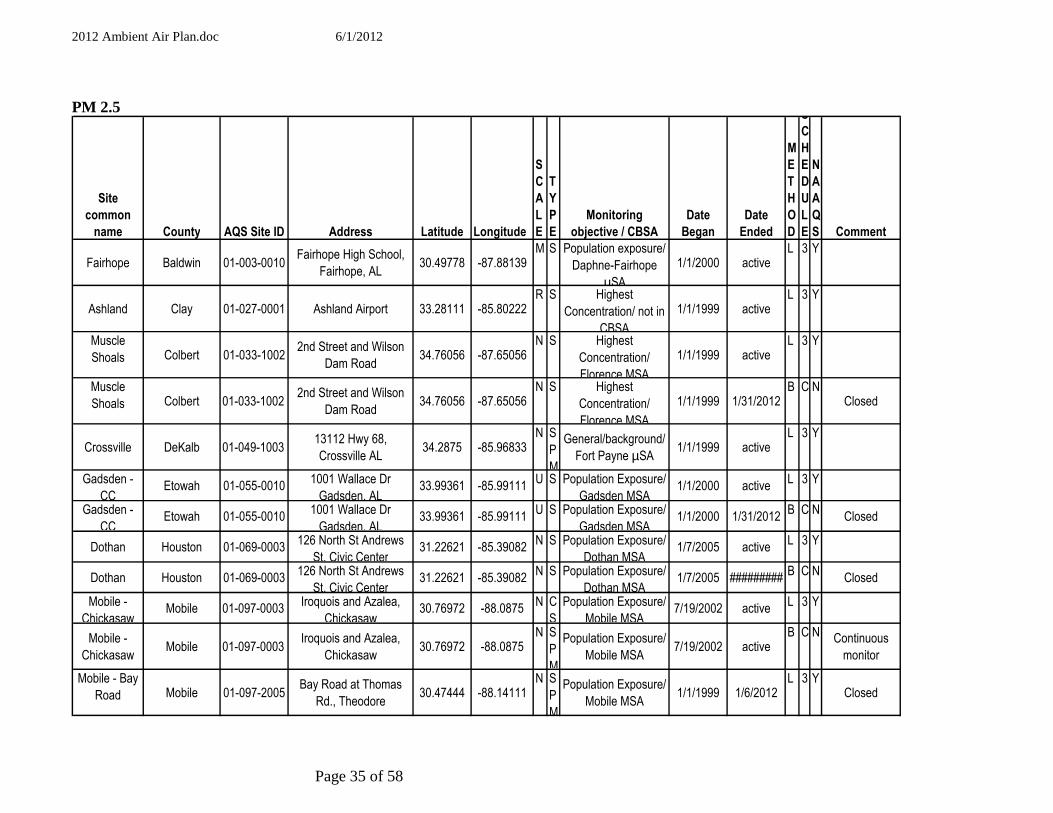
PM 2.5
Site
common
name County AQS Site ID Address Latitude Longitude
S
C
A
L
E
T
Y
P
E
Monitoring
objective / CBSA
Date
Began
Date
Ended
M
E
T
H
O
D
S
C
H
E
D
U
L
E
N
A
A
Q
S Comment
Fairhope Baldwin 01-003-0010Fairhope High School,
Fairhope, AL30.49778 -87.88139
M S Population exposure/
Daphne-Fairhope
µSA
1/1/2000 activeL 3 Y
Ashland Clay 01-027-0001 Ashland Airport 33.28111 -85.80222R S Highest
Concentration/ not in
CBSA
1/1/1999 activeL 3 Y
Muscle
Shoals Colbert 01-033-10022nd Street and Wilson
Dam Road34.76056 -87.65056
N S Highest
Concentration/
Florence MSA
1/1/1999 activeL 3 Y
Muscle
Shoals Colbert 01-033-10022nd Street and Wilson
Dam Road34.76056 -87.65056
N S Highest
Concentration/
Florence MSA
1/1/1999 1/31/2012B C N
Closed
Crossville DeKalb 01-049-100313112 Hwy 68,
Crossville AL34.2875 -85.96833
N S
P
M
General/background/
Fort Payne µSA1/1/1999 active
L 3 Y
Gadsden -
CCEtowah 01-055-0010
1001 Wallace Dr
Gadsden, AL33.99361 -85.99111
U S Population Exposure/
Gadsden MSA1/1/2000 active
L 3 Y
Gadsden -
CCEtowah 01-055-0010
1001 Wallace Dr
Gadsden, AL33.99361 -85.99111
U S Population Exposure/
Gadsden MSA1/1/2000 1/31/2012
B C NClosed
Dothan Houston 01-069-0003126 North St Andrews
St. Civic Center31.22621 -85.39082
N S Population Exposure/
Dothan MSA1/7/2005 active
L 3 Y
Dothan Houston 01-069-0003126 North St Andrews
St. Civic Center31.22621 -85.39082
N S Population Exposure/
Dothan MSA1/7/2005 #########
B C NClosed
Mobile -
ChickasawMobile 01-097-0003
Iroquois and Azalea,
Chickasaw 30.76972 -88.0875
N C
S
Population Exposure/
Mobile MSA7/19/2002 active
L 3 Y
Mobile -
ChickasawMobile 01-097-0003
Iroquois and Azalea,
Chickasaw30.76972 -88.0875
N S
P
M
Population Exposure/
Mobile MSA7/19/2002 active
B C N Continuous
monitor
Mobile - Bay
Road Mobile 01-097-2005Bay Road at Thomas
Rd., Theodore30.47444 -88.14111
N S
P
M
Population Exposure/
Mobile MSA1/1/1999 1/6/2012
L 3 YClosed
2012 Ambient Air Plan.doc 6/1/2012
Page 36 of 58
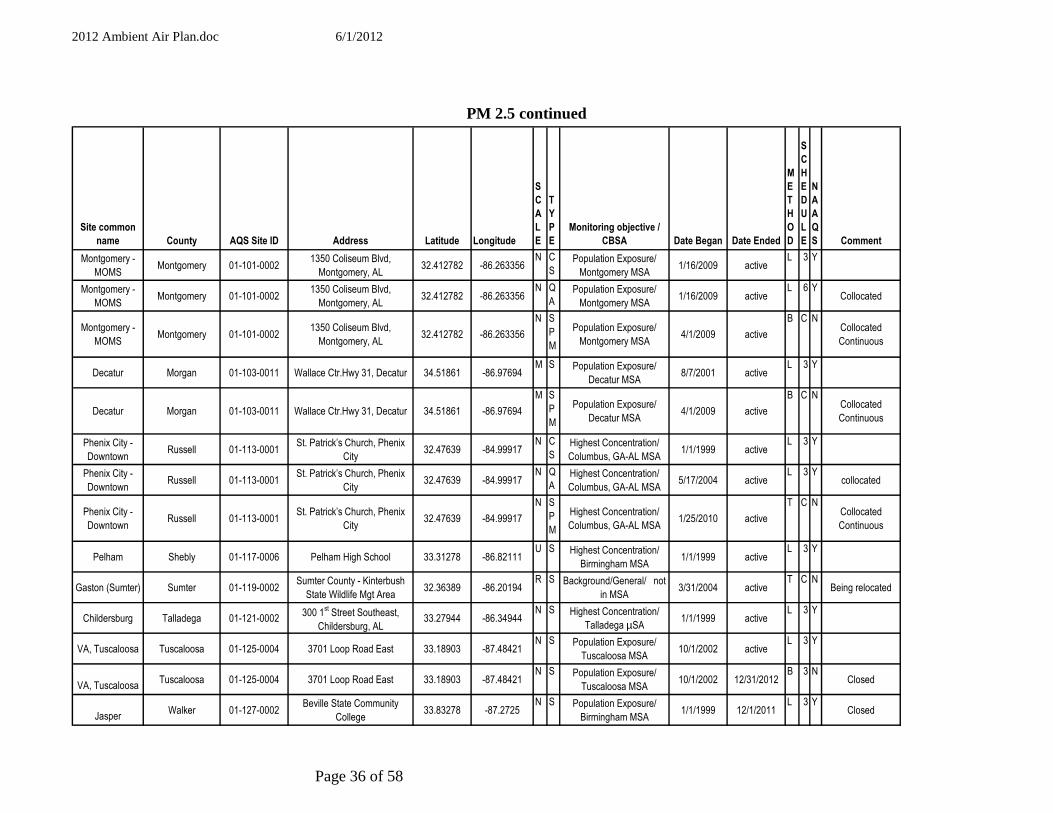
PM 2.5 continued
Site common
name County AQS Site ID Address Latitude Longitude
S
C
A
L
E
T
Y
P
E
Monitoring objective /
CBSA Date Began Date Ended
M
E
T
H
O
D
S
C
H
E
D
U
L
E
N
A
A
Q
S Comment
Montgomery -
MOMSMontgomery 01-101-0002
1350 Coliseum Blvd,
Montgomery, AL32.412782 -86.263356
N C
SPopulation Exposure/
Montgomery MSA1/16/2009 active
L 3 Y
Montgomery -
MOMSMontgomery 01-101-0002
1350 Coliseum Blvd,
Montgomery, AL32.412782 -86.263356
N Q
APopulation Exposure/
Montgomery MSA1/16/2009 active
L 6 YCollocated
Montgomery -
MOMSMontgomery 01-101-0002
1350 Coliseum Blvd,
Montgomery, AL32.412782 -86.263356
N S
P
M
Population Exposure/
Montgomery MSA4/1/2009 active
B C NCollocated
Continuous
Decatur Morgan 01-103-0011 Wallace Ctr.Hwy 31, Decatur 34.51861 -86.97694M S Population Exposure/
Decatur MSA8/7/2001 active
L 3 Y
Decatur Morgan 01-103-0011 Wallace Ctr.Hwy 31, Decatur 34.51861 -86.97694
M S
P
M
Population Exposure/
Decatur MSA4/1/2009 active
B C NCollocated
Continuous
Phenix City -
DowntownRussell 01-113-0001
St. Patrick’s Church, Phenix
City32.47639 -84.99917
N C
SHighest Concentration/
Columbus, GA-AL MSA1/1/1999 active
L 3 Y
Phenix City -
DowntownRussell 01-113-0001
St. Patrick’s Church, Phenix
City32.47639 -84.99917
N Q
AHighest Concentration/
Columbus, GA-AL MSA5/17/2004 active
L 3 Ycollocated
Phenix City -
DowntownRussell 01-113-0001
St. Patrick’s Church, Phenix
City32.47639 -84.99917
N S
P
M
Highest Concentration/
Columbus, GA-AL MSA1/25/2010 active
T C NCollocated
Continuous
Pelham Shebly 01-117-0006 Pelham High School 33.31278 -86.82111U S Highest Concentration/
Birmingham MSA1/1/1999 active
L 3 Y
Gaston (Sumter) Sumter 01-119-0002Sumter County - Kinterbush
State Wildlife Mgt Area32.36389 -86.20194
R S Background/General/ not
in MSA3/31/2004 active
T C NBeing relocated
Childersburg Talladega 01-121-0002300 1
st Street Southeast,
Childersburg, AL33.27944 -86.34944
N S Highest Concentration/
Talladega µSA1/1/1999 active
L 3 Y
VA, Tuscaloosa Tuscaloosa 01-125-0004 3701 Loop Road East 33.18903 -87.48421N S Population Exposure/
Tuscaloosa MSA10/1/2002 active
L 3 Y
VA, TuscaloosaTuscaloosa 01-125-0004 3701 Loop Road East 33.18903 -87.48421
N S Population Exposure/
Tuscaloosa MSA10/1/2002 12/31/2012
B 3 NClosed
JasperWalker 01-127-0002
Beville State Community
College33.83278 -87.2725
N S Population Exposure/
Birmingham MSA1/1/1999 12/1/2011
L 3 YClosed
2012 Ambient Air Plan.doc 6/1/2012
Page 37 of 58
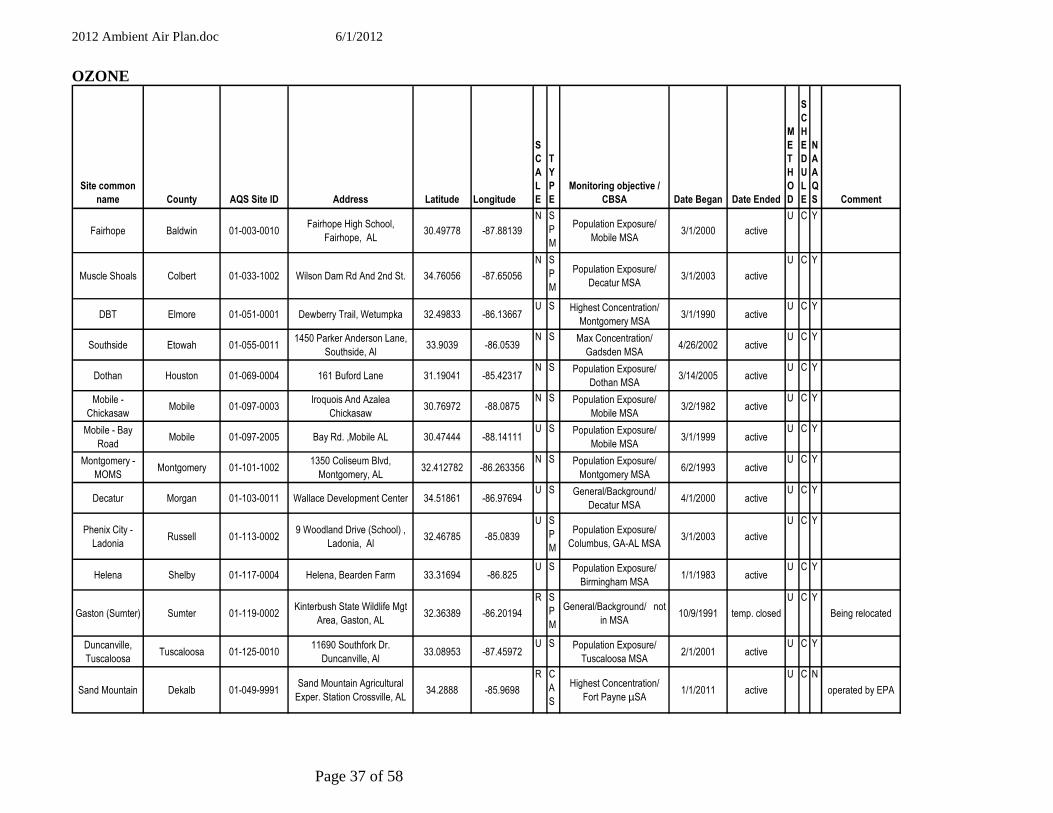
OZONE
Site common
name County AQS Site ID Address Latitude Longitude
S
C
A
L
E
T
Y
P
E
Monitoring objective /
CBSA Date Began Date Ended
M
E
T
H
O
D
S
C
H
E
D
U
L
E
N
A
A
Q
S Comment
Fairhope Baldwin 01-003-0010Fairhope High School,
Fairhope, AL30.49778 -87.88139
N S
P
M
Population Exposure/
Mobile MSA3/1/2000 active
U C Y
Muscle Shoals Colbert 01-033-1002 Wilson Dam Rd And 2nd St. 34.76056 -87.65056
N S
P
M
Population Exposure/
Decatur MSA3/1/2003 active
U C Y
DBT Elmore 01-051-0001 Dewberry Trail, Wetumpka 32.49833 -86.13667U S Highest Concentration/
Montgomery MSA3/1/1990 active
U C Y
Southside Etowah 01-055-00111450 Parker Anderson Lane,
Southside, Al33.9039 -86.0539
N S Max Concentration/
Gadsden MSA4/26/2002 active
U C Y
Dothan Houston 01-069-0004 161 Buford Lane 31.19041 -85.42317N S Population Exposure/
Dothan MSA3/14/2005 active
U C Y
Mobile -
ChickasawMobile 01-097-0003
Iroquois And Azalea
Chickasaw30.76972 -88.0875
N S Population Exposure/
Mobile MSA3/2/1982 active
U C Y
Mobile - Bay
RoadMobile 01-097-2005 Bay Rd. ,Mobile AL 30.47444 -88.14111
U S Population Exposure/
Mobile MSA3/1/1999 active
U C Y
Montgomery -
MOMSMontgomery 01-101-1002
1350 Coliseum Blvd,
Montgomery, AL32.412782 -86.263356
N S Population Exposure/
Montgomery MSA6/2/1993 active
U C Y
Decatur Morgan 01-103-0011 Wallace Development Center 34.51861 -86.97694U S General/Background/
Decatur MSA4/1/2000 active
U C Y
Phenix City -
LadoniaRussell 01-113-0002
9 Woodland Drive (School) ,
Ladonia, Al 32.46785 -85.0839
U S
P
M
Population Exposure/
Columbus, GA-AL MSA3/1/2003 active
U C Y
Helena Shelby 01-117-0004 Helena, Bearden Farm 33.31694 -86.825U S Population Exposure/
Birmingham MSA1/1/1983 active
U C Y
Gaston (Sumter) Sumter 01-119-0002Kinterbush State Wildlife Mgt
Area, Gaston, AL32.36389 -86.20194
R S
P
M
General/Background/ not
in MSA10/9/1991 temp. closed
U C Y
Being relocated
Duncanville,
TuscaloosaTuscaloosa 01-125-0010
11690 Southfork Dr.
Duncanville, Al 33.08953 -87.45972
U S Population Exposure/
Tuscaloosa MSA2/1/2001 active
U C Y
Sand Mountain Dekalb 01-049-9991Sand Mountain Agricultural
Exper. Station Crossville, AL34.2888 -85.9698
R C
A
S
Highest Concentration/
Fort Payne µSA1/1/2011 active
U C N
operated by EPA
2012 Ambient Air Plan.doc 6/1/2012
Page 38 of 58
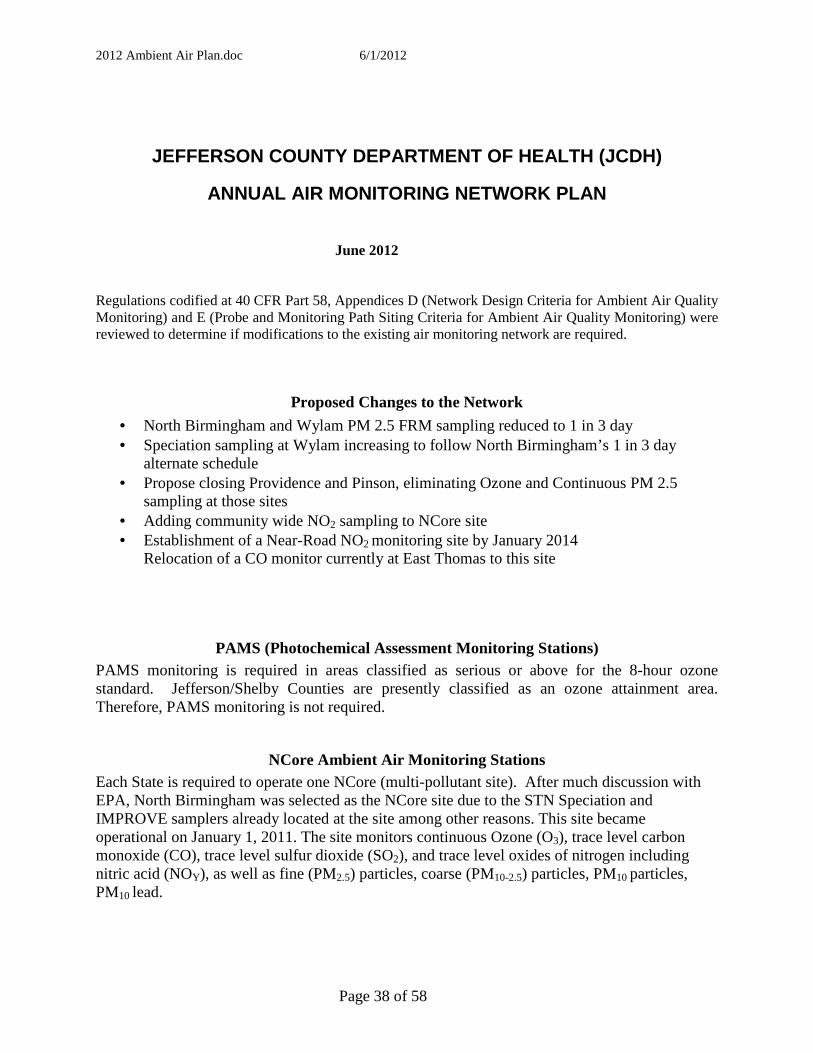
JEFFERSON COUNTY DEPARTMENT OF HEALTH (JCDH)
ANNUAL AIR MONITORING NETWORK PLAN
June 2012
Regulations codified at 40 CFR Part 58, Appendices D (Network Design Criteria for Ambient Air Quality Monitoring) and E (Probe and Monitoring Path Siting Criteria for Ambient Air Quality Monitoring) were reviewed to determine if modifications to the existing air monitoring network are required.
Proposed Changes to the Network
• North Birmingham and Wylam PM 2.5 FRM sampling reduced to 1 in 3 day • Speciation sampling at Wylam increasing to follow North Birmingham’s 1 in 3 day
alternate schedule • Propose closing Providence and Pinson, eliminating Ozone and Continuous PM 2.5
sampling at those sites • Adding community wide NO2 sampling to NCore site • Establishment of a Near-Road NO2 monitoring site by January 2014
Relocation of a CO monitor currently at East Thomas to this site
PAMS (Photochemical Assessment Monitoring Stations) PAMS monitoring is required in areas classified as serious or above for the 8-hour ozone standard. Jefferson/Shelby Counties are presently classified as an ozone attainment area. Therefore, PAMS monitoring is not required.
NCore Ambient Air Monitoring Stations Each State is required to operate one NCore (multi-pollutant site). After much discussion with EPA, North Birmingham was selected as the NCore site due to the STN Speciation and IMPROVE samplers already located at the site among other reasons. This site became operational on January 1, 2011. The site monitors continuous Ozone (O3), trace level carbon monoxide (CO), trace level sulfur dioxide (SO2), and trace level oxides of nitrogen including nitric acid (NOY), as well as fine (PM2.5) particles, coarse (PM10-2.5) particles, PM10 particles, PM10 lead.
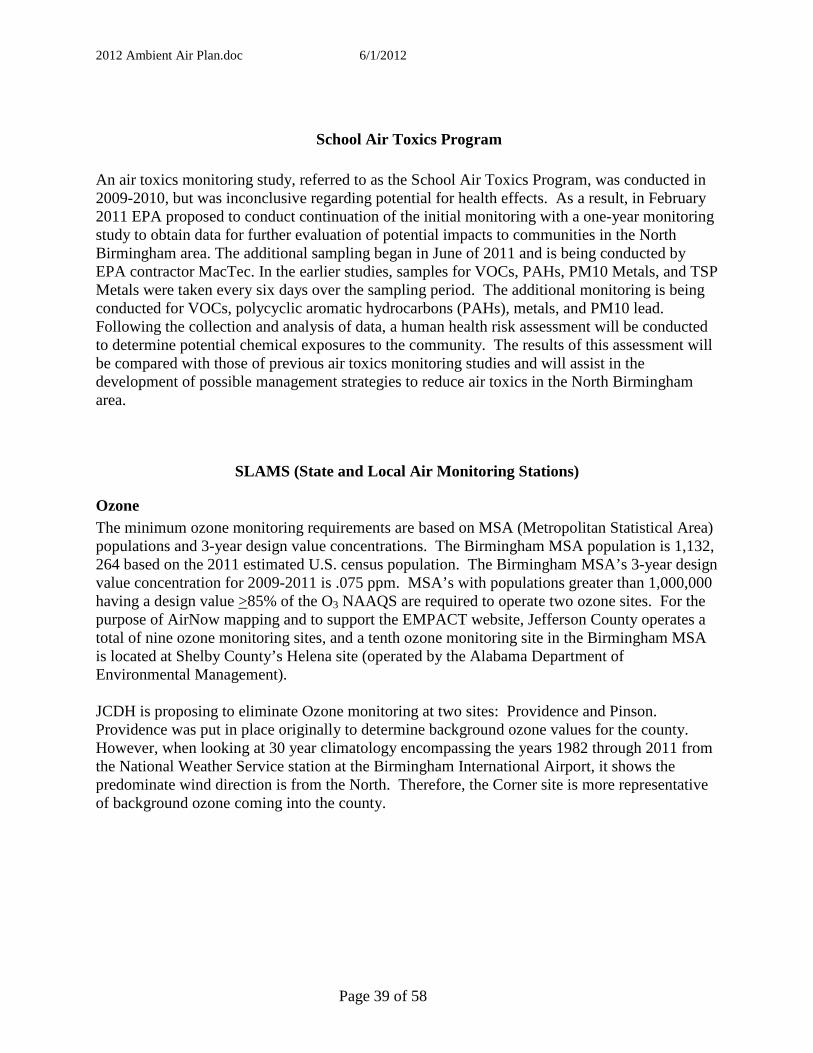
2012 Ambient Air Plan.doc 6/1/2012
Page 39 of 58
School Air Toxics Program An air toxics monitoring study, referred to as the School Air Toxics Program, was conducted in 2009-2010, but was inconclusive regarding potential for health effects. As a result, in February 2011 EPA proposed to conduct continuation of the initial monitoring with a one-year monitoring study to obtain data for further evaluation of potential impacts to communities in the North Birmingham area. The additional sampling began in June of 2011 and is being conducted by EPA contractor MacTec. In the earlier studies, samples for VOCs, PAHs, PM10 Metals, and TSP Metals were taken every six days over the sampling period. The additional monitoring is being conducted for VOCs, polycyclic aromatic hydrocarbons (PAHs), metals, and PM10 lead. Following the collection and analysis of data, a human health risk assessment will be conducted to determine potential chemical exposures to the community. The results of this assessment will be compared with those of previous air toxics monitoring studies and will assist in the development of possible management strategies to reduce air toxics in the North Birmingham area.
SLAMS (State and Local Air Monitoring Stations)
Ozone The minimum ozone monitoring requirements are based on MSA (Metropolitan Statistical Area) populations and 3-year design value concentrations. The Birmingham MSA population is 1,132, 264 based on the 2011 estimated U.S. census population. The Birmingham MSA’s 3-year design value concentration for 2009-2011 is .075 ppm. MSA’s with populations greater than 1,000,000 having a design value >85% of the O3 NAAQS are required to operate two ozone sites. For the purpose of AirNow mapping and to support the EMPACT website, Jefferson County operates a total of nine ozone monitoring sites, and a tenth ozone monitoring site in the Birmingham MSA is located at Shelby County’s Helena site (operated by the Alabama Department of Environmental Management). JCDH is proposing to eliminate Ozone monitoring at two sites: Providence and Pinson. Providence was put in place originally to determine background ozone values for the county. However, when looking at 30 year climatology encompassing the years 1982 through 2011 from the National Weather Service station at the Birmingham International Airport, it shows the predominate wind direction is from the North. Therefore, the Corner site is more representative of background ozone coming into the county.
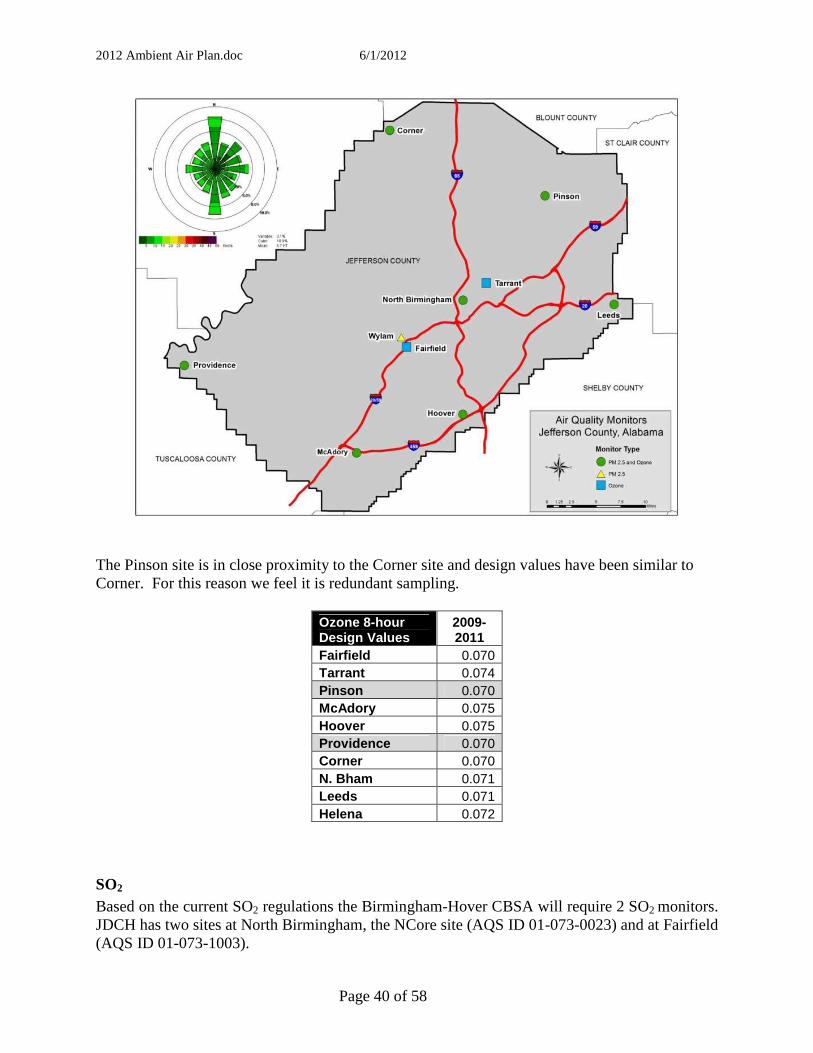
2012 Ambient Air Plan.doc 6/1/2012
Page 40 of 58
The Pinson site is in close proximity to the Corner site and design values have been similar to Corner. For this reason we feel it is redundant sampling.
Ozone 8-hour Design Values
2009-2011
Fairfield 0.070 Tarrant 0.074 Pinson 0.070 McAdory 0.075 Hoover 0.075 Providence 0.070 Corner 0.070 N. Bham 0.071 Leeds 0.071 Helena 0.072
SO2
Based on the current SO2 regulations the Birmingham-Hover CBSA will require 2 SO2 monitors. JDCH has two sites at North Birmingham, the NCore site (AQS ID 01-073-0023) and at Fairfield (AQS ID 01-073-1003).
2012 Ambient Air Plan.doc 6/1/2012
Page 41 of 58
CO Jefferson County operates four CO monitors even though concentrations continue to be low. One CO monitor will be required to operate collocated with the one required near-road NO2 monitor by January 1, 2014. Jefferson County plans once this is established to relocate the CO monitor currently at East Thomas (AQS ID 01-073-0028) to this new site to meet the new monitoring requirements.
NO2 A revised NAAQS for Nitrogen Dioxide was promulgated in February 2010. In this rule, EPA required changes to the monitoring network that will focus monitoring resources to capture short-term NO2 concentrations near heavily trafficked roads, to assess area-wide (or community-wide) NO2 concentrations, and to assess NO2 concentrations for vulnerable and susceptible populations. Jefferson County will be required to have two NO2 monitors, one to address community-wide NO2 and one to address near road concentrations. The community-wide monitor will be located at the North Birmingham NCore site. The establishment of a permanent near-road NO2 monitoring site will meet design and siting criteria as spelled out in 40 CFR Part 58. Even though funding has not been issued for this monitoring, Jefferson County’s meteorologist and engineers are currently researching appropriate sites using the technical assistance document and should have several sites identified by mid-summer. NOy monitoring began at the NCore site January 1, 2011.
Lead According to the new lead regulations, sources emitting a half ton or more of lead per year would be candidates for lead ambient air monitoring. There are no longer any significant point sources of lead emissions greater than the half ton threshold in Jefferson County. Therefore, based on past monitoring and 2010 emissions inventory data, a lead source monitoring site is not required. Pb monitoring is required at any NCore site in each CBSA with a population equal to or greater than 500,000 people. Lead PM10 monitoring is occuring at the NCORE (North Birmingham AQS ID 01-073-0023) site and has been collecting data since 12-29-2011.
PM10 Based on MSA’s with populations greater than 1,000,000 and high concentrations (greater than 80 percent of PM10 NAAQS), Jefferson County is required to operate between 6 and 10 sites. Jefferson County operates nine PM10 sites located in the main industrial valley. These monitors can be operated at very low cost and provide good spatial coverage within the county. Experience has shown that members of the public want ambient air monitoring to be performed in their part of the county, and the PM10 monitoring sites provide a monitoring presence at relatively low cost. Furthermore, the PM10 data provide an indirect indication of PM2.5 spatial variability at a tiny fraction of the cost of operating additional PM2.5 sites. Four of the PM10 sites have continuous PM10 monitors and are collocated with manual PM10 monitors which run every six days for quality assurance purposes.

2012 Ambient Air Plan.doc 6/1/2012
Page 42 of 58
PM2.5 The minimum PM2.5 monitoring requirements are based on MSA populations and 3-year design value concentrations. Birmingham MSA’s 3-year annual design value concentration for 2009-2011 is 12.9 µg/m3. MSA’s with populations greater than 1,000,000 having a design value ≥ 85% of the PM2.5 NAAQS are required to operate three PM2.5 sites. Although Jefferson County is only required to operate three PM2.5 monitoring sites, four PM2.5 monitoring sites are actually operated. Three sites (North Birmingham, Wylam and McAdory) operate on a 1 in 3 day schedule. The Leeds site operates on a 1 in 6 day schedule. While the North Birmingham site is the only required collocated site for manual PM2.5, all four of the manual PM2.5 monitoring sites are collocated on a 1 in 6 day schedule. Also ADEM operates at site in Shelby county (Pelham).
Continuous PM2.5 SPM (Special Purpose Monitors) Continuous PM2.5 monitoring is required in relation to the minimum SLAMS monitoring requirement stated above; i.e., equal to at least one-half (round up) the minimum monitoring requirement. Jefferson County is required to operate two continuous PM2.5 monitors. However, eight continuous PM2.5 monitors are actually operated in Jefferson County for the purpose of AirNow mapping and to support our EMPACT website. Continuous PM2.5 monitors are collocated with manual PM2.5 monitors for quality assurance purposes. Due to budget constraints, Jefferson County is proposing to eliminate the Pinson and Providence sites. This will leave 6 remaining sites to support the AirNow and EMPACT websites. Eliminating these two sites will allow us to focus resources on new monitoring efforts at NCore and the up-coming NO2 near road monitoring.
Manual PM2.5 STN Speciation Monitors and Supplemental Speciation Based on current and past trends in metal speciation, Jefferson County is proposing to increase speciation sampling at the Wylam site from a 1 in 6 day sampling frequency to a 1 in 3 day alternate schedule. This coincides with North Birmingham’s speciation sampling schedule. The increased sampling will allow the Air and Radiation Protection Division to have comparable data sets from both sites and enable better assessments of current and future trends.
Network Review Findings The existing network as summarized in the attached Air Monitoring Network Description complies with 40 CFR Part 58 requirements. The described network should adequately characterize typical population exposure concentrations and compliance status with the NAAQS for pollutants of concern. The monitoring site location map can be found in appendix A.
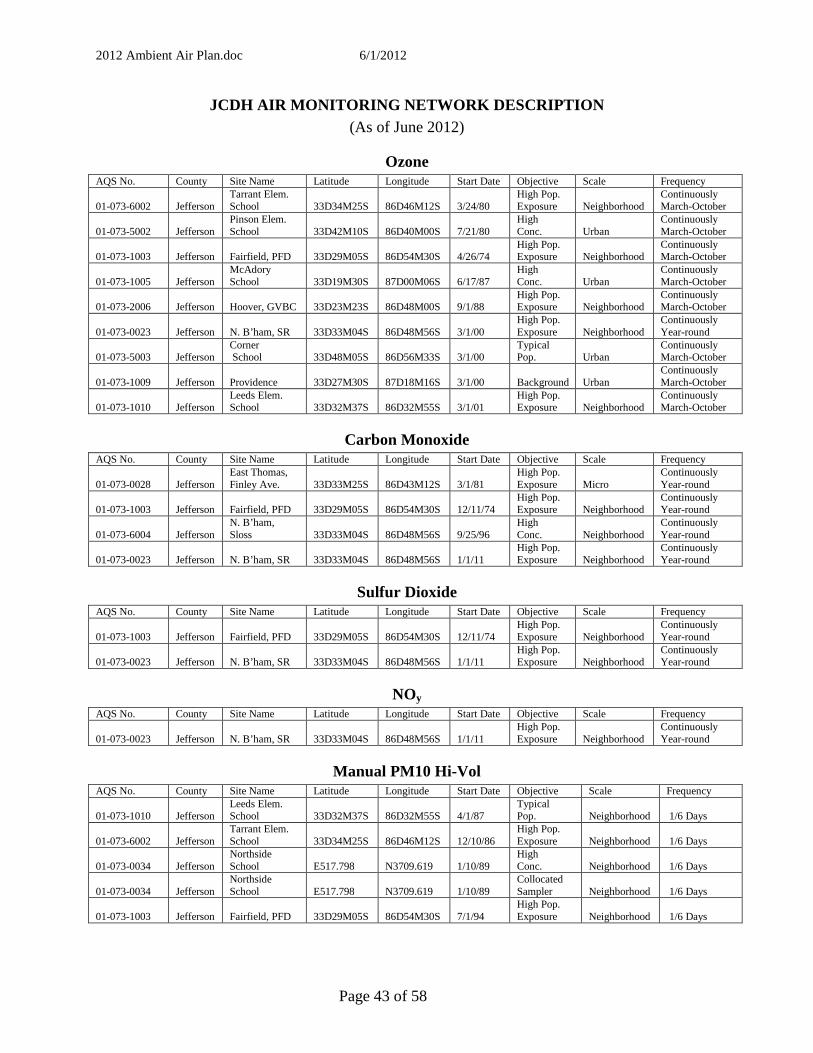
2012 Ambient Air Plan.doc 6/1/2012
Page 43 of 58
JCDH AIR MONITORING NETWORK DESCRIPTION (As of June 2012)
Ozone AQS No. County Site Name Latitude Longitude Start Date Objective Scale Frequency 01-073-6002
Jefferson
Tarrant Elem. School
33D34M25S
86D46M12S
3/24/80
High Pop. Exposure
Neighborhood
Continuously March-October
01-073-5002
Jefferson
Pinson Elem. School
33D42M10S
86D40M00S
7/21/80
High Conc.
Urban
Continuously March-October
01-073-1003
Jefferson
Fairfield, PFD
33D29M05S
86D54M30S
4/26/74
High Pop. Exposure
Neighborhood
Continuously March-October
01-073-1005
Jefferson
McAdory School
33D19M30S
87D00M06S
6/17/87
High Conc.
Urban
Continuously March-October
01-073-2006
Jefferson
Hoover, GVBC
33D23M23S
86D48M00S
9/1/88
High Pop. Exposure
Neighborhood
Continuously March-October
01-073-0023
Jefferson
N. B’ham, SR
33D33M04S
86D48M56S
3/1/00
High Pop. Exposure
Neighborhood
Continuously Year-round
01-073-5003
Jefferson
Corner School
33D48M05S
86D56M33S
3/1/00
Typical Pop.
Urban
Continuously March-October
01-073-1009
Jefferson
Providence
33D27M30S
87D18M16S
3/1/00
Background
Urban
Continuously March-October
01-073-1010
Jefferson
Leeds Elem. School
33D32M37S
86D32M55S
3/1/01
High Pop. Exposure
Neighborhood
Continuously March-October
Carbon Monoxide AQS No. County Site Name Latitude Longitude Start Date Objective Scale Frequency 01-073-0028
Jefferson
East Thomas, Finley Ave.
33D33M25S
86D43M12S
3/1/81
High Pop. Exposure
Micro
Continuously Year-round
01-073-1003
Jefferson
Fairfield, PFD
33D29M05S
86D54M30S
12/11/74
High Pop. Exposure
Neighborhood
Continuously Year-round
01-073-6004
Jefferson
N. B’ham, Sloss
33D33M04S
86D48M56S
9/25/96
High Conc.
Neighborhood
Continuously Year-round
01-073-0023
Jefferson
N. B’ham, SR
33D33M04S
86D48M56S
1/1/11
High Pop. Exposure
Neighborhood
Continuously Year-round
Sulfur Dioxide AQS No. County Site Name Latitude Longitude Start Date Objective Scale Frequency 01-073-1003
Jefferson
Fairfield, PFD
33D29M05S
86D54M30S
12/11/74
High Pop. Exposure
Neighborhood
Continuously Year-round
01-073-0023
Jefferson
N. B’ham, SR
33D33M04S
86D48M56S
1/1/11
High Pop. Exposure
Neighborhood
Continuously Year-round
NOy AQS No. County Site Name Latitude Longitude Start Date Objective Scale Frequency 01-073-0023
Jefferson
N. B’ham, SR
33D33M04S
86D48M56S
1/1/11
High Pop. Exposure
Neighborhood
Continuously Year-round
Manual PM10 Hi-Vol AQS No. County Site Name Latitude Longitude Start Date Objective Scale Frequency 01-073-1010
Jefferson
Leeds Elem. School
33D32M37S
86D32M55S
4/1/87
Typical Pop.
Neighborhood
1/6 Days
01-073-6002
Jefferson
Tarrant Elem. School
33D34M25S
86D46M12S
12/10/86
High Pop. Exposure
Neighborhood
1/6 Days
01-073-0034
Jefferson
Northside School
E517.798
N3709.619
1/10/89
High Conc.
Neighborhood
1/6 Days
01-073-0034
Jefferson
Northside School
E517.798
N3709.619
1/10/89
Collocated Sampler
Neighborhood
1/6 Days
01-073-1003
Jefferson
Fairfield, PFD
33D29M05S
86D54M30S
7/1/94
High Pop. Exposure
Neighborhood
1/6 Days
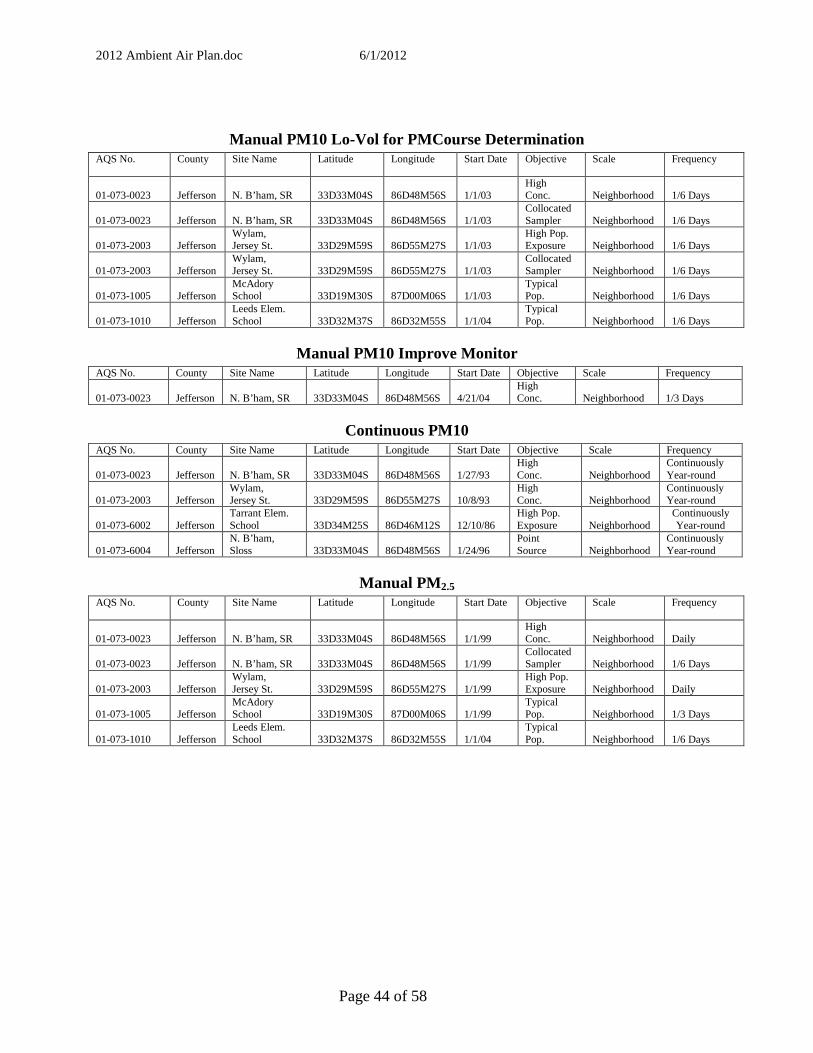
2012 Ambient Air Plan.doc 6/1/2012
Page 44 of 58
Manual PM10 Lo-Vol for PMCourse Determination AQS No. County Site Name Latitude Longitude Start Date Objective Scale Frequency
01-073-0023
Jefferson
N. B’ham, SR
33D33M04S
86D48M56S
1/1/03
High Conc.
Neighborhood
1/6 Days
01-073-0023
Jefferson
N. B’ham, SR
33D33M04S
86D48M56S
1/1/03
Collocated Sampler
Neighborhood
1/6 Days
01-073-2003
Jefferson
Wylam, Jersey St.
33D29M59S
86D55M27S
1/1/03
High Pop. Exposure
Neighborhood
1/6 Days
01-073-2003
Jefferson
Wylam, Jersey St.
33D29M59S
86D55M27S
1/1/03
Collocated Sampler
Neighborhood
1/6 Days
01-073-1005
Jefferson
McAdory School
33D19M30S
87D00M06S
1/1/03
Typical Pop.
Neighborhood
1/6 Days
01-073-1010
Jefferson
Leeds Elem. School
33D32M37S
86D32M55S
1/1/04
Typical Pop.
Neighborhood
1/6 Days
Manual PM10 Improve Monitor AQS No. County Site Name Latitude Longitude Start Date Objective Scale Frequency 01-073-0023
Jefferson
N. B’ham, SR
33D33M04S
86D48M56S
4/21/04
High Conc.
Neighborhood
1/3 Days
Continuous PM10 AQS No. County Site Name Latitude Longitude Start Date Objective Scale Frequency 01-073-0023
Jefferson
N. B’ham, SR
33D33M04S
86D48M56S
1/27/93
High Conc.
Neighborhood
Continuously Year-round
01-073-2003
Jefferson
Wylam, Jersey St.
33D29M59S
86D55M27S
10/8/93
High Conc.
Neighborhood
Continuously Year-round
01-073-6002
Jefferson
Tarrant Elem. School
33D34M25S
86D46M12S
12/10/86
High Pop. Exposure
Neighborhood
Continuously Year-round
01-073-6004
Jefferson
N. B’ham, Sloss
33D33M04S
86D48M56S
1/24/96
Point Source
Neighborhood
Continuously Year-round
Manual PM2.5 AQS No. County Site Name Latitude Longitude Start Date Objective Scale Frequency
01-073-0023
Jefferson
N. B’ham, SR
33D33M04S
86D48M56S
1/1/99
High Conc.
Neighborhood
Daily
01-073-0023
Jefferson
N. B’ham, SR
33D33M04S
86D48M56S
1/1/99
Collocated Sampler
Neighborhood
1/6 Days
01-073-2003
Jefferson
Wylam, Jersey St.
33D29M59S
86D55M27S
1/1/99
High Pop. Exposure
Neighborhood
Daily
01-073-1005
Jefferson
McAdory School
33D19M30S
87D00M06S
1/1/99
Typical Pop.
Neighborhood
1/3 Days
01-073-1010
Jefferson
Leeds Elem. School
33D32M37S
86D32M55S
1/1/04
Typical Pop.
Neighborhood
1/6 Days
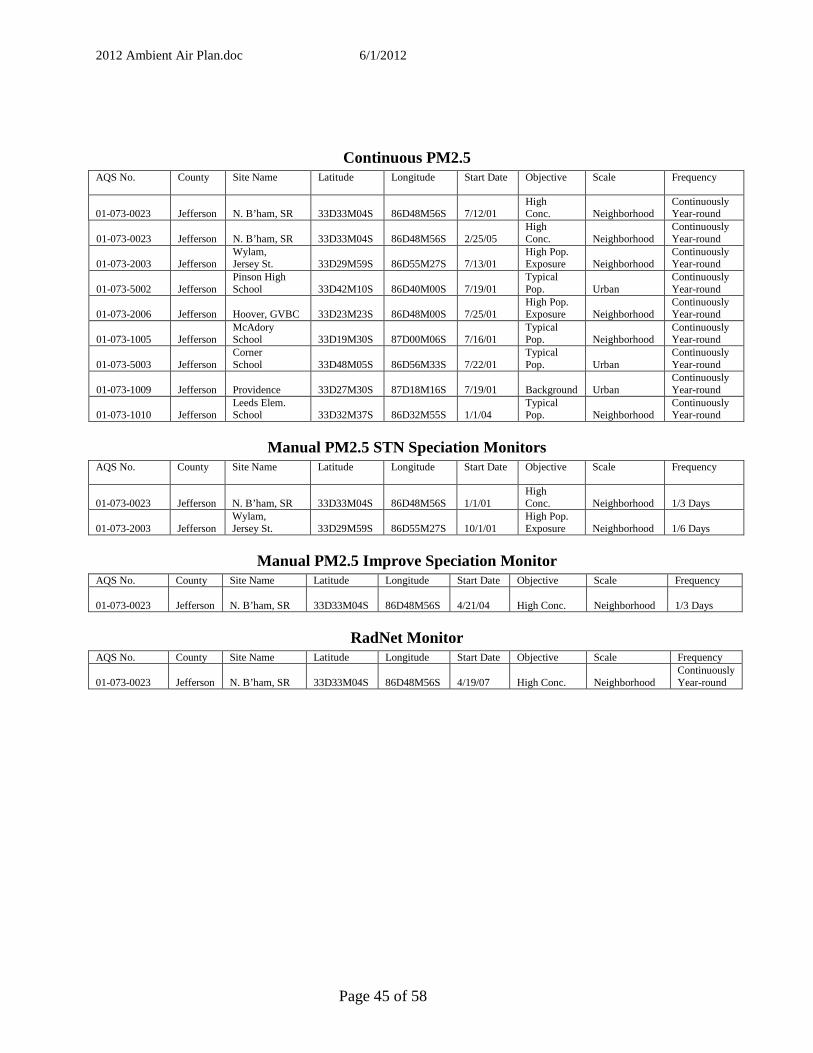
2012 Ambient Air Plan.doc 6/1/2012
Page 45 of 58
Continuous PM2.5 AQS No. County Site Name Latitude Longitude Start Date Objective Scale Frequency
01-073-0023
Jefferson
N. B’ham, SR
33D33M04S
86D48M56S
7/12/01
High Conc.
Neighborhood
Continuously Year-round
01-073-0023
Jefferson
N. B’ham, SR
33D33M04S
86D48M56S
2/25/05
High Conc.
Neighborhood
Continuously Year-round
01-073-2003
Jefferson
Wylam, Jersey St.
33D29M59S
86D55M27S
7/13/01
High Pop. Exposure
Neighborhood
Continuously Year-round
01-073-5002
Jefferson
Pinson High School
33D42M10S
86D40M00S
7/19/01
Typical Pop.
Urban
Continuously Year-round
01-073-2006
Jefferson
Hoover, GVBC
33D23M23S
86D48M00S
7/25/01
High Pop. Exposure
Neighborhood
Continuously Year-round
01-073-1005
Jefferson
McAdory School
33D19M30S
87D00M06S
7/16/01
Typical Pop.
Neighborhood
Continuously Year-round
01-073-5003
Jefferson
Corner School
33D48M05S
86D56M33S
7/22/01
Typical Pop.
Urban
Continuously Year-round
01-073-1009
Jefferson
Providence
33D27M30S
87D18M16S
7/19/01
Background
Urban
Continuously Year-round
01-073-1010
Jefferson
Leeds Elem. School
33D32M37S
86D32M55S
1/1/04
Typical Pop.
Neighborhood
Continuously Year-round
Manual PM2.5 STN Speciation Monitors AQS No. County Site Name Latitude Longitude Start Date Objective Scale Frequency
01-073-0023
Jefferson
N. B’ham, SR
33D33M04S
86D48M56S
1/1/01
High Conc.
Neighborhood
1/3 Days
01-073-2003
Jefferson
Wylam, Jersey St.
33D29M59S
86D55M27S
10/1/01
High Pop. Exposure
Neighborhood
1/6 Days
Manual PM2.5 Improve Speciation Monitor AQS No. County Site Name Latitude Longitude Start Date Objective Scale Frequency 01-073-0023
Jefferson
N. B’ham, SR
33D33M04S
86D48M56S
4/21/04
High Conc.
Neighborhood
1/3 Days
RadNet Monitor AQS No. County Site Name Latitude Longitude Start Date Objective Scale Frequency 01-073-0023
Jefferson
N. B’ham, SR
33D33M04S
86D48M56S
4/19/07
High Conc.
Neighborhood
Continuously Year-round
2012 Ambient Air Plan.doc 6/1/2012
Page 46 of 58
HUNTSVILLE ANNUAL AIR MONITORING NETWORK PLAN
May 17, 2012 Regulations codified at 40 CFR Part 58, Appendices A (Quality Assurance Requirements for SLAMS, SPMs and PSD Air Monitoring), C (Ambient Air Quality Monitoring Methodology), D (Network Design Criteria for Ambient Air Quality Monitoring) and E (Probe and Monitoring Path Siting Criteria for Ambient Air Quality Monitoring) were reviewed to determine if modifications to the existing air monitoring network are required.
NCore Ambient Air Monitoring Stations Each State is required to operate one NCore site (multipollutant). Huntsville was not selected for the NCore site.
PAMS (Photochemical Assessment Monitoring Stations) PAMS monitoring is required in areas classified as serious, severe, or extreme for the 8-hour ozone standard. Huntsville is presently classified as an ozone attainment area. Consequently, PAMS monitoring is not required.
SLAMS (State and Local Air Monitoring Stations) The minimum ozone monitoring requirements are based on MSA (Metropolitan Statistical Area) populations and 3-year design value concentrations. The Huntsville MSA population is 417,593 based on the 2010 decennial census population. Huntsville’s 3-year design value concentration for 2009-2011 is .070 ppm. MSA’s with populations of 50,000 to less than 350,000 having a design value >85% of the O3 NAAQS are required to operate one ozone site. MSA’s with populations of 350,000 to less than 4,000,000 are required to operate two ozone sites. Huntsville operates two ozone monitoring sites, as required. There is a two-tier minimum nitrogen dioxide (NO2) monitoring requirement. Near-road microscale monitoring is required in each CBSA (Core-based statistical area) with a population of 500,000 or more. Area-wide high concentration monitoring is required in each CBSA with a population of 1,000,000 or more. The Huntsville CBSA population is 417,593. Huntsville is not required to operate a SLAMS NO2 monitor. The minimum monitoring requirements for carbon monoxide (CO) require one monitor be collocated with a near-road NO2 monitor in each CBSA with a population of 1,000,000 or more. Huntsville is not required to operate a SLAMS CO monitor.
2012 Ambient Air Plan.doc 6/1/2012
Page 47 of 58
The minimum sulfur dioxide (SO2) monitoring requirements are based on a Population Weighted Emissions Index (PWEI), which is calculated by multiplying the population of the CBSA and the total SO2 emissions (using the most recent published version of the National Emissions Inventory) within the CBSA area. The resulting product is then divided by one million, representing million persons-tons per year. Areas having a PWEI greater than 1,000,000 are required to operate 3 monitors; areas having a PWEI equal to or greater than 100,000 but less than 1,000,000 are required to operate 2 monitors; areas having a PWEI greater than 5,000 but less than 100,000 are required to operate 1 monitor. The Huntsville PWEI is 2474 (based on 2008 estimated census population and 2008 National Emissions Inventory). Huntsville is not required to operate a SLAMS SO2 monitor. Lead monitoring (Pb) is required in areas where Pb levels have been shown or are expected to be of concern due to the proximity of Pb point source emissions. Generally, industrial sources emitting 0.5 ton or more of lead per year and airports emitting 1.0 ton or more per year would be candidates for lead ambient air monitoring. There are no significant point sources of lead emissions in Huntsville. Based on past monitoring and emissions inventory data, a SLAMS lead site is not required. Huntsville’s PM10 concentrations are less than 80 percent of the PM10 NAAQS (National Ambient Air Quality Standards). Based on Huntsville’s MSA population being between 250,000-500,000 and low concentrations, Huntsville is required to operate between 0 and 1 site. Huntsville operates 3 PM10 sites located south, central, and north within Huntsville. These monitors can be operated at very low cost and provide good spatial coverage within the city. Experience has shown that members of the public want ambient air monitoring to be performed in their part of the city, and the PM10 monitoring sites provide a monitoring presence at relatively low cost. Furthermore, the PM10 data provide an indirect indication of PM2.5 spatial variability at a tiny fraction of the cost of operating multiple PM2.5 sites. Note: PM10 Site 01-089-0004 will be terminated upon projected closure of Fire Station #7, if an alternate site cannot be found. The minimum PM2.5 monitoring requirements are based on MSA populations and 3-year 24-hour design value concentrations. Huntsville’s 24-hour 3-year design value concentration for 2009-2011 is 22 µg/m3. MSA’s with populations of 50,000 to less than 500,000 having a design value ≥ 85% of the PM2.5 NAAQS are required to operate one PM2.5 site on a 1 in 3 day sampling frequency. Huntsville is required to operate one PM2.5 monitoring site. Note: Operating frequency increases to daily sampling when the design value is within ± 5 percent of the 24-hour PM2.5 NAAQS (34, 35, and 36 µg/m3). Huntsville is required to operate on a 1 in 3 day schedule. SLAMS sites were also evaluated to determine consistency of spatial scales with stated monitoring objectives. Reference the attached monitoring network description. In addition to the information listed below, the description also indicates site locations, monitoring methodologies, and operational schedules. Current Spatial Scale Scale Monitoring Based on ADT* Meets Objective Site Pollutant Objective For nearest Streets Yes / No 0002 PM10 Population Neighborhood Yes 0004 PM10 High Conc. Middle Yes 0014 PM10 Population Urban Yes 0014 PM2.5 Population Urban Yes 0014 O3 Population Neighborhood Yes 0022 O3 High Conc. Urban Yes
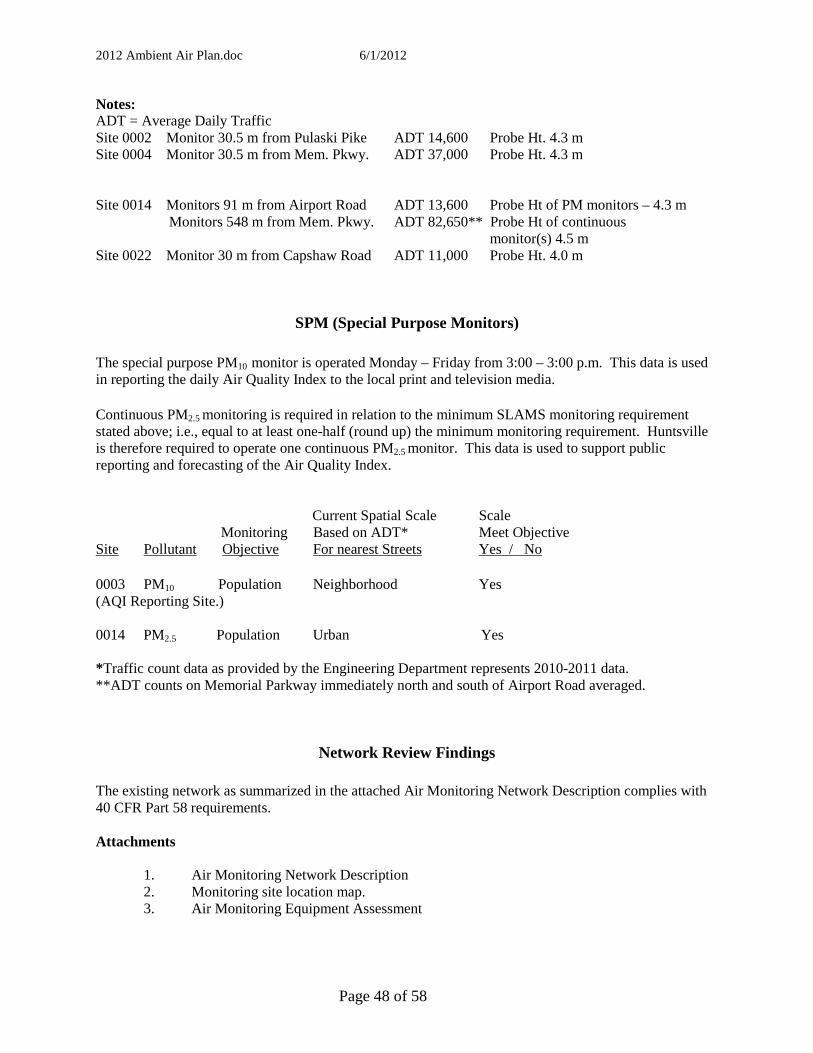
2012 Ambient Air Plan.doc 6/1/2012
Page 48 of 58
Notes: ADT = Average Daily Traffic Site 0002 Monitor 30.5 m from Pulaski Pike ADT 14,600 Probe Ht. 4.3 m Site 0004 Monitor 30.5 m from Mem. Pkwy. ADT 37,000 Probe Ht. 4.3 m Site 0014 Monitors 91 m from Airport Road ADT 13,600 Probe Ht of PM monitors – 4.3 m Monitors 548 m from Mem. Pkwy. ADT 82,650** Probe Ht of continuous monitor(s) 4.5 m Site 0022 Monitor 30 m from Capshaw Road ADT 11,000 Probe Ht. 4.0 m
SPM (Special Purpose Monitors) The special purpose PM10 monitor is operated Monday – Friday from 3:00 – 3:00 p.m. This data is used in reporting the daily Air Quality Index to the local print and television media. Continuous PM2.5 monitoring is required in relation to the minimum SLAMS monitoring requirement stated above; i.e., equal to at least one-half (round up) the minimum monitoring requirement. Huntsville is therefore required to operate one continuous PM2.5 monitor. This data is used to support public reporting and forecasting of the Air Quality Index. Current Spatial Scale Scale Monitoring Based on ADT* Meet Objective Site Pollutant Objective For nearest Streets Yes / No 0003 PM10 Population Neighborhood Yes (AQI Reporting Site.) 0014 PM2.5 Population Urban Yes *Traffic count data as provided by the Engineering Department represents 2010-2011 data. **ADT counts on Memorial Parkway immediately north and south of Airport Road averaged.
Network Review Findings The existing network as summarized in the attached Air Monitoring Network Description complies with 40 CFR Part 58 requirements. Attachments
1. Air Monitoring Network Description 2. Monitoring site location map. 3. Air Monitoring Equipment Assessment
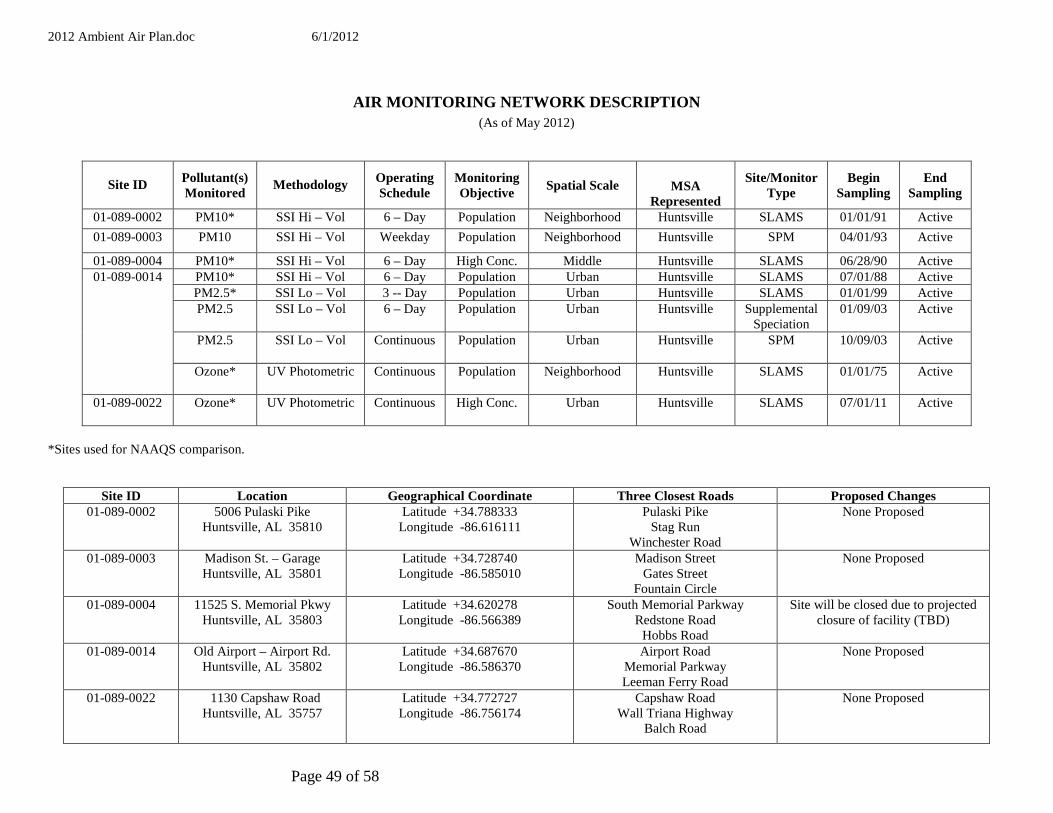
2012 Ambient Air Plan.doc 6/1/2012
Page 49 of 58
AIR MONITORING NETWORK DESCRIPTION (As of May 2012)
Site ID
Pollutant(s) Monitored
Methodology Operating
Schedule Monitoring Objective
Spatial Scale
MSA Represented
Site/Monitor Type
Begin Sampling
End Sampling
01-089-0002 PM10* SSI Hi – Vol 6 – Day Population Neighborhood Huntsville SLAMS 01/01/91 Active
01-089-0003 PM10 SSI Hi – Vol Weekday Population Neighborhood Huntsville SPM 04/01/93 Active
01-089-0004 PM10* SSI Hi – Vol 6 – Day High Conc. Middle Huntsville SLAMS 06/28/90 Active PM10* SSI Hi – Vol 6 – Day Population Urban Huntsville SLAMS 07/01/88 Active PM2.5* SSI Lo – Vol 3 -- Day Population Urban Huntsville SLAMS 01/01/99 Active PM2.5 SSI Lo – Vol 6 – Day Population Urban Huntsville Supplemental
Speciation 01/09/03 Active
PM2.5 SSI Lo – Vol Continuous Population Urban Huntsville SPM
10/09/03 Active
01-089-0014
Ozone* UV Photometric Continuous Population Neighborhood Huntsville SLAMS 01/01/75 Active
01-089-0022 Ozone* UV Photometric Continuous High Conc. Urban Huntsville SLAMS 07/01/11 Active
*Sites used for NAAQS comparison.
Site ID Location Geographical Coordinate Three Closest Roads Proposed Changes 01-089-0002 5006 Pulaski Pike
Huntsville, AL 35810
Latitude +34.788333 Longitude -86.616111
Pulaski Pike Stag Run
Winchester Road
None Proposed
01-089-0003 Madison St. – Garage Huntsville, AL 35801
Latitude +34.728740 Longitude -86.585010
Madison Street Gates Street
Fountain Circle
None Proposed
01-089-0004 11525 S. Memorial Pkwy Huntsville, AL 35803
Latitude +34.620278 Longitude -86.566389
South Memorial Parkway Redstone Road Hobbs Road
Site will be closed due to projected closure of facility (TBD)
01-089-0014 Old Airport – Airport Rd. Huntsville, AL 35802
Latitude +34.687670 Longitude -86.586370
Airport Road Memorial Parkway Leeman Ferry Road
None Proposed
01-089-0022 1130 Capshaw Road Huntsville, AL 35757
Latitude +34.772727 Longitude -86.756174
Capshaw Road Wall Triana Highway
Balch Road
None Proposed

2012 Ambient Air Plan.doc 6/1/2012
Page 50 of 58
APPENDIX A
Maps
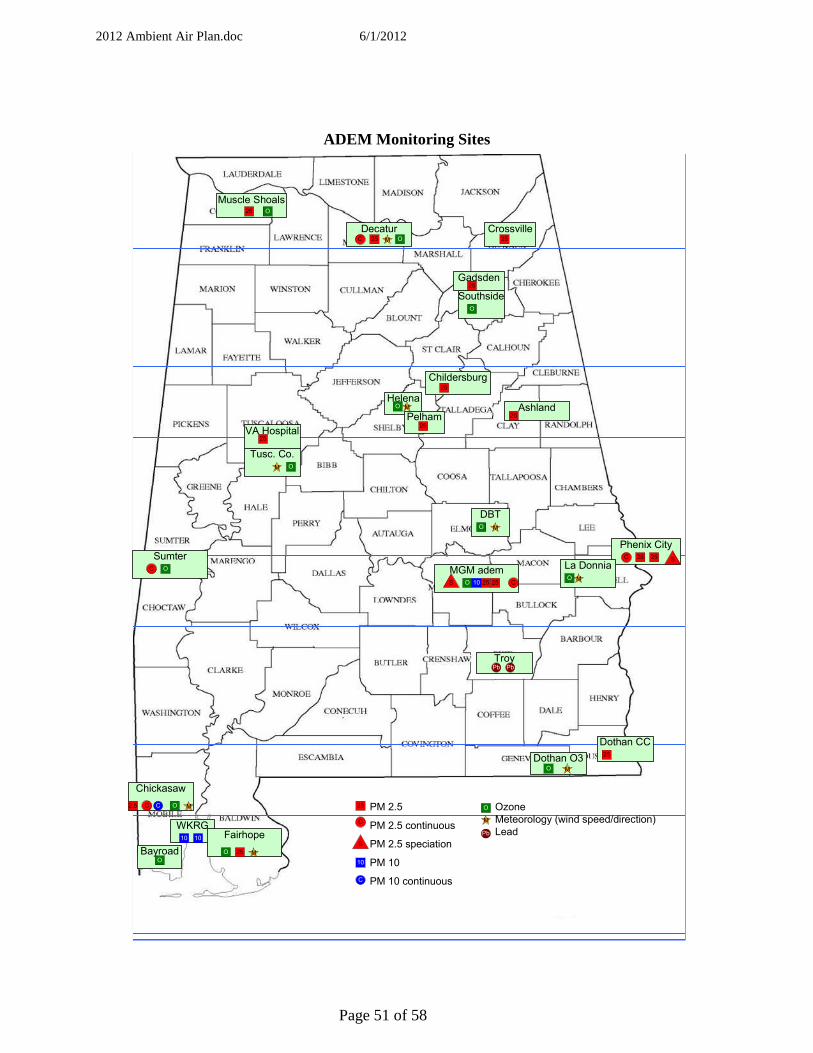
2012 Ambient Air Plan.doc 6/1/2012
Page 51 of 58
ADEM Monitoring Sites
DBT
Troy
WKRGFairhope
O
Chickasaw
Bayroad
Dothan CC
Phenix City
La DonniaSumter
MGM adem
Childersburg
Ashland
VA Hospital
Tusc. Co.
Gadsden
Southside
Decatur
Muscle Shoals
Dothan O3
M
S
C2.5
Pb
10
C
10
25
O
M
M
Pb
Pb
O
O
25
C
M
O
O
O
O
O
O
O
25
C
C
C
C
25 25
25
M
M
S
S
25
M
M25
25
25
10
10
Helena
PelhamO
25
25
Crossville25
C
PM 2.5
PM 2.5 continuous
PM 2.5 speciation
PM 10
PM 10 continuous
Ozone
Meteorology (wind speed/direction)
Lead
O
25
M
O
25
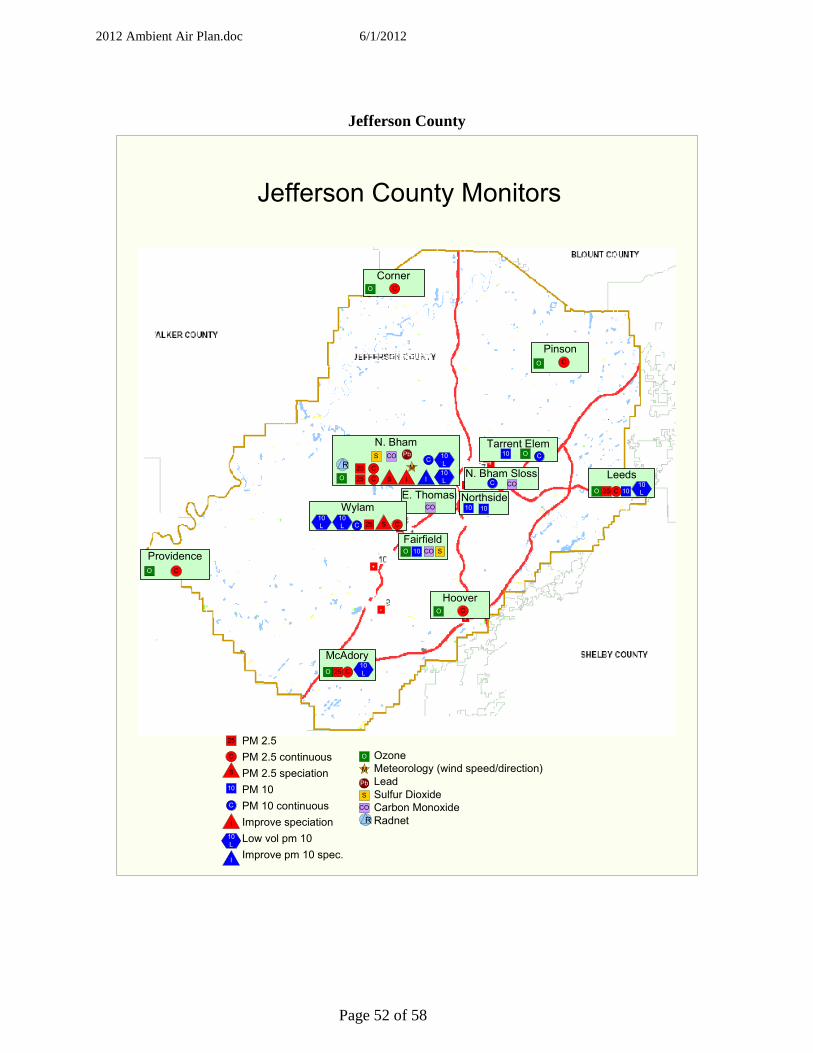
2012 Ambient Air Plan.doc 6/1/2012
Page 52 of 58
Jefferson County
S
M
Pb
C O
S
10
C
Ozone
Meteorology (wind speed/direction)
Lead
Sulfur Dioxide
Carbon Monoxide
RadnetI
10
L
I
CO
Pinson
Fairfield
McAdory
Hoover
Corner
Providence
Leeds
E. Thomas
N. Bham Sloss
NorthsideWylam
Tarrent Elem
O
O
O
O
O
O
O
O
25
25
25
C
C
C
C
C
C
C
S
10
10
10
10
L
10
L
CO
10
C
C
C CO
CO S
Jefferson County Monitors
10
L
10
L
N. Bham
O 25 C
C
S I10
LI
C10
L25R
R
PM 2.5
PM 2.5 continuous
PM 2.5 speciation
PM 10
PM 10 continuous
Improve speciation
Low vol pm 10
Improve pm 10 spec.
25
PbCOS
10
M
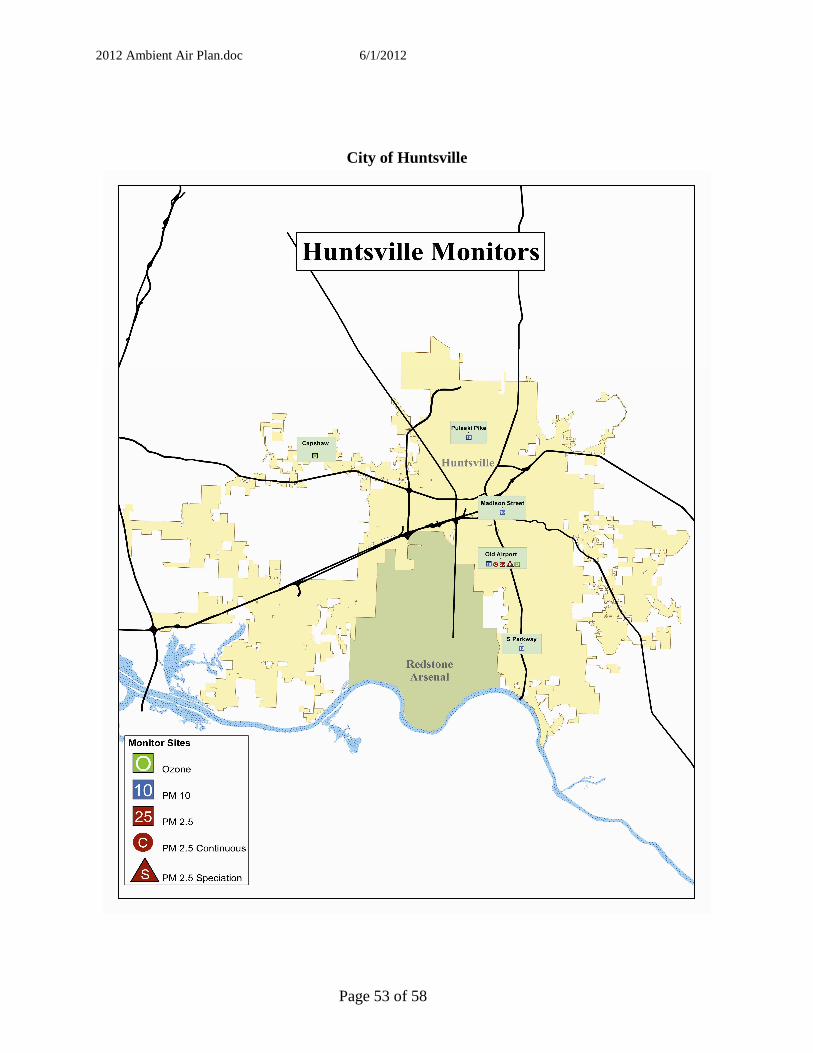
2012 Ambient Air Plan.doc 6/1/2012
Page 53 of 58
City of Huntsville

2012 Ambient Air Plan.doc 6/1/2012
Page 54 of 58
APPENDIX B
Support for ADEM SO 2 Sites
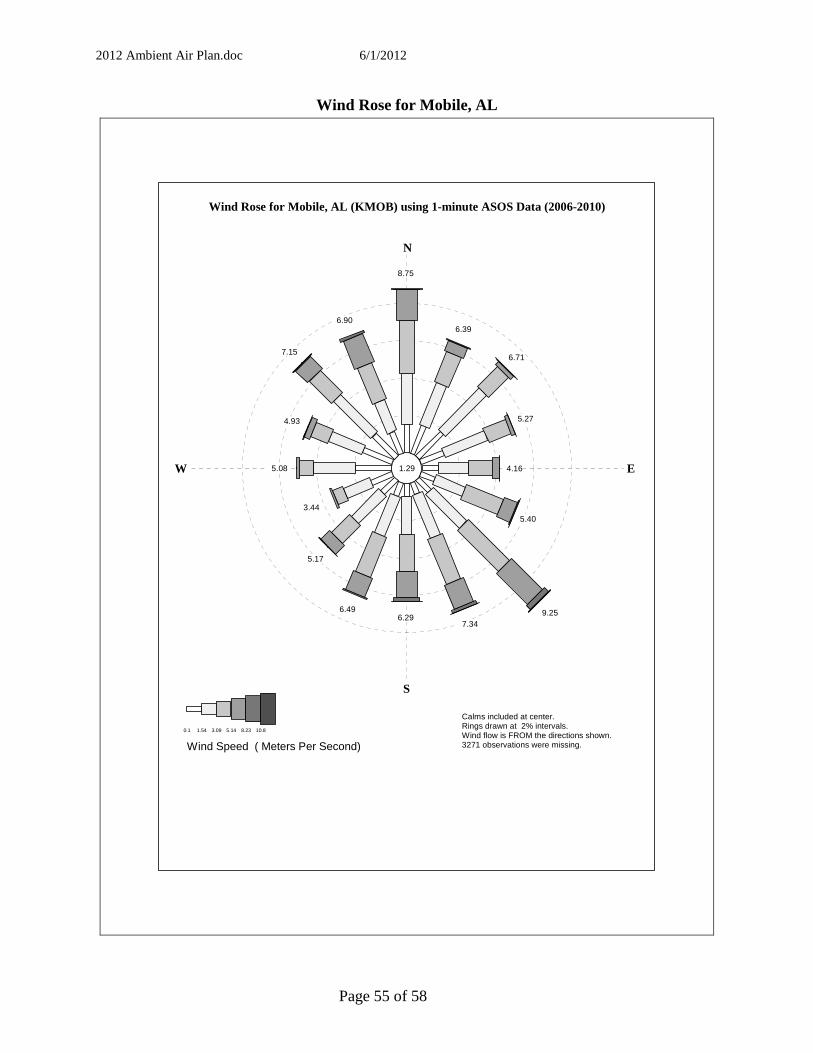
2012 Ambient Air Plan.doc 6/1/2012
Page 55 of 58
Wind Rose for Mobile, AL
Wind Rose for Mobile, AL (KMOB) using 1-minute ASOS Data (2006-2010)
N
S
W E
3271 observations were missing.Wind flow is FROM the directions shown.Rings drawn at 2% intervals.Calms included at center.
1.29
8.75
6.39
6.71
5.27
4.16
5.40
9.25 7.34
6.29 6.49
5.17
3.44
5.08
4.93
7.15
6.90
Wind Speed ( Meters Per Second)
0.1 1.54 3.09 5.14 8.23 10.8
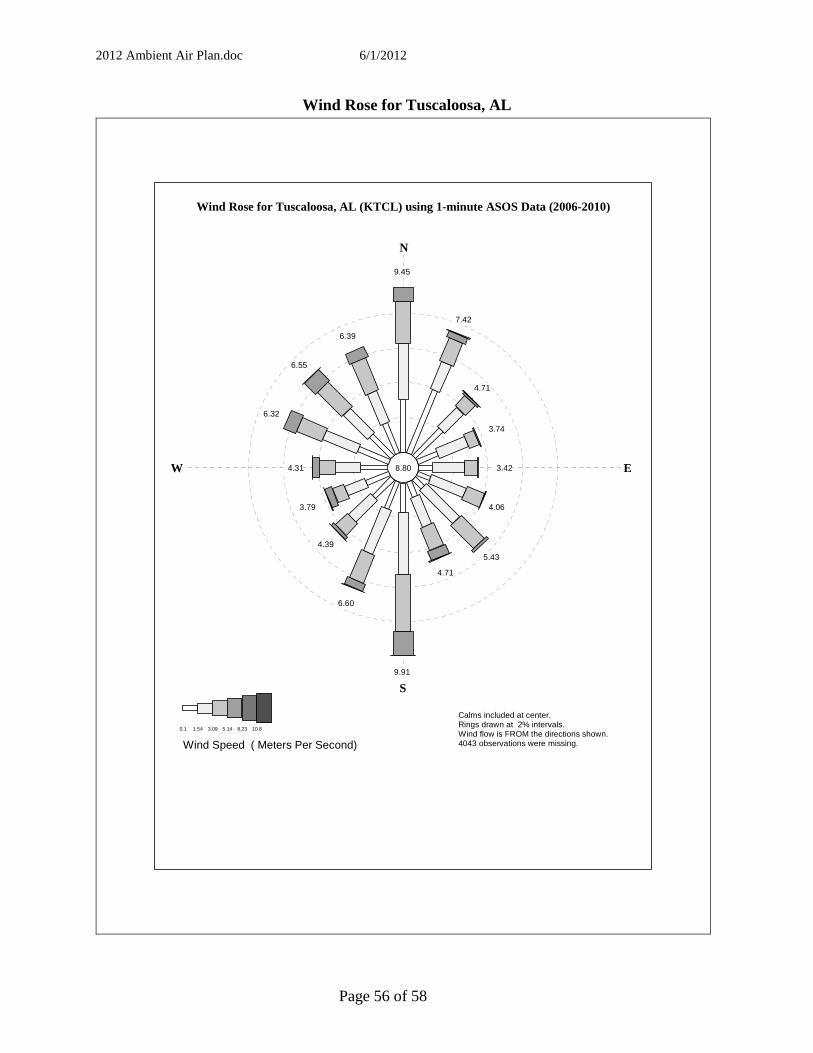
2012 Ambient Air Plan.doc 6/1/2012
Page 56 of 58
Wind Rose for Tuscaloosa, AL
Wind Rose for Tuscaloosa, AL (KTCL) using 1-minute ASOS Data (2006-2010)
N
S
W E
4043 observations were missing.Wind flow is FROM the directions shown.Rings drawn at 2% intervals.Calms included at center.
8.80
9.45
7.42
4.71
3.74
3.42
4.06
5.43
4.71
9.91
6.60
4.39
3.79
4.31
6.32
6.55
6.39
Wind Speed ( Meters Per Second)
0.1 1.54 3.09 5.14 8.23 10.8
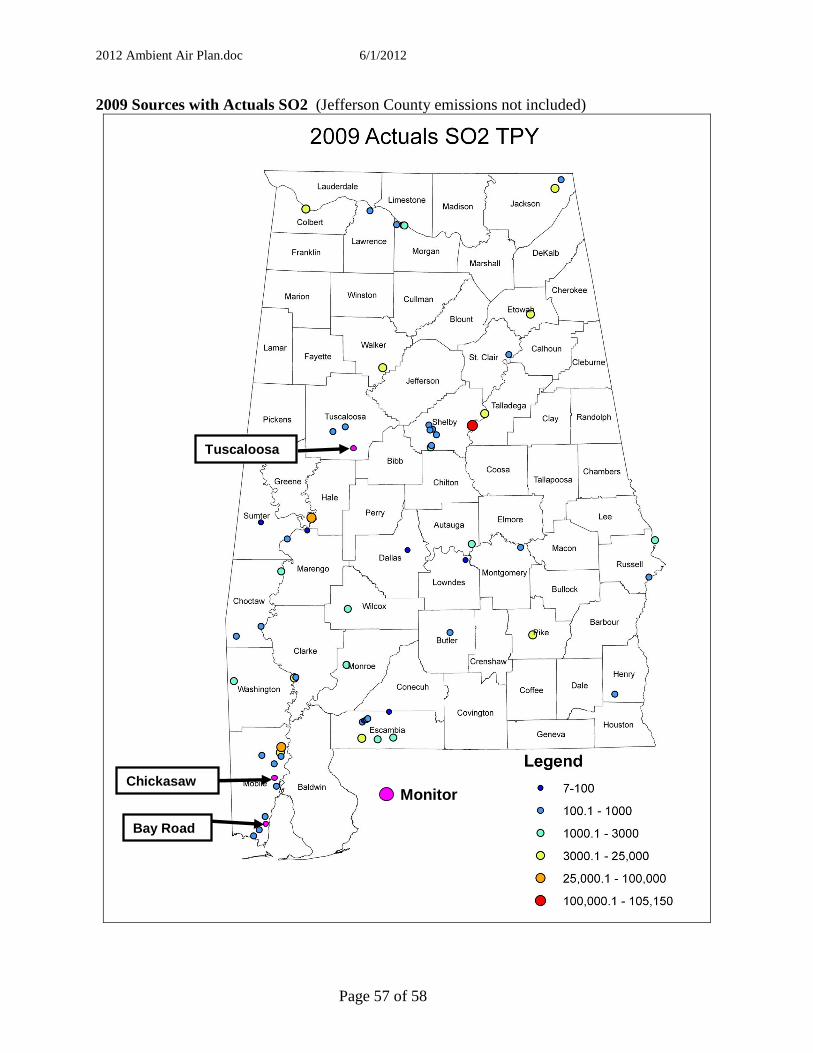
2012 Ambient Air Plan.doc 6/1/2012
Page 57 of 58
2009 Sources with Actuals SO2 (Jefferson County emissions not included)
Bay Road
MonitorChickasaw
Tuscaloosa
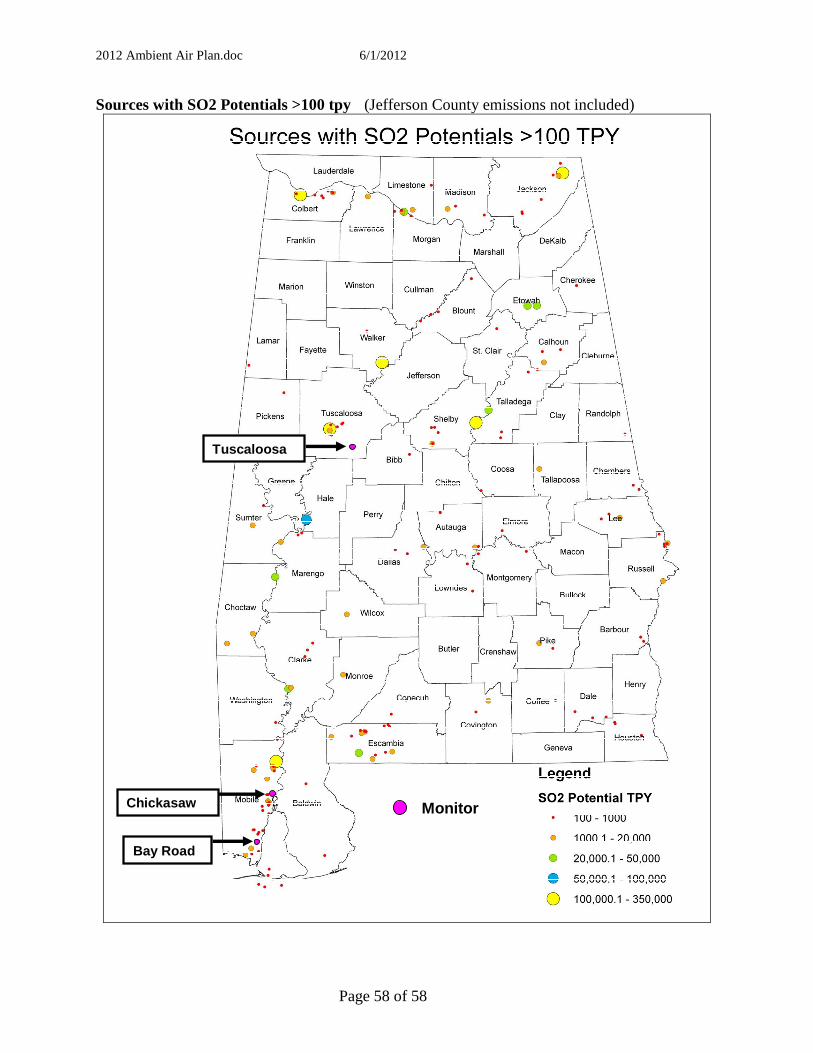
2012 Ambient Air Plan.doc 6/1/2012
Page 58 of 58
Sources with SO2 Potentials >100 tpy (Jefferson County emissions not included)
Tuscaloosa
Chickasaw
Bay Road
Monitor