Embed Size (px)
Citation preview

ADA Notice For individuals with sensory disabilities, this document is available in alternate
formats. For information call (916) 654-6410 or TDD (916) 654-3880 or write Records
and Forms Management, 1120 N Street, MS-89, Sacramento, CA 95814.
STATE OF CALIFORNIA • DEPARTMENT OF TRANSPORTATION
TECHNICAL REPORT DOCUMENTATION PAGE TR0003 (REV 10/98)
1. REPORT NUMBER
CA16-2641 2. GOVERNMENT ASSOCIATION NUMBER 3. RECIPIENT'S CATALOG NUMBER
4. TITLE AND SUBTITLE
Infill Dynamics in Rail Transit Corridors: Challenges and Prospects for Integrating Transportation and Land Use Planning
5. REPORT DATE
June 2016 6. PERFORMING ORGANIZATION CODE
7. AUTHOR
Jae Hong Kim, Douglas Houston, Jaewoo Cho, Ashley Lo, Xiaoxia Shi, Andrea Hoff, Nicholas Branic, Huy C. Ly, Alison L. Walker, Yanyan Zhang
8. PERFORMING ORGANIZATION REPORT NO.
UCTC-FR-2016-06
9. PERFORMING ORGANIZATION NAME AND ADDRESS
University of California, Irvine Institute of Transportation Studies 4000 Anteater Instruction and Research Building (AIRB) Irvine, CA 92697-3600
10. WORK UNIT NUMBER
11. CONTRACT OR GRANT NUMBER
65A0528 TO 018 A01 12. SPONSORING AGENCY AND ADDRESS
California Department of Transportation (Caltrans) Division of Research, Innovation and System Information 1227 O Street, MS-83 Sacramento, CA 95814
13. TYPE OF REPORT AND PERIOD COVERED
Final Report April 1, 2015 - July 7, 2016 14. SPONSORING AGENCY CODE
15. SUPPLEMENTARY NOTES
16. ABSTRACT
Although local and regional planning entities have attempted to direct growth into transit corridors to achieve the sustainability goals of California Senate Bill 375 (SB 375), little is known about the complexity of near-transit infill dynamics. This project aims to enhance our understanding of the relationship between transit investment and urban land use change through a systematic investigation of parcel-level land use in Southern California with a focus on the first phase of the Gold Line, opened in 2003. Our multinomial logistic regression results indicate that vacant parcels within the vicinity of new transit stations are more likely to be developed not only for residential but also for other urban purposes, than those with limited transit accessibility. Although relatively small in terms of magnitude, the presence of long-term (or indirect) effects is also detected, suggesting that continuing investment in a transit system can benefit both new and existing station areas by promoting the utility of the overall public transit service. Transit stations with low ridership, however, tend to generate smaller land use impacts, indicating the importance of the vitality of transit service. Transit investment’s impacts on industrial site reuse also appears to be less evident, while transit investment seems to function as a facilitator of the site redevelopment for multi-family housing and urban open space.
17. KEY WORDS
Transit, corridor, infill, land use, Senate Bill 375
18. DISTRIBUTION STATEMENT
No restriction
19. SECURITY CLASSIFICATION (of this report)
Unclassified
20. NUMBER OF PAGES
60 21. COST OF REPORT CHARGED
Reproduction of completed page authorized.
DISCLAIMER STATEMENT
This document is disseminated in the interest of information exchange. The contents of this report reflect the views of the authors who are responsible for the facts and accuracy of the data presented herein. The contents do not necessarily reflect the official views or policies of the State of California or the Federal Highway Administration. This publication does not constitute a standard, specification or regulation. This report does not constitute an endorsement by the Department of any product described herein. For individuals with sensory disabilities, this document is available in alternate formats. For information, call (916) 654-8899, TTY 711, or write to California Department of Transportation, Division of Research, Innovation and System Information, MS-83, P.O. Box 942873, Sacramento, CA 94273-0001.

UNIVERSITY OF CALIFORNIA TRANSPORTATION CENTER
RESEARCH PROJECT
Infill Dynamics in Rail Transit Corridors:
Challenges and Prospects for Integrating Transportation and Land Use Planning
June 2016
Project Investigators:
Jae Hong Kim and Douglas Houston
Research Assistants:
Jaewoo Cho, Ashley Lo, Xiaoxia Shi, Andrea Hoff, Nicholas Branic
Huy C. Ly, Alison L. Walker, Yanyan Zhang

Table of Contents
Abstract ........................................................................................................................................... 1
I. Introduction ................................................................................................................................. 2
II. Brief Literature Review – What does the existing research tell us? .......................................... 3
III. Study Areas & Local Contexts ................................................................................................. 6
III-1. Overview ............................................................................................................................ 6
III-2. Population Characteristics ................................................................................................ 9
III-3. Economic Characteristics ................................................................................................ 16
III-4. Other Characteristics....................................................................................................... 24
IV. Explorative Analysis ............................................................................................................... 26
IV-1. Methodology ..................................................................................................................... 26
IV-2. Results .............................................................................................................................. 29
V. Land Use Change Analysis – Multinomial Logistic Regression Analysis .............................. 39
V-1. Model, Variables, and Data .............................................................................................. 39
V-2. Baseline Estimation Outcomes .......................................................................................... 42
V-3. Sensitivity Analysis ............................................................................................................ 46
VI. Summary & Discussion .......................................................................................................... 49
References ..................................................................................................................................... 52

List of Tables
Table 1. Gold Line Phase I grades ................................................................................................ 24
Table 2. Land use classification (15 categories) ........................................................................... 26
Table 3. Descriptive statistics ....................................................................................................... 41
Table 4. Logistic regression results (New development model) ................................................... 44
Table 5. Logistic regression results (Redevelopment model) ....................................................... 45
Table 6. Sensitivity analysis results summary (New development) ............................................. 47
Table 7. Sensitivity analysis results summary (Redevelopment) ................................................. 48

List of Figures
Figure 1. LACMTA/Metro system map ......................................................................................... 7
Figure 2. Typology of Gold Line Phase I stations .......................................................................... 8
Figure 3. Population per square miles........................................................................................... 10
Figure 4. Population per household .............................................................................................. 11
Figure 5. Percentage of Hispanic population ................................................................................ 12
Figure 6. Percentage of non-Hispanic African American population ........................................... 13
Figure 7. Percentage of non-Hispanic Asian population .............................................................. 14
Figure 8. Percentage of Foreign-born population ......................................................................... 15
Figure 9. Median household income ............................................................................................. 17
Figure 10. Percentage of household below poverty level ............................................................. 18
Figure 11. Unemployment rate ..................................................................................................... 19
Figure 12. Percentage of labor force in management and professional occupations .................... 20
Figure 13. Percentage of highly educated population ................................................................... 21
Figure 14. Percentage of owner-occupied housing units .............................................................. 22
Figure 15. Percentage of renter-occupied housing units ............................................................... 23
Figure 16. Map of specific plans ................................................................................................... 25
Figure 17. Overlapping policy areas and transit vicinity boundaries ........................................... 28
Figure 18. Land use composition, 1990-2012 (Los Angeles County) .......................................... 29
Figure 19a. Land use composition, 1990-2012 (Rail transit vicinity) .......................................... 30
Figure 19b. Land use composition, 1990-2012 (near Gold Line Phase I stations) ....................... 31
Figure 19c. Land use composition, 1990-2012 (near stations opened before Gold Line Phase I) 31
Figure 19d. Land use composition, 1990-2012 (near stations opened after Gold Line Phase I) .. 32
Figure 20a. Land use composition, 1990-2012 (FRCI) ................................................................ 33
Figure 20b. Land use composition, 1990-2012 (FEZ) .................................................................. 33
Figure 20c. Land use composition, 1990-2012 (SEZ) .................................................................. 34
Figure 20d. Land use composition, 1990-2012 (TOD)................................................................. 34
Figure 20e. Land use composition, 1990-2012 (BID) .................................................................. 35
Figure 20f. Land use composition, 1990-2012 (TNI) ................................................................... 35
Figure 21a. Land use composition, 1990-2012 (FRCI & Transit vicinity) .................................. 36
Figure 21b. Land use composition, 1990-2012 (FEZ & Transit vicinity) .................................... 36
Figure 21c. Land use composition, 1990-2012 (SEZ & Transit vicinity) .................................... 37
Figure 21d. Land use composition, 1990-2012 (TOD & Transit vicinity) ................................... 37
Figure 21e. Land use composition, 1990-2012 (BID & Transit vicinity) .................................... 38
Figure 21f. Land use composition, 1990-2012 (TNI & Transit vicinity) ..................................... 38
1
Abstract
Although local and regional planning entities have attempted to direct growth into transit
corridors to achieve the sustainability goals of California Senate Bill 375 (SB 375), little is
known about the complexity of near-transit infill dynamics. This project aims to enhance our
understanding of the relationship between transit investment and urban land use change through
a systematic investigation of parcel-level land use in Southern California with a focus on the first
phase of the Gold Line, opened in 2003. Our multinomial logistic regression results indicate that
vacant parcels within the vicinity of new transit stations are more likely to be developed not only
for residential but also for other urban purposes, than those with limited transit accessibility.
Although relatively small in terms of magnitude, the presence of long-term (or indirect) effects is
also detected, suggesting that continuing investment in a transit system can benefit both new and
existing station areas by promoting the utility of the overall public transit service. Transit
stations with low ridership, however, tend to generate smaller land use impacts, indicating the
importance of the vitality of transit service. Transit investment’s impacts on industrial site reuse
also appears to be less evident, while transit investment seems to function as a facilitator of the
site redevelopment for multi-family housing and urban open space.

2
I. Introduction
In the domain of planning research and practice, a great deal of attention has been paid to the
potential of systematic integration of transportation and land use planning in achieving a more
sustainable form of urban development. More specifically, in the State of California, transit-
oriented infill development has been employed as a major strategy for reducing vehicle miles
traveled (VMT) and associated greenhouse gas (GHG) emissions from passenger vehicles and
attaining other sustainability goals of the Senate Bill 375 (SB 375). For instance, the Southern
California Association of Governments (SCAG) recently adopted the region’s 2016-2040
Regional Transportation Plan (RTP) / Sustainable Communities Strategy (SCS) which called for
nearly 50% of new employment and housing growth to occur in its High-Quality Transit Areas
(HQTA), defined as “generally a walkable transit village ... within one half-mile of a well-
serviced transit stop or a transit corridor with 15-minute or less service frequency during peak
commute hours” (SCAG, 2016, p.189). In addition, local governments, such as Los Angeles,
California, are developing plans which promote nearby transit-oriented development (TOD) in
order to make neighborhoods more compact, mixed-use, and transit accessible to achieve SCS
goals (Lane, 2008; Boarnet et al., 2011). The Los Angeles County Metropolitan Transportation
Authority’s (LACMTA, “Metro”) long-range plan also commits funds to new light rail transit
(LRT) lines scheduled to open by 2019 (LACMTA, 2009).
These initiatives have been informed by the sizeable literature on the systematic connections
between transportation and land use. Studies have investigated the influences of land use
characteristics on travel behavior and suggested that an appropriate mix of land use, residential
density and street connectivity play a critical role in determining VMT, transit usage, and
physical activities (see e.g., Cervero and Kockleman, 1997; Boarnet and Sarmiento, 1998; Ewing
and Cervero, 2001 and 2010; Saelens et al., 2003; Salon et al., 2012). More recent studies have
also attempted to expand the land use metrics to better represent the detailed configuration of
land use beyond traditional density or entropy indicators so as to better understand how land use
influences travel patterns (see e.g., Day et al., 2006; Boarnet et al., 2011). A similarly large
number of studies have investigated the reverse: how a change or intervention on the side of
transportation systems and infrastructure can affect land use and real estate market prices (see
e.g., Knight and Trygg, 1977; Huang, 1996; Vessali, 1996; Cervero and Landis, 1997; Giuliano,
2004; Bartholomew and Ewing, 2011). Scholarly attention has also been paid to the importance
of land use-transportation integration in realizing a more efficient urban spatial structure and
promoting local/regional economic development (Cervero, 2001; Kim, 2011).
We know relatively little, however, about the expected nature and magnitude of the impact that
transit system development or expansion will have on nearby infill development dynamics.
Although prior research does contribute to our understanding of the potential land use impacts of
transit systems, existing studies often regard transit stations as a homogeneous entity (or

3
amenity) and neglect the substantial variation in transit system types, service quality, local plans,
and other associated factors that could generate a systematic difference in land use outcomes
near transit. Furthermore, little is known about how the dynamic changes in a transit system can
shape and re-shape land use patterns within immediate vicinities of stations and broader corridor
areas, although it has been suggested that land markets would start to react even before the initial
development (Knaap et al., 2001; McMillen and McDonald, 2004).
This research project aims to enhance our understanding of the land use impacts of transit
through an investigation of land use change dynamics in relation to transit system development
and expansion in Southern California. We use a historical geo-database of the changes in transit
systems and land use to identify key factors that shape land use patterns, with a focus on the
areas around rail transit stations in Los Angeles County. Attention is paid to land use change
dynamics near thirteen stations along the first phase of the Gold Line, which opened in 2003,
while consideration is also given to the other station areas in the region. By analyzing parcel-
level land use change patterns near the Los Angeles transit system that has expanded
substantially over the last two decades, we attempt to provide critical insights into the
mechanisms between urban transit expansion and land (re)development processes and
meaningful lessons for guiding the local, regional, and state-level initiatives to create more
(socially, economically, and environmentally) sustainable communities through a more
systematic integration of transportation and land use planning.
II. Brief Literature Review – What does the existing research tell us?
Previous research often focused on the impacts of transit development on land value appreciation
(rather than changes in detailed land use) or the general bi-directional interaction between land
use and transportation. However, reviewing early studies on real estate development impacts of
urban rail systems in North America, Huang (1996) provided some useful insights into how
transit can influence urban land use. More specifically, the author suggested that the effects of
transit on land use are highly dependent on zoning and many social-economic factors.
According to Huang (1996), it was unclear whether transit investment is the most cost-effective
way to shape urban form, as planners intended. Vessali (1996) also provided a systematic
review of studies concerning the changes brought by transit system development and highlighted
several points that were presented in these early studies, including that the effects of transit on
land use development might not always be substantial and often required the presence of other
complementary factors. Common limitations and constrains found in the early studies were also
discussed in Vessali’s (1996) review. According to the author, few studies employed statistical
models to control for confounding factors (that could affect land use and might be related to
transit) and, therefore, measuring the exact extent to which transit development shaped land use

4
remained as a subject of further research. Moreover, most of the early efforts were made to
investigate the impacts of heavy rail, as opposed to light rail or bus transit systems that deserved
more attention.
More recent studies (published after 1996) tended to utilize more sophisticated statistical models
and take advantage of better access to detailed data sets. The coverage of study has also
expanded significantly. In particular, a growing number of studies have been devoted to
assessing the impacts of light rail and bus rapid transit systems. In terms of findings, however,
these recent studies are not completely distinct from those of early research. Rather, they have
reinforced the major findings from early research, while recent work has indeed contributed to
refining our understanding. For instance, the importance of complementary policies and land use
plans has been recognized in recent studies (Cervero and Landis, 1997; Polzin, 1999; Handy,
2005; Loukaitou-Sideris, 2010). In addition, similar to earlier research, most (quantitative)
studies have acknowledged difficulties in distinguishing the effects of transit development on
land use changes from those of other factors due to the complex nature of the transportation-land
use nexus (Pan and Zhang, 2008; Cervero and Kang, 2011; Jun, 2012; Hurst and West, 2014;
Ahmad et al., 2016). It has also been suggested that transit systems can lead to land use
conversion toward more capital-intensive uses (e.g., for commercial or other business actives) in
nearby areas (Duncan, 2008; Pan and Zhang, 2008; Cervero and Kang, 2011; Grube-Cavers and
Patterson, 2015).
The intensification of land use in transit corridors is clearly demonstrated in a recent empirical
study conducted by Hurst and West (2014). Using the parcel-level data in Minneapolis,
Minnesota for 1997-2010, the authors investigated the changes in land use patterns along the
Metro Blue Line (light rail), for which construction started in 2001 and service operations began
in 2004. They found that vacant land and industrial sites were replaced by residential and
commercial buildings (especially multi-family residential uses, which showed the largest
increase) and suggested that these land use changes were associated with the proximity to the
light rail system. Moreover, they compared the magnitudes of impacts at different time points –
i.e., before construction, during construction, and after operation – and detected the largest and
smallest impacts before construction and during the construction project, respectively.
Empirical evidence of such land use intensification has also been reported by studies focusing on
cases in other countries. For instance, Pan and Zhang (2008) looked into the changes in land use
patterns along with the rapid rail lines in Shanghai, China, and found that in near-station areas,
high-density and capital-intensive land uses, such as commercial and transportation-related
facilities, increased. They also detected a substantial increase in the average Floor Area Ratio
(FAR) along the corridors. Similarly, through an investigation of the Bus Rail Transit (BRT)
system in Seoul, Korea using multi-level logit models, Cervero and Kang (2011) reported that
single-family land uses along the BRT lines were replaced by more intensive uses, such as multi-

5
family housing and mixed development, specifically after the service improvement with creation
of dedicated bus-lanes. Furthermore, the authors provided evidence suggesting that transit
accessibility can generate land price premiums. Later, another study (Jun, 2012) examined the
same area and concluded that the impacts of the BRT system tended to be more significant on
non-residential land uses than on residential areas.
Some other studies, mainly through in-depth investigations of their study areas, have stressed the
importance of local actions, often implemented in conjunction with or as a reaction to
transportation projects. In their largely-cited 1997 study, Cervero and Landis examined the Bay
Area Rapid Transit (BART) and its long-term impacts on land use changes with careful
consideration of local conditions and neighborhood factors that could play a critical role. Their
study suggested that: i) BART’s land-use impacts were not evenly distributed and appeared to be
associated with local factors; ii) light rail proximity could be an important contributor to land
development, but it alone would not be a sufficient condition to lead to significant land use
changes; and iii) freeway proximity could be more influential in determining employment and
office growth rates than BART. In the study, the authors also paid attention to how local policy
instruments were used. For example, they looked at downtown San Francisco and found that the
area was emerging as an international financial center with supportive policies aiming at certain
types of land development, such as tax increment financing and density bonuses (Cervero and
Landis, 1997). As one of the biggest investments in the area, BART played a critical role in
improving accessibility, lessening congestion, and thus supporting the economic growth of the
downtown. Using the case of the Daly City corridor as a counterexample, the authors also
pointed out the possibilities of policy changes with the presence or absence of community
support.
Loukaitou-Sideris (2010) provided a systematic comparison of development near two light rail
lines in Southern California: the Blue and Gold lines in Los Angeles County, one of which was
thought of as a failure, whereas the other was often recognized as a success. This study
compared two lines in terms of ridership and the amount/type of development permits issued
around station areas to reveal what can make a TOD project successful. It also relied on
interviews with architects, urban planners, city officials, and developers, and suggested that the
success of TOD projects would depend on stakeholders’ perceptions and coordination, as well as
existing socio-economic conditions in the project areas.
More recently, Grube-Cavers and Patterson (2015) conducted an investigation of Canadian cities
with a focus on possible adverse effects of transit investment on communities. According to the
authors, public investment could induce gentrification and thus result in displacement and/or
conflicts within the communities, while providing affordable housing opportunities near
transportation stations could help minimize such negative consequences (see e.g., Kahn, 2007;
Zuk et al., 2015; Dawkins and Moeckel, 2016). Recent studies focusing on energy saving and air
6
quality concerns have shifted the goal of public transit investment away from serving people who
were living in densely-occupied areas with high need of public transit service, towards
addressing the needs of those who previously traveled by automobile (Polzin, 1999). This shift
has called for active and strong involvement of municipalities to publicize the advantage of
commuting by transit than by personal vehicle, in many cases by stressing the benefits of TOD
and sustainable communities. While rapid technological advances in automobile energy
efficiencies and emissions would “have lessened the contribution to air quality improvement that
transit can make” (Polzin, 1999, p.136), given the urgent need to curb sprawl and address
environmental issues, planners may need to keep putting public transit ahead of other policy
tools. However, the importance of social equity should not be underestimated in devising and
implementing transit-oriented policy initiatives and other municipal actions.
III. Study Areas & Local Contexts
III-1. Overview
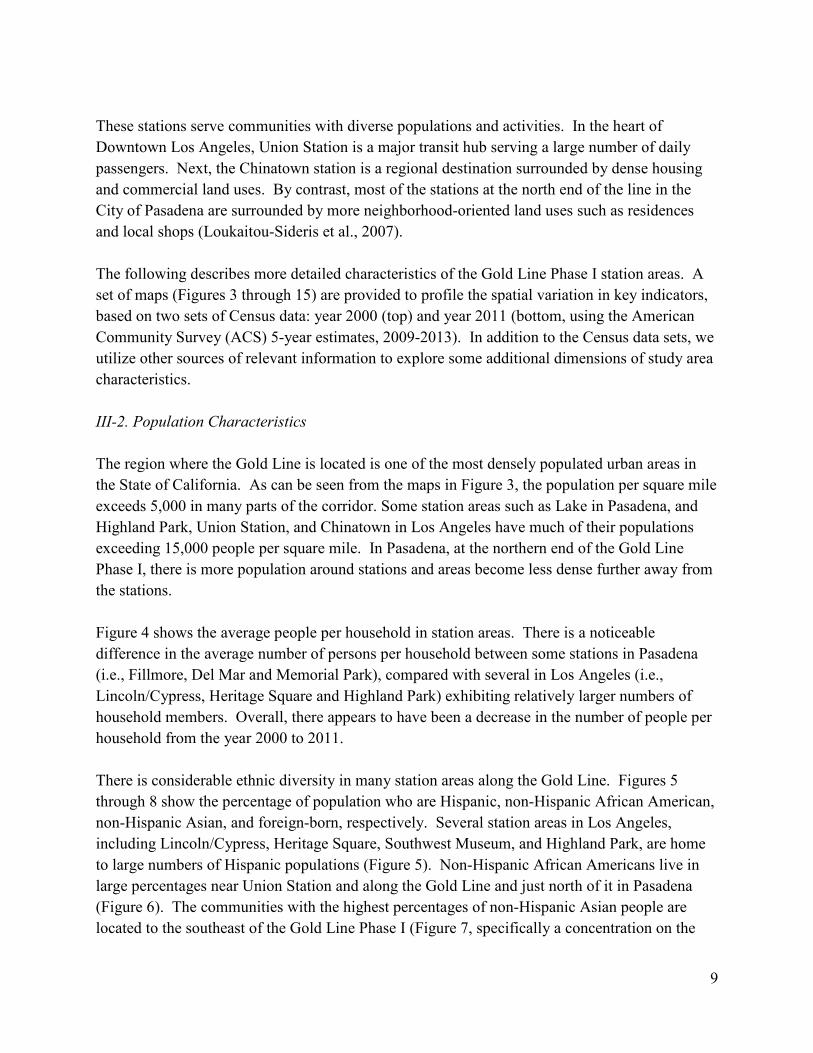
To analyze the land use impacts of transit development and expansion, in this project we focus
on public (light rail) transit corridor areas in Los Angeles County, particularly thirteen stations
along Phase I of the Gold Line. In this region, the Metro Blue Line started to provide service
with 22 stations opened in 1990. The Metro Red and Purple Lines were added in 1993, covering
Downtown Los Angeles, Hollywood, Mid-Wilshire, and North Hollywood. In 1995, the transit
system was further augmented by the Green Line, offering service to suburban locations in the
county (14 stations, approximately 20 miles) without passing Downtown Los Angeles. Later, the
Metro Gold (the main focus of this research) and Expo Lines started to operate in conjunction
with the existing system. Some of these lines are expected to be extended more in the near
future.1
The Gold Line Phase I is selected as the focus of this study for multiple reasons. First, the Gold
Line Phase I stations are located in three different cities in Los Angeles County, and this
variation allows examination of different policy contexts and their potential impacts on
transformation of near-transit land use. The City of South Pasadena, for example, uses a Specific
Plan to incentivize development in the entire community district surrounding their Mission
1 Please refer to https://www.metro.net/interactives/metrorail_timeline/ for a more detailed description of
the future plans, as well as the 25 years of history. It also needs to be noted that we use the LACMTA rail
network data (in line and point shapefile formats). The shapefiles contain the six Metro lines (the Blue,
Red, Purple, Green, Gold, and Expo Lines) and 83 stations available in 2012. More detailed information
about individual lines and stations is also collected from multiple other sources, including the Metro
website and http://metroprimaryresources.info/. Figure 1 presents the metro rail system map obtained
from the Metro website, specifically at http://media.metro.net/riding_metro/maps/images/rail_map.pdf.

7
station, whereas other cities tend to focus incentives only in areas immediately surrounding
transit stations. Other differences also exist across municipalities which warrant examination of
transit corridor areas that cross jurisdictional boundaries (Loukaitou-Sideris, 2010).
Figure 1. LACMTA/Metro system map
(Retrieved from the Metro website in December 2015)
The Gold Line Phase I stations are also selected because they are located in areas of diverse
socioeconomic conditions. Some stations, particularly at the south end of the Gold Line Phase I
segment near Downtown Los Angeles, are located in relatively low-income, ethnic minority
communities. Others, like those located in South Pasadena and Pasadena, are in wealthier areas

8
with high rates of white-collar employment and education. The varying socioeconomic
conditions among different stations allow for examination of different factors and conditions that
could potentially impact the relationship between transit and land use (Loukaitou-Sideris et al.,
2007).
Data availability is another reason the Gold Line is selected. Parcel-level land use data, provided
by SCAG, is available for several years both prior to and after the opening of the Gold Line
Phase I (in 2003). For these years, other sources of information are also more accessible. The
presence of the Gold Line expansion makes an even more compelling case for focusing on this
part of the Los Angeles rail transit system. The Gold Line was extended in 2009 with the Gold
Line Eastside Expansion, connecting Downtown Los Angeles to East Los Angeles.
Figure 2 shows the Gold Line Phase I stations located in the three cities and each station’s
characteristic in terms of land use typology, provided by a Gold Line corridor study (Loukaitou-
Sideris et al., 2007). As shown in the map, the first six stations are located in the City of Los
Angeles (Union, Chinatown, Lincoln Heights/Cypress Park, Heritage Square/Arroyo, Southwest
Museum, and Highland Park); the following Mission Station is located in South Pasadena; and
the remaining six stations are in the City of Pasadena (Fillmore, Del Mar, Memorial Park, Lake,
Allen, and Sierra Madre Villa).
Figure 2. Typology of Gold Line Phase I stations
9
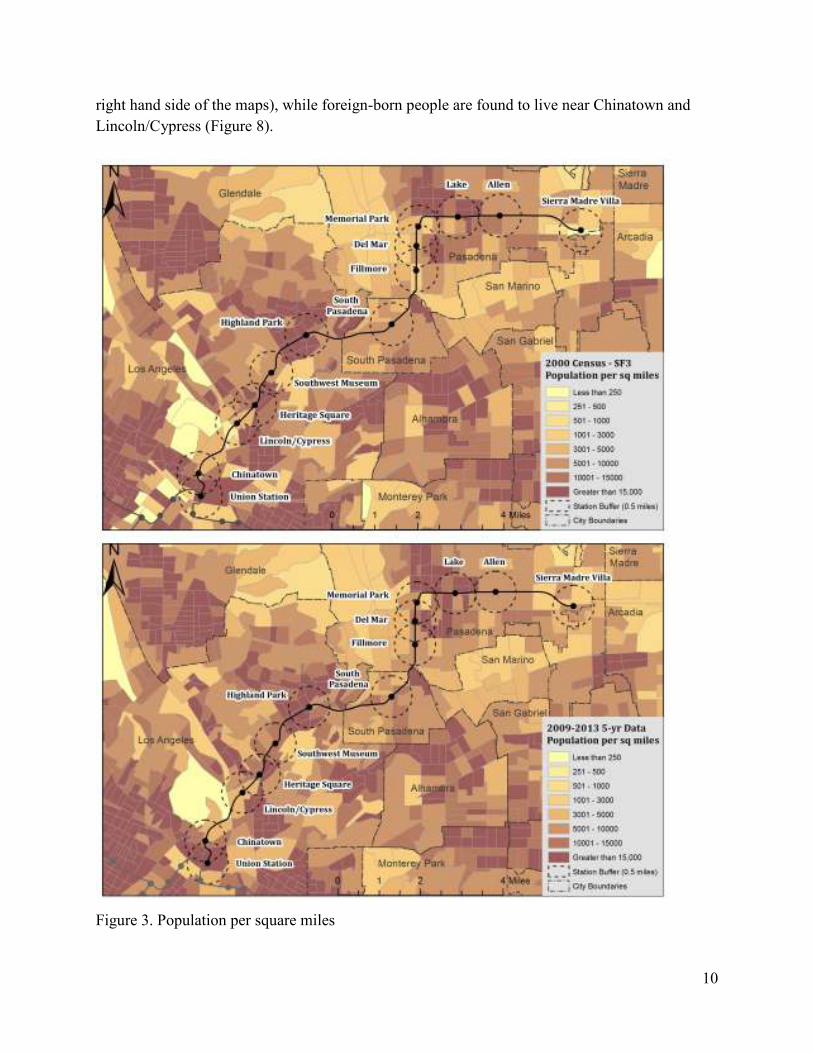
These stations serve communities with diverse populations and activities. In the heart of
Downtown Los Angeles, Union Station is a major transit hub serving a large number of daily
passengers. Next, the Chinatown station is a regional destination surrounded by dense housing
and commercial land uses. By contrast, most of the stations at the north end of the line in the
City of Pasadena are surrounded by more neighborhood-oriented land uses such as residences
and local shops (Loukaitou-Sideris et al., 2007).
The following describes more detailed characteristics of the Gold Line Phase I station areas. A
set of maps (Figures 3 through 15) are provided to profile the spatial variation in key indicators,
based on two sets of Census data: year 2000 (top) and year 2011 (bottom, using the American
Community Survey (ACS) 5-year estimates, 2009-2013). In addition to the Census data sets, we
utilize other sources of relevant information to explore some additional dimensions of study area
characteristics.
III-2. Population Characteristics
The region where the Gold Line is located is one of the most densely populated urban areas in
the State of California. As can be seen from the maps in Figure 3, the population per square mile
exceeds 5,000 in many parts of the corridor. Some station areas such as Lake in Pasadena, and
Highland Park, Union Station, and Chinatown in Los Angeles have much of their populations
exceeding 15,000 people per square mile. In Pasadena, at the northern end of the Gold Line
Phase I, there is more population around stations and areas become less dense further away from
the stations.
Figure 4 shows the average people per household in station areas. There is a noticeable
difference in the average number of persons per household between some stations in Pasadena
(i.e., Fillmore, Del Mar and Memorial Park), compared with several in Los Angeles (i.e.,
Lincoln/Cypress, Heritage Square and Highland Park) exhibiting relatively larger numbers of
household members. Overall, there appears to have been a decrease in the number of people per
household from the year 2000 to 2011.
There is considerable ethnic diversity in many station areas along the Gold Line. Figures 5
through 8 show the percentage of population who are Hispanic, non-Hispanic African American,
non-Hispanic Asian, and foreign-born, respectively. Several station areas in Los Angeles,
including Lincoln/Cypress, Heritage Square, Southwest Museum, and Highland Park, are home
to large numbers of Hispanic populations (Figure 5). Non-Hispanic African Americans live in
large percentages near Union Station and along the Gold Line and just north of it in Pasadena
(Figure 6). The communities with the highest percentages of non-Hispanic Asian people are
located to the southeast of the Gold Line Phase I (Figure 7, specifically a concentration on the
10
right hand side of the maps), while foreign-born people are found to live near Chinatown and
Lincoln/Cypress (Figure 8).
Figure 3. Population per square miles

11
Figure 4. Population per household

12
Figure 5. Percentage of Hispanic population

13
Figure 6. Percentage of non-Hispanic African American population

14
Figure 7. Percentage of non-Hispanic Asian population

15
Figure 8. Percentage of Foreign-born population

16
III-3. Economic Characteristics
The station areas in the City of Los Angeles are generally less economically well off than those
station areas in the Cities of Pasadena and South Pasadena. Figure 9 shows the median
household income for the Gold Line station areas with darker colors representing higher median
incomes. It appears that, overall, median household incomes rose generally throughout the
region from 2000 to 2011. In both maps, however, there is a noticeable difference in median
household incomes between Los Angeles and counterparts (i.e., corridor areas in South Pasadena
and Pasadena, which show higher levels of income).
A similar correlation between economic wealth and geographical location is evident from Figure
10, in which the census tract-level poverty status around stations is demonstrated. A higher
percentage of households below the poverty line reside in areas closer to Downtown Los Angeles
(nearer to Union Station and Chinatown stations) compared to the Cities of South Pasadena and
Pasadena. These areas also have relatively higher unemployment rates, while a higher degree of
fluctuation is detected from 2000 to 2011 in some station areas (Figure 11).
Employment in higher paying jobs, such as those in management and professional occupations,
tends to concentrate in the Cities of South Pasadena and Pasadena along the Gold Line (Figure
12). This echoes the noticeable pattern of income distribution mentioned above and a
geographical concentration of highly educated people in these areas as shown in Figure 13.
There are some areas adjacent to transit stations in Pasadena however, where the percentage of
such higher paying employment is quite low (i.e., around Memorial Park, Lake, Allen, and Sierra
Madre Villa), compared with the rest of the city. Station areas in South Pasadena and Pasadena
include many locations where 40-60% of residents have at least a bachelor’s degree, while
station areas in Los Angeles have more areas with less than 10% of residents with at least a
bachelor’s degree.
It also needs to be noted that there is visible variation among station areas in their percentage of
owner-occupied housing units (Figures 14). Near Downtown Los Angeles at the Union Station
and Chinatown stations, there are significant areas with less than 5% owner-occupied units in
2011, while the other four Los Angeles stations have relatively higher percentages of home
ownership. Memorial Park and Lake in Pasadena show lower numbers of owner-occupied
housing units compared to neighboring stations in that city. Generally, there appears to be more
rental units closer to the urban core of Downtown Los Angeles and closer to the Gold Line in
Pasadena (Figure 15), whereas owner-occupied housing units seem to dominate areas further
away from the rail line.

17
Figure 9. Median household income

18
Figure 10. Percentage of household below poverty level

19
Figure 11. Unemployment rate

20
Figure 12. Percentage of labor force in management and professional occupations

21
Figure 13. Percentage of highly educated population

22
Figure 14. Percentage of owner-occupied housing units

23
Figure 15. Percentage of renter-occupied housing units

24
III-4. Other Characteristics
A substantial degree of variation also exists in terms of built environments and policy attitudes.
For instance, stations closer to Downtown Los Angeles were found to have a more favorable
micro-level arrangement in a recent study (Elkind et al., 2015), which graded transit stations
according to how well they facilitate walkability, transit use, and transit-oriented development.
The Mission station in South Pasadena and the Allen and Sierra Madre Villa stations in Pasadena
(which were mainly surrounded by single-family homes) received the lowest scores in the study.
Table 1 provides the scores that each Gold Line Phase I station earned in the study.
Table 1. Gold Line Phase I grades
Station Name City Grade
Union Station Los Angeles B
Chinatown Los Angeles A
Lincoln Heights/Cypress Park Los Angeles A-
Heritage Square/Arroyo Los Angeles B-
Southwest Museum Los Angeles B-
Highland Park Los Angeles B+
Mission South Pasadena C-
Fillmore Pasadena B-
Del Mar Pasadena C
Memorial Park Pasadena C
Lake Pasadena B-
Allen Pasadena D
Sierra Madre Villa Pasadena C-
Data source: Elkind et al., (2015)
As noted above, the Gold Line Phase I stations are located in three different municipalities
within the County of Los Angeles--Los Angeles, South Pasadena, and Pasadena--having distinct
policies dealing with transit and surrounding land uses and development. Los Angeles has the
most extensive collection of related policies. According to the Los Angeles Transit Corridors
Strategy (Carlton et al., 2012), which contains a comprehensive review of TOD-related policies,
the City of Los Angeles has more than ten planning documents containing policies related to
TOD. These include design guidelines, General Plan elements, Specific Plans, bike plans, and
others. Metro also has two programmatic documents that relate to TOD in Los Angeles. Despite
this wealth of TOD policies, a research consultant team led by UC Berkeley that conducted the
review for Metro, points out that actual implementation of TOD around stations in Los Angeles
has been somewhat limited. Notable exceptions exist, however, with Metro joint development
around stations, some redevelopment, and public infrastructure projects (Carlton et al., 2012).

25
The City of South Pasadena uses its General Plan and the Mission Street Specific Plan to
promote transit-oriented land uses around the Gold Line. The Mission Street Specific Plan was
adopted in 1996 and provided incentives to developers to catalyze an area in anticipation of the
opening of the Gold Line transit service. One strategy used by the plan was to list parcels that
would qualify for density bonuses if developed as mixed-use or residential properties near the
Gold Line.
The City of Pasadena’s TOD-related policies exist in their General Plan and Specific Plans
around stations. The draft General Plan mobility element (currently being updated) calls for
mixed-use zoning, transit friendly features, and multi-family and affordable housing in transit
corridors. Also, four Specific Plans in Pasadena surround transit stations and deal with them
specifically. The Central District Specific Plan, for example, contains within its boundaries four
Gold Line Stations and promotes the development of ‘transit villages’ with high density housing
around the stations. Figure 16 shows specific plans surrounding stations along the Gold Line,
which have been used as a key instrument to promote TOD.
Figure 16. Map of specific plans

26
IV. Explorative Analysis
IV-1. Methodology
Before investigating the impacts of transit investment on land use change dynamics, an
exploration is made of the patterns of parcel-level land use changes in the study region. For this
explorative analysis, we extensively use the SCAG’s current land use data, combined with the
LACMTA rail station shapefile. The SCAG data file contains longitudinal land use information
of approximately 2 million land parcels in Los Angeles County for the years 1990, 1993, 2001,
2005, 2008, and 2012. Each parcel is identified by the SCAG’s unique land use coding scheme,
having nearly 140 types of detailed land use. We group the detailed land uses into 15 categories,
as shown in Table 2, and investigate how land use composition has evolved over time in the
study region.
Table 2. Land use classification (15 categories)
a TCU stands for Transportation, Communication, and Utilities; b Public Facilities include land parcels for
military purposes as well as schools and government offices.
More specifically, consideration is given to the following geographical boundaries of interest:
1. Entire county (i.e., Los Angeles County)
2. Transit station vicinities (0.5-mile radius)
a. near all stations
b. near Gold Line Phase I stations opened in 2003
c. near old stations opened before Gold Line Phase I
d. near newer stations opened after Gold Line Phase I
No. Category SCAG Land Use Codes
1 Single-family Residential 111*
2 Duplex & Townhouses 1122
3 Multi-Family Residential 112* except 1122
4 Other Types of Residential 110*, 113*, 114*, 115*
5 Commercial & Services 120*, 121*, 122*, 123*
6 Industrial 130*, 131*, 132*, 133*, 134*
7 TCU Facilities a 140*, 141*, … , 145*, 146*
8 Public Facilities b 124*, 125*, 126*, 127*
9 Mixed Developed 150*, 160*
10 Open Space and Recreational 180*, 181*, … , 187*, 188*
11 Urban Vacant & Under Construction 170*, 190*
12 Agricultural 200*, 210*, 211*, 212*, 220*, … , 260*, 270*
13 Non-Urban Vacant 310*, 320*, 330*, 340*
14 Water and Water Facilities 400*, 410*, …, 440*, 450*
15 Undetermined 0, 128*, 129*, 888*, 999*

27
3. Policy areas
a. Federal Renewal Community Initiative (FRCI) areas2
b. Federal Empowerment Zones (FEZ)3
c. State Enterprise Zones (SEZ)4
d. Los Angeles County’s 2005 TOD layer5
e. Los Angeles’ Business Improvement Districts (BID)6
f. Los Angeles’ Targeted Neighborhood Initiative (TNI) areas7
4. Overlapping areas in which each of the above six polices and transit proximity (0.5-
mile radius) are combined geographically (see Figure 17).
To understand land use distribution changes more effectively, we also calculate the Herfindahl-
Hirschman Index (HHI) for each data year, as shown below.
��� = � ����
��
2 To reduce unemployment and foster economic growth in blighted communities, the U.S. Department of
Housing and Urban Development introduced this initiative in 1993 (for more detailed information, see
http://portal.hud.gov/hudportal/HUD?src=/program_offices/comm_planning/economicdevelopment/progr
ams/rc). The Community Renewal Tax Relief of 2000 supported qualifying businesses in the
communities by providing employment credits and tax exempts. We acquire the policy layer that
indicates the designated communities from the City of Los Angeles’ open data website. These areas
include seven rail transit stations in Los Angeles. 3 Similar to FRCI, this program aims to improve the economic conditions of highly distressed
communities with a series of federal incentives. The FEZ areas are mostly located along the Blue and
Gold Lines. 4 The SEZ program was originated from the Enterprise Zone Act (AB 40) and the Employment and
Economic Incentive Act (AB 514) in 1984, and was established by SB 2023 and AB 296 in 1996
(Assembly Jobs, Economic Development, and the Economy Committee, 2010). The main purpose is to
encourage business investment in declining areas through incentives, such as business groups hiring
credits, longer net operating loss carryforward period, and the allowance of accelerated depreciation
(Assembly Jobs, Economic Development, and the Economy Committee, 2010). 5 The LA County’s TOD program is aimed at encouraging active and sustainable transportation modes
and facilitating economic activities through infill, compact, and mixed developments (Los Angeles
County, 2007). The 2005 layer includes six TODs around Hawthorn, Vermont, Willowbrook, Slauson,
Florence, and Firestone stations. 6 This program was introduced to the City of Los Angeles in 2003. The BID implementation has been
regarded as a notable example of collaborations between public and private agencies (Cook and
MacDonald, 2011). The BID boundaries (obtained from the City of Los Angeles’ website) show that
some of the districts are located near public transit stations. For instance, the South Park BID overlaps
with the 0.5-mile vicinity of Pico Station, while the Figueroa Corridor BID is associated with
Grand/LATTC (Los Angeles Trade-Technical College), LATTC/Ortho Institute, Jefferson/USC, EXPO
Park/USC and EXPO/Vermont stations. 7 This initiative was created to revitalize marginal neighborhoods in the city with Community
Development Block Grants. More specifically, the TNI aimed to make capital improvements and housing
rehabilitation through the implementation of a group of programs, including micro-loans, community
enhancement rehabilitation loans, and homeownership down payment assistance programs (City of Los
Angeles, n.d., http://planning.lacity.org/cwd/gnlpln/HsgElt/HE/Ch2Bkgnd.htm).

28
where si represents the share of each of the fifteen land use category (in terms of the parcel
count). A higher value of HHI (maximum=1) indicates that the area is dominated by one or
fewer land use types, whereas a lower value indicates a more diverse land use composition.
Figure 17. Overlapping policy areas and transit vicinity boundaries

29
IV-2. Results
Figure 18 shows the evolution of land use composition in Los Angeles County, as a whole.
More than 65% of the parcels in the county are used for single-family residential uses. While the
percentage of duplex and townhouses shows a substantial increase from 2001 to 2012, more
compact multi-family residential areas have not expanded (in terms of parcel counts as opposed
to housing units), suggesting that the overall residential land use has not intensified significantly
in the county. However, the ratio of vacant parcels (including urban vacant, under construction,
and non-urban vacant) has declined significantly, suggesting that new (infill) development has
taken place in the county.
Figure 18. Land use composition, 1990-2012 (Los Angeles County)
Areas in the county near transit (within 0.5-mile boundaries around stations) have a distinct
pattern of land use, compared to county-wide patterns (Figure 19a). The share of single-family
residential is much lower (less than 40%, in terms of parcel counts) in these areas, while a larger
proportion of the parcels around transit stations are designated for duplexes, townhouses, or
other types of multi-family housing units. In the vicinities, the proportion of commercial land
use is much larger than that in the entire county, indicating a more compact and diverse use of
land near transit stations. The declining trend of HHI values (from 0.224 in 1990 to 0.204 in

30
2012) also suggests that the land use composition in near-transit areas has been getting more
mixed.
Figure 19a. Land use composition, 1990-2012 (Rail transit vicinity)
Some additional patterns of land use are detected when we classify the transit vicinities into three
sub-categories based on the development timing of the nearest station (i.e., near the Gold Line
Phase I stations opened in 2003; near the old stations opened before Gold Line Phase I; and near
the newer stations opened after Gold Line Phase I) and analyze the trajectory of land use
composition in each sub-category (Figures 19b, 19c, and 19d). The decrease in HHI values
around the Gold Line Phase I stations (from 0.235 in 2001 to 0.207 in 2012) suggests that land
use in these areas has become more diversified after the Gold Line Phase I opening in 2003
(Figure 19b). However, the degree of land use mix is found to be higher in the areas around the
stations developed earlier (Figure 19c). Furthermore, these near-old-station areas also show a
relatively higher percentage of multi-family housing units (approximately +3~4 percentage
points), while the share of single-family residential is lower than the average of the entire transit
vicinity. In contrast, it appears that the parcels adjacent to newer stations opened after Gold Line
Phase I tend to be developed at a lower intensity with a much smaller proportion of multi-family
residential land, while the share of land for commercial and service uses has increased recently
(Figure 19d).

31
Figure 19b. Land use composition, 1990-2012 (near Gold Line Phase I stations)
Figure 19c. Land use composition, 1990-2012 (near stations opened before Gold Line Phase I)

32
Figure 19d. Land use composition, 1990-2012 (near stations opened after Gold Line Phase I)
Figures 20a through 20f show the patterns of land use transitions in each of the six selected
policy areas that are expected to facilitate a certain type of urban land development, while land
use change patterns in overlapping areas (i.e., policy zones overlapped with the 0.5-mile radius
transit vicinities) are presented in Figures 21a through 21f. Consistent with our expectations, a
majority of BID areas are used for commercial and industrial uses, and the share of these land
uses has gradually increased over the past 20 years (Figure 20e). However, the BIDs overlapped
with transit vicinity show a relatively smaller percentage of commercial and industrial land and
have a higher proportion of public facilities (Figure 21e). In addition, the SEZ areas are found to
be somewhat dominated by residential land. While the proportion of the land used for
commercial and public facility purposes has increased, industrial land has shrunken in the
enterprise zones (Figure 20c). Parcels included in the 2005 TOD boundaries areas are primarily
residential (approximately 80%), and the land use composition does not seem to change
drastically in these areas (Figures 20d and 21d).

33
Figure 20a. Land use composition, 1990-2012 (FRCI)
Figure 20b. Land use composition, 1990-2012 (FEZ)

34
Figure 20c. Land use composition, 1990-2012 (SEZ)
Figure 20d. Land use composition, 1990-2012 (TOD)

35
Figure 20e. Land use composition, 1990-2012 (BID)
Figure 20f. Land use composition, 1990-2012 (TNI)

36
Figure 21a. Land use composition, 1990-2012 (FRCI & Transit vicinity)
Figure 21b. Land use composition, 1990-2012 (FEZ & Transit vicinity)

37
Figure 21c. Land use composition, 1990-2012 (SEZ & Transit vicinity)
Figure 21d. Land use composition, 1990-2012 (TOD & Transit vicinity)

38
Figure 21e. Land use composition, 1990-2012 (BID & Transit vicinity)
Figure 21f. Land use composition, 1990-2012 (TNI & Transit vicinity)

39
V. Land Use Change Analysis – Multinomial Logistic Regression Analysis
V-1. Model, Variables, and Data
While the previous explorative analysis reveals informative patterns of land use change in our
study region, it does not enable us to distinguish the pure effects of transit on land use change
dynamics from the influences of other factors. In this section, we present a more rigorous
investigation designed to measure land use impacts of transit development/expansion. More
specifically, we analyze parcel-level land use change by employing a multinomial logistic model,
as shown below.8
P�y�|� = �� = exp (��� ∙ ��)∑ exp (��� ∙ ��)���
where ��� indicates the estimated coefficients for each determinant (X, including transit
variables) on the probability of land use conversion from i to j. Here, M represents all urban land
use types considered in the model estimation. In our case, detailed land uses are classified into
the following broad four categories: 1. Single-family Residential, 2. Multi-family Residential, 3.
Commercial & Industrial (includes a wide range of non-residential urban activities including
transportation, communication, utilities, public facilities, and mixed development), and 4. Open
Space (includes conservation, parks, and recreational areas). Based on this categorization, we
investigate the dynamics of i) new development (or infill development) of previously
undeveloped land parcels (urban vacant, under construction, and non-urban vacant), and ii)
redevelopment of industrial land from 2001 and 2012.
In our analysis, explicit attention is paid to each parcel’s proximity to three types of rail transit
stations. We identify land parcels near i) Gold.First: thirteen Gold Line Phase I stations; ii)
Before.GoldFirst: stations opened before Gold Line Phase I; and iii) After.GoldFirst: stations
opened after Gold Line Phase I; and analyze how the proximity to these stations influences new
(infill) development or redevelopment dynamics in the study area. Furthermore, using the
station-specific ridership count information obtained from Metro, we create an additional
variable, Low.Ridership, indicating whether the parcel is located near stations (Gold Line Phase I
only) with relatively lower ridership to explore the passible variation in the magnitude and
significance of land use impacts.
Given that our analysis focuses on land use change between 2001 and 2012, Gold.First
(representing parcels adjacent to the Gold Line Phase I stations opened in 2003) can enable us to
8 Multinomial logistic regression models have been increasingly employed in applied land use research.
For more detailed description of this approach, please see e.g., McMillen (1989), Zhou and Kockelman
(2008), Fragkias and Geoghegan (2010), and Kim et al. (2014).

40
capture the short-term land use impacts of transit development. In contrast, Before.GoldFirst can
provide an opportunity to gain insights into the long-term (or indirect) effects, while the
After.GoldFirst variable is expected to capture the influence that could emerge right after or even
prior to transit station opening. It should be stressed that Before.GoldFirst’s (long-term) effects
are not solely attributable to the development of these stations that took place in the 1990s.
Rather, these effects may be highly associated with the development of Gold Line Phase I, and
subsequent expansion of the entire transit system may have contributed to improving the utility
of old stations.
In addition to the transit variables, we consider other factors that could affect the probability of
land use change to control for their potential influences. These control variables include:
• each parcel’s physical conditions, including parcel size (ln.Parcel.Size, logged), shape
(Parcel.Shape, the ratio of parcel area to square of parcel’s perimeter), and slope
(Parcel.Slope, calculated based on the national elevation dataset downloaded from the
Multi Resolution Land Characteristics Consortium);
• neighborhood socio-economic characteristics (obtained from Census 2000 at the
block-group level), such as the median household income (ln.Nbhd.Med.Income,
logged) and the percentage of persons (25+ years old) who have a bachelor’s degree
or higher educational attainment (Nbhd.Education); and
• built environment and locational attributes, including population density
(Nbhd.Pop.Density), road network density (Nbhd.Road.Density), the distance to Los
Angeles’ central business district (Dist.CBD and Dist.CBD.Squared), and the share of
each category of land use in the neighborhood (Nbhd.SF%, Nbhd.MF%, Nbhd.CI%,
and Nbhd.OS%).
The descriptive statistics of these variables, included in our new development and redevelopment
model samples, are reported in Table 3. There were 182,173 vacant parcels and 51,893
industrial parcels (as of year 2001) in our new development and redevelopment datasets covering
the entire Los Angeles County. In the table, the first five variables (i.e., No Transition;
Transition to Single-family Residential; Transition to Multi-family Residential; Transition to
Commercial & Industrial; and Transition to Open Space) describe whether the parcels remained
in the same land use category or experienced a transition to another land use between 2001 and
2012. No Transition represents the baseline in our logistic regression. The means of No
Transition for vacant and industrial parcels are 0.728 and 0.772, respectively, suggesting that
approximately one-fourth of the land parcels in the study region underwent new- or re-
development from 2001 to 2012.

41
Table 3. Descriptive statistics
Variables Type
New Development
Model Sample
(Vacant Parcels)
Redevelopment
Model Sample
(Industrial Parcels)
Mean SD Mean SD
No Transition Binary 0.728 0.445 0.772 0.420
Transition to SF Residential Binary 0.201 0.401 0.017 0.130
Transition to MF Residential Binary 0.016 0.125 0.012 0.109
Transition to Com. & Industrial Binary 0.032 0.176 0.149 0.357
Transition to Open Space Binary 0.024 0.152 0.050 0.217
Gold.First.0.5 mile Binary 0.003 0.051 0.008 0.091
Before.GoldFirst.0.5 mile Binary 0.002 0.047 0.064 0.245
After.GoldFirst.0.5 mile Binary 0.000 0.017 0.026 0.159
Low.Ridership.0.5 mile Binary 0.002 0.046 0.001 0.037
Gold.First.0.75 mile Binary 0.008 0.087 0.014 0.116
Before.GoldFirst.0.75 mile Binary 0.005 0.071 0.120 0.325
After.GoldFirst.0.75 mile Binary 0.000 0.020 0.032 0.176
Low.Ridership.0.75 mile Binary 0.006 0.079 0.002 0.046
Gold.First.1 mile Binary 0.012 0.108 0.022 0.147
Before.GoldFirst.1 mile Binary 0.008 0.086 0.180 0.385
After.GoldFirst.1 mile Binary 0.001 0.031 0.031 0.172
Low.Ridership.1 mile Binary 0.009 0.092 0.004 0.061
ln.Parcel.Size Continuous 8.411 1.832 7.381 1.354
Parcel.Shape Continuous 0.206 0.049 0.195 0.051
Parcel.Slope Continuous 12.107 15.359 1.298 3.453
ln.Nbhd.Med.Income Continuous 10.904 0.493 10.489 0.503
Nbhd.Education Continuous 0.176 0.142 0.127 0.116
Nbhd.Pop.Density Continuous 508.2 1,032.7 2,128.4 2,369.9
Nbhd.Road.Density Continuous 4.883 6.734 12.747 10.441
Dist.CBD Continuous 56.088 22.510 20.276 12.907
Dist.CBD.Squared Continuous 3,652.5 2,314.6 577.7 761.1
Nbhd.SF% Continuous 0.135 0.212 0.139 0.194
Nbhd.MF% Continuous 0.010 0.038 0.044 0.093
Nbhd.CI% Continuous 0.101 0.143 0.266 0.194
Nbhd.OS% Continuous 0.014 0.043 0.081 0.150
Under.Construction Binary 0.070 0.255 NA NA
Sample Size 182,173 51,893
Note: The first five variables represent land use transition from 2001-2012.

42
V-2. Baseline Estimation Outcomes
Our baseline estimation results, in which a 0.5-mile radius is used to determine if each parcel is
located within the vicinity of a transit station (as done in many previous studies – see e.g., Guerra
et al., 2012), are presented in Tables 4 (new development model) and 5 (redevelopment model).
According to the results from our new development model estimation, generally, transit
investment is found to significantly facilitate development of previously undeveloped parcels,
while there are some notable patterns of variation. More specifically, Gold.First (indicating
parcels located within 0.5-mile of a Gold Line Phase I station), shows significant, positive effects
on development probabilities for all four types of urban land use transitions, while the
coefficients range from 1.215 (Commercial & Industrial) to 3.162 (Open Space). This result
suggests that the provision of public transit service does facilitate new (infill) development in
urban areas at least in short-run.
Parcels located near stations opened before Gold Line Phase I (i.e., Before.GoldFirst) are also
found to be more likely to be developed, particularly for Single-family Residential and
Commercial & Industrial purposes (0.377 and 0.289, respectively; significant at the 5% level),
although the magnitudes of the estimated coefficients are smaller than those of Gold.First. This
may imply that the positive impacts of transit can persist over a longer period of time (perhaps
thanks to the continuing expansion of the transit system in the broader study area), while long-
term effects may not be as large as immediate land use impacts of new station openings. In the
case of parcels near stations opened after Gold Line Phase I (i.e., After.GoldFirst), new
development for Multi-family Residential and Commercial & Industrial purposes seems to be
facilitated. This finding may be associated with growing emphasis (and incentives) on more
compact development in the process of recent transit development.
Our estimation results, however, suggest that such favorable effects would not be equally
realized around every station. Low.Ridership, a dummy variable included in our analysis to
explore if ridership matters, exhibits negative coefficients for all four types of new development.
In particular, the deterrent impacts on Single-family Residential (-2.516) and Open Space (-
3.023) are statistically significant at the 1% level. This finding deserves attention and further
investigation with a more rigorous treatment of potential endogeneity, as it implies that public
transit investment would not be able to generate expected land use outcomes, if the utility (or
usage) of transit service is limited.
The estimated coefficients of the remaining explanatory variables meet our expectations. For
instance, parcel slope is found to have significant, negative effects on development for urban
purposes, except Open Space. In contrast, the median household income in the neighborhood
shows a positive association with development probabilities, particularly for Single-family

43
Residential, suggesting that affluent areas are more likely to attract investment in new residential
development. Population density also shows a similar, positive influence on new development
of land parcels, as expected.
Another focus of this study is the effects of public transit development/expansion on
revitalization of nearby areas. As explained above, we examine this by analyzing land use
change (2001-2012) patterns of parcels which were initially used for industrial purposes using
our multinomial logistic regression model. The estimation results are presented in Table 5.
In the case of redevelopment, Gold.First exhibits significant, positive impacts on the
probabilities of redevelopment for Multi-family Residential (1.444) and Open Space (0.797). It
should be noted, however, that the magnitude of the impact on Open Space is substantially
smaller than that in our new development model presented earlier. This could be attributed to a
large amount of costs involved in converting industrial parcels to Open Space in a short period of
time. Also, Gold.First is found to have a moderate, negative association with the probability of
redevelopment for Single-family Residential uses, indicating the difficulties in converting
industrial sites to low-density residential purposes.
Before.GoldFirst’s coefficients also suggest that the impacts of transit on redevelopment are not
as strong as its influences on new development. The estimated coefficients for Single-family
Residential turns out to be negative again, while these transit stations are found to facilitate the
redevelopment of adjacent parcels for Open Space. After.GoldFirst even shows a negative
association with the probability of redevelopment for Open Space, as well as Multi-family
Residential. However, its impacts on the redevelopment for Commercial & Industrial turn out to
be positive, consistent with its impact on new development for these land uses.

44
Table 4. Logistic regression results (New development model)
Variables (1) Single-family
Residential
(2) Multi-family
Residential
(3) Commercial &
Industrial (4) Open Space
Intercept -19.410 *** -17.242 *** -12.796 *** -12.096 ***
Gold.First 1.964 *** 2.007 *** 1.215 *** 3.162 ***
Before.GoldFirst 0.377 ** 0.120 0.289 ** -0.173
After.GoldFirst 0.401 2.120 *** 0.700 ** 1.136
Low.Ridership -2.516 *** -35.191 -0.449 -3.023 ***
ln.Parcel.Size -0.681 *** -0.566 *** 0.211 *** 0.638 ***
Parcel.Shape 10.995 *** 8.457 *** -0.472 * -4.271 ***
Parcel.Slope -0.029 *** -0.062 *** -0.059 *** 0.045 ***
ln.Nbhd.Med.Income 1.580 *** 0.984 *** 0.615 *** 0.130 *
Nbhd.Education -1.563 *** 1.114 *** 0.230 -0.208
Nbhd.Pop.Density 0.00011 *** 0.00014 *** 0.00015 *** 0.00030 ***
Nbhd.Road.Density 0.025 *** 0.050 *** 0.010 *** -0.038 ***
Dist.CBD 0.150 *** 0.322 *** 0.100 *** 0.054 ***
Dist.CBD.Squared -0.00142 *** -0.00416 *** -0.00141 *** -0.00069 ***
Nbhd.SF% 2.218 *** 0.328 ** 1.116 *** 1.576 ***
Nbhd.MF% 0.252 1.413 *** 1.087 *** 1.006 *
Nbhd.CI% 1.215 *** 1.940 *** 3.200 *** -0.486 **
Nbhd.OS% 3.226 *** -0.776 * 3.083 *** 6.234 ***
Under.Construction 2.247 *** 2.011 *** 1.585 *** 0.654 ***
*** 1% level, ** 5% level, * 10% level significant; sample size = 182,173; pseudo r-squared: 0.358

45
Table 5. Logistic regression results (Redevelopment model)
Variables (1) Single-family
Residential
(2) Multi-family
Residential
(3) Commercial &
Industrial (4) Open Space
Intercept -5.300 *** -7.801 *** -1.116 *** -5.683 ***
Gold.First -1.700 * 1.444 *** 0.088 0.797 ***
Before.GoldFirst -0.575 *** 0.192 -0.136 ** 0.891 ***
After.GoldFirst -14.693 -1.190 ** 0.302 *** -1.354 ***
Low.Ridership -13.531 -15.731 0.150 -15.616
ln.Parcel.Size -0.759 *** -0.450 *** 0.088 *** -0.377 ***
Parcel.Shape 8.462 *** 2.668 *** -3.479 *** -8.21 ***
Parcel.Slope 0.165 *** -0.004 -0.039 *** 0.111 ***
ln.Nbhd.Med.Income 0.087 0.349 *** -0.095 *** 0.398 ***
Nbhd.Education -1.248 *** 3.081 *** 0.852 *** -0.085
Nbhd.Pop.Density -0.00018 *** 0.00006 ** -0.00004 *** 0.00004 **
Nbhd.Road.Density 0.046 *** 0.004 0.001 0.019 ***
Dist.CBD 0.149 *** 0.120 *** -0.009 *** 0.145 ***
Dist.CBD.Squared -0.00191 *** -0.00155 *** 0.00017 *** -0.00157 ***
Nbhd.SF% 2.331 *** 0.627 ** 0.938 *** -0.663 ***
Nbhd.MF% 2.966 *** 2.104 *** 2.694 *** -0.257
Nbhd.CI% 2.781 *** 0.365 1.172 *** 0.499 ***
Nbhd.OS% 0.489 -0.548 -0.276 ** 0.234
*** 1% level, ** 5% level, * 10% level significant; sample size: 51,893; pseudo r-squared: 0.094

46
V-3. Sensitivity Analysis
To check the robustness of our findings, we conducted the following two sets of additional
analyses: i) model estimation with a small sample size obtained through propensity score
matching; and ii) model estimation with the use of alternative transit vicinity boundaries (i.e.,
0.75- and 1-mile radiuses). First, we employed a propensity score matching method9 to identify
one-to-one matched parcels, having characteristics similar to those located near transit stations
(while maintaining our 0.5-mile radius to determine transit vicinity) and estimated our
multinomial logistic regression model to see how the sample change can modify the estimation
results. Second, we considered alternative ways to define transit vicinities using 0.75- and 1.0-
mile radiuses and tested how the land use impacts differ when the expanded boundaries are taken
into account. These estimation results are summarized in Tables 6 and 7.
Overall, our main findings from the baseline estimation are found to be quite robust, even though
there are few notable exceptions. For instance, in most settings, Gold.First shows statistically
significant, positive effects on new development for all of the four urban purposes considered,
while the magnitude varies to some extent (Table 6). The only exception comes from the
estimation with a small sample size obtained though the propensity score matching process. In
this case, Gold.First’s land use impacts on new development tends to be smaller and relatively
less significant than the baseline results. However, Gold.First still exhibits significant positive
impacts on the probabilities of new development for Single-family Residential and Open Space
at the 1% level. Furthermore, the deterrent effects of Low.Ridership are detected consistently,
suggesting that the vibrancy of transit system can play an important role in inducing new (infill)
development, particularly for Single-family Residential and Open Space.
Similarly, changes in our estimation setting do not appear to substantially modify our findings
regarding transit’s impacts on redevelopment of industrial parcels (Table 7). Gold.First is found
to have positive impacts on the probabilities of redevelopment for Multi-family Residential and
Open Space in all settings. Its negative impact on Single-family Residential is also detected in
all cases, while the magnitude of the effect varies. The pattern of the coefficients on
Before.GoldFirst and After.GoldFirst also remain largely unchanged, except in a few cases.
9 The characteristics of near-transit parcels may have some systematic differences from those outside of
the transit vicinities. To handle such differences and possible resultant biasedness, we employed a
propensity score matching method to create a quasi-randomized experiment for non-randomized
observations, which allowed us to compare outcomes of treatment and control groups in a more systemic
manner (Rosenbaum and Rubin, 1983). More specifically, similar to Hurst and West (2014), we used a
probit model to identify a control unit (i.e., matched land parcel) that had the closest estimated propensity
score to the treatment unit (a parcel around a transit station).

47
Table 6. Sensitivity analysis results summary (New development)
Variables Setting (1) Single-family
Residential
(2) Multi-family
Residential
(3) Commercial &
Industrial (4) Open Space
Gold.First
baseline 1.964 *** 2.007 *** 1.215 *** 3.162 ***
matching 1.795 *** -0.024 0.522 3.338 ***
0.75-mile 2.662 *** 2.535 *** 1.153 *** 2.747 ***
1-mile 2.510 *** 2.550 *** 0.694 *** 2.127 ***
Before.GoldFirst
baseline 0.377 ** 0.120 0.289 ** -0.173
matching 0.117 -0.719 * -0.135 -1.608 *
0.75-mile 0.818 *** -0.212 0.278 *** -0.573
1-mile 0.681 *** -0.262 0.606 *** -0.283
After.GoldFirst
baseline 0.401 2.120 *** 0.700 ** 1.136
matching -0.567 -0.056 -0.360 0.747
0.75-mile 0.160 1.408 * 0.707 ** 2.422 ***
1-mile -0.999 * 0.652 -0.026 0.834 ***
Low.Ridership
baseline -2.516 *** -35.191 -0.449 -3.023 ***
matching -3.015 *** -19.680 -0.142 -2.382 ***
0.75-mile -2.137 *** -14.949 -0.533 * -2.519 ***
1-mile -1.756 *** -15.533 -0.235 -1.001 ***

48
Table 7. Sensitivity analysis results summary (Redevelopment)
Variables Setting (1) Single-family
Residential
(2) Multi-family
Residential
(3) Commercial &
Industrial (4) Open Space
Gold.First
baseline -1.700 * 1.444 *** 0.088 0.797 ***
matching -2.234 ** 1.137 ** 0.195 1.096 ***
0.75-mile -1.325 * 1.001 *** 0.047 0.817 ***
1-mile -1.756 ** 1.232 *** 0.122 0.570 **
Before.GoldFirst
baseline -0.575 *** 0.192 -0.136 ** 0.891 ***
matching -0.574 * -0.010 -0.172 *** 0.572 ***
0.75-mile -0.445 0.236 -0.124 *** 1.008 ***
1-mile -0.087 0.296 ** -0.137 *** 0.915 ***
After.GoldFirst
baseline -14.693 -1.190 ** 0.302 *** -1.354 ***
matching -15.288 -1.094 * 0.320 *** -1.208 ***
0.75-mile -15.718 -1.406 ** 0.269 *** -1.766 ***
1-mile -15.618 -1.337 ** 0.275 *** -1.172 ***
Low.Ridership
baseline -13.531 -15.731 0.150 -15.616
matching -12.699 -16.395 0.065 -16.517
0.75-mile -14.457 1.358 ** 0.412 * -1.457
1-mile -13.585 0.871 0.082 -0.382

49
In sum, our sensitivity analyses reinforce a couple of findings derived from the baseline model
estimation. We confirmed Gold.First’s positive impacts on new development, suggesting that
vacant parcels near Gold Line Phase I stations (opened in 2003) were more likely to be
developed between 2001 and 2012 for various purposes. In other words, transit development or
expansion in urban areas can facilitate land (infill) development in subsequent years.
Before.GoldFirst’s coefficient pattern indicates the presence of long-term effects, although the
magnitude tends to be smaller and significant only for Single-family Residential and Commercial
& Industrial uses. As mentioned above, the persistence of these positive impacts could be
associated with the continuing expansion of the public transit system in the study region. The
opening of Gold Line Phase I and subsequent expansion might improve the utility of existing
stations and thus promote further development in nearby areas.
The deterrent effects of Low.Ridership also deserve attention. Low.Ridership shows negative
effects on new development, particularly for Single-family Residential and Open Space
consistently. This finding may indicate that the presence of transit stations alone would not lead
to infill development. Transit proximity appears to matter not only for new development but also
for redevelopment of industrial sites. Gold.First’s estimated coefficients from our
redevelopment model suggest that industrial sites are more likely to be developed for multi-
family housing or open space if located close to newly developed transit stations. However,
transit’s contribution to overall redevelopment probabilities seem less evident than its
contribution to new development.
VI. Summary & Discussion
This research empirically examines how transit investment shapes urban land use with a focus on
the public (rail) transit system in Los Angeles County that has expanded over the last few
decades. Using a historical geo-database of the changes in transit systems and land use, we
attempt to identify key factors that shape and re-shape land use change patterns and measure the
effects of transit development/expansion on parcel-level land use dynamics. This is mainly
accomplished by conducting multinomial logistic regression analyses for new (infill)
development and redevelopment of industrial sites, and the results seem to provide some
meaningful lessons, as discussed below.
First of all, not surprisingly, our analysis results suggest that the near-transit parcels are more
likely to experience development than those located outside of the vicinities of transit stations,
consistent with the findings of previous studies that have reported substantial effects of transit
investment on surrounding areas (Duncan, 2008; Pan and Zhang, 2008; Cervero and Kang, 2011;
Grube-Cavers and Patterson, 2015). In particular, we detect significant, positive impacts of Gold

50
Line Phase I stations (opened in 2003) on the probabilities that vacant parcels will be developed
for residential or commercial/industrial uses between 2001 and 2012. The large positive impacts
may be associated with timely efforts/plans made by municipalities to facilitate more intensive
land use in coordination with transit development, as discussed in Section 3.
Although relatively small in terms of magnitude, the presence of long-term effects is also found
in our study, even after controlling for the influence of other factors, such as population density
and other built environment characteristics. As mentioned in the previous section, the persisting
positive impacts on the areas surrounding older rail transit stations (i.e., Before.GoldFirst) may
not be solely due to the time lag between transit investment and land use change. In part, these
effects would be generated by the continuing improvement and/or expansion of the entire transit
system (through the development of Gold and Expo lines in our study area) that could
significantly improve the utility of existing stations developed in the 1990s. These indirect
benefits of transit expansion, largely ignored in most existing research, should not be
underestimated in making transit investment decisions.
Another important thing to be stressed is the deterrent effects of stations with low ridership. Our
multinomial regression results suggest that land use impacts of transit investment can be
dampened significantly if the transit system is not vibrant enough. In other words, a cyclical
relationship may exist between transit investment and land use change, and policy attention
needs to be directed towards ways of realizing a virtuous circle (for instance, transit system
vitality improvement – land development – further increase in ridership and efficiency).
According to our analysis, the way transit investment shapes redevelopment dynamics is not as
evident as its impacts on new (infill) development. However, we detect significant positive
effects of Gold Line Phase I stations on the probabilities of redevelopment of industrial lands for
multi-family residential and urban open space uses, while industrial parcels were rarely
converted to single-family housing. This finding may indicate the potential of transit investment
as a facilitator of site reuse. Admittedly, successful site reuse (or brownfield redevelopment)
often requires planning support and appropriate incentives, given the costs for environmental
cleanup and/or uncertainties involved in the redevelopment process.
Questions arise whether land use changes triggered by transit investment fully meet our goals for
creating more sustainable communities. Overall, our results suggest that transit development and
expansion (through continuing investment) can contribute to inducing infill and redevelopment
and thus achieving the vision of California’s planning and SB375. However, there are some
notable concerns. First, low-density (i.e., single-family) residential accounts for a large
proportion of new development around transit stations in Los Angeles County. This pattern is
particularly apparent in the areas with 0.5- to 1-mile distance from newly developed stations.
More attention needs to be paid to these areas, which are often excluded from conventional

51
transit-oriented planning processes with a narrow boundary of transit vicinity. Difficulties in
promoting transit ridership and making all stations vibrant are another concern to be addressed.
A systematic coordination of land use and transportation planning would be a solution, but little
is known about how we can realize the virtuous circle effectively. Planners also need to pay
attention to (potential) adverse consequences of rapid (re)development, especially the possibility
of displacement and exclusion, in order to make sure transit investment leads to a more
(environmentally and socially) sustainable future.
Achieving this vision of sustainability more successfully seems to require more concerted efforts
of various players from civic activists to government officials. This research attempts to provide
some meaningful insights into the connection between transit development and land use change
and support more informed, collective decision making.

52
References
Ahmad, S., Avtar, R., Sethi, M., & Surjan, A. (2016). Delhi’s land cover change in post transit
era. Cities, 50, 111-118.
Assembly Jobs, Economic Development, and the Economy Committee. (2010). California
enterprise zone: A review and analysis. Retrieved from
http://ajed.assembly.ca.gov/sites/ajed.assembly.ca.gov/files/publications/JEDE%20GTE
DA%20Final%20Report%20Jan%202010.pdf
Bartholomew, K. & Ewing, R. (2011). Hedonic price effects of pedestrian- and transit-oriented
development. Journal of Planning Literature, 26(1), 18-34.
Boarnet, M. G., & Sarmiento, S. (1998). Can land-use policy really affect travel behaviour? A
study of the link between non-work travel and land-use characteristics. Urban Studies,
35(7), 1155-1169.
Boarnet, M. G., Houston, D., Ferguson, G., & Spears, S. (2011). Land use and vehicle miles of
travel in the climate change debate: Getting smarter than your average bear. In Climate
Change and Land Policies, edited by G.K. Ingram and Y.H. Hong. 151-187. Cambridge,
MA: Lincoln Institute of Land Policy.
Carlton, I., Cervero, R., Rhodes, M., & Lavine, E. (2012). Developing and implementing the city
of Los Angeles’ transit corridors strategy: Coordinated action toward a transit-oriented
metropolis. Retrieved from
http://cityplanning.lacity.org/PolicyInitiatives/TransitOrientedDistrictPlanning/LATransit
CorridorsStrategy_WhitePaper%20Final%20(2012-10-01)%20Carlton.pdf
Cervero, R. (2001). Efficient urbanisation: Economic performance and the shape of the
metropolis. Urban Studies, 38(10), 1651-1671.
Cervero, R., & Kang, C. D. (2011). Bus rapid transit impacts on land uses and land values in
Seoul, Korea. Transport Policy, 18(1), 102-116.
Cervero, R., & Landis, J. (1997). Twenty years of the Bay Area Rapid Transit system: Land use
and development impacts. Transportation Research Part A: Policy and Practice, 31(4),
309-333.
Cervero, R., & Kockelman, K. (1997). Travel demand and the 3Ds: Density, diversity, and
design. Transportation Research Part D: Transport and Environment, 2(3), 199-219.
Cook, P. J., & MacDonald, J. (2011). Public safety through private action: an economic
assessment of BIDs. The Economic Journal, 121(552), 445-462.
Day, K., Boarnet, M., Alfonzo, M., & Forsyth, A. (2006). The Irvine–Minnesota inventory to
measure built environments: development. American Journal of Preventive Medicine,
30(2), 144-152.
Dawkins, C., & Moeckel, R. (2016). Transit-induced gentrification: Who will stay, and who will
go? Housing Policy Debate, DOI: 10.1080/10511482.2016.1138986
Duncan, M. (2008). Comparing rail transit capitalization benefits for single-family and
condominium units in San Diego, California. Transportation Research Record: Journal
of the Transportation Research Board, 2067, 120-130.
Elkind, E. N., Chan, M., & Faber, T. V. (2015). Grading California’s rail transit station areas.
Center for Law, Energy, & the Environment, University of California, Berkeley.
Retrieved from http://next10.org/sites/next10.huang.radicaldesigns.org/files/grading-
california-rail-transit-station-areas.pdf

53
Ewing, R., & Cervero, R. (2001). Travel and the built environment: A synthesis. Transportation
Research Record: Journal of the Transportation Research Board, 1780, 87-114.
Ewing, R., & Cervero, R. (2010). Travel and the built environment: A meta-analysis. Journal of
the American Planning Association, 76(3), 265-294.
Fragkias, M., & Geoghegan, J. (2010). Commercial and industrial land use change, job
decentralization and growth controls: A spatially explicit analysis. Journal of Land Use
Science, 5(1), 45-66.
Giuliano, G. (2004). Land use impacts of transportation investments-highway and transit. In The
Geography of Urban Transportation (3rd edition), edited by S. Hanson and G. Giuliano.
237-273. New York: The Guilford Press.
Grube-Cavers, A., & Patterson, Z. (2015). Urban rapid rail transit and gentrification in Canadian
urban centres: A survival analysis approach. Urban Studies, 52(1), 178-194.
Guerra, E., Cervero, R., & Tischler, D. (2012). Half-mile circle: Does it best represent transit
station catchments? Transportation Research Record: Journal of the Transportation
Research Board, (2276), 101-109.
Handy, S. (2005). Smart growth and the transportation-land use connection: What does the
research tell us? International Regional Science Review, 28(2), 146-167.
Huang, H. (1996). The land-use impacts of urban rail transit systems. Journal of Planning
Literature, 11(1), 18–30.
Hurst, N. B., & West, S. E. (2014). Public transit and urban redevelopment: The effect of light
rail transit on land use in Minneapolis, Minnesota. Regional Science and Urban
Economics, 46, 57-72.
Jun, M. J. (2012). Redistributive effects of bus rapid transit (BRT) on development patterns and
property values in Seoul, Korea. Transport Policy, 19(1), 85-92.
Kahn, M. E. (2007). Gentrification trends in new transit‐oriented communities: evidence from 14
cities that expanded and built rail transit systems. Real Estate Economics, 35(2), 155-182.
Kim, J. H. (2011). Linking land use planning and regulation to economic development: A
literature review. Journal of Planning Literature, 26(1), 35-47.
Kim, J. H., Hipp, J. R., Basolo, V., & Dillon, H. S. (2014). Municipal planning and urban land
use change dynamics in Southern California. Paper presented at the 53rd Annual Meeting
of Western Regional Science Association. San Diego, CA, USA.
Knaap, G. J., Ding, C., & Hopkins, L. D. (2001). Do plans matter? The effects of light rail plans
on land values in station areas. Journal of Planning Education and Research, 21(1), 32-
39.
Knight, R. L., & Trygg, L. L. (1977). Evidence of land use impacts of rapid transit systems.
Transportation, 6(3), 231-247.
Lane, B. W. (2008). Significant characteristics of the urban rail renaissance in the United States:
A discriminant analysis. Transportation Research Part A: Policy and Practice, 42(2),
279-295.
Los Angeles County. (2007). Transit Oriented Districts (TOD), Los Angeles County. ArcGIS
Shapefile. Retrieved from
http://portal.gis.ca.gov/geoportal/catalog/search/resource/details.page?uuid=%7B130BB
C9D-7724-459D-86E5-D37C42923E7E%7D
Los Angeles County Metropolitan Transportation Authority. (2009). 2009 Long Range
Transportation Plan. Retrieved from http://media.metro.net/projects_studies/images/final-
2009-LRTP.pdf

54
Loukaitou-Sideris, A. (2010). A new-found popularity for transit-oriented developments?
Lessons from Southern California. Journal of Urban Design, 15(1), 49-68.
Loukaitou-Sideris, A., Houston, D., & Bromberg, A. (2007). Gold Line corridor study final
report. Retrieved from
http://www.scag.ca.gov/Documents/Gold_Line_FINALReport_040907.pdf
McMillen, D. P. (1989). An empirical model of urban fringe land use. Land Economics, 65(2),
138-145.
McMillen, D. P., & McDonald, J. (2004). Reaction of house prices to a new rapid transit line:
Chicago’s midway line, 1983–1999. Real Estate Economics, 32(3), 463-486.
Pan, H., & Zhang, M. (2008). Rail transit impacts on land use: Evidence from Shanghai, China.
Transportation Research Record: Journal of the Transportation Research Board, 2048,
16–25.
Polzin, S. E., & P.E. (1999). Transportation/land-use relationship: Public transit’s impact on land
use. Journal of Urban Planning and Development, 125(4), 135–151.
Rosenbaum, P. R., & Rubin, D. B. (1983). The central role of the propensity score in
observational studies for causal effects. Biometrika, 70(1), 41-55.
Saelens, B. E., Sallis, J. F., & Frank, L. D. (2003). Environmental correlates of walking and
cycling: Findings from the transportation, urban design, and planning literatures. Annals
of Behavioral Medicine, 25(2), 80-91.
Salon, D., Boarnet, M. G., Handy, S., Spears, S., & Tal, G. (2012). How do local actions affect
VMT? A critical review of the empirical evidence. Transportation Research Part D:
Transport and Environment, 17(7), 495-508.
Southern California Association of Governments. (2016). The 2016-2040 Regional
Transportation Plan/Sustainable Communities Strategy: A plan for mobility, accessibility,
sustainability and a high quality of life. Retrieved from
http://scagrtpscs.net/Documents/2016/final/f2016RTPSCS.pdf
Vessali, K. V. (1996). Land use impacts of rapid transit: A review of the empirical literature.
Berkeley Planning Journal, 11(1), 71-105.
Zhou, B., & Kockelman, K. M. (2008). Neighborhood impacts on land use change: A
multinomial logit model of spatial relationships. Annals of Regional Science, 42(2), 321-
340.
Zuk, M., Bierbaum, A. H., Chapple, K., Gorska, K., Loukaitou-Sideris, A., Ong, P., & Thomas,
T. (2015). Gentrification, displacement and the role of public investment: A literature
review. Retrieved from
http://urbandisplacement.t324.com/sites/default/files/images/displacement_lit_review_fin
al.pdf


![ROAD DATA - [ ], [ ], [ ], [ ] & VICINITY](https://img.pdfslide.net/doc/110x75/61a4edb5a83d6b4d7a703c9f/road-data-amp-vicinity.jpg)