Embed Size (px)
Citation preview

STATE OF CALIFORNIA -- THE RESOURCES AGENCY GRAY DAVIS, Governor
DEPARTMENT OF WATER RESOURCES 1416 NINTH STREET, P.O. BOX 942836 SACRAMENTO, CA 94236-0001 (916) 653-5791
March 11, 2003 Honorable Michael J. Machado Member of the Senate State Capitol, Room 3086 Sacramento, California 95814 Dear Senator Machado:
This is in response to your letter regarding Mr. Dennis O’Connor’s comments on the Draft State Water Project Delivery Reliability Report.
Mr. O’Connor’s comments describe five major concerns with the report and
include miscellaneous observations and comments. The five concerns are:
1. Recent deliveries are lower than the modeled 2001 conditions. 2. The Year 2021 studies do not seem to reflect any growth in upstream consumptive use. 3. CALSIM II has not been calibrated, tested or otherwise verified. 4. The results appear inconsistent with previous estimates and models. 5. CALSIM II is not being used as designed. In the draft report, the Department commits to an evaluation of the adequacy of using CALSIM II for estimating SWP delivery ability. This effort is underway and consists of the simulation of a recent drought period (1987-1992), a simulation of a longer historic period, a sensitivity analysis of the key parameters of CALSIM II and a peer review conducted by the CALFED Science Program. The entire evaluation is expected to be done within a year. The simulation of the recent drought is complete. The results of this analysis are included in the following discussion of the concern that recent deliveries are lower than the modeled 2001 conditions. The remaining four major concerns are also discussed in the following text. Other comments contained in Mr. O’Connor’s report are addressed in Attachment 4. Recent deliveries are lower than the modeled 2001 conditions. This concern is expressed in several letters the Department of Water Resources received commenting on the draft report. The thrust of the concern is that the study results contained in this report for State Water Project deliveries are much higher than the amounts of water delivered by the SWP in the past and are, therefore, not accurate or reliable.

Senator Michael J. Machado March 11, 2003 Page 2 Recent amounts, as well as many historical SWP delivery amounts, are lower than the amounts estimated by the 2001 study. This occurs because the 2001 study is a projection of deliveries under year 2001 conditions. SWP contractors’ requests for water have increased in recent years, and 2001 is the first year that contractors’ requests exceeded 4.0 million acre-feet. Since the 2001 model study includes water demands that are significantly higher than historical levels, modeled water deliveries often exceed historical deliveries. The demands assumed in the model simulations serve as the upper limit for SWP deliveries. The simulation will export as much as allowable to meet the assumed demand; therefore, during wet times, the amount of deliveries is often controlled by the assumed demand. During dry periods, the assumed demands do not control the amount of delivery because water supply is the limiting factor. A good way to analyze how well CALSIM II simulates water system operations is to compare the results of the 2001 study to a recent dry period.
A comparison of adjusted historical and CALSIM II deliveries for the 1987-1992 dry period is shown on Attachment 1. It illustrates that the simulated values for deliveries in the draft report are significantly lower than the historical average deliveries; however, when the CALSIM II study is adjusted to reflect key conditions existing during that period, the resulting average delivery value is slightly lower (50,000 acre-feet per year) than the historical average delivery. Rather than over-estimating deliveries, CALSIM II appears to slightly underestimate deliveries during periods when water supply is low. This is an important conclusion that should help improve general confidence in using CALSIM II as an analytical tool. The Year 2021 studies do not seem to reflect any growth in upstream consumptive use. The model does account for growth in upstream consumptive use as well as other factors affecting river flows. For the modeling of upstream consumptive use, the Sacramento Valley is divided into seven hydrologic units known as depletion study areas. The average total modeled depletion for the 7 areas is 4,749 taf/yr for the 2001 study and 4,875 taf/yr for the 2021A study, an increase of 126 taf/yr. This average increase in depletion is projected to be offset on an average annual basis by an increase in precipitation-runoff of 145 taf/yr attributed principally to increased runoff from urbanization. In addition, average annual net groundwater extraction is projected to increase by 61 taf in the 2021A study compared to 2001 study. Attachment 2 and Tables 1 through 4 in Attachment 4 provide additional information on land use estimates and modeled depletion, precipitation-runoff gain and groundwater pumping for the 2001 and 2021 studies.

Senator Michael J. Machado March 11, 2003 Page 3 CALSIM II has not been calibrated, tested or otherwise verified. DWR continually checks CALSIM II to determine if it reasonably simulates water operations in the Sacramento – San Joaquin River system. Often this is done with the Bureau of Reclamation during the normal course of business and in coordination with interested stakeholders. The study comparing historical deliveries with modeled deliveries for 1987-1992 is an example of a check that can be done. Rigorous calibration techniques can be applied to only a few components of CALSIM II. Additional discussion of this concern is contained in Attachment 3. The results appear inconsistent with previous estimates and models. Mr. O’Connor cites two examples related to estimations of the delivery ability of the SWP and state that these are inconsistent with the studies used in the report. The first is a comparison of CALSIM II with a model using a daily time-step. CALSIM II uses a monthly time-step. The other refers to values contained in the Urban Water Management Plan (2000) for Castaic Lake Water Agency that are based upon DWRSIM, a predecessor to CALSIM II. The results of the daily time-step are different than the CALSIM II results and the observation is made that it is unknown which model more closely simulates actual export capacity. The choice of the analytical tool depends upon the purpose of the analysis. A daily time-step may be useful in certain circumstances where daily level of detail is important. In other cases, it may not be appropriate. A daily time-step model requires computations to be done for each day of the period of concern. If applied over the entire 73-year period, it requires data be developed for each day of every year, whether the data exists or not. For example, assumptions must be made about the distribution of flows throughout a month to generate assumed daily flows. A monthly time-step model may be the most practical tool to analyze long-term trends and averages; however, it may describe the system in a way that implies the system is more manageable than it actually is. DWR estimated the impact that a daily time-step can have upon the Delta exports estimates of CALSIM II. The initial modeling work using a daily time-step was done for the In-Delta Storage investigations. For the IDS study, a daily time-step Delta operational model was developed to assess the impact of daily variations on the balance of Delta outflow and the Central Valley Project and SWP exports. The net impact to the exports was sensitive to several other assumptions and resulted in a long-term annual average reduction of 100 to 200 taf/yr for the CVP and SWP combined. DWR is continuing to study the effect of the daily time-step upon long-term studies.

Senator Michael J. Machado March 11, 2003 Page 4 Regarding the 2000 Urban Water Management Plan for Castaic Lake Water Agency, DWR understands that the plan incorporates a more conservative interpretation of the results of the referenced DWRSIM study. DWR supports and encourages local water agencies to apply the level of SWP reliability they determine is appropriate for their areas, taking into account local supplies, other imported supplies, demand-management programs and local planning criteria. The SWP Delivery Reliability Report should serve as a reference document to help clarify decisions that are made at the local level. CALSIM II is not being used as designed. This comment relates to the fact that CALSIM II studies are best used as comparative studies. Although analyses based upon stand-alone studies are less certain than analyses using comparative studies, stand-alone studies provide very useful information. For example, DWR routinely uses stand-alone studies to develop strategies for operating the SWP. This process involves technical judgment and knowledge of key elements of the water system. This is the same process DWR encourages local water and planning agencies to take when applying the results in the report. Your letter, as well as all others commenting on the draft report and the corresponding responses, will be included in an appendix to the final report. In addition, they will be posted on the State Water Project Delivery Reliability Report website (http://swpdelivery.water.ca.gov) this April. Thank you for your comments and observations. If you wish to discuss these responses further, please contact me at (916) 653-7007 or your staff may contact Francis Chung, Chief of DWR’s Bay-Delta Office Modeling Support Branch, at (916) 653-5924.
Sincerely, Thomas M. Hannigan Thomas M. Hannigan Director Attachments cc: (See attached list.)

Mr. Dennis O’Connor, Consultant to Senate Committee on Agriculture and Water Resources State Capital, Room 406 Sacramento, California 95814
Ms. Jennifer Ruffulo Research Program Analyst California Research Bureau 900 N Street, Suite 300 Sacramento, California 95841

Attachment 1
Comparison of Historical and CALSIM II Deliveries for 1987-1992 As explained on page 6 of the draft report, past deliveries cannot accurately predict future deliveries. There have been continual, significant changes in the factors that determine State Water Project water delivery, including water demand. SWP water contractors’ requests for water have increased in recent years and 2001 is the first year that requests exceeded 4.0 million acre-feet (as shown in the attached Figure 1). The 2001 model study used for the draft report assumes that current water-use conditions, including water demands, exist for each year analyzed in the 73-year model study. Since the 2001 model study includes water demands that are significantly higher than historical levels, modeled water deliveries often exceed historical deliveries. One exception to this would be during dry periods because supply, not demand, determines the amount of water delivery. Historical values for SWP Table A deliveries from the Delta have been compared to the Table A delivery values of the 2001 model study for the dry period of 1987 through 1992 to assess how well CALSIM II simulates supply-limited conditions for a recent period. This comparison requires three adjustments to be made for the results to be comparable. One adjustment is made to the historical delivery data and two are made to the conditions assumed for CALSIM II. The historical delivery data are adjusted to be comparable to the model results as follows. Historically, a portion of the annual water allocation is carried over in SWP storage facilities and delivered in the following year. The CALSIM II model does not currently have criteria and procedures to allow carryover of allocated water from one year to the next. To make the historical data comparable to model data, the historical Table A delivery data was adjusted to show all the “carryover water” being delivered in the year of allocation rather than the following year. The adjusted historical and 2001 model study deliveries for the 1987 through 1992 dry period are compared in Figure 2. The modeled average delivery for this period is 1,670 taf/yr compared to the historical average of 2,030 taf/yr in CALSIM II format. The two adjustments made to CALSIM II are 1) changing the regulatory requirements for Delta operation to match the ones in place during 1987-92, and 2) adjusting the reservoir storages at the beginning of the period to match those that actually existed at that time. The 2001 model study in the draft report includes regulatory constraints that were not applicable to the 1987-1992 period (State Water Resources Control Board Decision 1641). For comparison purposes, a special 2001 model study was completed with the regulations that were in effect at that time (Decision 1485). As shown in Figure 3, this study produces higher SWP deliveries than the original study with the D-1641 constraints. The study’s modeled average delivery for this period is 1,910 taf/yr,

Attachment 1
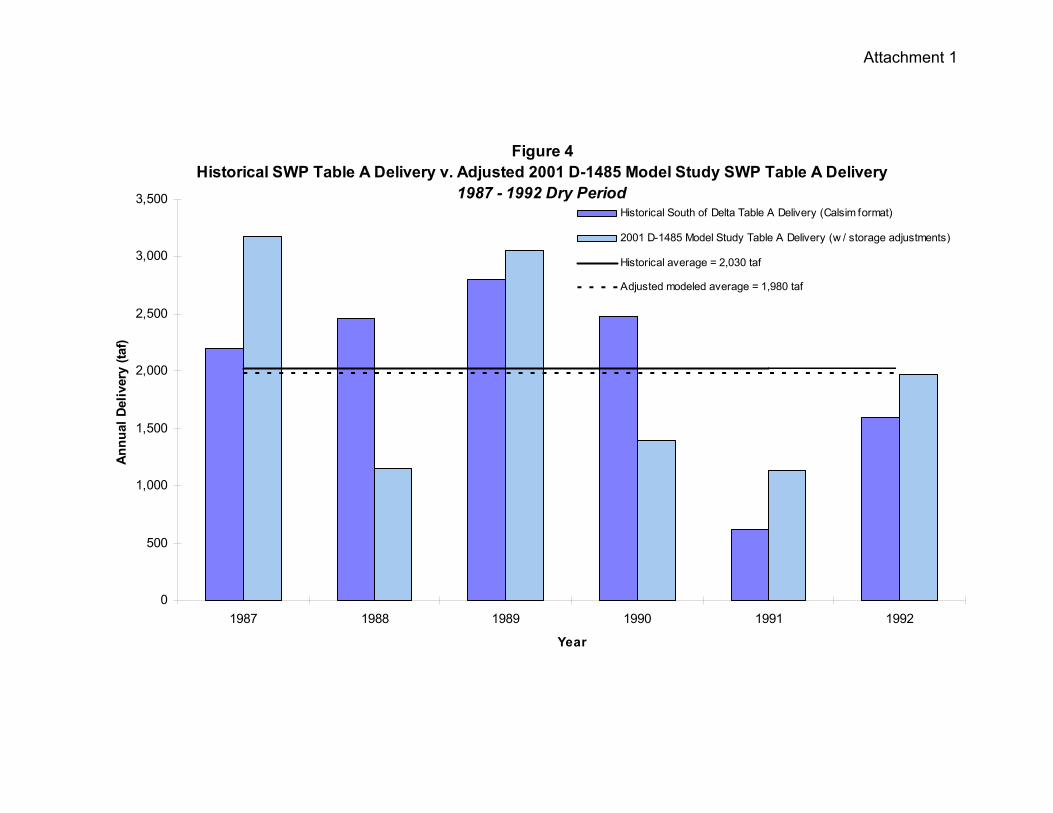
compared to the average of 1,670 taf/yr for the original study. A comparison of the revised study results with the historical deliveries is shown as Figure 3. Modeled SWP demand for 1986, a wet year just before the dry period, is 3,345 taf compared to the historical request of 2,364 taf. As a result of this higher model demand, modeled SWP storage at the beginning of the dry period is approximately 420 taf lower than the historical SWP storage. The modeled storage at the end of the dry period is essentially the same as the historical value. There is, therefore, an additional 420 taf of supply that would have been delivered in the model and the CALSIM delivery amounts during the dry period should be adjusted accordingly. To adjust for the 420 taf difference in storage, 70 taf was added to the modeled delivery for each of the six years in the dry period. This adjustment raises the average model delivery for the dry period to 1,980 taf/yr, 50 taf/yr lower than the historical average of 2030 taf/yr (Figure 4).

Attachment 1
Figure 1SWP Contractor's Table A Request versus 2001 Model Study SWP Table A Demand
0
500
1,000
1,500
2,000
2,500
3,000
3,500
4,000
4,500
1968
1969
1970
1971
1972
1973
1974
1975
1976
1977
1978
1979
1980
1981
1982
1983
1984
1985
1986
1987
1988
1989
1990
1991
1992
1993
1994
1995
1996
1997
1998
1999
2000
2001
2002
2003
Year
Ann
ual D
eman
d (ta
f)
SWP Contractor's Table A Request
2001 Model Study SWP Table A Demand

Attachment 1
Figure 2Historical SWP Table A Delivery versus 2001 Model Study SWP Table A Delivery
1987 - 1992 Dry Period
0
500
1,000
1,500
2,000
2,500
3,000
3,500
1987 1988 1989 1990 1991 1992
Year
Annu
al D
eliv
ery
(taf)
Historical South of Delta Table A Delivery (Calsim format)
2001 Model Study South of Delta Table A Delivery
Historical average = 2,030 taf
Modeled average = 1,670 taf

Attachment 1
Figure 3Historical SWP Table A Delivery versus 2001 D-1485 Model Study SWP Table A Delivery
1987 - 1992 Dry Period
0
500
1,000
1,500
2,000
2,500
3,000
3,500
1987 1988 1989 1990 1991 1992
Year
Ann
ual D
eliv
ery
(taf)
Historical South of Delta Table A Delivery (Calsim format)
2001 D-1485 Model Study South of Delta Table A Delivery
Historical average = 2,030 taf
Modeled average = 1,910 taf
Attachment 1
Figure 4Historical SWP Table A Delivery v. Adjusted 2001 D-1485 Model Study SWP Table A Delivery
1987 - 1992 Dry Period
0
500
1,000
1,500
2,000
2,500
3,000
3,500
1987 1988 1989 1990 1991 1992
Year
Annu
al D
eliv
ery
(taf)
Historical South of Delta Table A Delivery (Calsim format)
2001 D-1485 Model Study Table A Delivery (w / storage adjustments)
Historical average = 2,030 taf
Adjusted modeled average = 1,980 taf

Attachment 2
Upstream Depletion Estimates of demands and water use are part of the hydrology development for CALSIM II. Areas upstream of the Sacramento-San Joaquin Delta are divided into hydrologic basins or units known as Depletion Study Areas. These depletion areas are categorized as valley floor areas and rim basin areas. Because valley floor areas are more complex, have large demands, and need to be integrated with the operation of the CVP/SWP, they are represented in CALSIM II in much greater detail than rim basins. Flows from rim basins are determined prior to simulating CALSIM II and are input as a fixed time series. The attached map shows the delineation of the DSA boundaries. The land use acreage used to develop water demands for each DSA is based on the desired Level of Development. Fixed levels of land use are used to determine water demands for the existing (normalized year 1995) and future (year 2020) LOD. The table below contains land use assumptions for each DSA in the Sacramento Basin. Levels of development between 1995 and 2020 are estimated by linear interpolation. Sacramento Basin, Valley Floor Land Use (acres) 1995 2020 Difference DSA Urban Agriculture Urban Agriculture Urban Agriculture
58 67,400 37,400 110,000 33,700 42,600 -3,70010 21,800 188,000 33,300 199,600 11,500 11,60012 7,900 370,100 12,800 386,000 4,900 15,90015 3,400 279,200 4,800 279,800 1,400 60069 49,900 392,400 81,000 384,800 31,100 -7,60065 38,100 265,400 61,100 255,600 23,000 -9,80070 180,500 126,800 284,600 108,100 104,100 -18,70054 17,900 297,700 28,800 291,300 10,900 -6,40055 24,900 135,300 35,700 126,400 10,800 -8,900Total 411,800 2,092,300 652,100 2,065,300 240,300 -27,000
Source: DWR, Bay-Delta Office, CU model input for use in CALSIM II, based on Bulletin 160-98 data. Water consumption for different land use categories is calculated using DWR’s Consumptive Use model. The CU model simulates monthly soil moisture conditions over the 73-year period of simulation for 12 different agricultural crop categories, urban irrigated landscape and native vegetation for each DSA. Based on minimum soil moisture requirements the CU model calculates the Consumptive Use of Applied Water for the irrigated land use categories. Municipal and industrial demands are not fully addressed in the CU model. A large portion of M&I demands are non-consumptive and, therefore, not considered by the CU model. M&I diversions can have a large influence on reservoir operations and have, therefore, been included in CALSIM II for the American and Lower Sacramento rivers. M&I water diversion requirements are determined based on recent historic diversions for existing LOD and contract amounts for future LOD.

Attachment 2
The CU model uses a very simple approach to estimate outdoor urban water demands. The urban land use classification combines residential, commercial and industrial sectors. The total urban acreage is subsequently proportioned between “lawns,” “vacant lots” and “impervious surfaces.” To calculate the consumptive use of these three land types, the following assumptions are made:
• Consumptive use of lawns is identical to irrigated pasture; • Consumptive use of vacant lots is identical to native vegetation; and • All precipitation on impervious surface results in runoff, i.e., zero consumptive
use. The CU model assumes 10-15 percent of CUAW is lost to the system as non-recoverable losses. The CU model is also used to adjust the historical rainfall runoff due to any land use change. The table below contains average annual irrigation demands by crop and DSA as calculated by the CU model. The total average annual depletion (CUAW and non-recoverable losses) for the Sacramento Valley floor at 2001 LOD is 4,749 taf/yr compared to 4,875 taf/yr at 2020 LOD. Consumptive Use of Applied Water (ac-ft/ac)
DSA Alfalfa Citrus Cotton Field Grain Truck Orchard Pasture Rice Sugar Beets
Toma-toes
Vines Urban
10 2.6 1.6 1.4 0.2 1.3 2.2 3.0 3.5 2.0 2.1 1.8 0.8 12 2.8 2.0 1.5 0.3 1.4 2.2 3.1 3.6 2.1 2.0 1.9 0.8 15 2.8 2.0 1.5 0.3 1.3 2.2 3.2 3.6 2.1 2.0 0.8 58 2.3 1.4 1.3 0.1 1.2 2.1 2.7 1.7 0.7 65 2.7 1.5 0.2 1.4 2.2 3.1 3.6 2.1 2.0 1.7 0.8 69 2.6 2.0 1.4 0.2 1.3 2.2 3.0 3.5 2.0 1.9 0.7 70 2.7 1.5 0.2 1.3 2.3 3.0 3.5 2.1 1.9 1.9 0.8
55 lowland 1.9 1.3 0.0 0.9 1.3 2.6 3.4 1.5 1.2 1.2 0.6 55 upland 2.9 1.6 0.3 1.7 2.4 3.0 3.6 2.3 1.9 1.9 0.8
Notes: Blank values indicate that the crop is not grown in the region. Reported urban CUAW is based on an assumed irrigated landscape area of 25%
The current figures in the SWP Delivery Reliability Report are based on Bulletin 160-98 land use estimates. The next revision of the report, planned in approximately two years, will be based on revised estimates in the California Water Plan Update 2003. The calculation of irrigation demands for paddy rice differs from other crops. During the growing season rice fields are flooded to control weed growth. In the CU model water applied for flooding in April and subsequent months is treated as a consumptive use. The fields are assumed to be flooded to a depth of nine inches. The water recovered through draining the fields in September (1.5 to 2.0 inches) is added to the local water supply as an accretion. The quantity and timing of irrigation demands

Attachment 2
represent average planting and harvesting conditions in each DSA. Return flows from rice drainage are added to the time series of accretions for each basin. Return flows average approximately 70 taf/yr from a total of 485,000 acres of paddy rice at the 2001 LOD. Over the last few decades there have been substantial changes in the quantities of water diverted for rice production. Applied water demands have dropped as irrigation efficiencies have increased and farmers have switched to varieties with shorter growing periods. More recently fall flooding of rice fields for decomposition of rice straw has been adopted as an alternative to burning. Irrigation demands for rice are currently being reviewed and it is likely that model demands will be adjusted for the CALSIM II runs required to support the California Water Plan Update 2003.

Attachment 3
1
CALSIM II Evaluation DWR’s Bay-Delta Office is currently undertaking a “historical project operations study” to investigate the accuracy of the model’s water supply estimates. The purpose of the historical project operations study is to compare CALSIM II results with historical operations and investigate the source of any differences in historical and simulated performance. The historical project operations studies is part of a larger CALSIM II evaluation process. Other components of this evaluation will include a survey of stakeholders; a model peer review by leading academics and practitioners; and a sensitivity analysis on model inputs and parameters. Initial results from the historical project operations study are expected to be available by March 2003. The historical project operations study, conducted by DWR, will compare CALSIM II model results to recent historical operations for water years 1975 to 1998. This 24-year period includes both the 1976-77 and 1987-92 droughts. It also includes water year 1998 that is one of two years for which detailed analysis of historical water supply and demand is being conducted as part of the California Water Plan Update 2003 (Bulletin 160-03). For the historical project operations study, input to the current CALSIM II model will be changed to reflect historical conditions. The inflow hydrology will be revised to reflect historical rather than current or projected level of development. Demand will be calculated for the historical land use, based on DWR’s land surveys and county commissioners’ reports, rather than a fixed level of development. Project contracts and entitlements will be changed to their historical level. Lastly operation logic will be changed to reflect the changing regulatory base line such as the release of the State Water Resources Control Board 1995 Water Quality Control Plan and State and federal biological opinions for Delta smelt and Chinook salmon. The study will be limited in geographical scope to a dynamic operation of the Sacramento Valley, the Delta, and CVP-SWP facilities south of the Delta. Delta inflows from the San Joaquin Valley and the East Side Streams will be fixed at their historical level. In dry years when the system is system is supply limited, the SWP target demands will be set equal to the historical requests. In wet years when the system is demand driven, target demands will be set equal to historical deliveries. Similarly for the CVP, historical requests or annual contract amounts will be an upper bound on CVP deliveries. Modeling of the CVP-SWP system and areas contributory to the Sacramento-San Joaquin Delta requires considerable input data. The majority of the data relates to either system inflows or demand data for the 73-year period of simulation. As described in page 7 of the report, DWR has committed to undertake a sensitivity analysis on SWP water delivery reliability. This analysis would examine the effects of certain assumptions, parameters and input data on model results. The aim of the sensitivity analysis is to identify the input data that most strongly affect model results so that future
Attachment 3
2
work within the Department can be focused on refining estimates of these key determinants. The current representation of groundwater in CALSIM II is only a first step towards developing a fully integrated groundwater surface water model. The Department is currently developing the Central Valley Groundwater Surface water Model with the eventual aim of linking this model to CALSIM II to study impacts of surface water operations, groundwater pumping and land use change on groundwater elevations. The current groundwater model component of CALSIM II affects surface water operations through the calculation of the stream-groundwater interaction. There is considerable uncertainty about the magnitude of this interaction. In areas with high groundwater levels, groundwater inflow to streams is a function of groundwater head. In areas of low groundwater elevation where stream seepage flows to the groundwater, there is an assumed hydraulic disconnect between the stream and the aquifer so that seepage is independent of groundwater elevation. It is acknowledged that groundwater elevations are not accurately modeled in CALSIM II. As calculated by CALSIM II, groundwater inflows to the stream system in the upper Sacramento Valley average 255 taf/yr. Stream losses to groundwater in the lower Sacramento Valley average 40 taf/yr. This compares with an average annual Sacramento River inflow to the Delta (at Freeport) of approximately 16 maf/yr. In any discussion on model “calibration” it is important to remember that CALSIM II is a mass-balance accounting model and not a distributed hydrologic model that simulates a physical process. It is also important to understand that the hydrology development is based on historical gage data. Valley floor accretions and depletions are calculated as closure terms in a hydrologic mass balance calculated for each Depletion Study Area. The accretions represent local ungaged runoff into the stream system and are calculated based on gage data for stream inflows and outflows across the hydrologic boundary and estimates of urban and agricultural consumptive use of applied water within the region. The accretions and depletions also contain all the errors in the mass balance stemming from poor gage data or incorrect estimates of groundwater extraction or agricultural and urban water use. True calibration techniques can only be applied to a few components of the CALSIM II model, such as the Artificial Neural Network used for determining flow-salinity relationships in the Delta and the multi cell groundwater model.

Attachment 4
1
Responses to Other Comments from Dennis O’Connor, Assistant Director, California Research Bureau Comment: Except for the year 2000, historical deliveries are always less than the median modeled delivery of 3.3 maf. Response: The 73-year median modeled delivery of 3.30 maf is based on year 2001 level of development including 2001 SWP demand conditions. SWP contractor’s requests for water have increased in recent years and reached 4.1 maf in 2001 and initial requests for 2003 are also 4.1 maf. The highest SWP Contractor’s request prior to 2001 was 3.6 maf which occurred in the years 1992 and 2000. This request is slightly lower than the 73-year median model demand of 3.74 maf. Since the 2001 model study includes SWP water demand which is significantly higher than historical levels prior to 2001, modeled water deliveries often exceed historical deliveries. Comment: SWP contractor’s Table A requests have been higher than the median modeled delivery on 9 occasions. Response: Our records show that SWP contractor’s Table A requests have exceeded the median modeled delivery of 3.3 maf in six years as shown in the following table. The years with requests above 3.3 maf are 1991, 1992, and 2000 through 2003.
Year SWP Contractor’sTable A Request
(maf) 1986 2.4 1987 2.7 1988 2.6 1989 3.0 1990 3.1 1991 3.5 1992 3.6 1993 2.7 1994 2.7 1995 3.1 1996 2.7 1997 3.0 1998 3.2 1999 3.2 2000 3.6 2001 4.1 2002 3.9 2003 4.1

Attachment 4
2
Comment: SWP has delivered 95 percent or more of contractor’s requests only once in the last 12 years. Response: For the period 1989-2002, the SWP allocated 100 percent of the contractor’s requests in 1989, 1993 and 1996-1999. Project water delivery was 95 percent of the requested amount in 1989 and 93 percent of the requested amount in 1996. Project water deliveries in the years 1993 and 1997-1999 ranged from 55 to 85 percent of the initial requests due to substantial improvement in local water supplies after the request was submitted. Comment: The minimum model demand of 3.0 maf is well above the 1.7 maf ultimately demanded by SWP contractor’s in 1998. CALSIM does not consider that contractors might reduce their demand below 3.0 maf. Response: Many factors must be considered when estimating the appropriate level of SWP model demand for each year including local rainfall in the water use areas. Currently, SWP model demands have only been determined through 1994. The wet year of 1998 had above normal winter precipitation as well as unusually high rainfall in May. Sacramento had 3.04 inches of rain in May 1998 (661 percent of normal) while the Los Angeles Civic Center had 3.10 inches (1,940 percent of normal). To the extent possible, actual 1998 conditions will be taken into account when modeling 1998. Comment: The median model delivery in below-normal years is higher than the median model delivery in above-normal years. Response: The median model delivery in below-normal years is 46 taf greater than the median model delivery in above-normal years. This occurs because the average model demand in below-normal years is 164 taf higher than the average model demand in above-normal years as shown in the attached Figure 1. In below-normal years, the resources are often still available to supply this higher demand. Comment: The adjusted historical SWP Table A dry-year delivery of 1.4 maf in 2001 is less than all modeled Table A deliveries in years classified as dry. Response: The adjusted delivery of 1.4 maf in 2001 does not include 160 taf of water allocated in 2001 and carried over and delivered in 2002. This carryover should be added to the 1.4 maf delivery to make it comparable to modeled deliveries. With this adjustment, the value for 2001 is 1.56 maf, which is slightly higher than the lower bound of the modeled delivery in dry years.

Attachment 4
3
Comment: The adjusted historical SWP Table A wet-year deliveries of 1.7 maf in 1998 and 3.0 maf in 1999 are less than all modeled Table A deliveries in years classified as wet. Response: Modeled deliveries are similar to 1999 in three years classified as wet. The wet year of 1998 had above normal winter precipitation as well as unusually high rainfall in May. To the extent possible, actual 1998 conditions will be taken into account when modeling 1998. Comment: Why does 2021 delivery exceed 2001 delivery in the exceedance range of 80 to 85 percent in Figure 1 of the draft report? Response: Increased urbanization from 2001 to the 2021 projected level of development results in greater precipitation-runoff. Increased 2021 demands will result in greater groundwater pumping. These two factors result in higher delivery in 2021 compared to 2001 in the 80 to 85 percent range of Figure 1 of the draft report. The dry years with higher delivery in 2021 compared to 2001 are 1932, 1933 and 1960. The modeled depletion, precipitation-runoff gain and groundwater pumping for the 2001 and 2021 studies for the 1922-1994 study period and each of these years are shown in Tables 1, 2, 3 and 4, respectively. Comment: SWP delta exports cannot be evaluated without also looking at CVP delta exports. Response: DWR and the Bureau of Reclamation, in coordination with public agencies, have spent over two years developing CALSIM II. For years, the Bureau and DWR used different computer models to conduct planning analyses. The Bureau and DWR now agree CALSIM II sufficiently represents the operation of the CVP and the SWP and is the best model of its type for analyzing proposed projects. The studies used in the report are referred to as Benchmark Studies (May 17, 2002) and have been reviewed and accepted by the Bureau and DWR. Summary reports of the results of these studies, including the values for CVP exports, are available on the Internet at http://modeling.water.ca.gov/hydro/studies/SWPReliability/index.html. Comment: CALSIM II assumes water delivered any time of the year is useful to all contractors. Response: The monthly model demands are based on historical data and information received from SWP contractors. Under some contracts, project water is delivered in a monthly pattern that assumes the individual contractor will provide local storage facilities when using SWP water to meet local water demand.
Attachment 4
4
Comment: The historical weather pattern is no longer a reliable indicator of the future. Response: The impact of global warming is being evaluated as part of the 2003 California Water Plan Update (Bulletin 160). The incorporation of the potential effects of global warming in estimates of the delivery ability of the SWP is expected to be a topic addressed in the peer review and other public discussions regarding CALSIM II. Comment: The modeling simulation does not include the years 1995-2001. Response: We are currently updating the CALSIM II database to include the years 1995-1998. The quality-control process for some of the data needed for CALSIM II is a slow one. Updating CALSIM II with post-1998 data will be done at a later date.

Attachment 4
5
2021 Studyminus
2001 Study 2021 Study 2001 Study
Precipitation-runoff gain 4,683 4,828 145
Depletion 4,749 4,875 126
Net groundwater pumping 1,217 1,278 61
Gain - depletion + pumping 1,151 1,231 80
2021 Studyminus
2001 Study 2021 Study 2001 Study
Precipitation-runoff gain 1,958 2,041 83
Depletion 5,026 5,144 118
Net groundwater pumping 1,995 2,085 90
Gain - depletion + pumping -1,073 -1,018 55
2021 Studyminus
2001 Study 2021 Study 2001 Study
Precipitation-runoff gain 1,726 1,871 145
Depletion 5,190 5,295 105
Net groundwater pumping -1,966 2,055 89
Gain - depletion + pumping -1,498 -1,369 129
2021 Studyminus
2001 Study 2021 Study 2001 Study
Precipitation-runoff gain 3,060 3,221 161
Depletion 4,788 4,925 137
Net groundwater pumping 1,263 1,355 111
Gain - depletion + pumping -465 -349 135
Note: Precipitation-runoff gain is the stream flow accretion due to local ungaged streams that are not modeled explicitly in CALSIM II. Net groundwater pumping is the net groundwater extraction calculated as pumping less recharge from deep percolation.
Average Precipitation-Runoff Gain, Depletion and GroundwaterPumping for Sacramento Valley Depletion Study Areas
(1922-1994 average in taf/year)
Table 1
Table 31933 Precipitation-Runoff Gain, Depletion and Groundwater
Pumping for Sacramento Valley Depletion Study Areas
Table 21932 Precipitation-Runoff Gain, Depletion and Groundwater
Pumping for Sacramento Valley Depletion Study Areas(taf/year)
(taf/year)
(taf/year)
Table 41960 Precipitation-Runoff Gain, Depletion and Groundwater
Pumping for Sacramento Valley Depletion Study Areas

Attachment 4
6
Figure 12001 Model Study Table A Delivery Sorted By Water Year Type
(Bold lines show average Table A demand for each water year type)
0
500
1,000
1,500
2,000
2,500
3,000
3,500
4,000
4,500
1977
1988
1991
1924
1929
1990
1931
1992
1933
1934
1976
1994
1925
1932
1955
1960
1949
1947
1930
1961
1987
1989
1926
1964
1944
1939
1981
1985
1948
1950
1972
1962
1937
1935
1945
1959
1979
1968
1936
1946
1923
1966
1978
1980
1957
1928
1922
1993
1940
1973
1951
1954
1986
1941
1983
1952
1969
1965
1967
1938
1982
1958
1927
1943
1942
1963
1956
1974
1984
1970
1975
1953
1971
Critical Dry Below Normal Above Normal Wet
Ann
ual D
eman
d / D
eliv
ery
(taf)