Embed Size (px)
Citation preview
State of Cockburn Sound
Report
2013
S T A T E O F C O C K B U R N S O U N D 2 0 1 3 R E P O R T2
Cover: Top – Aerial image of BP Refinery, Bottom – A nudibranch (a marine snail). This Page: Looking north into Cockburn Sound across Cape Peron.
Contents
Acronyms 4
Preface 5
ExecutiveSummary 6
CockburnSoundManagementCouncilMembership 10
SettingtheScene 11
What’sNew? 13
2013MonitoringProgramOutcomes 15
CockburnSoundReportCards2013 21
ReportCardComparison2003-2013 32
Figure 1 7AsmallnumberofCSMCmembersandtheirDepartmentofEnvironmentRegulation(DER)Executivesupport.
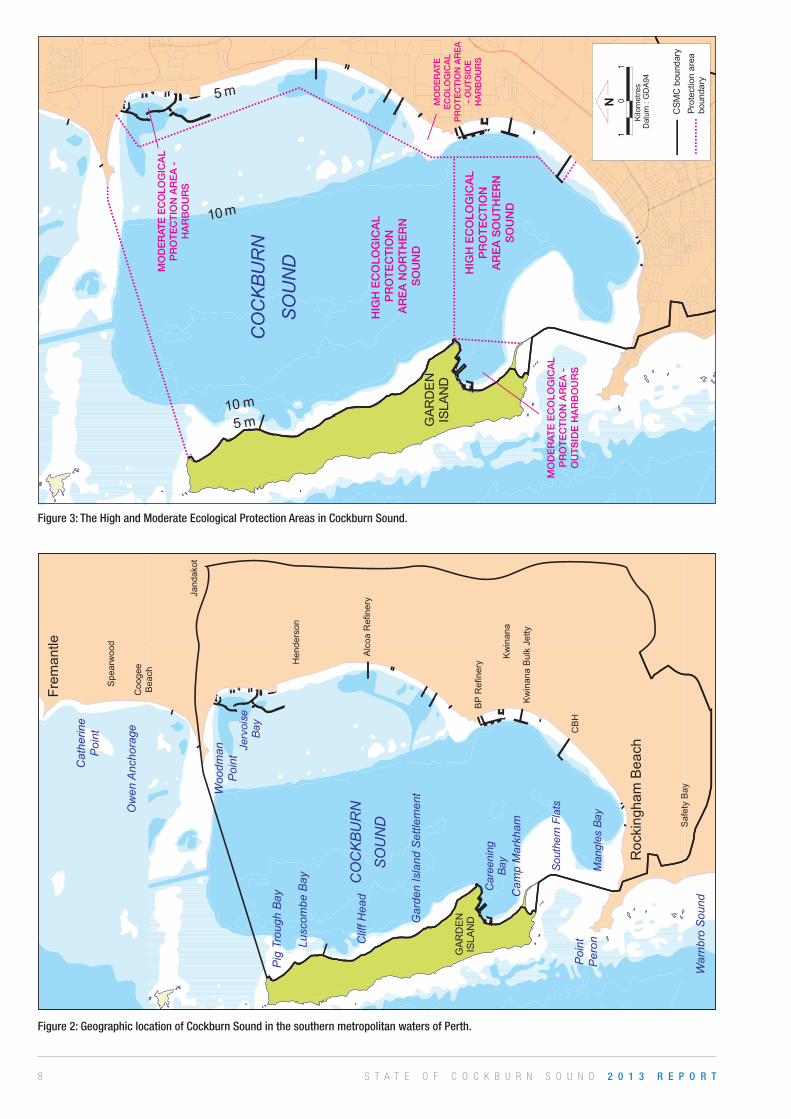
Figure 2 8GeographiclocationofCockburnSoundinthesouthernmetropolitanwatersofPerth.
Figure 3 8TheHighandModerateEcologicalProtectionAreasinCockburnSound.
Figure 4 9ProcessleadingtothetablingofthisreportinParliamentandreleasetothepublic.
Figure 5 14AconceptualdiagramofthenutrientenrichmentpressureresponsepathwayinCockburnSound.
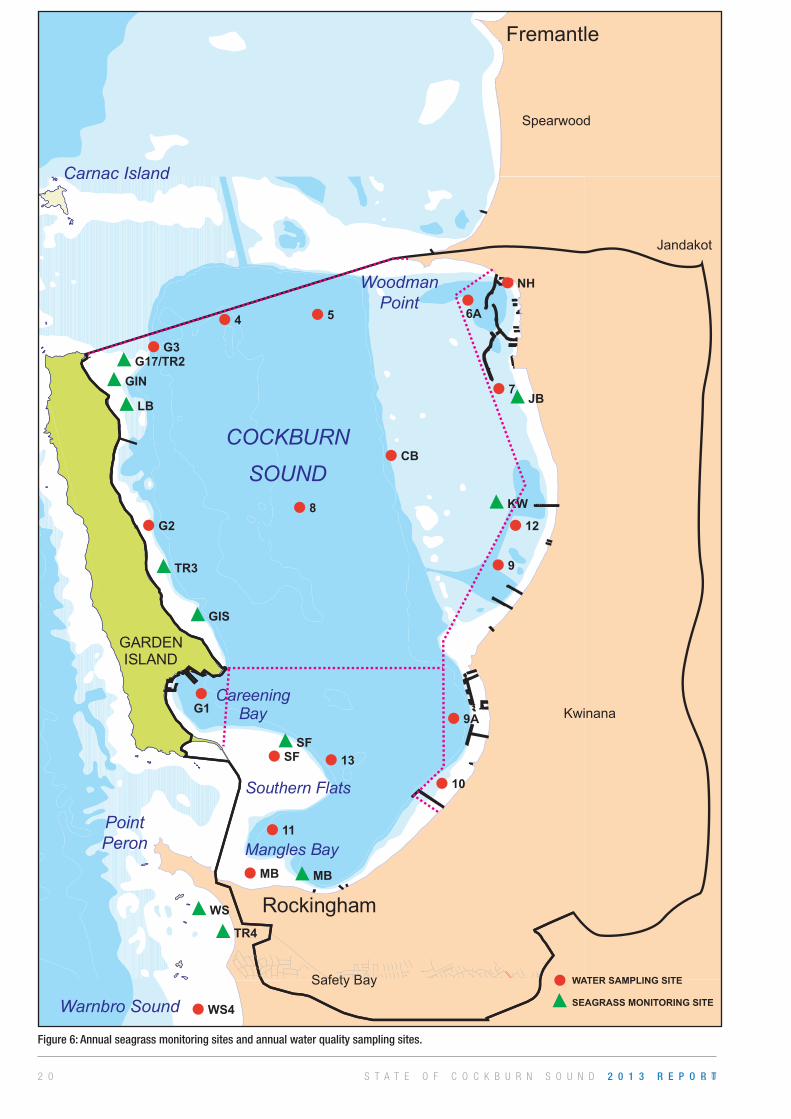
Figure 6 20Annualseagrassmonitoringsitesandannualwaterqualitysamplingsites.
Figure 7 29ECOSYSTEMHEALTH-NutrientEnrichment
Figure 8 30ECOSYSTEMHEALTH-Lightattenuationcoefficient(L)andchlorophyll‘a’(C)
Figure 9 31ECOSYSTEMHEALTH-PhytoplanktonBiomass
3S T A T E O F C O C K B U R N S O U N D 2 0 1 3 R E P O R T
S T A T E O F C O C K B U R N S O U N D 2 0 1 3 R E P O R T4
CSMC CockburnSoundManagementCouncil
EMP Environmental Management Plan for Cockburn Sound and its Catchment2005
EQC EnvironmentalQualityCriteria
EQG EnvironmentalQualityGuideline
EQMP EnvironmentalQualityMonitoringProgram
EQS EnvironmentalQualityStandard
HEPA HighEcologicalProtectionArea
KIC KwinanaIndustriesCouncil
MEPA ModerateEcologicalProtectionArea
RevisedSEP RevisedState Environmental (Cockburn Sound) Policy 2013
SDOOL SepiaDepressionOceanOutfallLandline
SEP State Environmental (Cockburn Sound) Policy 2005
SOP Manual of Standard Operating Procedures for Environmental Monitoring against the Cockburn Sound Environmental QualityCriteria
TBT Tributyltin(ingredientinanti-foulingpaint)
TSS Totalsuspendedsolids
Acronyms
5S T A T E O F C O C K B U R N S O U N D 2 0 1 3 R E P O R T
Preface
ItiswithpleasurethatIsubmitthisStateofCockburnSoundreporttotheMinisterforEnvironmentonbehalfoftheCockburnSoundManagementCouncil(CSMC).Sinceitsfoundationin2000theCSMChasworkedwiththecommunity,governmentandindustrytokeepCockburnSoundhealthyandsustainableforitsmultipleusesandforthepeopleofWesternAustralia.
During2013,theCSMCparticipatedinascheduledreview, initiated in2012bytheOfficeoftheEnvironmentalProtectionAuthority (OEPA), to update and revise the State Environmental (Cockburn Sound) Policy 2005 (SEP) and its associatedtechnical reports. The SEP is a policy that all Western Australians have reason to be proud of in that it has establishedworldclassstandardsandprocessesformonitoringtheenvironmentalhealthofthestate’smostheavilyanddiverselyusedembayment.
TheCSMCwelcomedthisreviewandhasbeenupdatingitsgovernancedocumentsinpreparationforthefinalisationofthenewSEP.Inaddition,theCSMChastakenthefirststepstowardsreviewingitsEnvironmentalManagementPlan2005.TheCSMCiscommittedtocontinuousimprovementanditisenvisagedthattherevisedSEPandEMPwillfurtherstrengthentheCSMC’scapacitytocoordinatetheenvironmentalmanagementofCockburnSoundincollaborationwithitspartnerorganisations.
I ampleased tonote the inclusionof nutrient enrichment inCSMC reporting.Nutrient enrichment is a keyparameter formeasuringecosystemhealththatincorporatesdataforchlorophyll‘a’,lightattenuationcoefficientandseagrassshootdensity.ThismeansthattheCSMCreportingnowalignscloselywiththerequirementsoftheEnvironmentalQualityCriteriaReferenceDocumentforCockburnSoundandreflectsrecommendationsmadebytheOfficeoftheAuditorGeneralin2010.
Within thisStateofCockburnSound report theReportCardssummarise ingraphic form themonitoring resultsover therangeofmonitoringprogramsundertakenin2013.AnalysisofresultssuggeststhatmultipleusepressuresgenerallyremainatsustainablelevelsandtheexistingmanagementframeworktheCSMCworkswithinappearstobeaneffectivebarriertodetrimentalenvironmentalimpacts.
IwouldliketoacknowledgethemanystakeholderswhodirectlyandindirectlysupporttheCSMCinourworkeitherfinanciallyorthroughcollaborationandsharingofinformation.
Finally, Iwould like toacknowledge thehardworkanddedicationof themembersof theCSMC. It isasa resultof theirgenerousinputoftime,energyandexpertisethattheCSMChasbeenabletoestablishitsproudrecordofservingthevariedandextensivecommunityofusersofCockburnSound.
EmeritusProfessorKaterynaLongley
Chair,CockburnSoundManagementCouncil
S T A T E O F C O C K B U R N S O U N D 2 0 1 3 R E P O R T6
Executive SummaryThe State Environmental (Cockburn Sound) Policy 2005 (SEP) provides the framework within which the Cockburn Sound Man-agement Council (CSMC) operates. The implementation of this policy by the CSMC through the Environmental Management Plan for Cockburn Sound and its Catchments 2005 (EMP) requires a collaborative approach involving key stakeholders from government and the community.
The SEP has been reviewed during 2013 and a revised SEP was released for public comment by the Environmental Protection Authority on 20 November 2013. The public comment period ended on 24 January 2014.
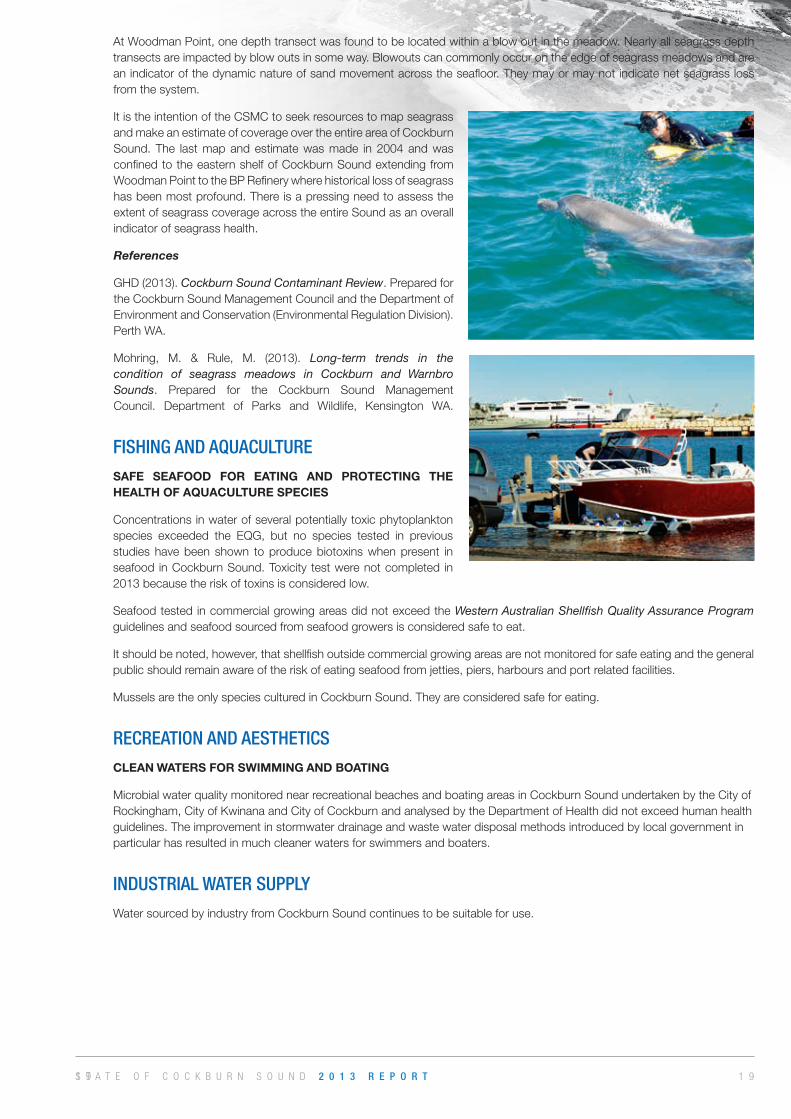
In 2013, the CSMC has begun reporting on two separate areas within the existing High Ecological Protection Area (HEPA): the HEPA-Northern Sound (HEPA–NS) and the HEPA-Southern Sound (HEPA-SS) for ecosystem health parameters. The HEPA-SS includes extensive seagrass meadows and is heavily used by the community for swimming, snorkelling, fishing and aquaculture. It is also an important feeding area for seabirds and resident bottlenose dolphins (Tursiops aduncus).
This report now presents outcomes for the assessment of nutrient enrichment, a key parameter for measuring ecosystem health. Assessment of nutrient enrichment incorporates data for chlorophyll ‘a’, light attenuation coefficient (LAC) and seagrass shoot density. Reporting on this parameter aligns closely with the requirements of the Environmental Quality Criteria Reference Document for Cockburn Sound and reflects recommendations made by the Office of the Auditor General in 2010.
Analysis of nutrient enrichment data indicates that the Garden Island Settlement (GIS), Mangles Bay (MB) and Kwinana (KW) monitoring sites are a concern. The CSMC will continue to liaise with the Department of Defence in regard to responding to nutrient enrichment at the GIS site and will review the nutrient enrichment status of KW and MB in 2014 to identify if there is further decline that provides increase cause for concern.
Chlorophyll ‘a’ concentration has exceeded the environmental quality guideline (EQG) at three of six sites in the HEPA-NS and at three of four sites in the HEPA-SS. Chlorophyll ‘a’ has also exceeded the EQG at four of seven sites in the Moderate Ecological Protection Area - Outside Harbours (MEPA-OH). It continues to exceed the EQG at the northern harbour (NH) site adjacent the Cockburn Sound Power Boat Association and public boating facilities.
LAC measured through the water column appears to be relatively stable after some good improvements from earlier years of monitoring. There has, however, been a slight decline in overall LAC in 2013 meaning that light availability in the water column was reduced. Elevated chlorophyll ‘a’ concentrations in the water column, as seen at a number of sites in the HEPAs and MEPAs, may be responsible for a reduction in LAC.
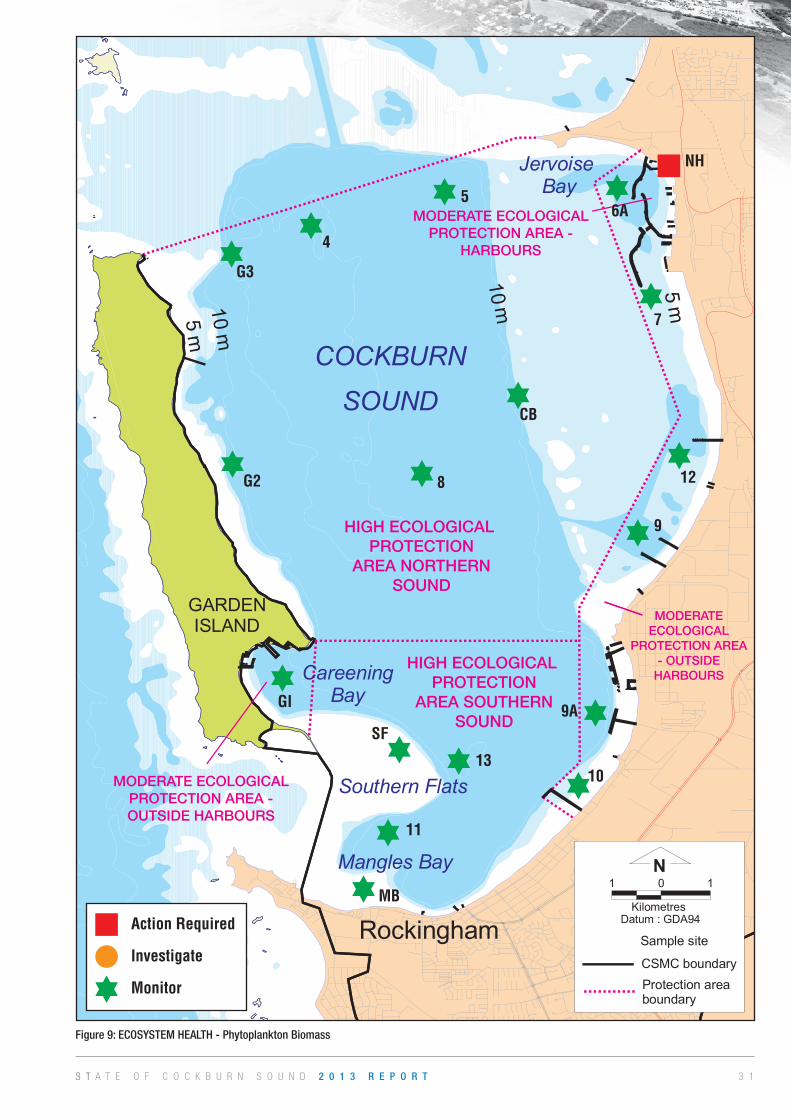
Based on monitoring of only one site, the Northern Harbour of Jervoise Bay continues to have very high phytoplankton bio-mass levels as it has done for the past seven years due to the low exchange of oceanic waters. Phytoplankton biomass is not of concern at any other place in Cockburn Sound.
Sites 11, 13 and MB exceeded the EQG when dissolved oxygen saturation levels fell between 78% and 90%. While the ex-ceedance is a concern, the saturation levels are similar to levels recorded in some previous years. Site 11, near Mangles Bay is of most concern and may indicate that there is little ‘turnover’ of waters at this deep water site in an area that has a low exchange rate with oceanic waters.
To improve government’s ability to target appropriate management actions, the CSMC and the then Department of Environ-ment and Conservation’s Environmental Regulations Division (now Department of Environment Regulation) commissioned a review of historical and contemporary contaminant loads entering Cockburn Sound (GHD, 2013). Estimates indicate that the major contemporary pathway for contaminants to Cockburn Sound appears to be surface runoff that enters drains or the groundwater from all land uses in the catchment. Residential use is estimated to be the largest contributor of nitrogen (21-53 tonnes/year) and phosphorus (3-6 tonnes/year) in the Cockburn Sound catchment.
The long term trends in the condition of seagrass meadows in Cockburn and Warnbro sounds were investigated in 2013 (Mohring & Rule, 2013). The investigation noted a significant decline in seagrass density at almost all sites (including reference sites) in Cockburn and Warnbro sounds. The pressure of most concern to seagrass communities appears to be summer sea
temperature which has shown an increase at all sites.
7S T A T E O F C O C K B U R N S O U N D 2 0 1 3 R E P O R T
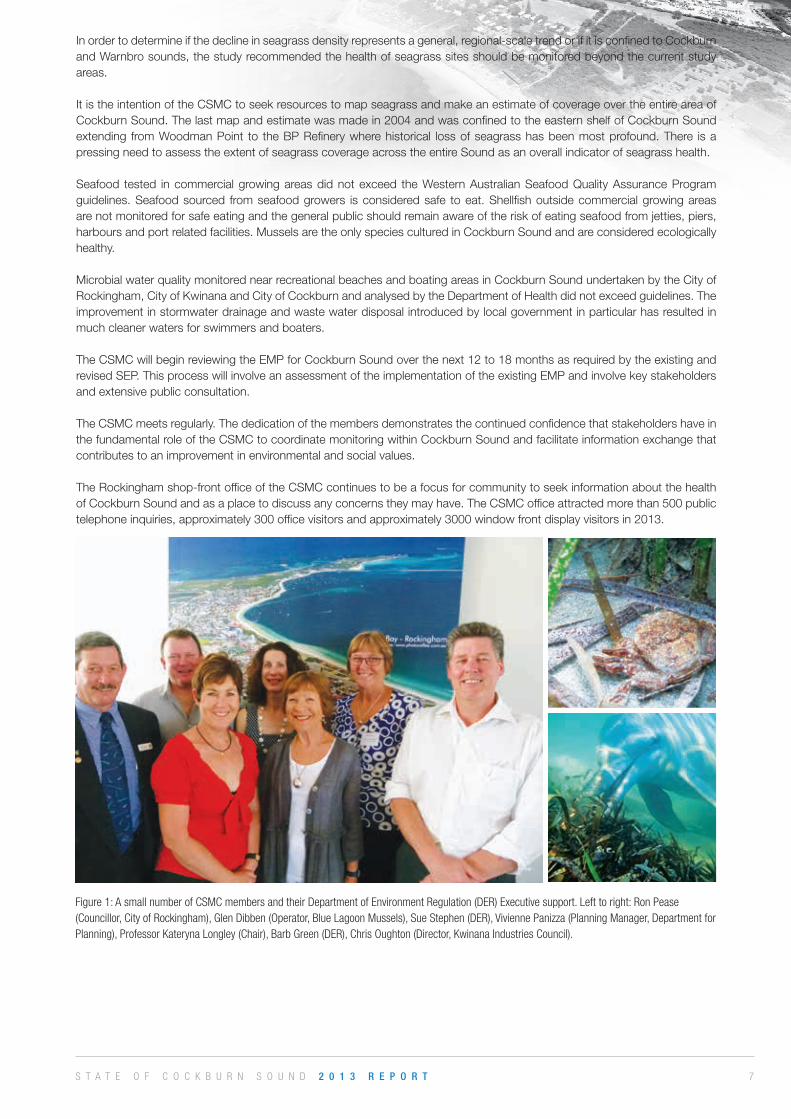
Figure 1: A small number of CSMC members and their Department of Environment Regulation (DER) Executive support. Left to right: Ron Pease (Councillor, City of Rockingham), Glen Dibben (Operator, Blue Lagoon Mussels), Sue Stephen (DER), Vivienne Panizza (Planning Manager, Department for Planning), Professor Kateryna Longley (Chair), Barb Green (DER), Chris Oughton (Director, Kwinana Industries Council).
In order to determine if the decline in seagrass density represents a general, regional-scale trend or if it is confined to Cockburn and Warnbro sounds, the study recommended the health of seagrass sites should be monitored beyond the current study areas.
It is the intention of the CSMC to seek resources to map seagrass and make an estimate of coverage over the entire area of Cockburn Sound. The last map and estimate was made in 2004 and was confined to the eastern shelf of Cockburn Sound extending from Woodman Point to the BP Refinery where historical loss of seagrass has been most profound. There is a pressing need to assess the extent of seagrass coverage across the entire Sound as an overall indicator of seagrass health.
Seafood tested in commercial growing areas did not exceed the Western Australian Seafood Quality Assurance Program guidelines. Seafood sourced from seafood growers is considered safe to eat. Shellfish outside commercial growing areas are not monitored for safe eating and the general public should remain aware of the risk of eating seafood from jetties, piers, harbours and port related facilities. Mussels are the only species cultured in Cockburn Sound and are considered ecologically healthy.
Microbial water quality monitored near recreational beaches and boating areas in Cockburn Sound undertaken by the City of Rockingham, City of Kwinana and City of Cockburn and analysed by the Department of Health did not exceed guidelines. The improvement in stormwater drainage and waste water disposal introduced by local government in particular has resulted in much cleaner waters for swimmers and boaters.
The CSMC will begin reviewing the EMP for Cockburn Sound over the next 12 to 18 months as required by the existing and revised SEP. This process will involve an assessment of the implementation of the existing EMP and involve key stakeholders and extensive public consultation.
The CSMC meets regularly. The dedication of the members demonstrates the continued confidence that stakeholders have in the fundamental role of the CSMC to coordinate monitoring within Cockburn Sound and facilitate information exchange that contributes to an improvement in environmental and social values.
The Rockingham shop-front office of the CSMC continues to be a focus for community to seek information about the health of Cockburn Sound and as a place to discuss any concerns they may have. The CSMC office attracted more than 500 public telephone inquiries, approximately 300 office visitors and approximately 3000 window front display visitors in 2013.
S T A T E O F C O C K B U R N S O U N D 2 0 1 3 R E P O R T8
Ro
ckin
gh
am
Be
ach
Woo
dman
Poin
t
Poin
tPe
ron
War
nbro
Sou
nd
Cat
herin
ePo
int
Ow
en A
ncho
rage
Fre
mantle
Sp
ea
rwo
od
Co
og
ee
Be
ach
He
nd
ers
on
Alc
oa
Re
fin
ery
BP
Re
fin
ery
Kw
ina
na
Bu
lk J
ett
y
CB
H
Ja
nd
ako
t
Kw
ina
na
Sa
fety
Ba
y
Pig
Trou
gh B
ay
Lusc
ombe
Bay
Clif
f Hea
d
Gar
den
Isla
nd S
ettle
men
t
Cam
p M
arkh
am
Figure 2: Geographic location of Cockburn Sound in the southern metropolitan waters of Perth.
HIG
H E
CO
LOG
ICA
LP
RO
TE
CT
ION
AR
EA
SO
UT
HE
RN
SO
UN
D
MO
DE
RAT
E E
CO
LOG
ICA
LP
RO
TE
CT
ION
AR
EA
-O
UT
SID
E H
AR
BO
UR
S
MO
DE
RAT
E E
CO
LOG
ICA
LP
RO
TE
CT
ION
AR
EA
-H
AR
BO
UR
S
MO
DE
RAT
EE
CO
LOG
ICA
LP
RO
TE
CT
ION
AR
EA
- O
UT
SID
EH
AR
BO
UR
S
HIG
H E
CO
LOG
ICA
L P
RO
TE
CT
ION
AR
EA
NO
RT
HE
RN
SO
UN
D
Figure 3: The High and Moderate Ecological Protection Areas in Cockburn Sound.
9S T A T E O F C O C K B U R N S O U N D 2 0 1 3 R E P O R T
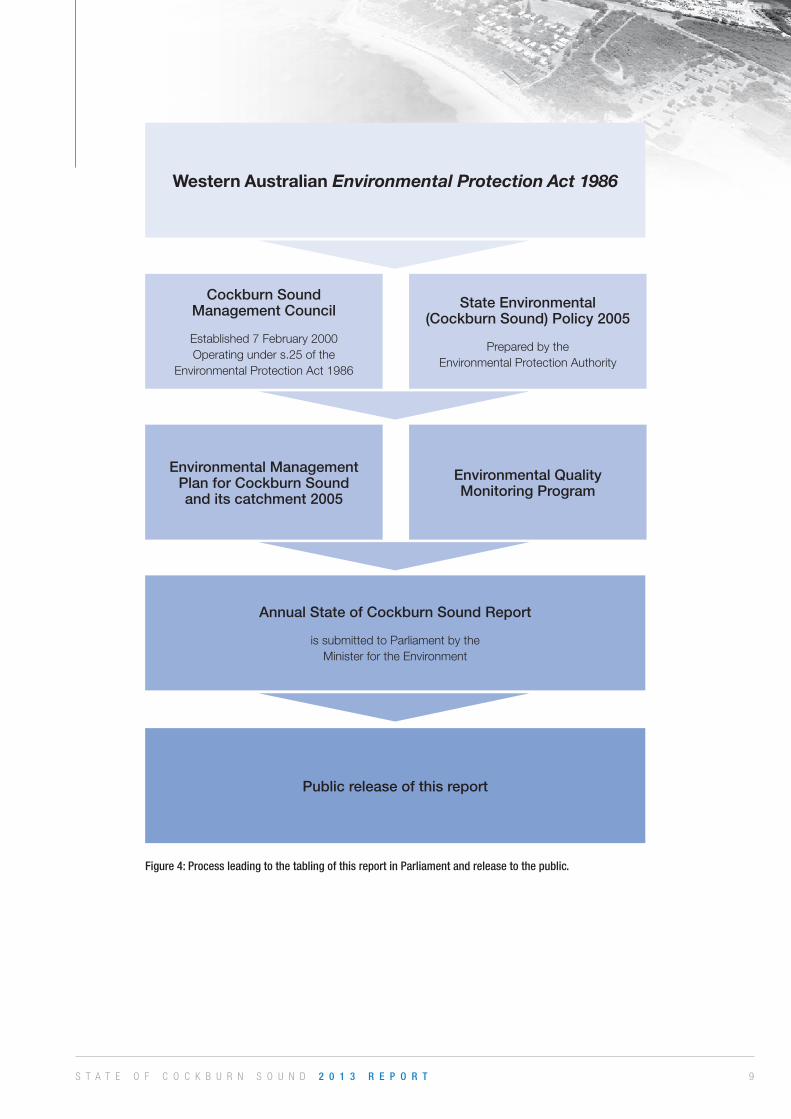
Figure 4: Process leading to the tabling of this report in Parliament and release to the public.
Cockburn Sound Management Council
Established7February2000Operatingunders.25ofthe
EnvironmentalProtectionAct1986
Annual State of Cockburn Sound Report
issubmittedtoParliamentbytheMinisterfortheEnvironment
Public release of this report
Western Australian Environmental Protection Act 1986
Environmental Management Plan for Cockburn Sound and its catchment 2005
State Environmental (Cockburn Sound) Policy 2005
PreparedbytheEnvironmentalProtectionAuthority
Environmental Quality Monitoring Program
S T A T E O F C O C K B U R N S O U N D 2 0 1 3 R E P O R T1 0
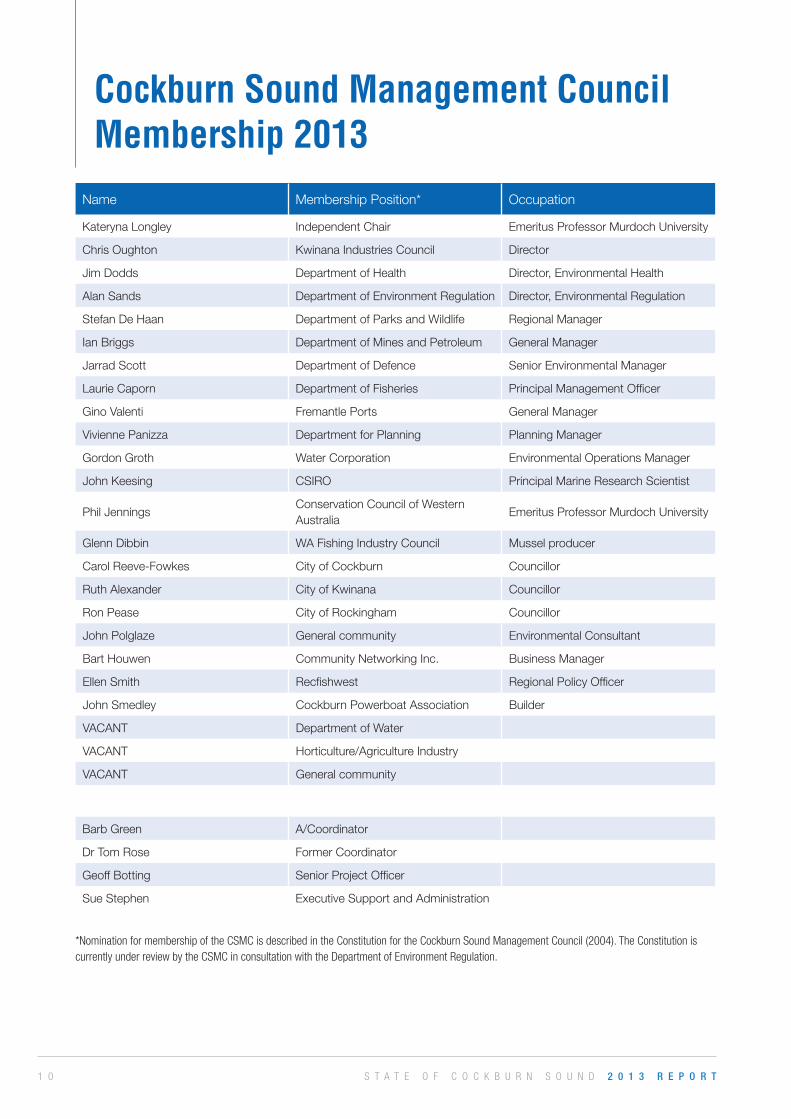
Cockburn Sound Management Council Membership 2013
Name MembershipPosition* Occupation
KaterynaLongley IndependentChair EmeritusProfessorMurdochUniversity
ChrisOughton KwinanaIndustriesCouncil Director
JimDodds DepartmentofHealth Director,EnvironmentalHealth
AlanSands DepartmentofEnvironmentRegulation Director,EnvironmentalRegulation
StefanDeHaan DepartmentofParksandWildlife RegionalManager
IanBriggs DepartmentofMinesandPetroleum GeneralManager
JarradScott DepartmentofDefence SeniorEnvironmentalManager
LaurieCaporn DepartmentofFisheries PrincipalManagementOfficer
GinoValenti FremantlePorts GeneralManager
ViviennePanizza DepartmentforPlanning PlanningManager
GordonGroth WaterCorporation EnvironmentalOperationsManager
JohnKeesing CSIRO PrincipalMarineResearchScientist
PhilJenningsConservationCouncilofWesternAustralia
EmeritusProfessorMurdochUniversity
GlennDibbin WAFishingIndustryCouncil Musselproducer
CarolReeve-Fowkes CityofCockburn Councillor
RuthAlexander CityofKwinana Councillor
RonPease CityofRockingham Councillor
JohnPolglaze Generalcommunity EnvironmentalConsultant
BartHouwen CommunityNetworkingInc. BusinessManager
EllenSmith Recfishwest RegionalPolicyOfficer
JohnSmedley CockburnPowerboatAssociation Builder
VACANT DepartmentofWater
VACANT Horticulture/AgricultureIndustry
VACANT Generalcommunity
DepartmentofEnvironmentRegulationOfficerssupportingtheCSMCin2013
BarbGreen A/Coordinator
DrTomRose FormerCoordinator
GeoffBotting SeniorProjectOfficer
SueStephen ExecutiveSupportandAdministration
*Nomination for membership of the CSMC is described in the Constitution for the Cockburn Sound Management Council (2004). The Constitution is currently under review by the CSMC in consultation with the Department of Environment Regulation.
1 1S T A T E O F C O C K B U R N S O U N D 2 0 1 3 R E P O R T
Setting the Scene
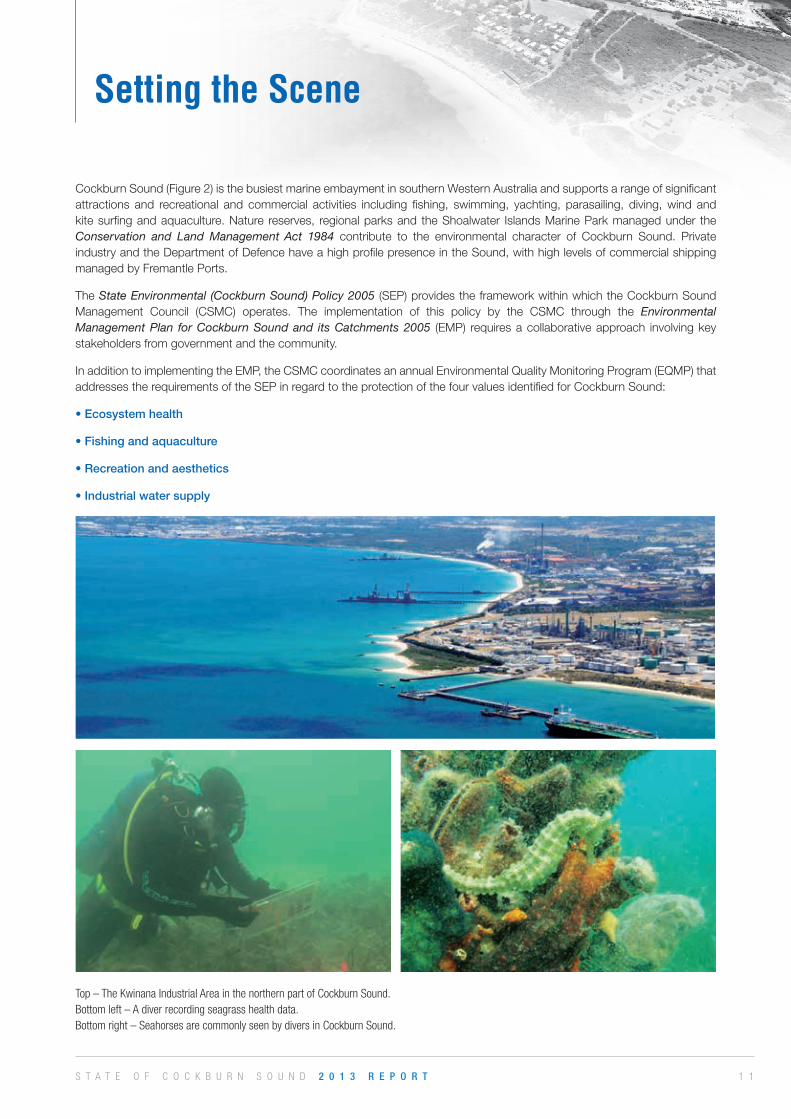
CockburnSound(Figure2)isthebusiestmarineembaymentinsouthernWesternAustraliaandsupportsarangeofsignificantattractions and recreational and commercial activities including fishing, swimming, yachting, parasailing, diving, wind andkitesurfingandaquaculture.Nature reserves, regionalparksand theShoalwater IslandsMarineParkmanagedunder theConservation and Land Management Act 1984 contribute to the environmental character of Cockburn Sound. PrivateindustryandtheDepartmentofDefencehaveahighprofilepresenceintheSound,withhighlevelsofcommercialshippingmanagedbyFremantlePorts.
TheState Environmental (Cockburn Sound) Policy 2005(SEP)providestheframeworkwithinwhichtheCockburnSoundManagement Council (CSMC) operates. The implementation of this policy by the CSMC through the Environmental Management Plan for Cockburn Sound and its Catchments 2005 (EMP) requiresacollaborativeapproach involvingkeystakeholdersfromgovernmentandthecommunity.
InadditiontoimplementingtheEMP,theCSMCcoordinatesanannualEnvironmentalQualityMonitoringProgram(EQMP)thataddressestherequirementsoftheSEPinregardtotheprotectionofthefourvaluesidentifiedforCockburnSound:
• Ecosystem health
• Fishing and aquaculture
• Recreation and aesthetics
• Industrial water supply
Top – The Kwinana Industrial Area in the northern part of Cockburn Sound.Bottom left – A diver recording seagrass health data.Bottom right – Seahorses are commonly seen by divers in Cockburn Sound.
S T A T E O F C O C K B U R N S O U N D 2 0 1 3 R E P O R T1 2
Maintenanceandimprovementofwaterandsedimentqualityandseagrasshealtharepivotaltotheprotectionofallthesevalues. The health of water, sediment and seagrass is assessed against predetermined Environmental Quality Guidelines(EQG)andEnvironmentalQualityStandards(EQS)containedwithintheEnvironmental Quality Criteria Reference Document for Cockburn Sound (EQCdocument). If anEQG isexceeded (isnotmet), amoredetailedassessmentagainstanEQSisrequired. IfanEQSisexceeded,anappropriatemanagementresponsewillberequired.ReportCards inthisdocumentpresenttheresultsoftheseassessmentsinaquickreferenceformat.
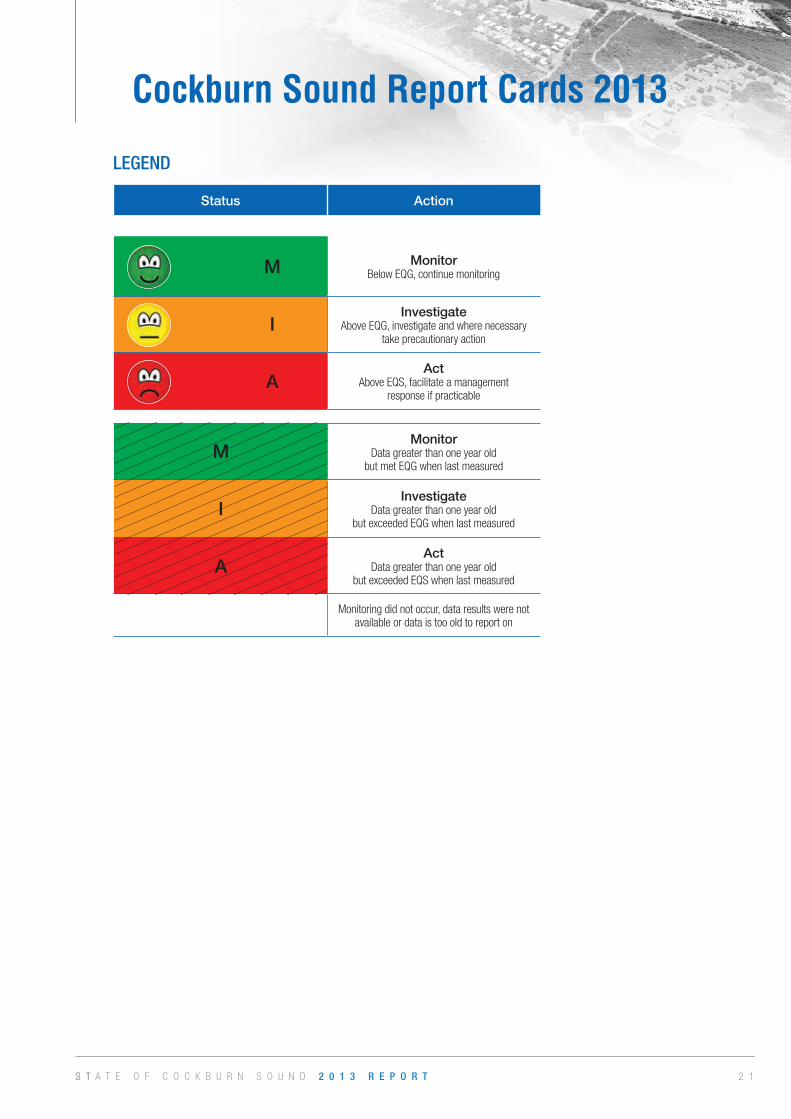
Information in thereportcards ispresented ina traffic-light formatofgreen,orangeandred.Thecolour isdeterminedbycomparingmonitoringdatawithrelevantEQGandEQScontainedwithinthetheEQCdocument.
ThepresenceofgreenonthereportcardshelpsgivethecommunityconfidencethattheiruseofCockburnSoundisoccurringinasafeandsustainablemanner.Conversely,thepresenceofredororangecanindicatethatthereisstilleffortrequiredtoimprovetheecologicalhealthofCockburnSound.
MonitoringoccursinHighEcologicalProtectionAreas(HEPA)andModerateEcologicalProtectionAreas(MEPA)(Figure3).TheCSMCdoesnotcoordinatemonitoringintheLowEcologicalProtectionAreasastheDepartmentofEnvironmentRegulationadministersstrictlicenceconditionstoindustriesthatdischargeintotheseverysmallareas.
TheCSMCmeetsregularly.ThededicationofthemembersdemonstratesthecontinuedconfidencethatstakeholdershaveinthefundamentalroleoftheCSMCtocoordinatemonitoringwithinCockburnSoundandfacilitateinformationexchangethatcontributestoanimprovementinenvironmentalandsocialvalues.
TheRockinghamshop-frontofficeoftheCSMCcontinuestobeafocusforcommunitytoseekinformationaboutthehealthofCockburnSoundandasaplacetodiscussanyconcernstheymayhave.TheCSMCofficeattractedmorethan500publictelephoneinquiries,approximately300officevisitorsandapproximately3000windowfrontdisplayvisitorsin2013.
InformationprovidedbytheCSMCtothepublicsupportsacomprehensivefoundationforunderstandingthishighlycomplexmarineembaymentandhelpstoquicklyclarifyareasofconcern.
1 3S T A T E O F C O C K B U R N S O U N D 2 0 1 3 R E P O R T
What’s New?
Ecological protection area reporting
In2013,theCSMChasbegunreportingontwoseparateareaswithintheexistingHighEcologicalProtectionArea(HEPA):the HEPA-Northern Sound (HEPA–NS) and the HEPA-Southern Sound (HEPA-SS) for ecosystem health parameters. TheHEPA-SSincludesextensiveseagrassmeadowsandisheavilyusedbythecommunityforswimming,snorkelling,fishingandaquaculture.Itisalsoanimportantfeedingareaforseabirdsandresidentbottlenosedolphins(Tursiops aduncus).Safeguardingthese activities and wildlife is an important function of the CSMC. The CSMC already reports on two separate areas oftheModerateEcologicalProtectionArea(MEPA):MEPA-OutsideHarbours(MEPA-OH)andMEPA-Harbours(MEPA-H)(seefigure3).
The recognitionof the southern sectionof theHEPAasa separatearea is expected tomake reportingmore informativeacrosswhatisalargegeographicalarea.ItalsorecognisesthatthesouthernareaoftheSoundhasdifferentenvironmentalcharacteristicsthanthenorthern,betterflushedareaoftheSound.
Introduction of reporting for nutrient enrichment
This report now presents outcomes of the CSMC assessment of nutrient enrichment, a key parameter for measuringecosystemhealth.Assessmentofnutrientenrichmentincorporatesdataforchlorophyll‘a’,lightattenuationcoefficient(LAC)andseagrassshootdensity.ReportingonthisparameteralignscloselywiththerequirementsoftheEnvironmental Quality Criteria Reference Document for Cockburn SoundandreflectsrecommendationsmadebytheOfficeoftheAuditorGeneralin2010.ScientistsattheOfficeofEnvironmentalProtectionAuthorityhavegreatlyassistedtheCSMCinintroducingthiskeyparametertothereportingframework.
2013 Research support
IncollaborationwiththeKwinanaIndustiesCouncil,theCSMCextendeditssupportforsmall-scaleresearchprojectsincludingapopulationassessmentoflittlepenguinsanddolphinhealth.In2014,theCSMCwillseektoprovidesupportforlarger-scaleresearchprojectswheregreaterfundingleveragecanbeachievedthroughstakeholderpartnerships.
Revision of the State Environmental (Cockburn Sound) Policy 2005
TheSEPhasbeenreviewedduring2013andarevisedSEPwasreleasedforpubliccommentbytheEnvironmentalProtectionAuthorityon20November2013.Thepubliccommentperiodendedon24January2014.ThedocumentwillbefinalisedinconsultationwiththeMinisterforEnvironmentandonceadoptedwilldirecttheworkoftheCSMCintothenextdecade.
Revision of the Environmental Management Plan for Cockburn Sound and its Catchment (2005)
TheCSMCwill begin reviewing theEMP forCockburnSound in 2014as requiredby the existing and revisedSEP.ThisprocesswillinvolveanassessmentoftheimplementationoftheexistingEMPandinvolveconsultationwithkeystakeholdersandextensivepublicconsultation.TherevisedEMPwillguidethedaytodayoperationalactivitiesoftheCSMCanditsmanypartnersinrelationtotheprotectionoftheenvironmentalandsocialvaluesofCockburnSound.
S T A T E O F C O C K B U R N S O U N D 2 0 1 3 R E P O R T1 4
Nutrient Enrichment
Whe
nnu
trie
nts
are
adde
dto
as
yste
mt
hey
stim
ulat
eth
egr
owth
of
mic
rosc
opic
phy
topl
ankt
on,
allo
win
gth
isg
roup
of
prim
ary
prod
ucer
sto
rap
idly
incr
ease
in
num
ber.
The
incr
ease
inp
hyto
plan
kton
bio
mas
sre
duce
sw
ater
cla
rity
soth
atle
ssli
ghtr
each
esth
ese
abed
.Ifl
ight
ava
ilabi
lity
atth
ese
abed
falls
bel
owc
ritic
alle
vels
fo
rpro
long
edp
erio
ds,s
eagr
ass
whi
chre
lyo
nsu
nlig
htto
pho
tosy
nthe
sise
can
suf
fera
ndd
ie.F
ors
eagr
ass
spec
ies
such
as
Pos
idon
ias
inuo
saa
loss
inh
ealth
tend
sto
be
first
exp
ress
eda
sa
thin
ning
oft
hem
eado
ww
hich
ism
easu
red
asa
redu
ctio
nin
sea
gras
ssh
ootd
ensi
ty.
Mon
itorin
gpr
ogra
ms
aim
eda
tid
entif
ying
and
man
agin
gar
eas
unde
rpr
essu
refr
omn
utrie
nte
nric
hmen
tm
easu
rew
ater
qua
lity
indi
cato
rss
uch
asC
hlor
ophy
ll‘a
’co
ncen
trat
ion
(indi
cativ
eof
phy
topl
ankt
onc
once
ntra
tion)
and
ligh
tat
tenu
atio
nco
effic
ient
(i.e
.a
mea
sure
oft
hed
egre
eof
sha
ding
int
hew
ater
col
umn)
as
early
w
arni
ngin
dica
tors
,an
dse
agra
sss
hoot
den
sity
as
the
indi
cato
rfo
rse
agra
ssh
ealth
,w
hich
is‘
furt
her
dow
n’t
hep
ress
ure-
resp
onse
pat
hway
.W
hen
thes
ear
eas
sess
edto
geth
er(a
s‘m
ultip
lelin
eso
fevi
denc
e’),
we
can
bec
onfid
enta
bout
wha
tis
actu
ally
hap
peni
ngin
the
mar
ine
envi
ronm
enta
ndin
crea
seo
ura
bilit
yto
mak
epr
e-em
ptiv
ean
din
form
edm
anag
emen
tdec
isio
nsto
pre
vent
una
ccep
tabl
eris
kto
sea
gras
san
dth
em
arin
een
viro
nmen
t.
Figu
re 5
: A c
once
ptua
l dia
gram
of t
he n
utrie
nt e
nric
hmen
t pre
ssur
e re
spon
se p
athw
ay in
Coc
kbur
n So
und.
1 5S T A T E O F C O C K B U R N S O U N D 2 0 1 3 R E P O R T
2013 Monitoring Program Outcomes
ECOSYSTEM HEALTH
WATER QUALITY
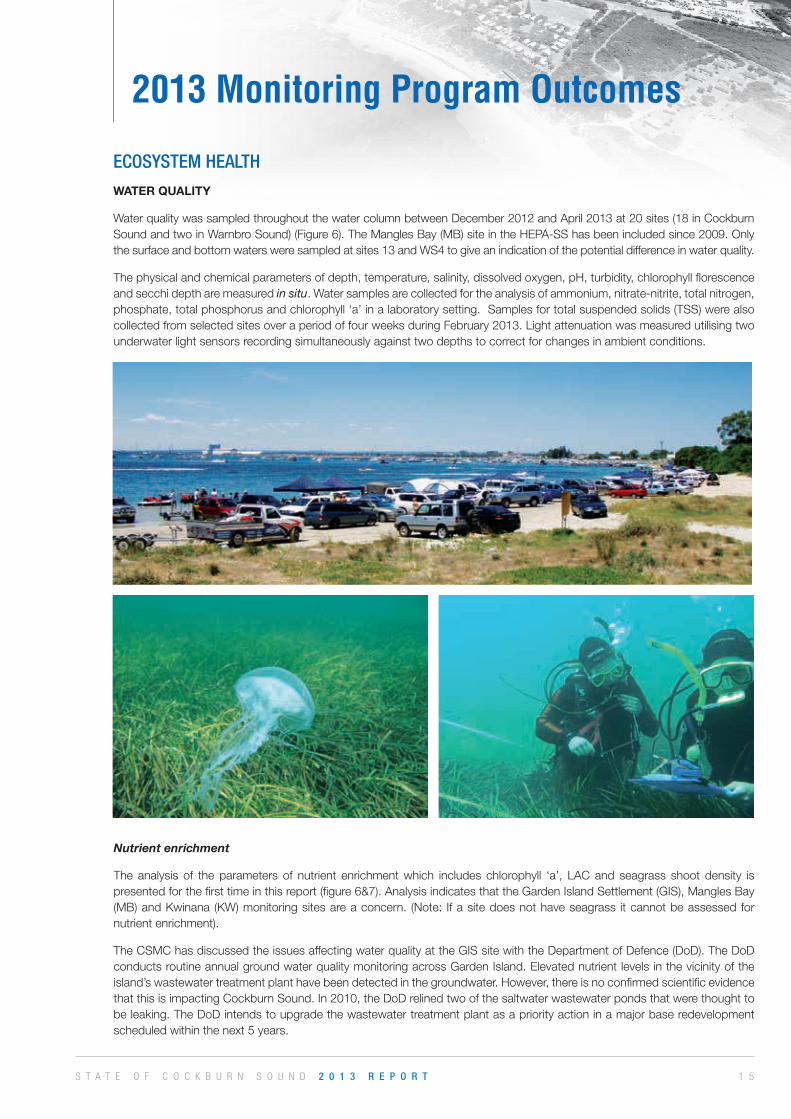
WaterqualitywassampledthroughoutthewatercolumnbetweenDecember2012andApril2013at20sites(18inCockburnSoundandtwoinWarnbroSound)(Figure6).TheManglesBay(MB)siteintheHEPA-SShasbeenincludedsince2009.Onlythesurfaceandbottomwatersweresampledatsites13andWS4togiveanindicationofthepotentialdifferenceinwaterquality.
Thephysicalandchemicalparametersofdepth,temperature,salinity,dissolvedoxygen,pH,turbidity,chlorophyllflorescenceandsecchideptharemeasured in situ.Watersamplesarecollectedfortheanalysisofammonium,nitrate-nitrite,totalnitrogen,phosphate,totalphosphorusandchlorophyll‘a’inalaboratorysetting.Samplesfortotalsuspendedsolids(TSS)werealsocollectedfromselectedsitesoveraperiodoffourweeksduringFebruary2013.Lightattenuationwasmeasuredutilisingtwounderwaterlightsensorsrecordingsimultaneouslyagainsttwodepthstocorrectforchangesinambientconditions.
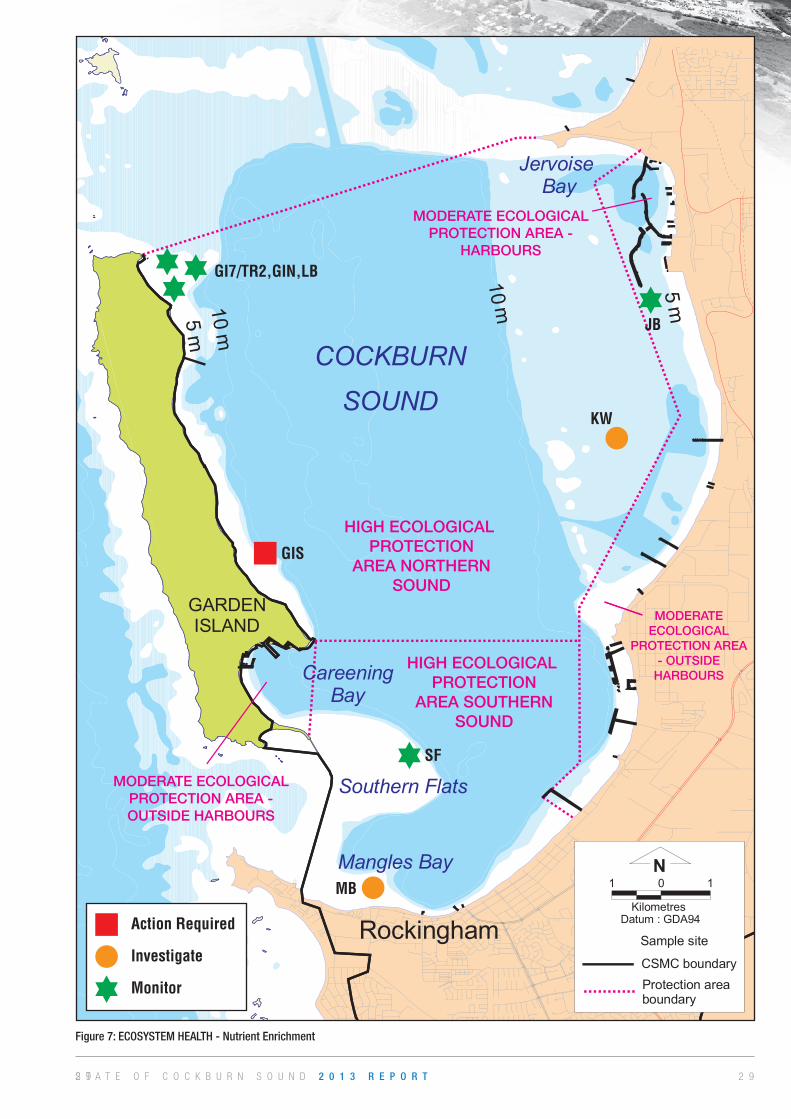
Nutrient enrichment
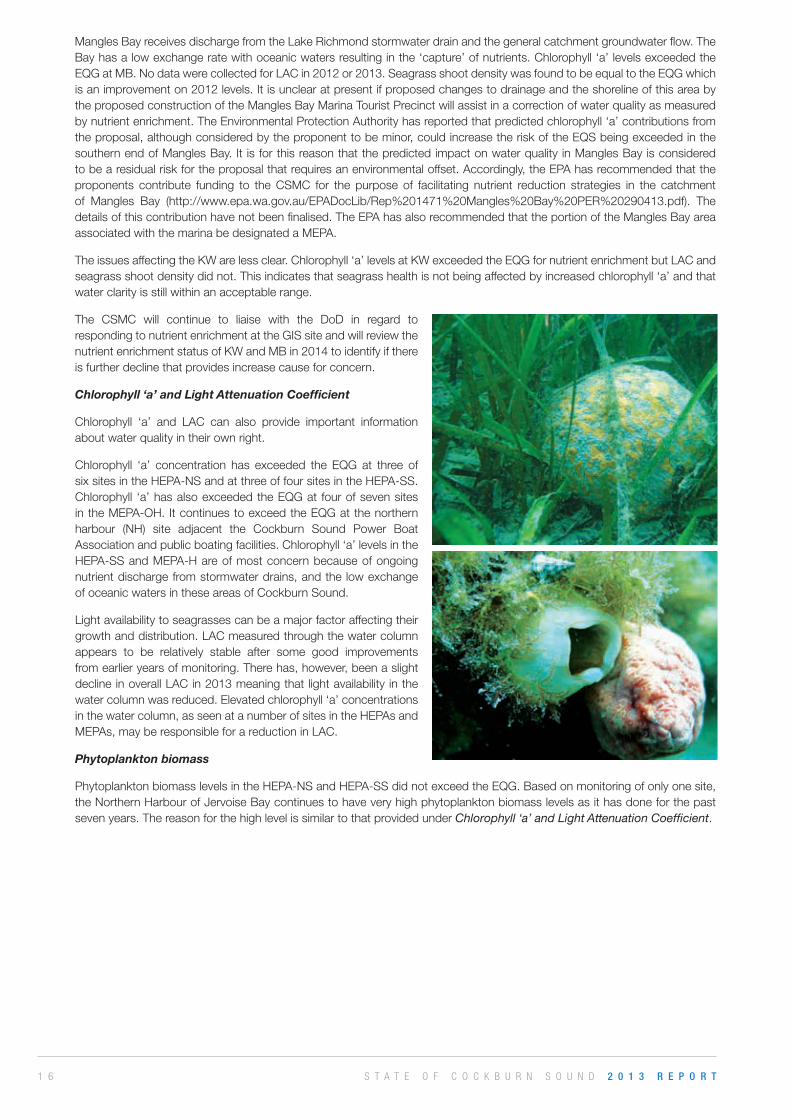
The analysis of the parameters of nutrient enrichment which includes chlorophyll ‘a’, LAC and seagrass shoot density ispresentedforthefirsttimeinthisreport(figure6&7).AnalysisindicatesthattheGardenIslandSettlement(GIS),ManglesBay(MB)andKwinana(KW)monitoringsitesareaconcern. (Note: Ifasitedoesnothaveseagrass itcannotbeassessedfornutrientenrichment).
TheCSMChasdiscussedtheissuesaffectingwaterqualityattheGISsitewiththeDepartmentofDefence(DoD).TheDoDconductsroutineannualgroundwaterqualitymonitoringacrossGardenIsland.Elevatednutrientlevelsinthevicinityoftheisland’swastewatertreatmentplanthavebeendetectedinthegroundwater.However,thereisnoconfirmedscientificevidencethatthisisimpactingCockburnSound.In2010,theDoDrelinedtwoofthesaltwaterwastewaterpondsthatwerethoughttobeleaking.TheDoDintendstoupgradethewastewatertreatmentplantasapriorityactioninamajorbaseredevelopmentscheduledwithinthenext5years.
S T A T E O F C O C K B U R N S O U N D 2 0 1 3 R E P O R T1 6
ManglesBayreceivesdischargefromtheLakeRichmondstormwaterdrainandthegeneralcatchmentgroundwaterflow.TheBayhasalowexchangeratewithoceanicwatersresultinginthe‘capture’ofnutrients.Chlorophyll‘a’levelsexceededtheEQGatMB.NodatawerecollectedforLACin2012or2013.SeagrassshootdensitywasfoundtobeequaltotheEQGwhichisanimprovementon2012levels.ItisunclearatpresentifproposedchangestodrainageandtheshorelineofthisareabytheproposedconstructionoftheManglesBayMarinaTouristPrecinctwillassistinacorrectionofwaterqualityasmeasuredbynutrientenrichment.TheEnvironmentalProtectionAuthorityhasreportedthatpredictedchlorophyll‘a’contributionsfromtheproposal,althoughconsideredbytheproponenttobeminor,couldincreasetheriskoftheEQSbeingexceededinthesouthernendofManglesBay.It isforthisreasonthatthepredictedimpactonwaterquality inManglesBayisconsideredtobearesidualriskfortheproposalthatrequiresanenvironmentaloffset.Accordingly,theEPAhasrecommendedthattheproponents contribute funding to the CSMC for the purpose of facilitating nutrient reduction strategies in the catchmentof Mangles Bay (http://www.epa.wa.gov.au/EPADocLib/Rep%201471%20Mangles%20Bay%20PER%20290413.pdf). Thedetailsofthiscontributionhavenotbeenfinalised.TheEPAhasalsorecommendedthattheportionoftheManglesBayareaassociatedwiththemarinabedesignatedaMEPA.
TheissuesaffectingtheKWarelessclear.Chlorophyll‘a’levelsatKWexceededtheEQGfornutrientenrichmentbutLACandseagrassshootdensitydidnot.Thisindicatesthatseagrasshealthisnotbeingaffectedbyincreasedchlorophyll‘a’andthatwaterclarityisstillwithinanacceptablerange.
The CSMC will continue to liaise with the DoD in regard torespondingtonutrientenrichmentattheGISsiteandwillreviewthenutrientenrichmentstatusofKWandMBin2014toidentifyifthereisfurtherdeclinethatprovidesincreasecauseforconcern.
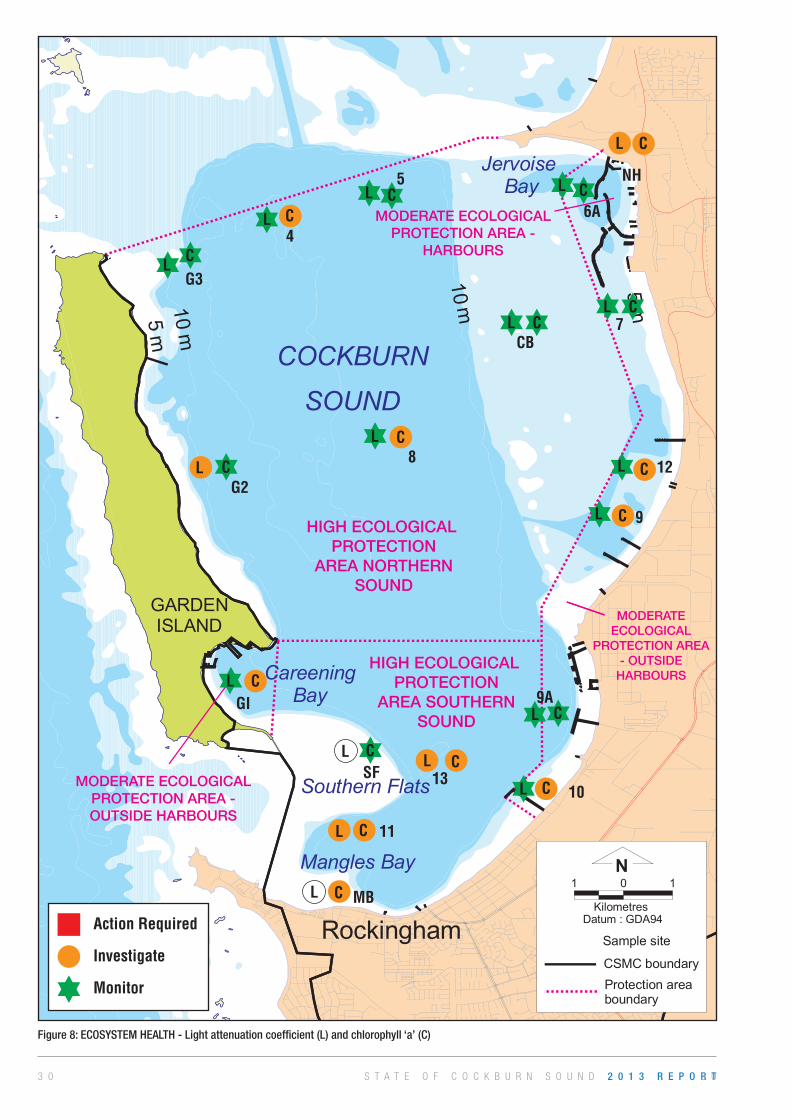
Chlorophyll ‘a’ and Light Attenuation Coefficient
Chlorophyll ‘a’ and LAC can also provide important informationaboutwaterqualityintheirownright.
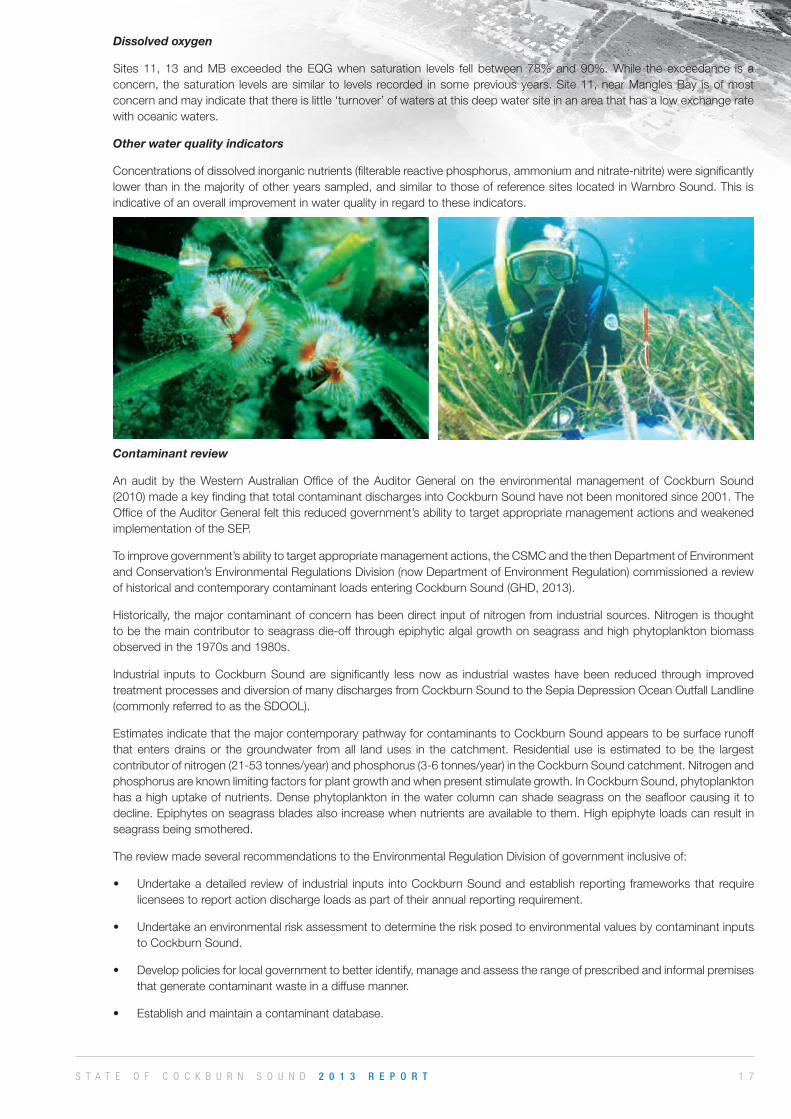
Chlorophyll ‘a’ concentration has exceeded the EQG at three ofsixsitesintheHEPA-NSandatthreeoffoursitesintheHEPA-SS.Chlorophyll ‘a’hasalsoexceededtheEQGat fourofsevensitesintheMEPA-OH.ItcontinuestoexceedtheEQGatthenorthernharbour (NH) site adjacent the Cockburn Sound Power BoatAssociationandpublicboatingfacilities.Chlorophyll‘a’levelsintheHEPA-SSandMEPA-Hareofmostconcernbecauseofongoingnutrientdischargefromstormwaterdrains,andthelowexchangeofoceanicwatersintheseareasofCockburnSound.
Lightavailabilitytoseagrassescanbeamajorfactoraffectingtheirgrowthanddistribution.LACmeasuredthroughthewatercolumnappears to be relatively stable after some good improvementsfromearlieryearsofmonitoring.Therehas,however,beenaslightdeclineinoverallLACin2013meaningthatlightavailability inthewatercolumnwasreduced.Elevatedchlorophyll‘a’concentrationsinthewatercolumn,asseenatanumberofsitesintheHEPAsandMEPAs,mayberesponsibleforareductioninLAC.
Phytoplankton biomass
PhytoplanktonbiomasslevelsintheHEPA-NSandHEPA-SSdidnotexceedtheEQG.Basedonmonitoringofonlyonesite,theNorthernHarbourofJervoiseBaycontinuestohaveveryhighphytoplanktonbiomasslevelsasithasdoneforthepastsevenyears.ThereasonforthehighlevelissimilartothatprovidedunderChlorophyll ‘a’ and Light Attenuation Coefficient.
1 7S T A T E O F C O C K B U R N S O U N D 2 0 1 3 R E P O R T
Dissolved oxygen
Sites 11, 13 and MB exceeded the EQG when saturation levels fell between 78% and 90%. While the exceedance is aconcern, thesaturation levelsaresimilar to levels recorded insomepreviousyears.Site11,nearManglesBay isofmostconcernandmayindicatethatthereislittle‘turnover’ofwatersatthisdeepwatersiteinanareathathasalowexchangeratewithoceanicwaters.
Other water quality indicators
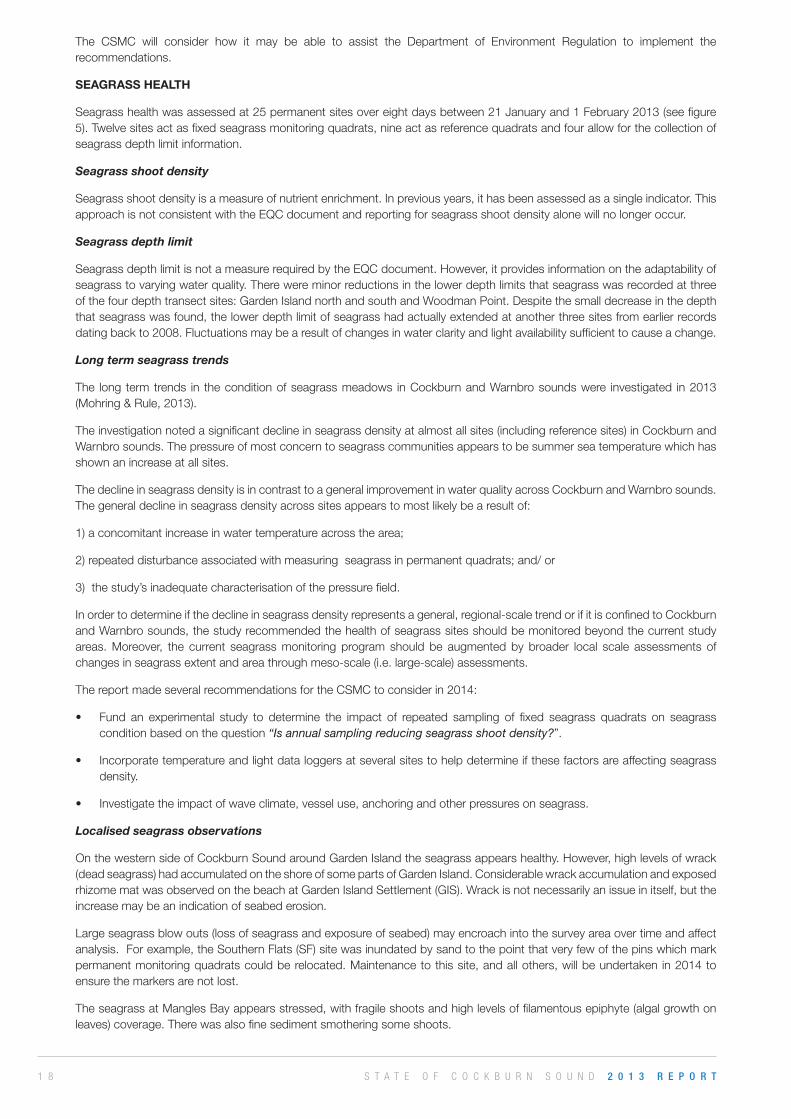
Concentrationsofdissolvedinorganicnutrients(filterablereactivephosphorus,ammoniumandnitrate-nitrite)weresignificantlylowerthaninthemajorityofotheryearssampled,andsimilartothoseofreferencesiteslocatedinWarnbroSound.Thisisindicativeofanoverallimprovementinwaterqualityinregardtotheseindicators.
Contaminant review
Anaudit by theWesternAustralianOfficeof theAuditorGeneral on the environmentalmanagementofCockburnSound(2010)madeakeyfindingthattotalcontaminantdischargesintoCockburnSoundhavenotbeenmonitoredsince2001.TheOfficeoftheAuditorGeneralfeltthisreducedgovernment’sabilitytotargetappropriatemanagementactionsandweakenedimplementationoftheSEP.
Toimprovegovernment’sabilitytotargetappropriatemanagementactions,theCSMCandthethenDepartmentofEnvironmentandConservation’sEnvironmentalRegulationsDivision(nowDepartmentofEnvironmentRegulation)commissionedareviewofhistoricalandcontemporarycontaminantloadsenteringCockburnSound(GHD,2013).
Historically,themajorcontaminantofconcernhasbeendirectinputofnitrogenfromindustrialsources.Nitrogenisthoughttobethemaincontributortoseagrassdie-offthroughepiphyticalgalgrowthonseagrassandhighphytoplanktonbiomassobservedinthe1970sand1980s.
Industrial inputs toCockburnSoundare significantly lessnowas industrialwasteshavebeen reduced through improvedtreatmentprocessesanddiversionofmanydischargesfromCockburnSoundtotheSepiaDepressionOceanOutfallLandline(commonlyreferredtoastheSDOOL).
EstimatesindicatethatthemajorcontemporarypathwayforcontaminantstoCockburnSoundappearstobesurfacerunoffthatentersdrainsor thegroundwater fromall landuses in thecatchment.Residential use isestimated tobe the largestcontributorofnitrogen(21-53tonnes/year)andphosphorus(3-6tonnes/year)intheCockburnSoundcatchment.Nitrogenandphosphorusareknownlimitingfactorsforplantgrowthandwhenpresentstimulategrowth.InCockburnSound,phytoplanktonhasahighuptakeofnutrients.Densephytoplanktoninthewatercolumncanshadeseagrassontheseafloorcausingittodecline.Epiphytesonseagrassbladesalsoincreasewhennutrientsareavailabletothem.Highepiphyteloadscanresultinseagrassbeingsmothered.
ThereviewmadeseveralrecommendationstotheEnvironmentalRegulationDivisionofgovernmentinclusiveof:
• Undertakeadetailedreviewof industrial inputs intoCockburnSoundandestablishreporting frameworks that requirelicenseestoreportactiondischargeloadsaspartoftheirannualreportingrequirement.
• UndertakeanenvironmentalriskassessmenttodeterminetheriskposedtoenvironmentalvaluesbycontaminantinputstoCockburnSound.
• Developpoliciesforlocalgovernmenttobetteridentify,manageandassesstherangeofprescribedandinformalpremisesthatgeneratecontaminantwasteinadiffusemanner.
• Establishandmaintainacontaminantdatabase.
S T A T E O F C O C K B U R N S O U N D 2 0 1 3 R E P O R T1 8
The CSMC will consider how it may be able to assist the Department of Environment Regulation to implement therecommendations.
SEAGRASS HEALTH
Seagrasshealthwasassessedat25permanentsitesovereightdaysbetween21Januaryand1February2013(seefigure5).Twelvesitesactasfixedseagrassmonitoringquadrats,nineactasreferencequadratsandfourallowforthecollectionofseagrassdepthlimitinformation.
Seagrass shoot density
Seagrassshootdensityisameasureofnutrientenrichment.Inpreviousyears,ithasbeenassessedasasingleindicator.ThisapproachisnotconsistentwiththeEQCdocumentandreportingforseagrassshootdensityalonewillnolongeroccur.
Seagrass depth limit
SeagrassdepthlimitisnotameasurerequiredbytheEQCdocument.However,itprovidesinformationontheadaptabilityofseagrasstovaryingwaterquality.Therewereminorreductionsinthelowerdepthlimitsthatseagrasswasrecordedatthreeofthefourdepthtransectsites:GardenIslandnorthandsouthandWoodmanPoint.Despitethesmalldecreaseinthedepththatseagrasswasfound,thelowerdepthlimitofseagrasshadactuallyextendedatanotherthreesitesfromearlierrecordsdatingbackto2008.Fluctuationsmaybearesultofchangesinwaterclarityandlightavailabilitysufficienttocauseachange.
Long term seagrass trends
The long termtrends in theconditionofseagrassmeadows inCockburnandWarnbrosoundswere investigated in2013(Mohring&Rule,2013).
Theinvestigationnotedasignificantdeclineinseagrassdensityatalmostallsites(includingreferencesites)inCockburnandWarnbrosounds.Thepressureofmostconcerntoseagrasscommunitiesappearstobesummerseatemperaturewhichhasshownanincreaseatallsites.
ThedeclineinseagrassdensityisincontrasttoageneralimprovementinwaterqualityacrossCockburnandWarnbrosounds.Thegeneraldeclineinseagrassdensityacrosssitesappearstomostlikelybearesultof:
1)aconcomitantincreaseinwatertemperatureacrossthearea;
2)repeateddisturbanceassociatedwithmeasuringseagrassinpermanentquadrats;and/or
3)thestudy’sinadequatecharacterisationofthepressurefield.
Inordertodetermineifthedeclineinseagrassdensityrepresentsageneral,regional-scaletrendorifitisconfinedtoCockburnandWarnbrosounds,thestudyrecommendedthehealthofseagrasssitesshouldbemonitoredbeyondthecurrentstudyareas. Moreover, the current seagrass monitoring program should be augmented by broader local scale assessments ofchangesinseagrassextentandareathroughmeso-scale(i.e.large-scale)assessments.
ThereportmadeseveralrecommendationsfortheCSMCtoconsiderin2014:
• Fund an experimental study to determine the impact of repeated sampling of fixed seagrass quadrats on seagrassconditionbasedonthequestion“Is annual sampling reducing seagrass shoot density?”.
• Incorporatetemperatureandlightdataloggersatseveralsitestohelpdetermineifthesefactorsareaffectingseagrassdensity.
• Investigatetheimpactofwaveclimate,vesseluse,anchoringandotherpressuresonseagrass.
Localised seagrass observations
OnthewesternsideofCockburnSoundaroundGardenIslandtheseagrassappearshealthy.However,highlevelsofwrack(deadseagrass)hadaccumulatedontheshoreofsomepartsofGardenIsland.ConsiderablewrackaccumulationandexposedrhizomematwasobservedonthebeachatGardenIslandSettlement(GIS).Wrackisnotnecessarilyanissueinitself,buttheincreasemaybeanindicationofseabederosion.
Largeseagrassblowouts(lossofseagrassandexposureofseabed)mayencroachintothesurveyareaovertimeandaffectanalysis.Forexample,theSouthernFlats(SF)sitewasinundatedbysandtothepointthatveryfewofthepinswhichmarkpermanentmonitoringquadratscouldberelocated.Maintenancetothissite,andallothers,willbeundertaken in2014toensurethemarkersarenotlost.
TheseagrassatManglesBayappearsstressed,withfragileshootsandhighlevelsoffilamentousepiphyte(algalgrowthonleaves)coverage.Therewasalsofinesedimentsmotheringsomeshoots.
1 9S T A T E O F C O C K B U R N S O U N D 2 0 1 3 R E P O R T
AtWoodmanPoint,onedepthtransectwasfoundtobelocatedwithinablowoutinthemeadow.Nearlyallseagrassdepthtransectsareimpactedbyblowoutsinsomeway.Blowoutscancommonlyoccurontheedgeofseagrassmeadowsandareanindicatorofthedynamicnatureofsandmovementacrosstheseafloor.Theymayormaynotindicatenetseagrasslossfromthesystem.
ItistheintentionoftheCSMCtoseekresourcestomapseagrassandmakeanestimateofcoverageovertheentireareaofCockburnSound.The lastmapandestimatewasmade in2004andwasconfinedtotheeasternshelfofCockburnSoundextendingfromWoodmanPointtotheBPRefinerywherehistoricallossofseagrasshasbeenmostprofound.ThereisapressingneedtoassesstheextentofseagrasscoverageacrosstheentireSoundasanoverallindicatorofseagrasshealth.
References
GHD(2013).Cockburn Sound Contaminant Review.PreparedfortheCockburnSoundManagementCouncilandtheDepartmentofEnvironmentandConservation(EnvironmentalRegulationDivision).PerthWA.
Mohring, M. & Rule, M. (2013). Long-term trends in the condition of seagrass meadows in Cockburn and Warnbro Sounds. Prepared for the Cockburn Sound ManagementCouncil. Department of Parks and Wildlife, Kensington WA.
FISHING AND AQUACULTURE
SAFE SEAFOOD FOR EATING AND PROTECTING THE HEALTH OF AQUACULTURE SPECIES
Concentrationsinwaterofseveralpotentiallytoxicphytoplanktonspecies exceeded the EQG, but no species tested in previousstudies havebeen shown toproducebiotoxinswhenpresent inseafood inCockburnSound.Toxicity testwerenotcompleted in2013becausetheriskoftoxinsisconsideredlow.
SeafoodtestedincommercialgrowingareasdidnotexceedtheWestern Australian Shellfish Quality Assurance Programguidelinesandseafoodsourcedfromseafoodgrowersisconsideredsafetoeat.
Itshouldbenoted,however,thatshellfishoutsidecommercialgrowingareasarenotmonitoredforsafeeatingandthegeneralpublicshouldremainawareoftheriskofeatingseafoodfromjetties,piers,harboursandportrelatedfacilities.
MusselsaretheonlyspeciesculturedinCockburnSound.Theyareconsideredsafeforeating.
RECREATION AND AESTHETICS
CLEAN WATERS FOR SWIMMING AND BOATING
MicrobialwaterqualitymonitorednearrecreationalbeachesandboatingareasinCockburnSoundundertakenbytheCityofRockingham,CityofKwinanaandCityofCockburnandanalysedbytheDepartmentofHealthdidnotexceedhumanhealthguidelines.Theimprovementinstormwaterdrainageandwastewaterdisposalmethodsintroducedbylocalgovernmentinparticularhasresultedinmuchcleanerwatersforswimmersandboaters.
INDUSTRIAL WATER SUPPLY
WatersourcedbyindustryfromCockburnSoundcontinuestobesuitableforuse.
1 9
S T A T E O F C O C K B U R N S O U N D 2 0 1 3 R E P O R T2 0 2 0
WoodmanPoint
Carnac Island
Warnbro Sound
PointPeron
Fremantle
Spearwood
Jandakot
Kwinana
Safety Bay
NH
6A
7
G3
45
8
G2
CB
12
9
WATER SAMPLING SITE
SEAGRASS MONITORING SITE
9A
10
13SF
G1
11
MB
WS4
G17/TR2
TR3
JB
KW
GIS
SF
MB
WS
TR4
LB
GIN
Figure 6: Annual seagrass monitoring sites and annual water quality sampling sites.
2 1S T A T E O F C O C K B U R N S O U N D 2 0 1 3 R E P O R T2 1
Cockburn Sound Report Cards 2013
Status Action
MonitorBelow EQG, continue monitoring
InvestigateAbove EQG, investigate and where necessary
take precautionary action
ActAbove EQS, facilitate a management
response if practicable
MonitorData greater than one year old
but met EQG when last measured
InvestigateData greater than one year old
but exceeded EQG when last measured
ActData greater than one year old
but exceeded EQS when last measured
Monitoring did not occur, data results were not available or data is too old to report on
M
M
I
I
A
A
LEGEND
S T A T E O F C O C K B U R N S O U N D 2 0 1 3 R E P O R T2 2 2 2
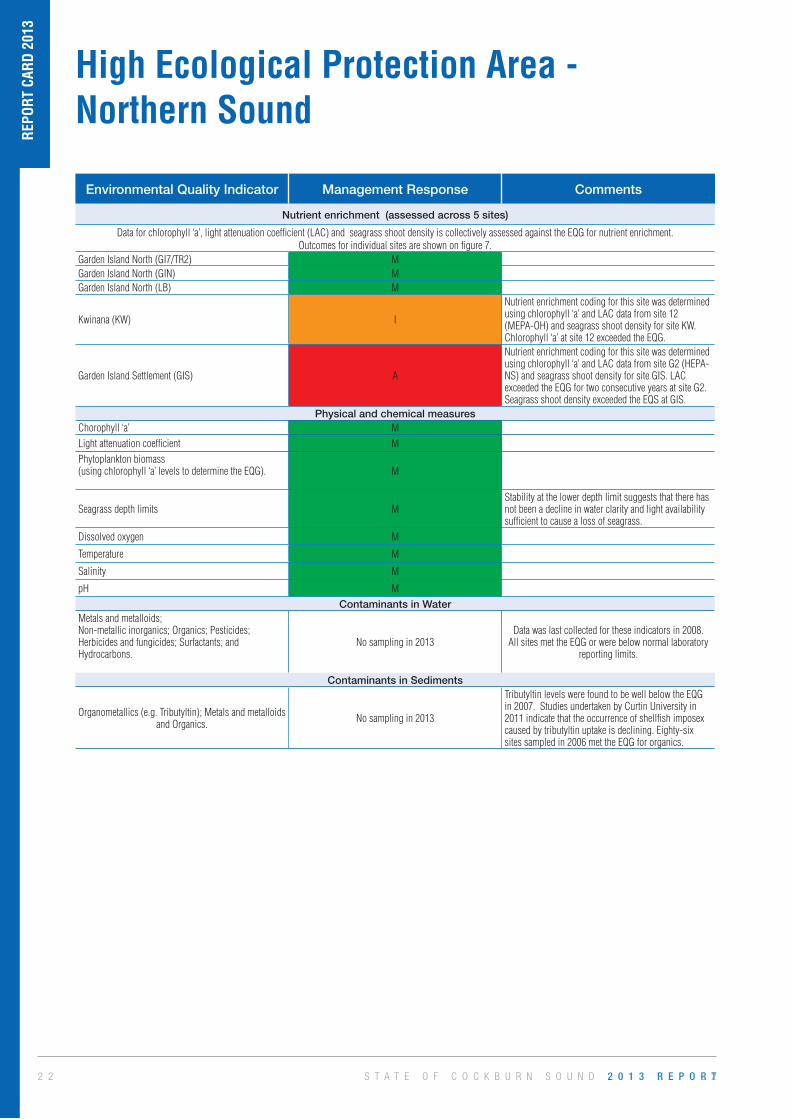
High Ecological Protection Area - Northern Sound
REP
ORT
CAR
D 2
013
Environmental Quality Indicator Management Response Comments
Nutrient enrichment (assessed across 5 sites)
Data for chlorophyll ‘a’, light attenuation coefficient (LAC) and seagrass shoot density is collectively assessed against the EQG for nutrient enrichment. Outcomes for individual sites are shown on figure 7.
Garden Island North (GI7/TR2) MGarden Island North (GIN) MGarden Island North (LB) M
Kwinana (KW) I
Nutrient enrichment coding for this site was determined using chlorophyll ‘a’ and LAC data from site 12 (MEPA-OH) and seagrass shoot density for site KW. Chlorophyll ‘a’ at site 12 exceeded the EQG.
Garden Island Settlement (GIS) A
Nutrient enrichment coding for this site was determined using chlorophyll ‘a’ and LAC data from site G2 (HEPA-NS) and seagrass shoot density for site GIS. LAC exceeded the EQG for two consecutive years at site G2. Seagrass shoot density exceeded the EQS at GIS.
Physical and chemical measuresChorophyll ‘a’ M
Light attenuation coefficient M
Phytoplankton biomass (using chlorophyll ‘a’ levels to determine the EQG). M
Seagrass depth limits M Stability at the lower depth limit suggests that there has not been a decline in water clarity and light availability sufficient to cause a loss of seagrass.
Dissolved oxygen M
Temperature M
Salinity M
pH M
Contaminants in WaterMetals and metalloids;Non-metallic inorganics; Organics; Pesticides; Herbicides and fungicides; Surfactants; andHydrocarbons.
No sampling in 2013Data was last collected for these indicators in 2008.
All sites met the EQG or were below normal laboratory reporting limits.
Contaminants in Sediments
Organometallics (e.g. Tributyltin); Metals and metalloids and Organics. No sampling in 2013
Tributyltin levels were found to be well below the EQG in 2007. Studies undertaken by Curtin University in 2011 indicate that the occurrence of shellfish imposex caused by tributyltin uptake is declining. Eighty-six sites sampled in 2006 met the EQG for organics.
2 3S T A T E O F C O C K B U R N S O U N D 2 0 1 3 R E P O R T
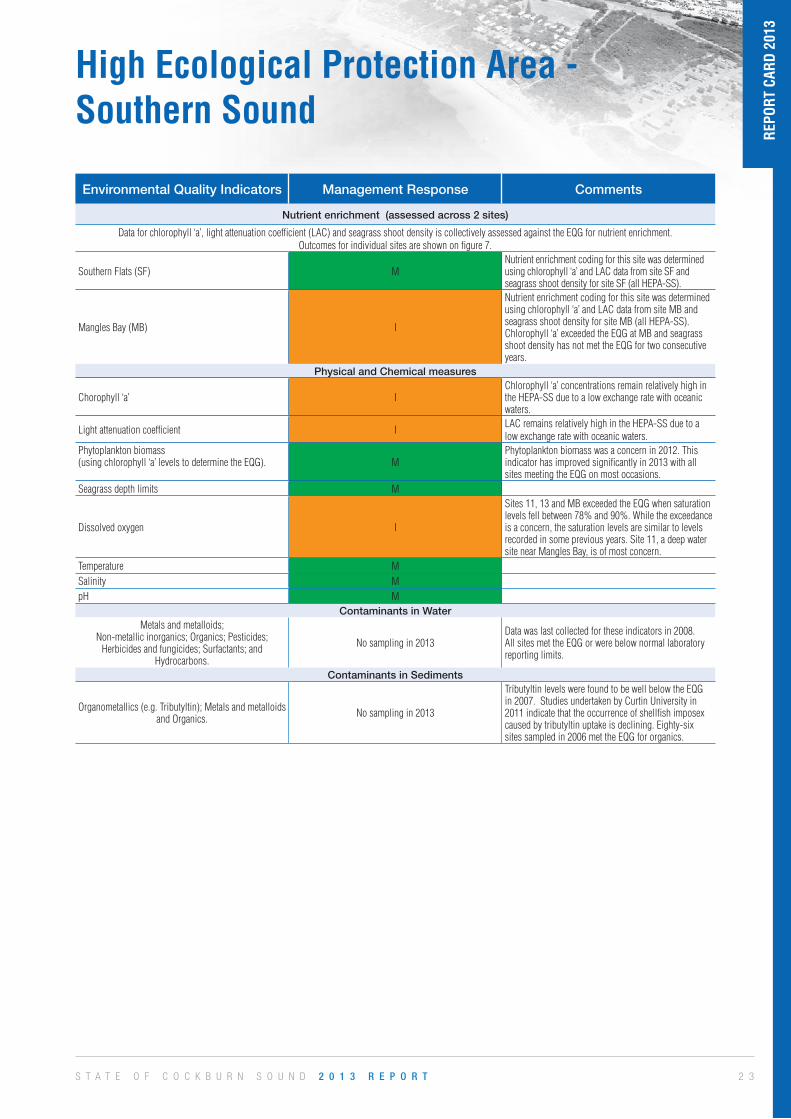
High Ecological Protection Area - Southern Sound
REP
ORT
CAR
D 2
013
Environmental Quality Indicators Management Response Comments
Nutrient enrichment (assessed across 2 sites)
Data for chlorophyll ‘a’, light attenuation coefficient (LAC) and seagrass shoot density is collectively assessed against the EQG for nutrient enrichment. Outcomes for individual sites are shown on figure 7.
Southern Flats (SF) MNutrient enrichment coding for this site was determined using chlorophyll ‘a’ and LAC data from site SF and seagrass shoot density for site SF (all HEPA-SS).
Mangles Bay (MB) I
Nutrient enrichment coding for this site was determined using chlorophyll ‘a’ and LAC data from site MB and seagrass shoot density for site MB (all HEPA-SS). Chlorophyll ‘a’ exceeded the EQG at MB and seagrass shoot density has not met the EQG for two consecutive years.
Physical and Chemical measures
Chorophyll ‘a’ IChlorophyll ‘a’ concentrations remain relatively high in the HEPA-SS due to a low exchange rate with oceanic waters.
Light attenuation coefficient ILAC remains relatively high in the HEPA-SS due to a low exchange rate with oceanic waters.
Phytoplankton biomass (using chlorophyll ‘a’ levels to determine the EQG). M
Phytoplankton biomass was a concern in 2012. This indicator has improved significantly in 2013 with all sites meeting the EQG on most occasions.
Seagrass depth limits M
Dissolved oxygen I
Sites 11, 13 and MB exceeded the EQG when saturation levels fell between 78% and 90%. While the exceedance is a concern, the saturation levels are similar to levels recorded in some previous years. Site 11, a deep water site near Mangles Bay, is of most concern.
Temperature MSalinity MpH M
Contaminants in WaterMetals and metalloids;
Non-metallic inorganics; Organics; Pesticides; Herbicides and fungicides; Surfactants; and
Hydrocarbons.
No sampling in 2013Data was last collected for these indicators in 2008. All sites met the EQG or were below normal laboratory reporting limits.
Contaminants in Sediments
Organometallics (e.g. Tributyltin); Metals and metalloids and Organics. No sampling in 2013
Tributyltin levels were found to be well below the EQG in 2007. Studies undertaken by Curtin University in 2011 indicate that the occurrence of shellfish imposex caused by tributyltin uptake is declining. Eighty-six sites sampled in 2006 met the EQG for organics.
S T A T E O F C O C K B U R N S O U N D 2 0 1 3 R E P O R T2 4 2 4
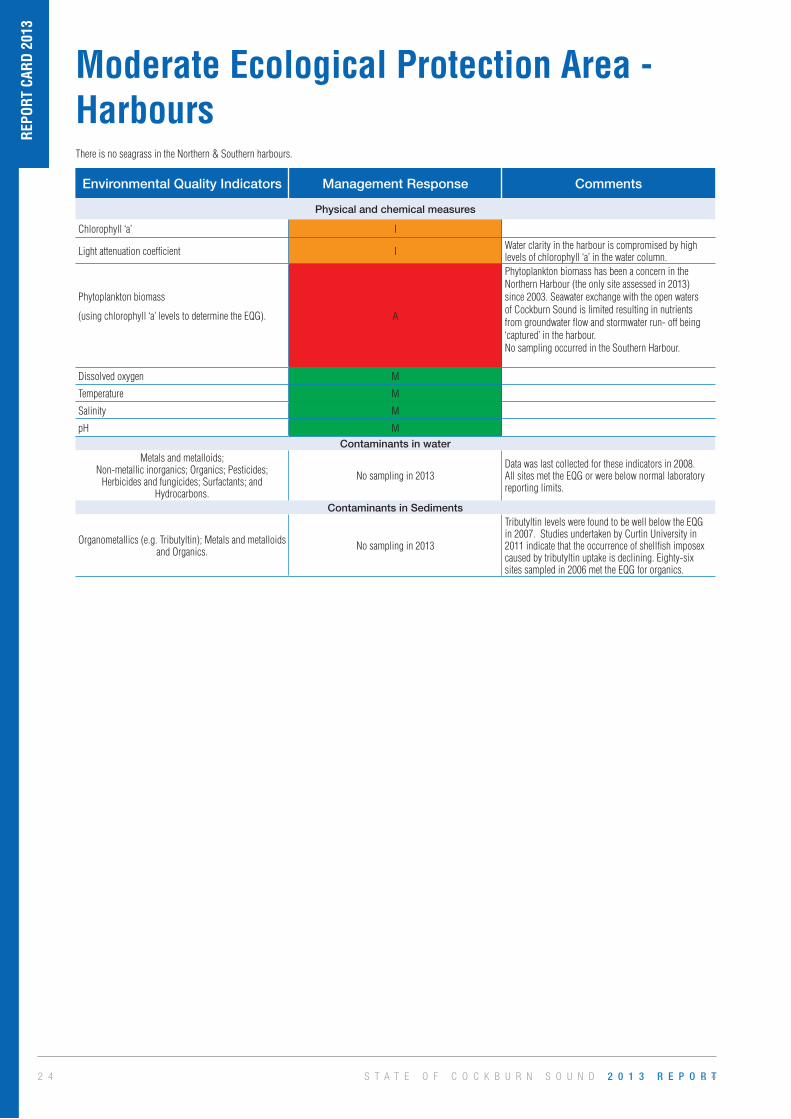
Moderate Ecological Protection Area - Harbours
REP
ORT
CAR
D 2
013
Environmental Quality Indicators Management Response Comments
Physical and chemical measures
Chlorophyll ‘a’ I
Light attenuation coefficient I Water clarity in the harbour is compromised by high levels of chlorophyll ‘a’ in the water column.
Phytoplankton biomass
(using chlorophyll ‘a’ levels to determine the EQG). A
Phytoplankton biomass has been a concern in the Northern Harbour (the only site assessed in 2013) since 2003. Seawater exchange with the open waters of Cockburn Sound is limited resulting in nutrients from groundwater flow and stormwater run- off being ‘captured’ in the harbour.No sampling occurred in the Southern Harbour.
Dissolved oxygen M
Temperature M
Salinity M
pH M
Contaminants in waterMetals and metalloids;
Non-metallic inorganics; Organics; Pesticides; Herbicides and fungicides; Surfactants; and
Hydrocarbons.
No sampling in 2013Data was last collected for these indicators in 2008. All sites met the EQG or were below normal laboratory reporting limits.
Contaminants in Sediments
Organometallics (e.g. Tributyltin); Metals and metalloids and Organics. No sampling in 2013
Tributyltin levels were found to be well below the EQG in 2007. Studies undertaken by Curtin University in 2011 indicate that the occurrence of shellfish imposex caused by tributyltin uptake is declining. Eighty-six sites sampled in 2006 met the EQG for organics.
There is no seagrass in the Northern & Southern harbours.
2 5S T A T E O F C O C K B U R N S O U N D 2 0 1 3 R E P O R T2 5
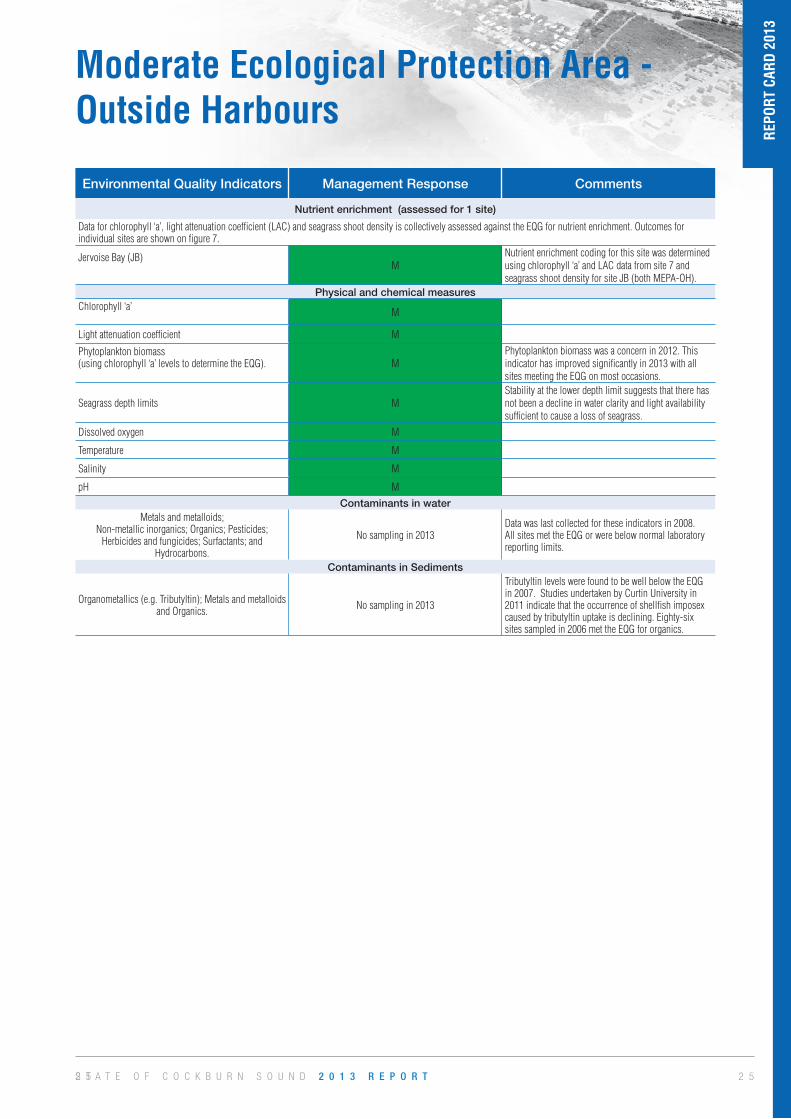
Moderate Ecological Protection Area - Outside Harbours
REP
ORT
CAR
D 2
013
Environmental Quality Indicators Management Response Comments
Nutrient enrichment (assessed for 1 site)
Data for chlorophyll ‘a’, light attenuation coefficient (LAC) and seagrass shoot density is collectively assessed against the EQG for nutrient enrichment. Outcomes for individual sites are shown on figure 7.
Jervoise Bay (JB)M
Nutrient enrichment coding for this site was determined using chlorophyll ‘a’ and LAC data from site 7 and seagrass shoot density for site JB (both MEPA-OH).
Physical and chemical measuresChlorophyll ‘a’ M
Light attenuation coefficient M
Phytoplankton biomass (using chlorophyll ‘a’ levels to determine the EQG). M
Phytoplankton biomass was a concern in 2012. This indicator has improved significantly in 2013 with all sites meeting the EQG on most occasions.
Seagrass depth limits MStability at the lower depth limit suggests that there has not been a decline in water clarity and light availability sufficient to cause a loss of seagrass.
Dissolved oxygen M
Temperature M
Salinity M
pH M
Contaminants in waterMetals and metalloids;
Non-metallic inorganics; Organics; Pesticides; Herbicides and fungicides; Surfactants; and
Hydrocarbons.
No sampling in 2013Data was last collected for these indicators in 2008. All sites met the EQG or were below normal laboratory reporting limits.
Contaminants in Sediments
Organometallics (e.g. Tributyltin); Metals and metalloids and Organics. No sampling in 2013
Tributyltin levels were found to be well below the EQG in 2007. Studies undertaken by Curtin University in 2011 indicate that the occurrence of shellfish imposex caused by tributyltin uptake is declining. Eighty-six sites sampled in 2006 met the EQG for organics.
S T A T E O F C O C K B U R N S O U N D 2 0 1 3 R E P O R T2 6 2 6
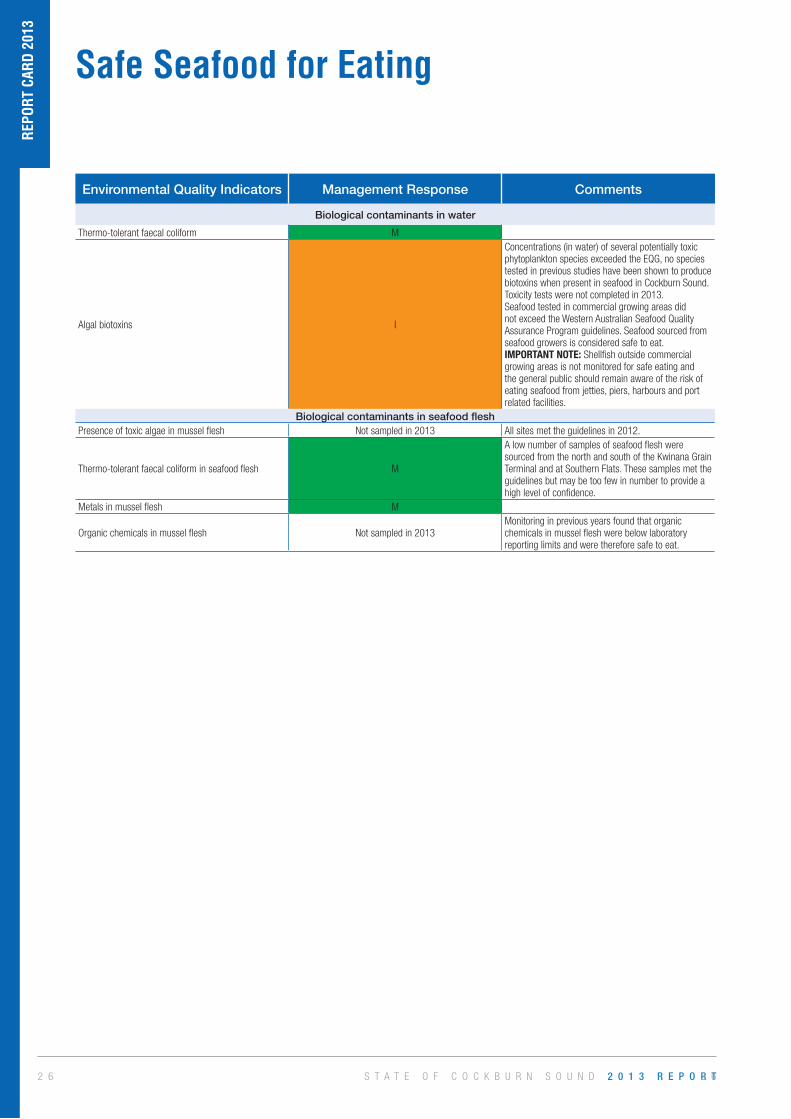
Safe Seafood for Eating
Environmental Quality Indicators Management Response Comments
Biological contaminants in water
Thermo-tolerant faecal coliform M
Algal biotoxins I
Concentrations (in water) of several potentially toxic phytoplankton species exceeded the EQG, no species tested in previous studies have been shown to produce biotoxins when present in seafood in Cockburn Sound. Toxicity tests were not completed in 2013.Seafood tested in commercial growing areas did not exceed the Western Australian Seafood Quality Assurance Program guidelines. Seafood sourced from seafood growers is considered safe to eat.IMPORTANT NOTE: Shellfish outside commercial growing areas is not monitored for safe eating and the general public should remain aware of the risk of eating seafood from jetties, piers, harbours and port related facilities.
Biological contaminants in seafood fleshPresence of toxic algae in mussel flesh Not sampled in 2013 All sites met the guidelines in 2012.
Thermo-tolerant faecal coliform in seafood flesh M
A low number of samples of seafood flesh were sourced from the north and south of the Kwinana Grain Terminal and at Southern Flats. These samples met the guidelines but may be too few in number to provide a high level of confidence.
Metals in mussel flesh M
Organic chemicals in mussel flesh Not sampled in 2013Monitoring in previous years found that organic chemicals in mussel flesh were below laboratory reporting limits and were therefore safe to eat.
REP
ORT
CAR
D 2
013
2 7S T A T E O F C O C K B U R N S O U N D 2 0 1 3 R E P O R T2 7
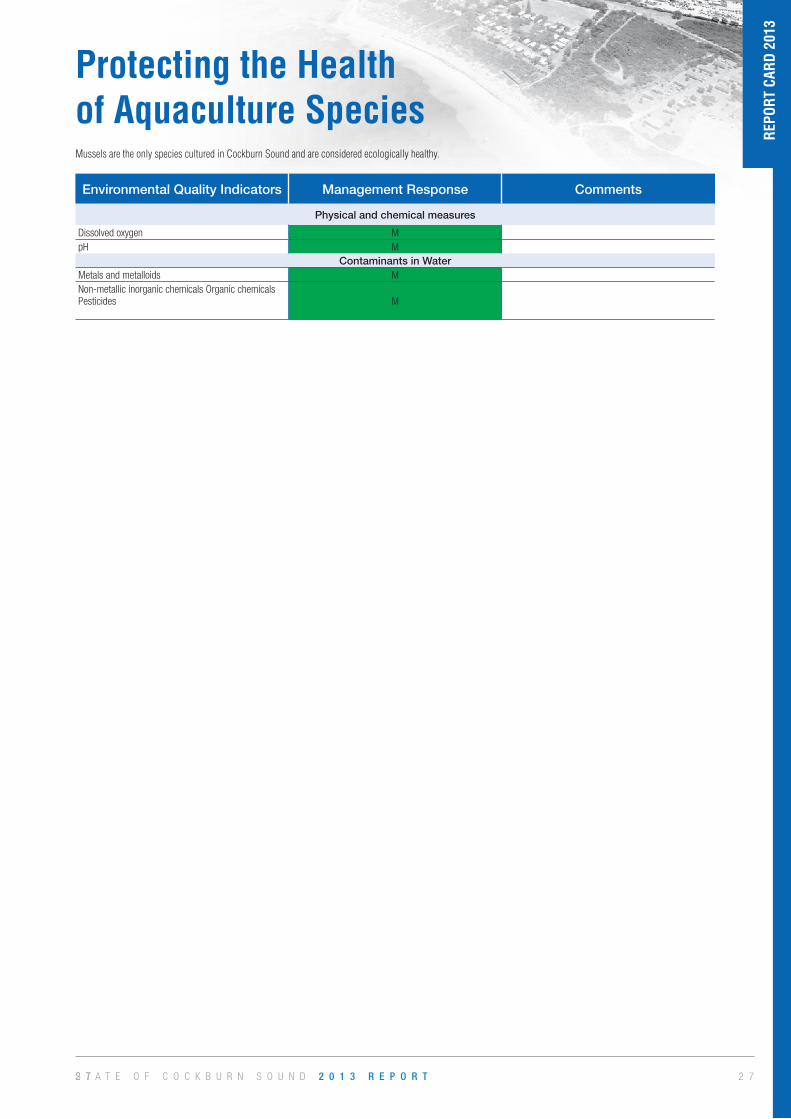
Protecting the Health of Aquaculture Species
Environmental Quality Indicators Management Response Comments
Physical and chemical measures
Dissolved oxygen MpH M
Contaminants in WaterMetals and metalloids MNon-metallic inorganic chemicals Organic chemicalsPesticides M
REP
ORT
CAR
D 2
013
Mussels are the only species cultured in Cockburn Sound and are considered ecologically healthy.
S T A T E O F C O C K B U R N S O U N D 2 0 1 3 R E P O R T2 8 2 8
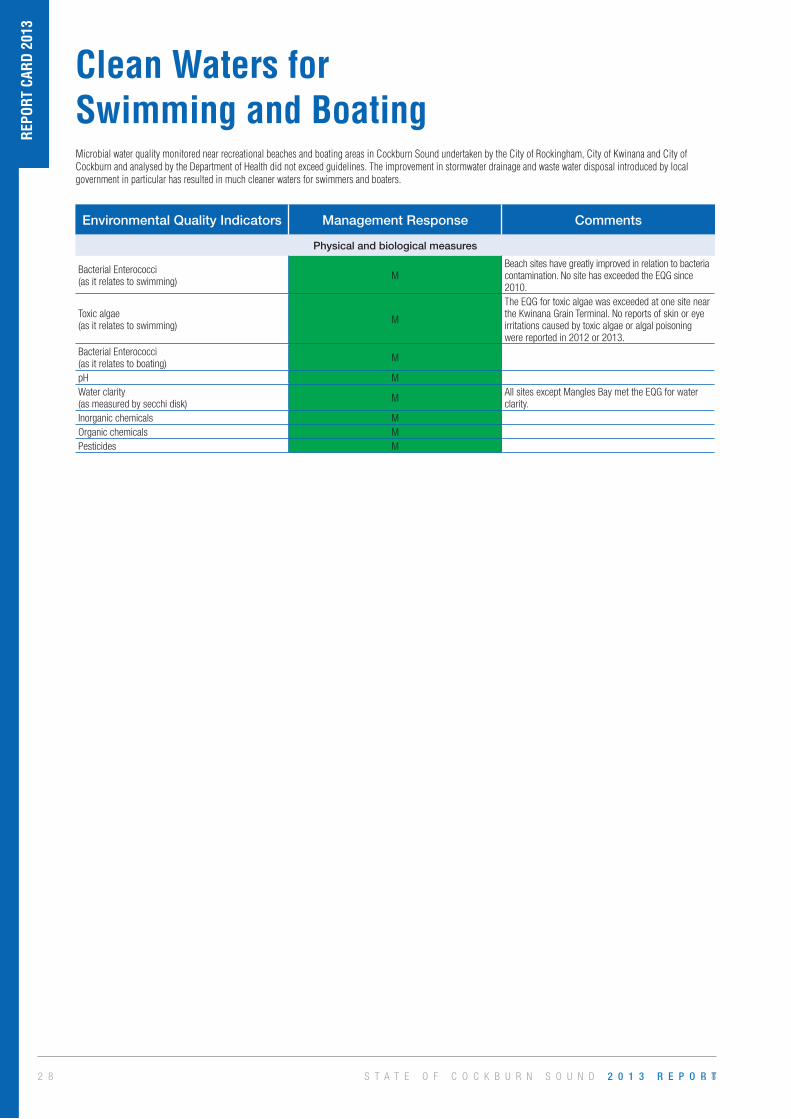
Clean Waters for Swimming and Boating
Environmental Quality Indicators Management Response Comments
Physical and biological measures
Bacterial Enterococci (as it relates to swimming) M
Beach sites have greatly improved in relation to bacteria contamination. No site has exceeded the EQG since 2010.
Toxic algae(as it relates to swimming) M
The EQG for toxic algae was exceeded at one site near the Kwinana Grain Terminal. No reports of skin or eye irritations caused by toxic algae or algal poisoning were reported in 2012 or 2013.
Bacterial Enterococci (as it relates to boating) M
pH MWater clarity(as measured by secchi disk) M All sites except Mangles Bay met the EQG for water
clarity.Inorganic chemicals MOrganic chemicals MPesticides M
REP
ORT
CAR
D 2
013
Microbial water quality monitored near recreational beaches and boating areas in Cockburn Sound undertaken by the City of Rockingham, City of Kwinana and City of Cockburn and analysed by the Department of Health did not exceed guidelines. The improvement in stormwater drainage and waste water disposal introduced by local government in particular has resulted in much cleaner waters for swimmers and boaters.
2 9S T A T E O F C O C K B U R N S O U N D 2 0 1 3 R E P O R T2 9
HIGH ECOLOGICAL PROTECTION
AREA SOUTHERNSOUND
MODERATE ECOLOGICALPROTECTION AREA -OUTSIDE HARBOURS
MODERATE ECOLOGICALPROTECTION AREA -
HARBOURS
MODERATEECOLOGICAL
PROTECTION AREA- OUTSIDE
HARBOURS
HIGH ECOLOGICAL PROTECTION
AREA NORTHERNSOUND
Action Required
Investigate
Monitor
GIS
GI7/TR2,GIN,LB
KW
JB
MB
SF
Figure 7: ECOSYSTEM HEALTH - Nutrient Enrichment
S T A T E O F C O C K B U R N S O U N D 2 0 1 3 R E P O R T3 0 3 0
HIGH ECOLOGICAL PROTECTION
AREA SOUTHERNSOUND
MODERATE ECOLOGICALPROTECTION AREA -OUTSIDE HARBOURS
MODERATE ECOLOGICALPROTECTION AREA -
HARBOURS
MODERATEECOLOGICAL
PROTECTION AREA- OUTSIDE
HARBOURS
HIGH ECOLOGICAL PROTECTION
AREA NORTHERNSOUND
Action Required
Investigate
Monitor
L C
L C
L CL C
SF
GI
1013
11
MB
L C
L C
L C9A
L CG2
L
LL
CC
C8
CB7
L CG3
L C4
L C5 L C
6A
L C
NH
L C
L C
9
12
Figure 8: ECOSYSTEM HEALTH - Light attenuation coefficient (L) and chlorophyll ‘a’ (C)
3 1S T A T E O F C O C K B U R N S O U N D 2 0 1 3 R E P O R T3 1
C7
L C
NH
C
C
9
12
HIGH ECOLOGICAL PROTECTION
AREA SOUTHERNSOUND
MODERATE ECOLOGICALPROTECTION AREA -OUTSIDE HARBOURS
MODERATE ECOLOGICALPROTECTION AREA -
HARBOURS
MODERATEECOLOGICAL
PROTECTION AREA- OUTSIDE
HARBOURS
HIGH ECOLOGICAL PROTECTION
AREA NORTHERNSOUND
Action Required
Investigate
Monitor
MB
11
13
SF
GI
8G2
CB
G3
4
56A
7
12
9
9A
10
NH
Figure 9: ECOSYSTEM HEALTH - Phytoplankton Biomass
S T A T E O F C O C K B U R N S O U N D 2 0 1 3 R E P O R T3 2
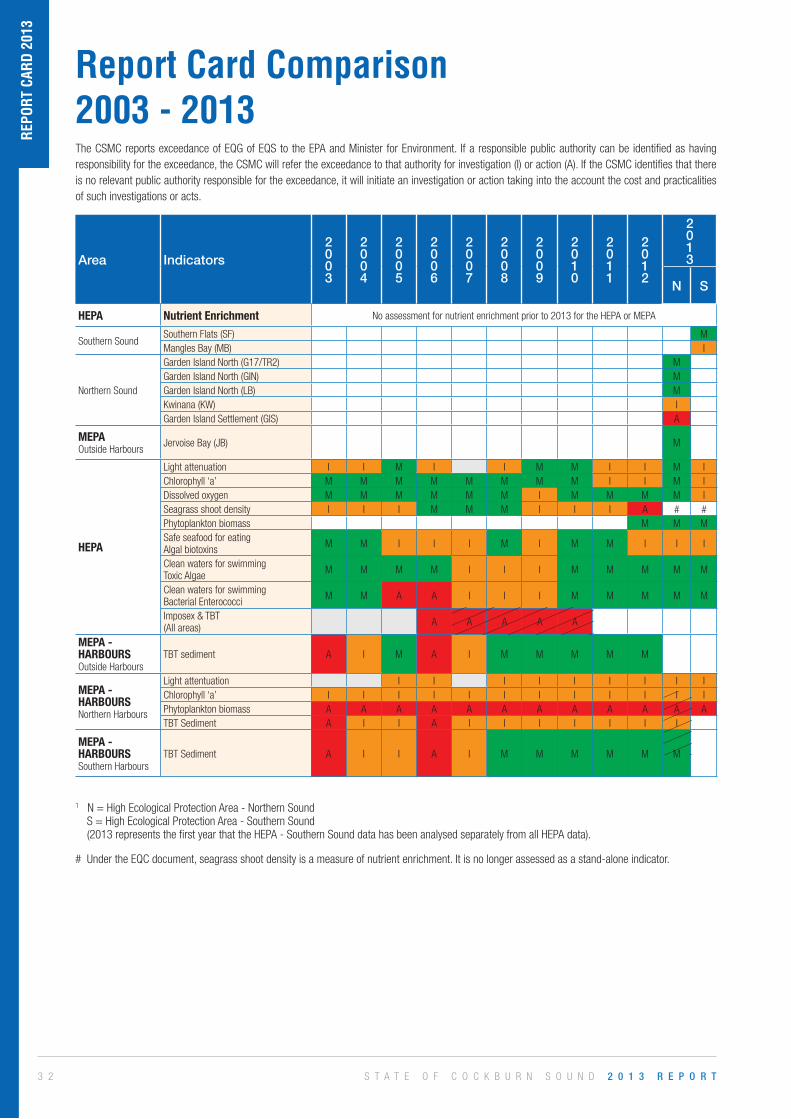
Report Card Comparison 2003 - 2013
REP
ORT
CAR
D 2
013
Area Indicators2003
2004
2005
2006
2007
2008
2009
2010
2011
2012
2013
N S
HEPA Nutrient Enrichment No assessment for nutrient enrichment prior to 2013 for the HEPA or MEPA
Southern SoundSouthern Flats (SF) MMangles Bay (MB) I
Northern Sound
Garden Island North (G17/TR2) MGarden Island North (GIN) MGarden Island North (LB) MKwinana (KW) IGarden Island Settlement (GIS) A
MEPA Outside Harbours
Jervoise Bay (JB) M
HEPA
Light attenuation I I M I I M M I I M IChlorophyll ‘a’ M M M M M M M M I I M IDissolved oxygen M M M M M M I M M M M ISeagrass shoot density I I I M M M I I I A # #Phytoplankton biomass M M MSafe seafood for eating Algal biotoxins M M I I I M I M M I I I
Clean waters for swimming Toxic Algae M M M M I I I M M M M M
Clean waters for swimming Bacterial Enterococci M M A A I I I M M M M M
Imposex & TBT (All areas) A A A A A
MEPA - HARBOURS Outside Harbours
TBT sediment A I M A I M M M M M
MEPA - HARBOURS Northern Harbours
Light attentuation I I I I I I I I IChlorophyll ‘a’ I I I I I I I I I I I IPhytoplankton biomass A A A A A A A A A A A ATBT Sediment A I I A I I I I I I I
MEPA - HARBOURS Southern Harbours
TBT Sediment A I I A I M M M M M M
The CSMC reports exceedance of EQG of EQS to the EPA and Minister for Environment. If a responsible public authority can be identified as having responsibility for the exceedance, the CSMC will refer the exceedance to that authority for investigation (I) or action (A). If the CSMC identifies that there is no relevant public authority responsible for the exceedance, it will initiate an investigation or action taking into the account the cost and practicalities of such investigations or acts.
1 N = High Ecological Protection Area - Northern Sound S = High Ecological Protection Area - Southern Sound (2013 represents the first year that the HEPA - Southern Sound data has been analysed separately from all HEPA data).
# Under the EQC document, seagrass shoot density is a measure of nutrient enrichment. It is no longer assessed as a stand-alone indicator.
3 3S T A T E O F C O C K B U R N S O U N D 2 0 1 3 R E P O R T

S T A T E O F C O C K B U R N S O U N D 2 0 1 3 R E P O R T3 4 S T A T E O F C O C K B U R N S O U N D 2 0 1 3 R E P O R T3 4
3 5S T A T E O F C O C K B U R N S O U N D 2 0 1 3 R E P O R T
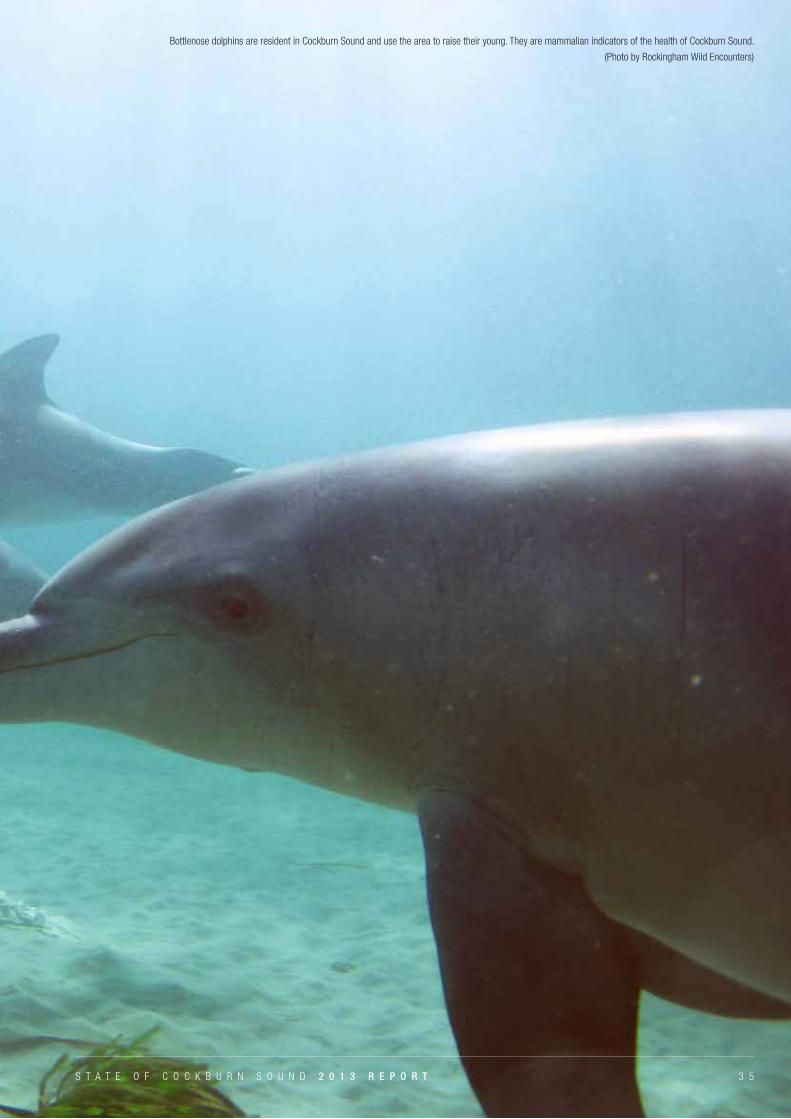
Bottlenose dolphins are resident in Cockburn Sound and use the area to raise their young. They are mammalian indicators of the health of Cockburn Sound.
(Photo by Rockingham Wild Encounters)
S T A T E O F C O C K B U R N S O U N D 2 0 1 3 R E P O R T 3 5
S T A T E O F C O C K B U R N S O U N D 2 0 1 3 R E P O R T3 6
State of Cockburn Sound Report 2013Shop 1, 15 Railway Terrace, Rockingham Beach WA 6168
PO Box 5161, Rockingham Beach WA 6969
Telephone: (08) 9591 3837 Facsimile: (08) 9528 5387
Email: [email protected]
www.csmc.environment.wa.gov.au