Embed Size (px)
Citation preview

1
MBTA STATE OF THE SERVICE
Commuter Rail

Commuter Rail at a Glance
2
Commuter Rail Routes 145 North Side9 South Side
Route Miles 388
Stations 138
Parking Spaces 39,24612,174 North Side27,072 South Side
Weekday Boardings 129,075
Annual Ridership 35 million
Revenue Fleet90 Locomotives410 Coaches
Maintenance Facilities 3
Layover/Storage Facilities 14
Source: MBTA Ridership and Service Statistics, 2014.MBTA parking data based on http://www.mbta.com/riding_the_t/parking/. Revenue Fleet info based on Draft FY 2016-2030 Commuter Rail Fleet Management Plan.

Overview of the System Comparison to Other Services
3Source: MBTA Ridership and Service Statistics, 2014.National Transit Database: 2013 Transit Profiles.

RidershipPassenger Volume Flow
Line Riders
NORTH SIDE TYPICAL WEEKDAY RIDERSHIP
Newburyport/Rockport 16,254
Haverhill 8,843
Lowell 11,965
Fitchburg 9,556
North Side Typical Weekday Ridership 46,618
SOUTH SIDE TYPICAL WEEKDAY RIDERSHIP
Framingham/Worcester 16,293
Needham 6,972
Franklin 12,480
Providence/Stoughton 26,465
Fairmount 1,038
Middleborough/Lakeville 7,182
Kingston/Plymouth 6,560
Greenbush 5,411
South Side Typical Weekday Ridership 82,401
TOTAL TYPICAL WEEKDAY COMMUTER RAIL RIDERSHIP 129,019
Source: MBTA, Ridership and Service Statistics, 2014.CTPS MBTA Commuter Rail Passenger Count Results, 2012

Commuter Rail StationsStation Accessibility
Draft for Discussion & Policy Purposes Only 5
143 total stations (includes Foxboro, seasonal stations, and stations under construction)
51 fully accessible stations, including 2 stations under construction
57 partially accessible stations with “mini-high” platforms
34 stations not accessible
Back Bay is fully accessible, except for Worcester Line platform with “mini-high”

Commuter Rail StationsParking Supply and Utilization
6
Parking is provided at 114 of the total 138 Commuter Rail stations
Of the 39,246 total commuter rail spaces, 25,977 are owned by the MBTA
4,639 North Side
21,338 South Side
Parking is a revenue generator
Daily rates between $4-$7 per day
Source: CTPS Park-and-Ride Capacity and Utilization (commuter rail only), 2013.MBTA Parking Facilities Utilization, FY 2016.www.mbta.com.www.capeflyer.com.

Commuter Rail Vehicle FleetStatistics about the Vehicle Fleet
7
• 92 switching, MOW, and wreck response vehicles in support fleet
• 500 active locomotives and coaches in revenue fleet
• Minimum target service life is 25 years
• 240 revenue vehicles at/beyond 25-year service life
• 37 locomotives are beyond their 25-year service life, with another 13 approaching their 25-year service life within the next six years
Active
At/Beyond25-Year
Service Life
Coaches 410 203
Locomotives 90 37Source: Support fleet data from MBTA Commuter Rail Operating Agreement, dated February 5, 2014,
and MBTA Commuter Rail Operations.Revenue fleet data from FY 2016 – 2030 MBTA Commuter Rail Fleet Management Plan -DRAFT.

Commuter Rail Vehicle FleetMean Miles between Failure for CR Locomotive Fleet
8
0
2,000
4,000
6,000
8,000
10,000
12,000
14,000
FY20
00
FY20
01
FY20
02
FY20
03
FY20
04
FY20
05
FY20
06
FY20
07
FY20
08
FY20
09
FY20
10
FY20
11
FY20
12
FY20
13
FY20
14
FY20
15
FY20
16
FY20
17
MM
BF (m
iles)
Goal Actual
MMBF goal reduced with start of new operating contract in FY2014 to reflect state of vehicles and MMBF history at that time
New operating contract stipulates gradually increasing MMBF goals
Source: FY 2016 – 2030 MBTA Commuter Rail Fleet Management Plan - DRAFT.

Commuter Rail Vehicle Fleet”Legacy” vs. HSP Locomotive MMBF Comparison
9
0
2,000
4,000
6,000
8,000
10,000
12,000
14,000D
ec-1
4
Jan-
15
Feb-
15
Mar
-15
Apr
-15
May
-15
Jun-
15
Jul-
15
Aug
-15
Sep-
15
Oct
-15
Nov
-15
Dec
-15
Jan-
16
Feb-
16
Mar
-16
MM
BF (m
iles)
MMBF By Locomotive Class (FY15 – FY16)Rolling 6-Month Average
"Legacy" Locos HSP Locos
Source: MMBF Reports provided by Leanna Green, MBTA.

Revenues from Commuter Rail
10* Rounded to nearest million/Annual Revenue GeneratedSource: CTPS MBTA Revenue Report, Fiscal Year 2015.
MBTA Ridership and Service Statistics, 2014.
OPERATING REVENUES$215M
TOTAL ANNUAL REVENUE GENERATED BY COMMUTER RAIL=$285M
PARKING
$17MRETAIL SPACE +OTHER LEASES
$3M
REAL ESTATE
$12M
ADVERTISING
$6M
UTILITIES & TELECOMM
$6M
NON-OPERATING REVENUES: $70M
REVENUE ASSESSMENTS (TOWNS WITH CR ONLY)
$12M
REVENUE ASSESSMENTS (10% TOWNS WITH SUBWAY AND BUS)
$14M

Costs to Operate Commuter Rail
11
FIXED PRICE$320M
TOTAL ANNUAL COST TO OPERATE COMMUTER RAIL=$397M
OTHER COSTS: $77M
50%
FUEL$30M
SERVICES$47M
72%NTD-ReportedFarebox Recovery
Farebox RecoveryConsidering Non-
Operating Revenues
* Costs rounded to nearest Million $

65%
70%
75%
80%
85%
90%
95%
100%
$-
$200,000
$400,000
$600,000
$800,000
$1,000,000
$1,200,000
Penalty Cap Total Penalties Assessed 3-Month OTP Average
Penalty Cap increase from Year 1 to Year 2
Contractual Performance PenaltiesPenalties Assessed vs. Penalty Limit
12
Force Majeure

Ridership Counts
13
CURRENT POTENTIAL• Manual Ridership Reports Ridership as reported by conductors
On-board only, no station-level breakdown
Conductors must multi-task; focus is on safety
No incentive to improve accuracy
• Bi-Annual Peak Passenger Counts Platform counts at Boston terminals
Peak period only
On-board only, no station-level breakdown
Primary purpose is to determine equipment and staffing needs – not to collect accurate ridership
• Comprehensive Count Audits Focused on capturing ridership at all stations
Expensive and time consuming
Last done in 2012
None currently planned
• Automated Passenger Counters On-board for each commuter rail coach
Pilot car is being tested now – successful
Wider rollout possible
• Automated Fare Collection 2.0 Pay with phone (no app), contactless credit
card, Charlie2 issued card
No cash on-board vehicle
Readers added at all rail stations and on platforms at South StationNorth Station / Back Bay
Automatically captures ridership from the tap made at each station (on, off)

RidershipDaily Inbound Boardings by Station Characteristics
14
No. Commuter Rail Station Daily Inbound Boardings Parking Capacity Accessibility
1. Salem 2,389 700 Fully
2. Mansfield 2,077 806 Partially
3. Lowell 1,770 695 Partially
4. Beverly 1,681 500 Partially
5. Attleboro 1,665 780 Partially
6. Route 128 1,604 2,589 Fully
7. Anderson 1,502 1,541 Fully
8. Worcester 1,475 500 Partially
9. South Attleboro 1,462 568 Partially
10. Providence 1,341 330 Fully
Highest Ridership Stations
Source: MBTA Ridership Counts, April 2016 (select stations).MBTA Ridership and Service Statistics, 2014.MBTA parking data based on http://www.mbta.com/riding_the_t/parking/

On-Time PerformanceTop 10 Causes of Delay (2015)
15
Rank Cause of Delay No. Incidents (2015)
1. Extreme Weather 4,743
2. Heavy Ridership 3,801
3. Gate Crossing Protection 1,136
4. Amtrak Intercity Conflict 980
5. Signal System 905
6. Speed Restriction 805
7. Other Extraordinary Delay 845
8. Signal Code Line Failure 713
9. Commuter Conflict 657
10. Switch Failure 650
Residual delays, not
included in this list,
when taken together are
by far the greatest
reason for delay
Several of the top
causes of delay in 2015
related to extreme weather
How delays are coded makes a
difference

On-Time PerformanceThe Importance of Residual Delays
16
Within the Last 12 Months…Residual delays comprised 30% of the
number of incidents causing delay, compared to all other causes combined
Residual DelaysOne initial incident can create a ripple
effect of delay, as several commuter rail trains are impacted downstream, and
sometimes on multiple lines
All Other Causes
COMBINED
Residual Delays Alone
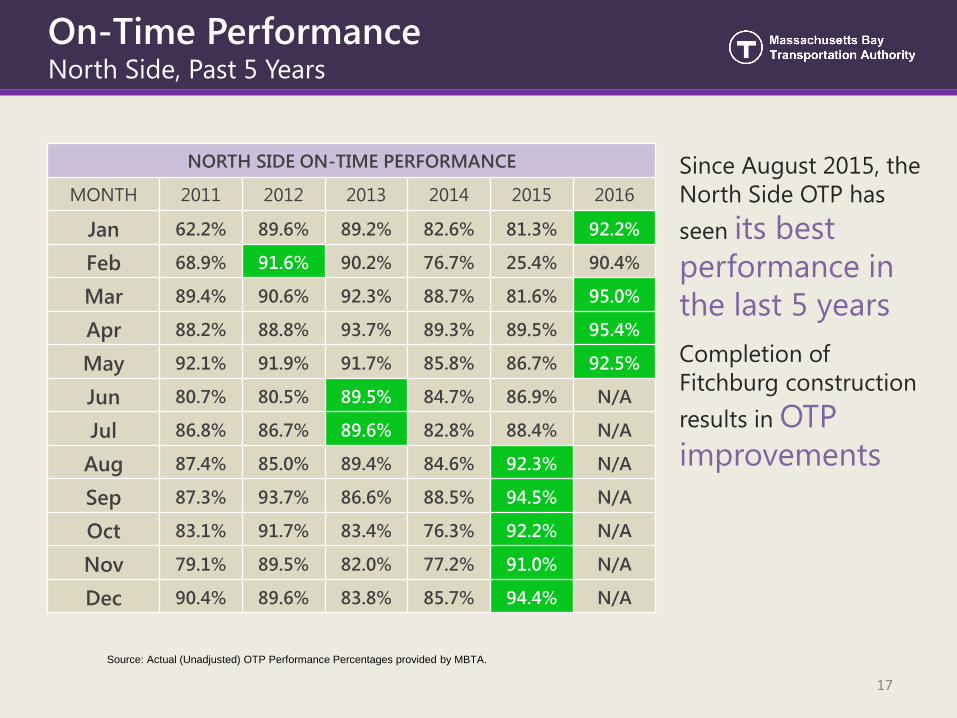
On-Time PerformanceNorth Side, Past 5 Years
17
Since August 2015, the North Side OTP has seen its best performance in the last 5 yearsCompletion of Fitchburg construction results in OTP improvements
NORTH SIDE ON-TIME PERFORMANCE
MONTH 2011 2012 2013 2014 2015 2016
Jan 62.2% 89.6% 89.2% 82.6% 81.3% 92.2%
Feb 68.9% 91.6% 90.2% 76.7% 25.4% 90.4%
Mar 89.4% 90.6% 92.3% 88.7% 81.6% 95.0%
Apr 88.2% 88.8% 93.7% 89.3% 89.5% 95.4%
May 92.1% 91.9% 91.7% 85.8% 86.7% 92.5%
Jun 80.7% 80.5% 89.5% 84.7% 86.9% N/A
Jul 86.8% 86.7% 89.6% 82.8% 88.4% N/A
Aug 87.4% 85.0% 89.4% 84.6% 92.3% N/A
Sep 87.3% 93.7% 86.6% 88.5% 94.5% N/A
Oct 83.1% 91.7% 83.4% 76.3% 92.2% N/A
Nov 79.1% 89.5% 82.0% 77.2% 91.0% N/A
Dec 90.4% 89.6% 83.8% 85.7% 94.4% N/A
Source: Actual (Unadjusted) OTP Performance Percentages provided by MBTA.

On-Time PerformanceSouth Side, Past 5 Years
18
Construction work has impacted Worcester Line OTP
Significant events have impacted OTP:
• Amtrak Forest Interlocking
• Amtrak Tower 1 interlocking
• Amtrak Centralized Electrification and Traffic Control (CETC) dispatching
• Heat restrictions on Worcester Line
SOUTH SIDE ON-TIME PERFORMANCE
MONTH 2011 2012 2013 2014 2015 2016
Jan 80.1% 95.2% 90.2% 89.6% 89.4% 91.8%
Feb 81.0% 96.3% 94.9% 89.8% 37.1% 88.0%
Mar 89.7% 95.5% 93.7% 94.5% 79.5% 91.5%
Apr 89.2% 95.9% 95.8% 95.3% 78.0% 91.5%
May 87.9% 93.8% 94.8% 92.5% 86.3% 87.9%
Jun 86.0% 93.8% 92.3% 89.9% 88.5% N/A
Jul 81.9% 91.4% 93.4% 92.4% 90.5% N/A
Aug 84.5% 92.5% 94.0% 92.6% 88.8% N/A
Sep 92.6% 95.8% 94.9% 94.4% 90.8% N/A
Oct 90.7% 94.8% 94.5% 91.5% 90.2% N/A
Nov 90.7% 92.3% 91.8% 89.7% 86.3% N/A
Dec 94.6% 93.4% 92.3% 92.9% 91.7% N/A
Source: Actual (Unadjusted) OTP Performance Percentages provided by MBTA.

Source: Actual (Unadjusted) OTP Performance Percentages provided by MBTA.
Average On-Time Performance – December 2015 to May 2016
Line Dec Jan Feb Mar Apr MayRockport 93.0% 93.2% 89.8% 95.6% 96.0% 95.1%Newburyport 94.7% 92.3% 91.1% 94.8% 96.9% 93.2%Haverhill 94.8% 86.8% 88.3% 94.4% 93.6% 88.5%Lowell 95.7% 92.6% 91.6% 94.9% 96.2% 95.0%Fitchburg 93.6% 96.3% 91.3% 95.4% 94.1% 90.1%Worcester 84.2% 88.4% 86.0% 88.2% 78.0% 64.9%Needham 91.5% 91.9% 86.9% 95.7% 96.6% 94.1%Franklin 87.3% 86.0% 78.6% 82.4% 87.2% 82.7%Providence 88.5% 89.0% 83.2% 86.3% 89.4% 82.5%Stoughton 88.8% 86.3% 77.8% 88.0% 92.0% 88.0%Fairmount 97.1% 96.5% 90.7% 93.6% 93.8% 94.3%Middleboro 94.9% 95.4% 94.1% 95.4% 94.4% 93.1%Kingston/Plymouth 95.1% 96.7% 96.0% 97.1% 96.3% 96.1%
Greenbush 97.5% 95.9% 98.6% 97.1% 95.7% 96.1%
19
Trains Less than 5 Minutes Late by Service LineProvidence, Stoughton and Franklin Lines impacted by significant events
Worcester Line impacted by ongoing construction
Steady performance continues on lines with no construction
8 lines had OTP higher than 92% in May
7 lines had OTP higher than 90% for each of the last 6 months
Lines connected to Amtrak North East Corridor
On-Time Performance - < 5 Minutes LateBy Line, Past 6 Months

Source: Actual (Unadjusted) OTP Performance Percentages provided by MBTA.
Average Performance nine minutes or less – December 2015 to May 2016
Line Dec Jan Feb Mar Apr MayRockport 96.8% 97.3% 95.1% 98.5% 98.8% 97.6%Newburyport 97.8% 96.7% 95.4% 98.1% 99.0% 97.6%Haverhill 97.8% 91.9% 94.2% 97.4% 97.1% 94.7%Lowell 98.2% 96.9% 96.6% 98.3% 98.6% 97.9%Fitchburg 96.2% 98.1% 95.7% 97.2% 96.8% 95.7%Worcester 92.9% 94.2% 92.0% 94.9% 88.6% 81.6%Needham 95.2% 97.3% 91.4% 98.8% 99.3% 98.3%Franklin 95.0% 95.5% 87.1% 92.5% 95.2% 94.1%Providence 95.3% 95.5% 90.4% 93.0% 95.1% 91.3%Stoughton 94.0% 95.2% 86.9% 95.4% 97.3% 95.4%Fairmount 98.6% 98.8% 93.7% 97.7% 96.9% 98.5%Middleboro 97.9% 97.6% 96.0% 97.4% 97.5% 97.0%Kingston/Plymouth 97.0% 98.0% 97.3% 98.4% 98.2% 98.5%
Greenbush 98.4% 97.4% 99.5% 97.7% 97.2% 96.8%
20
Trains Less than 9 Minutes Late by Service Line
Lines connected to Amtrak North East Corridor
On-Time Performance - 0-9 minutes LateBy Line, Past 6 Months

RidershipAvailability Factors
21
Train Seating Capacity Over the last year, MBTA operated over 140,000 trains. Less than 2,500 of them, or only 1.67%, were over capacity. That means that 98% of commuter rail trainshad a seat for every passenger.

Single track constraints and limited right-of-way Newburyport Line, between
North Beverly and Newburyport Haverhill Line, between Reading
and Andover Old Colony Main Line, between
Boston and Braintree Worcester Line, adjacent to the
Massachusetts Turnpike
Drawbridge rehabilitation/ replacement Gloucester Draw Beverly Draw Saugus Draw Draw 1 (North Station)
Parking constraints 25 commuter rail stations are at or over
parking capacity22
Systemwide Challenges

23
Station accessibility 34 stations are not accessible
Challenges with upgrading to fully accessible stations in corridors that require special freight clearances
Maintenance/layover facility capacity Overnight layover constraints on the North
Side (Rockport, Bradford, Lowell, Fitchburg) Overnight layover constraints on the South
Side (Worcester, Needham, Franklin, Stoughton)
Midday layover constraint on the South Side
Coach capacity Of 410 coaches in the active fleet, 203 or
approximately 50% are single-level
PTC construction
Source: FY 2016 – 2030 MBTA Commuter Rail Fleet Management Plan - DRAFT.
Systemwide Challenges

Capital NeedsPositive Train Control (PTC)
• Implementation Schedule
Phase I – PTC Equipment Installation• Plan to complete PTC Hardware installation by December 2018.
Phase II – Commuter Rail• South Side – Implement PTC on South Side where most of the
railroad is already equipped with cab signals (2019).• North Side – Implement PTC on North Side where there are no cab
signals and a derivative of the PTC technology will be deployed which requires additional testing (2019-2020).
Phase III – Freight Main Line (North Side)• Implement PTC on the Freight Main Line as an overlay to the
passenger rail PTC. This will require additional testing and integration. Plan to complete PTC Project by end of 2020.
• Total estimated project cost $451.3 M with 15% contingency
24

Potential Fleet InvestmentsLocomotives
25
• Invest in existing locomotives Replace major components on
10 active locomotives (UTEX)• Typical 2 year process• Not life extending; reliability improvements
Rehab 10 active locomotives• Life extending – 10 to 15 years
Remanufacture 10 locomotives currently stored• Life extending – 15 to 20 years
• Possible procurement of new locomotives Will be addressed in Fleet Plan Typical 7 year procurement until final acceptance of fleet

Capital NeedsPotential Fleet Investments - Coaches
26
• Invest in existing coaches Kawasaki rebuild program
• 118 coaches undergoing rebuild• Life extending – 10 to 15 years
• Possible procurement of new coaches Coach for coach replacement
• Single levels replaced by bi-levels
Explore potential options on Rotem procurement• Significantly reduces delivery time for known product

Capital NeedsInfrastructure
27
South Station Expansion South Station is at capacity today Provides ability to grow on
South Side Addresses need for midday layover
South Coast Rail Expands service to New Bedford/
Fall River region
Systemwide Track & Signal Upgrades Replace jointed rail with CWR Restore double track Modernize signal system
Structures Draw 1/Tower A at North Station East Street Bridge Bacon Street Bridge
Stations Construct Blue Hill Avenue Station
(Fairmount Line) Provide platform and upgrade
Ruggles Station Upgrades to Ballardvale and
Andover Stations Design and plan for accessibility
improvements at Winchester, Auburndale, Natick Center, Mansfield, South Attleboro Stations
28
MBTA STATE OF THE SERVICE – COMMUTER RAIL
APPENDIX

29
Source: North Side Equipment Cycle, Effective June 29, 2015.South Side Equipment Cycle, Effective June 15, 2015.Train Schedules, Effective December 14, 2015.
Overview of the System Operations – Train Volumes

Overview of the System Ownership and Agreements
30
MBTA owns the right of way used for existing passenger service within Massachusetts
Amtrak is the primary owner of the Northeast Corridor outside of Massachusetts
Proposed extension of service to Wachusett Station would operate over a segment of Pan Am track
Proposed extension of service beyond Forge Park would operate over CSXtrack
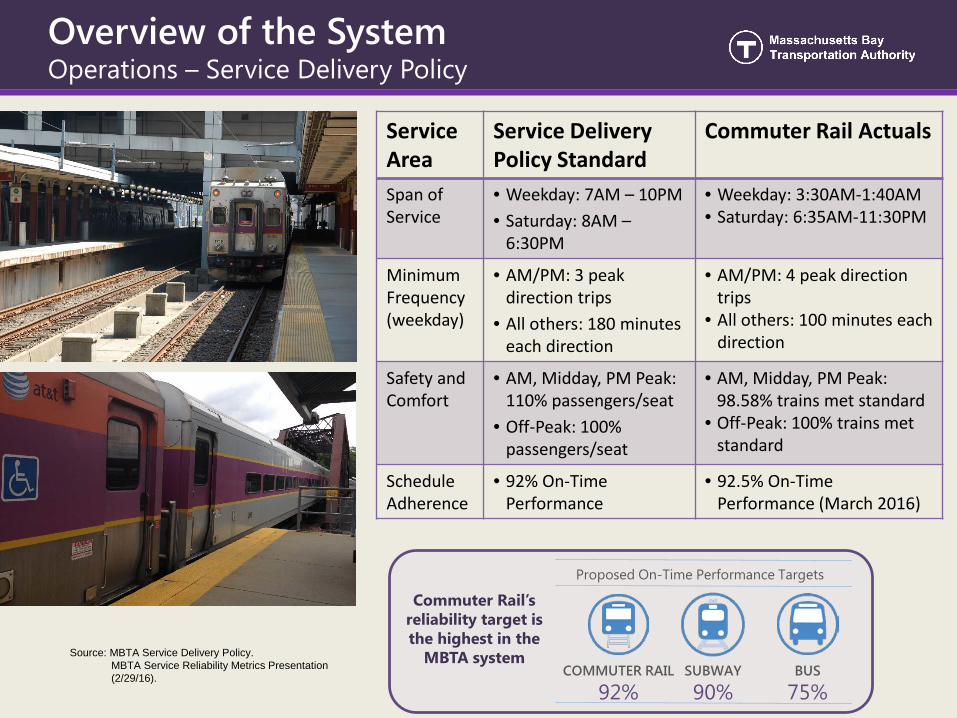
Overview of the System Operations – Service Delivery Policy
SUBWAY
90%COMMUTER RAIL
92%BUS
75%
Proposed On-Time Performance Targets
Commuter Rail’s reliability target is the highest in the
MBTA systemSource: MBTA Service Delivery Policy.MBTA Service Reliability Metrics Presentation (2/29/16).
ServiceArea
Service Delivery Policy Standard
Commuter Rail Actuals
Span of Service
• Weekday: 7AM – 10PM• Saturday: 8AM –
6:30PM
• Weekday: 3:30AM-1:40AM• Saturday: 6:35AM-11:30PM
Minimum Frequency (weekday)
• AM/PM: 3 peak direction trips
• All others: 180 minutes each direction
• AM/PM: 4 peak direction trips
• All others: 100 minutes eachdirection
Safety and Comfort
• AM, Midday, PM Peak: 110% passengers/seat
• Off-Peak: 100% passengers/seat
• AM, Midday, PM Peak: 98.58% trains met standard
• Off-Peak: 100% trains met standard
Schedule Adherence
• 92% On-Time Performance
• 92.5% On-Time Performance (March 2016)

Overview of the System Dispatching – North Side
32
MBTA controls dispatching on much, but not all, of the commuter rail network
Pan Am controls dispatching on segments of the Haverhill, Lowell, and Fitchburg Lines

Overview of the System Dispatching – South Side
33
Amtrak controls dispatching along the entire Northeast Corridor, at South Station, and over a small segment of the Dorchester Branch
Mass Coastal controls dispatching along the Framingham Secondary, Middleborough Secondary, and Cape Main Line

Commuter Rail Vehicle FleetMean Miles between Failure for CR Coach Fleet
34
Source: Modified from FY 2016 – 2030 MBTA Commuter Rail Fleet Management Plan - DRAFT.
135,538
0
40,000
80,000
120,000
160,000
200,000
240,000
FY20
00
FY20
01
FY20
02
FY20
03
FY20
04
FY20
05
FY20
06
FY20
07
FY20
08
FY20
09
FY20
10
FY20
11
FY20
12
FY20
13
FY20
14
FY20
15
FY20
16
MM
BF (m
iles)
Goal Actual

Commuter Rail Vehicle FleetCoach Equipment Type MMBF Comparison
35Source: MMBF Reports provided by Leanna Green, MBTA.
0
10,000
20,000
30,000
40,000
50,000
60,000
70,000
Dec
-14
Jan-
15
Feb-
15
Mar
-15
Apr
-15
May
-15
Jun-
15
Jul-
15
Aug
-15
Sep-
15
Oct
-15
Nov
-15
Dec
-15
Jan-
16
Feb-
16
Mar
-16
MM
BF (m
iles)
MMBF By Control Coach Equipment Type (FY15 – FY16)Rolling 6-Month Average
BI-Level CTC Single Level CC
200,000
300,000
400,000
500,000
600,000
700,000
800,000
Dec
-14
Jan-
15
Feb-
15
Mar
-15
Apr
-15
May
-15
Jun-
15
Jul-
15
Aug
-15
Sep-
15
Oct
-15
Nov
-15
Dec
-15
Jan-
16
Feb-
16
Mar
-16
MM
BF (m
iles)
MMBF By Blind Coach Equipment Type (FY15 – FY16)Rolling 6-Month Average
Bi-Level BTC Single Level BC

36
Maintenance and Layover FacilitiesMaintenance Facilities
Existing MBTA Maintenance Facilities
Commuter Rail Maintenance Facility (CRMF)
South Side Service & Inspection
Readville Interim Repair Facility

37
Maintenance and Layover FacilitiesOvernight and Midday Layover Facilities – North Side
Location Consist Capacity
Sets Needed for Service
OVERNIGHT LAYOVER FACILITIESRockport 4 4Newburyport 4 4
Bradford 4 5
Lowell 0 5Fitchburg(Wachusett replaces Fitchburg in 2016)
5(6) 6
Commuter Rail Maintenance Facility (CRMF)
12 1 (spare)
Subtotal 29 (30) 25
MIDDAY LAYOVER FACILITIESCommuter Rail Maintenance Facility (CRMF)
12
Subtotal 12

38
Maintenance and Layover FacilitiesOvernight and Midday Layover Facilities – South Side
Location Consist Capacity
Sets Needed for Service
OVERNIGHT LAYOVER FACILITIES
Worcester 4 8
Needham 3 3
Franklin 3 5
Pawtucket 6 7
Stoughton 0 2
Boston (Readville) 12 N/A
Middleborough 5 4
Kingston 5 4
Greenbush 5 4
Boston (Amtrak SHSY) 8 2 (Fairmount)
Boston (Amtrak Front Yard) 2 1 (spare)
Subtotal 53 40
MIDDAY LAYOVER FACILITIESBoston (Readville) 12
Boston (Amtrak SHSY) 8
Subtotal 20

RevenuesMonthly MBTA Commuter Rail Unallocated Revenue
39Source: CTPS MBTA Unit Sales for Fiscal Year 2015, 2016.

Source: www.mbta.com
RidershipZone Structure and Travel Times
40
• There are 11 commuter rail zones (Zone 1a through Zone 10) with one-way fares between $2.10 and $11.50
• There are 14 stations1 in Zone 1a alone
• The Needham and Fairmount Lines are entirely within Zones 1 and 2
• The Providence Line is the only one extending beyond Zone 8, with one station (T.F. Green) in Zone 9 and one (Wickford Junction) in Zone 10
1 Including North Station and South Station

RidershipCharacteristics of High Ridership Stations
41Source: MBTA Ridership Counts, April 2016 (select stations).MBTA Ridership and Service Statistics, 2014.

RidershipPerformance facts
42
ReliabilityAlmost 2/3 of the
commuter rail lines operated at 92% on-time performance or greater over the
last 12 months
Coverage AreaMore than 60% (86) of all commuter rail stations are
greater than a 30 minute travel time from
North or South Station.
Train Frequency Each weekday, commuter rail operates over 500
trains, of one-way distances between 10
and 63 miles

43
AssetsSystemwide Summary
ASSET CATEGORY NORTH SIDE SOUTH SIDE TOTAL
Total Track Miles 327.82 410.12 737.44Revenue Track Miles 297.27 342.90 640.17Layover Track Miles 11.87 12.79 24.66Non-Revenue Track Miles 18.18 54.43 72.61Single Track Miles 45.07 133.69 178.76
Grade Crossings 169 187 356Culverts 176 129 305Undergrade Bridges 139 216 355Interlockings 61 84 145Switches 386 431 817
Hand Throw Switches 165 197 362Power Switches 221 234 455
Source: MBTA 2016 Engineering Track Charts

On-Time PerformanceSystemwide Actual On-Time Performance
44
85%
86%
87%
88%
89%
90%
91%
92%
93%
94%
95%
Jun-
2015
Jul-
2015
Aug
-201
5
Sep-
2015
Oct
-201
5
Nov
-201
5
Dec
-201
5
Jan-
2016
Feb-
2016
Mar
-201
6
Apr
-201
6
May
-201
6
Act
ual O
n-Ti
me
Perf
orm
ance
3-Month Running Average Linear (3-Month Running Average)
• OTP improves as more locomotives are available and service reliability increases
• Currently working on program to provide additional spare locomotives on a daily basis

45
Drawbridge Condition Replacement Cost Year Built
Gloucester Structurally Deficient –to be replaced $60M 1911
Beverly Structurally Deficient –to be replaced $56M 1885
Saugus Structurally Deficient –to be replaced $60M 1911
Manchester Structurally Adequate N/A 1944
Tower A Structurally Deficient –to be replaced $121M 1931
Systemwide Challenges (Continued)Drawbridges

Commuter Rail at a GlanceFun Facts
46

47
MBTA STATE OF THE SERVICE
System Map