Embed Size (px)
Citation preview

+
Presented by: Sponsored by:
Contents01 Executive summary 3
02 Who took the survey? 8
03 IT performance & employee engagement 13
04 Building quality in 22
05 Lean product management 32
06 Changing organizational culture and identity 36
07 Understanding the ROI of DevOps 40
Conclusion 52
Methodology 53
About the authors 54
Share:
2
2016 State of DevOps Report | presented by Puppet + DORA
Share:
2
Executive summaryThe fifth annual State of DevOps Report confirms and highlights the fact that achieving higher IT and organizational performance is a team effort spanning development and operations — and it’s an investment that can deliver powerful returns.
This year’s report shows how improving the entire product lifecycle — from initial product planning, to quality and security assurance, to customer feedback — speeds up delivery while improving quality, security and business outcomes. DevOps practices also improve organizational culture and enhance employee engagement.
01
Share:
3
2016 State of DevOps Report | presented by Puppet + DORA
Back to Contents
Share:
3Chapter 01 — Executive summary
Over the past five years, we’ve surveyed more than 25,000 technical professionals worldwide to better understand how the technical practices, cultural norms, and lean management practices we associate with DevOps affect IT performance and organizational performance.
Last year we looked at several dimensions of DevOps, including lean management practices; application architecture; the role of IT managers in a DevOps transformation; diversity; deployment pain; and burnout. In short, we confirmed that there’s a lot more to IT performance than technical practices. In order to create sustained high performance, organizations need to invest just as much in their people and processes as they do in their technology.
We wanted this year’s survey to address some of the most pressing issues for the DevOps community today. These include concerns about understanding the ROI of DevOps; the role of experimentation and its value; how to integrate security into DevOps; and the relationship between employee engagement and organizational success.
2016 State of DevOps Report | presented by Puppet + DORA
Back to Contents
Share:
Chapter 01 — Executive summary 4
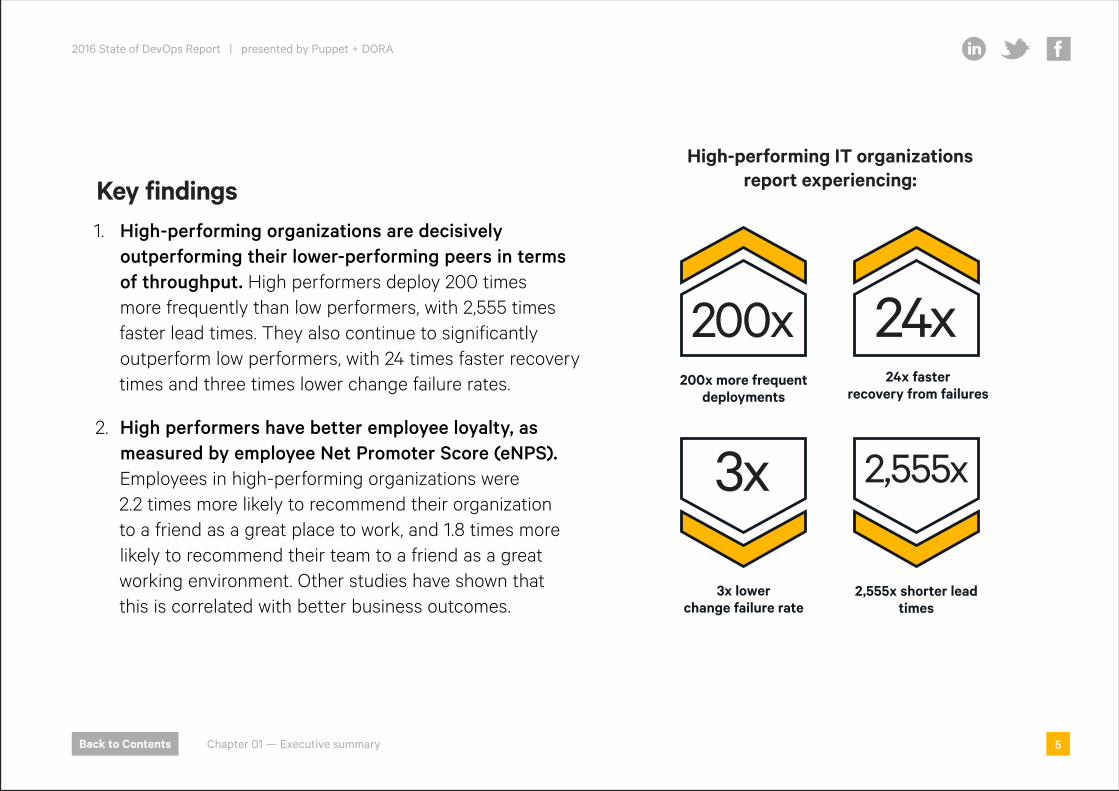
Key findings1. High-performing organizations are decisively
outperforming their lower-performing peers in terms of throughput. High performers deploy 200 times more frequently than low performers, with 2,555 times faster lead times. They also continue to significantly outperform low performers, with 24 times faster recovery times and three times lower change failure rates.
2. High performers have better employee loyalty, as measured by employee Net Promoter Score (eNPS).Employees in high-performing organizations were 2.2 times more likely to recommend their organization to a friend as a great place to work, and 1.8 times more likely to recommend their team to a friend as a great working environment. Other studies have shown that this is correlated with better business outcomes.
2,555x shorter lead times
2,555x
High-performing IT organizations report experiencing:
200x more frequent deployments
200x
3x lowerchange failure rate
3x
24x faster recovery from failures
24x
2016 State of DevOps Report | presented by Puppet + DORA
Back to Contents
Share:
Chapter 01 — Executive summary 5
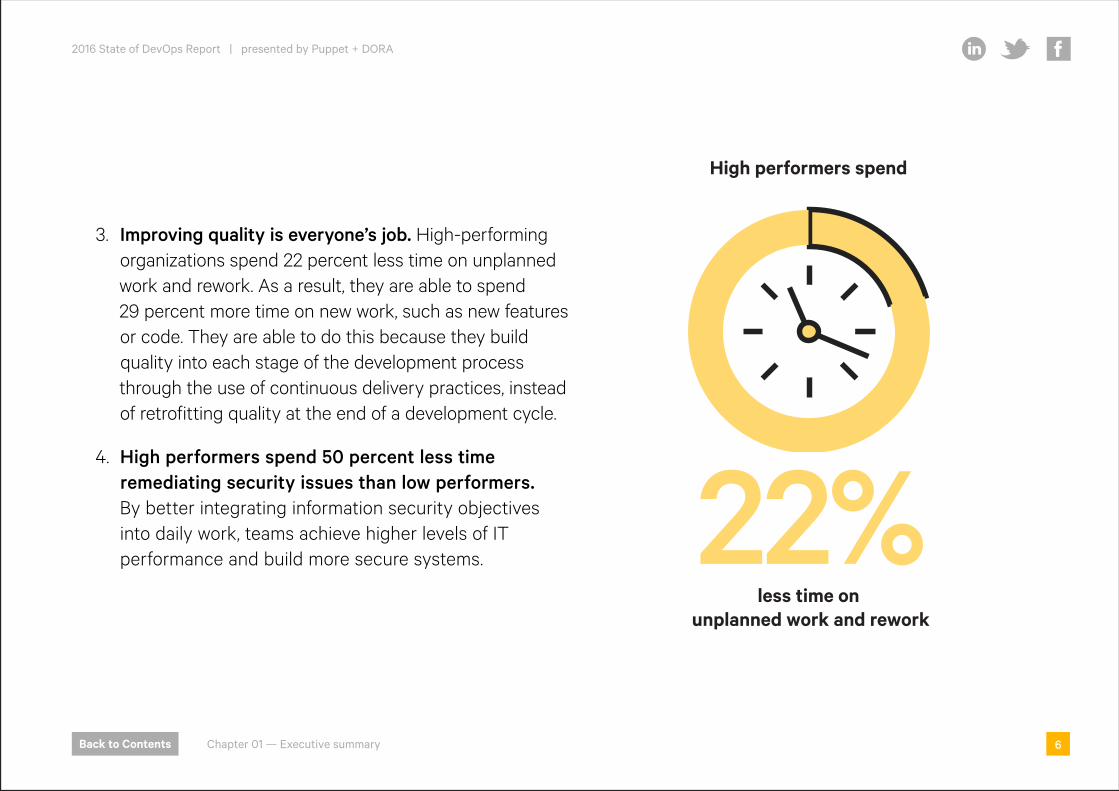
3. Improving quality is everyone’s job. High-performing organizations spend 22 percent less time on unplanned work and rework. As a result, they are able to spend 29 percent more time on new work, such as new features or code. They are able to do this because they build quality into each stage of the development process through the use of continuous delivery practices, instead of retrofitting quality at the end of a development cycle.
4. High performers spend 50 percent less time remediating security issues than low performers. By better integrating information security objectives into daily work, teams achieve higher levels of IT performance and build more secure systems.
less time on unplanned work and rework
High performers spend
22%
2016 State of DevOps Report | presented by Puppet + DORA
Back to Contents
Share:
Chapter 01 — Executive summary 6
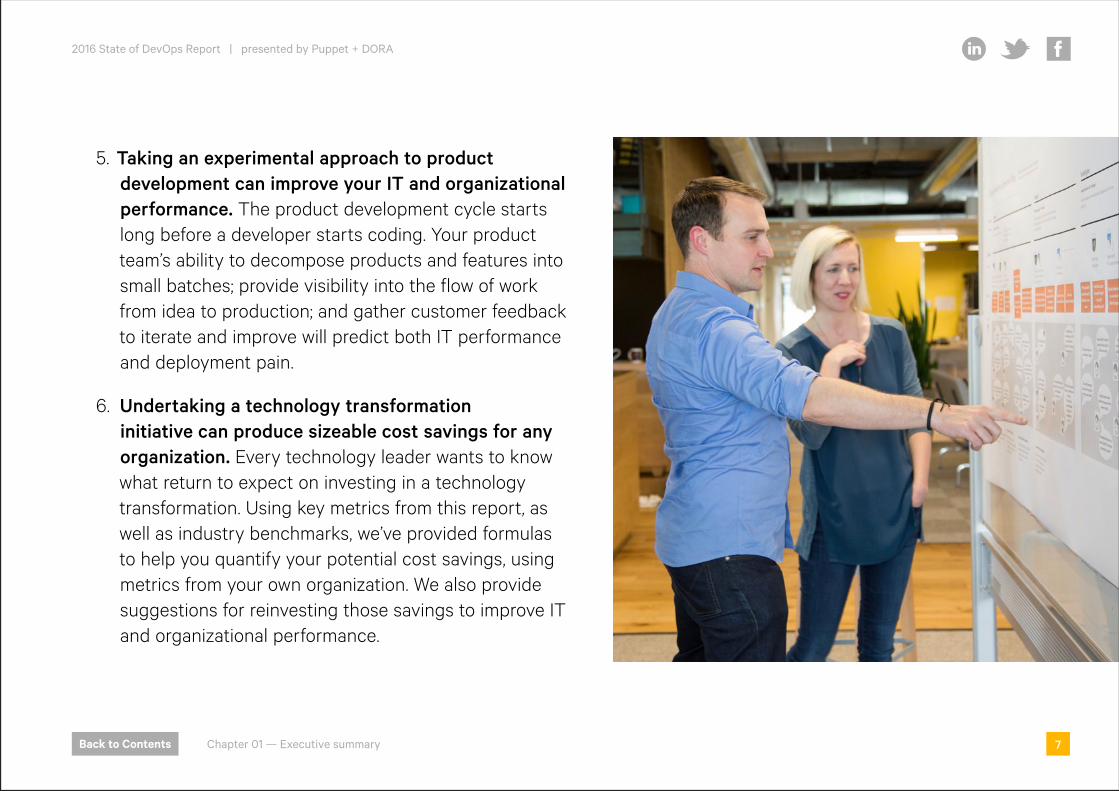
5. Taking an experimental approach to product development can improve your IT and organizational performance. The product development cycle starts long before a developer starts coding. Your product team’s ability to decompose products and features into small batches; provide visibility into the flow of work from idea to production; and gather customer feedback to iterate and improve will predict both IT performance and deployment pain.
6. Undertaking a technology transformation initiative can produce sizeable cost savings for any organization. Every technology leader wants to know what return to expect on investing in a technology transformation. Using key metrics from this report, as well as industry benchmarks, we’ve provided formulas to help you quantify your potential cost savings, using metrics from your own organization. We also provide suggestions for reinvesting those savings to improve IT and organizational performance.
2016 State of DevOps Report | presented by Puppet + DORA
Back to Contents
Share:
Chapter 01 — Executive summary 7
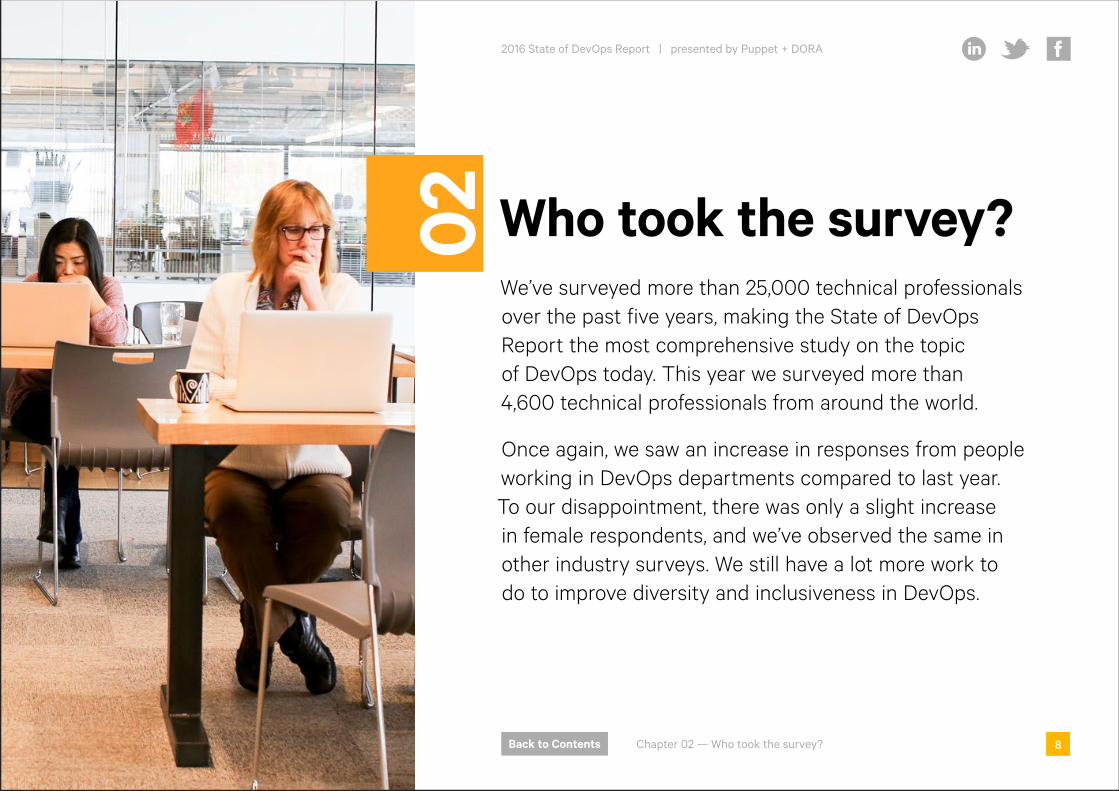
Who took the survey?We’ve surveyed more than 25,000 technical professionals over the past five years, making the State of DevOps Report the most comprehensive study on the topic of DevOps today. This year we surveyed more than 4,600 technical professionals from around the world.
Once again, we saw an increase in responses from people working in DevOps departments compared to last year. To our disappointment, there was only a slight increase in female respondents, and we’ve observed the same in other industry surveys. We still have a lot more work to do to improve diversity and inclusiveness in DevOps.
02
Share:
8
2016 State of DevOps Report | presented by Puppet + DORA
Back to Contents
Share:
8Chapter 02 — Who took the survey?
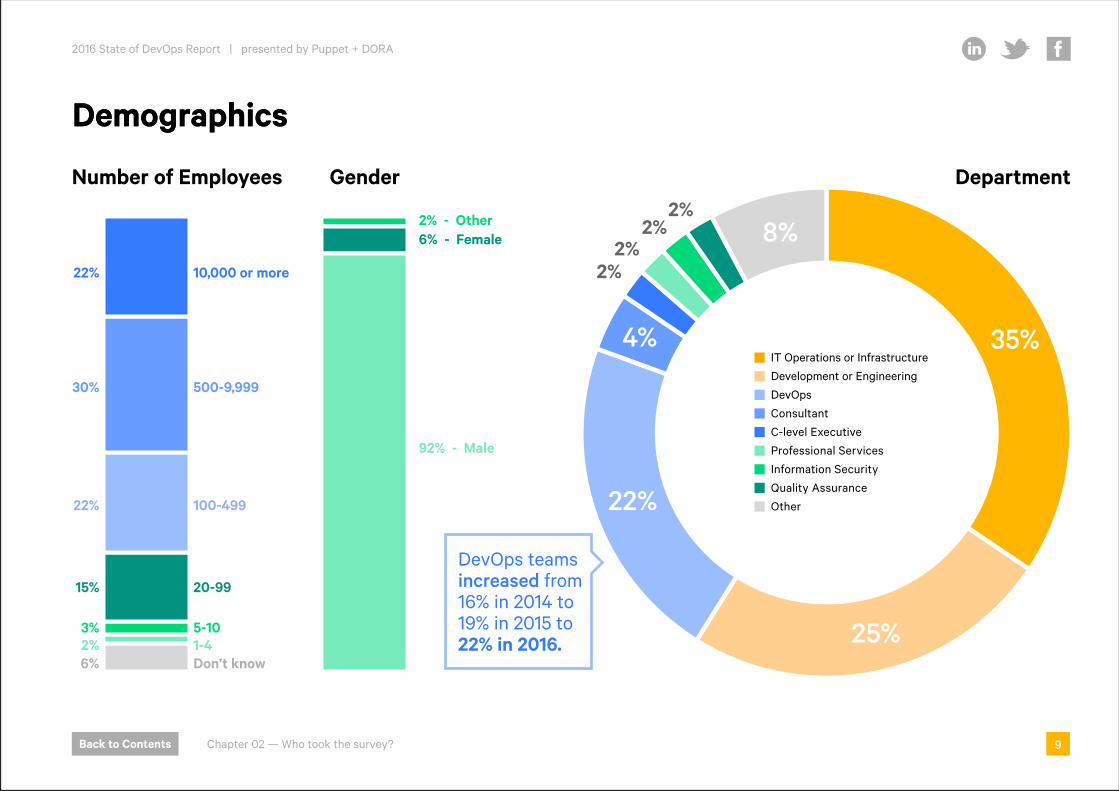
Number of Employees Gender Department2%
2%2%
2%
35%
22%
4%
8%
25%
DevOps teams increased from 16% in 2014 to 19% in 2015 to 22% in 2016.
- 5-10- 1-4
- 20-99
- Don’t know
- 10,000 or more
- 500-9,999
- 100-499
22%
30%
22%
15%
6%2%3%
2% - Other6% - Female
92% - Male
IT Operations or Infrastructure
Development or Engineering
DevOps
Consultant
C-level Executive
Professional Services
Information Security
Quality Assurance
Other
DemographicsDemographics
2016 State of DevOps Report | presented by Puppet + DORA
Back to Contents
Share:
Chapter 02 — Who took the survey? 9
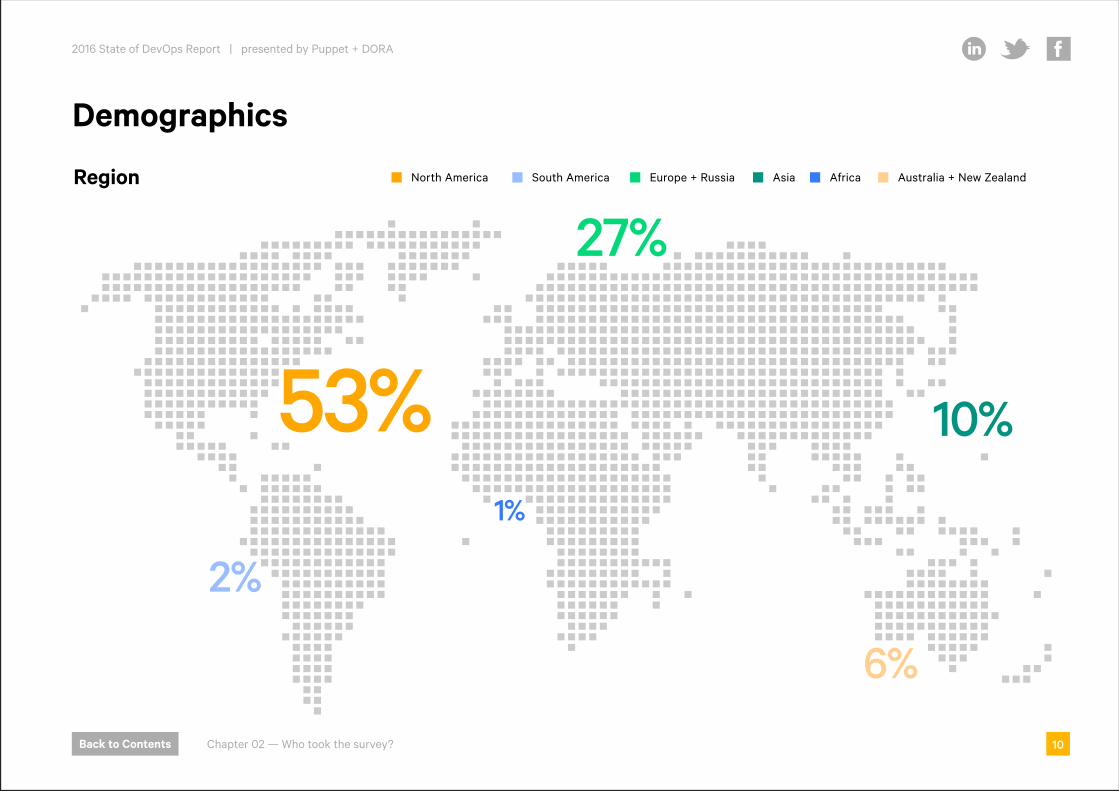
Region North America South America Europe + Russia AfricaAsia Australia + New Zealand
27%
53%
2%
6%
10%
Demographics
1%
2016 State of DevOps Report | presented by Puppet + DORA
Back to Contents
Share:
Chapter 02 — Who took the survey? 10
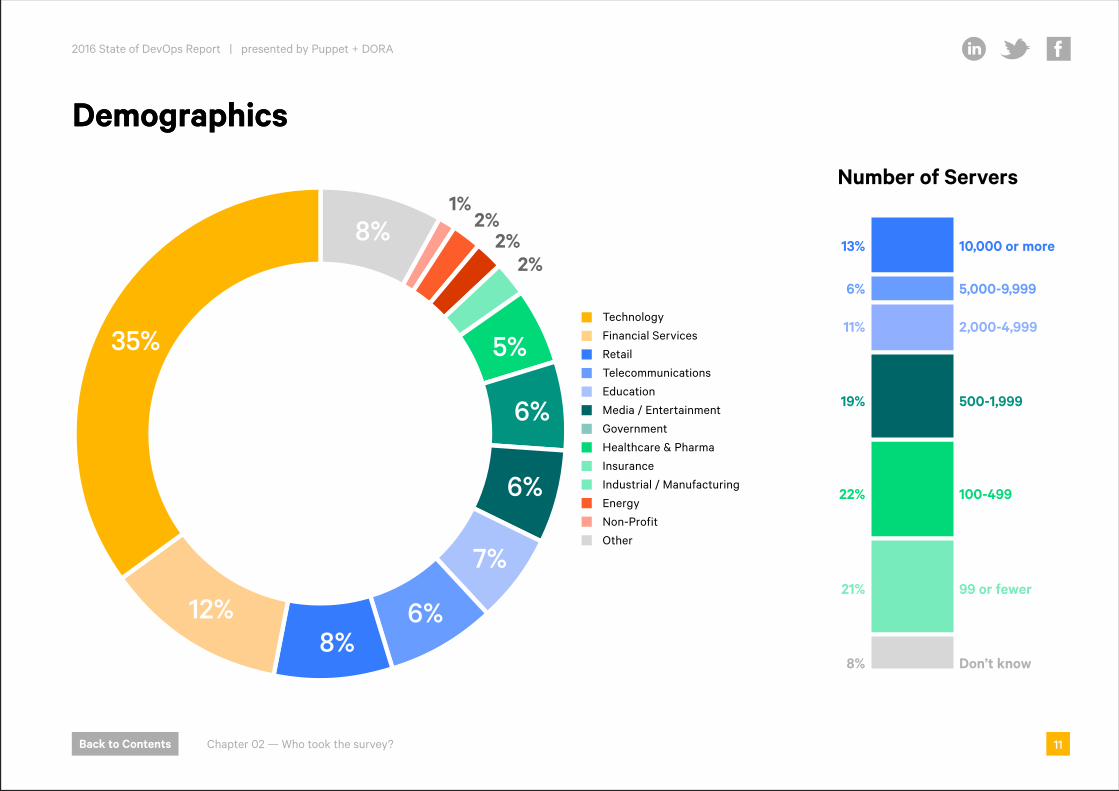
1%2%
2%2%
12%
35%
8%
7%
6%
6%
6%
8%
5%Technology
Financial Services
Retail
Telecommunications
Education
Media / Entertainment
Government
Healthcare & Pharma
Insurance
Industrial / Manufacturing
Energy
Non-Profit
Other
Number of Servers
- 100-499
- 99 or fewer
- 500-1,999
- Don’t know
- 10,000 or more
- 5,000-9,999
- 2,000-4,999
13%
6%
11%
19%
8%
21%
22%
DemographicsDemographics
2016 State of DevOps Report | presented by Puppet + DORA
Back to Contents
Share:
Chapter 02 — Who took the survey? 11
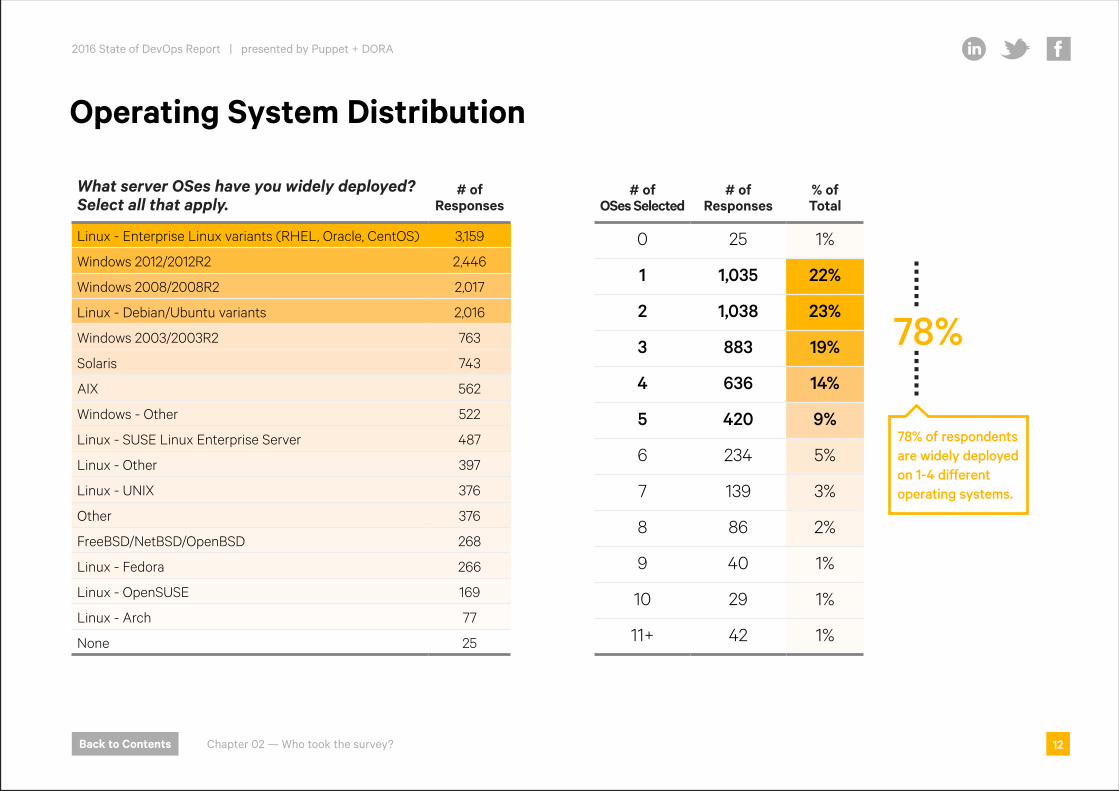
Operating System Distribution
What server OSes have you widely deployed? Select all that apply.
# of Responses
Linux - Enterprise Linux variants (RHEL, Oracle, CentOS) 3,159
Windows 2012/2012R2 2,446
Windows 2008/2008R2 2,017
Linux - Debian/Ubuntu variants 2,016
Windows 2003/2003R2 763
Solaris 743
AIX 562
Windows - Other 522
Linux - SUSE Linux Enterprise Server 487
Linux - Other 397
Linux - UNIX 376
Other 376
FreeBSD/NetBSD/OpenBSD 268
Linux - Fedora 266
Linux - OpenSUSE 169
Linux - Arch 77
None 25
# of OSes Selected
# of Responses
% of Total
0 25 1%
1 1,035 22%
2 1,038 23%
3 883 19%
4 636 14%
5 420 9%
6 234 5%
7 139 3%
8 86 2%
9 40 1%
10 29 1%
11+ 42 1%
78%
78% of respondents are widely deployed on 1-4 different operating systems.
2016 State of DevOps Report | presented by Puppet + DORA
Back to Contents
Share:
Chapter 02 — Who took the survey? 12

IT performance & employee engagementOur analysis shows that high performers are deploying 200 times more frequently than low performers, with 2,555 times faster lead times. They also have the fastest recovery time and the lowest change failure rate. This year, we also looked at employee engagement, as measured by employee Net Promoter Score (eNPS). We found that high performers had a higher proportion of promoters than low performers. This makes sense: It’s the most engaged employees who recommend their workplace to friends, and it’s high-performing workplaces that foster the most employee engagement.
03
Share:
13
2016 State of DevOps Report | presented by Puppet + DORA
Back to Contents
Share:
13Chapter 03 — IT performance & employee engagement
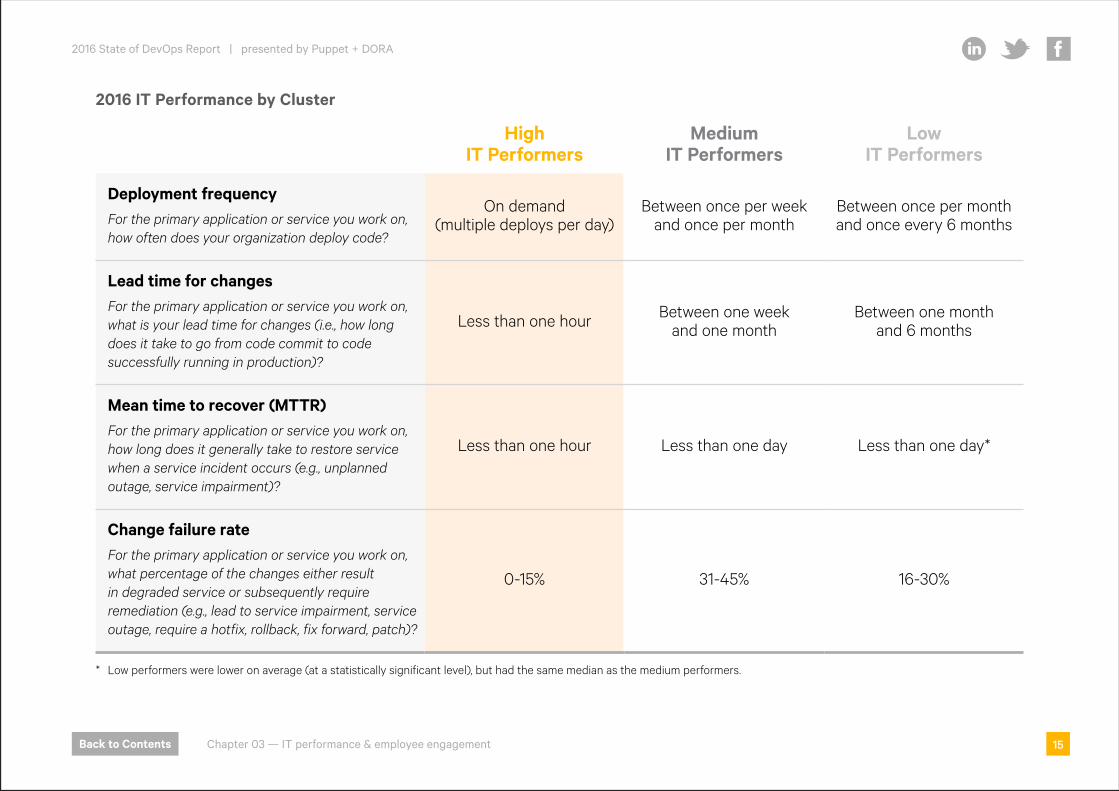
Over the past four years, we’ve found that high-performing IT teams have higher throughput and better stability than other IT teams. In 2016, we found the high performers had:
• 200 times more frequent code deployments• 2,555 times faster lead times• 24 times faster mean time to recover• 3 times lower change failure rate
The table on the following page illustrates the differences between high, medium and low performers for each IT performance measure.
share
2016 State of DevOps Report | presented by Puppet + DORA
Back to Contents
Share:
Chapter 03 — IT performance & employee engagement 14
2016 IT Performance by Cluster
High IT Performers
Medium IT Performers
Low IT Performers
Deployment frequencyFor the primary application or service you work on, how often does your organization deploy code?
On demand (multiple deploys per day)
Between once per week and once per month
Between once per month and once every 6 months
Lead time for changesFor the primary application or service you work on, what is your lead time for changes (i.e., how long does it take to go from code commit to code successfully running in production)?
Less than one hour Between one week and one month
Between one month and 6 months
Mean time to recover (MTTR)For the primary application or service you work on, how long does it generally take to restore service when a service incident occurs (e.g., unplanned outage, service impairment)?
Less than one hour Less than one day Less than one day*
Change failure rateFor the primary application or service you work on, what percentage of the changes either result in degraded service or subsequently require remediation (e.g., lead to service impairment, service outage, require a hotfix, rollback, fix forward, patch)?
0-15% 31-45% 16-30%
* Low performers were lower on average (at a statistically significant level), but had the same median as the medium performers.
2016 State of DevOps Report | presented by Puppet + DORA
Back to Contents
Share:
Chapter 03 — IT performance & employee engagement 15
ThroughputDeployment frequency
This year, high performers reported that they are routinely deploying on demand, performing multiple deployments per day. Low performers, by comparison, reported deploying between once per month and once every six months. We normalized these ranges to 1,460 deploys per year (four deploys per day x 365 days) for high performers and seven deploys per year for low performers (average of two deploys and 12 deploys). These figures show that high performers deploy code 200 times more frequently than their low-performing peers. It’s worth noting that four deploys per day is conservative with respect to companies like Etsy, which reports deploying 80 times per day, or to companies like Amazon and Netflix that deploy thousands of times per day.
Change lead time
Similarly, high performers reported that their lead time required to deploy changes into production (i.e., go from code committed to code deployed and running successfully in production) was less than one hour, whereas low performers required lead times between one to six months. So the high performers had 2,555 times faster change lead times than low performers. For our calculations, we used lead times of 60 minutes for high performers, and 3.5 months for low performers (the average of one and six months).
2016 State of DevOps Report | presented by Puppet + DORA
Back to Contents
Share:
Chapter 03 — IT performance & employee engagement 16
StabilityMean time to recover (MTTR)
High performers reported that their MTTR was less than one hour, while low performers reported less than one day. In other words, high performers had 24 times faster MTTR than low performers. For this calculation, we chose conservative time ranges: one hour for high performers, and one day for low performers.
Change failure rate
High performers reported a change failure rate between zero and 15 percent, while low performers reported change failure rates of 16-30 percent. We took the average of these two ranges (7.5 percent for high performers and 23 percent for low performers), and calculated that high performers have three times lower change failure rates compared to low performers.
2016 State of DevOps Report | presented by Puppet + DORA
Back to Contents
Share:
Chapter 03 — IT performance & employee engagement 17
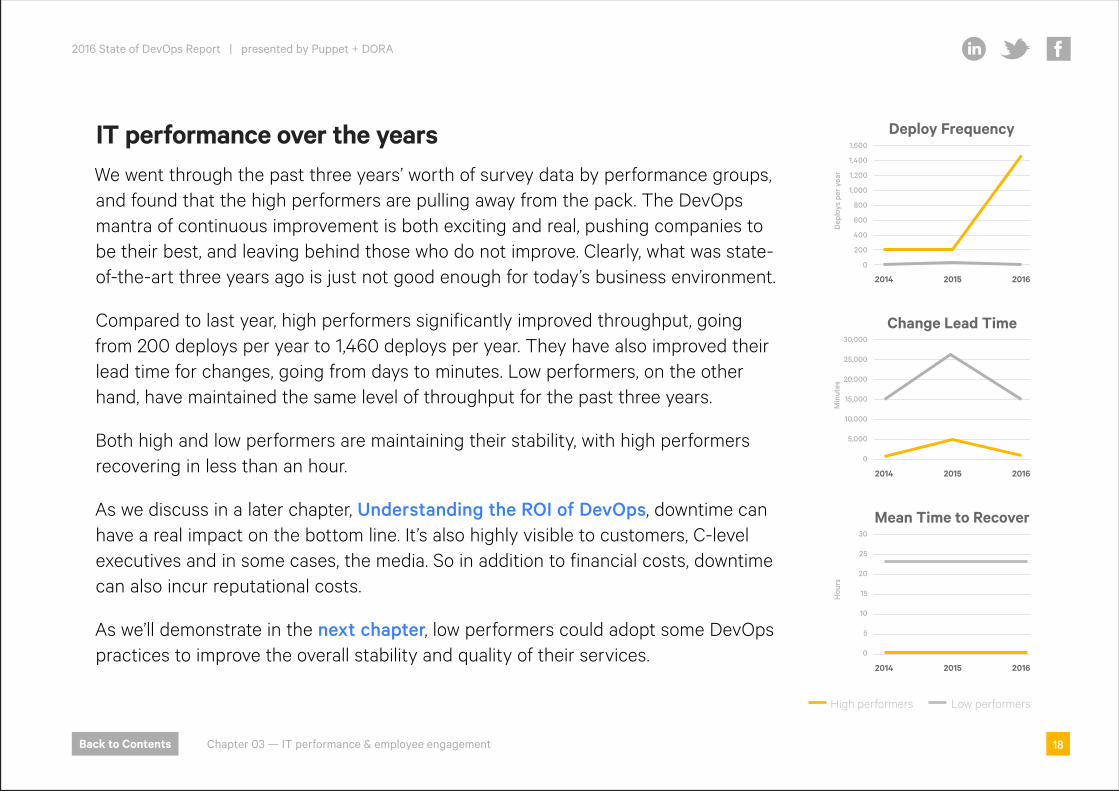
IT performance over the yearsWe went through the past three years’ worth of survey data by performance groups, and found that the high performers are pulling away from the pack. The DevOps mantra of continuous improvement is both exciting and real, pushing companies to be their best, and leaving behind those who do not improve. Clearly, what was state-of-the-art three years ago is just not good enough for today’s business environment.
Compared to last year, high performers significantly improved throughput, going from 200 deploys per year to 1,460 deploys per year. They have also improved their lead time for changes, going from days to minutes. Low performers, on the other hand, have maintained the same level of throughput for the past three years.
Both high and low performers are maintaining their stability, with high performers recovering in less than an hour.
As we discuss in a later chapter, Understanding the ROI of DevOps, downtime can have a real impact on the bottom line. It’s also highly visible to customers, C-level executives and in some cases, the media. So in addition to financial costs, downtime can also incur reputational costs.
As we’ll demonstrate in the next chapter, low performers could adopt some DevOps practices to improve the overall stability and quality of their services.
High performers Low performers
Min
utes
Change Lead Time
0
5,000
10,000
15,000
20,000
25,000
30,000
2014 2015 2016
Mean Time to Recover
Hou
rs
0
5
10
15
20
25
30
2014 2015 2016
Dep
loys
per
yea
r
0
200
400
600
800
1,000
1,200
1,400
1,600
Deploy Frequency
2014 2015 2016
2016 State of DevOps Report | presented by Puppet + DORA
Back to Contents
Share:
Chapter 03 — IT performance & employee engagement 18
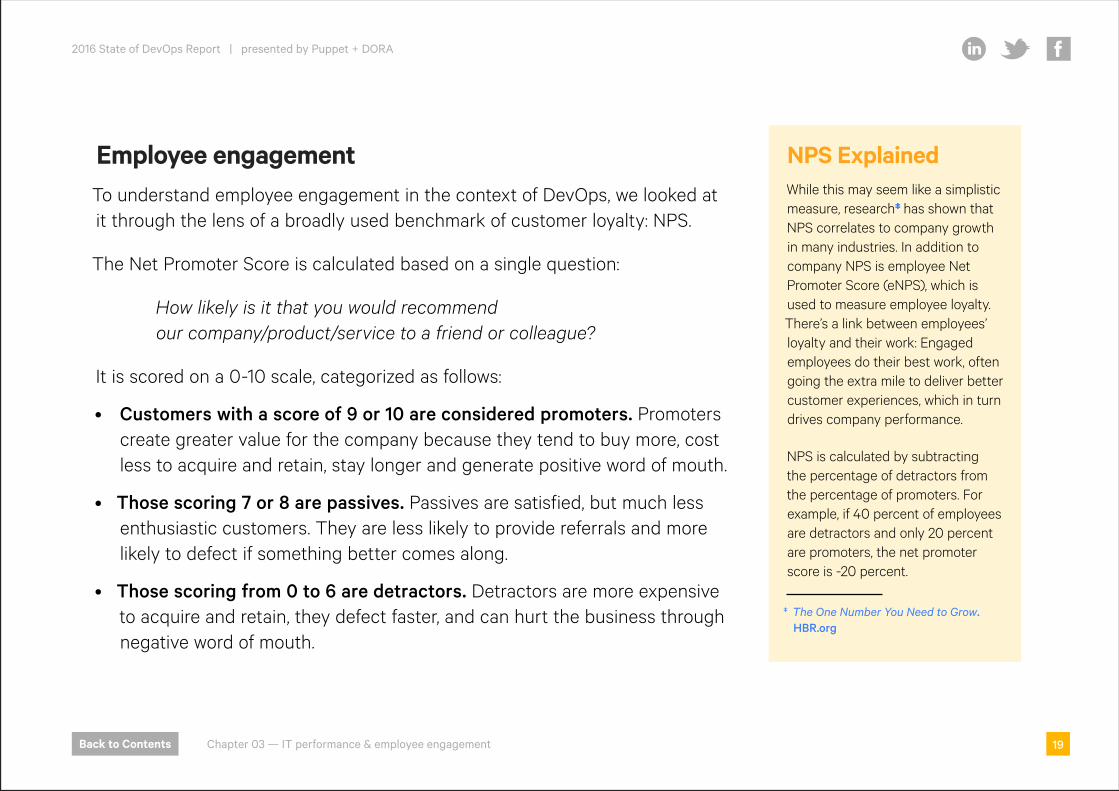
Employee engagementTo understand employee engagement in the context of DevOps, we looked at it through the lens of a broadly used benchmark of customer loyalty: NPS.
The Net Promoter Score is calculated based on a single question:
How likely is it that you would recommend our company/product/service to a friend or colleague?
It is scored on a 0-10 scale, categorized as follows:
• Customers with a score of 9 or 10 are considered promoters. Promoters create greater value for the company because they tend to buy more, cost less to acquire and retain, stay longer and generate positive word of mouth.
• Those scoring 7 or 8 are passives. Passives are satisfied, but much less enthusiastic customers. They are less likely to provide referrals and more likely to defect if something better comes along.
• Those scoring from 0 to 6 are detractors. Detractors are more expensive to acquire and retain, they defect faster, and can hurt the business through negative word of mouth.
NPS ExplainedWhile this may seem like a simplistic measure, research‡ has shown that NPS correlates to company growth in many industries. In addition to company NPS is employee Net Promoter Score (eNPS), which is used to measure employee loyalty. There’s a link between employees’ loyalty and their work: Engaged employees do their best work, often going the extra mile to deliver better customer experiences, which in turn drives company performance.
NPS is calculated by subtracting the percentage of detractors from the percentage of promoters. For example, if 40 percent of employees are detractors and only 20 percent are promoters, the net promoter score is -20 percent.
‡ The One Number You Need to Grow. HBR.org
2016 State of DevOps Report | presented by Puppet + DORA
Back to Contents
Share:
Chapter 03 — IT performance & employee engagement 19

We asked two questions:
Would you recommend your ORGANIZATION as a place to work to a friend or colleague?
Would you recommend your TEAM as a place to work to a friend or colleague?
We compared the proportion of promoters (those who scored 9 or 10) in the high-performing cluster against the proportion of promoters in the low-performing cluster. We found that employees in high-performing teams were 2.2 times more likely to recommend their organization to a friend as a great place to work, and 1.8 times more likely to recommend their team to a friend as a great working environment.
This is a significant finding, as research has shown “companies with highly engaged workers grew revenues two and a half times as much as those with low engagement levels. And [publicly traded] stocks of companies with a high-trust work environment outperformed market indexes by a factor of three from 1997 through 2011.”1
1 http://www.bain.com/publications/articles/the-chemistry-of-enthusiasm.aspx
Employees in high-performing teams were 2.2 times more likely to recommend their organization as a great place to work.
2.2x
2016 State of DevOps Report | presented by Puppet + DORA
Back to Contents
Share:
Chapter 03 — IT performance & employee engagement 20
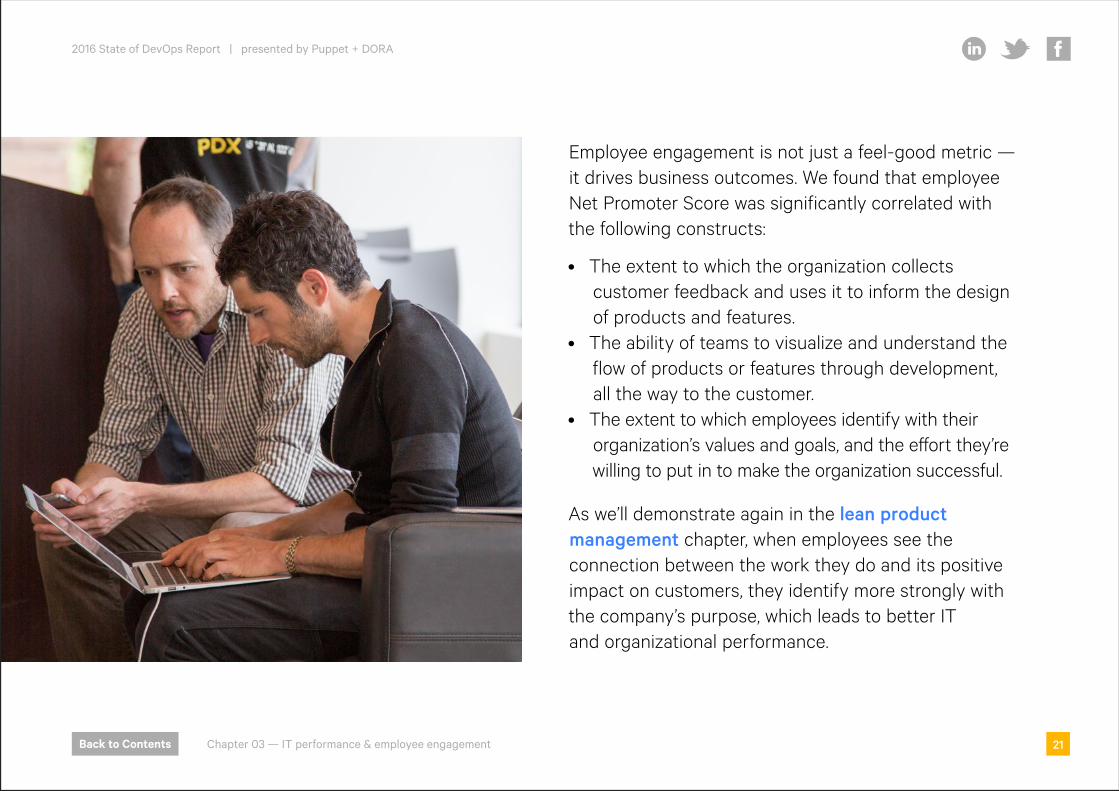
Employee engagement is not just a feel-good metric — it drives business outcomes. We found that employee Net Promoter Score was significantly correlated with the following constructs:
• The extent to which the organization collects customer feedback and uses it to inform the design of products and features.
• The ability of teams to visualize and understand the flow of products or features through development, all the way to the customer.
• The extent to which employees identify with their organization’s values and goals, and the effort they’re willing to put in to make the organization successful.
As we’ll demonstrate again in the lean product management chapter, when employees see the connection between the work they do and its positive impact on customers, they identify more strongly with the company’s purpose, which leads to better IT and organizational performance.
2016 State of DevOps Report | presented by Puppet + DORA
Back to Contents
Share:
Chapter 03 — IT performance & employee engagement 21
04 Building quality inThe more we work with organizations as they progress through their DevOps journeys, the more we hear the same theme: Quality and security are everyone’s responsibility. We wanted to confirm that continuous delivery practices made a difference to the quality of the products being built. We also wanted to see if integrating security throughout the software development cycle yields better outcomes.
We found that by building quality and security into the software development cycle, high performers spend less time on unplanned work. We also found that they spend less time remediating security issues, and spend more time on new, value-adding work.
Share:
22
2016 State of DevOps Report | presented by Puppet + DORA
Back to Contents
Share:
22Chapter 04 — Building quality in
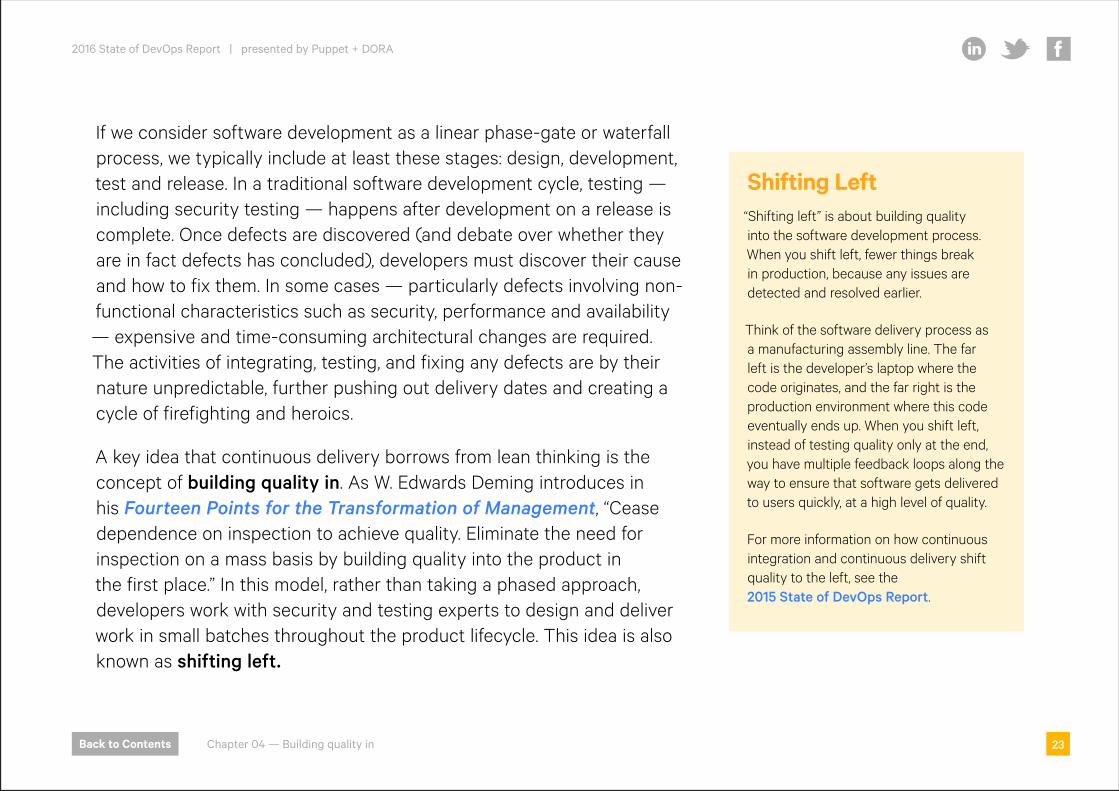
If we consider software development as a linear phase-gate or waterfall process, we typically include at least these stages: design, development, test and release. In a traditional software development cycle, testing — including security testing — happens after development on a release is complete. Once defects are discovered (and debate over whether they are in fact defects has concluded), developers must discover their cause and how to fix them. In some cases — particularly defects involving non-functional characteristics such as security, performance and availability — expensive and time-consuming architectural changes are required. The activities of integrating, testing, and fixing any defects are by their nature unpredictable, further pushing out delivery dates and creating a cycle of firefighting and heroics.
A key idea that continuous delivery borrows from lean thinking is the concept of building quality in. As W. Edwards Deming introduces in his Fourteen Points for the Transformation of Management, “Cease dependence on inspection to achieve quality. Eliminate the need for inspection on a mass basis by building quality into the product in the first place.” In this model, rather than taking a phased approach, developers work with security and testing experts to design and deliver work in small batches throughout the product lifecycle. This idea is also known as shifting left.
Shifting Left“Shifting left” is about building quality into the software development process. When you shift left, fewer things break in production, because any issues are detected and resolved earlier.
Think of the software delivery process as a manufacturing assembly line. The far left is the developer’s laptop where the code originates, and the far right is the production environment where this code eventually ends up. When you shift left, instead of testing quality only at the end, you have multiple feedback loops along the way to ensure that software gets delivered to users quickly, at a high level of quality.
For more information on how continuous integration and continuous delivery shift quality to the left, see the 2015 State of DevOps Report.
2016 State of DevOps Report | presented by Puppet + DORA
Back to Contents
Share:
Chapter 04 — Building quality in 23
In last year’s study, our analysis showed that the use of continuous delivery practices — deployment automation and continuous integration and testing, combined with version control for all production artifacts — predicted lower levels of deployment pain, higher IT performance, and lower change failure rates.
This year we had several additional ideas we wanted to validate. First, we wanted to understand the impact of continuous delivery on software quality. Second, we wanted to see if we could extend our definition of continuous delivery to include both effective test data management and the use of integrated security testing. Finally, since trunk-based development — the practice of working off master in version control rather than having developers work in feature branches — is still controversial, we wanted to further validate this practice.
2016 State of DevOps Report | presented by Puppet + DORA
Back to Contents
Share:
Chapter 04 — Building quality in 24
Unplanned work as a proxy for qualitySoftware quality is notoriously hard to measure. This is mainly because it is highly subjective and highly contextual. As software quality expert Jerry Weinberg asserts, “quality is value to some person.”2
One way we can measure the extent to which teams are doing a good job of building quality in is the amount of time they spend on unplanned work. In The Visible Ops Handbook, unplanned work is described as the difference between “paying attention to the low fuel warning light on an automobile versus running out of gas on the highway.” In the first case, the organization can fix the problem in a planned manner, without much urgency or disruption to other scheduled work. In the second case, the organization must fix the problem in a highly urgent manner, often requiring all hands on deck — for example, having six engineers drop everything and run down the highway with full gas cans to refuel the stranded truck.
2 Weinberg, G. Quality Software Management: Volume 1, Systems Thinking. Dorset House, 1992.
2016 State of DevOps Report | presented by Puppet + DORA
Back to Contents
Share:
Chapter 04 — Building quality in 25

Similarly, John Seddon, creator of the Vanguard Method, emphasizes the importance of reducing what he calls failure demand — demand for work caused by the failure to do the right thing the first time — by improving the quality of service we provide. This is one of the key goals of continuous delivery, with its focus on working on small batches with continuous in-process testing.
Unplanned work includes any break/fix work, emergency software deployments and patches, responding to urgent audit documentation requests, and so forth. We asked people about the percentage of time they spent both on rework and unplanned work, and on new work such as designing and building new features.
High performers reported spending 49 percent of their time on new work and 21 percent on unplanned work or rework. By contrast, low performers spend 38 percent of their time on new work and 27 percent on unplanned work or rework. Thus, high performers spend 29 percent more time on new work than low performers, and 22 percent less time on unplanned work and rework. Furthermore, continuous delivery predicts lower levels of unplanned work and rework in a statistically significant way.
New work vs. unplanned work
New work
Unplanned work or rework
Low performersHigh performers
21%
49%
38%
27%
Other work (meetings, routine maintenance, etc.)
35%30% 35%30%
2016 State of DevOps Report | presented by Puppet + DORA
Back to Contents
Share:
Chapter 04 — Building quality in 26
Integrating securityAll too often, we tack on security testing at the end of the delivery process. This typically means we discover significant problems — including architectural flaws — that are very expensive and painful to fix once development is complete, and which could have been avoided altogether if security experts had worked with delivery teams throughout the delivery process.
Instead of testing for security concerns at the end of the process, we believe we can achieve better outcomes by making security a part of everyone’s daily work. That means integrating security testing and controls into the daily work of Development, QA and Operations. Ideally, all this work will be automated and put into our deployment pipeline. By automating these activities, we can generate evidence on demand to demonstrate that our controls are operating effectively, whether to auditors, assessors, or anyone else working in our value stream.
2016 State of DevOps Report | presented by Puppet + DORA
Back to Contents
Share:
Chapter 04 — Building quality in 27
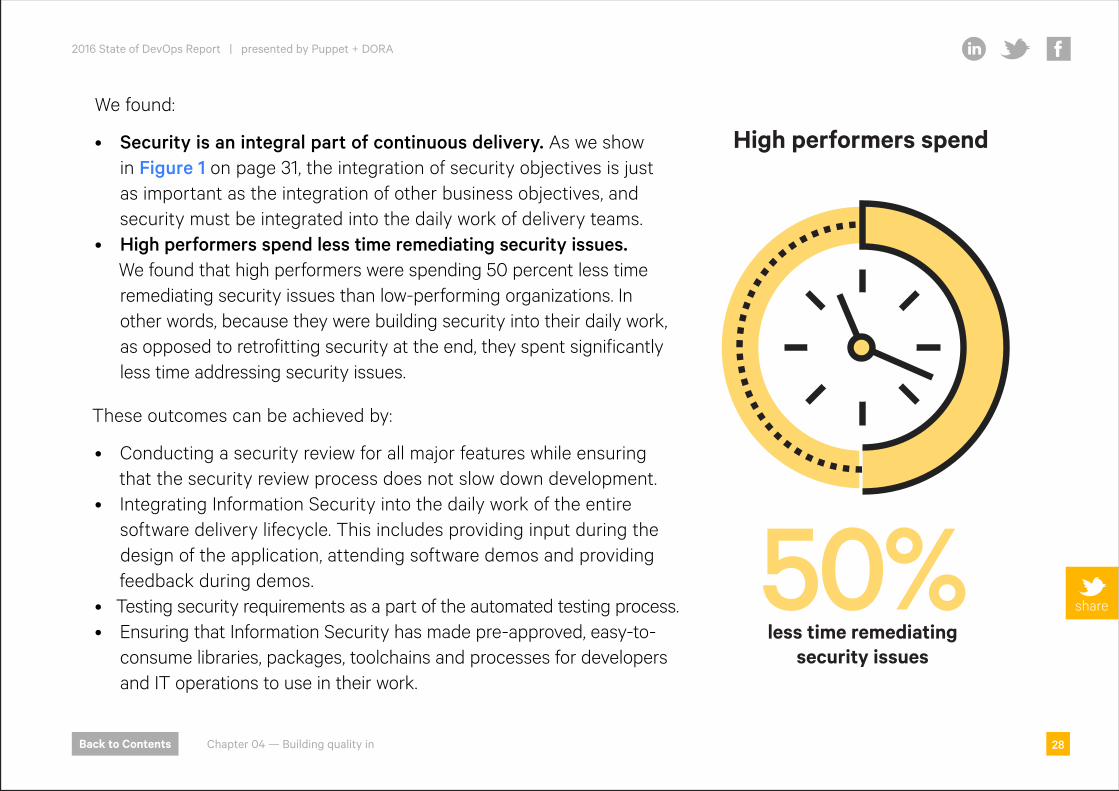
We found:
• Security is an integral part of continuous delivery. As we show in Figure 1 on page 31, the integration of security objectives is just as important as the integration of other business objectives, and security must be integrated into the daily work of delivery teams.
• High performers spend less time remediating security issues. We found that high performers were spending 50 percent less time remediating security issues than low-performing organizations. In other words, because they were building security into their daily work, as opposed to retrofitting security at the end, they spent significantly less time addressing security issues.
These outcomes can be achieved by:
• Conducting a security review for all major features while ensuring that the security review process does not slow down development.
• Integrating Information Security into the daily work of the entire software delivery lifecycle. This includes providing input during the design of the application, attending software demos and providing feedback during demos.
• Testing security requirements as a part of the automated testing process.• Ensuring that Information Security has made pre-approved, easy-to-
consume libraries, packages, toolchains and processes for developers and IT operations to use in their work.
less time remediating security issues
50%
High performers spend
share
2016 State of DevOps Report | presented by Puppet + DORA
Back to Contents
Share:
Chapter 04 — Building quality in 28
The importance of effective test data managementIn order to build maintainable test suites, it’s essential to have an effective strategy for creating and maintaining data sets for these tests. Anecdotally, many teams have said that managing test data is a major source of pain. We wanted to see if effective test data management led to better IT performance. Our hypothesis was that good hygiene around test data was a component of continuous delivery, and our analysis confirms this.
Our findings show that when teams have adequate test data to run automated tests, and can create that data on demand, they see better IT performance, lower change failure rates, and lower levels of deployment pain and rework.
One word of caution: Test data requires careful maintenance. Always try to minimize the amount of test data you require in order to run your automated tests, and avoid large database dumps wherever possible. Instead, start from a blank slate, and set up the correct state for your tests programmatically through the application’s API.
2016 State of DevOps Report | presented by Puppet + DORA
Back to Contents
Share:
Chapter 04 — Building quality in 29
Continuous integration redux
The idea that developers should work in small batches off master or trunk rather than on long-lived feature branches is still one of the most controversial ideas in the Agile canon, despite the fact it is the norm in high-performing organizations such as Google.3 Indeed, many practitioners express surprise that this practice is in fact implied by continuous integration, but it is: The clue is in the word “integration.”
Nevertheless, many teams, inspired by GitHub’s recommended workflow, routinely work in branches or forks.4 This year we extended our investigation to study how organizations can combine this kind of development with continuous integration.
3 http://everythingsysadmin.com/2014/03/yes-you-really-can-work-from-head.html4 https://guides.github.com/introduction/flow/
2016 State of DevOps Report | presented by Puppet + DORA
Back to Contents
Share:
Chapter 04 — Building quality in 30

We found that having branches or forks with very short lifetimes (less than a day) before being merged into trunk, and less than three active branches in total, are important aspects of continuous delivery, and all contribute to higher performance. So does merging code into trunk or master on a daily basis. Teams that don’t have code freeze periods (when people can’t merge code or pull requests) also achieve higher performance.
Overall, the technical practices that we found to be significant this year, along with their impact on culture and performance, are shown below in Figure 1. Findings that are new this year are shown in bold.
Lower change fail rates
Comprehensive, fast and reliable test and deployment automation
Trunk-based development and continuous integration
Effective test data management
Together, the factors on the left model
continuous delivery, which leads to...
Application code and app & system configuration all in version control
Incorporating security (and security teams) into the delivery process
Lower levels of deployment pain
Less rework
Higher levels of org performance
(productivity, market share, profitability)
Identifying strongly with the organization you work for
Higher levels of IT performance (higher throughput and stability)
Generative, performance-oriented culture (per Westrum’s model)
Figure 1
2016 State of DevOps Report | presented by Puppet + DORA
Back to Contents
Share:
Chapter 04 — Building quality in 31
05
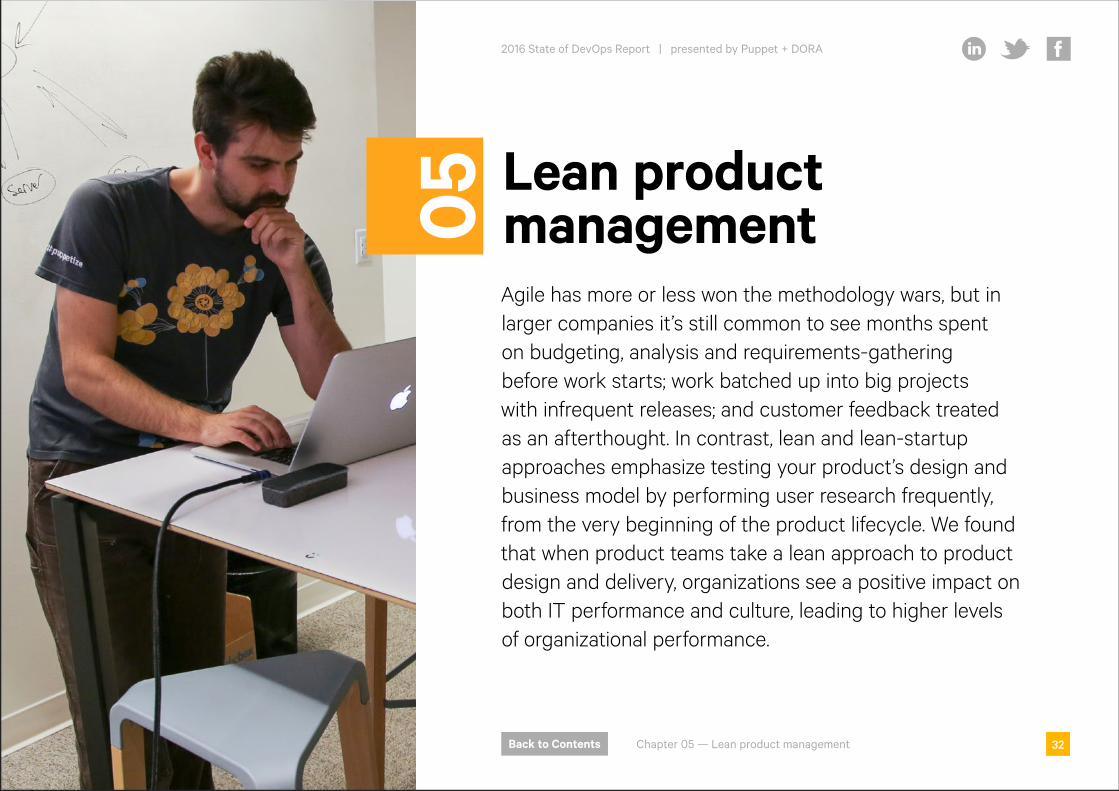
Lean product managementAgile has more or less won the methodology wars, but in larger companies it’s still common to see months spent on budgeting, analysis and requirements-gathering before work starts; work batched up into big projects with infrequent releases; and customer feedback treated as an afterthought. In contrast, lean and lean-startup approaches emphasize testing your product’s design and business model by performing user research frequently, from the very beginning of the product lifecycle. We found that when product teams take a lean approach to product design and delivery, organizations see a positive impact on both IT performance and culture, leading to higher levels of organizational performance.
Share:
32
2016 State of DevOps Report | presented by Puppet + DORA
Back to Contents
Share:
32Chapter 05 — Lean product management
In previous years, the State of DevOps Report has focused on the product development value stream, from writing code to operating systems in production. This year, we decided to take a look upstream and see how approaches to product development impact IT performance and organizational culture. In particular, we wanted to see if the ideas popularized by the lean and lean-startup movements have a measurable impact on these important outcomes.
In last year’s survey, we showed that the use of lean management practices such as limiting work in process (WIP) and the use of information radiators leads to higher IT performance and lower levels of burnout. These practices also predict a generative, performance-oriented culture, as described by Ron Westrum in his Typology of Organizational Cultures.
Lean and Lean Startup: A PrimerThe lean movement derives from Toyota’s approach to manufacturing, originally designed to solve the problem of creating a wide variety of different types of cars for the relatively small Japanese market. Toyota’s commitment to relentless improvement enabled the company to build cars faster, cheaper, and with higher quality than the competition. Companies such as Toyota and Honda cut deeply into the U.S. auto manufacturing industry, which survived only by adopting their ideas and methods. The lean philosophy was adapted for software development by Mary and Tom Poppendieck in their Lean Software Development book series. You can find out more about Toyota and lean in Episode 561 of This American Life.
The Lean Startup by Eric Ries describes an approach to building products in conditions of great uncertainty. Ries’ work is a synthesis of lean ideas and the work of entrepreneur Steven Blank, which emphasizes the importance of taking an experimental approach to product development. This approach includes building and validating prototypes from the beginning; working in small batches; and evolving or “pivoting” products and the business models behind them early and often, based on user research.
2016 State of DevOps Report | presented by Puppet + DORA
Back to Contents
Share:
Chapter 05 — Lean product management 33
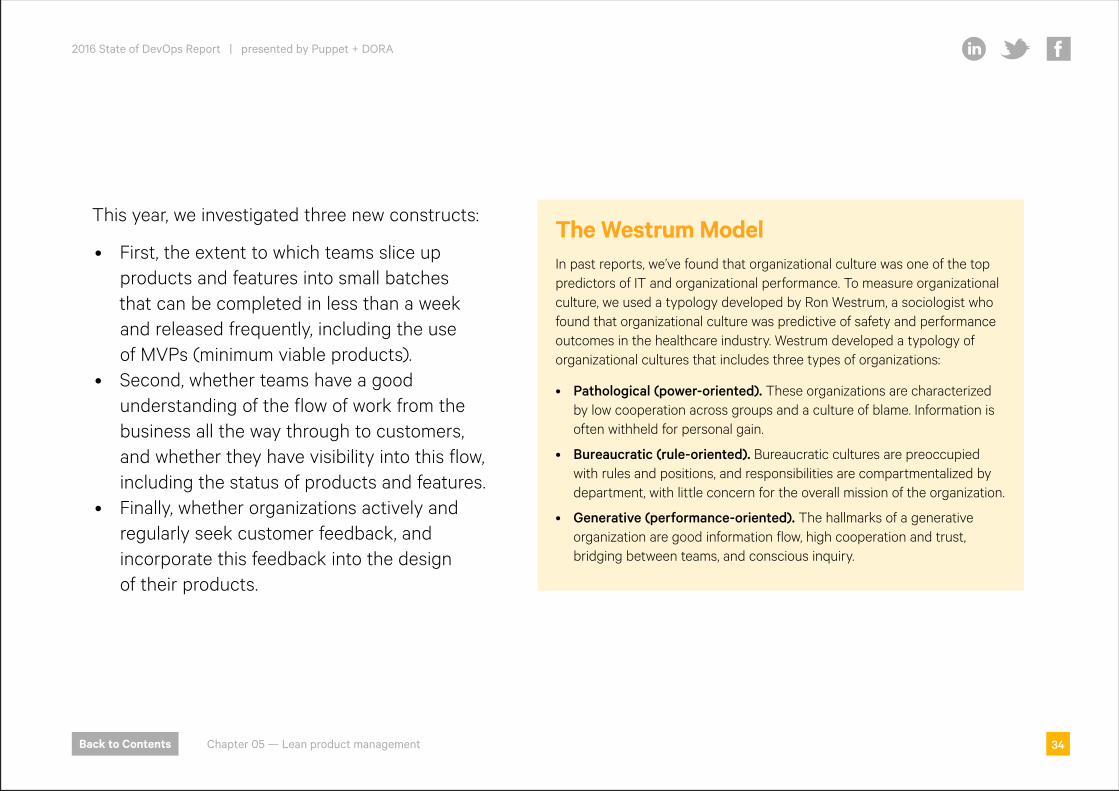
This year, we investigated three new constructs:
• First, the extent to which teams slice up products and features into small batches that can be completed in less than a week and released frequently, including the use of MVPs (minimum viable products).
• Second, whether teams have a good understanding of the flow of work from the business all the way through to customers, and whether they have visibility into this flow, including the status of products and features.
• Finally, whether organizations actively and regularly seek customer feedback, and incorporate this feedback into the design of their products.
The Westrum ModelIn past reports, we’ve found that organizational culture was one of the top predictors of IT and organizational performance. To measure organizational culture, we used a typology developed by Ron Westrum, a sociologist who found that organizational culture was predictive of safety and performance outcomes in the healthcare industry. Westrum developed a typology of organizational cultures that includes three types of organizations:
• Pathological (power-oriented). These organizations are characterized by low cooperation across groups and a culture of blame. Information is often withheld for personal gain.
• Bureaucratic (rule-oriented). Bureaucratic cultures are preoccupied with rules and positions, and responsibilities are compartmentalized by department, with little concern for the overall mission of the organization.
• Generative (performance-oriented). The hallmarks of a generative organization are good information flow, high cooperation and trust, bridging between teams, and conscious inquiry.
2016 State of DevOps Report | presented by Puppet + DORA
Back to Contents
Share:
Chapter 05 — Lean product management 34
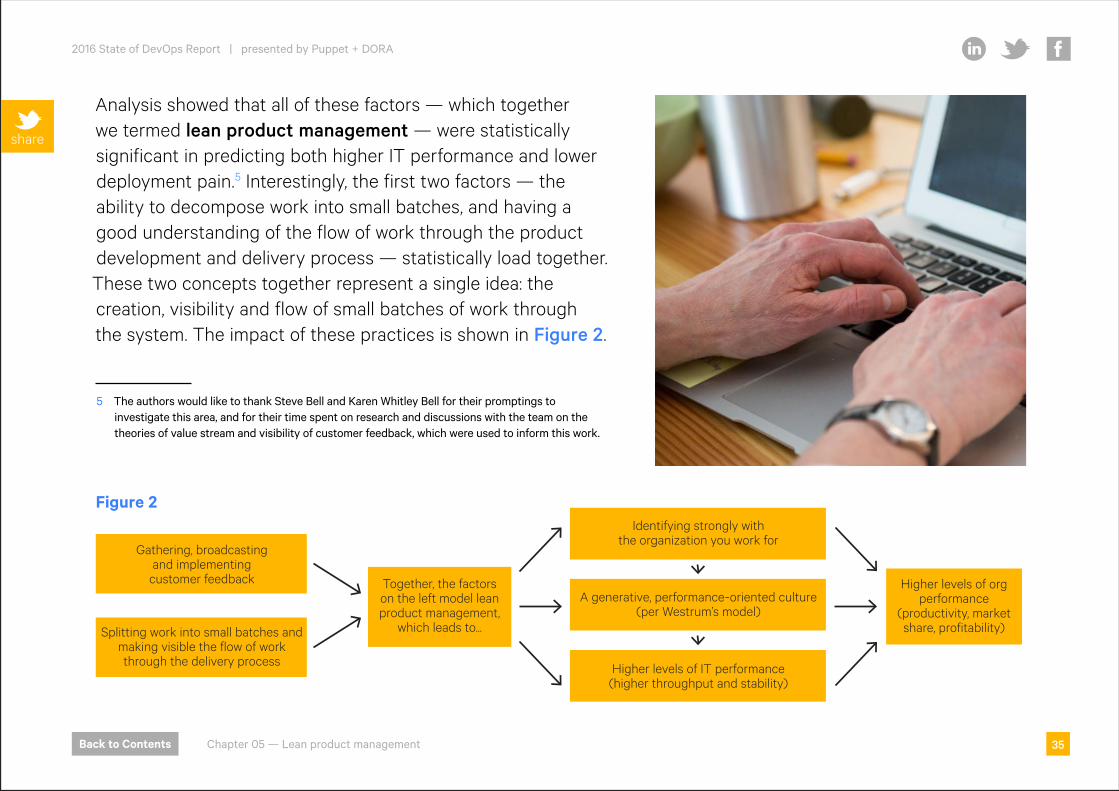
Analysis showed that all of these factors — which together we termed lean product management — were statistically significant in predicting both higher IT performance and lower deployment pain.5 Interestingly, the first two factors — the ability to decompose work into small batches, and having a good understanding of the flow of work through the product development and delivery process — statistically load together. These two concepts together represent a single idea: the creation, visibility and flow of small batches of work through the system. The impact of these practices is shown in Figure 2.
5 The authors would like to thank Steve Bell and Karen Whitley Bell for their promptings to investigate this area, and for their time spent on research and discussions with the team on the theories of value stream and visibility of customer feedback, which were used to inform this work.
Together, the factors on the left model lean product management,
which leads to...
Higher levels of org performance
(productivity, market share, profitability)
Gathering, broadcasting and implementing
customer feedback
Splitting work into small batches and making visible the flow of work through the delivery process
Identifying strongly with the organization you work for
A generative, performance-oriented culture(per Westrum’s model)
Higher levels of IT performance(higher throughput and stability)
Figure 2
share
2016 State of DevOps Report | presented by Puppet + DORA
Back to Contents
Share:
Chapter 05 — Lean product management 35
06
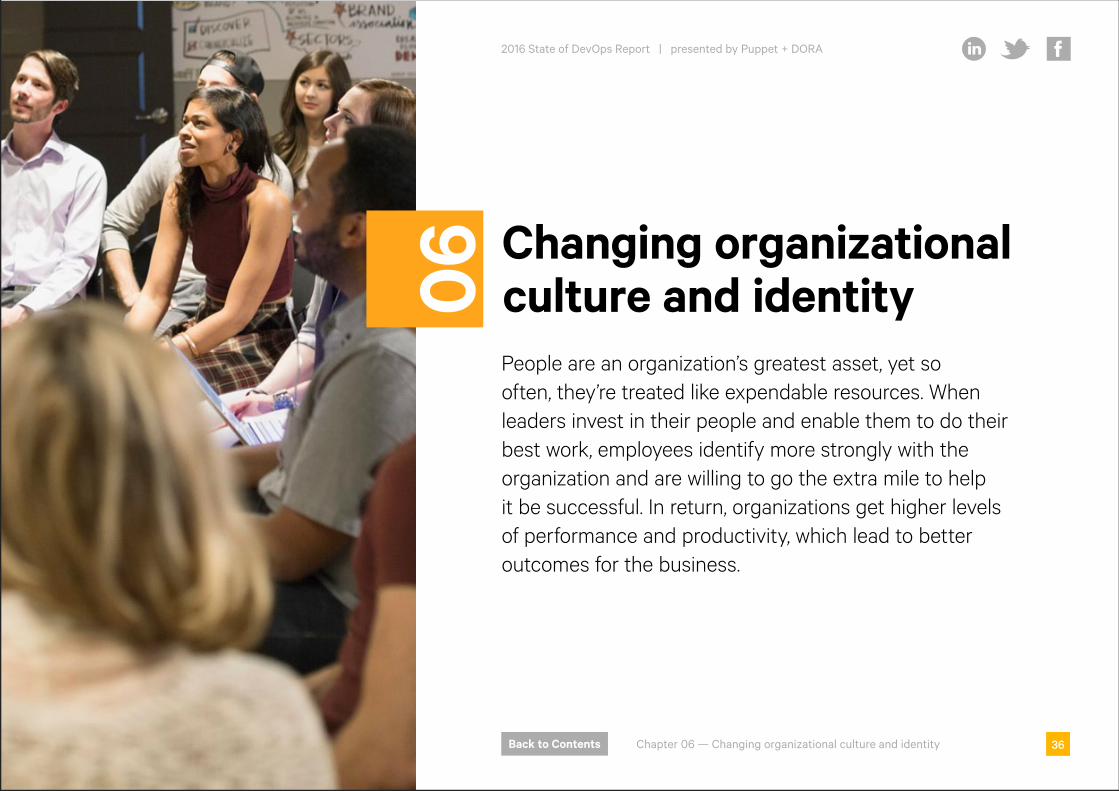
Changing organizational culture and identity People are an organization’s greatest asset, yet so often, they’re treated like expendable resources. When leaders invest in their people and enable them to do their best work, employees identify more strongly with the organization and are willing to go the extra mile to help it be successful. In return, organizations get higher levels of performance and productivity, which lead to better outcomes for the business.
Share:
36
2016 State of DevOps Report | presented by Puppet + DORA
Back to Contents
Share:
36Chapter 06 — Changing organizational culture and identity
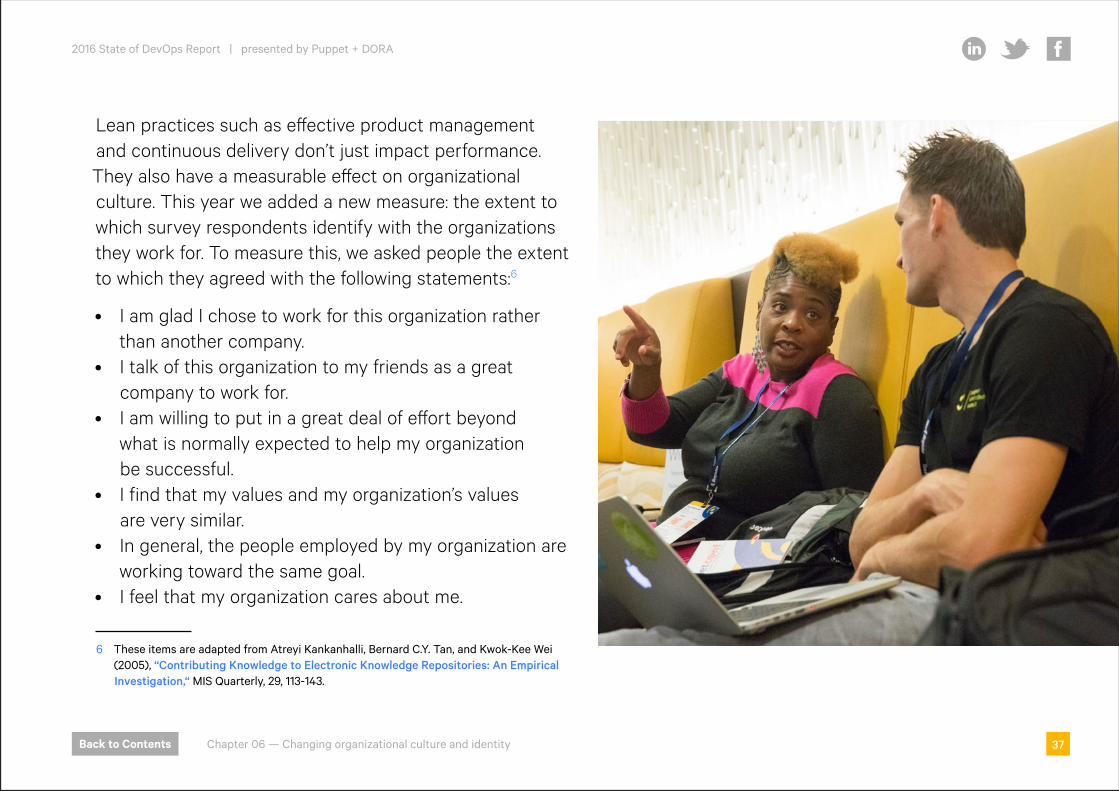
Lean practices such as effective product management and continuous delivery don’t just impact performance. They also have a measurable effect on organizational culture. This year we added a new measure: the extent to which survey respondents identify with the organizations they work for. To measure this, we asked people the extent to which they agreed with the following statements:6
• I am glad I chose to work for this organization rather than another company.
• I talk of this organization to my friends as a great company to work for.
• I am willing to put in a great deal of effort beyond what is normally expected to help my organization be successful.
• I find that my values and my organization’s values are very similar.
• In general, the people employed by my organization are working toward the same goal.
• I feel that my organization cares about me.
6 These items are adapted from Atreyi Kankanhalli, Bernard C.Y. Tan, and Kwok-Kee Wei (2005), “Contributing Knowledge to Electronic Knowledge Repositories: An Empirical Investigation,“ MIS Quarterly, 29, 113-143.
2016 State of DevOps Report | presented by Puppet + DORA
Back to Contents
Share:
Chapter 06 — Changing organizational culture and identity 37
Our key hypothesis in asking these questions was that teams implementing continuous delivery practices and taking an experimental approach to product development will build better products, and also feel more connected to the rest of their organization. This in turn creates a virtuous circle: By creating higher levels of performance, we increase the rate at which teams can validate their ideas, creating higher levels of job satisfaction and organizational performance.
This is in contrast to the way many companies still work, where requirements are handed down to development teams who must then deliver large stacks of work in big batches. In this model, employees feel little control over the products they build and the customer outcomes they create, and little connection to the organizations they work for. This is immensely de-motivating for teams, and leads to employees feeling emotionally disconnected from their work — and to worse organizational outcomes.
2016 State of DevOps Report | presented by Puppet + DORA
Back to Contents
Share:
Chapter 06 — Changing organizational culture and identity 38

Leaders can change cultureOur analysis showed that the use of continuous delivery practices and lean product management practices predicted both the extent to which people agreed with these statements, and whether the organization’s culture was generative and performance-oriented (see page 34 for more on The Westrum Model).
Furthermore, the extent to which people identified with their organization predicted a generative, performance-oriented culture and also predicted organizational performance, as measured in terms of productivity, market share, and profitability.
That shouldn’t surprise us. If people are a company’s greatest asset — and many corporate leaders declare they are — then having employees who strongly identify with the company should prove a competitive advantage.
Adrian Cockcroft, Netflix’s cloud architect, was once asked by a senior leader in a Fortune 500 company where he got his amazing people from. Cockcroft replied, “I hired them from you!” Our analysis is clear: In today’s fast-moving and competitive world, the best thing you can do for your products, your company and your people is institute a culture of experimentation and learning, and invest in the technical and management capabilities that enable it.
2016 State of DevOps Report | presented by Puppet + DORA
Back to Contents
Share:
Chapter 06 — Changing organizational culture and identity 39

07 Understanding the ROI of DevOpsEvery technology leader wants to know if investing in a technology transformation initiative will yield a positive return on investment. Using some key metrics from this report and industry averages, we run through some calculations of potential savings for organizations that implement DevOps practices, breaking these down for high, medium, and low IT performers. We also discuss how these savings of time and money can be reinvested to create greater and long-lasting value for your organization.
share
Share:
40
2016 State of DevOps Report | presented by Puppet + DORA
Back to Contents
Share:
40Chapter 07 — Understanding the ROI of DevOps
IT has traditionally been regarded as a cost center, making it hard to persuade management to invest in improvements. Until recently, there’s been little evidence that IT investments can provide significant returns. In past reports, we showed that there’s a predictive relationship between IT performance and organizational performance, proving that IT can deliver real business value and give businesses a competitive edge.
This year, we found that high-performing teams spend the least amount of time on unplanned work and rework (21 percent). As a result, they are able to spend 49 percent of their time on new work, such as new features that can add value to the business.
By contrast, we found that low performers spend less time on rework than medium performers (27 percent vs. 32 percent, respectively) and more time on new work (38 percent vs. 34 percent, respectively).7 One possible explanation is that low performers ignore critical rework so they can push new features, but it’s highly likely this is at the expense of racking up technical debt.
7 Both differences are statistically significant.
Medium performers spend more time on rework, burning down technical debt, and they have higher change failure rates than the low performers. However, because they deploy more frequently than the low-performing group, they are able to experiment and fail more rapidly.
We see medium performers as having the most to gain by continuing to optimize for speed and value over cost: Over time, they are more likely to improve processes and gain value from their learning cycles than the lower-performing group.
This interesting finding highlights the fact that every organization needs to make decisions about where to invest. With that in mind, we’ve taken some key metrics from this report and industry averages to develop a method for understanding the ROI of DevOps for high, medium, and low IT performers.
2016 State of DevOps Report | presented by Puppet + DORA
Back to Contents
Share:
Chapter 07 — Understanding the ROI of DevOps 41
The ROI calculations are based on expected savings. We express these in monetary terms, but it’s important to remember that when you save employees time, you are giving them back the space to think, to experiment, to be creative and to innovate. The value of that innovation is difficult to quantify (and really, this can be done only at the individual company level), but it is potentially many times greater than actual cost savings.
We also discuss how you might reinvest those cost savings and turn them into innovation that can drive more business value. The value you can create will depend on your company’s business model and growth strategy, and should not be overlooked in your ROI calculations.
We broke down ROI into two categories:
• Savings includes the cost of downtime and the cost of excess rework.
• Value includes the potential revenue and customers gained from releasing more quickly.
2016 State of DevOps Report | presented by Puppet + DORA
Back to Contents
Share:
Chapter 07 — Understanding the ROI of DevOps 42
SavingsCost of excess rework per yearUnplanned work and excess rework are a huge source of waste for any organization: They increase cycle times and divert resources from work that can add real value. We wanted to find out whether implementing DevOps practices would have an impact on excess rework, and if so, whether there was much variation between organizations with high, medium and low IT performance.
To calculate the cost of excess rework per year (in which we include unplanned work), we used the following equation:
Cost of excess rework = Technical staff size × Average salary × Benefits multiplier × Percentage of technical staff time spent on excess rework
Here’s how we defined each variable:
Technical staff size. This is the total number of technical employees in an organization who are involved with software creation and deployment. The group includes software developers, IT operations staff, quality assurance and test engineers, etc. The number of technical staff varies according to the overall organization size, as well as the degree to which the business relies on software. We’re breaking down technical staff size into the following groups, for the purpose of illustrating excess rework for different-sized organizations:
• Large organizations whose primary business is creating software = 40,000
• Large organizations whose primary business relies on software largely created in-house = 8,500
• Medium organizations whose primary business relies on software largely created in-house = 2,000
• Small-to-medium businesses and non-technical enterprises = 250
Of course, when you calculate the cost of excess rework for your own organization, you’ll use the number of technical staff involved with software development and delivery at your company.
share
2016 State of DevOps Report | presented by Puppet + DORA
Back to Contents
Share:
Chapter 07 — Understanding the ROI of DevOps 43
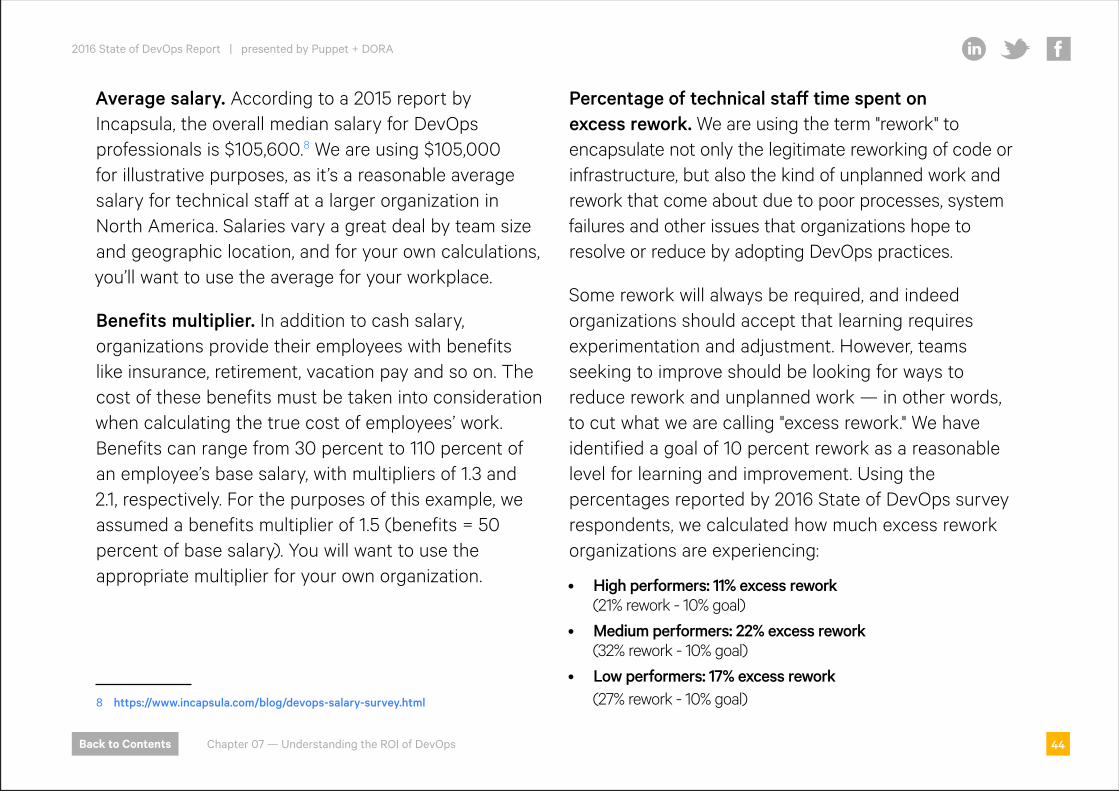
Average salary. According to a 2015 report by Incapsula, the overall median salary for DevOps professionals is $105,600.8 We are using $105,000 for illustrative purposes, as it’s a reasonable average salary for technical staff at a larger organization in North America. Salaries vary a great deal by team size and geographic location, and for your own calculations, you’ll want to use the average for your workplace.
Benefits multiplier. In addition to cash salary, organizations provide their employees with benefits like insurance, retirement, vacation pay and so on. The cost of these benefits must be taken into consideration when calculating the true cost of employees’ work. Benefits can range from 30 percent to 110 percent of an employee’s base salary, with multipliers of 1.3 and 2.1, respectively. For the purposes of this example, we assumed a benefits multiplier of 1.5 (benefits = 50 percent of base salary). You will want to use the appropriate multiplier for your own organization.
8 https://www.incapsula.com/blog/devops-salary-survey.html
Percentage of technical staff time spent on excess rework. We are using the term "rework" to encapsulate not only the legitimate reworking of code or infrastructure, but also the kind of unplanned work and rework that come about due to poor processes, system failures and other issues that organizations hope to resolve or reduce by adopting DevOps practices.
Some rework will always be required, and indeed organizations should accept that learning requires experimentation and adjustment. However, teams seeking to improve should be looking for ways to reduce rework and unplanned work — in other words, to cut what we are calling "excess rework." We have identified a goal of 10 percent rework as a reasonable level for learning and improvement. Using the percentages reported by 2016 State of DevOps survey respondents, we calculated how much excess rework organizations are experiencing:
• High performers: 11% excess rework (21% rework - 10% goal)
• Medium performers: 22% excess rework (32% rework - 10% goal)
• Low performers: 17% excess rework (27% rework - 10% goal)
2016 State of DevOps Report | presented by Puppet + DORA
Back to Contents
Share:
Chapter 07 — Understanding the ROI of DevOps 44
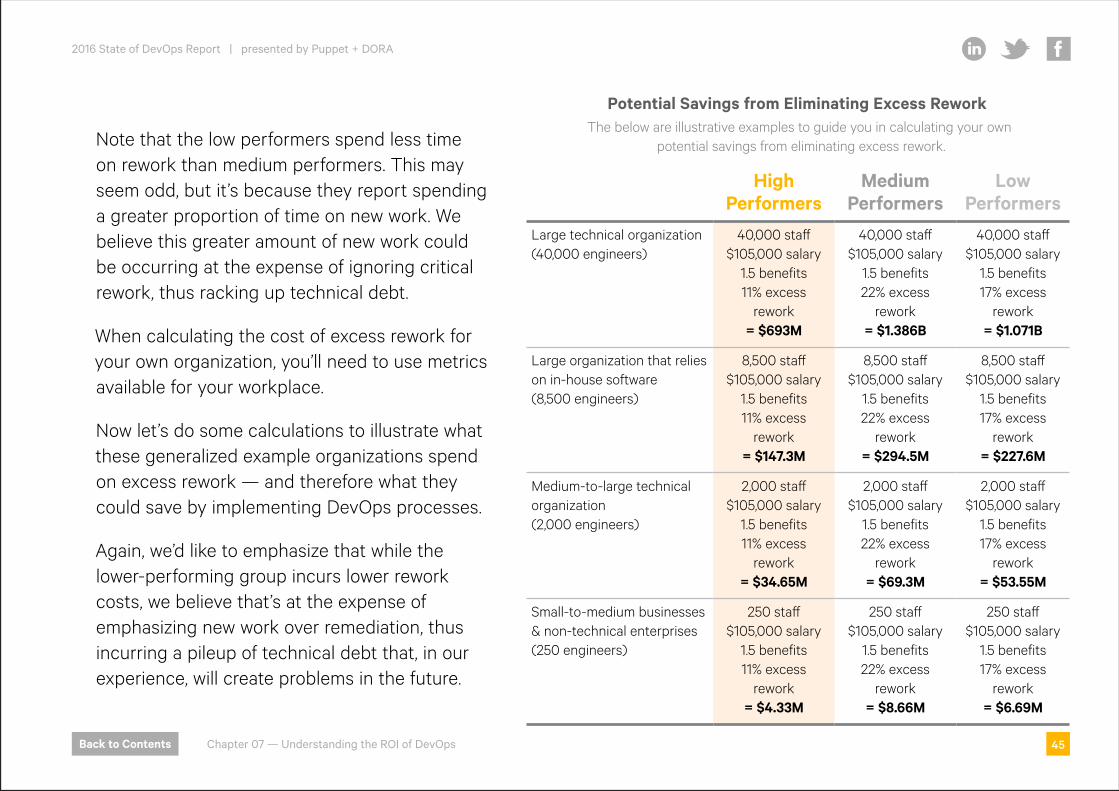
Note that the low performers spend less time on rework than medium performers. This may seem odd, but it’s because they report spending a greater proportion of time on new work. We believe this greater amount of new work could be occurring at the expense of ignoring critical rework, thus racking up technical debt.
When calculating the cost of excess rework for your own organization, you’ll need to use metrics available for your workplace.
Now let’s do some calculations to illustrate what these generalized example organizations spend on excess rework — and therefore what they could save by implementing DevOps processes.
Again, we’d like to emphasize that while the lower-performing group incurs lower rework costs, we believe that’s at the expense of emphasizing new work over remediation, thus incurring a pileup of technical debt that, in our experience, will create problems in the future.
High Performers
Medium Performers
Low Performers
Large technical organization (40,000 engineers)
40,000 staff $105,000 salary
1.5 benefits 11% excess
rework = $693M
40,000 staff $105,000 salary
1.5 benefits 22% excess
rework = $1.386B
40,000 staff $105,000 salary
1.5 benefits 17% excess
rework = $1.071B
Large organization that relies on in-house software (8,500 engineers)
8,500 staff $105,000 salary
1.5 benefits 11% excess
rework = $147.3M
8,500 staff $105,000 salary
1.5 benefits 22% excess
rework = $294.5M
8,500 staff $105,000 salary
1.5 benefits 17% excess
rework = $227.6M
Medium-to-large technical organization (2,000 engineers)
2,000 staff $105,000 salary
1.5 benefits 11% excess
rework = $34.65M
2,000 staff $105,000 salary
1.5 benefits 22% excess
rework = $69.3M
2,000 staff $105,000 salary
1.5 benefits 17% excess
rework = $53.55M
Small-to-medium businesses & non-technical enterprises (250 engineers)
250 staff $105,000 salary
1.5 benefits 11% excess
rework = $4.33M
250 staff $105,000 salary
1.5 benefits 22% excess
rework = $8.66M
250 staff $105,000 salary
1.5 benefits 17% excess
rework = $6.69M
Potential Savings from Eliminating Excess ReworkThe below are illustrative examples to guide you in calculating your own
potential savings from eliminating excess rework.
2016 State of DevOps Report | presented by Puppet + DORA
Back to Contents
Share:
Chapter 07 — Understanding the ROI of DevOps 45

Cost of downtime per year
According to a recent report by Steven Elliot of IDC, hourly downtime costs can range from $1.25 to $2.5 billion for a Fortune 1000 firm, and the average cost of a critical application failure is $500,000 to $1 million per hour.9 Of course, the costs of downtime are highly variable depending on the nature of the business. For example, a high-volume financial transaction business suffers significantly higher downtime costs per hour than a company that manages cleaning crews for commercial buildings. In addition, the impact of an outage and difficulty of recovering from it are dependent on IT architecture.
Because every business of any reasonable size is highly dependent on software and computing networks in today’s business climate, downtime is a real risk to business health. With that in mind, every organization should assess its own downtime costs based on its own business model and architecture.
9 http://info.appdynamics.com/rs/appdynamics/images/DevOps-metrics-Fortune1K.pdf
share
2016 State of DevOps Report | presented by Puppet + DORA
Back to Contents
Share:
Chapter 07 — Understanding the ROI of DevOps 46
To give you an idea of how to calculate the cost of downtime for your own organization, we are using industry data to create example calculations for high-performing, medium-performing and low-performing organizations, as defined earlier in this report.
Now let’s do some calculations to illustrate what high, medium and low performers could save by reducing the cost of downtime.
Cost of downtime = Deployment frequency × Change failure rate × Mean time to recover × Hourly cost of outage
Deployment frequency. We’re taking these figures from the results of the State of DevOps survey, and using the average figure where we have a range. High performers deploy on demand, with Etsy deploying 80 times per day, and large companies like Amazon or Netflix deploying thousands of times per day. We’re using a more conservative figure of four times per day for this group, which comes to 1,460 deploys per year. Medium performers deploy 12 to 52 times per year, so we’re using the average figure of 32. Low performers deploy two to 12 times per year, so we’re using the average figure of seven deploys per year. For your own calculations, you’ll need to look at how many times per year your own organization deploys changes.
Change failure rate. This is the percentage of changes that cause an outage in an organization. We used rates reported by State of DevOps survey respondents. High performers reported a range of zero percent failures to 15 percent of changes causing failure, so we’re using the average figure of 7.5 percent. For medium performers, the range was 31 to 45 percent, so the average is 38 percent. For low performers, the range was 16 to 30 percent, giving us an average change failure rate of 23.5 percent. Again, you’ll need to look at the specific figure for your organization to make your own calculations.
2016 State of DevOps Report | presented by Puppet + DORA
Back to Contents
Share:
Chapter 07 — Understanding the ROI of DevOps 47
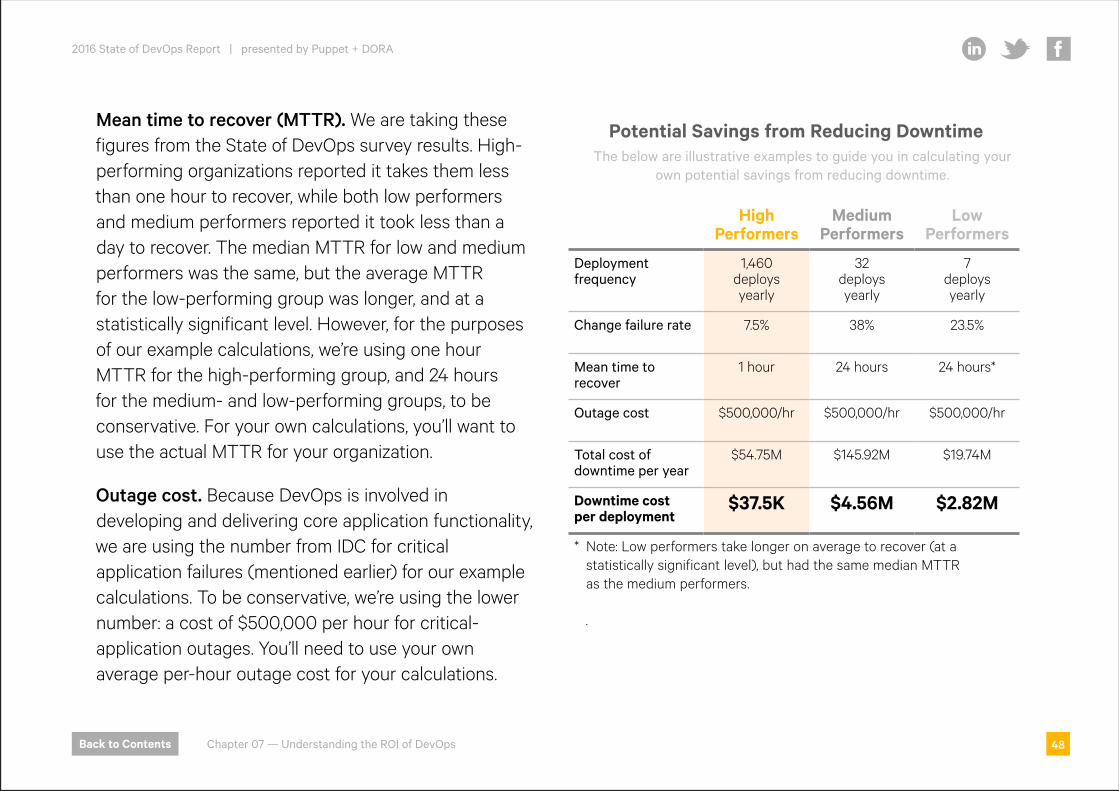
Mean time to recover (MTTR). We are taking these figures from the State of DevOps survey results. High-performing organizations reported it takes them less than one hour to recover, while both low performers and medium performers reported it took less than a day to recover. The median MTTR for low and medium performers was the same, but the average MTTR for the low-performing group was longer, and at a statistically significant level. However, for the purposes of our example calculations, we’re using one hour MTTR for the high-performing group, and 24 hours for the medium- and low-performing groups, to be conservative. For your own calculations, you’ll want to use the actual MTTR for your organization.
Outage cost. Because DevOps is involved in developing and delivering core application functionality, we are using the number from IDC for critical application failures (mentioned earlier) for our example calculations. To be conservative, we’re using the lower number: a cost of $500,000 per hour for critical-application outages. You’ll need to use your own average per-hour outage cost for your calculations.
High Performers
Medium Performers
Low Performers
Deployment frequency
1,460 deploys yearly
32 deploys yearly
7 deploys yearly
Change failure rate 7.5% 38% 23.5%
Mean time to recover
1 hour 24 hours 24 hours*
Outage cost $500,000/hr $500,000/hr $500,000/hr
Total cost of downtime per year
$54.75M $145.92M $19.74M
Downtime cost per deployment
$37.5K $4.56M $2.82M
* Note: Low performers take longer on average to recover (at a statistically significant level), but had the same median MTTR as the medium performers.
.
Potential Savings from Reducing DowntimeThe below are illustrative examples to guide you in calculating your
own potential savings from reducing downtime.
2016 State of DevOps Report | presented by Puppet + DORA
Back to Contents
Share:
Chapter 07 — Understanding the ROI of DevOps 48
While the low-performing group has lower total downtime costs than the high-performing group, it’s worth noting that there’s a hidden cost to deploying infrequently. Companies that seldom deploy are missing out on the opportunity to get frequent and fast feedback from customers, a factor that allows leading-edge companies to experiment, adjust, and continually improve their products and services, creating happy customers. That allows these companies to get out ahead of their competitors, and introduce market-changing innovations that keep them ahead of the pack. We speculate that the higher revenue and profitability that high IT performers enjoy10 far outstrips their higher downtime costs.
Companies that deploy infrequently may have a lower total cost of deployment, but their cost per deployment is very high. While we’re expressing it in dollar terms here, there’s another way to look at it. When you deploy infrequently, you release much larger, more complex bundles of code into your production environment, making integration and support of that new code challenging, and making it very difficult to identify the cause of failure.
10 In the 2014 DevOps survey, just over 1,000 respondents voluntarily identified the companies they worked for. Of these, 355 were publicly traded. We analyzed three-year results for these companies and found that they all outperformed the S&P 500 over the same three-year period. Of this group, those with high-performing IT teams, as identified by our analysis, had 50 percent higher market capitalization over three years than the public companies with lower-performing IT teams. The companies with high-performing IT teams were also twice as likely to have exceeded their own goals for profitability, market share and productivity.
There’s another cost to infrequent deployment, too. When you release infrequently, engineers and operators alike must scramble to make a quick fix. Then everyone has to get down to the tedious, often frustrating work of figuring out what went wrong, and how to re-engineer the application and its supporting infrastructure. This is not satisfying work, and it’s often accompanied by blame.
These painful deployment scenarios are an anti-pattern; essentially, such painful deployments teach teams how to do it wrong, not how to do it right. The virtuous cycle of experimentation, learning and continuous improvement is nearly impossible in this kind of environment, making it hard for the organization to improve its business outcomes.
2016 State of DevOps Report | presented by Puppet + DORA
Back to Contents
Share:
Chapter 07 — Understanding the ROI of DevOps 49
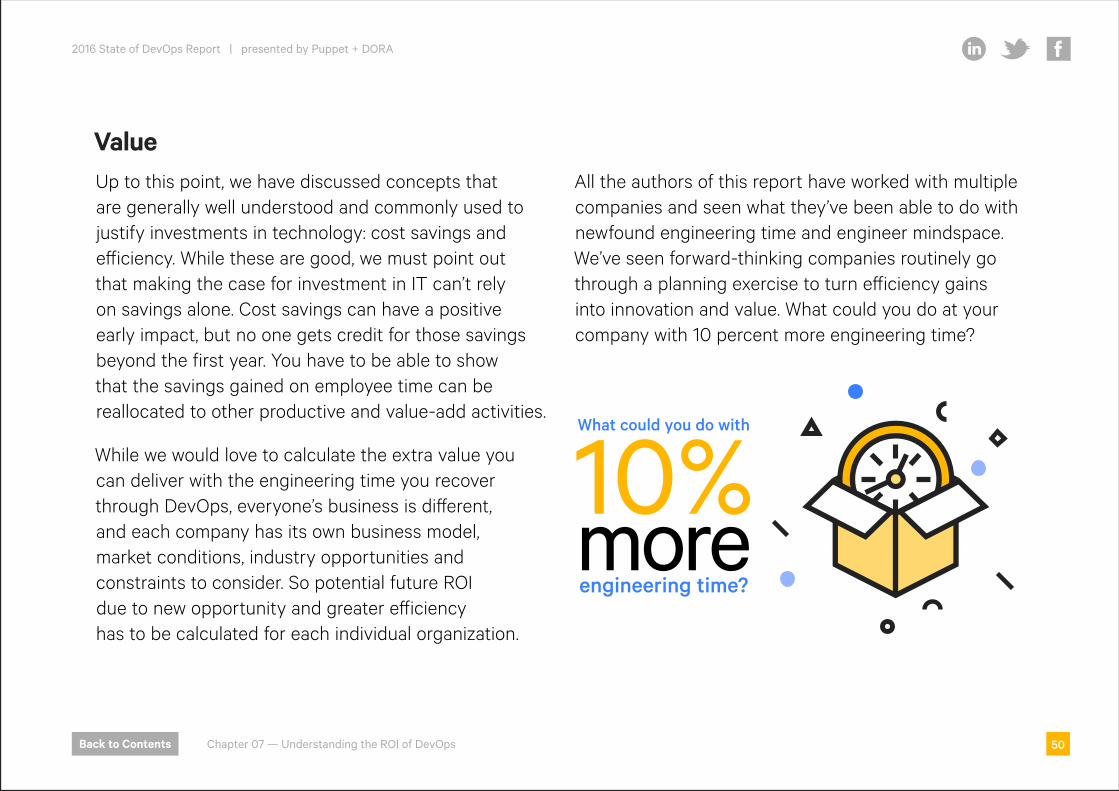
ValueUp to this point, we have discussed concepts that are generally well understood and commonly used to justify investments in technology: cost savings and efficiency. While these are good, we must point out that making the case for investment in IT can’t rely on savings alone. Cost savings can have a positive early impact, but no one gets credit for those savings beyond the first year. You have to be able to show that the savings gained on employee time can be reallocated to other productive and value-add activities.
While we would love to calculate the extra value you can deliver with the engineering time you recover through DevOps, everyone’s business is different, and each company has its own business model, market conditions, industry opportunities and constraints to consider. So potential future ROI due to new opportunity and greater efficiency has to be calculated for each individual organization.
All the authors of this report have worked with multiple companies and seen what they’ve been able to do with newfound engineering time and engineer mindspace. We’ve seen forward-thinking companies routinely go through a planning exercise to turn efficiency gains into innovation and value. What could you do at your company with 10 percent more engineering time?
10%moreengineering time?
What could you do with
2016 State of DevOps Report | presented by Puppet + DORA
Back to Contents
Share:
Chapter 07 — Understanding the ROI of DevOps 50

Here are a few things that could make a real difference to your organization’s competitiveness and revenue:
Improve your product development cycles:• Get new features and products to market faster.• Release with fewer bugs.• Experiment more.• Roll out results of successful experiments to new markets.
Improve data collection and analysis:• Get better business intelligence about your customers.
Improve your website:• Drive more customer engagement.• Drive more sales and/or leads.
Improve services you offer:• Drive customer retention.• Get more referrals.• Get more incremental revenue from existing customers.
Reinvesting the human time, creativity and energy saved by reducing rework and downtime can achieve great business results. The best organizations understand this, and include the value of technology transformation in their ROI calculations. The importance of future value creation should not be understated. Using the time recovered from excess rework and downtime to develop new products and features or implement process improvements will continue to pay off for years to come.
For more extensive research about the ROI of DevOps, sign up to be notified of DORA's upcoming white paper at http://devops-research.com.
2016 State of DevOps Report | presented by Puppet + DORA
Back to Contents
Share:
51Chapter 07 — Understanding the ROI of DevOps
ConclusionDevOps is no longer a mere fad or buzzword, but an understood set of practices and cultural patterns. People turn to DevOps not just to improve daily working life and get time back for family, friends and beer, but to improve their organization’s performance, revenues, profitability and other measurable outcomes.
We launched the DevOps survey and State of DevOps report five years ago to discover just how DevOps tools, practices and cultural values affected IT teams and the organizations they serve. This year we’ve gathered a broader range of data, and analyzed it more deeply. We hope the findings, analysis and guidance in this report help you better understand the potential impact of DevOps on your organization.
Thank you for sticking with us all the way through, and we hope you’ll take the survey next year.
2016 State of DevOps Report | presented by Puppet + DORA
Back to Contents
Share:
52Conclusion

MethodologyThe State of DevOps Report has evolved over the past five years. Our rigorous methodology goes beyond reporting raw numbers and looks at the statistical relationships among IT performance, organizational performance, technical practices, cultural norms, and management. Here, we describe how we enlisted survey respondents; designed our questions, models and constructs; and our analysis methods.
We welcome any questions about our survey methodology, so feel free to get in touch: [email protected].
Target population & sampling methodOur target population for this survey was practitioners and leaders working in, or closely with, IT, and especially those familiar with DevOps. Because we don’t have a master list of these people — we can describe them, but we don’t know exactly where they are, how to find them, and how many of them exist — we used snowball sampling to obtain respondents. This means we promoted the survey via email lists, online promotions, and social media, and also asked people to share the survey with their networks, growing the sample like a snowball. Our sample is likely limited to organizations and teams that are familiar with DevOps, and as such, may be doing some of it.
Creating latent constructsOnce the target population and sampling method were determined, we began the difficult work of determining which questions to include in the survey. To do that, we first had to figure out which hypotheses we wanted to test. To add to the rigor of our study, we referenced existing research and theories. We formulated our hypotheses and constructs, using previously validated constructs wherever possible. When we needed to create new constructs, we wrote them very carefully based on theory, definitions, and expert input. We then took additional steps to clarify intent and wording to ensure that data collected from the final survey would have a high likelihood of being reliable and valid.11 To create constructs, we used Likert-type12 questions, which provided shades of gray, rather than black-and-white, yes-or-no, true-or-false questions. Likert-type questions also make it possible to perform more advanced analysis.
Statistical analysis methodsCluster analysis.13 IT performance profiles are derived with a data-driven approach, using hierarchical cluster analysis. In this approach, those in one group are statistically similar to each other and dissimilar from those in other groups.
11 We used Churchill’s methodology: Churchill Jr, G. A. “A paradigm for developing better measures of marketing constructs,” Journal of Marketing Research 16:1, (1979), 64–73.
12 “Likert scale,” Wikipedia13 "Cluster analysis," Wikipedia
For IT performance profiles, they are similar (or dissimilar) based on our IT performance behaviors of throughput and stability: deployment frequency; lead time; mean time to restore; and change fail rate.
• Measurement model. Prior to conducting any analysis using constructs — including correlations, regressions, and partial least squares14 (PLS) analysis — the constructs were tested for validity and reliability. The constructs passed checks for convergent validity15, discriminant validity16, and reliability, therefore exhibiting good psychometric17 properties.
• Regression analysis. When predictions or impacts are cited and PLS is not explicitly mentioned, a simple linear regression18 was used.
• Structured equation modeling. The structured equation models (SEM)19 were tested using PLS analysis, which is a correlation-based SEM well suited to exploratory analysis. SmartPLS 3.2.0 was used. All paths shown in Figure 1 and Figure 2 are p < .001.
• Study design. This study employs a cross-sectional, theory-based design.
14 “Partial least squares regression,” Wikipedia15 “Convergent validity,” Wikipedia16 “Discriminant validity,” Wikipedia17 “Psychometrics,” Wikipedia18 “Linear regression,” Wikipedia19 “Structural equation modeling,” Wikipedia
2016 State of DevOps Report | presented by Puppet + DORA
Back to Contents
Share:
53Methodology
About the authorsNigel Kersten came to Puppet from Google Headquarters in Mountain View, California, where he was responsible for the design and implementation of one of the largest Puppet deployments in the world. At Puppet, Nigel was responsible for development of the initial versions of Puppet Enterprise, and has since served in a variety of roles, including head of product, CTO and CIO. He has been deeply involved in Puppet’s DevOps initiatives, and regularly speaks around the world about adoption of DevOps in the enterprise and IT organizational transformation.
Alanna Brown is senior product marketing manager at Puppet, where she conceived and launched the annual State of DevOps Report in 2012. She has been responsible for the survey and report since then. In addition to heading up DevOps research, Alanna is also responsible for developing programs with partners such as Microsoft, Amazon Web Services, and Google to bring joint solutions to market.
Jez Humble is co-author of the Jolt Award-winning “Continuous Delivery,” published in Martin Fowler’s Signature Series (Addison Wesley, 2010), and “Lean Enterprise,” in Eric Ries’ Lean series (O’Reilly, 2015). He has spent his career tinkering with code, infrastructure, and product development in companies of varying sizes across three continents. He is currently researching how to build high-performing teams and helping to create a cloud platform for government. He works at 18F, teaches at UC Berkeley, and is co-founder of DevOps Research and Assessment LLC.
Dr. Nicole Forsgren is an IT impacts expert who is best known for her work with tech professionals and as the lead investigator on the largest DevOps studies to date. She is a consultant, expert, and researcher in knowledge management, IT adoption and impacts, and DevOps. Nicole is the director of organizational performance and analytics at Chef. In a previous life, she was a professor, sysadmin, and hardware performance analyst. She has been awarded public and private research grants (funders include NASA and the NSF), and her work has been featured in various media outlets and several peer-reviewed journals and conferences. She holds a PhD in management information systems and a masters in accounting and is a co-founder of DevOps Research and Assessment LLC.
Gene Kim is a multi-award-winning CTO, researcher and author. He is the founder of Tripwire and served as CTO for 13 years. He has written three books: “The Phoenix Project: A Novel About IT, DevOps, and Helping Your Business Win,” “The Visible Ops Handbook” and the upcoming “DevOps Handbook.” Since 2014, he has been the organizer of the DevOps Enterprise Summit. In 2007, ComputerWorld included Gene in its list, “40 Under 40: 40 Innovative IT People to Watch, Under the Age of 40.” Gene was named an outstanding alumnus by Purdue University’s computer science department for his achievements and leadership in the profession. He is a co-founder of DevOps Research and Assessment LLC.
2016 State of DevOps Report | presented by Puppet + DORA
Back to Contents
Share:
54About the authors

About Puppet, Inc.
Puppet is driving the movement to a world of unconstrained software change. Its revolutionary platform is the industry standard for automating the delivery and operation of the software that powers everything around us. More than 32,000 companies — including more than two thirds of the Fortune 100 — use Puppet’s open source and commercial solutions to adopt DevOps practices, achieve situational awareness and drive software change with confidence. Based in Portland, Oregon, Puppet is a privately held company with more than 400 employees around the world.
Learn more at puppet.com.
About DevOps Research and Assessment
DevOps Research and Assessment, founded by Dr. Nicole Forsgren, Jez Humble and Gene Kim, conducts research into understanding high performance in the context of software development and the factors that predict it. DORA’s research over three years and more than 25,000 data points serves as the basis for a set of evidence-based tools for evaluating and benchmarking technology organizations.
Learn more at devops-research.com.
2016 State of DevOps Report | presented by Puppet + DORA
Back to Contents
Share:
55About the authors